influence of fibre volume fraction and temperature on ... · influence of fibre volume fraction and...
TRANSCRIPT

AIMS Materials Science, 3(3): 770-795.
DOI: 10.3934/matersci.2016.3.770
Received: 18 May 2016
Accepted: 27 June 2016
Published: 01 July 2016
http://www.aimspress.com/journal/Materials
Research article
Influence of fibre volume fraction and temperature on fatigue life of
glass fibre reinforced plastics
Dominik Flore *and Konrad Wegener
Institute of Machine Tools and Manufacturing (IWF), ETH Zürich, Zurich, Switzerland
*Correspondence: Email: [email protected].
Abstract: The influence of fibre volume fraction and temperature on fatigue life of continuous glass fibre reinforced plastics is investigated in detail. The physical causes of the two effects on the slope of the S-N-curve in fibre direction at R = 0.1 are researched and can be explained with help of micrographs. A new phenomenological approach is presented to model both effects in fibre dominated laminates with different stacking sequences using only the static ultimate strength as an input. Static and fatigue tests of different layups and fibre volume fractions are performed at different temperatures to validate the fatigue life predictions. Additionally it is derived that there is an optimal fibre volume fraction regarding a minimum damage sum. This fibre volume fraction is dependent on a given loading spectra and can be calculated using the phenomenological model.
Keywords: fibre reinforced plastics; fatigue strength; fibre volume fraction; temperature effect; composites
Nomenclature
r Strength indexes σ Stress E Elastic Modulus t tension Poisson's Ratio c compression n Fatigue Cycles applied o upper N Fatigue Cycles allowed u lower D Damage Variable i count index R Stress Ratio calc calculated b Slope of normalised S-N-Curve opt optimal a Intercept of the y-Axis f fibre

771
AIMS Materials Science Volume 3, Issue 3, 770-795.
φ Fibre Volume Fraction m matrix k Number of Plies comp composite m Area Weight r relative ρ Material Density g global t Laminate Thickness l local T Temperature
1. Introduction
The low specific weight of continuous fibre reinforced plastics (FRP) offers light weight design opportunities. Therefore, the application of FRP materials in automotive engineering is increasing since 2000 [1,2]. Since FRP are anisotropic and inhomogeneous, as described in [3], the mechanical behaviour of FRP materials is very different from metals. The failure of FRP is not determined by a single crack mechanism and its propagation but rather by several damage mechanisms (e.g., delamination, matrix failure, fibre pull-out , fibre failure) [3].
Even though the fibre determines mechanical properties like elastic modulus or strength, the fatigue failure is mainly dominated by matrix cracks [4]. As shown by [5,6] the damage evolution in composite laminates can be separated into three different stages that are determined by five main damage mechanisms according to Talreja [6]:
In the first stage multiple matrix cracking dominates in the layers with fibres aligned transverse to the loading direction. These are initiated by defects and voids. In the second stage cracks accumulate to macro cracks. Furthermore interfacial-debonding occurs and initiates interlaminar cracks. In the third stage, damage development is highly localized, increasing unstably and involves extensive fibre breakage. The final failure is manifested by the formation of a failure path through the locally failed regions. This continuous damage process leads to significant reductions of mechanical properties like the elastic modulus or strength. Therefore these parameters are likely used as damage parameter [3,7,8].
The fatigue behaviour depends strongly on the reinforcing textile used. In [9] laminates reinforced by carbon, glass and kevlar are compared under tension-tension fatigue. It is found out that the slope of the S-N-curve is steeper the lower the stiffness of the fibre is. Therefore glass laminates have the steepest slope, while the slope of CFRP materials is very flat. The microstructure of the textile is also relevant. While in unidirectional reinforced composites loaded in fibre direction mostly transverse cracks affect the stiffness reduction, woven composites show that cracks occur in the fibre bundles transversely to the load direction first and lead to a reduction in stiffness [10]. Under quasistatic loading this results in a knee point in the stress strain curve.
Another important influence factor on fatigue damage is the anisotropy leading to very different fatigue behaviour of composites loaded in fibre direction, transverse to it or under combined loading [11,12]. Furthermore the fatigue damage of composites is strongly affected by the mean stress. Corresponding investigations can be found in [13–16].
To predict the fatigue life of FRP are many fatigue models have been developed in the recent years. According to [17] these models can be separated in to three categories:
1) Fatigue life models that use S-N-curves and a fatigue failure criteria.

772
AIMS Materials Science Volume 3, Issue 3, 770-795.
2) Residual Strength/Stiffness models that use evolution laws which describe the degradation of strength/stiffness.
3) Progressive damage models that consider damage mechanisms and use damage variables to describe the evolution of these mechanisms (e.g. the increase in microcrack desity).
Even though progressive damage models are available, fatigue life models are still relevant because of their simple structure. This helps to explain and to predict the influence of various parameters (e.g. frequency, mean stress, temperature) very easily [18]. Therefore a fatigue life model is developed in section 4 that accounts for the temperature effect and the fibre volume fraction (FVF) effect. Since these two parameters are of special interest, they are investigated in the following section in detail.
2. Influence of Temperature and FVF on Fatigue Life
From the basic literature it can be seen that polymer matrix systems (thermoplastic and thermoset) show a viscoelastic material behaviour [19,20]. This means that the strength and the stiffness strongly depend on temperature and time. This causes the composite material parameters to be dependent on the time and temperature also. In [9] the strength response of a GFRP laminate is tested at various temperatures between −150 °C and 150 °C. The results show a linear relationship between the strength and the temperature. Similar results were obtained by [21] where the stiffness and strength of a thermosetting CFRP are investigated at various temperatures. The data indicates that a linear relationship between the temperature and the mechanical properties, stiffness and strength, is appropriate until a temperature of 160 °C. Over 160 °C a linear relation is no longer valid since the mechanical properties decrease dramatically at temperatures near the glass transition temperature.
Figure 1. Experimental S-N-curves at various temperatures (left), normalised S-N-curves (right) redrawn from [9].
Like the static strength the fatigue strength is also influenced by the temperature. In [9] a GFRP laminate is tested at a load ration of R = 0.1 and at various temperatures. The S-N-curves that are gained from the experiments are illustrated in Figure 1. Then the upper stress in each S-N-curve is
0
100
200
300
400
500
600
1.E+00 1.E+04 1.E+08
Upp
er S
tres
[M
Pa]
Cycles
T=-150°C
T=-100°C
T=-60°C
T=-20°C
T=23°C
T=60°C
T=100°C
T=150°C0
0.2
0.4
0.6
0.8
1
1.E+00 1.E+04 1.E+08
Nor
mal
ised
Str
ess
Cycles
T=-150°C
T=-100°C
T=-60°C
T=-20°C
T=23°C
T=60°C
T=100°C
T=150°C

773
AIMS Materials Science Volume 3, Issue 3, 770-795.
divided by the static strength at the corresponding temperature. The result is a normalised S-N-curve that is also presented in Figure 1. It can be seen that the normalised S-N-curves at any temperature result in one single trend line.
In [11] Kawai investigated the impact of the temperature on the fatigue behaviour of unidirectional CFRP. S-N-curves at different temperatures and fibre orientations were generated. This fatigue data also shows that there is a single trend between the normalised fatigue stress and the number of cycles to failure.
According to [2] the FVF is an important parameter, since it affects nearly all properties in a given material system (e.g. the static and fatigue strengths). In fibre direction the influence of the FVF on the static strength and elastic modulus is linear, independent from the composite material. Therefore the rule of mixture that can be found in [22] is very common to estimate the composite properties from the constituent properties.
∙ ∙ 1 (1)
∙ ∙ 1 (2)
In [23] the influence of the FVF on the static strength and elastic modulus of glass fibre reinforced plastics (GFRP) with a chopped strand mat as textile is tested and a linear relationship between these parameters given. The same observation was made by Karahan and his co-workers [24], when they investigated a woven carbon fibre reinforced plastic (CFRP) material under static loading. They also found that variations in the FVF had no effect on the damage modes, location or propagation characteristics of the damage. Furthermore the effect on flexural strength and modulus was studied in [25]. The authors concluded that these parameters also linearly increase with the FVF up to a critical fraction of 70% where there is no more enough resin available for bonding.
The fatigue behaviour of FRP is influenced by the FVF as well. One of the first investigations regarding this topic were made in [26] where the authors performed strain controlled fatigue tests of GFRP and found out that the fatigue strength is increased with the FVF in the range tested (0–44.7%). Their experiments show that the scatter in fatigue life is decreased with a higher FVF. Effects on the slope of the S-N-curves are not discussed. In [27] GFRP with FVFs in the range 34–57% are tested under fatigue loading. It is observed that larger FVFs lead to an earlier failure and a stronger stiffness reduction. The reason for that is assumed to be the bonding strength of the material that decreases with an increasing FVF.
Because of the importance of this effect for the wind energy industry a large database of fatigue tests on fibre-dominated GFRP laminates with a woven microstructure were generated during the Montana State University Composite Materials Fatigue Program from 1997 to 2001 and published in [28]. These tests were performed at room temperature, at different frequencies and at R = 0.1. For further investigations the relation between the normalised stress (defined by the quotient of the upper stress and the static ultimate strength) and the number of cycles to failure is used. For this the authors find a single logarithmic relation to be most appropriate.
∙ (3)
774
AIMS Materials Science Volume 3, Issue 3, 770-795.
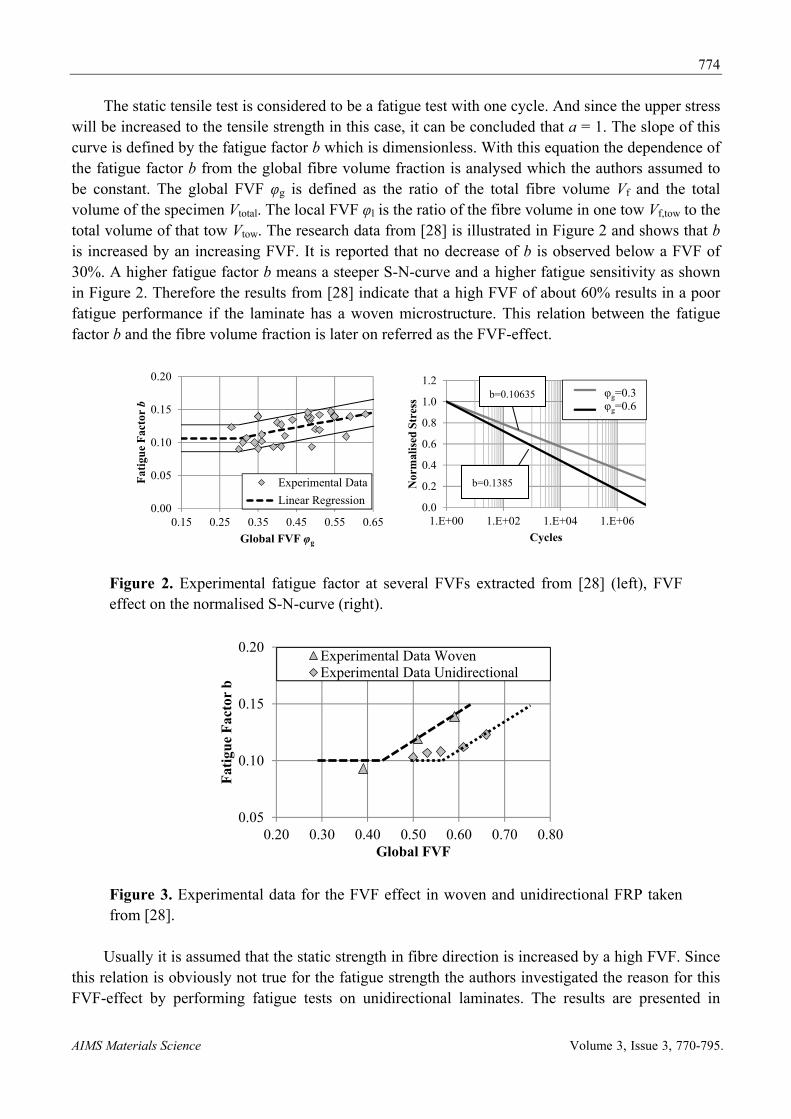
The static tensile test is considered to be a fatigue test with one cycle. And since the upper stress will be increased to the tensile strength in this case, it can be concluded that a = 1. The slope of this curve is defined by the fatigue factor b which is dimensionless. With this equation the dependence of the fatigue factor b from the global fibre volume fraction is analysed which the authors assumed to be constant. The global FVF φg is defined as the ratio of the total fibre volume Vf and the total volume of the specimen Vtotal. The local FVF φl is the ratio of the fibre volume in one tow Vf,tow to the total volume of that tow Vtow. The research data from [28] is illustrated in Figure 2 and shows that b is increased by an increasing FVF. It is reported that no decrease of b is observed below a FVF of 30%. A higher fatigue factor b means a steeper S-N-curve and a higher fatigue sensitivity as shown in Figure 2. Therefore the results from [28] indicate that a high FVF of about 60% results in a poor fatigue performance if the laminate has a woven microstructure. This relation between the fatigue factor b and the fibre volume fraction is later on referred as the FVF-effect.
Figure 2. Experimental fatigue factor at several FVFs extracted from [28] (left), FVF effect on the normalised S-N-curve (right).
Figure 3. Experimental data for the FVF effect in woven and unidirectional FRP taken from [28].
Usually it is assumed that the static strength in fibre direction is increased by a high FVF. Since this relation is obviously not true for the fatigue strength the authors investigated the reason for this FVF-effect by performing fatigue tests on unidirectional laminates. The results are presented in
0.00
0.05
0.10
0.15
0.20
0.15 0.25 0.35 0.45 0.55 0.65
Fat
igue
Fac
tor
b
Global FVF φg
Experimental Data
Linear Regression0.0
0.2
0.4
0.6
0.8
1.0
1.2
1.E+00 1.E+02 1.E+04 1.E+06
Nor
mal
ised
Str
ess
Cycles
φ=0,3%
φ=0,6%
φg=0.3φg=0.6
0.05
0.10
0.15
0.20
0.20 0.30 0.40 0.50 0.60 0.70 0.80
Fat
igu
e F
acto
r b
Global FVF
Experimental Data WovenExperimental Data Unidirectional
b=0.10635
b=0.1385

775
AIMS Materials Science Volume 3, Issue 3, 770-795.
Figure 3 and show that the fatigue factor b is also increased by the FVF in unidirectional laminates. However the critical FVF at which the fatigue factor increases significantly is higher for unidirectional than for woven composites.
The difference of the critical FVF is explained by the woven microstructure. Figure 4 shows two micrographs of FRP materials. On the left side a unidirectional material is shown in which the fibres are well dispersed. On the right side a woven material is shown and it can be seen that there are fibre rich areas and matrix rich areas. Therefore in unidirectional Prepregs the local FVF is equal to the global FVF while in a woven material the local FVF in the roving is much higher than the global one. These findings lead to the conclusion that it is the local FVF that causes the FVF-effect. The critical FVF is 43% for a woven microstructure. This leads to a local FVF of about 60% which is almost the critical FVF for a unidirectional microstructure.
Figure 4. Micro structure of well dispersed fibres in a unidirectional Prepreg (left) and fibre rich strands in a woven textile (right) according to [28].
3. Materials and Method
To show the accuracy of the fatigue life predictions for a new material system in chapter 4, several static and fatigue tests are prepared on fibre dominated laminates. These are laminates whose ultimate strengths are mainly caused by the damage mode “fibre breakage” which can be determined using the Hashin failure criterion. In chapter 3.1 the experimental setup is described while the experimental results and its discussion can be found in chapter 3.2.
3.1. Experimental Setup
The material used for validation tests is a GFRP. In the textile type VR 434 GI96 a share of 90% of the fibres are aligned in the main direction while 10% of them are woven transversally for stabilization. The resin system is an Epikote 04434 from Hexion. The material is bought and delivered from Lange+Ritter GmbH. Resin transfer moulding (RTM) is used for fabrication of the specimen. The last tempering step is at 160 °C to receive a glass transition temperature of the same value.

776
AIMS Materials Science Volume 3, Issue 3, 770-795.
Figure 5. Geometry of the unidirectional (left) and the multidirectional (right) specimen.
The geometry of the specimen used for static as well as for fatigue tests are shown in Figure 5. The geometry is chosen according to the American standard ASTM D3479/D3479M. For the unidirectional layups four plies are used while the multidirectional layups consist of eight plies and have therefore twice the thickness. The fixation tabs are also built in the RTM-process using the same materials mentioned above and a [+−45] layup.
The static tensile tests are performed with a velocity of 2 mm/min according to the German standards DIN EN ISO 527-5 (unidirectional specimen) and DIN EN ISO 527-4 (multidirectional specimen). The fatigue tests are performed at room temperature (23 °C), a stress ratio of R = 0.1 and a frequency of 10 Hz that causes no autogeneous heating. The constant load is a stress controlled sine wave.
3.2. Experimental Results
Six different layups given in Table 1 are tested for static response. Some typical results are presented in Figure 6. This figure indicates that all the fibre dominated laminates show a linear elastic behaviour up to approximately 70% of the maximum load. Then cracks in the transverse tows occur and reduce the stiffness by a small amount. The ultimate strength differs very much depending on the layup, the FVF and the temperature which can be seen from Table 1.
The average global FVF can be calculated from the number of plys, the mass per unit area of the textile, the specimen’s thickness, and the composite density using the following formula:
∙∙
(4)
Furthermore stress controlled fatigue tests at R = 0.1 are performed. These experimental data are illustrated in Figure 7–Figure 8. There is also shown an experimental approximation that is based on the normalised S-N-curve from equation (3). For each fatigue data point i a normalised stress is calculated. Since the parameter a equals 1 as described above, only the parameter b needs to be

777
AIMS Materials Science Volume 3, Issue 3, 770-795.
approximated. Using the least squares method the following equation for the approximation of the slope b can be derived.
∑ ∙ 1 ,
∑(5)
Figure 6. Stress-Strain-Curves from static tensile tests at 23 °C.
The fatigue experiments that are performed on the 0°-laminates are presented in Figure 7. The normalised S-N-curves show that the fatigue factor is increased by reducing the FVF from 0.6 to 0.41. Interestingly it can be seen that the fatigue factor is also increased by increasing the temperature from 23 °C to the glass transition temperature of 160 °C. This observation is new and not reported in the literature.
Figure 7. S-N-curves of laminates [0]4 at different temperatures and FVFs.
0
200
400
600
800
1000
1200
0,0 1,0 2,0 3,0 4,0
stre
ss [M
Pa]
strain [%]
[0], φ=0.6
[0], φ=0.41
0
200
400
600
800
1000
1200
0,0 1,0 2,0 3,0 4,0
stre
ss [M
Pa]
strain [%]
[0/90/+-10]
[+-10]
0.00
0.20
0.40
0.60
0.80
1.00
1.20
1.E+00 1.E+02 1.E+04 1.E+06 1.E+08
Nor
mal
ised
Str
ess
Cycles
FVF=0.6, T=23°C Regression curve
FVF=0.6, T=160°C Regression Curve
FVF=0.41, T=23°C Regression curve
778
AIMS Materials Science Volume 3, Issue 3, 770-795.
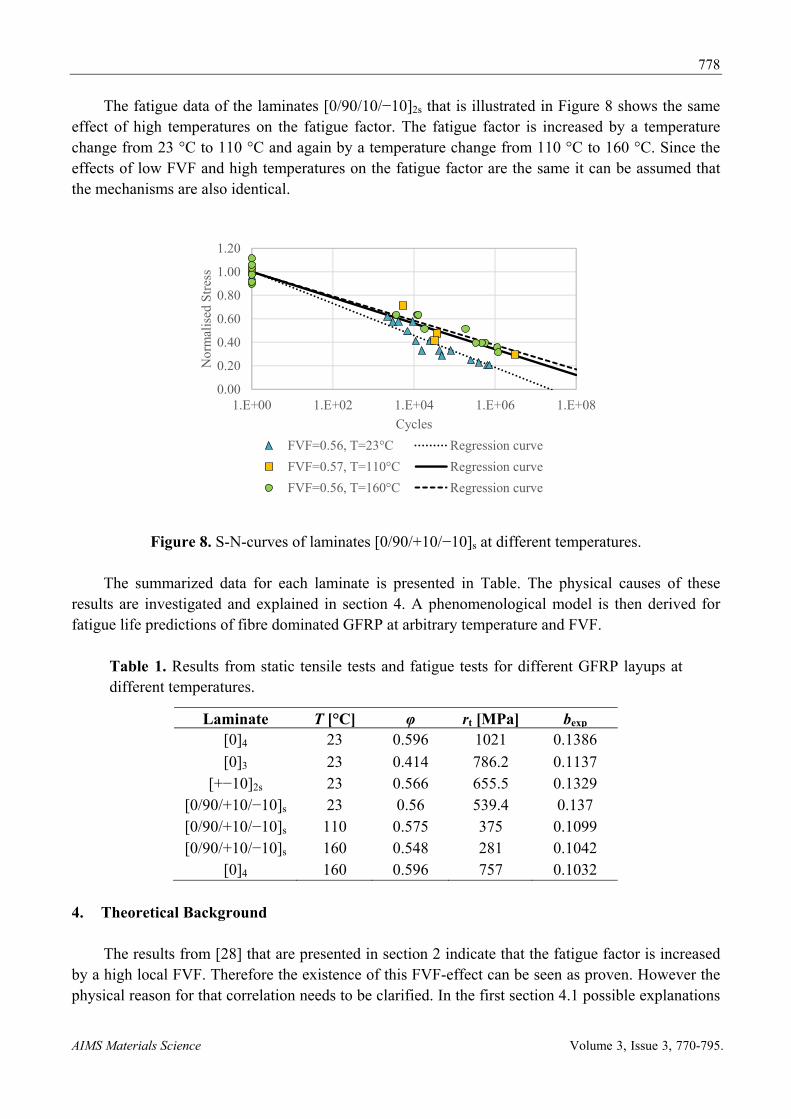
The fatigue data of the laminates [0/90/10/−10]2s that is illustrated in Figure 8 shows the same effect of high temperatures on the fatigue factor. The fatigue factor is increased by a temperature change from 23 °C to 110 °C and again by a temperature change from 110 °C to 160 °C. Since the effects of low FVF and high temperatures on the fatigue factor are the same it can be assumed that the mechanisms are also identical.
Figure 8. S-N-curves of laminates [0/90/+10/−10]s at different temperatures.
The summarized data for each laminate is presented in Table. The physical causes of these results are investigated and explained in section 4. A phenomenological model is then derived for fatigue life predictions of fibre dominated GFRP at arbitrary temperature and FVF.
Table 1. Results from static tensile tests and fatigue tests for different GFRP layups at different temperatures.
Laminate T [°C] φ rt [MPa] bexp [0]4 23 0.596 1021 0.1386
[0]3 23 0.414 786.2 0.1137 [+−10]2s 23 0.566 655.5 0.1329
[0/90/+10/−10]s 23 0.56 539.4 0.137 [0/90/+10/−10]s 110 0.575 375 0.1099 [0/90/+10/−10]s 160 0.548 281 0.1042
[0]4 160 0.596 757 0.1032
4. Theoretical Background
The results from [28] that are presented in section 2 indicate that the fatigue factor is increased by a high local FVF. Therefore the existence of this FVF-effect can be seen as proven. However the physical reason for that correlation needs to be clarified. In the first section 4.1 possible explanations
0.00
0.20
0.40
0.60
0.80
1.00
1.20
1.E+00 1.E+02 1.E+04 1.E+06 1.E+08
Nor
mal
ised
Str
ess
Cycles
FVF=0.56, T=23°C Regression curve
FVF=0.57, T=110°C Regression curve
FVF=0.56, T=160°C Regression curve
779
AIMS Materials Science Volume 3, Issue 3, 770-795.
of the FVF-effect on the fatigue factor b are discussed. A new physical explanation that considers the interface stresses in the microstructure is presented and studied in detail. Based on that model the consequences for the temperature effect on the fatigue factor are derived. The findings from 4.1 result in a phenomenological model that is presented in section 4.2.
Physical Explanation
As shown in section 2 the fatigue factor increases with an increasing fibre volume fraction. Furthermore this effect is attributed to a high local FVF. Since unidirectional composites show the same effect it can be concluded that fibre undulations in woven materials are not the cause of the effect. To quantify this relation a linear regression is done and the following equation is obtained by using the experimental fatigue data from [28] :
0.1063 , 0.30.1099 ∙ 0.0734, 0.3 (6)
This linear regression is plotted in Figure 2 and can be seen as a master curve considering the FVF-effect. According to [28] this effect is caused by the woven textile structure since this leads to a local FVF in the strands that is much higher than the global one. The decrease of fatigue performance starts at global FVF of 30%. This means that the local and not the global FVF is responsible for this effect. However it is the global FVF that is mostly know and therefore used in the following.
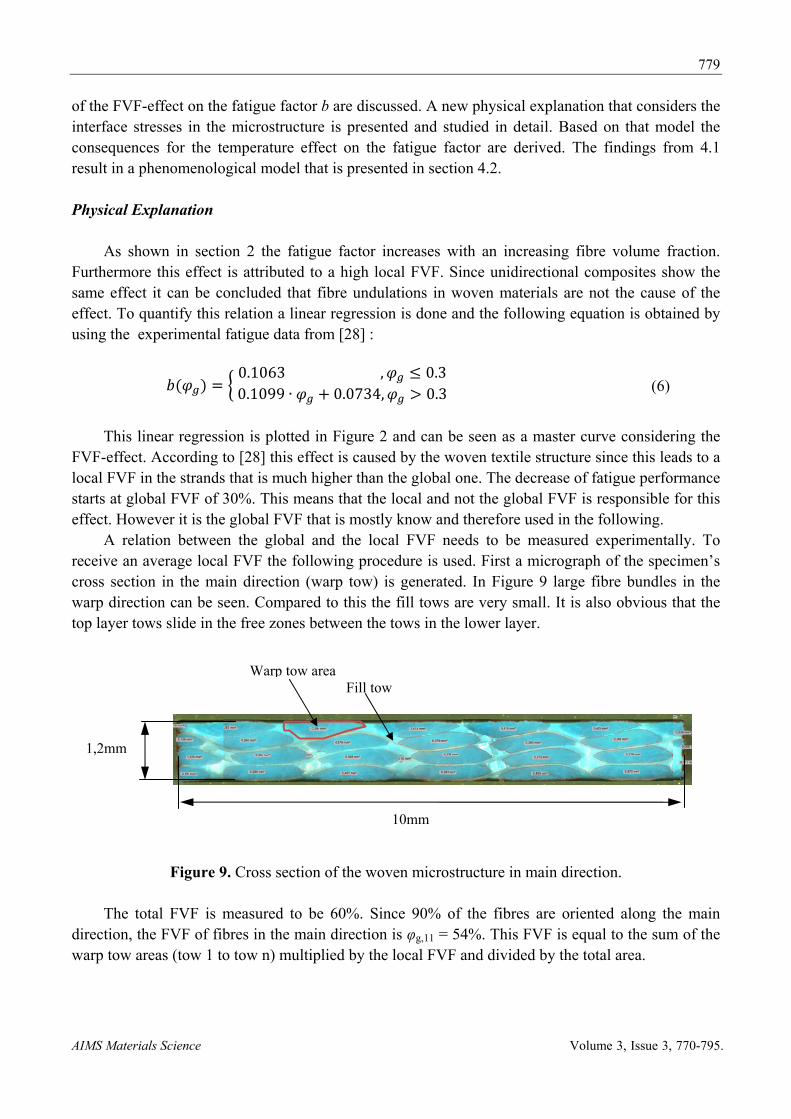
A relation between the global and the local FVF needs to be measured experimentally. To receive an average local FVF the following procedure is used. First a micrograph of the specimen’s cross section in the main direction (warp tow) is generated. In Figure 9 large fibre bundles in the warp direction can be seen. Compared to this the fill tows are very small. It is also obvious that the top layer tows slide in the free zones between the tows in the lower layer.
Figure 9. Cross section of the woven microstructure in main direction.
The total FVF is measured to be 60%. Since 90% of the fibres are oriented along the main direction, the FVF of fibres in the main direction is φg,11 = 54%. This FVF is equal to the sum of the warp tow areas (tow 1 to tow n) multiplied by the local FVF and divided by the total area.
10mm
Warp tow areaFill tow
1,2mm

780
AIMS Materials Science Volume 3, Issue 3, 770-795.
,, . . . , ∙
(7)
After measuring the single warp tow areas and the total cross section, the local FVF in fibre direction can be calculated.
,, . . . ,
∙ , (8)
As a result a local FVF of 75% is measured. Together with the experimental literature data from [28] this data point is plotted in Figure 10 to receive a correlation between the global and the local FVF.
Figure 10. Correlation between the global and the local FVF in woven FRP.
So far it is known that the local and not the global FVF is relevant for the fatigue performance. Still it needs to be clarified why a high local FVF causes a poor fatigue performance in FRP tested in the fibre direction. In the following possible explanations are given while the focus is laid to the micromechanical approach.
From the manufacturing point of view one possible explanation might be that it is more difficult to completely impregnate the fibres with resin if the FVF is very high. This is because the fibres are tightly packed. Incompletely impregnated fibres prohibit the load transfer between fibre and matrix which could lead to additional damage during cyclic loading. Furthermore a high FVF could lead to several fibres that contact each other directly. During cyclic loading friction between these fibres could induce additional damage.
Another reason for the FVF-effect can be seen in the interface between fibre and matrix. This approach is presented in the following in detail.
The interface stress at longitudinal loading in fibre direction results from the inhomogeneous structure of composites: The fibre has a smaller Poisson’s ratio than the resin as it is presented in Table 3. At small FVF the Poisson’s ratio of the composite corresponds to the one of the resin. Therefore the composite contracts more than the fibre would do which leads to compressive interface stresses. At a high FVF the Poisson’s ratio of the composite is similar to the fibre. Therefore the
0
0.2
0.4
0.6
0.8
1
0 0.2 0.4 0.6 0.8 1
Loc
al F
VF
Global FVF
Experimental Literature Data
Experimental Data
Linear Regression

781
AIMS Materials Science Volume 3, Issue 3, 770-795.
composite contracts less than the matrix would do which leads to tensional stresses on the interface. Figure 11 shows this mechanical behaviour.
Figure 11. Cause of interface stress at low FVF (left) and high FVF (right).
For the further quantitative analysis a micromechanical finite element model is used. Models for woven microstructure are available and are studied in the literature frequently [29,30]. However the experimental results show that the local FVF in the tows of the woven microstructure is relevant for the FVF-effect. Therefore considering a unidirectional microstructure is sufficient for an analysis of the interface stresses.
The corresponding square representative volume element (RVE) according to [31] is illustrated in Figure 12. The loading is a longitudinal force and the composite can contract freely as it is shown in Figure 12.
Figure 12. RVE of unidirecional GFRP (left), deformation in longitudinal loadcase (mid), contact pressure in the fibre-matrix-interface after loading (right).
The square RVE has a cube-shape with an edge length of 10 mm. The length dimensions are do not equal the real dimensions of the fibre. This has no effect on the stress calculations as long as the FVF is modelled correctly. The FVF can be varied by the fibre diameter. For the connection between fibre and matrix a bonded surface to surface contact of Ansys is used. The model is built and calculated using Ansys Workbench v.16. The matrix stresses in fibre direction and the interface stresses are calculated. Obviously the matrix stresses are reduced by a high FVF. Therefore the interface stress is supposed to be responsible for the FVF-effect on fatigue behaviour. Via the contact tool one has the possibility to evaluate the radial contact pressure in the interface (Figure 12, right).
In the first step a sensitivity analysis is run to see the correlations between the maximum interface stress and the input parameters: elastic modulus of matrix Em, Poisson’s ration of matrix m, elastic modulus of fibre Ef, Poisson’s ration of fibre f, local fibre volume fraction φ. It also helps to get a better understanding of the model. This is done with DOE and the scheme “Advanced Latin
σinter max
fibre
matrix

782
AIMS Materials Science Volume 3, Issue 3, 770-795.
Hypercube sampling” in the Software Optislang v.4.2.1. The longitudinal load is held constant to a standard load of 1000MPa. The ranges of the parameters used in the sensitivity analysis are illustrated in Table 2.
Table 2. Input parameters and parameter ranges for the sensitivity analysis.
Parameter Unit Range Em MPa 200 6000
- 0.1 0.4 Ef MPa 70000 78000 - 0.1 0.4 φ - 0.25 0.76
The results of the sensitivity analysis are three-dimensional response surface plots that show the influence of two of the input parameters on one of the output parameters. Figure 13 shows the influence of the Poisson’s ratios at an FVF of 75%. It can be seen that the interface stress is small if the values of m and f are close to each other. The more these parameters differ the larger the interface stress.
Figure 13. Response surface plot σinter,max = f(m, f), constant parameters: Ef = 74000 MPa, Em = 2500 MPa, φ = 0.75.
In Figure 14 the influence of the matrix’s elastic modulus and the FVF on the interface stress is shown. It can be seen that the maximum interface stress is increased with increasing FVF. This effect
Inte
rfac
e st
ress
[M
Pa]

783
AIMS Materials Science Volume 3, Issue 3, 770-795.
is even larger the higher the elastic modulus is. It is also very interesting to note that the maximum interface stress has a change of sign at about φ = 0.5. Low FVFs cause a compressive stress while high FVFs cause tensile interface stresses which corresponds to the considerations made before.
Figure 14. Response surface plot σinter,max = f(φ, Em), constant parameters: Ef = 74000 MPa, m = 0.35, f = 0.22.
As the analysis showed both the interface stress and the fatigue factor b increase with an increasing FVF. The explain the poor fatigue behavior at high FVF a correlation between the interface stress and the fatigue damage mechanisms needs to be established. This is described in the following section.
According to [32] the evolution of fatigue damage is determined by microcracks in the matrix and can be divided in three stages. The relevant damage mechanisms are drawn schematically in Figure 15.
As stated in [33] the damage evolution starts with the Formation of microcracks in the matrix that are perpendicular to the fibre and initiated by voids, air bubbles, early fibre breaks, inclusions or cracks in adjacent plies. Furthermore the damage of fibre/matrix-interface starts by Interface-debonding. This leads to a reduced load transfer between fibre and matrix and favoured further microcracking in the matrix as described in [6]. Additionally interface-debonding can be the origin for fibre pull-out. In the second stage a stabile propagation of the microcracks takes place according to [4,33]. As described in [4,6] two cases can be differentiated. If the interface is strong and the interface stress is low the crack will stop at the fibre. If the interface is weak and the interface stress is high the crack passes around the fibre which leads to fibre-bridged matrix cracking. In the third stage perpendicular macrocracks in the matrix and fibre bridging because stress concentrations in
Inte
rfac
e st
ress
[M
Pa]

784
AIMS Materials Science Volume 3, Issue 3, 770-795.
nearby fibres which will lead to additional fibre fracture. Fibre fracture is the origin for further matrix cracking and also fibre fracture and causes therefore a synergetic event.
Figure 15. Damage evolution during fatigue life in fibre direction.
If the FVF increases, the interface stresses change from negative values to positive values and may lead to additional interface-debonding. By interface-debonding the fibre stresses are not able to be transferred into the matrix and the nearby fibres which will accelerate the damage evolution and therefore reduce the fatigue life until fibre fracture occurs. This is how interface stresses could explain the poor fatigue performance of GFRP at high FVF.
Now the interface stress in the specimen that are used for the experiments in chapter 3 shall be analysed. Therefore it is necessary to have the exact elastic properties of the constituents. The elastic modulus of the resin system is measured experimentally at various temperatures and the results are given in Figure 16.
Figure 16. Experimental measurement of the elastic modulus of Epikote 04434 from Hexion.
To have sufficient material data for the further constituent material properties a literature search on elastic properties of glass fibres and epoxy resin systems is done. Reliable data could be found in [2,3435,36]. Based on that values the constituent properties for the further FEM-analysis are
0500
1000150020002500300035004000
-50 0 50 100 150 200
Ela
stic
Mod
ulu
s [M
Pa]
Temperature [°C]
exp. Data resin
linear regression
Interface-
Debonding
Perpendicular
matrix crack
Crack halted by fibre
Crack passes
around fibre
Accumulation of
micro cracks
Fibre
Pullout
Fibre
fracture
Fibre
fracture

785
AIMS Materials Science Volume 3, Issue 3, 770-795.
defined as illustrated in Table 3. The elastic modulus of the matrix depends on temperature. At 23 °C it is 2500 MPa, but at the glass transition temperature of 160 °C it is 500 MPa. With these values as input, a parameter study of the FVF-effect on the interface stress is performed using the same model as for the sensitivity analysis.
Table 3. Elastic constituent properties used for the FVF-study.
Parameter Unit Value
Em MPa 500 at 160 °C, 2500 at 23 °C
- 0.35 Ef MPa 74000 - 0.22 φg - variable
In this study the FVF is varied in the range of 20 to 75%, while the longitudinal load of 1000 MPa stays constant. The interface stress at different FVF and the two temperatures 23 °C and 160 °C can be seen from Figure 17. The change of sign at about φ = 0.5 is now very clear for both temperatures. At 160 °C the elastic modulus of the matrix is much lower and therefore the interface stresses are lower as well.
Figure 17. FVF-effect on the maximum interface stress.
As described above the critical local FVF at 23 °C is 60%. Above this value the fatigue factor is increased by an increasing FVF. The RVE analysis (Figure 17) shows that the Interface stress at this critical FVF is 2.68 MPa. This threshold stress is assumed to be independent from the temperature. Since the interface stress at 160 °C stays below this threshold stress of 2.68 MPa until an FVF of 75% it is assumed that the fatigue factor b is not increased significantly by higher FVF at 160 °C. These findings are used in the next section 4.2 to create a simple phenomenological model.
-15
-10
-5
0
5
10
15
0.2 0.3 0.4 0.5 0.6 0.7 0.8 0.9
Inte
rfac
e st
ress
[M
Pa]
local fiber volume fraction
RT
160°C

786
AIMS Materials Science Volume 3, Issue 3, 770-795.
4.1. Phenomenological model
The starting point of the phenomenological model is the master curve of the FVF-effect on the fatigue factor b that is described by equation (6) using the global FVF as input. The assumption is that b does not change below a global FVF of 30%. Therefore bmin can be calculated using equation (6) with φg = 0.3 as input. In the following equation (6) is rewritten using parameters:
, 0.3∙ , 0.3 (9)
Furthermore a maximum global FVF can be defined as 60% since the local FVF is then 75% according to Figure 10. Global FVF of 60% are the current technical limit. Higher FVF are technically not meaningful. Consequently the parameter bmax can be calculated using equation (6) with φg = 0.6 as input. As shown by the RVE analysis, the reduction in the elastic modulus of the matrix at the glass transition temperature of 160 °C leads to strongly reduced interface stresses. And as explained in the previous section it is therefore assumed that the FVF has no effect on the fatigue factor at the glass transition temperature which means that b is equal to bmin independently from the FVF. The temperature-effect on the fatigue factor can be taken into account by assuming a linear decrease of the fatigue factor between 23 °C and the glass transition temperature at a global FVF of 60%. The linearity is assumed since the experimental data showed a linear relation between the FVF and the fatigue factor as well. The gradient of the temperature influence at φg = 0.6 is then defined by equation (10). To eliminate the temperature influence at 23 °C is introduced and can be calculated by equation (11).
23 ° (10)
23° ∙ (11)
Assembling both effects leads to the following linear equation with two input parameters:
, ∙ ∙ ; (12)
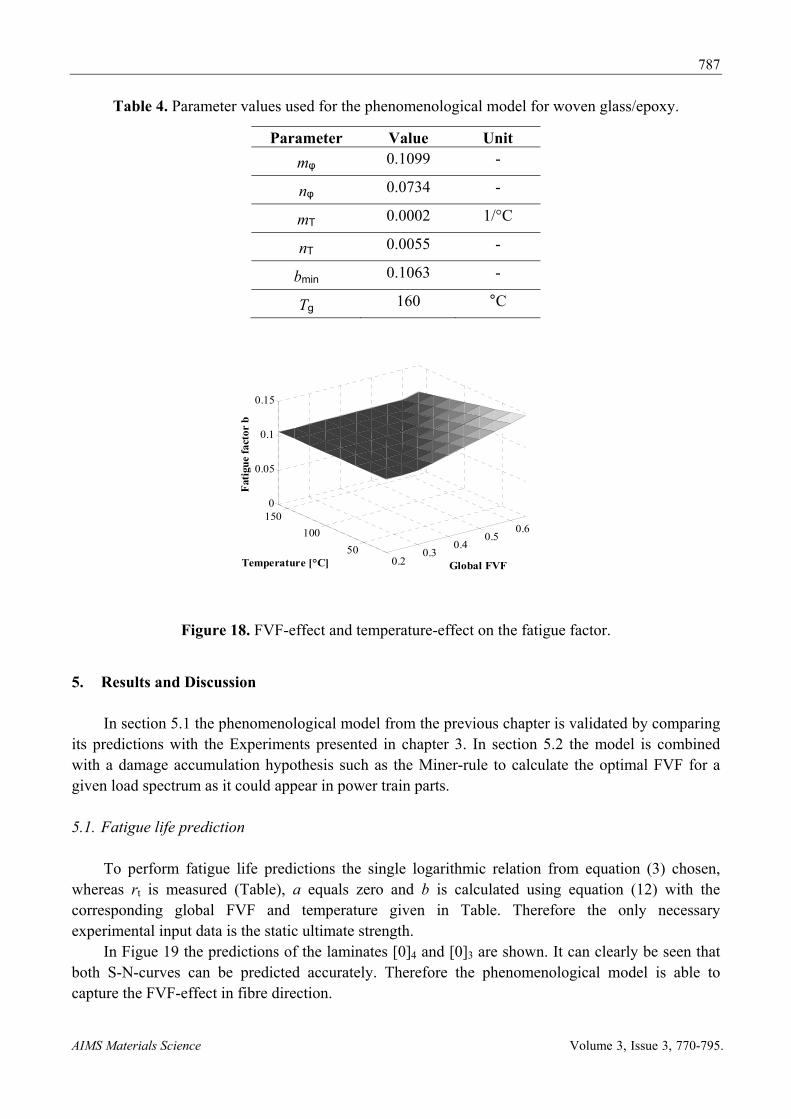
Interesting to note is that this model needs only the measurement of the glass transition temperature of the matrix material. All the other parameters are gained from the master curve in equation (6) that is valid for GFRP. All the parameters used for equation (12) are summarized with the corresponding values in Table 4. From the analysis of the literature fatigue data mφ, nφ and bmin appear to be universal constants for woven GFRP. The parameters mT and nT depend on the glass transition temperature of the composite.
The visualization of equation (12) using the parameter values from Table 4 is illustrated in Figure 18. Now that it is possible to calculate the fatigue factor at arbitrary temperature and FVF, one only needs to measure the static ultimate strength to make fatigue life predictions for fibre dominated laminates at R = 0.1 using equation (3). The accuracy of these predictions is shown in the next chapter 5.
787
AIMS Materials Science Volume 3, Issue 3, 770-795.
Table 4. Parameter values used for the phenomenological model for woven glass/epoxy.
Parameter Value Unit
mφ 0.1099 -
nφ 0.0734 -
mT 0.0002 1/°C
nT 0.0055 -
bmin 0.1063 -
Tg 160 °C
Figure 18. FVF-effect and temperature-effect on the fatigue factor.
5. Results and Discussion
In section 5.1 the phenomenological model from the previous chapter is validated by comparing its predictions with the Experiments presented in chapter 3. In section 5.2 the model is combined with a damage accumulation hypothesis such as the Miner-rule to calculate the optimal FVF for a given load spectrum as it could appear in power train parts.
5.1. Fatigue life prediction
To perform fatigue life predictions the single logarithmic relation from equation (3) chosen, whereas rt is measured (Table), a equals zero and b is calculated using equation (12) with the corresponding global FVF and temperature given in Table. Therefore the only necessary experimental input data is the static ultimate strength.
In Figue 19 the predictions of the laminates [0]4 and [0]3 are shown. It can clearly be seen that both S-N-curves can be predicted accurately. Therefore the phenomenological model is able to capture the FVF-effect in fibre direction.
0.20.3
0.40.5
0.6
50
100
1500
0.05
0.1
0.15
Global FVFTemperature [°C]
Fat
igu
e fa
ctor
b

788
AIMS Materials Science Volume 3, Issue 3, 770-795.
Figure 19. Experimental fatigue data and predicted S-N-curves of laminates [0]4 and [0]3
at room temperature.
But the model is not only applicable to the [0] lamiantes but also gives accurate predictions for fibre dominated laminates. According to [16] these are laminates whose strength in mainly influenced by plies that fail by fibre fracture according to the Hashin criterion [37]. The fatigue data of laminate [+−10]2s as well as [0/90/+10/−10]s shows a very good correlation with the model predictions which can be seen from Figure 20.
Figure 20. Experimental fatigue data and predicted S-N-curves lines of laminates [+−10]2s and [0/90/+10/−10]s at room temperature.
Furthermore the model is able to capture the temperature effect on the fatigue factor. This can be seen from Figure 22 that shows the prediction of the [0]4 laminate at 160 °C. The fatigue factor is
0
200
400
600
800
1000
1200
1400
1.E+00 1.E+03 1.E+06
Up
per
Str
ess
[MP
a]
Cycles
Experimental Data Prediction
[0]4, φg=0.596, T=23°C
0
200
400
600
800
1000
1200
1400
1.E+00 1.E+03 1.E+06
Up
per
Str
ess
[MP
a]
Cycles
Experimental Data Prediction
[0]3, φg=0.414, T=23°C
0
100
200
300
400
500
600
700
800
1.E+00 1.E+03 1.E+06
Up
per
Str
ess
[MP
a]
Cycles
Experimental Data Regression Curve
[10/-10]2s, φg=0.566, T=23°C
0
100
200
300
400
500
600
700
800
1.E+00 1.E+03 1.E+06
Up
per
Str
ess
[MP
a]
Cycles
Experimental Data Prediction
[0/90/10/‐10]s, φg=0.56, T=23°C

789
AIMS Materials Science Volume 3, Issue 3, 770-795.
0.1032 and therefore almost the same as at room temperature and a low FVF. This is because both high temperatures and low FVF lead to reduced interface stresses and therefore to longer fatigue lives.
Figure 21. Experimental fatigue data and predicted S-N-curves of laminate [0]4 at elevated temperature.
The prediction works not only for the fibre direction but also for fibre dominated laminates. Therefore it is possible to make accurate predictions for the [0/90/+10/−10]s laminate at 110 °C and 160 °C as it is illustrated in Figure 22. The very good correlation validates the theory and structure of the model from chapter 4 additionally.
Figure 22. Experimental fatigue data and predicted S-N-curves of laminate [0/90/+10/−10]s at elevated temperatures.
0
200
400
600
800
1000
1200
1400
1.E+00 1.E+03 1.E+06
Upp
er S
tres
s [M
Pa]
Cycles
Experimental Data Prediction
[0]4, φg=0.596, T=160°C
0
100
200
300
400
500
600
700
800
1.E+00 1.E+03 1.E+06
Up
per
Str
ess
[MP
a]
Cycles
Experimental Data Prediction
[0/90/10/‐10]s, φg=0.57, T=110°C
0
100
200
300
400
500
600
700
800
1.E+00 1.E+03 1.E+06
Up
per
Str
ess
[MP
a]
Cycles
Experimental Data Prediction
[0/90/10/‐10]s, φg=0.55, T=160°C

790
AIMS Materials Science Volume 3, Issue 3, 770-795.
As it is shown in this chapter the interface stress approach gives a plausible explanation in how far a high FVF leads to poor fatigue performance at room temperature and that the fatigue performance is not lowered at high temperatures near the glass transition temperature. To make fatigue life predictions for R-values other than 0.1 the theory described in [16] can be used. The inputs are the tensile and compressive static ultimate strengths at a given temperature and FVF. Furthermore the fatigue data at R = 0.1 is required.
5.2. Optimal FVF
In section 5.1 it is shown that the phenomenological model is valid to predict S-N-curves at arbitrary FVF and temperature. Now this model shall be used to determine the optimal fibre volume content. To demonstrate this the fatigue data of the [0°] layup at 23 °C is used as an example.
The first step is to find a relation between the global FVF and the static ultimate strength. This task can be accomplished using the experimental static strength at different FVF. Figure 23 shows the corresponding experimental data and the linear regression that is expressed as follows:
1524.2 ∙ 96.8 (13)
Figure 23. Influence of the global FVF on the static ultimate strength in fibre direction.
Figure 24. Two load spectra defined by upper stress vs. cumulative cycles.
0
200
400
600
800
1000
1200
0 0.2 0.4 0.6 0.8
Str
engt
h r
t[M
Pa]
Global FVF φg
Experimental Data
Linear Regression
0100200300400500600700800900
1000
1.E+00 1.E+02 1.E+04 1.E+06 1.E+08
Upp
er S
tres
s [M
Pa]
Cycles
Load Spectrum A
Load Spectrum B

791
AIMS Materials Science Volume 3, Issue 3, 770-795.
Furthermore the relation between the FVF and the fatigue factor is known from equation (6). With both relations it is possible to make fatigue life predictions for any load spectrum.
Figure 24 shows two different loading spectra A and B. Both spectra are examples to show that the there is an optimal FVF for a given load spectrum. The exact definition of the spectra is given in Table 5 by the upper stress and the loading cycles. Both spectra consist of 5 different load levels at an R-value of 0.1.
Table 5. Definition of the loading spectra A and B.
To define the optimal FVF according to a given load spectrum, it is necessary to have a damage accumulation hypothesis such as the Miner rule.
(14)
The Miner rule was published in [38] and offers a simple damage sum criterion to decide whether the material can withstand a load history or not. In [39] the Miner rule is investigated regarding the adaptability to composite materials and it is stated that this rule leads to non-conservative fatigue life prediction. Even though it is used in this work as a qualitative indicator. With the miner rule it is possible to calculate the maximum cycles to failure Ni at each load level for a given FVF.
10
,
(15)
After that the Damage can be summed up over each load level. The damage sum is calculated for both load spectra and various FVFs. The optimal FVF is defined as the FVF that results in the minimum damage sum. By plotting the damage sum over the global FVF the optimal FVF can be identified graphically very well as shown in Figure 25. The optimum is φopt = 0.375 for load spectrum B and φopt = 0.625 for load spectrum A. It is shown that the optimum in FVF can be totally different depending on the load spectrum. Considering load spectrum B, the damage sum can be reduced by a factor of 3 by using a FVF of 37.5% instead of a common used FVF of 55%. This result shows that it can be very helpful to calculate the optimal FVF previously since it will reduce the laminate thickness and save costs as well as weight.
load level i σo,i [MPa] ni 1 750 20 2 630 100 3 500 1000 4 350 5000 5 200 500000
load level i σo,i [MPa] ni 1 480 60 2 300 1000 3 250 10000 4 200 230000 5 120 8000000

792
AIMS Materials Science Volume 3, Issue 3, 770-795.
Figure 25. Dependence of the damage sum from the global FVF for different load spectra.
6. Conclusion
In this paper the FVF-effect and temperature-effect on the fatigue strength of woven GFRP are investigated experimentally and theoretically. The most important results can be summarized as follows:
(1) The FVF-effect and the temperature-effect on the fatigue strength of fibre dominated laminates is measured experimentally. The results are compared with respect to the fatigue factor b whereas a large value of b represents a high fatigue sensitivity. It is found that the fatigue factor increases with the FVF and decreases with the temperature.
(2) An approach for explaining the experimental results on microstructure level is presented. The core of the approach is based on the interface stress that results from a longitudinal loading in woven GFRP because of the material’s inhomogeneity and causes an additional damage and therefore a shorter fatigue life. The interface stress is calculated using FEM with a square RVE and it is shown that the interface stress increases with the FVF. At a FVF of about 50% the stresses change from negative values to positive values. According to the model the fatigue factor is increased by the FVF because the interface stress is increased. A higher temperature will reduce the fatigue factor because the elastic modulus of the matrix and therefore the interface stress will be reduced while the fibre’s modulus is constant.
(3) A simple phenomenological model is generated from the previous findings. Since a master curve is generated from a lot of literature fatigue data, the only input to the model is the glass transition temperature and the static ultimate strengths of the corresponding laminate. Then it is possible to make fatigue life predictions for fibre dominated laminates at an arbitrary temperature and arbitrary FVF. The high accuracy of these predictions is shown by fatigue experiments and validates the model.
(4) The phenomenological model is combined with the Miner rule as a damage accumulation hypothesis and then used to calculate the optimal FVF for two exemplarily chosen load spectra. It is shown that the optimum can be very different depending on the load spectrum. If the spectrum contains high stress levels and short fatigue cycles a high FVF is recommended. Otherwise the FVF should be low.
0.00.51.01.52.02.53.03.54.04.55.0
0.1 0.2 0.3 0.4 0.5 0.6 0.7 0.8
Dam
age
Sum
[M
Pa]
Global FVF
Load Spectrum A
Load Spectrum B

793
AIMS Materials Science Volume 3, Issue 3, 770-795.
So far these key findings are modelled using a fatigue life model. For the future it is planned to integrate these correlations into a progressive fatigue framework. This would extend the fatigue life predictions to notched specimen with an arbitrary layup.
Furthermore in future one must try to get even more fatigue data and validate the model to them, e.g. low FVF and high temperatures. Another open question is, how the FVF and temperature will influence laminates that mainly fail by interfibre breakage, e.g. 90°-specimen.
Finally the investigation of other fibre materials could be very interesting. According to the presented model, a CFRP material will have a lower fatigue sensitivity regarding temperature and FVF since the transversal elastic modulus is about 20000 MPa and therefore much lower than the isotropic elastic modulus of the glass fibre that is 70000 MPa. This softer fibre will reduce the interface stresses and therefore lower the sensitivity of the fatigue factor.
Conflict of Interest
The authors declare no conflicts of interest regarding this paper.
References
1. Lässig R, Eisenhut M, Mathias A, et al. (2012) Serienproduktion von hochfesten Faserverbundbauteilen: VDMA Verlag.
2. Schürmann H (2007) Konstruieren mit Faser-Kunststoff-Verbunden. Berlin: Springer. 672 S. p. 3. Vassilopoulos AP, Keller T (2011) Fatigue of fiber-reinforced composites. London: Springer.
238 S. p. 4. Fertig III RS, Kenik DJ (2011) Predicting Composite Fatigue Life Using Constituent-Level
Physics. AIAA/ASME/ASCE/AHS/ASC Structures, Structural Dynamics and Materials Conference. Denver, Colorado.
5. Krüger H (2012) Ein physikalisch basiertes Ermüdungsschädigungsmodell zur Degradationsberechnung von Faser-Kunststoff-Verbunden [Ph.D Thesis]: Leibniz-Universität Hannover.
6. Talreja R, Singh CV (2012) Damage and Failure of Composite Materials. Cambridge: Cambridge University Press, 1–304 p.
7. Salkind MJ (2011) Fatigue of Composites. Composite Materials: Testing and Design (Second Conference). Philadelphia.
8. Kensche CW (1996) Fatigue of materials and components for wind turbine rotor blades. Brussels: German Aerospace Research Establishment.
9. Harris B (2003) Fatigue in composites science and technology of the fatigue response of fibre-reinforced plastics. Boca Raton: Elsevier Science Ltd 742 S. p.
10. Pandita SD, Huysmans G, Wevers M, et al. (2001) Tensile fatigue behaviour of glass plain-weave fabric composites in on- and off-axis directions. Compos Part A-Appl S 32: 1533–1539.
11. Kawai M, Yajima S, Hachinohe A, et al. (2001) High-temperature off-axis fatigue behaviour of unidirectional carbon-fibre-reinforced composites with different resin matrices. Compos Sci Technol 61: 1285–1302.
12. Quaresimin M, Susmel L, Talreja R (2010) Fatigue behaviour and life assessment of composite laminates under multiaxial loadings. Int J Fatigue 32: 2–16.

794
AIMS Materials Science Volume 3, Issue 3, 770-795.
13. Kawai M (2004) A phenomenological model for off-axis fatigue behavior of unidirectional polymer matrix composites under different stress ratios. Compos Part A-Appl S 35: 955–963.
14. Kawai M, Kato K (2006) Effects of R-ratio on the off-axis fatigue behavior of unidirectional hybrid GFRP/Al laminates at room temperature. Int J Fatigue 28: 1226–1238.
15. Vassilopoulos AP, Manshadi BD, Keller T (2010) Influence of the constant life diagram formulation on the fatigue life prediction of composite materials. Int J Fatigue 32: 659–669.
16. Flore D, Wegener K (2016) Modelling the mean stress effect on fatigue life of fibre reinforced plastics. Int J Fatigue 82: 689–699.
17. Van Paepegem W, Degrieck J (2001) Fatigue damage modeling of fibre-reinforced composite materials: review. Appl Mech Rev 54: 279–300.
18. Kawai M, Teranuma T (2012) A multiaxial fatigue failure criterion based on the principal constant life diagrams for unidirectional carbon/epoxy laminates. Compos Part A 43: 1252–1266.
19. Papanicolaou GC, Zaoutsos SP (2011) Viscoelastic constitutive modeling of creep and stress relaxation in polymers and polymer matrix composites. In: Guedes RM, editor. Creep and fatigue in polymer matrix composites. Cambridge: Woodhead Publishing Limited. pp. 572.
20. Dillard DA (1990) Viscoelastic Behavior of Laminated Composite Materials. In: Reifsnider KL, editor. Fatigue of Composite Materials: Elsevier Science Publishers B.V.,.
21. Song J, Wen WD, Cui HT, et al. (2015) Effects of temperature and fiber volume fraction on mechanical properties of T300/QY8911-IV composites. J Reinf Plast Comp 34: 157–172.
22. Vasiliev VV, Morozov EV (2013) Advanced mechanics of composite materials and structural elements. Amsterdam: Elsevier. 818 S. p.
23. Rejab MRM, Theng CW, Rahman MM, et al. An Investigation into the Effects of Fibre Volume Fraction on GFRP Plate; 2008.
24. Karahan M (2012) The effect of fibre volume fraction on damage initiation and propagation of woven carbon-epoxy multi-layer composites. Text Res J 82: 45–61.
25. He HW, Gao F (2015) Effect of Fiber Volume Fraction on the Flexural Properties of Unidirectional Carbon Fiber/Epoxy Composites. Int J Polym Anal Ch 20: 180–189.
26. Allah MHA, Abdin EM, Selmy AI, et al. (1996) Effect of fibre volume fraction on the fatigue behaviour of grp pultruded rod composites. Compos Sci Technol 56: 23–29.
27. Mini KM, Lakshmanan M, Mathew L, et al. (2012) Effect of fibre volume fraction on fatigue behaviour of glass fibre reinforced composite. Fatigue Fract Eng M 35: 1160–1166.
28. Samborsky DD, Mandell JF, Cairns DS (2002) Sandia Contractors report - Fatigue of composite materials and substructures for wind turbine blades. Montana State University.
29. Barbero EJ, Trovillion J, Mayugo JA, et al. (2006) Finite element modeling of plain weave fabrics from photomicrograph measurements. Compos Struct 73: 41–52.
30. Kuhn JL, Charalambides PG (1999) Modeling of plain weave fabric composite geometry. J Compos Mater 33: 188–220.
31. Sun CT, Vaidya RS (1996) Prediction of composite properties, from a representative volume element. Compos Sci Technol 56: 171–179.
32. Talreja R, Singh CV (2012) Damage and Failure of Composite Materials. Cambridge Cambridge University Press 1–304 p.
33. Kennedy CR, Bradaigh CMO, Leen SB (2013) A multiaxial fatigue damage model for fibre reinforced polymer composites. Compos Struct 106: 201–210.

795
AIMS Materials Science Volume 3, Issue 3, 770-795.
34. Stellbrink K (1996) Micromechanics of Composites: Composite Properties of Fibre and Matrix Constituents. Cincinnati: Hanser.
35. Pristavok J (2006) Mikromechanische Untersuchung an Epoxidharz Glasfaser Verbunden unter zyklischer Beanspruchung [Ph.D. Thesis]: Technische Universität Dresden.
36. Soden PD, Hinton MJ, Kaddour AS (1998) Lamina properties, lay-up configurations and loading conditions for a range of fibre-reinforced composite laminates. Compos Sci Technol 58: 1011–1022.
37. Hashin Z (1980) Failure Criteria for Unidirectional Fiber Composites. J Appl Mech-T Asme 47: 329–334.
38. Miner MA (1945) Cumulative Damage in Fatigue. J Appl Mech-T Asme 12: A159–A164. 39. Van Paepegem W, Degrieck J (2002) Effects of load sequence and block loading on the fatigue
response of fiber-reinforced composites. Mech Adv Mater Struc 9: 19–35.
© 2016 Dominik Flore, et al., licensee AIMS Press. This is an open access article distributed under the terms of the Creative Commons Attribution License (http://creativecommons.org/licenses/by/4.0)