influence of internal communication on employees’ …usir.salford.ac.uk/39998/1/phd....
TRANSCRIPT
INFLUENCE OF INTERNAL COMMUNICATION ON
EMPLOYEES’ BRAND OUTCOMES
by
Sira Sriyothin
SUBMITTED IN PARTIAL FULFILMENT OF THE
REQUIREMENTS FOR THE DEGREE OF
DOCTOR OF PHILOSOPHY
AT
UNIVERSITY OF SALFORD
MANCHESTER M5 4WT UK
August 2016
ii
Declaration
I hereby declare that except where specific reference is made to work of others, the contents
of this thesis are original and have not been submitted in whole or in part for consideration
for any other degree or qualification in this, or any other university. This thesis is my own
work and contains nothing which is the outcome of work done in collaboration with others,
except as specified in the text and Acknowledgements.
Copyright © 2016 by Sira Sriyothin
“The copyright of this thesis rests with the author. No quotations from it should be published
without the author’s prior written consent and information derived from it should be
acknowledged”.

iv
Table of Contents
Page
Declaration ii
Table of Contents iv
List of Tables xi
List of Figures xiv
Acknowledgements xvii
Abstract xviii
Chapter One: Introduction
1.0 Introduction 1
1.1 Research initiative 4
1.1.1 Influence of internal communication on employee brand
performance
4
1.1.2 Importance of The Communication Satisfaction
Questionnaire (CSQ) with Internal Branding Theory
5
1.1.3 Importance of the domains of Internal Communication in a
developing country context for Internal Branding Theory
8
1.2 Research Objectives 9
1.3 Research Approach 9
1.4 Parameters of Research 10
1.5 Summary of Definitions 10
1.6 Thesis Structure 12
Chapter Two: Conceptualising Internal Branding: The Influence of Internal
Communication on Employee Brand Behaviour
2.0 Introduction 14
2.1 Internal Branding 15
2.1.1 What is Internal Branding? 15
2.1.2 The concept of Brand Promise 17
2.1.3 Brand Promise Delivery 19
2.2 The Customer-facing Employee: A Valuable Asset 20
2.3 Internal Communication: Definition, Theory and Implication 21
2.3.1 Meta-theoretical Approach 22
2.3.2 Organizational Behaviour Theory 25
2.4 Internal Communication Satisfaction 26
v
2.5 An Outcome of Internal Communication Satisfaction 29
2.6 Employee Brand Attitudes: Outcome of Internal Communication in Internal
Branding Concept
32
2.6.1 Employees’ Brand Commitment 32
2.6.2 Employees’ Brand Identification 34
2.6.3 Employees’ Brand Loyalty 36
2.7 Employees’ Brand Behaviour: Outcome of Employees’ Brand Attitudes 37
2.8 The Construct of Internal Communication Satisfaction 40
2.8.1 The Specific Internal Communication Dimensions 41
2.8.2 The internal communication dimensions by using a
standardised instrument
48
2.9 Conclusion and research gap of the construct of internal communication
satisfaction
56
Chapter Three: Conceptualization and Nomological Network of Internal
Communication Satisfaction
3.0 Introduction 58
3.1 The Construct of Downs-Hazen Communication Satisfaction Questionnaire
(CSQ)
59
3.2 The Communication Satisfaction Questionnaire (CSQ) Constructs as an
Internal Communication Satisfaction Constructs in Internal Branding Concept
63
3.2.1 The Downs-Hazen CSQ Integrated the Corporate
Communication Approaches with the Internal Branding
Approaches
64
3.2.2 The Downs-Hazen CSQ as an Aid in Investigating
Effective Internal Branding
66
3.2.3 The Link between the CSQ Constructs and Internal
Branding’s Outcomes
67
3.3 Research Objective 1: To conceptualise the domain of internal
communication within the concept of internal branding
68
3.3.1 Communication Climate 69
3.3.2 Relationship to Superiors 75
3.3.3 Organizational Integration 80
3.3.4 Media Quality 82
3.3.5 Horizontal Communication 86
3.3.6 The organizational perspective 91
vi
3.3.7 Personal Feedback 94
3.4 Objective 2: To determine the nomological network of internal branding 97
3.5 Objective 3: To evaluate the influence of internal communication on
employees’ behaviour from high/ low performance employees in Thailand.
99
3.6 Conclusion 101
Chapter Four: Importance of Internal Communication with Internal Branding in the
Hotel Industry in Thailand
4.0 Introduction 103
4.1 Importance of studying internal communication in developing countries 104
4.2 The importance of studying internal communication in internal branding
concept in the hotel industry in Thailand
114
4.3 Evaluating the moderating of internal communication in the hotel industry in
Thailand
117
4.3.1 Hotel Rating Systems 117
4.3.2 TripAvisor’s hotel ranking system 118
4.3.3 Evaluating the moderating of internal communication of
high ranking hotels and low ranking hotels in Thailand
120
4.4 Conclusion 121
Chapter Five: Methodology
5.0 Introduction 122
5.1 Research Philosophy 124
5.1.1 Philosophical Stance 124
5.1.2 Research Design Selection 126
5.2 Study Design 128
5.2.1 Data Collection Strategy –Main Survey 129
5.2.1.1 Sampling 129
5.2.1.1.1 Sampling Frame and Procedure 129
5.2.1.1.2 Sample Size 130
5.2.1.1.3 Sample Characteristics 132
5.2.1.2 Survey Administration Procedure 132
5.2.1.3 Instrument 133
5.2.1.4 Operationalisation of Constructs 134
5.2.2 Data Analysis Strategy 135
5.2.2.1 Questionnaire Audit and Missing Data 136
vii
5.2.2.2 New Measure Development: The internal
communication satisfaction scale
137
5.2.2.2.1 Measure Development Stage 139
5.2.2.2.2 Measure Purification and Validation
Stage: An Overview
144
5.2.2.2.3 Assessment of Existing Measures 146
5.2.2.2.4 Testing Objectives and Hypotheses 147
5.2.3 Survey data collection and analysis summary 152
5.3 Reliability and Validity Considerations 152
5.3.1 Reliability Considerations 152
5.3.2 Validity Considerations 155
5.4 Summary 155
Chapter Six: Analysis and Results Part 1
6.0 Introduction 157
6.1 New Measure Development and Validation: Internal Communication
Satisfaction
158
6.1.1 Measure Purification 159
6.1.2 Measure Validation 168
6.1.2.1 High / Low Ranking Samples Assessment 169
6.1.2.1.1 Undimensionality Confirmation 169
6.1.2.1.2 Reliability and Validity Assessment 172
6.1.2.2 Pooled Samples Fit Assessment 182
6.1.2.2.1 Unidimensionality Confirmation 182
6.1.2.2.2 Convergent Validity Assessment 183
6.2.1 Validation of Existing Measures 191
6.2.1.1 Dependent Variable 1: Employees’ Brand
Identification (EI) Validation
191
6.2.1.1.1 Undimensionality Confirmation 191
6.2.1.1.2 Convergent Validity Assessment 192
6.2.1.2 Dependent Variable 2: Employees’ Brand
Commitment (EC) Validation
192
6.2.1.2.1 Undimensionality Confirmation 192
6.2.1.2.2 Convergent Validity Assessment 193
6.2.1.3 Dependent Variable 3: Employees’ Brand Loyalty
(EL) Validation
194

viii
6.2.1.3.1 Undimensionality Confirmation 194
6.2.1.3.2 Convergent Validity Assessment 194
6.2.1.4 Dependent Variable 4: Employees’ Brand
Performance (EP) Validation
195
6.2.1.4.1 Undimensionality Confirmation 195
6.2.1.4.2 Convergent Validity Assessment 196
6.3 Conclusion 197
Chapter Seven: Analysis and Results Part 2: Hypotheses Testing
7.0 Introduction 199
7.1 Hypotheses Testing (H1, 2, 3, 4, 5, 6, and 7) 202
7.2 Evaluation of goodness-of-fit indices 210
7.3 Testing Structural Relationship 213
7.4 Testing Hypothesis 1: The Influence of Communication Climate on
Employees’ Brand Outcomes
224
7.5 Testing Hypothesis 2: The Influence of Relationship to Superior on
Employees’ Brand Outcomes
228
7.6 Testing Hypothesis 3: The Influence of Organizational Integration on
Employees’ Brand Outcomes
231
7.7 Testing Hypothesis 4: The Influence of Media Quality on Employees’ Brand
Outcomes
233
7.8 Testing Hypothesis 5: The Influence of Horizontal Communication on
Employees’ Brand Outcomes
236
7.9 Testing Hypothesis 6: The Influence of Organizational Perspective on
Employees’ Brand Outcomes
237
7.10 Testing Hypothesis 7: The Influence of Personal Feedback on Employees’
Brand Outcomes
240
7.11 The development of a second-order model for internal communication
satisfaction (ICS) and for employees’ brand attitudes (EBA)
242
7.12 A Comparison of Results of the first-order model and the second-order
model of internal communication satisfaction
248
7.13 Assessing the second-order model for internal communication satisfaction
attributes
248
7.14 A Comparison of Results of the first-order model and the second-order
model of employees’ brand attitudes
253
7.15 Assessing the second-order model for internal communication satisfaction 254

ix
attributes
7.16 Model Estimation and Comparison for Internal Branding Concept 256
7.17 Model Specification 258
7.18 Results Comparison 261
7.19 Hypothesises Testing 262
7.20 Testing Hypothesis 8 265
7.21 Testing Hypothesis 9 and 10 265
7.22 Baseline Model 269
7.23 Testing Hypothesis 11 270
7.24 Conclusion 274
Chapter Eight: Conclusions and Implications
8.0 Introduction 276
8.1 The Downs-Hazen (CSQ) Constructs as the Domain of Internal
Communication in the Internal Branding Concept
276
8.1.1 Communication Climate 277
8.1.2 Relationship to Supervisors 278
8.1.3 Organizational Integration 280
8.1.4 Media Quality 280
8.1.5 Horizontal Communication 281
8.1.6 Organisational perspective 282
8.1.7 Personal Feedback 283
8.2 Influence of Internal Communication Satisfaction on the Employees’
Brand Attitudes and Employees’ Brand Performance
283
8.3 Employees Brand Attitudes as the Mechanism of Internal Branding
Process
285
8.4 Evaluating the Influence of Internal Communication Satisfaction on
Employees’ Behaviour in a Developing Economy
285
8.5 Theoretical Contribution 286
8.6 Managerial Implications 291
8.7 Limitations and Future Research Directions 301
A Appendix for Chapter 5 303
B Appendix for Chapter 6 330
Reference 377

xi
List of Tables
Tables Page
Table 1.1 Key definition in the study 11
Table 2-1 Studies showing the relation between internal communication
satisfaction and organizational outcomes
45
Table 2.2 Four existing internal communication instruments 51
Table 2.3 Comparative Instrument Assessment Schedule 55
Table 3-1 Studies showing the relation between communication climate and
employees’ outcomes
74
Table 3-2 Studies showing the relation between relationship to superiors and
employees’ outcomes
79
Table 3-3 Studies showing the relation between organizational integration and
employees’ outcomes
82
Table 3-4 Studies showing the relation between media quality and employees’
outcomes
85
Table 3-5 Studies showing the relation between horizontal communication and
employees’ outcomes
90
Table 3-6 Studies showing the relation between organizational perspective and
employees’ outcomes
94
Table 3-7 Studies showing the relation between personal feedback and
employees’ outcomes
97
Table 4-1 Studies of Internal Communication in various countries 109
Table 4-2 ASEAN Economic Community (AEC) offers greater opportunities 115
Table 5-1 Objectives and Hypotheses proposed to be measured in the study 122
Table 5-2 Contrasting implications of positivism and phenomenology 126
Table 5-3 Respondent’s Hotel 131
Table 5-4 Operational definitions of internal communication dimensions,
employees’ brand attitudes and employees’ brand behaviour.
135
Table 5-5 Key Data Analysis Steps 136
Table 5-6 New Measure Development and Validation Steps 137
Table 5-7 Expert Judgement Panel agreement percentage 142
Table 5-8 Existing Measures Validation Steps 146
Table 5-9 Summary: The Survey data collection and analysis process 152
Table 5-10 Methodology Chapter Summary 156

xii
Table 6-1 Hypotheses measured by the empirical studies 157
Table 6-2 Operational Definitions of Communication climate (CC); Relationship
to Supervisory (Relation); Organization integration (OI); Media quality
(MQ); Horizontal communication (HC); Organisational perspective
(OP); and Personal feedback (PF)
158
Table 6-3 CC Scales Measure Purification Statistics (High Ranking Sample, Low
Ranking Sample, and Pooled Sample)
161
Table 6-4 Relation Scales Measure Purification Statistics (High Ranking Sample,
Low Ranking Sample, and Pooled Sample)
162
Table 6-5 OI Scales Measure Purification Statistics (High Ranking Sample, Low
Ranking Sample, and Pooled Sample)
163
Table 6-6 MQ Scales Measure Purification Statistics (High Ranking Sample, Low
Ranking Sample, and Pooled Sample)
164
Table 6-7 HC Scales Measure Purification Statistics (High Ranking Sample, Low
Ranking Sample, and Pooled Sample)
165
Table 6-8 OP Scales Measure Purification Statistics (High Ranking Sample, Low
Ranking Sample, and Pooled Sample)
166
Table 6-9 PF Scales Measure Purification Statistics (High Ranking Sample, Low
Ranking Sample, and Pooled Sample)
167
Table 6-10 Summary of Selected Goodness-of-Fit Indices 169
Table 6-11 Initial Model for CC, Relation, OI, MQ, HC, OP, and PF Scales 170
Table 6-12 CC Scale Item Parameters (High and Low Ranking Samples) 175
Table 6-13 Relation Scale Item Parameters (High and Low Ranking Samples) 176
Table 6-14 OI Scale Item Parameters (High and Low Ranking Samples) 177
Table 6-15 MQ Scale Item Parameters (High and Low Ranking Samples) 178
Table 6-16 HC Scale Item Parameters (High and Low Ranking Samples) 179
Table 6-17 OP Scale Item Parameters (High and Low Ranking Samples) 180
Table 6-18 PF Scale Item Parameters (High and Low Ranking Samples) 181
Table 6-19 Initial Model for CC, and Relation Scales 182
Table 6-20 Initial Model for OI, and MQ Scales 182
Table 6-21 Initial Model for HC and OP Scales 183
Table 6-22 Initial Model for PF Scales 183
Table 6-23 CC Scale Item Parameters (Pooled Samples) 184
Table 6-24 Relation Scale Item Parameters (Pooled Samples) 185
Table 6-25 OI Scale Item Parameters (Pooled Samples) 186
Table 6-26 MQ Scale Item Parameters (Pooled Samples) 187

xiii
Table 6-27 HC Scale Item Parameters (Pooled Samples) 188
Table 6-28 OP Scale Item Parameters (Pooled Samples) 189
Table 6-29 PF Scale Item Parameters (Pooled Samples) 190
Table 6-30 Fit indices of Initial and Final EI Models 191
Table 6-31 EI Scale Item Parameters 192
Table 6-32 Fit indices of Initial and Final EI Models 193
Table 5-33 EC Scale Item Parameters 193
Table 6-34 Fit indices of Initial and Final EL Models 194
Table 6-35 EL Scale Item Parameters 195
Table 6-36 Fit indices of Initial and Final EP Models 196
Table 6-37 EP Scale Item Parameters 197
Table 7-1 Objectives and hypotheses measured by empirical studies 199
Table 7-2 Fit Indices of Communication Climate (CC), and Relationship to
Supervisors (Relation)
210
Table 7-3 Fit Indices of Organizational Integration (OI) and Media Quality (MQ) 211
Table 7-4 Fit Indices of Horizontal Communication (HC) and Organizational
Perspective (OP)
211
Table 7-5 Fit Indices of Personal Feedback (PF) 212
Table 7-5 AMOS Output Extract: Standardized Regression Estimates of the
Hypotheses Tested
221
Table 7.6 Internal Communication Satisfaction Attributes: Fit indices of the first-
order and the second-order model
248
Table 7.7 Employees’ Brand Attitudes Attributes: Fit indices of the first-order and
the second-order model
254
Table 7-8 Hypotheses measured by empirical studies 256
Table 7-9 Fit indices of alternative models – A and B 261
Table 7-10 Path Coefficients of the Models: Internal Communication Satisfaction
(ICS), Employees’ Brand Attitudes (EBA) and Employees’ Brand
Performance (EBP) of Internal Branding Concept
264
Table 7-11 Objective and hypothesis measured by empirical studies 268
Table 7-12 The Testing Procedure 268
Table 7-13 Fit indices of baseline model – High and Low Range Hotels 269
Table 7-14 Path Coefficients of the Models: Internal Communication Satisfaction
(ICS), Employees’ Brand Attitudes and Employees’ Brand
Performance (EBP) of Internal Branding Concept
273
xiv
List of Figures
Figures Page
Figure 2-1 The Three Essentials of Internal Branding Concept 17
Figure 2-2 The Model of Internal Communication and Internal Branding Outcomes 27
Figure 3.1 The Linkages between Internal communication with employee attitudes
and employee performance
69
Figure 5-1 Study Design Overview 128
Figure 6-1 Chapter Six organization structure 157
Figure 6-2 Measure Development Stages 159
Figure 7-1 Measurement Model - Communication Climate (CC) and its influence
on Employee Identification (EI), Employee Commitment (EC),
Employee Loyalty (EL) and Employees’ Brand Performance (EBP)
203
Figure 7-2 Measurement Model - Relationship to Supervisors (Relation) and its
influence on Employee Identification (EI), Employee Commitment (EC),
Employee Loyalty (EL) and Employees’ Brand Performance (EBP)
204
Figure 7-3 Measurement Model - Organizational Integration (OI) and its influence
on Employee Identification (EI), Employee Commitment (EC),
Employee Loyalty (EL) and Employees’ Brand Performance (EBP)
205
Figure 7-4 Measurement Model - Media Quality (MQ) and its influence on
Employee Identification (EI), Employee Commitment (EC), Employee
Loyalty (EL) and Employees’ Brand Performance (EBP)
206
Figure 7-5 Measurement Model - Horizontal Communication (HC) and its influence
on Employee Identification (EI), Employee Commitment (EC),
Employee Loyalty (EL) and Employees’ Brand Performance (EBP)
207
Figure 7-6 Measurement Model - Organizational Perspective (OP) and its influence
on Employee Identification (EI), Employee Commitment (EC),
Employee Loyalty (EL) and Employees’ Brand Performance (EBP)
208
Figure 7-7 Measurement Model - Personal Feedback (PF) and its influence on
Employee Identification (EI), Employee Commitment (EC), Employee
Loyalty (EL) and Employees’ Brand Performance (EBP)
209
Figure 7.8 Model of Relationships between Communication Climate (CC),
Employees' Brand Attitudes (e.g. Brand Identification, Brand
Commitment, and Brand Loyalty), and Employees’ Brand Performance
214
Figure 7.9 Model of Relationships between Relationship to Supervisors (Relation),
Employees' Brand Attitudes (e.g. Brand Identification, Brand
Commitment, and Brand Loyalty), and Employees’ Brand Performance
215

xv
Figure 7.10 Model of Relationships between Organizational Integration (OI),
Employees' Brand Attitudes (e.g. Brand Identification, Brand
Commitment, and Brand Loyalty), and Employees’ Brand
Performance
216
Figure 7.11 Model of Relationships between Media Quality (MQ), Employees'
Brand Attitudes (e.g. Brand Identification, Brand Commitment, and
Brand Loyalty), and Employees’ Brand Performance
217
Figure 7.12 Model of Relationships between Horizontal Communication (HC),
Employees' Brand Attitudes (e.g. Brand Identification, Brand
Commitment, and Brand Loyalty), and Employees’ Brand
Performance
218
Figure 7.13 Model of Relationships between Organizational Perspective (OP),
Employees' Brand Attitudes (e.g. Brand Identification, Brand
Commitment, and Brand Loyalty), and Employees’ Brand
Performance
219
Figure 7.14 Model of Relationships between Personal Feedback (PF), Employees'
Brand Attitudes (e.g. Brand Identification, Brand Commitment, and
Brand Loyalty), and Employees’ Brand Performance
220
Figure 7-15 First order model of internal communication satisfaction 244
Figure 7-16 First order model of Employees’ Brand Attitudes 245
Figure 7-17 Second order structure of internal communication satisfaction 246
Figure 7-18 Second order structure of Employees’ Brand Attitudes 247
Figure 7-19 Second-order Factor Model for Internal Communication Satisfaction
Attributes
249
Figure 7-20 Second-order Factor Model for Employees’ Brand Attitudes Attributes 255
Figure 7-21 Model of Relationship between Internal Communication Satisfaction
(ICS), Employees’ Brand Attitudes (EBA) (e.g. Brand Identification,
Brand Commitment, and Brand Loyalty), and Employees’ Brand
Performance (EP)
257
Figure 7-22 Alternative path models: Model A 259
Figure 7-23 Alternative path models: Model B 260
Figure 7-24 Relationships between Internal Communication Satisfaction (ICS),
Employees’ Brand Attitudes (EBA) and Employees’ Brand
Performance (EP)
263
Figure 7-25 Testing Steps in mediation Models 267

xvi
Figure 7-26 Measurement Model – Internal Communication and its impact on
Employees’ Brand Attitudes and Employees’ Brand Performance both
High Range and Low Range.
271

xvii
Acknowledgement
Firstly, I wish to thank my sponsor, Faculty of Management Science, Silpakorn University in
Thailand, for granting me the scholarship and providing me with this great opportunity to
complete my studies in the UK and so enabling me to fulfil my ambition.
My main appreciation and special thanks go to my supervisor, Professor Amanda Broderick,
for her unlimited support, expert advice and guidance. Without her willingness and
invaluable suggestions this PhD thesis could not have been completed. In addition, I would
also like to show my gratitude towards both Dr Peter Reeves and Dr Fiona Cheetham for
their useful advice and suggestions.
I would like to acknowledge my closest supporters, my parents, for their support in terms of
moral encouragement.
Finally, I would like to thank all the respondents who sacrificed their productive time to
provide opinions conducive to the study.

xviii
Abstract
Internal branding studies indicate that organizations are pointing to effective internal communication as an
influential factor in business success in ensuring the delivery of the brand promise by their employees,
particularly the customer-interface employees. Internal communication satisfaction makes employees feel that
they are identified with, committed and loyal to the brand, so they would behave in ways that support the brand
reality. The Communication Satisfaction Questionnaire (CSQ) is the most widely used business communication
satisfaction questionnaire. However, the constructs of internal communication satisfaction from the CSQ have not
been used in the internal branding concept in developing countries.
Therefore, this researcher’s aim was to conceptualise and evaluate the role of internal communication
satisfaction constructs from the CSQ constructs, which include seven constructs (Organizational Perspective,
Organizational Integration, Personal Feedback, Relationship to Supervisors, Horizontal Communication, Media
Quality and Communication climate) on employees’ brand outcomes in the hotel business in Thailand.
Furthermore, this study provides empirical evidence to support the link between the domain of internal
communication satisfaction and employees’ brand attitudes and brand behaviours. Within a positivist paradigm,
the study employed a survey to collect data from customer-facing employees in the hotel business in Thailand in
both high ranking and low ranking hotels. The data consists of 1,212 customer-facing employees from high
ranking hotels and the other 535 employees from low ranking hotels. The study then analyses the data using a
structural equation model.
There are three notable findings upon which conclusions can be drawn from this study. First, the seven CSQ’s
constructs as the domain of internal communication satisfaction in the internal branding concept can help
employees represent a brand to customers that come into contact with the brand. Second, this study confirms
previous studies that claim internal communication satisfaction is a tool of internal branding that shapes
employees' brand attitudes (e.g. identification, commitment, and loyalty) and employees’ brand behaviours.
Finally, the seven domains of internal communication satisfaction (created from the CSQ) in the internal branding
concept can be used in both hotels of high and low customer ranking in Thailand context and communicated to
staff to achieve higher employee brand performance.
The study contributes to marketing academic knowledge by: (1) identifying the seven CSQ’s constructs as the
domain of internal communication in the internal branding concept; (2) extending the concept of internal branding
to explain how internal communication influences employees’ brand performance, and (3) confirming the
functional importance of both organizational and management communication from the corporate communication
approach, which will help employees achieve the internal branding goals.
Managerially, the study provides a model for marketers to conceive and design the internal communication
whose attributes work together to create employees’ brand outcomes and competitive advantage in business. It
isolates the key role played, in developing effective measurement internal communication tools for the business,
by the desire to explore both employees high and low in the variable work performance.
The study consists of a series of philosophies and methods in quantitative research, and each tool for
quantitative studies necessitates a choice. The researcher is aware that the same research objectives could have
been met using a qualitative research methodology. The main limitations are now reviewed, and point the way
towards future research.
1
Chapter 1: INTRODUCTION
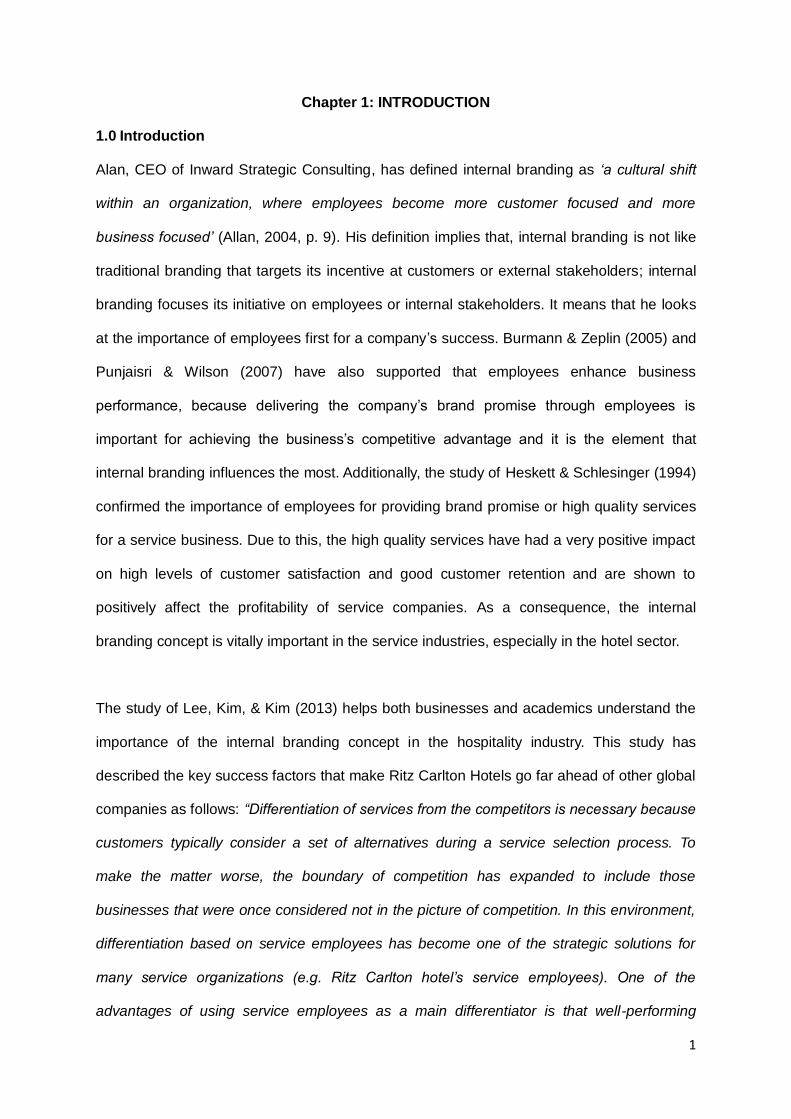
1.0 Introduction
Alan, CEO of Inward Strategic Consulting, has defined internal branding as ‘a cultural shift
within an organization, where employees become more customer focused and more
business focused’ (Allan, 2004, p. 9). His definition implies that, internal branding is not like
traditional branding that targets its incentive at customers or external stakeholders; internal
branding focuses its initiative on employees or internal stakeholders. It means that he looks
at the importance of employees first for a company’s success. Burmann & Zeplin (2005) and
Punjaisri & Wilson (2007) have also supported that employees enhance business
performance, because delivering the company’s brand promise through employees is
important for achieving the business’s competitive advantage and it is the element that
internal branding influences the most. Additionally, the study of Heskett & Schlesinger (1994)
confirmed the importance of employees for providing brand promise or high quality services
for a service business. Due to this, the high quality services have had a very positive impact
on high levels of customer satisfaction and good customer retention and are shown to
positively affect the profitability of service companies. As a consequence, the internal
branding concept is vitally important in the service industries, especially in the hotel sector.
The study of Lee, Kim, & Kim (2013) helps both businesses and academics understand the
importance of the internal branding concept in the hospitality industry. This study has
described the key success factors that make Ritz Carlton Hotels go far ahead of other global
companies as follows: “Differentiation of services from the competitors is necessary because
customers typically consider a set of alternatives during a service selection process. To
make the matter worse, the boundary of competition has expanded to include those
businesses that were once considered not in the picture of competition. In this environment,
differentiation based on service employees has become one of the strategic solutions for
many service organizations (e.g. Ritz Carlton hotel’s service employees). One of the
advantages of using service employees as a main differentiator is that well-performing

2
employees are difficult to be replicated by competitors at least in a short period of time” (Lee
et al., 2013, p. 1-2). The focus on internal branding of Ritz Carlton Hotels has influenced the
ways other hotels run their business. As the hotel business is a service–oriented entity it
would require a full-hearted commitment and efforts of employees play the most important
role for its success. The hotel guest satisfaction depends entirely on employees and the
functioning of hotel systems managed by them.
The concept of internal branding is grounded in the concept of communicating with
employees, namely internal communication, which is defined as communicating with people
inside an organization and it means to create and implement behaviour changes (Punjaisri &
Wilson, 2007). According to the concept of internal branding, internal communication
influences employees’ brand attitudes, which in turn leads to delivery of brand promise to
their customers (Asha & Jyothi, 2013; Blombäck & Brunninge, 2009; Punjaisri & Wilson,
2007; Lai & Hsu, 2015; Liu, Chapleo, Ko & Ngugi, 2015; Sharma & Kamalanabhan, 2012;
Tosti & Stotz, 2001). In short, for internal branding concept, internal communication is a
useful tool for communicating brand values and other brand-related messages to influence
employees’ behaviours.
As important as this is, the fact is that service industries need to understand the correlation
of the internal communication with employee attitudes and employee performance.
Understanding the internal communication constructs and processes underlying employees’
brand attitudes in the internal branding concept is of significant importance in predicting
employees’ desirable attitudes in improving the organizational service orientation, especially
the hotel business. However, little is known about the internal communication constructs
which influence or lead to employees’ brand outcomes in the concept of internal branding
(Sharma & Kamalanabhan, 2012).
3
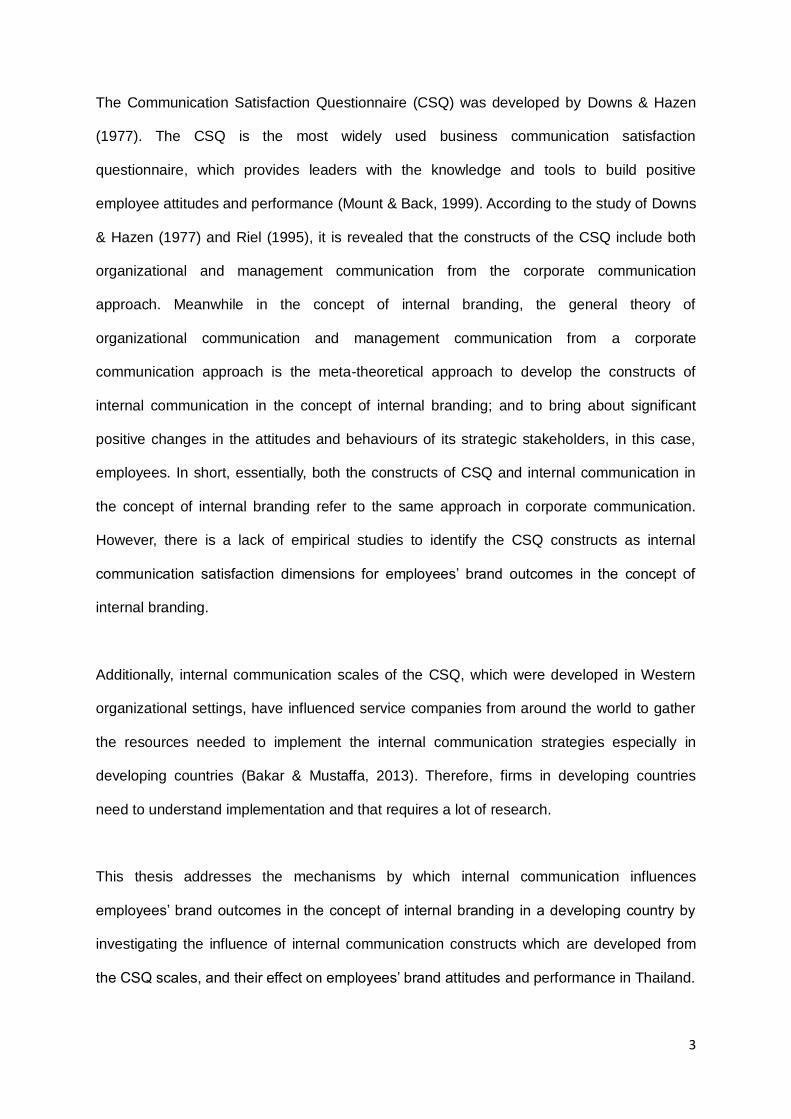
The Communication Satisfaction Questionnaire (CSQ) was developed by Downs & Hazen
(1977). The CSQ is the most widely used business communication satisfaction
questionnaire, which provides leaders with the knowledge and tools to build positive
employee attitudes and performance (Mount & Back, 1999). According to the study of Downs
& Hazen (1977) and Riel (1995), it is revealed that the constructs of the CSQ include both
organizational and management communication from the corporate communication
approach. Meanwhile in the concept of internal branding, the general theory of
organizational communication and management communication from a corporate
communication approach is the meta-theoretical approach to develop the constructs of
internal communication in the concept of internal branding; and to bring about significant
positive changes in the attitudes and behaviours of its strategic stakeholders, in this case,
employees. In short, essentially, both the constructs of CSQ and internal communication in
the concept of internal branding refer to the same approach in corporate communication.
However, there is a lack of empirical studies to identify the CSQ constructs as internal
communication satisfaction dimensions for employees’ brand outcomes in the concept of
internal branding.
Additionally, internal communication scales of the CSQ, which were developed in Western
organizational settings, have influenced service companies from around the world to gather
the resources needed to implement the internal communication strategies especially in
developing countries (Bakar & Mustaffa, 2013). Therefore, firms in developing countries
need to understand implementation and that requires a lot of research.
This thesis addresses the mechanisms by which internal communication influences
employees’ brand outcomes in the concept of internal branding in a developing country by
investigating the influence of internal communication constructs which are developed from
the CSQ scales, and their effect on employees’ brand attitudes and performance in Thailand.
4
Under this line of thought, this chapter aims to:
1. Develop the rationale for the research initiative;
2. Present the research aims and objectives.
1.1 Research initiative
The rationale for the research is articulated in the following three sections.
1.1.1 Influence of internal communication on employee brand performance
With the development of internal branding concept, the importance of internal
communication and its link to employees’ perception was emphasized (Du Preez, &
Bendixen, 2015; Punjaisri & Wilson, 2007). Internal communication influences employees’
brand attitudes, which in turn affects employees’ performance or employees’ brand promise
delivery. Researchers have shown the significance of relationships between effective internal
communication practice and many organizations' performance outcomes (Bakar & Mustaffa,
2013; Du Preez, & Bendixen, 2015; Mishra, Sharma, & Kamalanabhan, 2015; Wyatt, 2006).
Goris, Vaught, & Pettit (2000) and Gray & Laidlaw (2002), internal communication theorists,
also gave much thought to the relationship between effective internal communication and
positive employees’ performance. They considered internal communication as the most
important tools for improving employees’ performance and for positive organizational
outcomes. Accordingly, it is clear that internal communication is important for organizational
functioning and significant impacts on subsequent profit growth (Heskett & Schlesinger,
1994; Yee, Yeung, & Cheng, 2010), which on an individual level relates to employees’
performance or employees’ brand promise delivery. Therefore, successful internal branding
needs all stakeholders in a business to understand the domains of internal communication
as a tool for business success.
The study of Gray & Laidlaw (2002) views the domains of internal communication as the
significant factors, which are responsible for bringing about a change in positive employee
5
attitudes and performance. It means that the domains of internal communication help
businesses to create internal communication strategies for improving their communication
climate and organizational effectiveness. Therefore, Gray & Laidlaw (2002) suggest internal
communication researchers should focus on the relationship between internal
communication and other organization outcomes, identify aspects that could improve its
business performance and competitive advantage, and develop a well-constructed
instrument that is aligned to these business objectives.
However, theory and theoretical propositions of internal branding might not yet have
sufficient empirical support to conceptualise the domain of internal communication. For these
reasons, this thesis aims to examine and develop the measurements of internal
communication in the internal branding theory.
1.1.2 Importance of The Communication Satisfaction Questionnaire (CSQ) with
Internal Branding Theory
Previous research on internal branding confirms the role of internal communication on
employees’ brand attitudes and employees’ brand performance in internal branding theory
(Asif & Sargeant, 2000; Bambacas & Patrickson, 2008; Brunetto & Farr-Wharton, 2004;
Camilleri, 2008; Carriere & Bourque, 2009; Chong, 2007; Clutterbuck, 2005; Du Preez, &
Bendixen, 2015; Elving, 2005; Fawkes & Gregory, 2001; Gelb & Rangarajan 2014; Hargie &
Dickson, 2007; Hawabhay, Abratt, & Peters, 2009; Kapoor, 2010; Mazzei, 2010; Melewar &
Akel, 2005; Mestre, Stainer, Stainer, & Strom, 2000; Power & Rienstra, 1999; Punjaisri &
Wilson, 2007; Tukiainen, 2001; van Vuuren, de Jong, & Seydel, 2007; Welch & Jackson,
2007). It means that a relation between internal communication and employees’ brand
outcomes is established. Internal communication programs are associated with internal
communication satisfaction that further promotes a sense of positive brand attitudes and
performance among the employees.
6
Although the domains of internal communication developed by these researchers can be
used, many studies have shown that the underlying internal communication theory and
practice have not been fully developed in the academic field (Goodman & Koul, 2009;
Sharma & Kamalanabhan, 2012). According to the study of Sharma & Kamalanabhan (2012,
p. 301), it is stated that, ‘At a time when the effectiveness of internal branding in the context
of turnover or employee engagement is highly discussed, it would be relevant to examine
how ICC (internal corporate communication) dimensions can influence internal branding
outcomes from employee’s perspective’. It means that scholars need to understand the
effectiveness of internal communication in internal branding concept.
Downs & Hazen (1977) developed the communication Satisfaction Questionnaire (CSQ) to
explore the relationship between communication and job satisfaction with employees across
the United States. The CSQ resulted in eight stable dimensions of internal communication.
The study of Gray & Laidlaw (2002) comments that the CSQ developed by Downs & Hazen
(1977) is one of the most comprehensive instruments available. However, there is a lack of
empirical studies to identify the CSQ constructs as internal communication for employees’
brand outcomes in the concept of internal branding. The eight stable constructs of internal
communication identified by Downs & Hazen (1977) are as follows:
Horizontal communication. The extent to which informal communication is accurate
and free flowing, and includes perceptions of the grapevine.
Relationship to Subordinate. Upward and downward communication with
subordinates. Only workers in supervisory positions responded to these items, which
included subordinate responsiveness to downward communication and the extent to which
subordinates initiate upward communication.
Media quality. The extent to which meetings are well organized and written directives
are short and clear.
7
Organisational perspective. Information about the organisation as a whole, which
includes notifications about changes, overall policies, and goals of the organisation.
Organisational integration. The degree to which individuals receive information about
their immediate work environment.
Communication climate. The extent to which communication in an organisation
motivates and stimulates workers to meet organisational goals.
Personal feedback. Information concerning how workers are being judged and how
their performance is being appraised.
Relationship to Supervisor. The upward and downward aspects of communicating
with superiors.
The researcher believes that it is important to investigate which internal communication
constructs influence employees’ attitudes and performance. This thesis has used the CSQ
constructs to examine and develop the measurement of internal communication for internal
branding. There are three main reasons for using the CSQ constructs in this thesis.
First of all, from the internal branding literature review, internal communication dimensions in
the concept of internal branding will need to include both organizational communication
forms and management communication forms, in order to engender or improve employees’
brand attitudes and behaviours (Asif & Sargeant, 2000; Bambacas & Patrickson, 2008;
Brunetto & Farr-Wharton, 2004; Camilleri, 2008; Carriere & Bourque, 2009; Chong, 2007;
Clutterbuck, 2005; Du Preez, & Bendixen, 2015; Elving, 2005; Fawkes & Gregory, 2001;
Gelb & Rangarajan 2014; Hargie & Dickson, 2007; Hawabhay, Abratt, & Peters, 2009;
Kapoor, 2010; Mazzei, 2010; Melewar & Akel, 2005; Mestre, Stainer, Stainer, & Strom, 2000;
Power & Rienstra, 1999; Punjaisri & Wilson, 2007; Tukiainen, 2001; van Vuuren, de Jong, &
Seydel, 2007; Welch & Jackson, 2007). Organizational communication is forms of
communication that attempt to influence the behaviour of groups on which the organization
depends, and management communication is communication by managers with target

8
groups (Riel, 1995). The CSQ constructs should be viewed as the internal communication
dimensions in the concept of internal branding because they include both organizational and
management communication forms. However, little is known about the CSQ constructs
which influence or lead to employees’ brand outcomes in the concept of internal branding.
Second of all, after reviewing the internal communication literature, this thesis found that
there is a relationship between each construct of the CSQ with employees’ brand attitudes
and employees’ brand performance in internal branding concept.
Finally, the CSQ has not been applied in the internal branding concept in the Thai hotel
industry and this thesis will be the first to apply the CSQ to hotel employees in Thailand.
According to the report of the Thai National Statistical Office (2014), it was found that there
are 10,018 Thai hotels. Moreover, more than 80 percent of the hotels have difficulty creating
competitive advantage, and more than 70 percent of the hotels need the Thai government to
support them with potential to improve and grow. According to this report, doing research
and development in Thailand is still rare for most of the Thai hotel industry. Therefore, this
thesis aims to access the effect of each of the CSQ factors on employees’ brand attitudes
and employees’ brand performance of hotel employees in Thailand, and in applying the new
results to develop their business further.
1.1.3 Importance of the domains of Internal Communication in a developing country
context for Internal Branding Theory
The landmark development in the evolution of internal branding theory is internal
communication domains. In the past, knowledge about the domains of internal
communication was created in part through employees in a developed countries context,
and it was possible to derive some useful insights by this means. However, insight into
internal communication domains derived from employees in developed countries context has
its limitations, simply because perceptions of the internal communication of employees in
9
developing countries are not always reliable, partly due to the influence exerted by their
attitudes and values. In addition, the studies of Hofstede (2003) and Bakar & Mustaffa
(2013) suggest that management theories, which were borne out of developed country
contexts are not universal and these studies found that business environment contexts can
influence management practices, especially in the way that organizations communicate with
employees in a developing economy. However, this aspect has received little attention in the
internal communication literature (Bakar et al., 2007; Bakar & Mustaffa, 2013; Denison et al.,
2004; Varona, 1996). For example, the study of Bakar et al. (2007) found that the domains of
internal communication about supervisor-subordinate relationships in Malaysian
organizations differ extensively from US organizations. According to the study of Varona
(1996), it was shown that not all domains of internal communication in western
organizational contexts were applicable in Guatemalan organizations. Thus, the third
purpose of this thesis is to evaluate the domains of internal communication in a developing
economy, especially Thailand.
1.2 Research Objectives
The three main research objectives are:
1. To conceptualise the domain of internal communication by using the constructs of
Communication Satisfaction Questionnaire (CSQ) that are perceived as relevant and
effective by employees
2. To determine the nomological network of internal branding
3. To evaluate the influence of internal communication on employees’ behaviour from high/
low performance employees based on a developing country context using evidence from the
hotel sector in Thailand
1.3 Research Approach
This study is conducted with a positivist approach following a deductive methodology. After
the conceptualisation of internal communication through internal branding theory, a pilot

10
survey is employed. In total, the sample includes 1,747 participants in the Thai hotel
industry. The sample comprises customer-facing employees of hotels in Thailand.
In the data analysis process, survey data is transferred into the SPSS 20.0 for data
purification. The next step to prepare for the multivariate analysis is to examine the reliability
and validity of the measurement scales through confirmatory factor analysis (CFA), assisted
by AMOS 20.0. Finally, survey-related hypotheses are tested through structural equation
analysis.
1.4 Parameters of Research
The target population of the study was defined as all customer-facing employees who have
worked in hotels in Thailand. This is because the internal branding concepts focused on
customer-facing employees who have an impact on the perceived service quality, the
customers’ perceptions of brand image, and customer satisfaction (Parasuraman, Zeithaml,
& Berry, 1985; Punjaisri & Wilson, 2007). The hotel industry in Thailand was selected as a
unit for the single case study because this industry plays an important role in the Thai
Economy, and moreover, this industry needs to build a competitive advantage and develop
sustainable growth for all (Thai National Statistical Office, 2014).
1.5 Summary of Definitions
Definitions of internal communication satisfaction, three employees’ brand attitudes and
employees’ brand performance are shown in Table 1-1.

11
Table 1.1: Summary of Definitions in the study
Abbreviation
Construct/Variables Definition
Internal Branding Internal branding represents a firm’s internal communication efforts to promote within the firm, a clear view of what makes it different and desirable as an employer (Punjaisri, Evanschitzky, & Wilson, 2009)
Internal Communication
Communicating with people inside an organization and it means to create and implement behaviour changes (Punjaisri, 2008)
Internal Communication
Satisfaction
The satisfaction with the various aspects of communication practices prevailing in an organization (Downs & Hazen, 1977)
CC Communication climate
The extent to which communication in an organisation motivates and stimulates workers to meet organisational goals (Downs & Hazen, 1977)
Relation Relationship to superiors
The upward and downward aspects of communicating with superiors (Downs & Hazen, 1977)
OI Organisational integration
The degree to which individuals receive information about their immediate work environment (Downs & Hazen, 1977)
MQ Media quality The extent to which meetings are well organized and written directives are short and clear (Downs & Hazen, 1977)
HC Horizontal communication
The extent to which informal communication is accurate and free flowing, and includes perceptions of the grapevine (Downs & Hazen, 1977)
OP Organisational perspective
Information about the organisation as a whole, which includes notifications about changes, overall policies, and goals of the organisation (Downs & Hazen, 1977)
PF Personal feedback Information concerning how workers are being judged and how their performance is being appraised (Downs & Hazen, 1977)
EC Employees’ Brand Commitment
The extent of psychological attachment of employees to the brand, which influences their willingness to exert extra effort towards reaching the brand goals (Punjaisri et al., 2009)
EI Employees’ Brand Identification
An employee’s sense of belonging to the organization and a perception of being aligned to the organization’s brand values and promises (Punjaisri et al., 2009)
EL Employees’ Brand Loyalty
An employee’s willingness to remain with the current organization (Punjaisri et al., 2009)
EB Employees’ Brand Behaviour
Employee behaviours in delivering the brand promise (Punjaisri, 2008)

12
1.6 Thesis Structure
This current study is constructed with 8 chapters, a synopsis of which is as follows:
In summary, Chapter 1 has set the research objectives, highlighting their relevance,
importance, and place in the literature.
Chapter 2 aims to conceptualise internal branding and the roles of internal communication in
the internal branding concept.
Chapter 3 focuses on the importance of the CSQ and the relationships between each CSQ
construct and employees’ brand outcomes in the internal branding concept.
Chapter 4 also highlights the importance of studying internal communication in the internal
branding concept in the hotel industry in Thailand and the need to evaluate the moderating
of internal communication differences between high ranking and low ranking hotels in
Thailand.
Chapter 5 outlines the research design and methods utilised to address objectives and
hypotheses.
Chapter 6 presents evidence of internal communication satisfaction constructs evolved from
the exploratory study, reports the results of measures’ development and validated measures,
and discusses the obtained results. Additionally, this chapter reports validation of the existing
measure included in this current study (Employees’ brand identification, commitment, loyalty
and performance).
13
Chapter 7 presents the results, interpretation and discussion of testing the hypotheses
concerned with the effects of internal communication satisfaction on employees’ brand
outcomes.
Chapter 8 reports the contribution of this thesis to the existing knowledge as well as the
managerial implications. The chapter closes with suggestions for future research.

14
CHAPTER 2: Conceptualising Internal Branding: The Influence of Internal
Communication on Employee Brand Behaviour
2.0 Introduction
This research study focuses on conceptualising the domain of internal communication on
employee brand behaviour in delivering the brand promise to customers within the concept
of internal branding by developing from the Downs-Hazen Communication Satisfaction
Questionnaire (CSQ).
This current study’s research objectives are:
1. To conceptualise the domain of internal communication satisfaction within the
concept of internal branding
2. To determine the nomological network of internal branding
3. To evaluate the influence of internal communication on employees’ behaviour from
high/ low performance employees based on a developing country context using evidence
from the hotel sector in Thailand
To address research objective 1 (objective 2 and 3 of this research are presented in the
chapter 3 and 4), this chapter is structured to address the following research questions:
1.) What is internal communication in the concept of internal branding?
2.) How can internal communication be conceptualised in an internal branding
context?
This chapter is divided into four main sections. The concept of internal communication has
been researched in internal branding concepts, which have been investigated in Part One
(Section 2.1-2.4). Part Two (Section 2.5-2.7) investigates the research studies that have
linked internal communication dimensions and organizational outcomes.
15
Part 1 (Section 2.1-2.4)
2.1 Internal Branding
Many scholars have accepted the importance of internal branding to support the
achievement of business objectives (Asha & Jyothi, 2013; De Chernatony & Cottam, 2006;
Du Preez et al., 2015; Gelb & Rangarajan, 2014; Punjaisri & Wilson, 2007; Tavassoli, et al.,
2014; Vallaster & De Chernatony, 2005). Scholars are interested in the impact of internal
branding on building a strong corporate brand in order to gain competitive advantage. The
current interest is in internal branding and corporate branding, referred to earlier in the
importance of the behaviour of employees who make a positive overall contribution to the
company because they create customer satisfaction and perceptions about the corporate
brand. So, employees are one key factor in supporting the brand promise, and attaining and
maintaining the desired identity. For these reasons, internal branding has become
increasingly more important to both marketing academics and practitioners (Punjaisri &
Wilson, 2007).
2.1.1 What is Internal Branding?
Mahnert & Torres (2007, p.54) observe that, “much of the literature on internal branding to
date has been disparate and lacking in focus and definition”. Some of the definitions of
internal branding are given below.
MacLaverty, McQuillan, & Oddie (2007, p. 3), for example, defined internal branding as “the
set of strategies and processes that align and empower employees to deliver the appropriate
customer experience in a consistent fashion”. Stershic (2006, p.1) defined it as, “the process
of aligning day-to-day activities, business processes, job designs, and recognition and
rewards with the brand identity to drive business results. It is part of a focused brand
strategy that helps employees understand and integrate brand value(s) in their respective
roles to ensure they can effectively deliver on the brand promise”. Bergstrom, Blumenthal,
and Crothers (2002, p. 135) argued that, “Internal branding (IB) refers to three things:

16
communicating the brand effectively to the employees; convincing them of its relevance and
worth; and successfully linking every job in the organization to delivery of the brand
essence”. Punjaisri & Wilson (2007, p. 59-60) state that, “Internal branding is considered as
a means to create powerful corporate brands. It assists the organization in aligning its
internal process and corporate culture with those of the brand”. Asha & Jyothi (2013, p. 37)
state that, “The key role of internal branding in organizations is to ensure that employees
transform espoused brand messages into brand reality for customers and other stakeholders
in the external market”.
In light of the definitions presented above, scholars would support the view that employees’
behaviour is influenced by internal branding. It means that internal branding can be
described as the transfer of brand promise into brand reality for customers. According to the
study of Mahnert & Torres (2007), it was found that internal branding is a key ingredient in
corporate branding, and could be defined as the relative strength of the external brand with
and involvement in the company. In summary, it is noted that internal branding helps
employees to understand their corporate brand in “the big picture” and performs an
important function in helping employees adopt “the big picture” in which they live (Bergstrom
et al., 2002; MacLaverty et al., 2007).
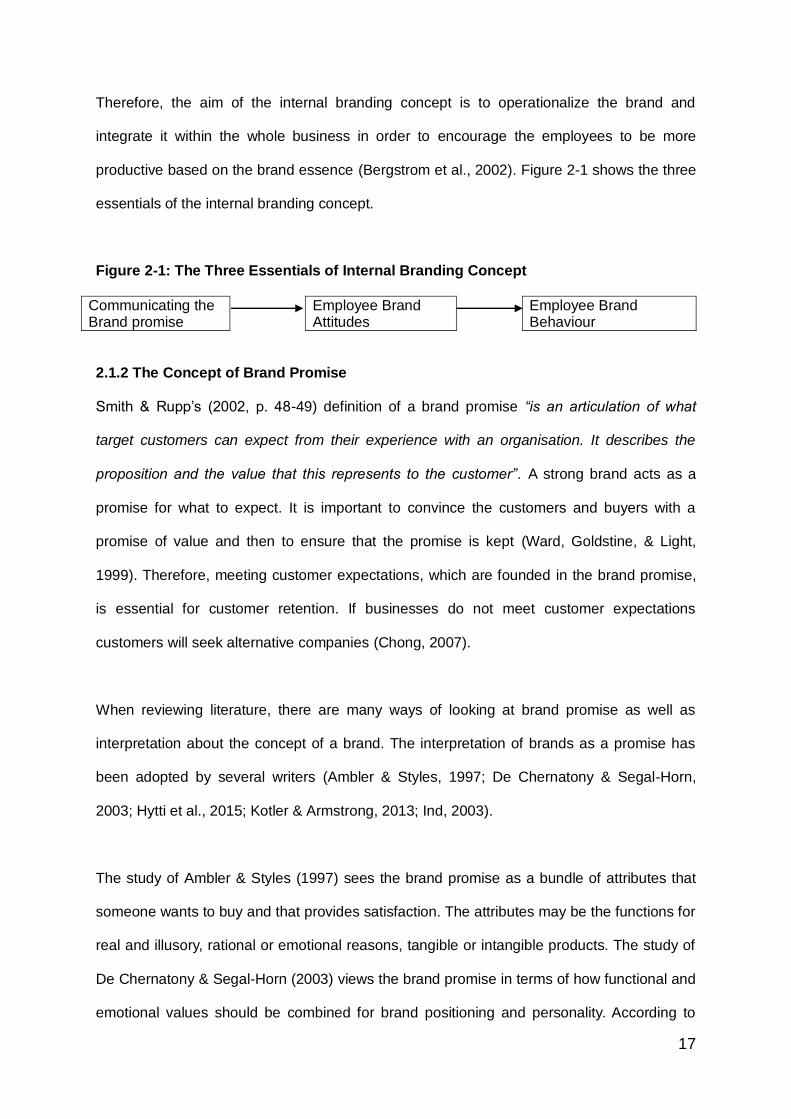
A review of these definitions reveals three essentials of the internal branding concept:
1.) Communicating the brand promise and its essence effectively to the
employees
2.) Convincing employees about the brand and its meaning: Employee Brand
Attitudes
3.) Implementing the brand into employees' daily work activities: Employee
Brand Behaviour
17
Therefore, the aim of the internal branding concept is to operationalize the brand and
integrate it within the whole business in order to encourage the employees to be more
productive based on the brand essence (Bergstrom et al., 2002). Figure 2-1 shows the three
essentials of the internal branding concept.
Figure 2-1: The Three Essentials of Internal Branding Concept
Communicating the Brand promise
Employee Brand Attitudes
Employee Brand Behaviour
2.1.2 The Concept of Brand Promise
Smith & Rupp’s (2002, p. 48-49) definition of a brand promise “is an articulation of what
target customers can expect from their experience with an organisation. It describes the
proposition and the value that this represents to the customer”. A strong brand acts as a
promise for what to expect. It is important to convince the customers and buyers with a
promise of value and then to ensure that the promise is kept (Ward, Goldstine, & Light,
1999). Therefore, meeting customer expectations, which are founded in the brand promise,
is essential for customer retention. If businesses do not meet customer expectations
customers will seek alternative companies (Chong, 2007).
When reviewing literature, there are many ways of looking at brand promise as well as
interpretation about the concept of a brand. The interpretation of brands as a promise has
been adopted by several writers (Ambler & Styles, 1997; De Chernatony & Segal-Horn,
2003; Hytti et al., 2015; Kotler & Armstrong, 2013; Ind, 2003).
The study of Ambler & Styles (1997) sees the brand promise as a bundle of attributes that
someone wants to buy and that provides satisfaction. The attributes may be the functions for
real and illusory, rational or emotional reasons, tangible or intangible products. The study of
De Chernatony & Segal-Horn (2003) views the brand promise in terms of how functional and
emotional values should be combined for brand positioning and personality. According to

18
Chong (2007), the concept of brand promise is a set of company core values, which are the
fundamental beliefs of a person or organization. According to Kotler & Armstrong (2013), the
concept of brand promise is a term used to describe the mission for a brand and a mission of
what the brand must be and do. Kotler & Armstrong (2013) proposed that a brand promise is
a major source of competitive advantage. A brand promise is the company’s promise to
deliver a specific set of features, benefits, services and experiences consistently to the
consumers. These values can answer the questions of: who the company is and what it
stands for. Ind (2003) views brand promise as an ideological aspect that transforms
companies into value-based organizations. The ideology states a purpose and an
organizational direction. It works as a philosophy for the employees to engage with. The
ideology will provide a framework for how to communicate and behave internally and
externally within the company.
Olins (2000) suggested that companies should make sure that the brand promise is always
fulfilled and that the quality and service assurances are as per the level their consumers
expect. Additionally, O'Loughlin, Szmigin, & Turnbull (2004) mention that the company brand
promise should be articulated in every company communication so that a brand becomes
credible and a focal point of trust and assurance is established.
There are many business benefits to the company of providing a brand promise. First of all,
providing the brand promise can reduce the consumer’s perceived risk in terms of their
understanding of uncertainty and adverse consequences of buying a product or service.
Second of all, benefits accrue to a service organisation where the service performance itself
is basically intangible; therefore, a brand promise helps the consumers to evaluate the
branded service being offered (values, benefits and quality) quickly. Finally, the brand
promise helps consumers to capture what is being offered and what is not. It leads to a
reduction of the buyer’s search costs (Punjaisri, 2008; Kotler & Armstrong, 2013).

19
2.1.3 Brand Promise Delivery
Marketers must consistently deliver on their brand promise and also improve customer
spending through external marketing. To make the company differentiate themselves from its
competitors it is crucial to give a delivery on that promise (Kotler & Armstrong, 2013; Ward et
al., 1999). Additionally, the studies of Asha & Jyothi, (2013) and Kimpakorn & Tocquer (2010)
suggest that the company should try to find a balance between the internal and external
perspectives because employees do not just represent the company’s brand; to customers
they become the brand.
The brand promise addresses customers’ expectations about a product or service.
Therefore, it is challenging to meet and realize the expectations driven by the advertising.
There is brand promise failure if the brand promise made in the external marketing
communication is not being realized internally (Asha & Jyothi, 2013; Burmann & Zeplin,
2005; Khan, 2009; Punjaisri & Wilson, 2007). Therefore, if the companies do not deliver their
brand promise with help from their employees, all their external advertising is wasted (Khan,
2009).
A good of balance between the external marketing and internal marketing can create a
strong corporate brand in the service sector, because customer perspectives are the sole
judge of corporate branding. Customers access service by comparing the service they
perceive brand promise though the internal marketing (e.g. knowledge and skills from
employees) with the service they desire though the external marketing (e.g. advertising). A
company can achieve a strong corporate brand only when it consistently meets customer
service expectation. This is because customers collect all interactions they perceive from the
company and create a brand image (De Chernatony & Segal-Horn, 2003); a consistent
delivery of the brand promise is essential to promote a consistent brand image (Asha &
Jyothi, 2013; Henkel, Tomczak, Heitmann, & Herrmann, 2007; Punjaisri, Evanschitzky, &
Wilson, 2009).
20
2.2 The Customer-facing Employee: A Valuable Asset
Employees are the key within the service organization when it comes to providing the
promise of the brand to customers. Therefore, the service organization has developed
processes that enable employees to deliver the brand promise effectively and consistently
(Abimbola, Lim, Foster, Punjaisri, & Cheng, 2010; Du Preez & Bendixen, 2015; King &
Grace, 2012).
Employee-customer interface are the people who create the value for the service
organizations by using their words and actions. Internal branding concept views the
employee-customer interface as the service providers who enthusiastically deliver what the
brand promises because they create good/ bad memorable experiences of the brand
promise in the eyes of major customers through their knowledge and skills. Therefore, there
is the relationship between customer-facing employees’ positive and negative behaviours
and customers' perception of the brand, i.e. brand image (Chong, 2007; De Chernatony &
Cottam, 2006; Du Preez & Bendixen, 2015; Henkel et al., 2007; Joseph, 1996; King &
Grace, 2012; Tavassoli et al., 2014). Similarly, the study of Stewart (2004) noted that the
skills and talents of a company’s workforce constituted an intangible asset, which service
organizations can use as a competitive advantage. They have a crucial impact on the
service brand building process (Burmann & Zeplin, 2005; Du Preez & Bendixen, 2015; Khan,
2009; Papasolomou & Vrontis, 2006; Punjaisri & Wilson, 2007; Tavassoli et al., 2014).
The above discussion clearly evidences that the employee-customer interface is the key to
delivering brand promise in the concept of internal branding. The employee-customer
interface is capable of delivering the brand promise and their responsibility is to turn the
company’s brand promise into brand reality, to determine it by their ability to meet customers'
expectations and to deliver customer service excellence (Berry, 2000; Punjaisri & Wilson,
2007, 2011). Therefore, employees’ attitudes and behaviour have a crucial impact in their

21
contact with the customer (Asha & Jyothi, 2013; Henkel et al., 2007; King & Grace, 2012;
Kimpakorn & Tocquer, 2010; Punjaisri & Wilson, 2007). Now, the question is how well the
customer-facing employees perform and mange to fulfil and deliver the company brand
promise.
2.3 Internal Communication: Definition, Theory and Implication
According to the study of Bergstrom et al. (2002), the communication of the brand promise is
the first element of the concept of internal branding, namely internal communication. There
are so many meanings and definitions of internal communication since research on it is
cross-disciplinary. Internal communication can be termed in internal media, cross-
departmental communication, management communication (Greenbaum, Clampitt, &
Willihnganz, 1988 Neves & Eisenberger, 2012), corporate or business communication
(Kitchen, 1997; Valackiene, 2015), organizational communication, internal marketing,
employee relations (Berthon et al., 2005; Chen et al., 2015; Quirke, 2000), integrated
internal communication (Kalla, 2005) or strategic communication (Argenti, 2007; Henderson
et al., 2015). In the present day, internal communication covers all aspects of communication
within an organization (Horomia, 2007).
The definition of internal communication by Welch and Jackson (2007, p. 186) states that it
is, “a process between an organization’s strategic managers and its internal stakeholders,
designed to promote commitment to the organization, a sense of belonging to it, awareness
of its changing environment and understanding of its evolving aims”. In the internal branding
concept, internal communication is considered to be communicating with people inside an
organization and it means to create and implement behaviour changes (Gelb & Rangarajan,
2014; Punjaisri, 2008; Sharma & Kamalanabhan, 2012; Smidts, Pruyn, & Van Riel, 2001).
Therefore, internal communication is a process of communicating brand values and other
brand-related messages that have an influence on employees’ behaviours.

22
According to the internal communication literature, this study found that there are two
theories as to how internal communication in the concept of internal branding could have
been created: Meta-theoretical Approach and Organizational Behaviour Theory. In the next
section, Meta-theoretical Approach and Organizational Behaviour Theory will be examined.
2.3.1 Meta-theoretical Approach
The organizational communication and management communication from a corporate
communication approach is the meta-theoretical approach to the internal communication in
the concept of internal branding.
The definition of corporate communication by Riel (1995, p. xi) defines it as, ‘a framework in
which all communication specialists (marketing, organizational and management
communication) integrate the totality of the organizational message, thereby helping to
define the corporate image as a means to improving corporate performance’. According to
Riel (1995), ‘marketing communication’ covers all aspects of the promotion mix that support
sales of particular goods or services. It includes advertising, sales promotions, direct mail,
sponsorship, personal selling and other elements in the marketing communication strategies.
It means that the objective of any form of marketing communication is to provide information
to external target audiences or a company’s customers and decide to purchase products or
services. The organizational communication studied by Riel (1995) sees organizational
communication as forms of communication that attempt to influence the behaviour of groups
on which the organization depends. Using organizational communication (such as public
relations, public affairs, environmental communication, investor relations, and labour market
communication) in the context of corporate communication is considered an important
development in emotionally influencing internal stakeholders (Riel, 1995). Thus,
organizational communication is the process of communicating directly with internal
audiences and building positive behaviours that promote the positive corporate image. The
most important form of corporate communication is management communication; it is

23
communication between management (who is authorized to exert influence on internal and
external stakeholders) and internal stakeholders that is fundamental to build a strong
corporate image (Riel, 1995). An important consideration for the use of management
communication as a theory is belief in the source of good communication in the workplace
(McKenna, 2012; Riel, 1995). Three approaches have been put forward as ways of creating
effective corporate communication to build a strong corporate image.
A development of corporate communication to define corporate image as a means to
improving corporate performance by Riel (1995) is principles of corporate communication.
The author focuses on what they call the three communication specialists, which include
marketing, organizational and management communication. The three communication
specialists are given both internal communication and external communication functions and
then combined into a single message that initiates overall organizational excellence and
effectiveness, so the company can ensure both customer and employee communication
satisfaction and thereby define the corporate image as a means to improving corporate
performance. In short, organizational, management and marketing communication forms of
corporate communication are significant factors associated with the overall corporate image.
The corporate communication approach and the concept of internal branding have similar
aims or outcomes, which are the balance between external marketing and internal
marketing. The external marketing attempts to communicate a company’s brand promise to
its customers, which influences customers’ perceptions about a product or service
(Kimpakorn & Tocquer, 2010; To et al., 2015). For external marketing to be successful, the
company’s employees need to perform and manage to fulfil and deliver the company’s brand
promise (Burmann & Zeplin, 2005; Khan, 2009; To et al., 2015). Without employee support,
all their marketing communication is wasted (Khan, 2009; To et al., 2015). For this reason,
the company needs to implement the concept of internal branding through effective internal
communication (both organizational and management communication) as a process by
24
communicating brand values and other brand-related messages that have an influence on
employees’ behaviours. Therefore, to achieve the balance between external marketing and
internal marketing, both marketing communication with its customers and internal
communication with its employees must be integrated to deliver a consistent message,
which is associated with the overall corporate brand. Both marketing communication and
internal communication are parts of a corporate communication approach (Riel, 1995), and
therefore it is not a surprise that there is a link between the corporate communication
approach and the concept of internal branding.
Major aims of the meta-theoretical approach (organizational communication and
management communication) relevant to this study are that both organizational and
management communication from the corporate communication approach have an important
role to play in developing the internal communication dimensions in the concept of internal
branding. Here, a number of research studies in the internal branding literature will be
considered with both organizational communication and management communication as a
vehicle for changing employees’ attitudes and behaviours (Du Preez et al.; 2015; Gelb &
Rangarajan, 2014; Punjaisri & Wilson, 2007; Sharma & Kamalanabhan, 2012).
From the point of view of this current study, both organizational communication and
management communication of a corporate communication approach are seen to be
involved in the domains of internal communication satisfaction in the concept of internal
branding, to increase the positive employee attitudes and behaviours, and to assist the
organization in improving corporate performance. However, these did not existed in the
internal branding research in Thailand prior to this study. This study will use both
organizational and management communication from a corporate communication approach
to develop the domain of internal communication in the concept of internal branding.
25
2.3.2 Organizational Behaviour Theory
This current study aims to explore the relationship between internal communication
satisfaction and employees’ brand outcomes in the concept of internal branding. Therefore, a
subject that refers to the study of human behaviour in organizations falls within the
boundaries of organizational behaviour. According to the study of McKenna (2012, p. 6),
organizational behaviour is defined as “a field of study that endeavours to understand,
explain, predict, and change human behaviour as it occurs in the organizational context”. It
means that this theory focuses on the individual, and organizational behaviour is related with
the association between the employee and the group, and how both interact with the
organization. The major goal of this theory is to explore associations between variables (e.g.
internal communication and employee performance). At the heart of variables in
organizational behaviour theory lies communication (Huczynski & Buchanan, 2013;
McKenna, 2012; Robbins & Judge, 2014).
In the organizational behaviour theory, there is the relationship between employees’
perceptions of communication in the organization and employee attitudes and behaviours.
The communication status during organizational behaviour refers to the methods of
communicating, such as oral and written communication, nonverbal communication,
information and communication technology, and communication networks. Furthermore, the
communication in this theory suggests that both the improving communication (such as
storytelling aided by social networks) and the communication skills (active listening and the
provision of feedback) have a positive impact on employee attitudes and behaviours
(Huczynski & Buchanan, 2013; McKenna, 2012; Robbins & Judge, 2014).
The relevance of communication in organizational behaviour theory to this current study is
the benefits of source domain for the conceptualization of internal communication in the
concept of internal branding. In order for the company to achieve its internal branding goals
and be successful in delivering on the customer brand promise through its employees’
26
behaviour, it needs effective internal communication. An effective internal communication
accompanied by formal and informal communication, channels of communication, feedback
and communication skills will embolden staff members to take accountability and deliver on
that brand promise at every point of customer contact. According to the theory, effective
internal communication will affect employees’ satisfaction with the organization’s
communication. In turn, this will develop employees’ positive attitudes and behaviours
towards it, leading to the building of competitive advantage and increased profits and goal
achievement.
2.4 Internal Communication Satisfaction
Hecht (1978) placed emphasis on the internal communication approach, with the spotlight on
the interaction between internal communication behaviour and internal communication
satisfaction. The internal communication satisfaction here is important in the context of
interpersonal perception. Also, it is critical for the effective organizational development
strategies (Hecht, 1978; Huczynski & Buchanan, 2013; McKenna, 2012; Robbins & Judge,
2014).
Internal communication satisfaction is associated with how well our personal expectations
about communication at work are in line with work performance (Hamilton, 1987). According
to internal communication literature, the study of Carriere and Bourque (2009, p. 31) has
defined internal communication satisfaction as “an employee’s affective appraisal of the
organization’s communication practices”. Bakanauskienė et al. (2015) also refer to the
“internal communication satisfaction”, which is the personal satisfaction experienced by an
individual when communicating successfully.
When internal communication is discussed in the concept of internal branding, many
scholars in internal branding literature often make reference to internal communication
satisfaction and employees’ brand outcomes. Internal communication satisfaction is defined

27
as the extent to which a person is gratified or fulfilled by internal communication received
(Bakanauskienė et al., 2015; Punjaisri & Wilson, 2007; Sharma & Kamalanabhan, 2012).
Another way to look at it is that internal communication practice is associated with internal
communication satisfaction, which in turn leads to employees’ brand outcomes. The study of
Sharma & Kamalanabhan (2012) showed the studies that have linked specific internal
communication satisfaction constructs to internal communication outcomes as shown in
Figure 2-2.
Figure 2-2: The Model of Internal Communication and Internal Branding Outcomes
Internal Communication Practice
Internal Communication Satisfaction
Internal Branding Outcomes
Source: Adapted from Sharma & Kamalanabhan (2012, p. 308)
Past studies confirmed internal communication satisfaction as a mediating variable between
internal communication practice and employees’ attitudes and behaviours (Du Preez et al.,
2015; Gelb & Rangarajan, 2014; King & Grace, 2010; Power & Rienstra, 1999; Punjaisri &
Wilson, 2007). There is empirical evidence to show the link between internal communication
satisfaction and employees’ attitudes is strong (Davies et al., 2010). Sharma &
Kamalanabhan (2012) studied the petroleum public sector and found that internal
communication satisfaction promoted a sense of employees’ brand loyalty, identification and
commitment. According to Davies et al. (2010), reflecting on the relationship between
internal communication satisfaction and employees’ attitudes, there are two possible
outcomes: employee positive attitudes and customers’ satisfaction toward the brand. It
means that the effective internal communication is help an employee offer good quality
customer service that meets the expectation of customers. If a customer has expectations
that are fulfilled, he or she is likely to have found very high levels of customer satisfaction.
28
With regard to the relationship between internal communication satisfaction and employees’
brand behaviour, Asha & Jyothi (2013) conclude that employees who are satisfied with
internal communication are more likely to do their best for an organization as brand
ambassadors than those who are dissatisfied. Gelb & Rangarajan (2014) found that internal
communication is significant, as it requires telling employees convincingly and frequently that
they are the brand ambassador. According to Gelb & Rangarajan (2014), creating a brand
ambassador from employees by using internal communication satisfaction can help a
business achieve customer service excellence and strong profit levels. According to King &
Grace (2012), there is said to be a positive relationship between internal communication
satisfaction and employees’ brand outcomes. That is, when internal communication
satisfaction is high, both employees’ brand commitment and employees’ brand behaviours
tend to be high (King & Grace, 2012). An alternative view of the relationship between internal
communication satisfaction and employees’ brand behaviour is put forward by Du Preez &
Bendixen (2015). They found that internal communication influence employees’ brand
behaviour by increasing job satisfaction and motivate employees to deliver what their
business promises to their customers. There were other employee outcomes such as the
feeling of organizational commitment and identification among the employees (Smidts et al.,
2001; Trombetta & Rogers, 1988); employees’ satisfaction (Taylor, 1997); positive workplace
relationship (Hunt, Tourish, & Hargie, 2000); job satisfaction (Moorehead & Griffin, 2010);
deterioration in productivity of employees (Clampitt & Downs, 1993); job performance
(Pincus, 1986) and high service quality (Snipes, Oswald, LaTour, & Armenakis, 2005).
Therefore, internal communication satisfaction in these studies is related independently to
positive organizational outcomes in support of the perspective of the concept of internal
branding.
Before examining the outcomes of internal communication satisfaction in the concept of
internal branding in the next section, this current study ought to say something about the

29
opposite of internal communication satisfaction, which is internal communication
dissatisfaction. Employees can feel dissatisfied with some aspect of the internal
communication. The behavioural manifestations of internal communication dissatisfaction
could include the following: reduced employee commitment, resigning from the organization
and going elsewhere, being reluctant to accept guidance or instructions from supervisors
and managers, and poor overall job performance (McKenna, 2012).
This current study also aims to adopt an internal communication approach to measure
internal communication satisfaction that is designed to provide feedback on employee
satisfaction, which can expect certain outcomes or consequences in the concept of internal
branding.
2.5 An Outcome of Internal Communication Satisfaction
According to the Organisational Behaviour Theories, employee perception is an important
part of the internal communication process, and at work there are different types of
communication. The concept of internal communication satisfaction provides a positive work
environment that influences the moods and attitudes of employees (Huczynski & Buchanan,
2013; McKenna, 2012; Robbins & Judge, 2014). Therefore, the importance of internal
communication satisfaction and its links to employee perception are emphasized. There
were two main reasons as to why companies should be concerned with internal
communication. First of all, there is a regulation that requires employers to communicate
with their employees about the organizational context, and requires them to take on their
duties and responsibilities (Hall, 2005; McKenna, 2012). Finally, effective internal
communication is considered to be a key business tool, which can improve employee
engagement and practices to increase corporate performance (MacLeod & Clarke, 2011).
According to internal branding literature, Ind (2003) proposes that internal communication
satisfaction leads to employees understanding and believing in the values of a company and
30
as a result, a corporate brand can successfully be developed. In this context, internal
communication is used to assure that internal stakeholders are involved in corporate culture
and strategy (Backhaus & Tikoo, 2004; Foreman & Argenti, 2005). Additionally, the empirical
research of Punjaisri et al. (2009) shows that effective internal communication can
encourage employees’ brand commitment, identification, loyalty and performance. According
to the study of McKenna (2012) and Morhart et al. (2009), the internal communication can
transmit brand-related information up, down, and sideways within a company, and on a one-
way or two-way basis. Therefore, it is beneficial to develop an understanding of brand-
related information in order to assist employees to facilitate the internalization of brand
values by employees (Morhart et al., 2009), and to align their behaviour with these brand
values when delivering the brand promise (Vallaster & de Chernatony, 2005). In summary,
according to Davies et al., 2010; Huczynski & Buchanan, 2013; McKenna, 2012; and
Robbins & Judge, 2014; there is evidence to indicate that the internal communication could
attempt to positively impact employees’ attitudes and behaviours and consequently
customers’ satisfaction toward the corporate brand.
As the internal communication function matures within the concept of internal branding
(Asha & Jyothi, 2013; Backhaus & Tikoo, 2004; Foreman & Argenti, 2005; Ind, 2003;
Punjaisri et al., 2009; King & Grace, 2012; Sharma & Kamalanabhan, 2012), internal
branding amounts to a combination of employees’ brand identification, commitment and
loyalty within the set of organizational values and goals through effective internal
communication, which, in turn, impacts employee behaviour to deliver on the brand promise.
Recent research in internal branding literature has investigated the association between
internal communication satisfaction and employees’ brand commitment. Burmann & Zeplin
(2005) found that internal communication satisfaction helps employees conform and identify
themselves with the brand and the company before their values become aligned with the
brand. Some empirical evidence shows that the link between internal communication

31
satisfaction and employees’ commitment and performance (Thomson, De Chernatony,
Arganbright, & Khan, 1999). According to Thomson et al. (1999), organizations with more
satisfied internal communication tended to be more effective in delivering the brand promise
to their customers than organizations with less satisfied internal communication. According
to Asha & Jyothi (2013) and King & Grace (2012), employees’ brand commitment arises
when the employee is satisfied with their internal communication, and is willing to make an
effort on its behalf. Other researchers have supported that employees’ brand commitment
enhances employees’ brand performance with the brand values encapsulated in the brand
promise (Ambler & Barrow, 1996; Rucci, Kirn, & Quinn, 1998).
The study of Papasolomou & Vrontis (2006) proposed that effective internal communication
led to employees’ brand loyalty, and when employees’ loyalty exists, they tend to internalise
the brand values that translate into on-brand behaviours (Punjaisri et al., 2009). With regard
to the relationship between internal communication satisfaction and employees’ brand
loyalty, Du Preez et al. (2015) conclude that employees who are satisfied with their internal
communication are less likely to leave the company than those who are dissatisfied.
According to the social identity theory, internal communication satisfaction has an impact on
the employee’s brand identification so the employee adopts the characteristics of the group
in order to sustain a valued relationship (Asha & Jyothi, 2013; McKenna, 2012). De
Chernatony & Segal-Horn (2001) suggest that there is a relationship between internal
communication satisfaction and employee identification, and it is said that employees who
are satisfied with their internal communication are more likely to establish or maintain a
satisfying relationship with others in the company (De Chernatony & Segal-Horn, 2001;
McKenna, 2000; Sharma & Kamalanabhan, 2012).
Additionally, there is said to be a positive relationship between internal communication
satisfaction and level of employee brand performance, as when internal communication is

32
high, employee brand performance tends to be high (Punjaisri et al., 2009). Khanyapuss
Punjaisri et al. (2009) have empirically proved that, when employees internalise the brand
values, they are more attuned to the behaviours that are appropriate for brand sustainability,
namely employee’s brand behaviour. With regard to the relationship between internal
communication satisfaction and level of employee brand performance, King & Grace (2012)
found that good internal communication could not only lead to employees’ brand attitudes,
but could raise the level of employees’ brand performance.
A commonplace view is that if an organization does not create internal communication for
the provision of minimum level of employee satisfaction, one cannot expect certain
outcomes to follow, such as employees’ brand identification, commitment, loyalty, and
performance (Punjaisri et al., 2009; Sharma & Kamalanabhan, 2012).
According to the above, internal communication satisfaction in the concept of internal
branding creates the four employee brand outcomes: employees’ brand commitment,
identification, loyalty and performance. In the following section, these attitudes and
behaviours will be discussed from various researchers' and academics' perspectives.
2.6 Employee Brand Attitudes: Outcome of Internal Communication in Internal
Branding Concept
2.6.1 Employees’ Brand Commitment
According to Appelbaum (2000), employee commitment is defined as an employee’s feeling
about their employers and the individual’s psychological attachment to the organization. It is
a major contributing factor towards achieving organizational goals and sustaining long-term
success. The study of Thomson et al. (1999) defined employee brand commitment as
employees’ emotional attachment to the brand and its values, which drives them to make an
extra effort to reach the brand goals. Additionally, employees’ brand commitment can be
defined as an active relationship with the company that makes internal stakeholders willing
33
and proud to share their brand values with others (Kimpakorn & Tocquer, 2010). Similarly,
the study of Burmann & Zeplin (2005, p. 284) defined employees’ brand commitment as, “the
extent of psychological attachment of employees to the brand, which influences their
willingness to exert extra effort towards reaching the brand goals”.
The effective internal communication helps the employees to obtain some material benefit
and accept the demands of the organizational culture in order to maintain a good
relationship with co-workers. Consequently, employees adopt the cultural values and
produce intrinsic satisfaction because these values are in line with their own personal
values, which in turn, enhance commitment to the organization (McKenna, 2012).
Mowday, Porter, & Steers (2013) have purported that successful employee commitment
leads to a low level of employee turnover and absenteeism. Meyer, Paunonen, Gellatly,
Goffin, & Jackson (1989) and McKenna (2012) add that employees rated with “high”
commitment tended to be better performers than those rated “low”. The study of Khanyapuss
Punjaisri et al. (2009) is the empirical study to investigate the effects of brand commitment
on employee brand behaviour, i.e. the brand promise delivery among customer- facing
employees. They considered employee brand commitment as a competitive variable, which
employees develop on the job (e.g. interaction skills). There is an impact on the level of
morale, which in turn enhances performance to the organization.
Several studies have confirmed that the level of brand commitment results in the quality of
brand promise delivery (Khan, 2009; Punjaisri & Wilson, 2007). The study of Burmann &
Zeplin (2005) and Punjaisri & Wilson (2007) confirmed that, brand commitment helps
organizations to align employees who represent them and deliver on brand promise, since
when employees live the brand, they live the brand promise.

34
Regarding the consequences of employees’ brand commitment, one should note the
following points. First, employees’ brand commitment is said to influence employees’
performance outcomes (Asha & Jyothi, 2013; Du Preez et al., 2015). Also, commitment
could be reflected in the employees’ willingness to undertake duties beyond the standard
requirement of the brand (Asha & Jyothi, 2013; Du Preez et al., 2015; McKenna, 2012). The
study of Wright, Gardner, and Moynihan (2003) reveals that employee brand commitment
plays a role in predicting employee brand productivity. It plays a large role in the
performance of both in-role and extra-role behaviours, which is consistent with employee
behaviours that are not part of a formal job description, and this also leads to better quality
in-role behaviour (Wright et al., 2003).
2.6.2 Employees’ Brand Identification
Identification is “the process of adopting the characteristics of the group in order to sustain a
valued relationships” (McKenna, 2012, p. 317). The study of Mael and Ashforth (1992, p.
104) defined employee identification as, “the perception of oneness with or belongingness to
an organization, where the individual defines him or herself in terms of the organization(s) in
which he or she is a member”. According to the study of Punjaisri et al., (2009), employees’
brand identification could be defined as an employees’ sense of belonging to the
organization and a perception of being aligned to the organization’s brand values and
promise.
The study of McKenna (2012) and Welch & Jackson (2007) revealed the relationship
between internal communication satisfaction and employee identification. The effective
internal communication helps employees to conform to the expectations of groups and
organizations because the groups and organizations have the power to reward them if they
conform to the group’s values, and to punish them if they fail to do so (McKenna, 2012).
When employees conform to the values, they can also serve to adopt the characteristics of

35
the group and organization and increase employees’ identification with an organization
(McKenna, 2012; Welch & Jackson, 2007). According to Du Preez et al. (2015) state that, an
objective of effective internal communication is to help employees refer to the process of
adopting the characteristics of the group in order to sustain a valued relationship. Therefore,
if a company does not create conditions for the provision of a minimum level of internal
communication satisfaction, one can expect certain employees’ brand identification.
Similarly, the study of De Chernatony & Segal-Horn (2001) and Punjaisri et al. (2009)
confirmed that employee identification is employee attitude outcomes of effective internal
communication.
Employee identification is important since employees engaged in their organization will
naturally desire to achieve goals on behalf of the organization (Van Knippenberg, Van
Knippenberg, De Cremer, & Hogg, 2004). The study by Van Knippenberg et al. (2004)
concluded that employees with high organizational identification contribute to their
organization in a positive manner. Furthermore, in answer to the questions of why
organizations should care if employees have strong identification, Dutton, Dukerich, and
Harquail (1994) argued that strong organizational identification helps to achieve their desired
outcomes, such as a satisfying relationship with others in organization.
Many other studies have also examined possible links between employee identification and
employee brand behaviour. For example, Pratt, Rockmann, and Kaufmann (2006) produced
evidence that employee identification is positively associated with employee behaviour.
Meanwhile, the study by Smidts et al. (2001) measured employees’ organizational
identification in three organizations. The study concluded that employee identification is
positively related to behaviour and performance of the individuals. Walumbwa, Avolio, and
Zhu (2008) revealed that employees’ identification with their workplace was related to
employee behaviour, while Walumbwa, Cropanzano, and Hartnell (2009) investigated the
mediated effect of employee’s identification with employee behaviour. The conclusion was
36
that a worker’s sense of self could improve work performance. Asha & Jyothi (2013) and
Löhndorf & Diamantopoulos (2014) explain the influence of employees’ brand identification
influences on employees’ brand behaviour. There is said to be a positive relationship
between employees’ brand identification and employees’ brand behaviour, and when
employees’ brand identification is high, employees’ brand behaviour tends to be high.
Therefore, employees’ brand identification plays a critical role in developing the work
performance of employees towards reaching the brand goals.
2.6.3 Employees’ Brand Loyalty
Allen & Meyer (1990) defined employee loyalty as an affective commitment among
employees. Employees who have a strong sense of loyalty towards the organization will
remain with the organization because they believe they want to do so (Allen & Meyer, 1996).
The study findings by Loveman (1998) found that there is a positive relationship between
internal communication satisfaction and level of employees’ loyalty, so when internal
communication satisfaction is high, employees’ loyalty tends to be high. The effective
internal communication of a company can build employee loyalty, which enhances the
behaviour of employees (Asif & Sargeant, 2000; Huczynski & Buchanan, 2013; McKenna,
2012; Papasolomou & Vrontis, 2006; Robbins & Judge, 2014; Silvestro, 2002) because the
effective groups in the workplace require the characteristics of effective internal
communication. These include informality, understanding, listening, consensus decision-
making, awareness of decisions, leadership roles undertaken by most suitable members and
frequent reviews of group operations (McGregor, 1960; McKenna, 2012). McKenna (2012)
argues that effective groups can establish job satisfaction because they appear to have good
intra-groups and supportive colleagues. In this way, job satisfaction addresses the positive
influence of employees’ loyalty (McKenna, 2012). Additionally, Clegg (1983), and Scott &
Taylor (1985) have depicted the influence of the high levels of job satisfaction on the low
level of absenteeism, which subsequently affects the success of the organization.

37
Heskett & Schlesinger (1994) concluded that employee loyalty is positively associated with
high service quality. This study suggested that employee loyalty is important for business
because it improves customer satisfaction and increases the company profits. Furthermore,
Heskett & Schlesinger (1994, p.164-165) state that, “Loyalty is a direct result of customer
satisfaction. Satisfaction is largely influenced by the value of services provided to customers.
Value is created by satisfied, loyal, and productive employees. Employee satisfaction, in
turn, results primarily from high-quality support services and policies that enable employees
to deliver results to customers”.
Meanwhile, Yee, Yeung, & Edwin Cheng (2010) explored the link between employee loyalty
and firm performance in high-contact service shops in Hong Kong. This study found that the
consequences of employee loyalty could include good service quality with a low incidence of
error and wastage, which may be reflected in increased customer satisfaction and customer
loyalty. Yee et al. (2010, p.110) argued that, “loyal employees who are satisfied with their job
demonstrate their loyalty to the employing organization by working hard and being
committed to delivering services with a high level of quality to customers”. Therefore, loyal
employees are viewed as an asset to the organization because a company’s profitability is
totally dependent upon them (Michlitsch, 2012). According to Asha & Jyothi (2013) and
Punjaisri et al. (2009), employees’ brand loyalty, a key ingredient in internal branding
outcomes, could be defined as an employees’ willingness to remain with the current
organization. Employees’ brand loyalty arises when employees’ strongly identifies with the
organization, agrees with their brand goals and values, and are willing to expend effort on
their behalf.
2.7 Employees’ Brand Behaviour: Outcome of Employees’ Brand Attitudes
When the internal communication of an organization aids in developing employees whose
attitudes are that of commitment, with identification with the company and loyalty to the

38
brand promise, then they will represent the brand through their words and actions and
deliver the brand promise in a consistent manner (Gapp & Merrilees, 2006; Ind, 2003 Ind,
2014; Sharma & Kamalanabhan, 2012). According to the study of Mayer, Davis, and
Schoorman (1995), they confirmed this concept because they found that there is a link
between positive employees’ attitudes and employees’ performance. Therefore, positive
attitudes from employees play an important role in the productivity and success of the
organization. The study of De Chernatony (2002) and Khan (2009) mentions the outcome of
employees’ brand attitudes as living the brand or being the brand. Additionally, Punjaisri
(2008, p.226) defined employee brand behaviour as, “employee behaviours in delivering the
brand promise”. This means that employee brand behaviour can be measured by
supervisors and others as a means of developing human resources for corporate branding,
and delivering the brand promise. Similarly, other researchers of internal branding concluded
that the employee brand behaviour is the results of the internal communication process to be
shared with the employees in a positive way so that the person concerned is given the
support to put right deficiencies or maintain good brand promise (Ahmed, Rafiq, & Saad,
2003; Asha & Jyothi, 2013; Drake, Gulman, & Roberts, 2005; Free, 1999; Punjaisri, 2008;
Löhndorf & Diamantopoulos, 2014).
Additionally, Collis & Montgomery (2008) concluded that employee brand behaviour has a
significantly positive effect on organization performance because it provides an organization
with a competitive advantage. As a result, the organizations aim to maximise employee
performance and align individual effort with organizational objectives. Some empirical
evidence shows that the link between employees’ brand behaviour with sustainable
competitive advantage for a financial service company is strong (Lai & Hsu, 2015). There is
a significant positive correlation between these two variables. It was found that organizations
with more satisfied employees’ brand behaviour tended to be more to gain competitive
advantage than organizations with less satisfied employees (Lai & Hsu, 2015).
39
From an internal branding perspective, the business needs to build employee brand
attitudes, which include employee brand commitment, identification and loyalty to achieve a
high level of employee performance. Additionally, from the literature it is clear that internal
communication is influential in enabling employees to perform their role in delivering the
brand promise in the concept of internal branding. This means that internal communication
satisfaction has a positive influence on employees’ brand attitudes and employees’ brand
behaviour (Carriere & Bourque, 2009; Du Preez et al., 2015; Sharma & Kamalanabhan,
2012).
Research in the concept of internal branding has shown important links between internal
communication satisfaction and employees’ brand outcomes. However, Gray & Laidlaw
(2004) and Zwijze-Koning & de Jong (2007) underscore the need for more research on
internal communication dimensions. The studies on internal communication have to accept
that effective internal communication satisfaction measurement is notoriously difficult to get
right, nevertheless many companies consider such a procedure as an essential tool for
assessing the employees’ brand outcomes in the concept of internal branding (Bakar &
Mustaffa, 2013). Therefore, within the internal communication literature, the internal
communication has been constructed differently, leading to a myriad of constructs.
Thus, the main objective of this study is to conceptualise the domain of internal
communication in the Thai hotel industry. The importance of specifying the domains to be
used in internal communication satisfaction evaluation in the concept of internal branding
must not be understated. The following section discusses the constructs of internal
communication satisfaction from existing internal communication instruments, whereby the
relevant and important techniques are addressed.

40
2.8 The Construct of Internal Communication Satisfaction
Measuring internal communication satisfaction is done via the gauge of organizational
climate and health in terms of employee satisfaction/ dissatisfaction (Downs, 1988). The
study of Gardner (2009) views an evaluation of communication satisfaction as a benchmark
for the progress and future of the organization. The Macmillan English Dictionary (Macmillan,
2009, p.123) defines a benchmark as, “an amount, level, standard etc. that you can use for
judging how good or bad other things are”. Gardner (2009) suggests that an evaluation of
internal communication satisfaction as benchmarks is a comparative analysis of internal
communication practice across divisions within a company. It reveals two sides: strength and
weakness and is used to diagnose actual or perceived communication obstructions that may
undermine the success of any organization. Additionally, an internal communication
satisfaction survey may improve an internal communication system and may also affect the
variables that characterize the system. The survey will improve planning, organizing and
managing control of internal communication networks, policies and activities, and help an
organization to adapt to new situations or detect negative trends. Communication
satisfaction is typically measured through personnel surveys or questionnaires (Gardner,
2009).
The study of Gray & Laidlaw (2002) shows advantages of internal communication audits and
assessments of internal communication satisfaction. The information revealed from the
survey lists an organization’s strength and weaknesses, which will help the organization
develop its communication strategies. The communication strategies will help the
organization develop and improve work relationships, which is important for finding
satisfaction in employees’ jobs, the transmission of information and the organization’s overall
performance.
In the field of organization communication theory there is a belief that internal
communication is the framework in which all production relies; without internal
41
communication an organization ceases to exist (Hart et al., 2015). According to Hart et al.,
(2015), the internal communication audits are powerful tools to investigate internal
communication processes and often answer the questions where, what, how, and when
internal stakeholders are receiving and sending information as well as the quality of the
information transmitted. They appeal to us in what is working well, and what is not working
well, and areas that can be improved. Therefore, managers can use the internal
communication audits to improve every aspect of their company’s performance (Hart et al.,
2015).
Within the organization communication literature, the internal communication satisfaction
dimensions have been approached differently, leading to a myriad of dimensions. Apart from
the different dimensions of internal communication, two groups of internal communication
dimensions are used by researchers in the literature; they are identified as follows: the
specific internal communication dimensions developed by researchers; and the internal
communication dimensions using a standardised instrument. Under each group, a variety of
internal communication dimensions are subcategorised.
The section 2.8.1 provides a review of the specific internal communication dimensions
developed by researchers. The section 2.8.2 then reviews the internal communication
dimensions by using a standardised instrument. This aims to show the domain of internal
communication of each instrument. Finally, section 2.8.3 concludes by identifying the
research gap.
2.8.1 The Specific Internal Communication Dimensions
Apart from the different dimensions of internal communication, the literature has revealed a
variety of dimensions developed in an internal communication campaign. From the literature
review and the study of Sharma & Kamalanabhan (2012), three broad categories of

42
dimensions are used by researchers in the literature to communicate with employees; they
are identified as follows:
1.) A dialogue communication
2.) Communication channels
3.) Communication and a sense-making activity
The use of a dialogue communication reflects the notion of applying corporate vision and
values to implement an internal branding project. According to the study of Grunig, Grunig,
Sriramesh, Huang, & Lyra (1995), it was found that a dialogue communication, in respect to
communication, is considered to be a vehicle for changing attitudes and behaviours.
Similarly, Sharma & Kamalanabhan (2012) suggest that the organization must engage its
staff members in a dialogue communication about what the corporate values and vision are
because it supports value internalization by employees. Of all the different dialogue
communication dimensions used, two-way communication is found to be the most
successful dimension because they effectively share an added challenge and extra
information to develop staff members’ ideas in the direction a company wants (Brunetto &
Farr-Wharton, 2004; Juholin et al., 2015; Kapoor, 2010; Power & Rienstra, 1999; Sharma &
Kamalanabhan, 2012). Using a dialogue communication is considered an important
development in influencing internal stakeholders emotionally. In any discussion of internal
communications nowadays, the importance of a dialogue communication is underlined
(Juholin et al., 2015). The dialogue communication is important in the context of
interpersonal perception in the organization and it provides a basic framework for
understanding organizational change and helps business to convey to employees the logic
of the change, for by doing so it is assumed that resistance can be reduced (McKenna,
2012).
Additional attention of internal communication dimensions should be paid to the
communication channels. Argenti (2007) & Tukiainen (2001) suggest the use of internal

43
communication channels to charm and attract employees. Their suggestion is in accordance
with De Chernatony & Segal-Horn (2003), who underline the use of internal communication
channels to transmit information about mission and vision of the company to the receiver. De
Chernatony & Segal-Horn (2003) show that the link between internal communication
satisfaction and positive employee behaviours with the corporate values are strong if the
internal communication channels are effective. The formal and informal communication
channels have been observed by Herstein, Mitki, & Jaffe (2008) to be mostly used as the
dimensions of internal communication channels. The dimension that exerts the foremost
pervasive influence is argued to be face-to-face communication or informal communication.
Other studies (Hargie & Dickson, 2007; Power & Rienstra, 1999; Tukiainen, 2001) have so
far supported this argument because when we use the face-to-face communication, the
sender of a message has the opportunity to observe feedback, answer questions, and
provide additional information about corporate values by way of classification. Therefore,
face-to-face communication is a forum to exchange information on the implementation of
corporate values so as to decide on the appropriate action with corporate brand image
among the employees (Herstein et al., 2008; McKenna, 2012; Sharma & Kamalanabhan,
2012). The communication channels are considered as the way of forming a relationship
within organization (McKenna, 2012). It was found that employees who came across as
genuine on the internal communication channels were most likely to form a close and lasting
relationship. According to To et al. (2015), it was also found that the communication
channels usually consisting of both formal and informal internal communication affected
employee work attitudes. To et al. (2015) suggested that the internal communication
channels can help employees to be more positive in the workplace and to put in the extra
effort when it is needed.
The use of communication and a sense-making activity become increasingly important for its
virtues of enhancing all staff members within an organization to help an organization create
a strong identity among internal stakeholders (Sharma & Kamalanabhan, 2012; Weick,

44
1987). The use of language (e.g. news, feature-writing) is a common dimension in a
communication and sense-making activity to establish and develop employees’ attitudes and
behaviours that are aligned with the expectations of an organization and customers (Weick,
1987). Additionally, the studies of Melewar & Akel (2005) and Mestre, Stainer, Stainer, and
Strom (2000) provide evidence of the use of visual communication as part of brand
messages with all employees that is a vital internal communication dimension to shape
employees’ attitudes and employees’ behaviours so that they deliver on the brand promise.
According to McKenna (2012), traditional employees received one-way messages from their
supervisors and the HRM department of companies. These can be challenged nowadays
because employees can get assitance and information from other internal stakeholaders by
soliciting opinions or visiting social network sites. McKenna (2012) suggests that using social
network sites, for example; facebook and Twitter, in the context of organizational storytelling
is considered an important development in influencing employees’ attitudes and behaviour.
Various organizational outcomes are attributed to different specific internal communication
satisfaction dimensions and these are shown in Table 2.1.

45
Table 2-1 Studies showing the link between internal communication satisfaction and
organizational outcomes
Authors Internal Communication
Satisfaction Constructs
Organizational Outcomes
Fawkes & Gregory (2000) 1. Messages
2. Channels
3. Sender and Receiver
Effect on internet based
communication
Hargie & Dickson (2007) 1. Messages
2.Channels (formal and
informal)
3. Source of information
Awareness
Hawabhay et al. (2009) 1. Visual identity symbols
2. Messages (value statements)
3. Top management
communication
Corporate Brand Image
Kapoor (2010) 1. Messages
2. Channels
3. Feedback
Employer branding
Mazzei (2010) 1. Messages
2. Channels
3. Training
Impact on communication
behaviours
Melewar & Akel (2005) Visual Communication 1. Corporate identity
2. Corporate image
Mestre et al. (2000) Visual communication 1. Work life
2. Employee performance
Power & Rienstra (1999) 1. Message
2. Face-to-face communication
3. Two way communication
(feedback)
4. Communication training
1. Impact on employee
behaviours
2. Impact on employee attitudes
Punjaisri et al. (2007) 1. Channels (orientation
programmes, group meetings,
briefings)
2. Training
Employee brand identification
Employee brand commitment
Employee brand loyalty
Employee brand performance
Sharma & Kamalanabhan (2012)
1. Message effectiveness
2. Channels
3. Brand Feedback
4. Brand Training
1. Employee brand identification
2. Employee brand commitment
3. Employee brand loyalty

46
Table 2-1 Studies showing the link between internal communication satisfaction and
organizational outcomes
Authors Internal Communication
Satisfaction Constructs
Organizational Outcomes
Teeni (2001) 1. Messages
2. Channels
Mutual Understanding between
internal stakeholders and
influencing behaviour and
attitude
Tukiainen (2001) 1. Communication Channels
2. Face-to-face communication
3. Supervisor communication
Communication satisfaction
Vuuren et al. (2007) Supervisory communication Affective organizational
commitment
Welch & Jackson (2007) 1. Sender
2. Messages
3. Channels
4. Organization communication
relationships
1. Employee belonging
2. Employee awareness
3. Employee commitment
4. Employee loyalty
5. Job/ personal satisfaction
To et al. (2015) 1. Formal internal
communications
2. Informal internal
communications
Employees’ work attitudes
Karanges et al. (2015) Internal supervisor
communication
Employee engagement
Du Preez (2015) 1.Brand identity
2.Internal brand communication
3.External brand
communication
1.Brand commitment
2.Job satisfaction
3.Intention to stay
Asha & Jyothi (2013) 1.Compensation and
Rewards
2.Training
3.Employee Growth Need
Strength
4.Participation in Decision
Making
5.Quality of Work Life
6.Organizational Socialization
7.Management Communication
Organizational Citizenship
Behaviour

47
Table 2-1 Studies showing the link between internal communication satisfaction and
organizational outcomes
Authors Internal Communication
Satisfaction Constructs
Organizational Outcomes
Matanda & Ndubisi (2013) 1.Training
2.Internal communication
3.Human resources
involvement in branding
1.Person–organisation fit
2.Intention to stay
Lee et al. (2014) 1.Training
2.Communication
3.Reward
1. Job engagement
2. Organization engagement
3. Job satisfaction
4.Employee Loyalty
Chowdhury et al. (2015) 1.Training
2.Orientation
3.Group Meeting
4.Briefing
1. Quality Commitment
2. Affective Quality Commitment
3. Behavioural Quality
Commitment
4. Cognitive Quality
Commitment
According to the above literature, the importance of internal communication has become
increasingly apparent in the concept of internal branding. However, internal branding
scholars are concerned with internal communication constructs in the concept of internal
branding (Argenti, 2007; Sharma & Kamalanabhan, 2012). Sharma & Kamalanabhan (2012,
p. 301) have proposed that, “At a time when the effectiveness of internal branding in context
of turnover or employee engagement is highly discussed, it would be relevant to examine
how ICC (Internal Corporate Communication) dimensions can influence internal branding
outcomes from employee’s perspective”. The study of Sharma & Kamalanabhan (2012)
clearly suggests that internal branding becomes crucial for marketers to know how to align
employees’ brand performance with the brand promise. Internal communication satisfaction
develops the positive employees’ brand attitudes that can align employees’ performance with
brand promise. However, internal branding literature is lacking domains of internal
communication satisfaction in the concept of internal branding and the interplay between
these domains and employees’ brand outcomes. Similarly, Smidts et al. (2001) supported

48
that internal branding is already successfully utilised by marketing practitioners when
developing and measuring internal communication satisfaction aimed at providing feedback
on specific examples of internal communication satisfaction and dissatisfaction.
2.8.2 The internal communication dimensions by using a standardised instrument
The most frequently adopted approach to measuring internal communication satisfaction
involves the use of rating scales. These are standard instruments that are designed to
provide feedback on specific examples of employee satisfaction and dissatisfaction in
internal communication. Four existing internal communication instruments have been
identified (Bakar & Mustaffa, 2013):
1.) Organizational communication questionnaire (OCQ) by Roberts & O'Reilly (1974)
2.) Communication satisfaction questionnaire (CSQ) by Downs & Hazen (1977)
3.) Communication audit survey questionnaire (CAS) by Goldhaber & Rogers (1979)
4.) Organizational communication audit questionnaire (LTT) by Wiio & Helsila (1974)
The organizational communication questionnaire (OCQ) was one of the first systematic
instruments to internal communication measurement and was developed by Roberts &
O'Reilly (1974). The following are the internal communication factors, which were considered
in attempts to establish the cause of internal communication satisfaction:
The communication variables. The level of satisfaction will depend on the
acceptability of ways of communication, which would embrace desire for
interaction, directionality upward, directionality downward, directionality
lateral, accuracy, summarization frequency, gate keeping, overload,
satisfaction, and the four modalities of written, face-to-face, telephone, and
other channels of communication.
The communication-related variables. Where communication-related
variables are trust in superior, influence of superior, and mobility aspirations.
49
The communication-related variables with respect to internal communication
satisfaction would be bleaker if the communication-related variables were
poor.
In the internal communication satisfaction measurement developed by Downs & Hazen
(1977), the communication satisfaction questionnaire (CSQ) was designed to measure the
overall internal communication satisfaction (Bakar & Mustaffa, 2013). The eight
communication satisfaction variables are communication climate, supervisory
communication, organization integration, media quality, co-worker communication, corporate
communication, personal feedback, and subordinate communication.
The communication Audit Survey Questionnaire (CAS), developed by Goldhaber & Rogers
(1979), makes a continuous comparison between the perceived actual situation and the
desired situation (Riel, 1995). The measurement deals with the following topics: judgement
of the amount of information to be received; judgement of the amount of information to be
sent to others; and judgement of the feedback received on the information sent (Bakar &
Mustaffa, 2013; Riel, 1995). It means that the CAS aims to measure employees’ perception
about the steps involved in the communication cycle, including encoding the communication,
the ways of communication, decoding the communication, and feedback messages.
The organizational Communication Audit Questionnaire, developed by Wiio & Helsila (1974),
was originally called LTT, then OCD, and sometimes it is called OCA (Riel, 1995). The LTT
consists of 12 communication variables, which are:
Overall communication satisfaction;
Amount of information received from different source – now;
Amount of information received from different source – ideal;
Amount of information received about specific job items – now;
50
Amount of information received about specific job items – ideal;
Areas of communication that need improvement;
Job satisfaction;
Availability of computer information system;
Allocation of time in a working day;
Respondent’s general communication behaviour;
Organization-specific questions; and
Information-seeking patterns.
Table 2.2 provides the dimensions of internal communication categorised into four existing
internal communication instruments, which are derived from the literature.
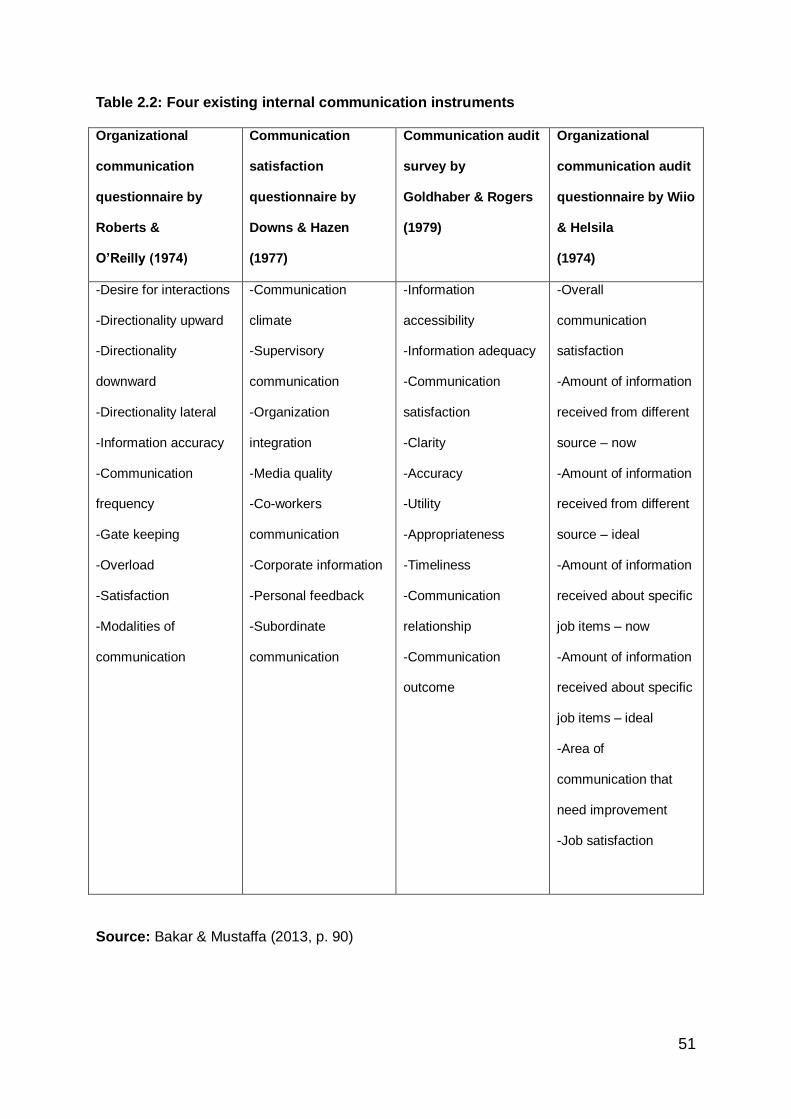
51
Table 2.2: Four existing internal communication instruments
Organizational
communication
questionnaire by
Roberts &
O’Reilly (1974)
Communication
satisfaction
questionnaire by
Downs & Hazen
(1977)
Communication audit
survey by
Goldhaber & Rogers
(1979)
Organizational
communication audit
questionnaire by Wiio
& Helsila
(1974)
-Desire for interactions
-Directionality upward
-Directionality
downward
-Directionality lateral
-Information accuracy
-Communication
frequency
-Gate keeping
-Overload
-Satisfaction
-Modalities of
communication
-Communication
climate
-Supervisory
communication
-Organization
integration
-Media quality
-Co-workers
communication
-Corporate information
-Personal feedback
-Subordinate
communication
-Information
accessibility
-Information adequacy
-Communication
satisfaction
-Clarity
-Accuracy
-Utility
-Appropriateness
-Timeliness
-Communication
relationship
-Communication
outcome
-Overall
communication
satisfaction
-Amount of information
received from different
source – now
-Amount of information
received from different
source – ideal
-Amount of information
received about specific
job items – now
-Amount of information
received about specific
job items – ideal
-Area of
communication that
need improvement
-Job satisfaction
Source: Bakar & Mustaffa (2013, p. 90)
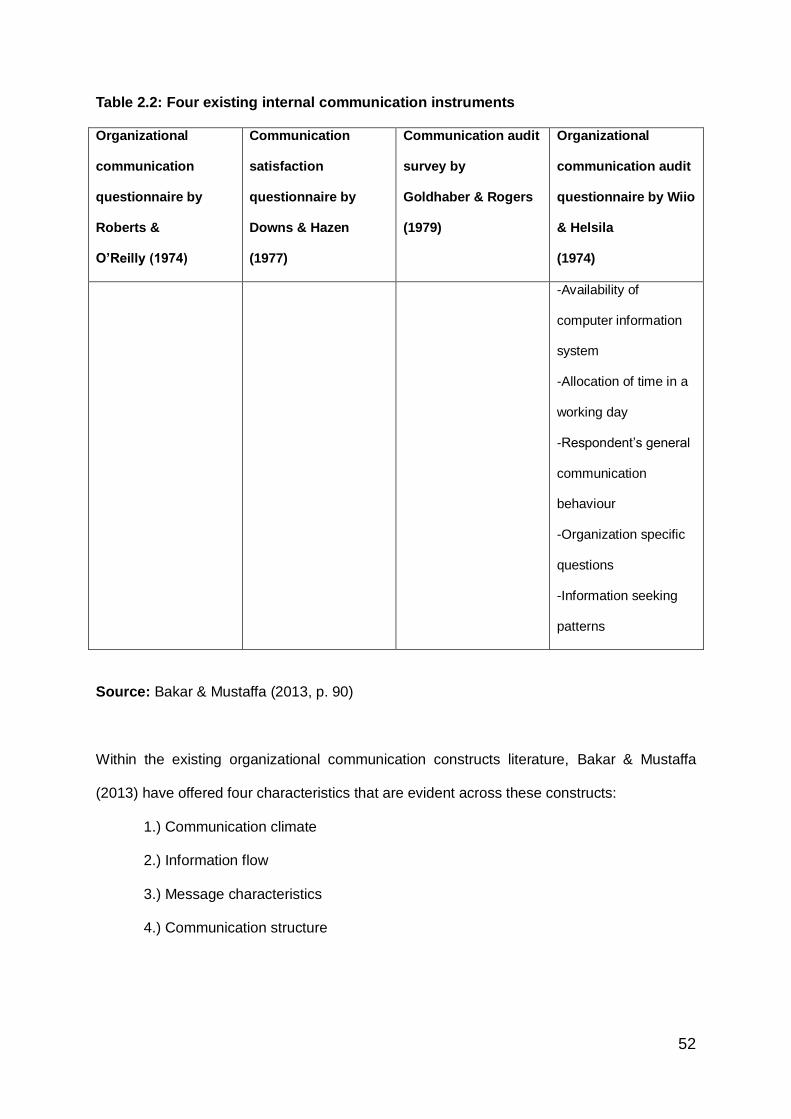
52
Table 2.2: Four existing internal communication instruments
Organizational
communication
questionnaire by
Roberts &
O’Reilly (1974)
Communication
satisfaction
questionnaire by
Downs & Hazen
(1977)
Communication audit
survey by
Goldhaber & Rogers
(1979)
Organizational
communication audit
questionnaire by Wiio
& Helsila
(1974)
-Availability of
computer information
system
-Allocation of time in a
working day
-Respondent’s general
communication
behaviour
-Organization specific
questions
-Information seeking
patterns
Source: Bakar & Mustaffa (2013, p. 90)
Within the existing organizational communication constructs literature, Bakar & Mustaffa
(2013) have offered four characteristics that are evident across these constructs:
1.) Communication climate
2.) Information flow
3.) Message characteristics
4.) Communication structure
53
According to the existing organizational communication constructs literature, communication
climate can be termed as information accuracy, communication frequency (Roberts &
O'Reilly, 1974); communication climate, (Downs & Hazen, 1977); clarity, accuracy,
appropriateness, timeliness (Goldhaber & Rogers, 1979); overall communication
satisfaction, organization specific questions, area of communication that need improvement
(Wiio & Helsila, 1974). The study of Clampitt & Downs (1993) suggests that the
characteristics of good communication climate which includes warm, tolerant and
participative, will be considered with respect to communication as a vehicle for changing
employees’ attitudes. Therefore, a good communication climate can help organizations to
ensure that it obtains positive perceived outcomes on both organizational and personal
levels such as quality of work life, innovation and organizational development (Clampitt &
Downs, 1993). According to van den Hooff & De Ridder (2004), there are many
characteristics of a good communication climate, which include horizontal communication
flow, openness, vertical information flow, and reliability of information. Van den Hooff & De
Ridder (2004) found that communication climate can have positive effects on employees’
knowledge sharing behaviours.
According to the study of Miller (2014), the information flow refers to ways in which the
information can move in an organization. The free information flow encourages staff
members in an organization to give feedback and share ideas to improve business
performance (Miller, 2014). The information flow can be termed as desire for interactions
(Roberts & O'Reilly, 1974); personal feedback (Downs & Hazen, 1977); information
accessibility (Goldhaber & Rogers, 1979); respondent’s general communication behaviour
(Wiio & Helsila, 1974).
McKenna (2012) suggests that various characteristics of the message will be considered
with respect to communication as a vehicle for changing attitudes. This suggestion is
supported by Petty & Cacioppo (1984), who view the nature of a message as a vehicle for
54
playing a role in persuasion. For example, McKenna (2012) found that the credibility of the
source of a message is applicable to persuasion. Credibility depends on the general
trustworthiness, qualifications dynamism, or energy of the person (McKenna, 2012).
Additionally, a two-sided communication, which is two sides of the argument, appears in the
message and would be more effective in changing the attitudes of all stakeholders than one-
sided communication (McKenna, 2012). According to the existing organizational
communication constructs literature, message characteristics can be termed as overload
(Roberts & O'Reilly, 1974); organization integration, organization perspective (Downs &
Hazen, 1977); utility (Goldhaber & Rogers, 1979); amount of information received from
different sources, amount of information received about specific job items (Wiio & Helsila,
1974).
According to the study of Miller (2014), communication structure consists of both style of
communication and communication channels in an organization. The style of communication
was considered by Miller (2014), and he proposes the combination of formal and informal
communication to ensure the performance of employees and behaviours that supports the
corporate goals and values. For communication channels, there are different channels to
facilitate communication flow such as face-to-face communication, oral and written
communication, nonverbal communication, new technology and communication network
(McKenna, 2012; Miller, 2014). The study of McKenna (2012) found that communication
channels have a direct impact on the company’s performance. The communication structure
can be termed as directionality upward, directionality downward, directionality lateral, gate
keeping (Roberts & O'Reilly, 1974); relation to supervisor, relation to subordinate, horizontal
communication, media quality (Downs & Hazen,1977); utility (Goldhaber & Rogers, 1979);
availability of computer information system; information seeking patterns (Wiio & Helsila,
1974).

55
Additionally, the four existing organizational communication constructs have been tested for
reliability and validity by various authors. A comparative instrument assessment schedule of
the four instruments used by Greenbaum et al. (1988) containing a summary of judgements
made about the instruments is shown in Table 2.3.
Table 2.3: Comparative Instrument Assessment Schedule (Greenbaum et al., 1988)
OCQ CSQ CAS OCD
General structure
Item: total 35 51 134 76
communication items 27 40 109 54
demographics - 5 12 7
outcome variable items - 6 13 7
comm.-related items 8 - - -
org.-specific items - - - 8
Dimensions 16 10 13 12
Response format:
Type of scale 7-point 7-point 5-point 5-point
Open-ended none Limited extensive limited
Multiple choice inc. demographics - 5 items 12 items 16 items
Administration
Ease of administering high High high moderate
Ease of tabulating high High moderate moderate
Past use of instrument moderate moderate high high
Norms availability none Yes yes yes
Psychometric data
Reliability overall .70 .94 .838 n/a
Inter-item within scale .84 to .53 .86 to .75 .90 to .70 n/a
Item to total .39 to .22
Validity
Face validity high High high high
Discrimination valid high High high n/a
Factor stability moderate moderate low moderate
Evaluated by other researchers yes Yes yes yes
Source: Riel (1995, p. 71)
56
However, the four existing organizational communication constructs were developed in the
western context. These instruments are considered as conducting the internal
communication audit and provide a basis for planning the future scope and quality of the
internal communication function. However, according to the study of Bakar & Mustaffa,
(2013) these standardised instruments did not examine developing countries in the
development of internal communication constructs in the internal branding concept.
Furthermore, according to this gap theory, a limited number of research studies have been
conducted into the processes required to develop internal communication instruments,
particularly in the context of developing countries. These findings point to the need for more
research of internal communication instruments in organizations in developing countries.
2.9 Conclusion and research gap of the construct of internal communication
satisfaction
Along with the rise of internal branding, the literature has increasingly stressed the crucial
role of the constructs of internal communication in influencing employees’ attitudes and
performance in the concept of internal branding. Relatively few studies have been carried
out to understand the domain of internal communication from the viewpoint of employees in
the context of developing countries. Furthermore, a limited amount of research has been
conducted into the internal communication processes required to encourage employees’
brand outcomes in the concept of internal branding.
The first objective of this study was to conceptualise the domain of internal communication
that is perceived as relevant and effective by employees. When internal communication
measurements were discussed earlier in this chapter, reference was made to various
existing communication constructs. The constructs of Communication Satisfaction
Questionnaire (CSQ) was considered by this current study in an attempt to establish the
causes of internal communication satisfaction in the concept of internal branding. According
to the internal branding literature, the internal communication satisfaction was considered as

57
a vehicle for changing attitudes and behaviours in the concept of internal branding.
Additionally, there is a link between the CSQ constructs and employees’ outcomes in the
concept of internal branding.

58
Chapter 3: Conceptualization and Nomological Network of Internal Communication
Satisfaction
3.0 Introduction
The previous chapter revealed the influences of internal communication satisfaction on the
internal branding outcomes. According to the internal communication literature, many
researchers have highlighted a need for more research into the dimensions of internal
communication. Apart from the different dimensions of internal communication, this current
study can be classified into two main groups: the specific internal communication dimensions
developed by researchers; and the internal communication dimensions by using a
standardised instrument.
The overall goal of this study is to explore the influence of internal communication on
employees’ brand outcomes in the concept of internal branding by using constructs from a
standardised instrument. The specific research objectives have been broken down as
follows:
The first objective of this study was to conceptualise the domain of internal communication
by using the constructs of Communication Satisfaction Questionnaire (CSQ) that are
perceived as relevant and effective by employees.
The second objective of this study was thus to determine the nomological network of internal
branding by using the constructs of the Communication Satisfaction Questionnaire (CSQ).
Finally, the third objective of this study was to evaluate the influence of internal
communication on employees’ behaviour from high/low performance employees based on a
developing country context using evidence from the hotel sector in Thailand.

59
This chapter provides a review of the CSQ constructs, which are distinctively associated with
employees’ brand outcomes and formulated in the first, second and third research objectives
and hypotheses that form the literature review.
3.1 The Construct of Downs-Hazen Communication Satisfaction Questionnaire (CSQ)
In the questionnaire developed by Downs and Hazen (1977), eight communication
satisfaction variables were considered one of the most comprehensive instruments available
(Gray & Laidlaw, 2002). This study of Gray and Laidlaw (2002) found that there are three
reasons why CSQ is the most comprehensive instrument available:
First of all, the CSQ assesses the direction of information flow because its constructs can
transmit information up, down, and sideways within an organization (Gray & Laidlaw, 2002).
Therefore, the CSQ constructs create the organizational communication networks that are
not the same as the lines of communication found on an organization chart. It is beneficial to
assist supervisors and subordinates to facilitate communication and to foster much needed
integration within the organizational system (Gray & Laidlaw, 2002; McKenna, 2012).
Second of all, the CSQ assesses the formal and informal channels of communication,
because informal organizational communication can be used to supplement formal
communication channels. The informal communication can raise morale when it transmits
positive information about the organization (Gray & Laidlaw, 2002; McKenna, 2012).
Finally, the CSQ assesses the relationships with various members of the organization (Gray
& Laidlaw, 2002). The communication roles and functions of people in organizations are
crucial for the proper functioning of the communication network and the organization as a
whole, such as Gatekeeper, Liaison, Cosmopolite, Isolate, and Isolated dyad (McKenna,

60
2012). Therefore, the CSQ constructs are beneficial to capitalize on the strengths and
orientations of individuals within the organization (Gray & Laidlaw, 2002; McKenna, 2012).
In a later study, Zwijze-Koning & de Jong (2007) concentrated their attention on evaluating
the communication satisfaction questionnaire as a communication audit tool, rather than the
impact of this tool in employees’ outcomes. They found that the CSQ can be used to
estimate employees’ communication satisfaction by asking employees a large number of
questions regarding eight different communication topics that these topics vary from
interpersonal communication to assessment of the organization-wide communication
climate. Additionally, Zwijze-Koning & de Jong (2007) suggested that researchers may use
established statistical techniques to assess the instrument’s reliability and to analyse its
results for business management.
Downs & Adrian (2012) state the functional benefits of the Communication Satisfaction
Questionnaire (CSQ) as a communication audit tool are likely to put forward the following
case.
The CSQ provides an excellent backdrop for tracing some of the organizational
communication culture. Their results are particularly helpful for management to use
to understand the general organizational communication culture that also influences
what is happening within the company.
The CSQ is helping employees’ perceptions about the way the company works and
judgments about whether or not it operates effectively.
The CSQ gives management the new information about internal communication it
needs to plan organizational development.
The CSQ provides feedback about internal communication effectiveness that can be
applied to the development of internal organizational communication strategies.

61
The CSQ offers a benchmark for the progress and future of corporate communication
programs.
Management can use the CSQ as a useful forum for employees’ participation to
make a difference in their organization, which is referred to as a horizontal
organization. The horizontal organization can facilitate suggestions from
subordinates, and provides all employees with a feeling of security and belonging,
which in turn fosters satisfaction and group stability.
In short, acording to the studies of Gray & Laidlaw (2002) and Downs & Adrian (2012)
confirmed that items on the Communication Satisfaction Questionnaire are adequate
indicators and support the original factor structure hypothesized by its developers.
Downs and Hazen (1977) have developed the Communication Satisfaction Questionnaire
(CSQ), which places emphasis on communication satisfaction. This study views the internal
communication concept that is multidimensional. In the questionnaire developed by Downs
and Hazen (1977), eight internal communication satisfaction variables were made for the
rating scales.
The development of CSQ measurement begins by identifying all internal communication
tasks and the standard procedures prescribed for each. It then develops the original
questionnaire and factor-analysis of the data. Next comes a detailed review and evaluation
of the questionnaire and its administration in four different organizations. The findings of the
measurements show the correlation analysis to identify which communication factors were
strongly related to job satisfaction. The study of Downs and Hazen (1977) suggest that the
CSQ provides a basis for planning the future scope and quality of the internal
communication function. Internal communication is potentially an important tool in
competitive differentiation. Additionally, the results of the study of Downs and Hazen (1977)

62
show that the CSQ should also be used in different types of organizations. The eight internal
communication satisfaction dimensions are as follows:
Horizontal communication. The extent to which informal communication is
accurate and free flowing, and includes perceptions of the grapevine (Downs, 1988;
Gray & Laidlaw, 2002).
Relationship to Subordinate. Upward and downward communication with
subordinates. Only workers in supervisory positions responded to these items, which
included subordinate responsiveness to downward communication and the extent to
which subordinates initiate upward communication (Downs, 1988; Gray & Laidlaw,
2002).
Media quality. The extent to which meetings are well organized and written
directives are short and clear (Downs, 1988; Gray & Laidlaw, 2002).
Organisational perspective. Information about the organisation as a whole,
which includes notifications about changes, overall policies, and goals of the
organisation (Downs, 1988; Gray & Laidlaw, 2002).
Organisational integration. The degree to which individuals receive
information about their immediate work environment (Downs, 1988; Gray & Laidlaw,
2002).
Communication climate. The extent to which communication in an
organisation motivates and stimulates workers to meet organisational goals (Downs,
1988; Gray & Laidlaw, 2002).
Personal feedback. Information concerning how workers are being judged
and how their performance is being appraised (Downs, 1988; Gray & Laidlaw, 2002).
Relationship to Supervisory. The upward and downward aspects of
communicating with superiors (Downs, 1988; Gray & Laidlaw, 2002).

63
3.2 The Communication Satisfaction Questionnaire (CSQ) Constructs as an Internal
Communication Satisfaction Constructs in Internal Branding Concept
Within the concept of internal branding, studies have shown the relationship between
internal communication dimensions and employees’ brand outcomes. For example, Punjaisri
and Wilson (2007) found that employees who are satisfied with their internal communication,
including channels and training, are high likely to increase employees’ brand outcomes,
including employees’ brand identification, commitment, loyalty, and performance, than those
who are dissatisfied. Additionally, the study of Sharma and Kamalanabhan (2012) found that
there is said to be a positive relationship between internal communication satisfaction,
including messages, channels, feedback, and training, and level of employees’ brand
outcomes, including employee brand identification, commitment, and loyalty; that is, when
internal communication satisfaction is high, employees’ brand outcomes tend to be high.
Some empirical evidence shows that the link between internal communication satisfaction
and employees’ brand attitudes is strong (To et al., 2015), and that there is a significant
positive correlation between these variables. According to To et al. (2015), with regard to
formal and informal internal communication, satisfied employees with both formal and
informal internal communication could lead to feeling good about employees’ brand
attitudes, which, in turn, could raise the level of job satisfaction. According to Karanges et al.
(2015), reflecting on the relationship between internal communication satisfaction and
employees’ brand attitudes, at least one moderating variable - namely internal supervisor
communication – come to mind. With regard to internal supervisor communication, the
correlation between internal communication satisfaction and employees’ brand attitudes is
stronger for groups of employees; they are satisfied with their supervisors’ communication in
the workplace (Karanges et al., 2015).
With regard to the relationship between internal communication satisfaction and employees’
brand behaviour, according to Asha & Jyothi (2013), they found that employees who are

64
satisfied with their internal communication tended to be more effective than employees who
are less satisfied. In a specific sense, as internal communication satisfaction increases, it is
suggested that the employees’ brand behaviour tends to increase, irrespective of the level of
internal communication satisfaction (Asha & Jyothi, 2013).
However, in these studies only the specific internal communication dimensions are related
significantly to employees’ brand outcomes in the concept of internal branding, but they did
not investigate and interpret the internal communication dimensions by using a standardised
instrument. The constructs of the Communication Satisfaction Questionnaire (CSQ)
developed by Downs and Hazen (1977) was considered particularly relevant to this current
study; it was based on the theoretical assumption of internal branding that if an organization
does create internal communication conditions for the provision of a minimum level of
employee satisfaction, one can expect certain outcomes or consequences to follow,
including employees’ brand identification, commitment, loyalty, and performance (Sharma &
Kamalanabhan, 2012). Furthermore, this current study was to evaluate the CSQ applicability
to the concept of internal branding, and implementation in the developing country context.
The rationale for selecting the Downs-Hazen CSQ was the following in the next sections.
3.2.1 The Downs-Hazen CSQ Integrated the Corporate Communication Approaches
with the Internal Branding Approaches
Internal communication has been introduced to the internal branding literature as one of the
crucial corporate communication elements that it will enable receivers or staff members to
deliver the brand promise to the customers at all customer contact points (Punjaisri &
Wilson, 2007).
The study of Riel (1995) has offered three main forms in approaching the corporate
communication: management communication, marketing communication and organizational
communication. To build a successful business, it is even more important to use all

65
communication specialists (management, marketing and organizational communication) as a
means of integrating the organizational message into the customer's mind of the corporate
image, and they in turn improve future corporate performance (Riel, 1995). Management
communication is one of the most significant communication specialists of corporate
communication (Riel, 1995). The definition of management communication by Riel (1995, p.
2) is “communication by (senior) managers with internal and external target groups”.
Marketing communication is considered as the tools an organization uses to deliver the
promotional messages that it had promised to its customers, such as advertising, sales
promotions, direct mail, sponsorship, personal selling and other (communication) elements
in the promotion mix (Riel, 1995, p. 2). The forms of organizational communication are
directed primarily at target groups in order to gain influence over the behaviour of groups on
which the organization depends, for example public relations, public affairs, environmental
communication, investor relations, labour market communication, corporate advertising and
internal communication (Riel, 1995, p. 2).
In three main forms of corporate communication, internal branding becomes a process of
value and meaning creation through the synthesised management and organizational
communication to be endowed to a corporate image. The importance of internal
communication which includes both management communication and organizational
communication is underlined. However, few studies have been carried out to understand the
internal communication constructs in the internal branding concept from the viewpoint of
management and organizational communication approaches. The CSQ constructs
developed by Downs and Hazen (1977) provide both management communication forms
and organizational communication forms. Therefore, the CSQ constructs should be used in
the internal branding concept in order to gain influence over the employees’ brand
performance.
66
3.2.2 The Downs-Hazen CSQ as an Aid in Investigating Effective Internal Branding
It is a common event for internal communication to be evaluated by employees as a means
of developing internal communication systems, with productivity firmly in mind (McKenna,
2012). If the internal communication audits are applied with care, there is usually little
resistance to it, and it can lead only to improvements in internal communication (Riel, 1995).
According to the study of Sharma and Kamalanabhan (2012), it was found that the internal
branding concept aims to develop employee brand attitudes and behaviour through internal
communication satisfaction. Therefore, internal communication satisfaction audits are
considered as a means of developing internal branding, with internal branding outcomes in
mind. Gray and Laidlaw (2002) found that the CSQ constructs are important for the
attainment of an ideal internal communication, because they will assess the direction of
information flows, and all ways of communications. Therefore, the internal communication
satisfaction constructs developed from the CSQ constructs are important for the attainment
of effective internal branding in a company because they can lead only to improvements in
internal communication (Riel, 1995).
The domains of internal communication satisfaction developed from the CSQ constructs are
considered as the criterion or criteria used to measure internal communication satisfaction.
These data throw light on what a company do about internal communication, what
employees know about internal communication, and the role played by internal
communication in helping to develop employees’ brand outcomes. Therefore, the domains of
internal communication satisfaction have been important in creating a focus on ‘effective
internal branding’.
This means that the domains of internal communication satisfaction developed from the
CSQ constructs are the auditing technique that management can consider as an aid in
investigating company communication in the concept of internal branding (Gray & Laidlaw,

67
2002; Riel, 1995). Additionally, according to the study of Punjaisri and Wilson (2007) and
Sharma and Kamalanabhan (2012), it is suggested that the use of audits in the internal
branding concept has become increasingly important.
3.2.3 The Link between the CSQ Constructs and Internal Branding’s Outcomes
Internal communication is argued to be the most important mechanism leading to
employees’ brand outcomes, thereby improving corporate image (Punjaisri & Wilson, 2007;
Riel, 1995). The outcomes of internal communication in the internal branding concept
include employees’ brand attitudes (identification, commitment and loyalty) and employees’
brand performance (Punjaisri & Wilson, 2007). After reviewing the internal communication in
internal branding concept literature, this thesis found that there is a relationship between
each construct of the CSQ with employees’ brand attitudes and employees’ brand
performance in the internal branding concept. Therefore, when management synergise the
seven CSQ constructs, they can better reinforce their employees’ brand performance that
can help a service company identify competitive advantage.
However, the studies of internal communication did not investigate the relationship between
the CSQ constructs and employees’ brand outcomes in the concept of internal branding.
This means that there is a lack of empirical studies to identify the quality of the CSQ
constructs inspiring positive brand attitudes and behaviours among employees within
internal branding contexts.
Taking into account the previous chapter’s theoretical ground the first research objectives is
thus established as follows:
Research Objective 1: To conceptualise the domain of internal communication satisfaction
within the concept of internal branding.
68
In the next section (Section 3.3) will discuss the link between each of the CSQ constructs as
internal communication constructs and employee brand attitudes (identification, commitment
and loyalty) and brand performance. It then discusses the ‘what’ issue of each of the CSQ
constructs and its linkage with employee outcomes before developing into the discussion
about the ‘how’ and the ‘why’ of the constructs. In summary, the Section 3.3 will outline in
detail the first objective and hypothesises.
3.3 Research Objective 1: To conceptualise the domain of internal communication
within the concept of internal branding
Various authors (Punjaisri & Wilson, 2007; Sharma & Kamalanabhan, 2012) show empirical
evidence that the link between internal communication satisfaction and employees’ brand
outcomes are strong. From these studies, this section will discuss the link between each of
the CSQ constructs as internal communication constructs and employee brand attitudes
(identification, commitment and loyalty) and brand performance.
However, the objectives of this current thesis would like to conceptualise the domain of
internal communication in the concept of internal branding by using the constructs of
Communication Satisfaction Questionnaire (CSQ) and to determine the nomological network
of internal branding. In the concept of internal branding (Punjaisri & Wilson, 2007), we focus
on employees-customer interface who are not supervisory personnel and thus do not have
subordinates. Therefore, the subordinate communication sub construct of the CSQ was
eliminated from the study.
Figure 3.1 presents a conceptual framework derived from the literature review and research
hypothesises discussed in the next section.

69
Internal Communication Satisfaction - Communication climate - Relationship to superiors - Organizational integration - Media quality - Horizontal communication - Organisational perspective - Personal feedback
Employees’ Attitudes - Employees’ Brand Identification - Employees’ Brand Commitment - Employees’ Brand Loyalty
Employee Brand Behaviour
Figure 3.1: The Linkages between Internal Communication with Employee Attitudes
and Employee Performance
3.3.1 Communication Climate
Communication climate deals with the general satisfaction with the perceived effectiveness
of the communication atmosphere on both the organizational and individual level (Clampitt &
Downs, 1993). The communication climate is viewed by management as the barometer of
whether employees’ satisfaction toward internal communication are healthy in the
organization or not (Downs & Hazen, 1977). Given the definition of communication climate
by Neher (1996), the communication climate is defined as the perceptions of employees
regarding the quality of the internal communication they experience within their companies.
Communication climate is defined as a process by which the information is communicated
within an organization. It reflects on an individual’s perception and develops an interpretation
of their environment in terms of psychological meaning and significance (Smidts, Pruyn, &
Van Riel, 2001).
Apart from the different key success factors of communication climate, the literature has
revealed a variety of factors deployed in an internal communication campaign. Within the
framework of communication climate studies, the study of Redding (1972) is the first
communication climate study, which has been important in creating a focus on the ideal

70
communication climate. Redding (1972) suggests the five factors, which are important for
attainment of ideal communication climate in an organization. According to the study of
Neher (1996), there are five key success factors of communication; these five factors are
used by management to establish and maintain the positive employee-organization
relationship. When employees are satisfied with these factors of communication climate in
their surroundings, they are more productive.
The five factors of ideal communication climate are identified by Neher (1996) as:
Supportiveness
Participative decision making
Trust, confidence, and credibility
Openness and condor
High performance goals
The first factor, supportiveness, is defined as the feeling of being taken seriously by others
within the organization (Smidts et al., 2001). Janssen (2005) and Wei and Morgan (2004)
have revealed the importance of employees’ perceptions of management supportiveness
and others in the company in developing employees’ innovative behaviour in the workplace.
In addition, Niehoff, Enz, and Grover (1990) have found that the supportiveness of
employees’ management affects employees’ commitment, satisfaction and decision-making.
Employees’ management desired employee attitudes and behaviours need to be consistent
with inspiring a shared vision, supportive employee effort and allowing influence in decision-
making. According to Bartels et al. (2007), the degree of support of both group and
department are associated with employees’ attitudes. The support group and department
were found to have had advantages as far as the collective allocation of work were
concerned, and in encouraging all employees to identify with the common goal (Bartels et

71
al., 2007; McKenna, 2012). Management’s support of employees shifts to all employees,
which was also considered an important variable by Wynia et al. (2010). It would appear that
support of organizational climate is the major function area in employee development that
affects the performance of employees at work. Arif et al. (2012) saw a supportive
communication climate as becoming more employee intensive. In this study, the supportive
communication climate has also been associated with employees’ positive behaviour.
The second factor, participative decision-making, the study of Smidts et al. (2001) found that
boosting employees’ participation and decision-making in the workplace is fundamental for
putting them in a homogeneous group and essential for achieving business goals via team
building. According to the study of Smidts et al. (2001) & Earley and Mosakowski (2000), it
was found that a homogeneous group is the key to providing all employees with equal
access and participation of employees in the decision-making process. They enable
employees to improve their performance and increase company outcomes. According to Arif
et al. (2012), it comes as no surprise that participative decision-making related to tasks
remains the most powerful and useful factor of motivated work behaviour still in existence. It
has been suggested that participative decision-making can engender a sense of
achievement, accomplishment, and recognition (Arif et al., 2012; McKenna, 2012).
The third factor, according to the study of Zeffane, Tipu, and Ryan (2011, p.77), defined trust
as “an expectancy held by an individual or group that the word, promise, verbal or written
statement of another individual or group can be relied upon”. Mellinger (1956) found that
both sender and receiver in two-way communication need to trust each other and the trust
matters in communication between them in order to reduce compliant and aggressive
communication. The study of Gaines (1980) adds that, trust could encourage the distortion
of upward communication. The literature has also recognised the role of employees’ trust in
their supervisors, thereby increasing satisfaction with supervisor communication and
decreasing employees’ negative behaviours such as anti-social behaviours and
72
communication (Chory & Hubbell, 2008; van Vuuren, de Jong, & Seydel, 2007; Zeffane et
al., 2011). These studies summarise the importance of trust as a key dimension of the
communication climate in building employees’ positive behaviours.
The fourth factor, according to the study of Ayoko (2007) and Spaho (2013), implies that
openness and candour are considered as the approach to manage conflict in the
organization. As conflict has potential for misunderstanding, insufficient exchange of
information, and damaging consequences such as disruptive or counter-productive, it is
important that managers are aware of how to manage it (McKenna, 2012). Therefore,
conflict management through a proper communication climate has been identified (Smidts et
al., 2001).
For the fifth factor, “high performance goals”, Neher (1996) views the high standards of
performance as conducive to a positive communication climate. Communication goals have
been significant in promoting employees’ understanding of work motivation. The high
performance goals are basically desirable objectives, the achievement of which is uppermost
in the mind of employees (McKenna, 2012). According to Wynia et al. (2010), it was found
that there was an increase in the level of performance monitoring by management, which led
to a noticeable increase in a positive attitude in the workplace.
Within the framework of five key success factors of communication climate, studies have
demonstrated the link between each of these factors and organizational outcomes.
Employee commitment was significantly related to high performance goals (Welsch, 1981);
participative decision-making factors (Guzley, 1992; Smidts et al., 2001; Welsch, 1981);
communication openness (Abu Bakar, Dilbeck, & McCroskey, 2010; Rogers, 1987;
Trombetta & Rogers, 1988); information adequacy (Trombetta & Rogers, 1988); and
frequency of communication (Brunetto, Farr-Wharton, & Shacklock, 2011). According to the
study of Frenkel et al. (2012), it is suggested that open communications were related to

73
employees’ commitment because openness is interpreted as a sign of worth that boosts
employee self-esteem that partially mediates the relationship between communication
climate and employees’ commitment.
With regards to the relationship between communication climate and employee identification,
it is said that employees who are satisfied with their communication climate, including
openness, participation, and supportiveness, are more likely to establish or maintain a
satisfying relation with others (Bartels et al., 2007; Smidts et al., 2001; Swanson & Kent,
2015).
Many factors of communication climate are responsible for bringing about a change in an
employee’s loyalty. Two factors of an employee’s loyalty change include openness (Dortok,
2006) and participative decision-making (Ruppel & Harrington, 2000). Some empirical
evidence shows there is a link between communication climate and employee performance
(Arif et al., 2012; Lam, Chen, & Schaubroeck, 2002; Wynia et al., 2010). There is said to be
a positive relationship between communication climate and level of employee performance
in that when communication climate satisfaction (e.g. participative decision making) is high,
employee performance tends to be high.
Reflecting on the relationship between communication climate and employees’ outcomes,
this current study found that at least two items from the original items of communication
climate constructs in the CSQ instrument – namely, the ability of people in the organization
to communicate with one another; and handling workplace conflict through communication
channels – come to mind. Forces such as these could improve the relationship between
communication climate and employees’ outcomes (Bakar & Mustaffa, 2013). Additionally,
according to the studies about communication climate, these studies did not investigate the
relationship between the communication climate and employees’ brand outcomes in the
concept of internal branding. Therefore, the relationship between communication climate and
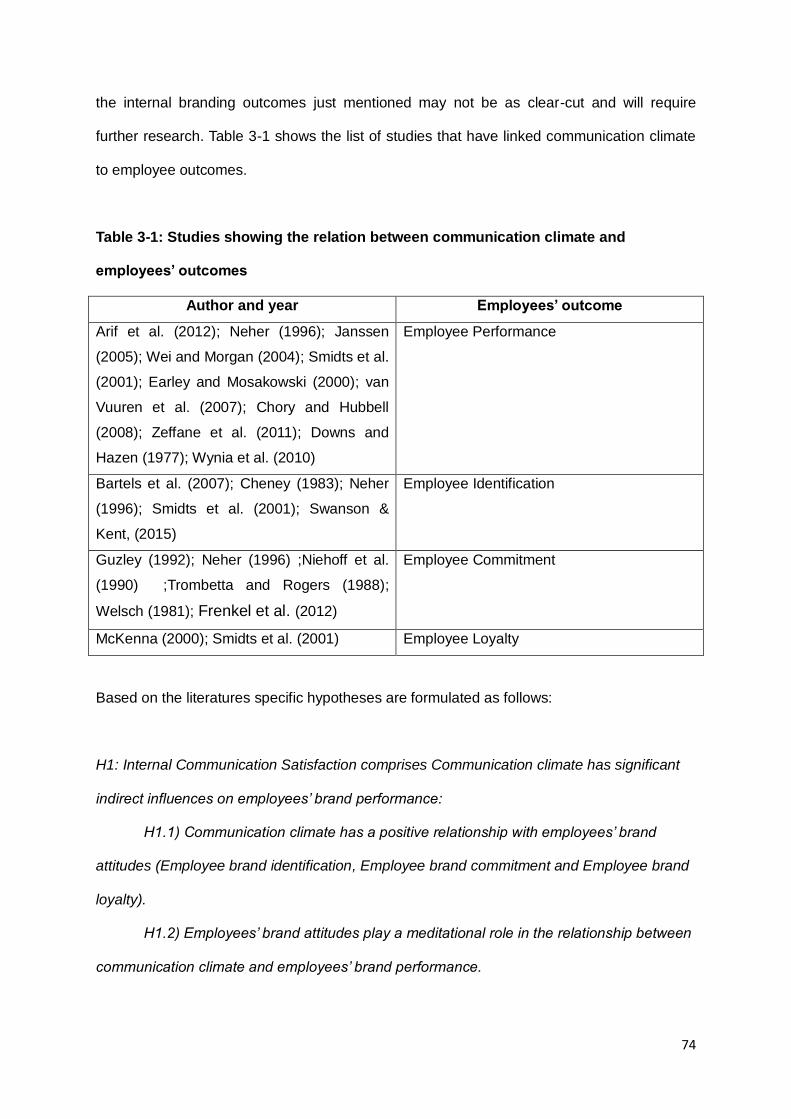
74
the internal branding outcomes just mentioned may not be as clear-cut and will require
further research. Table 3-1 shows the list of studies that have linked communication climate
to employee outcomes.
Table 3-1: Studies showing the relation between communication climate and
employees’ outcomes
Author and year Employees’ outcome
Arif et al. (2012); Neher (1996); Janssen
(2005); Wei and Morgan (2004); Smidts et al.
(2001); Earley and Mosakowski (2000); van
Vuuren et al. (2007); Chory and Hubbell
(2008); Zeffane et al. (2011); Downs and
Hazen (1977); Wynia et al. (2010)
Employee Performance
Bartels et al. (2007); Cheney (1983); Neher
(1996); Smidts et al. (2001); Swanson &
Kent, (2015)
Employee Identification
Guzley (1992); Neher (1996) ;Niehoff et al.
(1990) ;Trombetta and Rogers (1988);
Welsch (1981); Frenkel et al. (2012)
Employee Commitment
McKenna (2000); Smidts et al. (2001) Employee Loyalty
Based on the literatures specific hypotheses are formulated as follows:
H1: Internal Communication Satisfaction comprises Communication climate has significant
indirect influences on employees’ brand performance:
H1.1) Communication climate has a positive relationship with employees’ brand
attitudes (Employee brand identification, Employee brand commitment and Employee brand
loyalty).
H1.2) Employees’ brand attitudes play a meditational role in the relationship between
communication climate and employees’ brand performance.
75
3.3.2 Relationship to Superiors
From the organizational behaviour literature, the relationship to supervisors has been
regarded as the support of people (social support) for achieving the individual’s sense of
personal worth and enhancing their feeling of importance (McKenna, 2012). Neher (1996)
argues that the relationship with superiors is important to create a sense of teamwork among
employees and increase self-managed teams. This relationship is often central in
determining employees’ satisfaction and motivation in the company (Neher, 1996). Rogers,
Clow et al. (1994, p.14) have proposed that, “without effective communications (between
supervisors and employees), employee job satisfaction suffers as well as the quality of the
service encounters between the firm’s employees and the firm’s customers”. This clearly
suggests that the communication between supervisors and employees impacts not only
employees’ attitudes but also employees’ behaviour. According to Bakanauskienė et al.
(2015), there is empirical evidence to show that the link between supervisory communication
and employees’ positive attitudes is strong. Reflecting on the relationship between
supervisory communication and employees’ positive attitudes, there are at least five
moderating variables, i.e. informal communication with supervisors, attaining complete and
accurate information by a supervisor, providing reliable information by a supervisor,
openness of the supervisor, and providing the vast majority of daily information by a
supervisor (Bakanauskienė et al., 2015). Forces such as these could improve the
relationship between supervisory communication and employees’ positive attitudes.
According to the study of Khabir (2014), the role of supervisor (competent or friendly) has a
positive impact on employees’ commitment, identification, and loyalty. Similarly, the study of
McKenzie (2015), found that effective supervisory communication has influence on
employees’ morale, commitment, and motivation.
According to the corporate communication literature, supervisor refers to anyone who is
authorized to exert influence on internal target groups, resulting in access to resources that
are fundamental for an organization (Preffer & Salancik, 1978; Riel, 1995). Past studies in
76
organization communication have revealed that supervisor communication is capable of
building employees with positive attitudes and performance (Brunetto & Farr-Wharton, 2004;
Hawabhay, Abratt, & Peters, 2009; McKenzie, 2015; Power & Rienstra, 1999; Tukiainen,
2001; van Vuuren et al., 2007). The reserchers show that supervisor communication has a
fairly strong effect on employees’ performance because it has potential for reducing
misunderstandings, discrepancies and conflict between departments, groups or individuals
(Cheney, 1983; Gilly & Wolfinbarger, 1998; McKenna, 2012; Smircich & Morgan, 1982).
According to the organization communication literature and corporate communication
literature, this study found that two broad categories of supervisor communication are used
by supervisors to bring messages down the line; they are identified as follows: 1.)
characteristics of information used by supervisors; and 2.) supervisor communication
behaviour, which establishes effective communication with staff.
The information from their immediate supervisors became the tools and techniques
employed in creating high performance employees (Pincus, Rayfield, & Cozzens, 1991).
Many organizational communication researchers recommend accurate information from
supervisors as tools to build employees’ commitment (Abu Bakar et al., 2010; Whitener et
al., 1998; and McKenzie, 2015). However, according to the supervisor communication
literature, these studies show the importance of supervisor communication behaviour rather
than characteristics of information used by supervisors in order to establish effective
communication with staff members.
With regards to the relationship between supervisor communication and employees’
attitudes, it is said that employees who are satisfied with supervisor communication
behaviour, including open in communication (Jablin, 1979; Whitener et al., 1998),
explanations for decisions (Whitener et al., 1998), interaction patterns (Jablin, 1979),
effective supervisory communication (Shipton et al., 2015); the supervisor-subordinate
77
relationship (Lam et al., 2015); supervisory communication behaviour (Wallace et al., 2013)
and supervisor’s characteristics (Jablin, 1979), are more likely to be committed to the
organization than those who are dissatisfied.
There is said to be a direct relationship between employee satisfaction with supervisor
communication and level of identification, that is, when employee satisfaction is high,
identification tends to be high (Elving, 2005; Gu et al., 2015; Unzicker et al., 2000).
According to the study of Gkorezis et al. (2015), it was found that the positive employee–
supervisor relationship has influence on employees’ identification with organizational
strategies. The relationship between employee satisfaction with supervisor communication
and identification could be moderated by the importance of supervisor communication
behaviour, which is the quality of the supervisor’s communication (Elving, 2005; Unzicker et
al., 2000). In the internal branding literature, Punjaisri et al., (2013) show that there is a
correlation between the employee–supervisor relationship and employees’ brand
identification. It is a two-way communication process thereby the supervisors provide up-to-
date information about corporate brand to all members, and the latter are given the
opportunity to ask questions (McKenna, 2012; Punjaisri et al., 2013).
Employee loyalty arises when employees perceived importance of their job and supervisors
have a good relationship with every employee (McKenna, 2012). These variables include
supervisors’ communication skills (Khabir, 2014; Therkelsen & Fiebich, 2004; Tjosvold,
1984; van Vuuren et al., 2007); the management’s recognition of the importance of
employee life (Smith & Rupp, 2002); showing confidence in employees’ abilities (Therkelsen
& Fiebich, 2004); and cooperating with employees (Therkelsen & Fiebich, 2004). Salleh et
al. (2013) add that good communication between supervisors and employees could
encourage employees’ brand loyalty to both organization and customers. Because of good
communication between supervisors and employees a good business environment is
created that is perceived as positive for performance. Furthermore, the supervisor

78
communication behaviour factors might consider attempts to establish the causes of job
satisfaction. These factors include effective supervisory communication (Kim, 2002) and the
supervisor’s open communication (Eisenberg, 2009). Yuan et al. (2006) conclude that when
employees and supervisors can communicate effectively, job satisfaction will take place,
which is followed by employees’ loyalty.
According to the above discussion, the dimensions of supervisor communication in these
studies usually correlate with the items of relationship with supervisor construct of the CSQ
instrument. Additionally, considerable research has been done to establish the relationship
between supervisor communication and employees’ outcomes (e.g. identification,
commitment, loyalty and performance). However, these studies did not investigate the
relationship between supervisor communication and employee’s outcomes in the concept of
internal branding.
Furthermore, according to the organization communication literature, the organizational
behaviour scholars predict that both supervisors’ sense of humour and supervisor appraisal
would play an intervening role in the relationship between relationship to supervisor and
organization outcomes (Breeze, Dawson, & Khazhinsky, 2002; McKenna, 2012). According
to the study of Breeze et al. (2002), which was conducted on around 2,500 employees, it
was shown that when supervisors use humour in communication in the workplace it can
reduce stress and increase employee satisfaction and commitment. Additionally, the
supervisor is often considered to be the most important person for the role of evaluator of a
subordinate’s performance (McKenna, 2012). The supervisor as evaluator could help a
subordinate to achieve the objectives set for him or her for the period under review and
relevant to the organization. McKenna (2012) found that informal feedback about their
progress and resolving performance problems from superiors on a frequent basis is a key
factor that motivates employees to achieve their objective and affect employees’
performance. However, these studies did not investigate or interpret the humour in

79
communication and supervisor appraisal in the development of relationship to superiors
constructs. Table 3-2 shows the list of studies that have linked relationship to superiors to
employees’ outcomes.
Table 3-2: Studies showing the relation between relationship to superiors and
employees’ outcomes
Author and year Employees’ outcome
Johlke and Duhan (2000); Kim (2002) Employee Performance
Elving (2005); Downs and Adrian (2012);
Unzicker et al. (2000); Gkorezis et al. (2015);
Punjaisri et al., (2013); Khabir (2014)
Employee Identification
Abu Bakar et al. (2010); Breeze et al. (2002);
Jablin (1979); Jablin (1979); Whitener et al.
(1998); Yoshimura (2003); McKenzie (2015);
Shipton et al. (2015); Lam et al. (2015);
Wallace et al. (2013); Khabir (2014)
Employee Commitment
van Vuuren et al. (2007); Therkelsen and
Fiebich (2004); Tjosvold (1984); Smith and
Rupp (2002); Khabir (2014); Salleh ei al.
(2013); Yuan et al. (2006)
Employee Loyalty
As such, the following specific hypotheses are established:
H2: Internal Communication Satisfaction comprises Relationship to superiors has indirect
influences on employees’ brand performance:
H2.1) Relationship to superiors has a positive relationship with employees’ brand
attitudes (Employee brand identification, Employee brand commitment and Employee brand
loyalty).
H2.2) Employees’ brand attitudes play a meditational role in the relationship between
relationship to superiors and employees’ brand performance.

80
3.3.3 Organizational Integration
The definition of organizational integration by Byrne and LeMay (2006) states that, it “refers
to satisfaction of information individuals receive about the organization and their immediate
job environment”. Clampitt and Downs (1993) and Downs and Hazen (1977) defined
organizational integration as the extent to which employees receive information about the
immediate work environment, such as information about department plans, the employees’
progress benefits, the requirements of their jobs, personnel news, and providing information
that can make staff members feel they have been integrated. According to the defections of
organizational integration by Byrne and LeMay (2006) and Downs and Hazen (1977), this
current study found that organizational integration provides specific information about
employees’ immediate work environment and effort to develop a workforce that is integrated
with a set of organizational values and objectives.
From the organization communication literature, the following characteristics are evident
across the organization integration constructs: the quality of the information; and types of
presentation information. Ebren (2006) suggests that, the companies have attained higher
levels of customer satisfaction when they help employees feel like a valuable part of the
company, by informing them about employees’ immediate work environment. Within the
framework of the quality of the information, studies have demonstrated the link between the
quality of information about employees’ immediate work environment and organizational
outcomes. According to internal branding literature, Kumar & Pansari (2014) found that there
is a significant positive correlation between qualities of information about a
company delivering on its brand promise and employees’ brand outcomes. It was found that
organizations with more satisfied employees with information about organizational
integration tended to have more positive employees’ brand outcomes, which include
employees’ commitment, identification, loyalty, and performance. According to the internal
communication literature, the quality of task-related communication was significantly related
to employees’ commitment, employees’ identification (Byrne & LeMay, 2006), employee’s

81
loyalty (Byrne & LeMay, 2006; Murthy & Guthrie 2013), and employee performance (Baker et
al., 2014; Ebren, 2006; Murthy & Guthrie 2013; Pincus, 1986). Furthermore, the study of
Henkel, Tomczak, Heitmann, and Herrmann (2007) found that types of presentation
information about employees’ immediate work environment (e.g. information booklets,
manual of branding, hand out) has an important influence on employee identification.
Similarly, the study of Baker et al. (2014), that employees who are satisfied with their
information about brand knowledge are more likely to demonstrate behaviours that are
consistent with the brand promise of their company.
According to the studies above, if an organization does provide information about the
immediate work environment for provision of a minimum level of internal communication
satisfaction, one can expect certain outcomes or consequences to follow, such as
employee’s commitment, employee’s identification, employee’s loyalty and employee’s
performance. However, these studies did not investigate the relationship between
organizational integration dimensions and employees’ brand outcomes in the concept of
internal branding. Furthermore, according to the original items of organizational integration
from the CSQ instrument, this current study found that the original items of this construct
include only the quality of the information, not the types of presentation information. These
findings point to the need for further research on the relationship between organizational
integration and internal branding outcomes. Table 3-3 shows the list of studies that have
linked organizational integration to organizational outcomes.

82
Table 3-3: Studies showing the relation between organizational integration and
employees’ outcomes
Author and year Employees’ outcome
Baker et al. (2014); Pincus (1986); Ebren
(2006); Kumar & Pansari (2014)
Employee Performance
DeCotiis and Summers (1987); Guest and
Conway (2002); King and Grace (2010);
Ridder (2004); Thomson and Hecker (2001);
Kumar & Pansari (2014)
Employee Commitment
Henkel et al. (2007); Kumar & Pansari (2014) Employee Identification
Clampitt and Downs (1993); Murthy &
Guthrie (2013); Kumar & Pansari (2014)
Employee Loyalty
Therefore, the following hypotheses are specified as:
H3: Internal Communication Satisfaction comprises Organizational integration has indirect
influence on employees’ brand performance:
H3.1) Organizational integration has a positive relationship with employees’ brand
attitudes (Employee brand identification, Employee brand commitment and Employee brand
loyalty).
H3.2) Employees’ brand attitudes play a meditational role in the relationship between
organizational integration and employees’ brand performance.
3.3.4 Media Quality
Downs and Hazen (1977) have underlined the concept of media quality as the media for
employee communication, which they need to become the effective media communication
and to have success in improving positive employee outcomes. They add that management
can attempt to create effective employee communication media through the meetings that
are well organized, conciseness of reports, and an adequate amount of communication
(Clampitt & Downs, 1993; Downs & Hazen, 1977).

83
Apart from the different communication media items of the media quality constructs in the
organization communication literature, they have revealed a variety of communication media
deployed in an internal communication campaign. From the organization communication
literature, two broad categories of communication media are used by management to
communicate messages to all staff members; they are identified as follows:
1.) Oral and written communication; and
2.) Information and communication technology (ICT).
The use of oral communication within an organization means face-to-face conversation in a
small group, or a telephone conversation, or social media conversation, and it provides the
sender with feedback, answers and the ability to ask questions and provide more information
by way of clarification (McKenna, 2012). According to the study of Silverman (2010), it was
found that face-to-face communication was preferred by most employees, because it allows
the sender or original speaker the opportunity to observe feedback, answer questions from
receiver or original listener, and provide additional information by way of clarification
(McKenna, 2012). Moreover, face-to-face communication can help businesses develop a
social context in a company to lead to a decreased negative tone that includes assertive and
hostile language in computer-mediated communication (Siegel, Dubrovsky, Kiesler, &
McGuire, 1986; Sproull & Kiesler, 1986). In terms of organization communication, Power and
Rienstra (1999) and Tukiainen (2001) have provided empirical evidence that face-to-face
communication has an influence on employees’ attitudes. However, a disadvantage of oral
communication is the absence of a written record of the dialogue. The written
communication has been observed by Howard (1998) and McKenna (2012) to be mostly
used as a back-up for oral communication. For example, a formal meeting, which consists of
the spoken and written word, enables the employees to respond and perform their jobs in
the workplace. The written component is creating a meeting agenda, comments on the
minutes of the last meeting, and papers distributed previously or on the day. McKenna
(2012) found that written communication can provide more information to the receiver by this
84
means than through oral communication because this method is somewhat more time-
consuming than the spoken word. Additionally, written communication provides an
opportunity for the sender to observe feedback and to provide clarification. According to the
study of Baker et al. (2014) and McKenna (2012), the written component is the use of brand
book and newsletters allowing the communicator to organise his or her thoughts carefully.
The study of Baker et al. (2014) discovered that both brand book and newsletters as a way
of communicating may affect the level of employees’ brand performance. Therefore, both
oral and written communication were significantly related to employee commitment (Asif &
Sargeant, 2000; Stein, 2006); employee identification (Henkel et al., 2007); employee loyalty
(Gill, 2011) and employee performance (Baker et al., 2014).
The use of information and communication technology (ICT) reflects the application of new
technology to the communication of information. The ICT includes computerized information-
processing systems, new forms of telecommunications systems, and a combination of the
two (McKenna, 2012). McKenna (2012) has enlisted these ICT tools; namely, faxing, e-
mailing, home banking, video conferencing on PCs, along with mobile phones offering
voicemail, text messaging, and PC integration. The new technology can assist organizations
with the dissemination of new ideas and practices, and in the process organizations will
become knowledge-based learning organizations (McKenna, 2012). According to the
literature, the new technology satisfaction of employees positively influences employee
identification (De Bussy, Ewing, & Pitt, 2003; Henkel et al., 2007) and employee commitment
(Asif & Sargeant, 2000). Similar to the study of Omilion-Hodges & Baker (2014), it was found
that both new media technologies and social media can assist in shaping employees’
identification with their organization.
According to the above literature, this current study can conclude that the constructs of
media quality in internal communication need to have both oral and written communication
and information and communication technology (ICT) items in order to develop internal

85
stakeholders that are committed, loyal and identify with the company’s values and goals.
Recently, the studies of Asif and Sargeant (2000); Baker et al. (2014); Henkel et al. (2007);
and Omilion-Hodges & Baker (2014) supported that internal communication using both oral
and written communication and the new technology enhances employees’ attitudes and
performance. However, the media quality constructs of the CSQ, developed by Downs and
Hazen (1977), did not include the information and communication technology (ICT) items in
the development of internal communication constructs. Furthermore, according to the
organization communication literature, these studies did not investigate the relationship
between media quality and employees’ brand outcomes as part of the concept of internal
branding. Based on this evidence therefore, it is salient to include information and
communication technology (ICT) items in internal communication constructs, especially in
the concept of internal branding context. Table 3-4 shows the list of studies that have linked
media quality to organizational outcomes.
Table 3-4: Studies showing the relation between media quality and employees’
outcomes
Author and year Employees’ outcome
Daft and Lengel (1983); Daft, Lengel, and
Trevino (1987); Baker et al. (2014)
Employee Performance
Stein (2006); Fornes, Rocco, and Wollard
(2008); Downs and Adrian (2012); Ridder
(2004); Asif and Sargeant (2000)
Employee Commitment
De Bussy et al. (2003); Henkel et al. (2007);
Omilion-Hodges & Baker (2014)
Employee Identification
Smith and Rupp (2002); Gill (2011); De
Bussy et al. (2003); Daft et al. (1987)
Employee Loyalty
Therefore, the following specific hypotheses under these literatures are formulated as
follows:
86
H4: Internal Communication Satisfaction comprises Media quality has indirect influence on
employees’ brand performance:
H4.1) Media quality has a positive relationship with employees’ brand attitudes
(Employee brand identification, Employee brand commitment and Employee brand loyalty).
H4.2) Employees’ brand attitudes play a meditational role in the relationship between
media quality and employees’ brand performance.
3.3.5 Horizontal Communication
Horizontal communication relates to satisfaction with co-worker communication relationships
in the organization (Downs & Adrian, 2012; Riel, 1995). It involves the extent to which people
and informal communication is precise and flowing between people (Downs & Hazen, 1977).
The study of Van den Bosch, De Jong, and Elving (2004) considered horizontal
communication as one dimension of knowledge sharing in organizational communication
that provides information needed to adequately perform in the job. It helps employees to
absorb and understand their job information. From the point of view of knowledge sharing
theory, organizational knowledge can be obtained from translating employees' knowledge
and employees’ experience into others though horizontal communication (van den Hooff &
De Ridder, 2004). Within the knowledge sharing theory, the view of knowledge sharing
through horizontal communication seems to recognise the significance of both knowledge
donating and knowledge collecting perspectives to deliver positive organizational
performance. Knowledge donating is, “communicating to others what one’s personal
intellectual capital is” and knowledge collecting is “consulting colleagues in order to get them
to share intellectual capital” (van den Hooff & De Ridder, 2004, p.18). van den Hooff and De
Ridder (2004) illustrate that actively communicating to others that which one knows and
actively consulting others in order to learn what they know means integrating employees in a
coherent way and helping them to improve employees’ performance. The power of horizontal
communication in knowledge sharing has been underlined by Asif and Sargeant (2000), as

87
they view horizontal communication as one of the important predictors of the atmosphere for
communication in organizations. Horizontal communication helps management in increasing
knowledge exchange and developing relationships in organizations (Asif & Sargeant, 2000).
McKenna (2012) adds that horizontal communication, as informal organizational
communication or grapevine, can potentially be used to supplement formal communication
channels for organizations. McKenna (2012) proposes that a number of factors give rise to
the formation of grapevine. The first factor is the lack of information though the formal
communication channels. The second is employees feel insecure when talking with each
other so they build a bulwark against likely threats. The third is the issue of conflicts and
tensions between subordinates and supervisors, which can give rise to people
communicating about the issues informally. The fourth is the feeling of distrust and dislike
between people, the protagonists will use the grapevine to gain advantage by informally
circulating negative information about their opponents. The fifth is the informal
communication, which is often faster than formal communication and has the advantage of
being personal. However, McKenna (2012) has remarked that horizontal communication is
generally the carrier of incomplete and inaccurate information that creates negative side-
effects, for example dissatisfaction and anxiety.
Some authors of the knowledge sharing theory (Hall, 2001; Jarvenpaa & Staples, 2001;
Meyer, 1997; van den Hooff & De Ridder, 2004) strongly believe that horizontal
communication is a tool for management to create employees’ commitment. It helps an
organization to facilitate how employees link the organizational knowledge with their
attitudes and behaviours. McKenna (2012) has considered horizontal communication as a
strong device to improve employee commitment because the grapevine can actually
increase morale when it transmits positive information about the organization. Parolia,
Goodman, Li, and Jiang (2007) say that, horizontal communication can increase the level of
leadership empowerment and knowledge transfer and help to develop employee
88
commitment. Similarly, there are many other researchers who argued that horizontal
communication impacts on employee commitment (Asif & Sargeant, 2000; Thomson &
Hecker, 2001).
When every member in an organization shares an understanding of the positive information
about an organization through informal communication channels, the employees’
identification can be positively enhanced (McKenna, 2012; Gkorezis et al., 2015; Wallace,
1995). According to McKenna (2012), horizontal communication can best serve as a bridge
linking information about the organization and employees’ identification because the informal
communication provides organizations with a feeling of security and belonging, which in turn
become employees’ identification. With respect to specific horizontal communication factors
related to employees’ identification, Chan & Mak (2014, p.24) have suggested that
effectively communicating with co-workers - such as “Listens to me when I have to get
something off my chest,” “Takes time to listen to my problems and worries,” and “Takes a
personal interest in me.” – are more capable of increasing employees’ identification.
According to Galbraith (1973), horizontal communication contributes to employee
identification, with employees from different parts of an organization working in a
collaborative effort. According to Ashforth and Mael (1989), using horizontal communication
with colleagues can help employees adopt the characteristics of the group in order to sustain
a valued relationship. According to the study of Guerber et al. (2014), it was found that the
horizontal communication can arise spontaneously within an organization, and can be seen
to make a contribution in terms of increasing employees’ identification. Similar to the study of
Gkorezis et al. (2015), the relationship between the employee-co-worker relationship and
employee’s identification was introduced and illustrated. The positive employee-co-worker
relationship could enhance the level of employees’ identification. Lin et al. (2013) conclude
that an important consideration for the use of horizontal communication as an approach is
the belief that caring actions by co-workers might increase employee’s identification with the
organization as well as the felt obligation to reciprocate.

89
According to the study by Levine and Moreland (1990), communicating with colleagues
within a group can create employee loyalty. McKenna (2012) has revealed that horizontal
communication is capable of reducing negative emotions in the employees because
grapevine enables an employee to relieve frustration and stress in situations where anger
cannot be realistically directed at an authority figure and it significantly affects employees’
loyalty. Additionally, Meyer (1997) concluded that information from horizontal communication
leads to attraction and cohesiveness to sub-units in the organization. According to the study
of Narteh & Odoom (2015), it has been revealed that employees’ interpersonal
communication satisfaction is capable of increasing employees’ loyalty because employees’
satisfaction affects loyalty toward their workplace.
McKenna (2012) views the grapevine both as a constant reminder to managers to be
professional in their managerial role and as a feedback mechanism to help managers
understand employees’ problems in the workplace. This means that the manager’s
ineptitude and inefficiency can be highlighted by horizontal communication channels and
they provide managers with knowledge of how employees generally provide problems.
Therefore, horizontal communication helps managers build effective management and to
understand employees’ problems that can help employees increase their performance.
According to a group of authors (Bratton & Gold, 1994; Richmond, McCroskey, &
McCroskey, 2001; Yammarino & Naughton, 1988), the horizontal communication channels
become a device that assists organizations in increasing employees’ performance because it
focuses on employee satisfaction, morale and the level of effort expended by employees.
According to the above literature, this current study found that these items of horizontal
communication are not much different comparing with items of this construct from the CSQ
instrument of Downs and Hazen (1977). From the above discussion, the following
characteristics are evident across the horizontal communication constructs: the
communication atmosphere between physician colleagues; the accurate and free flow of
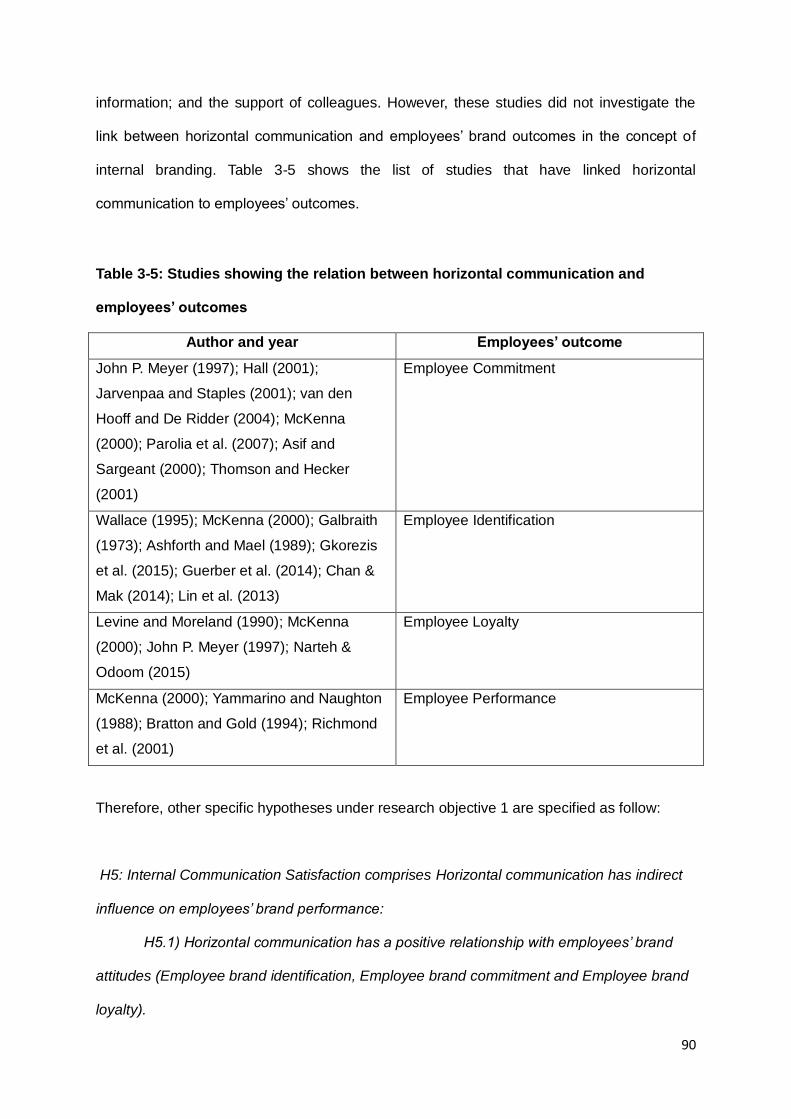
90
information; and the support of colleagues. However, these studies did not investigate the
link between horizontal communication and employees’ brand outcomes in the concept of
internal branding. Table 3-5 shows the list of studies that have linked horizontal
communication to employees’ outcomes.
Table 3-5: Studies showing the relation between horizontal communication and
employees’ outcomes
Author and year Employees’ outcome
John P. Meyer (1997); Hall (2001);
Jarvenpaa and Staples (2001); van den
Hooff and De Ridder (2004); McKenna
(2000); Parolia et al. (2007); Asif and
Sargeant (2000); Thomson and Hecker
(2001)
Employee Commitment
Wallace (1995); McKenna (2000); Galbraith
(1973); Ashforth and Mael (1989); Gkorezis
et al. (2015); Guerber et al. (2014); Chan &
Mak (2014); Lin et al. (2013)
Employee Identification
Levine and Moreland (1990); McKenna
(2000); John P. Meyer (1997); Narteh &
Odoom (2015)
Employee Loyalty
McKenna (2000); Yammarino and Naughton
(1988); Bratton and Gold (1994); Richmond
et al. (2001)
Employee Performance
Therefore, other specific hypotheses under research objective 1 are specified as follow:
H5: Internal Communication Satisfaction comprises Horizontal communication has indirect
influence on employees’ brand performance:
H5.1) Horizontal communication has a positive relationship with employees’ brand
attitudes (Employee brand identification, Employee brand commitment and Employee brand
loyalty).
91
H5.2) Employees’ brand attitudes play a meditational role in the relationship between
horizontal communication and employees’ brand performance.
3.3.6 The organizational perspective
According to the study of Downs and Hazen (1977), organizational perspective deals with
information about the organization as a whole, such as information about the corporation’s
financial standing, organizational change, and organizational policies and goals (Clampitt &
Downs, 1993; Downs & Hazen, 1977; Meintjes & Steyn, 2006).
McKenna (2012) has considered the organizational perspective as an internal
communication strategy that provides information to help managers and employees manage
organizational change. The organizational perspective of communicating organizational
change provides employees with the logic of the change and it can reduce employee
resistance in the workplace. The source of employee resistance lies in misinformation or
poor communication. Therefore, the effective organizational perspective can provide an
organization with all the significance of reducing misunderstandings and employee
resistance and increased employee performance also were reflected (McKenna, 2012).
Ridder (2004) classifies information about employees into two categories: non-task-related
information and task-related information. The organizational perspective aims to share
information about non-task-related information, which is related to organizational policies
and goals. Ridder (2004) found that the higher quality of non-task-related information is
related with a positive attitude toward the job because non-task-related information (e.g.
information about goals and organizational policy) is a powerful motivational device in the
sense that it can help employees work towards meeting organizational goals (McKenna,
2012; Ridder, 2004).

92
According to Jeavons (1994), communication of organizational values or vision/ mission will
improve employee identification and raise employee productivity because it is important for
employees in an organization to understand how their work supports the vision/ mission of
the company. According to Hilton & Sherman (2015), the key elements of organizational
perspective are identifying the vision/ mission of the organization, the achievement of which
will bring about the attainment of organizational goals or employees’ identification.
Additionally, communicating organizational change has been put forward as ways of
controlling resistance to change. According to Edwards & Edwards (2012), it was found that
negative employee reaction to organizational change in general can cause a lack of
employees’ organization identification.
In Rho et al. (2015), communication of organizational values or vision/ mission is the best
predicted by their identification. The information about organizational values can deal with
employees’ feeling of self-worth in terms of organizational membership or employees’
identification. Additionally, the strength of employees’ identification with their organization is
positively associated with employees’ brand behaviour (Rho et al., 2015).
The recent research of Mullane (2002) has put the vision/ mission statement under the
spotlight. The vision/ mission statement views the useful tools for enhancing employee
performance. Bart, Bontis, and Taggar (2001) have even stated that the communication
mission statement could guide employees to achieve positive behaviour. Some empirical
evidence shows that the link between communicating information about the vision/mission
statement and employees’ performance is strong (Juriova & Durkova, 2012). When
employees can understand exactly what the company want to be in the future through the
vision/mission statement, corporate culture will take place, which is followed by employees’
performance (Juriova & Durkova, 2012).

93
According to Foote, Seipel, Johnson, and Duffy (2005), there is a relationship between
employee commitment and organizational policies. This study suggested that the company
should communicate organizational policies to employees because this helps them to
consider what is right or wrong in employees’ behaviour. Similarly, a study of Diamond
(1992) concluded that communication organizational policies can develop employee
commitment because these policies are in line with employees’ personal values.
Furthermore, McDonald (1996) and Foreman (1997) argued that an understanding of the
company’s objectives and goals impacts on employee commitment. Similarly, Thomson and
Hecker (2001) concluded that knowledge about organizational policies and goals impacts on
employee commitment.
Studies of Ridder (2004) have posited that the organizational perspective that offers
information about goals, organizational problems and organizational policy become the key
to building a long-lasting relationship with employees. That is, the organizational perspective
impacts on employee loyalty.
According to the literature above, this current study can conclude that the organizational
perspective items from these studies (including information about company’s policies and
goals; company changes; and company's financial standing) are characterised similarly on
organizational perspective constructs in the CSQ of Downs and Hazen (1977). However,
these studies did not investigate and interpret the items from the CSQ listed as the
information about government policies and regulations affecting their business, and
accomplishments and/ or failures of these businesses. Furthermore, these studies did not
explore the relationship between the organizational perspective and employees’ brand
outcomes to find out how they relate to each other independently of the internal branding
outcomes. Table 3-6 shows the list of studies that have linked organizational perspective to
employee outcomes.
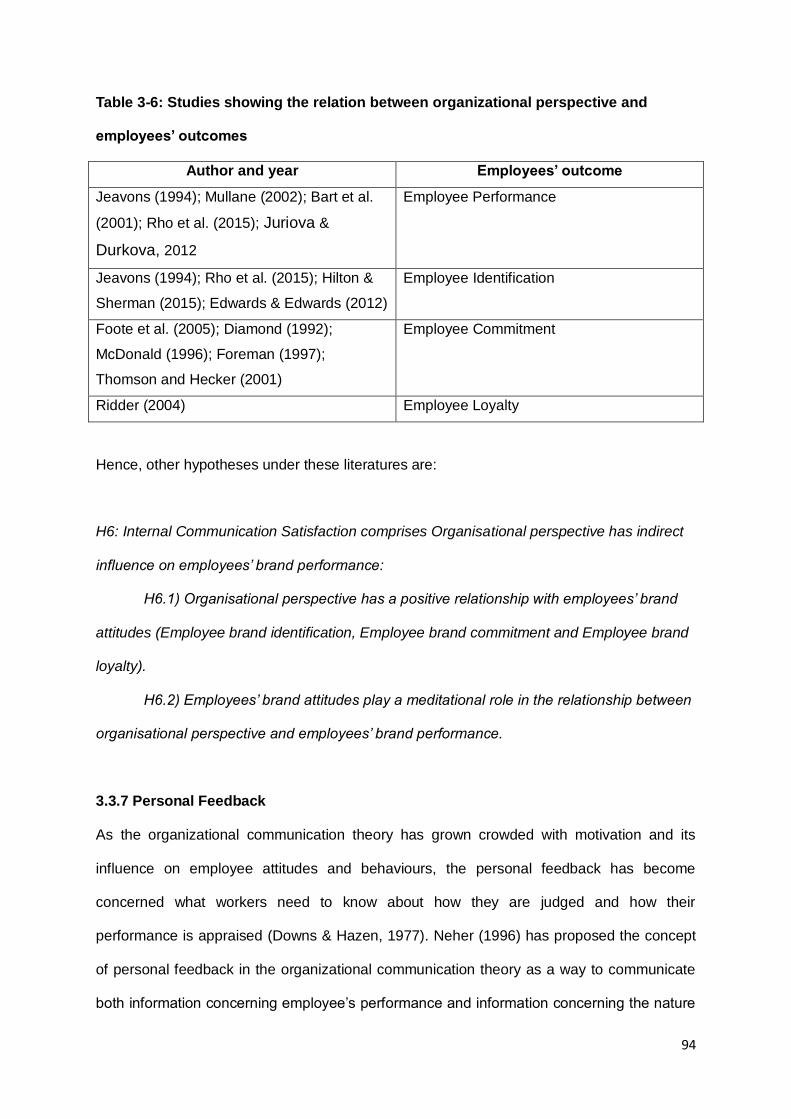
94
Table 3-6: Studies showing the relation between organizational perspective and
employees’ outcomes
Author and year Employees’ outcome
Jeavons (1994); Mullane (2002); Bart et al.
(2001); Rho et al. (2015); Juriova &
Durkova, 2012
Employee Performance
Jeavons (1994); Rho et al. (2015); Hilton &
Sherman (2015); Edwards & Edwards (2012)
Employee Identification
Foote et al. (2005); Diamond (1992);
McDonald (1996); Foreman (1997);
Thomson and Hecker (2001)
Employee Commitment
Ridder (2004) Employee Loyalty
Hence, other hypotheses under these literatures are:
H6: Internal Communication Satisfaction comprises Organisational perspective has indirect
influence on employees’ brand performance:
H6.1) Organisational perspective has a positive relationship with employees’ brand
attitudes (Employee brand identification, Employee brand commitment and Employee brand
loyalty).
H6.2) Employees’ brand attitudes play a meditational role in the relationship between
organisational perspective and employees’ brand performance.
3.3.7 Personal Feedback
As the organizational communication theory has grown crowded with motivation and its
influence on employee attitudes and behaviours, the personal feedback has become
concerned what workers need to know about how they are judged and how their
performance is appraised (Downs & Hazen, 1977). Neher (1996) has proposed the concept
of personal feedback in the organizational communication theory as a way to communicate
both information concerning employee’s performance and information concerning the nature

95
of the personal relationship between leaders and members within an organization. In this
way, the maintenance of a positively valued relationship is able to create a positive
organizational climate, higher levels of satisfaction on the part of both parties, and higher
levels of productivity (Neher, 1996). According to Maanen and Katz (1976), studies found
that personal feedback is associated with employees’ performance. These results suggest
that the degree to which an employee receives clear information about their jobs can affect
employees’ performance.
Neher (1996) argues that personal feedback is interpreted as positive and negative
outcomes. The positive feedback creates a positive behaviour for employees and keeps
them doing what they are doing. In other words, the negative feedback does desist an
employee from current behaviour. According to the study of Katz (1978), it was found that
positive feedback has an impact on employee satisfaction. When the employee is strongly
satisfied with the organization, agrees with its objectives, and is willing to expend effort on its
behalf (McKenna, 2000), positive feedback can provide employees with a sense of
commitment (Larson, 1989; McKenna, 2000). Similarly, according to Steers (1977) and
Porter and Steers (1973), the amount of feedback provided on the job influences employee
commitment. The studies pointed out that the feedback should include satisfaction with
management, how management is judged and how employees’ performance is appraised.
According to Daft et al. (1987) and Neher (1996), feedback from employees’ managers
makes employees feel a strong sense of identification with the organization because the
personal feedback induces employees of a company to identify their own needs and
interests with those of the company (Neher, 1996). Additionally, many other researchers
(Burris et al., 2014; Young & Steelman, 2014; Ibarra, 1999; Swann, 1987) found that giving
positive feedback to employees can make them develop employee identification, and hence
improve employee performance. Therefore, employees can create and deliver brand value
to meet the needs of a customer.

96
A study by Greenbaum, Clampitt, and Willihnganz (1988) and McKenna (2012) found that
the information produced by the personal feedback system can convey that an employee
should be considered for extra rewards, or is in need of additional training, or is so seriously
deficient in the necessary skills to do the job. Therefore, the personal feedback can be of
benefit to employees and increases employee loyalty (Greenbaum et al., 1988; Neher,
1996). Similarly, according to Narteh & Odoom (2015), there is said to be a positive
relationship between the satisfaction of employees with personal feedback and level of
employees’ loyalty that is when personal feedback satisfaction is high, employees’ loyalty
tends to be high. Furthermore, various authors support that both praise and feedback in the
workplace for employees have a strong relationship with the development of employee
loyalty (Daft et al., 1987; Eisenberger, Fasolo, & Davis-LaMastro, 1990; Goleman, 1998;
Ross & Zander, 1957)
From the above discussion, the following characteristics are evident across the existing
personal feedback constructs: feedback from job (Katz, 1978; King Jr, Lahiff, & Hatfield,
1988; Maanen & Katz, 1976); and feedback for the employee assistance (Larson, 1989).
Additionally, the study of Downs and Hazen (1977) did investigate and interpret two of these
characteristics in the development of personal feedback of the CSQ instrument. However,
these studies did not investigate the possible relationship between the personal feedback
and employees’ brand outcomes of the concept of internal branding. Table 3-7 shows the list
of studies that have linked personal feedback to employee outcomes.

97
Table 3-7: Studies showing the relation between personal feedback and employees’
outcomes
Author and year Employees’ outcome
Goleman (1998); Neher (1996); Maanen and
Katz (1976); Swann (1987); Ibarra (1999)
Employee Performance
Larson (1989); McKenna (2000); Steers
(1977); Porter and Steers (1973)
Employee Commitment
Daft et al. (1987); Young & Steelman, 2014;
Neher (1996); Swann (1987); Ibarra (1999)
Employee Identification
Greenbaum et al. (1988); Neher (1996);
Ross and Zander (1957); Daft et al. (1987);
Eisenberger et al. (1990); Goleman (1998);
Narteh & Odoom (2015)
Employee Loyalty
Based on the literature, the following hypotheses are developed:
H7: Internal Communication Satisfaction comprises Personal feedback has indirect influence
on employees’ brand performance:
H7.1) Personal feedback has a positive relationship with employees’ brand attitudes
(Employee brand identification, Employee brand commitment and Employee brand loyalty).
H7.2) Employees’ brand attitudes play a meditational role in the relationship between
personal feedback and employees’ brand performance.
3.4 Objective 2: To determine the nomological network of internal branding
The beginning section 3.3 has revealed that employees’ brand outcomes (employees’ brand
identification, commitment, loyalty, and performance) come about because employees are
satisfied with certain aspects of their internal communication. The literature has documented
a number of empirical research studies that provide evidence for the influences of internal
communication satisfaction on employees’ identification (Burmann & Zeplin, 2005; De
Chernatony & Segal-Horn, 2001); employees’ commitment (Asif & Sargeant, 2000; Steers,

98
1977); employees’ loyalty (Asif & Sargeant, 2000; Papasolomou & Vrontis, 2006; Steers,
1977); and employees’ performance (Burmann & Zeplin, 2005; Punjaisri, Evanschitzky, &
Wilson, 2009; Punjaisri & Wilson, 2007). However, the number of studies remains small,
necessitating more research to enrich the knowledge in the concept of internal branding;
employees’ attitudes and behaviours.
Furthermore, according to the internal branding literature, the relationship between internal
communication satisfaction and employees’ performance has both a direct and indirect
relationship. According to the study of Burmann and Zeplin (2005), the direct link between
internal communication satisfaction and employees’ performance is in line with brand values.
However, some authors (De Chernatony & Segal-Horn, 2001; Punjaisri & Wilson, 2007;
Thomson, De Chernatony, Arganbright, & Khan, 1999) suggest that employees’ brand
attitudes (i.e. identification, commitment, and loyalty) precede employees’ performance. This
means that these attitudes were considered as a mechanism, which can influence the
behaviours of employees. This issue has highlighted the need for more research to explore
the relationship among employees’ attitudes towards a brand values and their relationships
with employees’ performance in terms of their role in delivering the brand promise.
Therefore, the following research objective 2 and hypotheses are:
Research Objectives 2: To determine the nomological network of internal branding.
H8: The second-order factor structure of internal communication satisfaction has a positive
relationship with employees’ brand attitudes.
H9: The second-order factor structure of employees’ brand attitudes act as a mediational
factor on the relationship between internal communication satisfaction and employees’ brand
performance.
99
H10: The second-order factor structure of internal communication satisfaction positively
influences employees’ brand performance.
3.5 Objective 3: To evaluate the influence of internal communication on employees’
behaviour from high/ low performance employees based on a developing country
context using evidence from the hotel sector in Thailand.
Members of ASEAN include Brunei Darussalam, Cambodia, Indonesia, Laos, Malaysia,
Myanmar, Philippines, Singapore, and Thailand. The countries of the ASEAN bloc are
fuelling growth and development in the region because the ultimate objective of the ASEAN
is to eliminate all trade barriers among member countries. The ASEAN Economic
Community (AEC) will be created by 2015. Such development will allow companies based in
ASEAN nations that are able to manufacture high-quality, low-cost goods and services to
ship them anywhere within the ASEAN without paying duties or being subjected to quotas.
This economic integration presents both opportunities and challenges for business
managers. Therefore, the AEC will affect business across Southeast Asia in terms of
competitive advantage.
The hotel sector being investigated in this current study is part of the service sector, which
contributes to the Thai economic growth and employment. According to the established AEC,
Thai hotel companies require a new business paradigm to attack the competition and gain a
foothold in the ASEAN markets. To achieve a sustainable competitive advantage and
manage the change process effectively, the concept of internal branding through effective
internal communication with internal stakeholders can be a strategic tool. This means that
the implementation of marketing strategy from a marketing perspective must be determined
on both customers (external stakeholders) and employees (internal stakeholders). According
to the internal branding literature, effective internal communication is essential in helping

100
employees achieve positive brand attitudes and implicit brand promise to their customers. If
it is good, a company’s competitive advantage and its performance will also be good. Thai
companies (including the hotel sector that is the focus of this research) should therefore
realise that the secret is to gain competitive advantage through effective internal
communication with their staff members, because employees have a very important role in
delivering the customer brand promise.
However, to implement internal branding strategies, Thai hotel managers must tap the
primary function domains of internal communication satisfaction in the concept of internal
branding. They must have confidence in the internal communication satisfaction constructs,
which play a role in internal branding strategy implementation in a developing country
context. Therefore, the Thai hotel business needs more research into evaluating the
domains of internal communication satisfaction in the concept of internal branding in the Thai
context.
A third objective of this current research was to evaluate the use of the results of the Downs-
Hazen CSQ, which was developed in objectives 1 and 2 with this objective, and
implementation in the Thai (hotel) context. Therefore, the following research objective is:
Research objective 3: To evaluate the influence of internal communication on employees’
behaviour from high/ low performance employees based on a developing country context
using evidence from the hotel sector in Thailand
H11: Performance rankings in hotels moderate the effects that internal communication
satisfaction have on employees' brand attitudes and employees' brand performance;
specifically, the impact of internal communication satisfaction will be stronger in hotels that
are ranked highly by customers.
101
3.6 Conclusion
The main aim of this chapter was to address the research questions posted for enquiry:
what is the internal communication satisfaction in the concept of internal branding and their
role in sense of the concept of internal branding? With the help of a multidisciplinary
literature review, the main outcomes of this chapter are as follows:
First, there has been a clarification of how internal communication satisfaction in the concept
of internal branding influences and aligns employees' brand attitudes and behaviours.
Second, by reviewing the different dimensions of internal communication satisfaction in the
specific internal communication dimensions developed by researchers and the internal
communication dimensions by using a standardised instrument, the Downs-Hazen
Communication Satisfaction Questionnaire (CSQ) includes possible dimension support for
employees’ brand outcomes in the concept of internal branding because each of the CSQ’s
dimensions have a relationship with employees’ brand outcomes. Therefore, new
conceptualisations of internal communication satisfaction dimensions in the concept of
internal branding were articulated in definitions from the Downs-Hazen Communication
Satisfaction Questionnaire (CSQ) instrument. The new internal communication satisfaction
dimensions include the following: Communication Climate (CC), Relationship to Supervisors
(RS), Organizational Integration (OI), Media Quality (MQ), Horizontal Communication (HC),
Organizational Perspective (OP), Personal Feedback (PF).
Third, Hypothesis 1, 2, 3, 4, 5, 6, 7, 8, 9, 10 and 11 were developed to posit the proposed
relationships between new conceptualisations of internal communication satisfaction
dimensions and four employees’ brand outcomes in the concept of internal branding
(Employee Identification (EI), Employee Commitment (EC), Employee Loyalty (EL)) and
Employees’ Brand Performance (EP)).
102
The next step of the enquiry will consist of evaluating the need for using new
conceptualisations of internal communication satisfaction dimensions in the concept of
internal branding in a developing economy context. The next Chapter 4 will bring together
the literature reviewed in this section and further extant literature addressing this objective.

103
Chapter 4: Importance of Internal Communication with Internal Branding in the Hotel
Industry in Thailand
4.0 Introduction
The third objective of this thesis is to evaluate the moderating of internal communication
based on a developing country context using evidence from the hotel sector in Thailand.
Similarly, the aim here is to evaluate the moderating of internal communication in the internal
branding concept in the hotel industry in Thailand.
The main goals of this chapter are to answer the following questions:
1.) Why is research on internal communication in a developing country important for
developing internal communication theory?
2.) Why is studying internal communication in the internal branding context important
for the hotel industry in Thailand?
3.) What is the difference between the moderating of internal communication of high
ranking hotels and low ranking hotels in Thailand?
This chapter is divided into three main sections. The importance of studying internal
communication in the internal branding concept in a developing country has been
investigated in Section One. Section Two shows the importance of studying internal
communication in the internal branding concept in the hotel industry in Thailand. Finally,
section Three shows the argument about the need to evaluate the moderating of internal
communication differences between high ranking and low ranking hotels in Thailand.
104
4.1 Importance of studying internal communication in developing countries
The purpose of internal communication is essentially the same for firms in developed
countries and firms in developing countries: inform, educate, persuade, and stimulate an
appropriate and timed response from internal stakeholders (McKenna, 2012). What is
communicated, and how, where, and when it is so communicated should not be left to
chance. However, effective internal communication is not an easy task, especially when the
company and its employees are from different contexts.
According to the study of Bakar and Mustaffa (2013, p. 87), “One of the most difficult
challenges for the field of organizational communication is the applying of theories and
models developed in one part of the world and to understand a phenomenon that occurs in
another part of the world.” This means that internal communication is management theory,
and they must acquire knowledge of diverse business environments in order to achieve
successful internal communication. Similarly, various authors (e.g. Akaah & Riordan, 1988;
Cui et al., 2006; Frimpong & Wilson, 2013; Tsui, 2004) have recently recognised the
importance of more context specific research in the business management literature.
With an increasing interdependence of the world economies, the importance of doing
research in the subject of marketing in the developing countries is warranted form both
business managements and marketing researchers (Akaah & Riordan, 1988). According to
Akaah & Riordan (1988), the rationale for applicability of marketing knowhow in the
developing countries becoming a management issue is that the context of the developing
economies is changing from the context of sellers’ market economies into buyers’ market
economies. It means that business managers in the developing countries recognise the
marketing strategies necessity of reaching out for a brand to differentiate their offering and
gain a competitive advantage that resists replication. However, the most current status of
marketing knowhow works by researchers in the U.S. and Western European countries and
the discipline were found to lack applicability of marketing knowhow in the developing

105
economies (Akaah & Riordan, 1988). Akaah & Riordan (1988) suggest that applicability of
marketing knowhow in the developing country is important to support a relatively high level
of performance of marketing activities in the developing country.
The study of Tsui (2004) suggests that building management knowledge by researchers in
the U.S. and Western European countries can be accrued to yield economic benefits to their
countries because the development of management knowledge is regarded as a major key
success factor, leading to successful business enterprise. Tsui (2004) has considered
applying the management knowhow from the developed countries setting into the developing
countries setting as major factors of business success in the developing countries because it
can substantially alter the underlying casual dynamic of employee-organizational relations.
Additionally, the applicability of management knowledge in developing economies has
incredible benefits for economic development in a developing economy because it can help
the developing countries to increase economic growth in the future. However, the growth of
management knowledge literature that occurs in the context of a developing economy does
not match that of the needs of business in developing economies as a whole. The business
management literature is mostly associated with the U.S. and Western European countries
and their focus is on business management research in general and not specifically
international management studies for a developing economy (Tsui, 2004).
According to the study of Cui et al. (2006), knowledge transfers from multinational
corporations (MNC) to local subsidiaries and they found that the success of knowledge
transfer between MNC and its subsidiaries was influenced by understanding the business
environmental factors of local subsidiaries, especially in the developing countries that affect
the organization. It means that understanding environmental factors in a developing
economy can help MNC apply the knowledge transfer to local subsidiaries and enhance
corporate performance. Similarly with Tsui (2004) and Akaah & Riordan (1988), they found
that a majority of business management studies were conducted in a developed economy

106
especially in North America or Western Europe markets. Cui et al. (2006) have postulated
that business management researchers should not be confined only to the North America or
Western Europe markets. Instead, they need to conduct research in developing country
markets in order to achieve and sustain strategic success via knowledge transfer between
MNC and its subsidiaries in a developing economy. Moreover, Cui et al. (2006) suggest that
conducting research in developing country markets can be considered as an opportunity to
extend applications of the business management theory under study to a non-developed
market. The results of the research can offer initial insights into the influence of business
environmental factors on corporate performance and provide concrete directions for
managerial guidelines in a developing country.
Frimpong & Wilson (2013) have provided evidence to support the importance of conducting
research in developing countries. According to the study of Frimpong & Wilson (2013), it was
confirmed that the major current business management knowledge is largely informed by
insights obtained from developed countries, especially Western Europe and North America,
and to a minor extent from developing countries, especially Asian economies. With the focus
of business management knowledge on developed country contexts, their business
management can create business strategies based on their knowledge of business
management literature that ensures an effective product and service delivery, which
customers will value. However, Frimpong & Wilson (2013) are concerned about too much
emphasis on developed countries’ contexts, without a link to a developing economy. They
say that the extent to which underlying theory of business management is relevant to
developing countries has received very little attention and needs to be addressed.
In summary, a group of academics (Akaah & Riordan, 1988; Cui et al., 2006; Frimpong &
Wilson, 2013; Tsui, 2004) call for more research in developing country contexts into the
business management literature.

107
This thesis seeks to examine the influence of internal communication on employees’ brand
outcomes in the concept of internal branding in a developing country. According to the
internal communication literature, this thesis found that this literature is largely informed by
insights obtained from developed country contexts and to a minor extent, from developing
country contexts. Consequently, the extent to which the underlying influence of internal
communication on employees’ brand outcomes in the concept of internal branding is
relevant to developing countries, especially, those in Asian economies, which has received
very little attention, needs to be addressed.
Additionally, this thesis develops domains of internal communication in the internal branding
concept from the CSQ constructs. The CSQ was developed by Downs and Hazen (1977) in
a developed country. The CSQ consists of eight major activities and these eight dimensions
can be viewed as internal communication tools. Many organizational communication
researchers used the CSQ constructs in various countries. Table 3.1 shows examples of
these research studies from the literature. However, where such studies have been
conducted, they usually examine developed countries such as Australia, United States, and
Taiwan. There is a lack of empirical research of the CSQ constructs within developing
countries. This means that the extent of the CSQ on the internal branding concept lacks
applicability or relevance in the developing countries, and this would suggest the need to re-
examine the CSQ of internal communication theory to enhance within developing countries.
The negative effects of a lack of application of the CSQ within developing countries are that
they would reinforce its negative stereotyping in developing countries; internal
communication activities are viewed with disdain and suspicion in developing countries; and
the internal communication in the internal branding concept would exacerbate the difficulty
multinational marketers face in formulating international marketing strategies (Akaah &
Riordan, 1988). Therefore, understanding and adapting the CSQ as the internal
communication constructs to many business environments in other countries in a developing

108
economy are key factors for developing the internal communication in the internal branding
concept. Additionally, this literature is the best way to gather the internal branding best
practices for business leaders in a developing economy.

109
Table 4-1: Studies of Internal Communication in various countries
Author Focus of the study Function/outcomes Target Group
Clampitt and Downs
(1993)
To explore the relationship between
internal communication and
productivity
Employee productivity Employees in two businesses
(service, manufacturing) in the USA
Clampitt and Downs
(1993)
A factor analytic study of the internal
communication satisfaction in a bank
Internal communication satisfaction Employee in a bank in USA
Taylor (1997) To explore the communication
satisfaction with Church Membership
Communication satisfaction Member in Southern Baptist
Churches in USA
Scott et al. (1999) To explore the relationship between
the organizational communication
and employee turnover
Employee turnover Employees in a state government
agency in the USA
Mount and Back
(1999)
A factor analytic study of the internal
communication satisfaction in a
lodging setting
Internal communication satisfaction Employee in a lodging setting in USA
Smidts, Pruyn, and
Van Riel (2001)
To demonstrate the relationship of
both internal communication with
organizational identification
Employee identification Employees in three organizations in
the Netherlands (Non-profit service
organization, a nationally operating
utilities company, a bank)
Mueller and Lee
(2002)
To explore the relationship between
internal communication and
communication satisfaction
Internal communication satisfaction Employees in four organizations in
the USA

110
Table 4-1: Studies of Internal Communication in various countries
Author Focus of the study Function/outcomes Target Group
Gray and Laidlaw
(2002)
To examine the relationship between
internal communication and
employee relation
Employee relation Employees in a major Australian
supermarket organization
Mount and Bartlett
(2002)
To explore the relationship between
internal communication and job
satisfaction
Job satisfaction Staff members in hotel service in
USA
Fu and Mount
(2002)
To examine the important
communication factors that influence
older workers’ job satisfaction
Job satisfaction Older workers in the lodging industry
in Texas, USA
Allen, Scotter, and
Otondo (2004)
To test the effect of internal
communication on communication
outcomes
Attitudes, intentions and behaviour
associated with joining the organisation
Undergraduate students in the USA
McMurray, Scott,
and Pace (2004)
To explore the relationship between
organizational commitment and
internal communication
Organizational commitment Employees in Australia automotive
component manufacturing
Brunetto and Farr-
Wharton (2004)
To examine the effect of internal
communication practices on
employee commitment
Employee commitment Employees in public sector
organizations in Australia

111
Table 4-1: Studies of Internal Communication in various countries
Author Focus of the study Function/outcomes Target Group
Akkirman & Harris
(2005)
To study the levels of internal
communication satisfaction
Internal communication satisfaction Virtual workplace and Traditional
workplace employees in the USA
Schulz & Auld
(2006)
To investigate the satisfaction with
organizational communication
Communication satisfaction The chairpersons and executive
directors of Queensland State
Sporting Organizations in Australia
Nakra (2006) To investigate between
communication satisfaction and
organizational identification
Organizational identification Employee from the central
government organizations, public
sector undertaking and the private
sector in India
Nelson, Brunetto,
Farr-Wharton, &
Currant (2007)
To examine the links between the
antecedents of workplace stress
(communication practices) and
public sector nurses’ perception of
workplace stress
Employees’ perception of workplace
stress
Employees in various organizations
in Australia
Mohamad (2008) To examine the relationship between
internal communication and turnover
intention
Turnover intention Hotel employees in Malaysia

112
Table 4-1: Studies of Internal Communication in various countries
Author Focus of the study Function/outcomes Target Group
Carriere & Bourque
(2009)
To provide the relationship between
internal communication and
organizational commitment
Organizational commitment Employees in the emergency service
sector in Canada
Tsai, Chuang, &
Hsieh (2009)
To examine the relationship of
internal communication to job
satisfaction and turnover intention
Job satisfaction and Turnover intention Staff members in the 500 service
industries in Taiwan
Carriere & Bourque
(2009)
To examine the relationship between
internal communication and two
important factors of job satisfaction
and effective organization
commitment
Job satisfaction and effective
organisation commitment
Employees in urban land ambulance
service in Canada
Rogelberg, Allen,
Shanock, Scott, &
Shuffler (2010)
To explore employee satisfaction
with internal communication
Employee satisfaction Working adults from the
southeastern United States
Wagenheim & Rood
(2010)
To explore the relationship between
employee satisfaction with the
organizational communication and
external customer orientation
Employee satisfaction and External
Customer Orientation
Front-line employees in
Entertainment Center in the USA

113
Table 4-1: Studies of Internal Communication in various countries
Author Focus of the study Function/outcomes Target Group
Chen, Okumus,
Hua, & Nusair
(2011)
To explore effective communication
strategies for Spanish-speaking and
Haitian-Creole-speaking employees
in hotel companies
Employee communication satisfaction Employees from a resort hotel in
Orlando, Florida, USA
Dawson, Madera,
Neal, & Chen (2012)
To examine the influence
communication of lodging managers
Employee communication satisfaction Employees in citizenship projects
conducted in Texas, USA
Mustamil et al.
(2014)
To explore the relationship between
communication satisfaction and
employee turnover intention
Employee turnover intention Employees working in 11
Industries in Malaysia
Gümüş & Hamarat
(2014)
To explore the effects of
communication on
organizational identification
Organizational identification Teacher at public school in Turkey
Bakanauskienė et
al. (2015)
To explore the relationship between
communication satisfaction and job
satisfaction
Job satisfaction Lithuania’s university employees

114
In summary, the research conducted regarding internal communication by using the CSQ
constructs in the developing countries context can extend and develop the internal
communication research in these countries.
Thailand is especially interesting for examining the CSQ constructs and employee outcomes
in an internal branding context because the business environments of Thailand differences
from the western countries and the internal communication construct should be conceived of
in distinctive ways.
4.2 The importance of studying internal communication in internal branding concept
in the hotel industry in Thailand
The Tourism Authority of Thailand (TAT) was established in 1960. Tourist numbers increased
from 0.336 million in 1967 to over 22 million in 2012 (BOT, 2013). The share of tourism jobs
reached 6.6 percent of total employment (2,563,000 jobs) by 2013 and the tourism industry
produced more than 9.0 percent of GDP in 2013 (WTTC, 2014). Therefore, the tourism
industry has had a tremendous impact on Thailand’s economy. The industry is composed of
hotels, transportation, entertainment, food and beverage, etc. The hotel industry plays an
important role, and has a 28% share (or more than a quarter) of tourist expenditures (BOT,
2013).
The Association of Southeast Asian Nations (ASEAN) was created in 1967 and includes
Brunei Darussalam, Cambodia, Indonesia, Laos, Malaysia, Myanmar, the Philippines,
Singapore, Thailand, and Vietnam. ASEAN has five main objectives: 1) increase economic
growth; 2) social development; 3) cultural development; 4) the protection of regional peace
and stability; and 5) provide opportunities for member countries to discuss differences
peacefully. In 2003, ASEAN attempted to reduce hardship through economic integration and
announced the formation of a customs union called ASEAN Economic Community (AEC)
(ASEAN, 2011; Cuyvers, De Lombaerde, & Verherstraeten, 2005). The ten member

115
countries have agreed to reduce tariffs to a maximum level of 5% by 2005 and to create a
customs union by 2015.
Since 2015, the AEAN Economic Community (AEC) has established a single regional
common market of ASEAN countries. This means that the growth of international trade and
investment has been substantially larger than the growth of domestic economies, especially
in Thailand. Therefore, the AEC presents more opportunities for expansion, growth, and
income than domestic business does alone (Czinkota, Ronkainen, Moffett, Marinova, &
Marinov, 2009). The benefits derived from the AEC include trade creation, economies of
scale, improved terms of trade, the reduction of monopoly power, and improved cross-
cultural communication (Czinkota et al., 2009). The Siam Commercial Bank Economic
Intelligence Centre (SCB, 2011, p. 4) lists five opportunities that accrue of AEC, and these
are summarised in Table 3.2.
Table 4-2: ASEAN Economic Community (AEC) offers greater opportunities
AEC Compare to…
Population 580 million > Europe Union
GDP size 1.5 trillion USD = South Korea
International Trade 1.6 trillion USD = 6 times Thailand
FDI 50 billion USD = 60% of China
International tourists 65 million persons = ranked 2nd globally (next to France)
Sources: The Siam Commercial Bank Economic Intelligence Centre (SCB, 2011, p. 4)
However, the Thai hotel industry perceives both opportunity and threat from the AEC
success: the opportunity arises from possible increases in the number of ASEAN visitors to
Thailand and Thai hotel investment in ASEAN enterprises, whereas the threat arises from
the size and rapid growth of other ASEAN countries and the competition for customers and
foreign direct investment.

116
When ASEAN becomes a single market in 2015, new hotel players from nine nations that
have similar services will emerge as serious competitors to Thailand as a cheap travel
destination. Therefore, the Thai hotel industry must prepare for the AEC (SCB, 2011).
The AEC is a challenge for Thai business owners to prepare to seize the opportunity of the
expanding customer base from 60 million in Thailand to more than 580 million people in
ASEAN in 2015. Thus, as the Thai-Commerce (2010) has suggested, “internal branding” is
going to become increasingly important for the hotel industry in Thailand. Thai hotel brands
have a challenge to focus beyond their small home market and to bring their brands to the
bigger, regional and even global markets.
Thai marketing researchers undertook many studies about branding in many aspects and
some Thai universities established research centres, which focused on ‘brand studies’.
However, most of the studies related with brand building currently focus on the positioning of
products and services while in the present study the brand-building concept shifts from
focusing on the positioning of products and services to the importance of internal branding.
Similarly, the study of Punjaisri (2008) classified research on internal branding research
according to the context of service industry and found that there has been a lot of research
on internal branding in different contexts within services companies; however, there has
been little research focused on internal branding within the hotel industry. Therefore, the
research about internal branding research in the hotel industry in Thailand will reveal how
Thai hotel business is different from other competitors.
117
4.3 Evaluating the moderating of internal communication in the hotel industry in
Thailand
The aim of internal communication practice in the internal branding context is employees’
satisfaction because employees’ satisfaction is linked to customers’ satisfaction who as a
result, become more loyal and therefore, create more profit for the company (Dunmore,
2002). This means that employee satisfaction affects the customer satisfaction and
organizational productivity (Potterfield, 1999). For this reason, the managers of hotels in
Thailand have to pay attention to hotel ranking, which comes from customer satisfaction
(Narangajavana & Hu, 2008).
The question of this thesis is: “What is the difference between the internal communication of
high ranking hotels and low ranking hotels in developing countries, especially Thailand?”
4.3.1 Hotel Rating Systems
The hotel rating system is used for hotel management and as the primary instrument with
respect to improving service quality and to communicate and reinforce service quality to all
stakeholders involved in the hotel industry (Narangajavana & Hu, 2008). The study of World
Tourism Organization (WTO) & International Hotel and Restaurant Association (IH&RA)
showed that the hotel rating systems offer benefits to five parties involved in the hotel
industry: travel agencies, tour operators, hotels, governments, and consumers
(Narangajavana & Hu, 2008). From the hotel managers’ point of view, hotel rating systems
use classification schemes such as ‘‘branding’’, which create total quality across every
aspect of the customer relationship (Gronroos, 1990; Narangajavana & Hu, 2008). The hotel
rating systems help managers determine scope of its customer-service function and conduct
a customer-service audit. The hotel rating systems can identify all customer-contact tasks
and the standard procedures prescribed for each (Lovelock, 1992). Therefore, the hotel
rating systems will report the current business situation and provide a fundamental basis for
planning the factors shaping customer-service functions and quality of the customer-service
118
functions. Since customer service is one of the most important tools in competitive
differentiation, an appraisal should also be done of competitors’ customer-service efforts
(Lovelock, 1992). Additionally, the company can provide information about the hotel rating
systems to its employees in order to show how they affect the whole firm. The hotel rating
systems can be helpful in increasing employees’ awareness of their role in customer
satisfaction and company success.
This thesis focuses on the role of internal communication in internal branding concept, which
aims to shape employees’ behaviours to deliver brand promise to customers and to create
much higher levels of customer satisfaction. Therefore, the hotel rating used in this thesis
could extend the concept of customer satisfaction that can aid in the development and
testing of the internal branding concept in the Hotel industry in Thailand. TripAvisor’s hotel
ranking system is selected for this research.
4.3.2 TripAvisor’s hotel ranking system
The following paragraphs show the reasons why this thesis selected TripAvisor’s hotel
ranking system.
First of all, TripAdvisor ranks hotels in destinations according to how favourably consumers
reviewed them. It means that hotel rankings in TripAdvisor are created from traveller
satisfaction. According to the official TripAdvisor website, they describe “TripAdvisor ranking”
as:
Based on their experience with you, travellers rate and review your property.
Based on those reviews, your property receives an overall TripAdvisor rating, with 5
being the highest.
119
Your TripAdvisor rating then factors into your property’s overall TripAdvisor ranking
among other properties in your location. TripAdvisor rankings are also known as the
Popularity Index.
The better your ratings and the more recent your reviews the higher your property’s
TripAdvisor ranking can potentially go.
The objective of internal branding approach through internal communication is to develop
employees that ‘live the brand’, since this has been found to have an impact upon revenue,
growth and profitability of the company. This is because employees’ satisfaction is linked to
customers’ satisfaction who, as a result become more loyal and therefore, create more profit
for the company (Dunmore, 2002). Therefore, the objective regarding customers’ satisfaction
of the internal branding and TripAdvisor ranking are conceptually similar.
Second of all, it is widely known that TripAvisor’s hotel ranking system is the most successful
hotel rating system. According to the study of Whitehead (2011), it shows that the travel
review website receives over 40 million worldwide visitors through the site every month, it
has 20 million registered users, and offers over 45 million traveller reviews, covering more
than 125,000 visitor attractions, 450,000 hotels, and 600,000 restaurants. Similarly, the study
of Xiang and Gretzel (2010) supports that TripAdvisor is a powerful unique domain name in
the Google information search for travel information.
Finally, the research of Smyth, Wu, and Greene (2010) studies the TripAdvisor effect of the
hotel sector in Ireland and Las Vegas hotels and found that TripAdvisor will result in an
increase in standards of service. It means hotel owners/ managers look at their ranking from
TripAdvisor and all complaints about their hotels as opportunities to improve customer
service levels. Additionally, according to the study of Tuominen (2011), it was found that
there is a relationship between the hotel performance and the number of reviews given as

120
well as with the ratings of the reviews. Therefore, it has an enormous influence on the hotel
businesses.
4.3.3 Evaluating the moderating of internal communication of high ranking hotels and
low ranking hotels in Thailand
The ASEAN Economic Community (AEC) by 2015 will have an impact on the Thai Hotel
Industry. The AEC will attempt to increase market size and the number of competing firms,
resulting in greater efficiency and lower prices for customers (Czinkota et al., 2009).
Integration factor has served to stimulate competition, which, in turn places a premium on
encouraging innovation and developing workers to ensure that the human resources are
available to operate and deliver on the brand promise to their customers. Successful brands
delivering on their promises can be a way of differentiating the offering and creating a
competitive advantage (Khanyapuss Punjaisri & Wilson, 2007). For this reason, the Thai
Hotel Industry needs to plan every aspect for it to be successful, especially to raise Thai
hotels’ overall service quality and to deliver excellent quality service to customers
(Narangajavana & Hu, 2008).
Effective service management, which focuses on the delivery of the brand promise to the
customers, requires a shift in thinking from external branding to internal branding
(Khanyapuss Punjaisri & Wilson, 2007). Therefore, Thai hotel managers need to understand
the concept of internal branding that internal communication has the biggest influence on
employees’ brand outcomes. A Thai hotels survey by the Thai National Statistical Office
(2014) found that more that 80 percent of the hotels in Thailand have difficulty creating
competitive advantage, and more than 70 percent of the hotels need the Thai government to
support them with the potential to improve and grow. According to this report, doing research
and development in Thailand is still rare for most of the Thai hotel industry.
121
Therefore, studying the comparison of moderating of internal communication between high
ranking and low ranking hotels in Thailand can lead to a deeper and broader understanding
of the internal communication approach. Internal communication research on high ranking
hotels has led to the development of the internal communication system of low ranking
hotels in Thailand. When internal communication in the internal branding concept in low
ranking hotels is improved, then it will lead to employee satisfaction and customer
satisfaction that will result in good business outcomes in the Thai hotel Industry (Nilsson,
Johnson, & Gustafsson, 2001; Khanyapuss Punjaisri & Wilson, 2007).
For this research, TripAdvisor hotel rankings are classified into two types: high ranking and
low ranking. As TripAdvisor hotel rankings show a number out of all destinations, this
research classifies hotels based on the percentage of order of hotels in this destination: high
ranking (less than 50%) and low ranking (more than 50%).
4.4 Conclusion
This chapter, upon integrating the literature and theoretical foundations developed in
Chapter 2 and 3 with the concept of internal branding, new internal communication
satisfaction dimensions and the influence of internal communication on employees brand
outcomes, made the case for extending acculturation theory into the developing country
contexts. It presented an evaluation of the influence of new internal communication
satisfaction dimensions on employees’ behaviour from high/ low performance employees in
a developing economy.
Objective 3 was developed to explain and predict variance of new internal communication
satisfaction dimensions from high/ low performance employees in a developing economy.
The next Chapter 5 presents the design of the empirical study developed to address these
hypotheses.
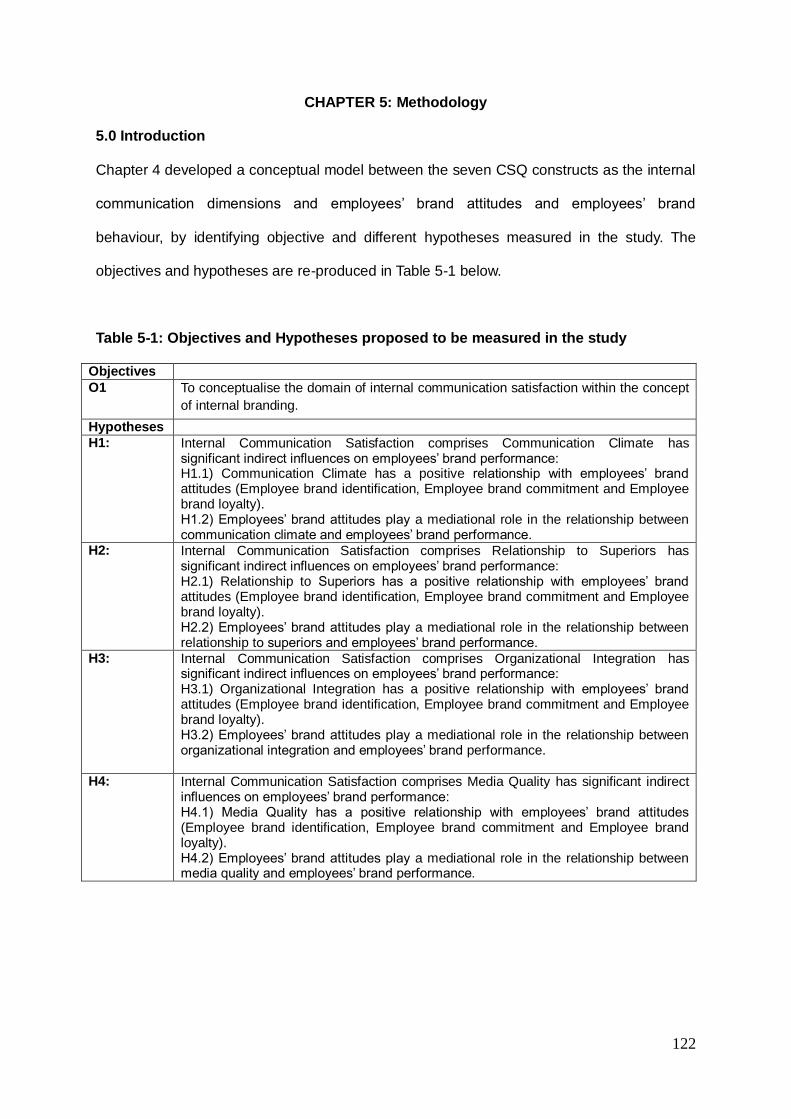
122
CHAPTER 5: Methodology
5.0 Introduction
Chapter 4 developed a conceptual model between the seven CSQ constructs as the internal
communication dimensions and employees’ brand attitudes and employees’ brand
behaviour, by identifying objective and different hypotheses measured in the study. The
objectives and hypotheses are re-produced in Table 5-1 below.
Table 5-1: Objectives and Hypotheses proposed to be measured in the study
Objectives
O1
To conceptualise the domain of internal communication satisfaction within the concept
of internal branding.
Hypotheses H1:
Internal Communication Satisfaction comprises Communication Climate has significant indirect influences on employees’ brand performance: H1.1) Communication Climate has a positive relationship with employees’ brand attitudes (Employee brand identification, Employee brand commitment and Employee brand loyalty). H1.2) Employees’ brand attitudes play a mediational role in the relationship between communication climate and employees’ brand performance.
H2: Internal Communication Satisfaction comprises Relationship to Superiors has significant indirect influences on employees’ brand performance: H2.1) Relationship to Superiors has a positive relationship with employees’ brand attitudes (Employee brand identification, Employee brand commitment and Employee brand loyalty). H2.2) Employees’ brand attitudes play a mediational role in the relationship between relationship to superiors and employees’ brand performance.
H3: Internal Communication Satisfaction comprises Organizational Integration has significant indirect influences on employees’ brand performance: H3.1) Organizational Integration has a positive relationship with employees’ brand attitudes (Employee brand identification, Employee brand commitment and Employee brand loyalty). H3.2) Employees’ brand attitudes play a mediational role in the relationship between organizational integration and employees’ brand performance.
H4: Internal Communication Satisfaction comprises Media Quality has significant indirect influences on employees’ brand performance: H4.1) Media Quality has a positive relationship with employees’ brand attitudes (Employee brand identification, Employee brand commitment and Employee brand loyalty). H4.2) Employees’ brand attitudes play a mediational role in the relationship between media quality and employees’ brand performance.

123
Table 5-1: Objectives and Hypotheses proposed to be measured in the study
Hypotheses H5: Internal Communication Satisfaction comprises Horizontal Communication has
significant indirect influences on employees’ brand performance: H5.1) Horizontal Communication has a positive relationship with employees’ brand attitudes (Employee brand identification, Employee brand commitment and Employee brand loyalty). H5.2) Employees’ brand attitudes play a mediational role in the relationship between horizontal communication and employees’ brand performance.
H6: Internal Communication Satisfaction comprises Organisational Perspective has significant indirect influences on employees’ brand performance: H6.1) Organisational Perspective has a positive relationship with employees’ brand attitudes (Employee brand identification, Employee brand commitment and Employee brand loyalty). H6.2) Employees’ brand attitudes play a mediational role in the relationship between organisational perspective and employees’ brand performance.
H7: Internal Communication Satisfaction comprises Personal Feedback has significant indirect influences on employees’ brand performance: H7.1) Personal feedback has a positive relationship with employees’ brand attitudes (Employee brand identification, Employee brand commitment and Employee brand loyalty). H7.2) Employees’ brand attitudes play a mediational role in the relationship between personal feedback and employees’ brand performance.
Objectives
O2 To determine the nomological network of internal branding.
H8: The second-order factor structure of internal communication satisfaction has a positive
relationship with employees’ brand attitudes.
H9: The second-order factor structure of employees’ brand attitudes act as a mediational
factor in the relationship between internal communication satisfaction and employees’
brand performance.
H10: The second-order factor structure of internal communication satisfaction positively
influences employees’ brand performance.
Objectives
O3 To evaluate the influence of internal communication on employees’ behaviour from
high/ low performance employees based on a developing country context using
evidence from the hotel sector in Thailand.
H11: Performance rankings in hotels moderates the effects that internal communication
satisfaction have on employees' brand attitudes and employees' brand performance;
specifically, the impact of internal communication satisfaction will be stronger in hotels,
which are ranked highly by customers.
This chapter discusses the methodology used to test the above objectives and hypotheses.
Mainly, this chapter consists of four sections; Section 5.1 covers the research philosophy
while Section 5.2 and 5.3 reports a detailed discussion of data collection strategies and
analysis strategies implemented in the study (comprising measure development with
preliminary study, pilot study and main study). Finally, Section 5.4 reviews the key steps
taken to minimise possible sources of bias during data collection and analysis of this study.
124
5.1 Research Philosophy
This section presents the justification for the adopted philosophical stance that informed the
research design and research selection.
5.1.1 Philosophical Stance
Saunders, Saunders, Lewis, and Thornhill (2011, p. 5) defined research as, “something that
people undertake in order to find out things in a systematic way, thereby increasing their
knowledge”. Research aims to increase a body of knowledge by the discovery of new facts
or relationships through a process of systemic scientific inquiry and the research process
(Chava & David, 1996; Husse & Hussey, 1997).
Carson, Gilmore, Perry, and Gronhaug (2001, p. 1) state that the research philosophy aims
to “understand the philosophy that underpins the choices and decisions to be made in
staking a research position”. A research position helps researchers to answer the what, how
and why questions, for example, what the research is about, how the research will contribute
to a deeper and wider perspective of research, and as a result, the researcher will have a
clearer purpose within the wider context.
Although there are many research philosophies in the social sciences, many scholars (Collis
& Hussey, 2003; Easterby-Smith, Thorpe, & Jackson, 2012; Husse & Hussey, 1997;
Saunders et al., 2011) identify and discuss them under two main philosophical schools:
phenomenology and positivism. Easterby-Smith et al. (2012, p. 28) point out that in
positivism “the social world exists externally, and that its properties can be measured
through objective methods rather than being inferred subjectively through sensation,
refection or intuition”. Meanwhile, Carson et al. (2001, p. 16) argue that a “phenomenologist
is committed to understanding social phenomena from the actor’s own perspective. He or
she examines how the world is experienced”. The two broad research philosophies are to be
found within the marketing literature.

125
The positivism approach aims to concentrate on description and explanation of target group
attitudes towards behaviour, where thought is governed by explicitly stated theories and
hypotheses. Positivism uses statistics and mathematical techniques for trying to explore and
measure independent facts about a single reality, which is assumed to exist, driven by
natural laws and mechanisms (Carson et al., 2001; Ehrenberg, 2000; Hunt, 1993). In
marketing research, application of phenomenology implies that researchers are trying to
understand what is happening in a given context. It includes consideration of multiple
realities, different actors’ perspectives, researcher involvement, taking account of the
contexts of the phenomena under study, and the contextual understanding and interpretation
of data (Buttle, 1994; Carson et al., 2001; Peter & Olson, 1989). Therefore, positivism aims
to explain casual relationships by means of objective facts and statistical analysis;
phenomenology uses a more personal process in order to understand reality (Carson et al.,
2001). Carson et al. (2001, p. 6) summarised the contrasting implications of positivism and
phenomenology philosophies in Table 5.2.

126
Table 5-2: Contrasting implications of positivism and phenomenology
Positivism Phenomenology
Nature of ‘being’/nature of the world
Have direct access to real world No direct access to real world
Reality Single external reality No single external reality Grounds of knowledge/ relationship between reality and research
Possible to obtain hard, secure objective knowledge
Understood through ‘perceived’ knowledge
Research focuses on generalization and abstraction
Research focuses on the specific and concrete
Thought governed by hypotheses and stated theories
Seeking to understand specific context
Focus of research Concentrate on description and explanation
Concentrate on understanding and interpretation
Role of researcher
Detached, external observer Researchers want to experience what they are studying
Clear distinction between reason and feeling
Allow feelings and reason to govern actions
Aim to discover external reality rather than creating the object of study
Partially create what is studied, the meaning of the phenomena
Strive to use rational, consistent, verbal, logical approach
Use of pre-understanding is important
Seek to maintain clear distinction between facts and value judgements
Distinction between facts and value judgements less clear
Distinction between science and personal experience
Accept influence from both science and personal experience
Techniques used by researcher
Formalized statistical and mathematical methods predominant
Primarily non-quantitative
Source: Carson et al. (2001, p. 6)
5.1.2 Research Design Selection
This study aims to explore the relationships between internal communication, employees’
attitudes and employees’ behaviours within the Hotel Businesses in Thailand. The positivism
philosophy has been chosen for this research for the following reasons.
Firstly, this study aims to test a hypothesis, and also to analyse the role of internal
communication on employees’ attitudes and employees’ behaviours. Additionally, this study
needs to investigate the level of employee satisfaction in internal communications, and how
it relates with their attitudes and performance. Positivism is the suitable research philosophy
for studies that are concerned with hypothesis testing.
127
One of the aims of this study is test models to explain employees’ brand behaviours and
relationships between the domain of internal communication satisfaction and employees’
brand outcomes. This study will focus on these factors as numbers rather than words, and
thus use prediction modelling. Therefore, a positivism philosophy is suitable for this study
because quantitative research methods are appropriate when researchers are testing
models to explain targets’ behaviours or relationships between two or more variables.
Additionally, this current study assesses the reliability and validity of scales for investigating
internal communication factors in the concept of internal branding, employees’ brand
attitudes, and employees’ brand behaviours. Therefore, a positivism philosophy is suitable
for this study.
Finally, the area of study and the method of study were purely determined by objective
criteria rather than the researcher’s own belief and interest. The researcher in this study
remains detached by maintaining a distance between them and the targets of the research;
the researcher tries to be emotionally neutral and make a clear distinction between reason
and feeling, science and personal experience. Again, therefore, a positivism philosophy is
suitable for this study.
Based on the considerations above, a research programme was developed to comprise four
studies conducted in two main phases. Phase 1 comprised the literature search; Phase 2
comprises three studies (measure development with preliminary study, pilot study and main
study), to enable measure development and validation and hypotheses testing. Figure 5-1
presents a diagram of the design.

128
Figure 5-1: Study Design Overview
Phase 1
Literature Review (Chapter 2, 3 and 4)
Phase 2
Preliminary study: Measure development and expert judging (n=10)
Pilot study: Instrument validation with local experts and pilot survey (n=50)
Objectives:
-Obtain a set of measures with content validity
-Ensure transaction and scoring equivalence
-Pilot instrument
Main study: Survey (n=1,747)
Approach: Snowball sampling; measure validation; invariance validation of new measures;
operationalisation of internal communication satisfaction
Objectives:
-To obtain sound measures
-Objectives 1, 2 and 3 testing
-Hypotheses 1, 2, 3, 4, 5, 6, 7, 8, 9, 10, 11 testing
5.2 Study Design (Preliminary study, Pilot study and Main study)
This section presents data collection and analysis strategies adopted in Phase 2 to further
address objective 1 and 2 by testing hypotheses 1, 2, 3, 4, 5, 6, 7, 8, 9, and 10 and to
address objective 3 by testing hypothesis 11. The main objectives of Phase 2 were to obtain
data to: 1) develop sound measures of the seven domains of internal communication
satisfaction (Communication climate (CC); Relationship to Supervisory (Relation);
Organization integration (OI); Media quality (MQ); Horizontal communication (HC);

129
Organisational perspective (OP); and Personal feedback (PF)), the three employees brand
attitudes (Employees’ brand identification, Employees’ brand commitment, and Employees’
brand loyalty), and Employees’ Brand Performance; 2) test the hypotheses concerning the
relationships between each internal communication satisfaction domain and employees’
brand attitudes and employees’ brand performance; and 3) evaluate the influence of internal
communication satisfaction on employees’ behaviour from high/ low performance employees
in a developing economy.
In seeking to address the objectives above, Phase 2 was designed to include three studies:
Preliminary study – measure development with expert judging: Pilot study – pilot; Main study
– survey. Data collection strategy for the main survey (Main study) is presented next, while
Preliminary study and Pilot study are discussed in the data analysis strategy section in order
to establish the objectives they addressed.
5.2.1 Data Collection Strategy –Main Study
5.2.1.1 Sampling
5.2.1.1.1 Sampling Frame and Procedure
The target population of the study was defined as all customer-facing employees who have
worked in hotels in Thailand. This is because the internal branding concepts focused on
customer-facing employees (Khanyapuss Punjaisri & Wilson, 2007). In light of this
conceptualisation, all customer-facing employees were necessary requirements for the
sampling frame.
In the study of Samuel Craig and Douglas (2001), nonprobability sampling was adopted as a
sampling procedure for international marketing research. Probability sampling procedures
are uncommon in international marketing research, especially in studies involving developing
countries because the selection of a representative sample in developing countries is
complicated by many factors such as comparability and availability of sampling lists, different
130
social attitudes of specific cultural groups to interview formats, and uneven infrastructure
such as penetration of communication systems, and resources constraints (Samuel Craig &
Douglas, 2001). Therefore, selection of sampling units is based on some type of intuitive
judgement or knowledge of the researchers (Hair Jr & Lukas, 2014). The nonprobability
sampling method is a method that is usually an extension of convenience sampling.
Convenience sampling procedures help to overcome these difficulties, providing that
adopted sampling frames are equivalent across settings and a conscious effort is made on
the part of the researcher to maximise samples’ comparability (Malhotra, Agarwal, &
Peterson, 1996).
In Thailand, this current study approached the Thai Hotel Association with an invitation to
participate in the study. The Thai Hotels Association (THA) has represented the Thai hotel
industry since 1963 and now represents more than 850 members across Thailand services
with a network of branches in every province. The THA agreed to support this thesis and 15
hotels, which were members of the Thai Hotel Association, agreed to participate in this
research study.
5.2.1.1.2 Sample Size
The researcher needs to determine the size of the sample needed before collecting data.
However, the question of sample size is complex because this current study is in a
developing country, where estimates of population variance may be simply unavailable.
Decisions on target sample size in international marketing research, especially the
developing countries, are often based on qualitative criteria, for example the nature of the
research, the time, money, and persons available for the study (Churchill & Iacobucci, 2005;
Malhotra et al., 1996).
According to the study of Hair et al. (2006), a sample size of 200-500 is recommended for
multivariate data analysis. Additionally, Hair et al. (2006) suggest that a ratio of ten cases per
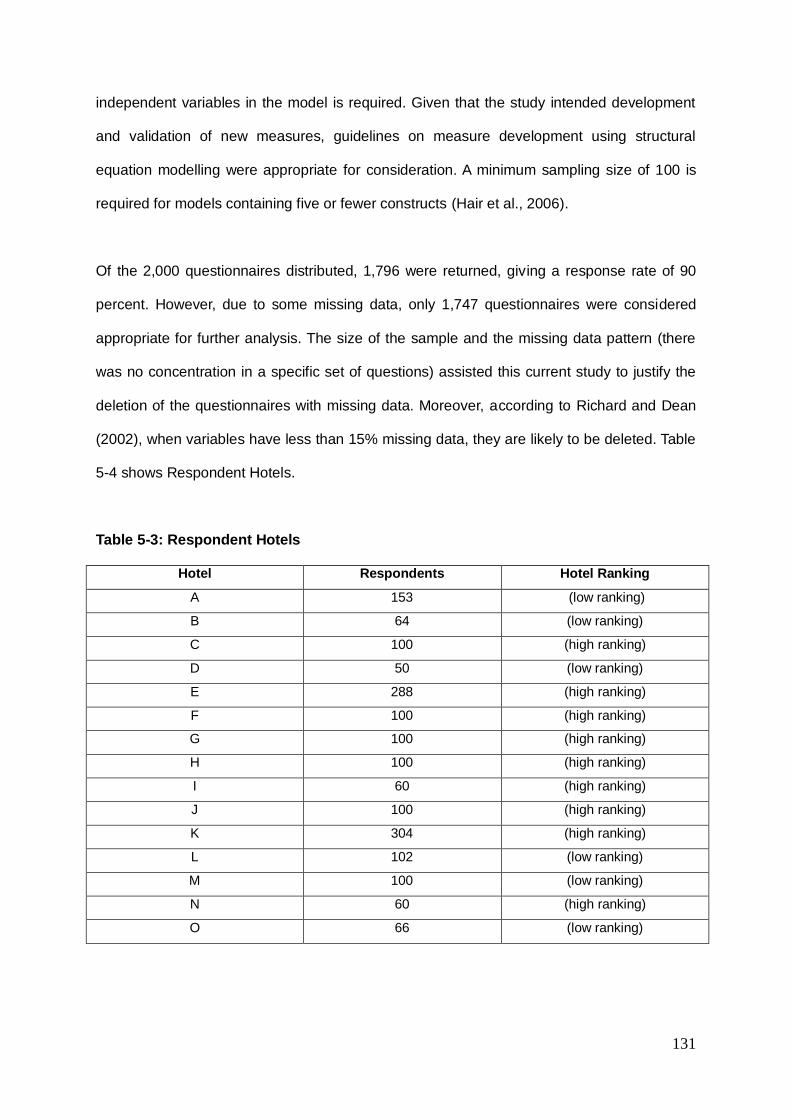
131
independent variables in the model is required. Given that the study intended development
and validation of new measures, guidelines on measure development using structural
equation modelling were appropriate for consideration. A minimum sampling size of 100 is
required for models containing five or fewer constructs (Hair et al., 2006).
Of the 2,000 questionnaires distributed, 1,796 were returned, giving a response rate of 90
percent. However, due to some missing data, only 1,747 questionnaires were considered
appropriate for further analysis. The size of the sample and the missing data pattern (there
was no concentration in a specific set of questions) assisted this current study to justify the
deletion of the questionnaires with missing data. Moreover, according to Richard and Dean
(2002), when variables have less than 15% missing data, they are likely to be deleted. Table
5-4 shows Respondent Hotels.
Table 5-3: Respondent Hotels
Hotel Respondents Hotel Ranking
A 153 (low ranking)
B 64 (low ranking)
C 100 (high ranking)
D 50 (low ranking)
E 288 (high ranking)
F 100 (high ranking)
G 100 (high ranking)
H 100 (high ranking)
I 60 (high ranking)
J 100 (high ranking)
K 304 (high ranking)
L 102 (low ranking)
M 100 (low ranking)
N 60 (high ranking)
O 66 (low ranking)
132
5.2.1.1.3 Sample Characteristics
The target population of the study was defined as all customer-facing employees who have
worked in hotels in Thailand. This is because the internal branding concepts focused on
customer-facing employees (Khanyapuss Punjaisri & Wilson, 2007).
The Human Resources Departments of fifteen respondent hotels suggest that employees
from three departments, including Department of Front Office and Department of Food and
Beverage and Department of Housekeeping, fit with the customer interface terms as defined
by the concept of internal branding.
5.2.1.2 Survey Administration Procedure
The survey was administered in November 2013 – January 2014 in Thailand, in the form of a
self-completed pen and paper questionnaire. There are two reasons why this current study
needs to select this survey administration procedure. First, self-completion questionnaires
are considered as one of the ways to reduce the confounding influence of social desirability
bias and interviewer bias (Malhotra, 2008; Malhotra et al., 1996). Social desirability bias may
be triggered by interaction with the interviewer, particularly if the interviewee perceives the
interviewer’s status to be higher than his/ her own or the interviewer has a different cultural
background (Samuel Craig & Douglas, 2001). Second, assessment of literacy levels
confirmed that literacy enjoys a high priority in Thailand (93.5%), as estimated in 2012, and
therefore the self-completion method of survey administration was not a problem (Unicef,
2014).
The data collection process follows five steps:
First of all, the researcher of this study will go to the hotels and leave the questionnaires with
Human Resource Managers. Prior to conducting this survey, these Human Resource
Managers would be trained about the way to approach respondents, understand the

133
meaning of all questions and will also be aware how the hotel could fully benefit from the
research.
Second of all, when employees come to work, Human Resource Managers or Officers
introduce the research and ask for their permission to fill in the questionnaire. After they get
permission, they will explain the structure of the questionnaire and instructions to fill in the
form.
Third of all, employees could take one questionnaire and fill it in at a convenient time. When
finished, the Human Resource Managers or Officers check for any mistakes or unanswered
parts and immediately ask the respondents to correct or fill in those parts.
Fourth, the questionnaires can be returned by leaving it in the provided box or on a table
placed inside their department office.
Finally, the questionnaires will be gathered and collected by the researcher.
5.2.1.3 Instrument
The final survey instrument consists of 5 parts, as summarised below. A full copy of the
instrument is provided in Appendix 5.5.
Section One includes instructions on how to complete the questionnaire with customer-
facing employees.
Section Two includes the first 7 constructs of internal organizational communication, which
are: Communication climate, Relationship to supervisors, Organizational Integration, Media
Quality, Horizontal Communication, Organizational Perspective and Personal Feedback. All
items were measured on a 5-point Likert Scale ranging from “strongly disagree” (1) to
“strongly agree” (5).

134
Section Three includes the three constructs of employees’ brand attitudes: Employee
Commitment, Employee Identification and Employee Loyalty and, all items were measured
on a 5-point Likert scale with response outcomes ranging from “strongly disagree” (1) to
“strongly agree” (5).
Section Four includes the constructs of employees’ brand behaviour and these items were
also measured on a 5-point Likert scale with possible outcome measures ranging from
“strongly disagree” (1) to “strongly agree” (5).
Section Five investigates the respondents’ data.
5.2.1.4 Operationalisation of Constructs
Operational definitions of the constructs and their measurement instruments are detailed in
Table 5-5.

135
Table 5-4: Operational definitions of internal communication dimensions, employees’
brand attitudes and employees’ brand behaviour.
Definition of the constructs Authors
Communication climate The extent to which communication in an organisation motivates and stimulates workers to meet organisational goals
Downs and Hazen (1977), Bartels, Pruyn, De Jong, and Joustra (2007)
Relationship to superiors The upward and downward aspects of communicating with superiors
Downs and Hazen (1977), Alexander and Wilkins (1982)
Organisational integration The degree to which individuals receive information about their immediate work environment.
Downs and Hazen (1977), Zwijze-Koning and de Jong (2007)
Media quality. The extent to which meetings are well organized and written directives are short and clear.
Downs and Hazen (1977), Zwijze-Koning and de Jong (2007)
Organisational perspective. Information about the organisation as a whole, which includes notifications about changes, overall policies, and goals of the organisation.
Downs and Hazen (1977)
Horizontal communication The extent to which informal communication is accurate and free flowing, and includes perceptions of the grapevine.
Downs and Hazen (1977), Zwijze-Koning and de Jong (2007)
Personal feedback. Information concerning how workers are being judged and how their performance is being appraised.
Downs and Hazen (1977)
Employees’ Brand Commitment The extent of psychological attachment of employees to the brand, which influences their willingness to exert extra effort towards reaching the brand goals.
Punjaisri (2008),Mowday, Steers, and Porter (1979)
Employees’ Brand Identification An employee’s sense of belonging to the organization and a perception of being aligned to the organization’s brand values and promises.
Punjaisri (2008), Mael and Ashforth (1992)
Employees’ Brand Loyalty An employee’s willingness to remain with the current organization.
Punjaisri (2008), Chen and Francesco (2003), Meyer, Allen, and Smith (1993)
Employees’ Brand Behaviour Employee behaviours in delivering the brand promise.
Punjaisri (2008), Williams and Anderson (1991)
5.2.2 Data Analysis Strategy
Data analysis strategies were adopted to address objectives 1, 2 and 3, and hypotheses 1,
2, 3, 4, 5, 6, 7, 8, 9, 10 and 11, constituting four key steps. These steps and the objectives
they addressed are summarised in Table 5-6 below.

136
Table 5-5: Key Data Analysis Steps
Step Objective
Assessment of Raw Data To assess data for inconsistencies and
safeguard form non-ignorable missing data
patterns
Measure Development and Validation
(Exploratory Factor Analysis, Confirmatory
Factor Analysis, and Structural Equation
Modelling)
To ensure soundness of new and existing
measures
Objectives and Hypotheses testing, including:
Operationalisation of Communication climate
(CC); Relationship to Supervisory (Relation);
Organization integration (OI); Media quality
(MQ); Horizontal communication (HC);
Organisational perspective (OP); Personal
feedback (PF); Employees’ brand
identification (EI); Employees’ brand
commitment (EC); Employees’ brand loyalty
(EL); and Employees brand performance
(EP)
To test Objective 1 and 2 (with Hypotheses
1, 2, 3, 4, 5, 6, 7, 8, 9 and 10): the
hypothesised relationships between each
domain of internal communication
satisfaction and employees’ brand outcomes.
Structural Equation Modelling with high/ low
performance hotels
To test Objective 3 (with Hypothesis 11): the
internal communication satisfaction
delineated in the internal branding process of
both high and low performance hotels
5.2.2.1 Questionnaire Audit and Missing Data
As reported in Section 5.2.1.1.2, a total of 1,796 responses were collected. Returned
questionnaires were audited for inconsistencies such as process and response bias (Samuel
Craig & Douglas, 2001). However, due to some missing data, only 1,747 were considered
appropriate for further analysis.
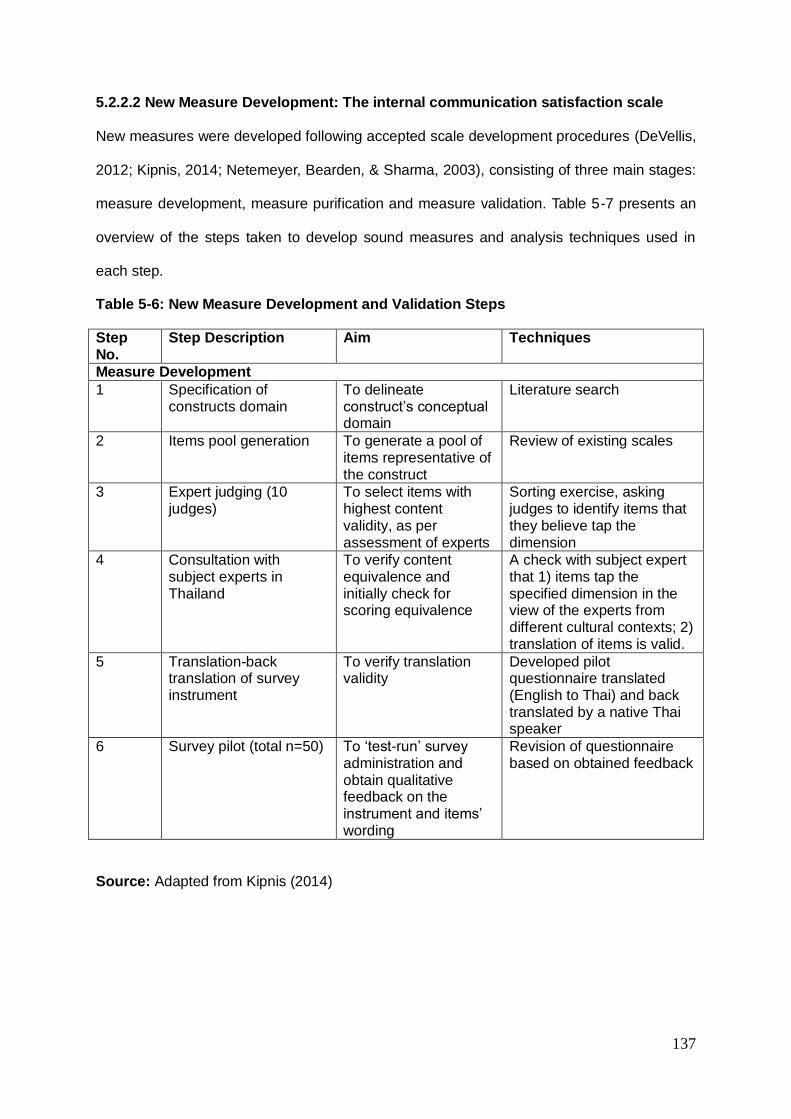
137
5.2.2.2 New Measure Development: The internal communication satisfaction scale
New measures were developed following accepted scale development procedures (DeVellis,
2012; Kipnis, 2014; Netemeyer, Bearden, & Sharma, 2003), consisting of three main stages:
measure development, measure purification and measure validation. Table 5-7 presents an
overview of the steps taken to develop sound measures and analysis techniques used in
each step.
Table 5-6: New Measure Development and Validation Steps
Step No.
Step Description Aim Techniques
Measure Development
1 Specification of constructs domain
To delineate construct’s conceptual domain
Literature search
2 Items pool generation To generate a pool of items representative of the construct
Review of existing scales
3 Expert judging (10 judges)
To select items with highest content validity, as per assessment of experts
Sorting exercise, asking judges to identify items that they believe tap the dimension
4 Consultation with subject experts in Thailand
To verify content equivalence and initially check for scoring equivalence
A check with subject expert that 1) items tap the specified dimension in the view of the experts from different cultural contexts; 2) translation of items is valid.
5 Translation-back translation of survey instrument
To verify translation validity
Developed pilot questionnaire translated (English to Thai) and back translated by a native Thai speaker
6 Survey pilot (total n=50) To ‘test-run’ survey administration and obtain qualitative feedback on the instrument and items’ wording
Revision of questionnaire based on obtained feedback
Source: Adapted from Kipnis (2014)

138
Table 5-6: New Measure Development and Validation Steps
Step No. Step Description Aim Techniques
Data collection – survey (total n= 1, 747; High ranking hotel n= 1,212; Low ranking hotel n= 535)
Measure Purification
7 Measure purification: 1) on two half samples, one per each ranking of hotel; high n = 606; low n=268 ); 2) on pooled half sample (n = 873)
To obtain, for each measure, a set of internally consistent items that load on one factor
Inter-item correlations; Item-total correlations; Exploratory Factor Analysis; Assessment of KMO Measure of Sampling Adequacy (>.4, as recommended by Ford, MacCallum, & Tait 1986) and significance of Bartlett’s test of Sphericity
Measure Validation
8 Normality assessment To ensure data is suitable for Structural Equation Modelling (Confirmatory Factor Analysis)
Examination of skewness and kurtosis statistics
9 Measure validation on different ranking hotels haft sample (high n=606 ; low n =267), as follows:
9a) Undimensionality confirmation
To eliminate items that display high residuals with other items, to weed out items with poor reliability and to arrive at an equivalent well-fitting measurement model for both high and low ranking samples
Confirmatory Factor Analysis Residuals and square multiple correlations assessment Fit indices examination
9b) Reliability assessment
To ensure that construct reliability is acceptable (>.6, as recommended by Bagozzi and Yi (1988) for each final model)
Confirmatory Factor Analysis
9c) Face validity assessment
Assessing the remaining items alongside construct definition
9d) Convergent validity assessment
To ensure that the measures in the well-fitting model converge (i.e. are highly significantly correlated)
Examination of factor loading for each item and assessment of average variance extracted (AVE) for acceptability (>.5, as recommended by Fornell and Larcker (1981))
Source: Adapted from Kipnis (2014)

139
Table 5-6: New Measure Development and Validation Steps
Step No.
Step Description Aim Techniques
10 Measure validation on pooled half sample (n=873)
10a) Undimensionality confirmation
To verify the model is well-fitting when specified on the pooled sample
Confirmatory Factor Analysis Residuals and square multiple correlations assessment Fit indices examination
10b) Reliability assessment
To ensure that construct reliability is acceptable (>.6, as recommended by Bagozzi and Yi (1988)) for each final model
Confirmatory Factor Analysis
10c) Convergent validity assessment
To ensure that the measures converge (i.e. are highly significantly correlated) in a well-fitting model when the model is specified on the pooled sample
Examination of factor loadings for each item and assessment of average variance extracted (AVE) for acceptability (>.5, as recommended by Fornell and Larcker (1981))
11 Nomological validity assessment
To ensure the new measures operate ‘lawfully’ within a set of theoretical constructs
Examination of inter-construct correlations constructed with 90% confidence interval, to ascertain confidence intervals for each pair of construct do not display unity (i.e. indicating the constructs occupy identical domains).
Source: Adapted from Kipnis (2014)
5.2.2.2.1 Measure Development Stage
Measure of internal communication satisfaction with Communication Climate (CC),
Relationship to Supervisor (Relation), Organization integration (OI), Media quality (MQ),
Horizontal communication (HC), Organisational perspective (OP), and Personal feedback
(PF) were the new measures developed for this study. Measure development was
considered to be required after the review of existing measures available in the literature
identified a lack of studies approaching analysis of internal communication satisfaction in
developing country contexts. Although around 7 acculturation scales exist, the majority of

140
them were developed to measure internal communication satisfaction in the context of
developed countries. Measure development steps will now be detailed.
Specification of Constructs Domain
To specify the domain of the constructs, a conceptual definition of Internal Communication
Satisfaction was created from the Downs-Hazen Instrument (CSQ).
Generation of Initial Items Pool
Having specified the conceptual domain for each internal communication satisfaction
construct, a sample of items designed to tap each construct was developed. Items were
sourced from published scales and they identified that the internal communication
satisfaction could be tapped in the same way, irrespective of culture in focus. Many of the
reviewed published acculturation scales (Alexander & Wilkins, 1982; Bartels et al., 2007;
Downs & Hazen, 1977; Zwijze-Koning & de Jong, 2007) utilise identically-worded items
adapted to tap the internal communication satisfaction with different countries (Appendix
5.1). This discovery was considered important since a measurement tool utilising identical
items for the internal communication satisfaction may enhance the applicability of the scale
for future studies in different country contexts and usability for practitioners.
Expert Judging (Preliminary study)
According to the Communication Satisfaction Questionnaire (CSQ), which was developed by
Downs and Hazen (1977), 7 constructs make up the set of identifiable and measurable
components associated with the internal communication satisfaction constructs. To illustrate
this point, this current study identifies the domains of measurable components representing
the internal communication satisfaction constructs though a literature review of past research
on the concept of internal branding in Chapter 3. The result suggests that 7 constructs with
59 items can be indirectly represented by the domains of internal communication in the
concept of internal branding (Appendix 5.1). However, according to the study of Hair and

141
Lukas (2014), researchers need to conduct the domains of measurable components by
expert judgements in the next step, in order to select and indicate for each construct of
internal communication based on the given operational definitions.
According to the study of Voss, Tsikriktsis, and Frohlich (2002), expert judgement comes
from the key informants who are important for providing reliable answers to the research
questions. Therefore, researchers should focus attention on selecting expert judgement.
Initial discussions with the Thai Hotel Association were carried out to gain insight into the
best choices for expert judgement in this current study. The expert judgement process was
administered by 10 hotel managers (5 general managers of high ranking hotels and 5
general managers of low ranking hotels) who are members of the Thai Hotel Association.
The general managers from the two types of hotels were considered expert judges because
they could make decisions about how employees from these hotels were being informed and
educated to ensure their understanding of brand values and, thus, brand supporting
behaviours. To ensure that expert judging sessions are productive, a moderator’s guide must
be prepared (Hair & Lukas, 2014). A moderator’s guide is a detailed outline of instructions
and information to successfully complete the task. The study of Hair and Lukas (2014)
suggests that a moderator’s guide uses a structured outline format with a sequence of
opening, introductory, transition, substantive, and ending questions (Appendix 5.3).
Converting information from all 10 expert judgement responses so it can be transferred to a
data warehouse is referred to as analysing and reporting the results. First of all, items were
entered into a spreadsheet that enables the research analyst to manipulate and transform
the data into useful information. Second of all, researchers must make decisions in the pilot
questionnaire in order to make appropriate inclusion/ exclusion decisions based on the
responses to these questions. According to the study of Hardesty and Bearden (2004),
researchers can calculate the average rank of importance agreement on the items selected
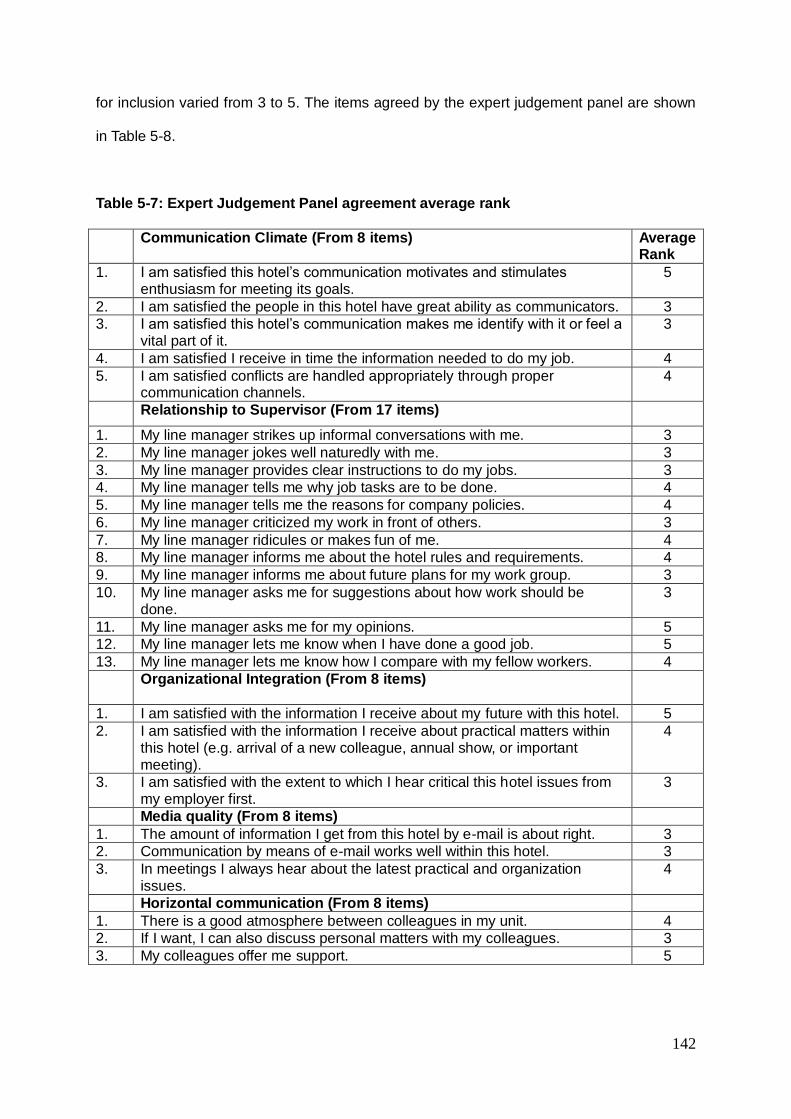
142
for inclusion varied from 3 to 5. The items agreed by the expert judgement panel are shown
in Table 5-8.
Table 5-7: Expert Judgement Panel agreement average rank
Communication Climate (From 8 items) Average Rank
1. I am satisfied this hotel’s communication motivates and stimulates enthusiasm for meeting its goals.
5
2. I am satisfied the people in this hotel have great ability as communicators. 3
3. I am satisfied this hotel’s communication makes me identify with it or feel a vital part of it.
3
4. I am satisfied I receive in time the information needed to do my job. 4
5. I am satisfied conflicts are handled appropriately through proper communication channels.
4
Relationship to Supervisor (From 17 items)
1. My line manager strikes up informal conversations with me. 3
2. My line manager jokes well naturedly with me. 3
3. My line manager provides clear instructions to do my jobs. 3
4. My line manager tells me why job tasks are to be done. 4
5. My line manager tells me the reasons for company policies. 4
6. My line manager criticized my work in front of others. 3
7. My line manager ridicules or makes fun of me. 4
8. My line manager informs me about the hotel rules and requirements. 4
9. My line manager informs me about future plans for my work group. 3
10. My line manager asks me for suggestions about how work should be done.
3
11. My line manager asks me for my opinions. 5
12. My line manager lets me know when I have done a good job. 5
13. My line manager lets me know how I compare with my fellow workers. 4
Organizational Integration (From 8 items)
1. I am satisfied with the information I receive about my future with this hotel. 5
2. I am satisfied with the information I receive about practical matters within this hotel (e.g. arrival of a new colleague, annual show, or important meeting).
4
3. I am satisfied with the extent to which I hear critical this hotel issues from my employer first.
3
Media quality (From 8 items)
1. The amount of information I get from this hotel by e-mail is about right. 3
2. Communication by means of e-mail works well within this hotel. 3
3. In meetings I always hear about the latest practical and organization issues.
4
Horizontal communication (From 8 items)
1. There is a good atmosphere between colleagues in my unit. 4
2. If I want, I can also discuss personal matters with my colleagues. 3
3. My colleagues offer me support. 5
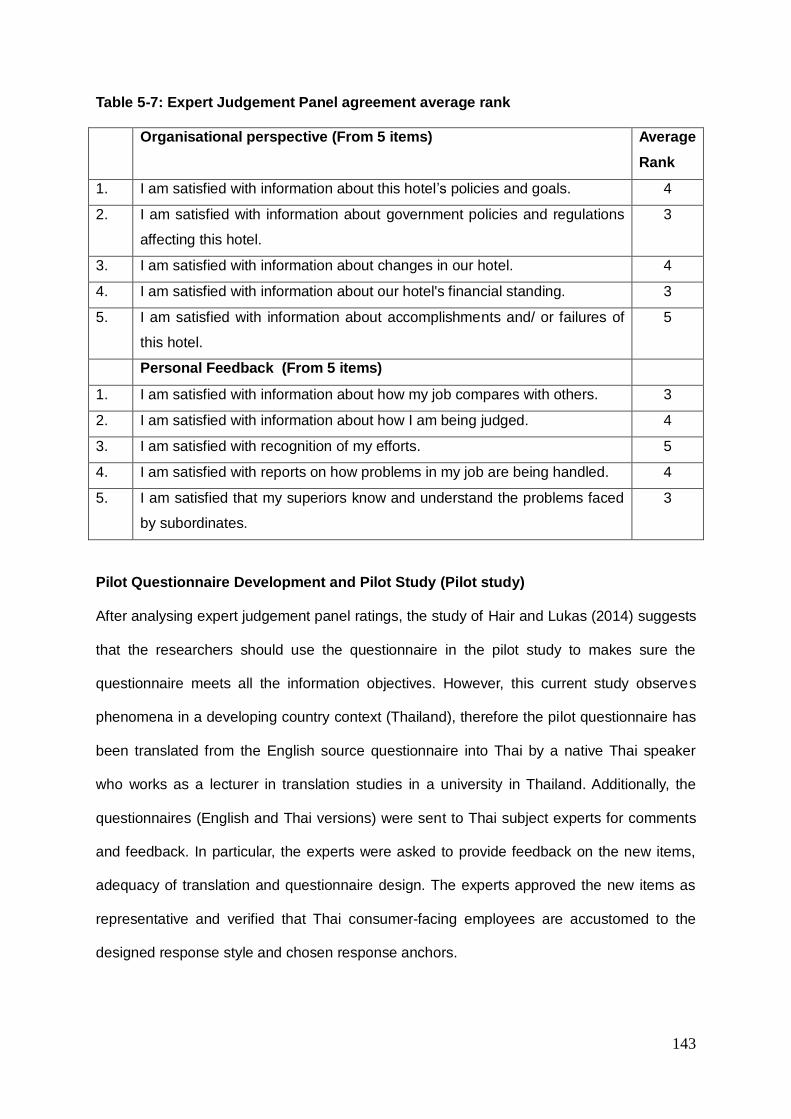
143
Table 5-7: Expert Judgement Panel agreement average rank
Organisational perspective (From 5 items) Average
Rank
1. I am satisfied with information about this hotel’s policies and goals. 4
2. I am satisfied with information about government policies and regulations
affecting this hotel.
3
3. I am satisfied with information about changes in our hotel. 4
4. I am satisfied with information about our hotel's financial standing. 3
5. I am satisfied with information about accomplishments and/ or failures of
this hotel.
5
Personal Feedback (From 5 items)
1. I am satisfied with information about how my job compares with others. 3
2. I am satisfied with information about how I am being judged. 4
3. I am satisfied with recognition of my efforts. 5
4. I am satisfied with reports on how problems in my job are being handled. 4
5. I am satisfied that my superiors know and understand the problems faced
by subordinates.
3
Pilot Questionnaire Development and Pilot Study (Pilot study)
After analysing expert judgement panel ratings, the study of Hair and Lukas (2014) suggests
that the researchers should use the questionnaire in the pilot study to makes sure the
questionnaire meets all the information objectives. However, this current study observes
phenomena in a developing country context (Thailand), therefore the pilot questionnaire has
been translated from the English source questionnaire into Thai by a native Thai speaker
who works as a lecturer in translation studies in a university in Thailand. Additionally, the
questionnaires (English and Thai versions) were sent to Thai subject experts for comments
and feedback. In particular, the experts were asked to provide feedback on the new items,
adequacy of translation and questionnaire design. The experts approved the new items as
representative and verified that Thai consumer-facing employees are accustomed to the
designed response style and chosen response anchors.
144
Hair and Lukas (2014) suggest that the pilot study should come from people representing
the individuals who will be asked to actually fill out the survey. Therefore, a sample of 50
respondents was involved in the study that comes from Thai consumer-facing employees in
a hotel in Thailand. They were asked to provide qualitative feedback on any aspect of the
questionnaire including words, phrases, instructions, and question flow patterns and point
out anything they felt was confusing, difficult to understand, or otherwise a problem (Hair &
Lukas, 2014). When using the pilot study (Appendix 5.4), this feedback was useful for
handling wording issues and analysing reliability/ validity issues at this point.
Finally, the questionnaire was made into its final format so the collection of data could begin
(Appendix 5.5). The final questionnaire was used in the main survey that was translated form
English to Thai.
Data Collection – Survey (Main Study)
As reported in Section 5.2.1.1.2, the final sample size utilised for the analysis equalled
1,747. Those utilised for analysis equalled 1,212 and 532 for high ranking and low ranking
performance respectively. Data collected in the main survey served to:
- Purify and validate all measures
- Test the objective and hypotheses concerning the relationship between internal
communication satisfaction and employees’ brand attitudes and performance in the concept
of internal branding.
- Evaluate the influence of internal communication on employees’ behaviour from high/
low performance employees in a developing economy.
5.2.2.2.2 Measure Purification and Validation Stage: An Overview
As outlined in Table 5-3, new measure purification and validation was conducted sequentially
on sample size and high/ low performance employees. The sample size was randomly split
into different halves for the measure purification and validation stage, to minimise decision-

145
making based on samples’ idiosyncrasies. Samples used for the measure purification stage
equalled 606 and 268 for high and low ranking performance samples respectively. Samples
used for the measure validation stage equalled 606 and 267 for high and low ranking
performance samples respectively.
Measure purification was conducted utilising Exploratory Factor Analysis (EFA) and following
a conventional method recommended by Churchill (1979). All items expected to tap a
particular construct were factor analysed together; the first half of the sample and then the
second half of the sample. Given that all seven new measures were a priori specif ied as
unidimensional, the initial EFA sought to verify that one factor was extracted as
hypothesised. Next, each construct was assessed for internal consistency to identify items
displaying poor properties by inspecting the inter-item and item-total correlation values. Low
inter-item and item-total correlations serve as indicators of an item not sharing common
variance, and, therefore conceptual domains with other items in the construct (Netemeyer et
al., 2003).
Given that Exploratory Factor Analysis in the strictest sense of the term does not provide
evidence of items belonging to only one factor, item properties and factor structure of the
measures were further assessed by subjecting them to a more rigorous Confirmatory Factor
Analysis (CFA) procedure (Anderson & Gerbing, 1988). Overall model fit indices and
assessment of individual items’ residuals, composite reliability, convergent validity and
measurement invariance on the first half and second half of the samples via CFA served to
verify emic validity, equivalence and acceptability of final measures for pooled level analysis
(Hooper, Coughlan, & Mullen, 2008; Netemeyer et al., 2003; Steenkamp & Baumgartner,
1998). Finally, assessment of discriminant validity and nomological validity of new measures
served to establish evidence of them possessing unique properties rather than being
extensions of existing constructs and operating as expected in relation to established

146
constructs within hypothesised nomological networks. The full purification and validation
process and the results of the analysis are reported in Chapter 6.
5.2.2.2.3 Assessment of Existing Measures
Four existing measures, Employees’ Brand Commitment (Mowday et al., 1979), Employees’
Brand Identification (Punjaisri, 2008), Employees’ Brand Loyalty (Punjaisri, 2008), and
Employees’ Brand Performance (Punjaisri, 2008) were used in the study (Appendix 5.2).
However, it is necessary to ensure that these measures’ properties are reliable and valid in
the context of the conducted study’s sample. Thus, existing measure validation was
conducted following recommended step-by-step validation procedure (Ping, 2004). This
procedure is summarised in Table 5-9, and the results of the analysis are reported in the
next Chapter 6.
Table 5-8: Existing Measures Validation Steps
No. Step-by-step
description
Goal Techniques
Conducted on Full Sample (n = 1,747)
1 An assessment
of the normality
of data
To ensure the data's future
usability for Confirmatory
Factor Analysis
Interpreting skewness and
kurtosis statistics
2 Confirmation of
unidimensionality
To verify a good model when
specified on the pooled sample
Confirmatory Factor Analysis
The Squared Multiple Correlation
Fit indices examination
3 Reliability
Assessment
To ensure construct validity for
each final model (ideally larger
than 0.6, as recommended by
Bagozzi and Yi (1988))
Confirmatory Factor Analysis
4 Convergent
Validity
To ensure that all factor
coefficients are highly
significant in a well-fitting
model
Testing of factor loadings for
each item and the average
variance extracted (AVE) should
exceed 0.50 for acceptability
(Fornell & Larcker, 1981).
Source: Adapted from Kipnis (2014)

147
5.2.2.2.4 Testing Objectives and Hypotheses
Having verified validity of measures, objectives 1, 2, and 3 and hypotheses 1, 2, 3, 4, 5, 6, 7,
8, 9, 10 and 11 were tested.
Objective 1 was concerned with the relationships between each of the seven domains of
internal communication (Organizational Perspective, Organizational Integration, Personal
Feedback, Relationship with Supervisors, Horizontal Informal Communication, Media Quality
and Communication climate) and employees’ brand attitudes (Employees’ brand
commitment, identification, and loyalty) and employees’ brand performance. Hypotheses 1,
2, 3, 4, 5, 6 and 7 were tested by using structural equation modelling.
Objective 2 was concerned with testing measurement invariance in the second-order factor
model of internal communication satisfaction and the relationships between the second-
order factor structure of internal communication satisfaction and employees’ brand attitudes
and employees’ brand performance. Hypotheses 8, 9 and 10 were tested by using structural
equation modelling.
Objective 3 was concerned with whether performance rankings in hotels affect the internal
communication satisfaction employees and their brand attitudes and brand performance;
specifically, the impact of internal communication satisfaction will be stronger in hotels, which
are ranked highly by customers. Hypothesis 11 was tested by using structural equation
modelling.
Structural Equation Modelling
Structural Equation Modelling (SEM) is a statistical methodology, which is employed to take
a confirmatory (hypothesis-testing) approach to the analysis of a structural theory bearing on
some phenomenon (Byrne, 2013). The SEM has a good understanding of multiple
regression (examining dependence relationships) and factor analysis (representing

148
unmeasured factors with multiple variables), in order to estimate a series of interrelated
dependence relationships simultaneously (Hair et al., 1998).
There are two reasons why the SEM has been used in almost every conceivable field of
study, such as marketing, psychology, and organizational behaviour. First of all, the SEM
provides a straightforward method of dealing with multiple relationships simultaneously while
providing statistical efficiency. Second of all, the SEM can assess the relationships
comprehensively and provide a transition from exploratory to confirmatory analysis (Hair et
al., 1998, p. 578).
In SEM, there are two kinds of variables: latent variables and observed variables. In the
behavioural sciences, researchers are often interested in studying theoretical constructs that
cannot be observed directly. These abstract phenomena are termed latent variables (Byrne,
2013, p. 4). Since latent variables are not observed directly, it follows that they cannot be
measured directly. Therefore, the latent variables are associated to one that is observable,
thereby making its measurement possible. These measurements are referred to as observed
variables (Byrne, 2013, p. 4).
Additionally, in SEM, there are two kinds of models: measurement model and structural
model. The measurement model is a sub model in SEM that (1) specifies the indicators for
each construct, and (2) assesses the reliability of each construct for estimating the causal
relationships (Hair et al., 1998, p. 581). This means that the measurement model shows the
relationship between a latent variable and its observed variables. The structural model is a
set of one or more dependence relationships linking the hypothesized model constructs. It is
useful in representing the interrelationships of variables between dependence relationships
(Hair et al., 1998, p. 583).

149
Types of Structural Equation Models
There are the three major types of structural equation models: Confirmatory Factor Analysis
(CFA); Path Analysis with observed variables; and Path analysis with latent variables.
The study of Hair et al. (1998, p. 579) defined the Confirmatory Factor Analysis (CFA) as the
use of a multivariate technique to test (confirm) a pre-specified relationship because the
model (hypothesis) is specified a priori or based on theory. The CFA is the opposite of
Exploratory Factor Analysis (EFA). The EFA is the analysis that defines possible
relationships in only the most general form and then allows the multivariate technique to
estimate relationships. For the opposite of the CFA, the researchers do not require a priori
hypothesis about relationships within their model, but instead the method and the data
define the nature of the relationships.
Observed Variable Path Analysis (OVPA) is the method that employs simple bivariate
correlations to estimate the relationship among constructs represented by direct measured
(observed) variables (Hair et al., 1998).
Latent Variable Path Analysis (LVPA) is a simultaneous test of measurements and structural
parameters, which tests CFA and OVPA at the same time.
Structural Equation Modelling VS Regression Analysis
It is often debated as to why SEM has an advantage over regression when it comes to
multiple indicators. According to the study of Hoyle (1995), the main reasons are that SEM
considers the measurement error whereas regression does not. Additionally, SEM allows for
multiple variables; regression allows only a single department variable. Finally, SEM allows
variables to correlate, whereas regression adjusts for other variables in the model.
150
Therefore, this thesis used SEM as a statistical technique for testing and estimating the
nomological network of relationships between the internal communication, employees’ brand
attitudes and employees’ brand behaviour.
SEM Assumptions
1.) Independent Observation
The SEM assumes that observations are independents. This means that the answers of one
observation do not affect the choice of the other observation.
2.) Linearity
The SEM assumes a relationship between variables, which is linear.
3.) The normality of the data
Normality is one of the basic assumptions required in order to carry out SEM analysis. The
skewness and kurtosis can be used to test the normality of a given data set (Baumgartner &
Steenkamp, 1996; Byrne, Shavelson, & Muthén, 1989).
4.) Continuous data
In SEM assumptions, the data must be continuous. The study of Jöreskog and
Sörbom (1996) suggests that Likert scale data is considered to be continuous data.
Estimation method
According to the study of Bollen (1989), it was found that the maximum likelihood estimation
(MLE) is the best suited when the sample size is larger than 200. Additionally, the MLE
commonly employed in structural equation models is a procedure, which iteratively improves
parameter estimates to minimize a specified fit function (Hair et al., 1998). Therefore, the
MLE is the estimation procedure used in this current study.

151
Two-step approach to modelling
Many studies suggest analysing SEM via two-step method (Anderson & Gerbing, 1988;
Jöreskog, 1993). First of all, the researcher chooses indicators to measure the construct
before the hypotheses are tested through the structural model. Second, the structural model
was developed to test the hypothesised relationships.
This two-step method was followed during the study. Internal communication scale in internal
branding concept was created and validated after identifying and eliminating items from
scale results in the consequences of model misspecification before arriving at a good-fitting
measurement model. At the second stage, the structure model was developed to test the
hypothesised relationships between internal communication constructs and employees’
brand outcomes in internal branding concept.
Confirmatory Factor Analysis (CFA) and SEM
In the structure model, the researcher needs to determine the best-fit values of the model by
avoiding misspecification. The way to detect these specification errors is to study residuals.
The Analysis of Residuals provides the differences between the observed and the predicted
correlation. According to the study of Hair et al. (1998) and Steenkamp and Van Trijp (1991),
they suggest that residual values -2.58 and greater than 2.58 are statistically significant at
the 0.05 level, indicating an estimation error between a pair of indicators. The use of the
residuals is shown by using the modification indices for the analysis.
In the measure validation study, modification indices show the improvement in good model
fit. To assess reliability, concurrent validity and predictive validity of items were achieved by
removing items that have higher residual error of whose modification indices suggested that
they were located in more than one variable, or whose error term correlated with the error
term of another item that violated the measurement theory’s undimentionality assumption
(Anderson & Gerbing, 1988).

152
5.2.3 The Survey data collection and analysis process
The survey data collection and analysis can be better understood in Table 5-10.
Table 5-9: Summary: The Survey data collection and analysis process
Objectives Method Analysis Strategy
Measure Development Expert Judgement (n=10)
Pilot test (n=50)
Best item selection based on Judge’s agreement percentage.
Inter-item correlation analysis
Measure Validation (All Hotels)
Main Survey (n=1,747) Confirmatory Factor Analysis
Reliability and validity assessment
Testing of Hypotheses 1-10 (All Hotels)
Main Survey (n=1,747) Structural Equation Modelling
Testing of Hypothesis 11 (High Ranking Hotels)
Main Survey (n = 1,212) Structural Equation Modelling
Testing of Hypothesis 11 (Low Ranking Hotels)
Main Survey (n = 535) Structural Equation Modelling
5.3 Reliability and Validity Considerations
Reliability and validity considerations are an important aspect of any scholarly research. This
section reviews the key steps taken to minimise potential sources of bias and error during
data collection and analysis of quantitative research. It also acknowledges potential sources
of bias as limitations.
5.3.1 Reliability Considerations
The decision about minimising measurement errors by researchers is the most important
factor in quantitative research reliability (Kipnis, 2014). In marketing research measurement
errors may stem from inconsistency of how measures were obtained and inconsistency of
assessment of how measurement tools behave across samples, leading to invalid
conclusions (Kipnis, 2014). According to the study of Van de Vijver (2001), two levels of bias
have been identified: method bias, and constructs and items bias. The suggested bias
approaches of Van de Vijver (2001) constituted evidence of effort at research design, and
the data collection and analysis stages were recorded in this chapter and are summarised
below.
153
Method bias refers to the nuance factors that are created from sampling, the way the
instruments or administration are constructed (Kipnis, 2014). The following steps were taken
to protect the research from these nuisances:
- Selection of research context (Thailand) and sampling frame were suggested by
conceptualisation and the research goals (Kipnis, 2014; Samuel Craig & Douglas, 2001).
Selection of a nonprobability sampling frame assured sampling of hotel employees by
customer interface criterion to satisfy the definition of the target population in the concept of
internal branding. It was acknowledged that the sampling frame is not fully representative of
Thai hotel employees. Therefore, the results may not be generalizable across country levels.
- In terms of protecting from the instrument bias, instrument translation-back
translation was managed by a professional Thai interpreter. The instrument was
subsequently verified for translation nuances and response style through a pilot study in
Thailand and consultations with local experts.
- To protect from mode of administration bias, using self-completion format of
administration would help to protect anonymity for respondents and assurance that there are
no 'right' or 'wrong' answers to the posed questions that were implemented to minimise
social desirability and interviewer bias (Kipnis, 2014; Van de Vijver, 2001).
- To protect from errors in measurements arising from process and recording bias,
returned questionnaires were examined for inconsistencies and the final dataset was
assessed for existence of patterns in missing data. It is acknowledged that, as measuring
social phenomena, this current study is subject to the risk of measurement error arising
through conditioning, however, conditioning effects are very difficult to prevent and to an
extent all social science studies are prone to conditioning risks (Kipnis, 2014; Warren &
Halpern-Manners, 2012).

154
Construct bias conduces that constructs being measured in the study are not equivalent
across contexts, both at a theoretical and at a measurement level (Kipnis, 2014). That is, the
constructs do not have exactly the same conceptual meaning across contexts in the study or
have different structures. Item bias refers to an item of a measure having a different
psychological meaning of words across contexts. These differences can arise from bad
translation or inapplicability of item contents to the cultural context. Steps taken to protect
against construct and item bias were:
- The primary objective of this current study was thus to domain the internal
communication in the concept of internal branding by using a standardised instrument, the
Down-Hazen Communication Satisfaction Questionnaire (CSQ). With regards to a
standardised instrument utilised in this current study, use of validation of these measures in
Confirmatory Factor Analysis assured acceptability of the measures to the study sample
(Kipnis, 2014; Ping, 2004).
- Item development followed accepted guidelines (Kipnis, 2014; Netemeyer et al.,
2003), and clarity and validity of the developed items were verified through expert judgement
(Kipnis, 2014). The translated-back translated items in Thai were evaluated for translation
equivalence and nuances by local experts in Thailand, to protect from item bias arisen from
translation.
A further consideration concerning threats to reliability is the process of statistical inferences.
In chapter 6 and 7 this thesis will demonstrate the intermediary and final results of measure
validation, in order to ensure and provide evidence of reliability and validity of the util ised
measures. Additionally, theses chapters will show the assumptions concerning interpretation
of model fit statistics that served for the basic decisions on measure reliability and validity
are reported.

155
5.3.2 Validity Considerations
In statistics, validity is the extent to which a measurement adequately represents what it is
supposed to represent and that it functions in a set of relationships representative of the
developed theory. A process for enhancing the validity of measurement through which
construct and nomological validity are utilised to test hypotheses regarding the relationship
between internal communication satisfaction and employees’ brand attitudes and employees’
brand behaviour was assessed in detail in Section 5.3.6, with results reported in the next
Chapter 6.
The external validity is concerned with the validity of generalized inferences in the findings
and the developed theory. In this current study, it was acknowledged that the sample could
not be statistically representative of the target population. Nevertheless, the main goal of this
current study aims to conceptualise the domain of internal communication satisfaction in the
concept of internal branding and its influence on employees’ brand attitudes and employees’
brand behaviours. Therefore, the generalisability of the study’s results to target population is
not possible in statistical terms, but the results are valuable in the concept of internal
branding by showing the domain of internal communication satisfaction and its influence on
employees’ brand outcomes.
5.4 Summary
This chapter has shown the research methodology relevant to the study and data-collection
process. The data-collection process includes expert judgement, pilot study, supervision of
data-collection, and validation of data-collection. Finally, reliability and validity were
considered from the quantitative research, and steps followed to minimise bias and error
were summarised. Limitations of the study were acknowledged as part of these
considerations. The Table 5-11 below outlines a summary of this methodology chapter.

156
Table 5-10: Methodology Chapter Summary Study Objectives Sample
Size Analysis strategy Software
Used Hypothesis
1 Expert Judgement Panel
To validate the internal communication scale
To examine relationships between the internal communication, employees’ brand attitudes and employees’ brand behaviour
10 Measure Development: Judge’s agreement percentage
MS Excel 2010
N/A
2 Pilot Test
50 Measure Development: Inter-item correlation analysis
SPSS 20.0 N/A
3 Main Survey
1,747 Measure Validation: CFA, Reliability and validity for all hotels (n=1,747)
Testing of Hypotheses: Second order CFA, Structural Equation Modelling for all hotels (n=1,747)
Testing of Hypotheses: Second order CFA, Structural Equation Modelling for high ranking hotels (n=1,212)
Testing of Hypotheses: Second order CFA, Structural Equation Modelling for low ranking hotels (n=535)
SPSS 20.0 Amos
O1, O2, O3 H1, H2, H3, H4, H5, H6, H7, H8, H9, H10, H11
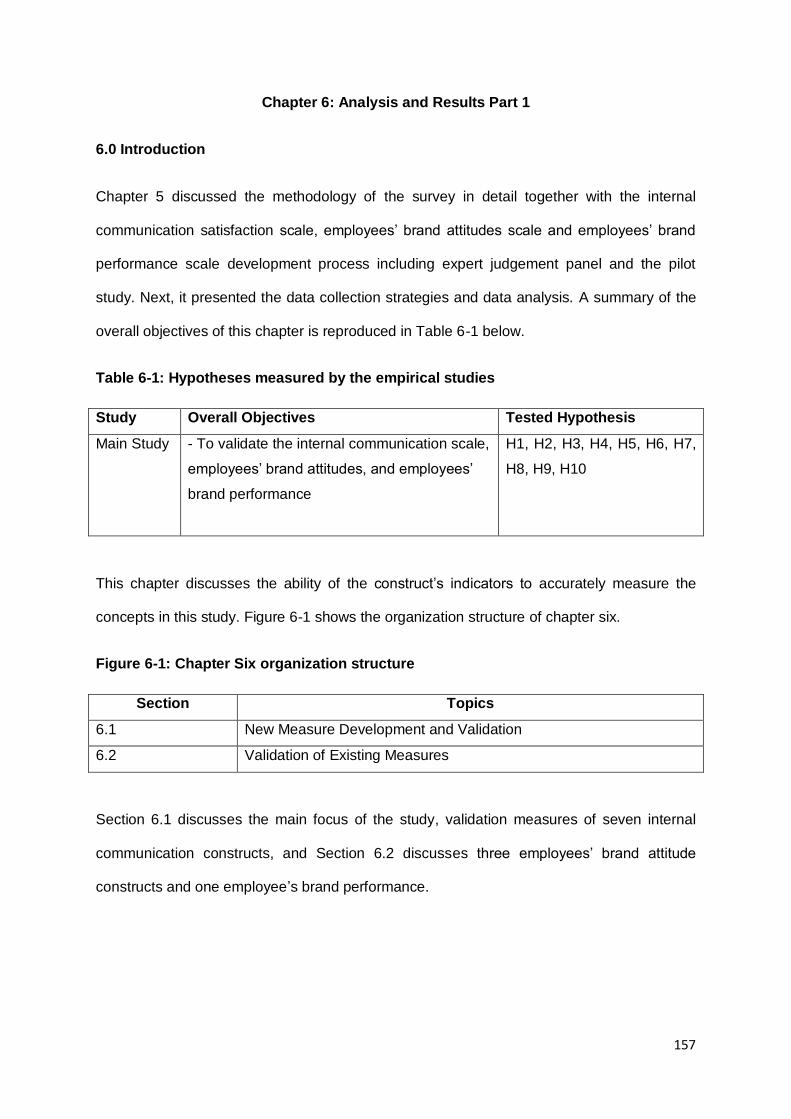
157
Chapter 6: Analysis and Results Part 1
6.0 Introduction
Chapter 5 discussed the methodology of the survey in detail together with the internal
communication satisfaction scale, employees’ brand attitudes scale and employees’ brand
performance scale development process including expert judgement panel and the pilot
study. Next, it presented the data collection strategies and data analysis. A summary of the
overall objectives of this chapter is reproduced in Table 6-1 below.
Table 6-1: Hypotheses measured by the empirical studies
Study Overall Objectives Tested Hypothesis
Main Study - To validate the internal communication scale,
employees’ brand attitudes, and employees’
brand performance
H1, H2, H3, H4, H5, H6, H7,
H8, H9, H10
This chapter discusses the ability of the construct’s indicators to accurately measure the
concepts in this study. Figure 6-1 shows the organization structure of chapter six.
Figure 6-1: Chapter Six organization structure
Section Topics
6.1 New Measure Development and Validation
6.2 Validation of Existing Measures
Section 6.1 discusses the main focus of the study, validation measures of seven internal
communication constructs, and Section 6.2 discusses three employees’ brand attitude
constructs and one employee’s brand performance.

158
6.1 New Measure Development and Validation: Internal Communication Satisfaction
The conceptual model developed in Chapter 2 postulates Communication climate (CC);
Relationship to Supervisor (Relation); Organization integration (OI); Media quality (MQ);
Horizontal communication (HC); Organisational perspective (OP); and Personal feedback
(PF) as constructs that influence employees’ communication satisfaction aligned to
employees’ brand attitudes and behaviours. Operational definitions of the 7 constructs given
in Table 6-2 below are based on conceptual definitions of the Downs-Hazen Communication
Satisfaction Questionnaire (CSQ) developed by Downs & Hazen (1977).
Table 6-2: Operational Definitions of Communication climate (CC); Relationship to
Supervisor (Relation); Organization integration (OI); Media quality (MQ); Horizontal
communication (HC); Organisational perspective (OP); and Personal feedback (PF)
Abbreviation
Construct Operational Definition
CC Communication climate
The extent to which communication in an organisation motivates and stimulates workers to meet organisational goals (Downs & Hazen, 1977)
Relation Relationship to superiors
The upward and downward aspects of communicating with superiors (Downs & Hazen, 1977)
OI Organisational integration
The degree to which individuals receive information about their immediate work environment (Downs & Hazen, 1977)
MQ Media quality The extent to which meetings are well organized and written directives are short and clear (Downs & Hazen, 1977)
HC Horizontal communication
The extent to which informal communication is accurate and free flowing, and includes perceptions of the grapevine (Downs & Hazen, 1977)
OP Organisational perspective
Information about the organisation as a whole, which includes notifications about changes, overall policies, and goals of the organisation (Downs & Hazen, 1977)
PF Personal feedback Information concerning how workers are being judged and how their performance is being appraised (Downs & Hazen, 1977)
Based on the definitions above, CC, Relation, OI, MQ, HC, OP, and PF scales were
developed as measures of seven independent unidimensional constructs. As detailed in
Chapter 5 (Section 5.2.2.2), the CC, Relation, OI, MQ, HC, OP, and PF scales development
procedure consisted of three main stages: development, purification and validation. The step

159
by step analysis process adopted for each stage is detailed in Figure 6-2. The development
stage is reported in Chapter 5 and the rest of the process is discussed in the following
sections.
Figure 6-2: Measure Development Stages
Stage Analysis Steps Chapter and section where
step is reported
Development Item Pool Generation Chapter 5, Section 5.2.1.4
Content Validity Assessment – Expert
Judging
Purification Internal Consistency and Reliability
Assessment
Chapter 6, Section 6.1.1
Unidimensionality Exploration
Validation Normality Assessment Appendix 6.2
Unidimensionality Confirmation Chapter 6, Section 6.1.2.1.1
Reliability Assessment and Convergent
and Face Validity Assessment
Chapter 6, Section 6.1.2.1.2
Evaluation Analysis: High/ Low Ranking
Hotels Measurement
Chapter 6, Section 6.1.2.2
Unidimensionality Confirmation and
Evaluation of Model Fit
Chapter 6, Section 6.1.2.2.1
Convergent Validity Assessment Chapter 6, Section 6.1.2.2.2
6.1.1 Measure Purification
CC, Relation, OI, MQ, HC, OP, and PF measures included 5, 13, 3, 3, 3, 5, and 5 identically-
worded items that referred to CC, Relation, OI, MQ, HC, OP, and PF as per operations
respectively. Purification of CC, Relation, OI, MQ, HC, OP, and PF measures was conducted
first on two half samples of data collected from two types of hotels in Thailand, high ranking
(n = 606) and low ranking (n = 268) and on a subsequently pooled sample (n = 874). Items
were subjected to a series of exploratory factor analyses (EFA) using the Principal
Component Analysis (PCA) method. Before proceeding with PCA, the items of each
measure were assessed for suitability for factor analysis through examination of inter-item
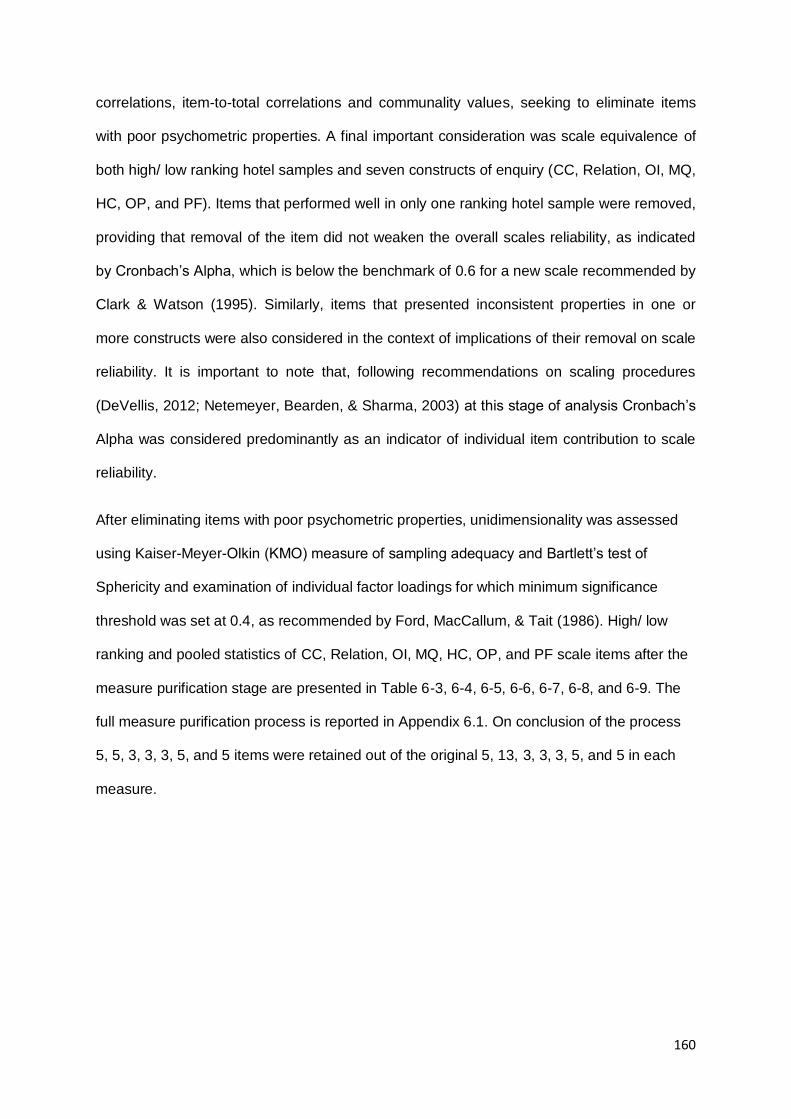
160
correlations, item-to-total correlations and communality values, seeking to eliminate items
with poor psychometric properties. A final important consideration was scale equivalence of
both high/ low ranking hotel samples and seven constructs of enquiry (CC, Relation, OI, MQ,
HC, OP, and PF). Items that performed well in only one ranking hotel sample were removed,
providing that removal of the item did not weaken the overall scales reliability, as indicated
by Cronbach’s Alpha, which is below the benchmark of 0.6 for a new scale recommended by
Clark & Watson (1995). Similarly, items that presented inconsistent properties in one or
more constructs were also considered in the context of implications of their removal on scale
reliability. It is important to note that, following recommendations on scaling procedures
(DeVellis, 2012; Netemeyer, Bearden, & Sharma, 2003) at this stage of analysis Cronbach’s
Alpha was considered predominantly as an indicator of individual item contribution to scale
reliability.
After eliminating items with poor psychometric properties, unidimensionality was assessed
using Kaiser-Meyer-Olkin (KMO) measure of sampling adequacy and Bartlett’s test of
Sphericity and examination of individual factor loadings for which minimum significance
threshold was set at 0.4, as recommended by Ford, MacCallum, & Tait (1986). High/ low
ranking and pooled statistics of CC, Relation, OI, MQ, HC, OP, and PF scale items after the
measure purification stage are presented in Table 6-3, 6-4, 6-5, 6-6, 6-7, 6-8, and 6-9. The
full measure purification process is reported in Appendix 6.1. On conclusion of the process
5, 5, 3, 3, 3, 5, and 5 items were retained out of the original 5, 13, 3, 3, 3, 5, and 5 in each
measure.

161
Table 6-3: CC Scales Measure Purification Statistics (High Ranking Sample, Low Ranking Sample, and Pooled Sample)
Item High Ranking Sample Low Ranking Sample Pooled Sample
Loading H2
Mean Std.dev. Loading H2 Mean Std.dev. Loading H2 Mean Std.dev.
mot01 I am satisfied with this hotel’s communication motivates and stimulates an enthusiasm for meeting its goals.
.828 .703 3.95 .885 .774 .628 4.01 .779 .813 .680 3.97 .854
mot02 I am satisfied with the people in this hotel have great ability as communicators.
.730 .577 3.60 .831 .746 .597 3.66 .793 .734 .582 3.62 .819
mot03 I am satisfied with this hotel’s communication makes me identify with it or feel a vital part of it.
.837 .714 3.93 .797 .828 .698 3.93 .752 .835 .709 3.93 .783
mot04 I am satisfied which I receive in time the information needed to do my job.
.785 .648 3.83 .814 .823 .692 3.64 .939 .790 .652 3.77 .858
mot05 I am satisfied which conflicts are handled appropriately through proper communication channels.
.717 .566 3.75 .875 .695 .542 3.78 .838 .710 .559 3.76 .863
Cronbach’s Alpha .838 .830 .834
Total variance explained 60.993% 60.008% 60.505%
KMO Measure of Sample Adequacy .829 .846 .837
Bartlett’s Test of Sphericity 1145.050, df 10, p = .000 466.762, df 10, p = .000 1590.803, df 10, p = .000

162
Table 6-4: Relation Scales Measure Purification Statistics (High Ranking Sample, Low Ranking Sample, and Pooled Sample)
Item High Ranking Sample Low Ranking Sample Pooled Sample
Loading H2
Mean Std.dev. Loading H2 Mean Std.dev. Loading H2 Mean Std.dev.
sup01 My line manager strikes up informal conversations with me.
.837 .734 4.01 .898 .847 .755 4.03 .854 .839 .739 4.02 .884
sup02 My line manager jokes well naturedly with me.
.722 .584 3.71 .951 .778 .660 3.63 .944 .737 .604 3.69 .949
sup03 My line manager provides clear instructions to do my jobs.
.837 .718 3.91 .832 .873 .786 4.05 .780 .847 .737 3.95 .819
sup04 My line manager tells me why job tasks are to be done.
.846 .730 3.89 .852 .861 .767 4.01 .899 .851 .742 3.93 .868
sup05 My line manager tells me the reasons for company policies.
.760 .616 3.90 .851 .825 .716 3.96 .919 .782 .649 3.92 .872
Cronbach’s Alpha .858 .890 .868
Total variance explained 64.304% 70.161% 68.451%
KMO Measure of Sample
Adequacy
.825 .841 .831
Bartlett’s Test of Sphericity 1404.976, df 10, p = .000 799.051, df 10, p = .000 2184.740, df 10, p = .000
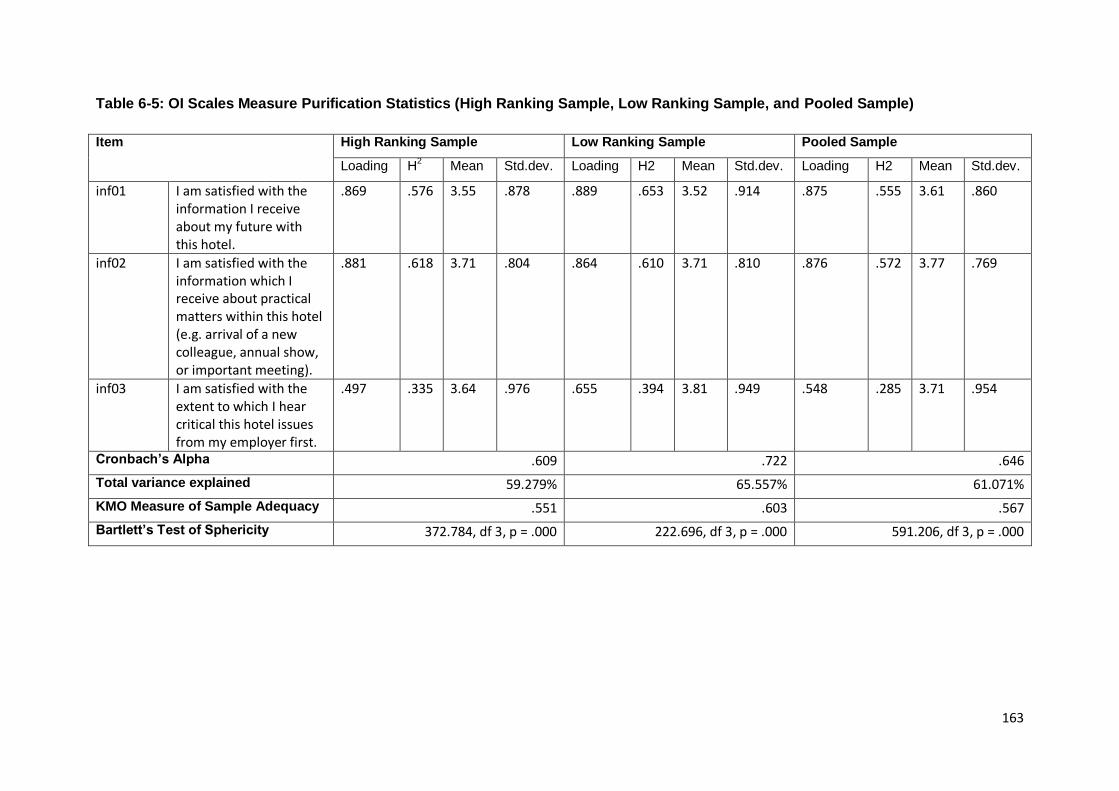
163
Table 6-5: OI Scales Measure Purification Statistics (High Ranking Sample, Low Ranking Sample, and Pooled Sample)
Item High Ranking Sample Low Ranking Sample Pooled Sample
Loading H2
Mean Std.dev. Loading H2 Mean Std.dev. Loading H2 Mean Std.dev.
inf01 I am satisfied with the information I receive about my future with this hotel.
.869 .576 3.55 .878 .889 .653 3.52 .914 .875 .555 3.61 .860
inf02 I am satisfied with the information which I receive about practical matters within this hotel (e.g. arrival of a new colleague, annual show, or important meeting).
.881 .618 3.71 .804 .864 .610 3.71 .810 .876 .572 3.77 .769
inf03 I am satisfied with the extent to which I hear critical this hotel issues from my employer first.
.497 .335 3.64 .976 .655 .394 3.81 .949 .548 .285 3.71 .954
Cronbach’s Alpha .609 .722 .646
Total variance explained 59.279% 65.557% 61.071%
KMO Measure of Sample Adequacy .551 .603 .567
Bartlett’s Test of Sphericity 372.784, df 3, p = .000 222.696, df 3, p = .000 591.206, df 3, p = .000

164
Table 6-6: MQ Scales Measure Purification Statistics (High Ranking Sample, Low Ranking Sample, and Pooled Sample)
Item High Ranking Sample Low Ranking Sample Pooled Sample
Loading H2
Mean Std.dev. Loading H2 Mean Std.dev. Loading H2 Mean Std.dev.
inf04 The amount of information I get from this hotel by e-mail is about right.
.820 .556 3.52 .881 .837 .623 3.60 .866 .823 .576 3.55 .876
inf05 Communication by means of e-mail works well within this hotel.
.787 .513 3.73 .950 .848 .640 3.76 .957 .809 .554 3.74 .952
inf06 In meetings I always hear about the latest practical and organization issues.
.761 .478 3.79 .769 .818 .597 3.71 .930 .780 .516 3.77 .822
Cronbach’s Alpha .696 .781 .725
Total variance explained 62.404% 69.660% 64.658%
KMO Measure of Sample Adequacy .683 .702 .679
Bartlett’s Test of Sphericity 319.016, df 3, p = .000 223.513, df 3, p = .000 534.462, df 3, p = .000
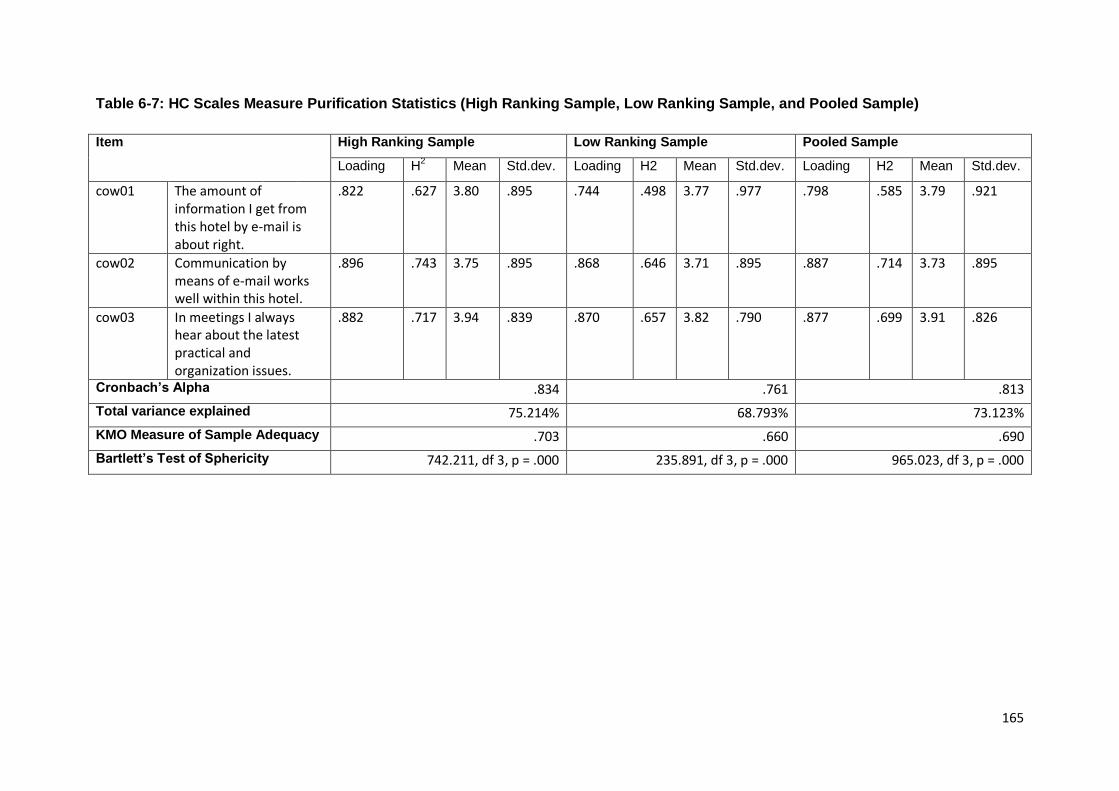
165
Table 6-7: HC Scales Measure Purification Statistics (High Ranking Sample, Low Ranking Sample, and Pooled Sample)
Item High Ranking Sample Low Ranking Sample Pooled Sample
Loading H2
Mean Std.dev. Loading H2 Mean Std.dev. Loading H2 Mean Std.dev.
cow01 The amount of information I get from this hotel by e-mail is about right.
.822 .627 3.80 .895 .744 .498 3.77 .977 .798 .585 3.79 .921
cow02 Communication by means of e-mail works well within this hotel.
.896 .743 3.75 .895 .868 .646 3.71 .895 .887 .714 3.73 .895
cow03 In meetings I always hear about the latest practical and organization issues.
.882 .717 3.94 .839 .870 .657 3.82 .790 .877 .699 3.91 .826
Cronbach’s Alpha .834 .761 .813
Total variance explained 75.214% 68.793% 73.123%
KMO Measure of Sample Adequacy .703 .660 .690
Bartlett’s Test of Sphericity 742.211, df 3, p = .000 235.891, df 3, p = .000 965.023, df 3, p = .000
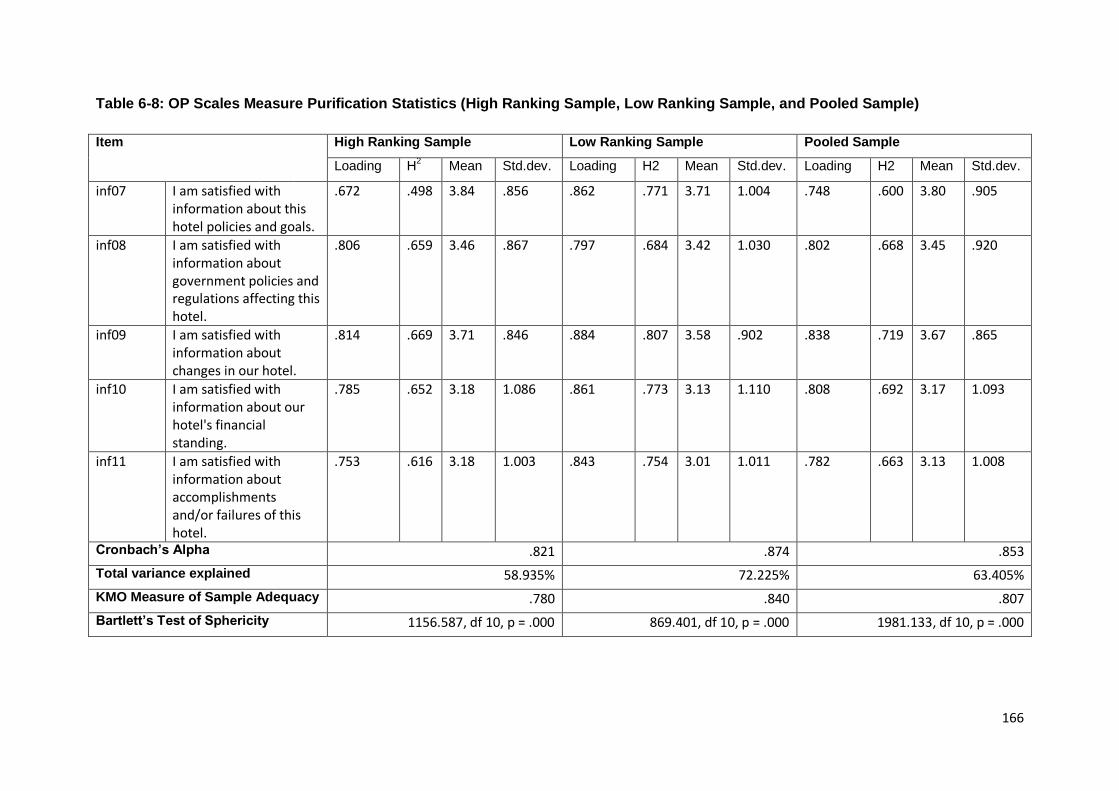
166
Table 6-8: OP Scales Measure Purification Statistics (High Ranking Sample, Low Ranking Sample, and Pooled Sample)
Item High Ranking Sample Low Ranking Sample Pooled Sample
Loading H2
Mean Std.dev. Loading H2 Mean Std.dev. Loading H2 Mean Std.dev.
inf07 I am satisfied with information about this hotel policies and goals.
.672 .498 3.84 .856 .862 .771 3.71 1.004 .748 .600 3.80 .905
inf08 I am satisfied with information about government policies and regulations affecting this hotel.
.806 .659 3.46 .867 .797 .684 3.42 1.030 .802 .668 3.45 .920
inf09 I am satisfied with information about changes in our hotel.
.814 .669 3.71 .846 .884 .807 3.58 .902 .838 .719 3.67 .865
inf10 I am satisfied with information about our hotel's financial standing.
.785 .652 3.18 1.086 .861 .773 3.13 1.110 .808 .692 3.17 1.093
inf11 I am satisfied with information about accomplishments and/or failures of this hotel.
.753 .616 3.18 1.003 .843 .754 3.01 1.011 .782 .663 3.13 1.008
Cronbach’s Alpha .821 .874 .853
Total variance explained 58.935% 72.225% 63.405%
KMO Measure of Sample Adequacy .780 .840 .807
Bartlett’s Test of Sphericity 1156.587, df 10, p = .000 869.401, df 10, p = .000 1981.133, df 10, p = .000
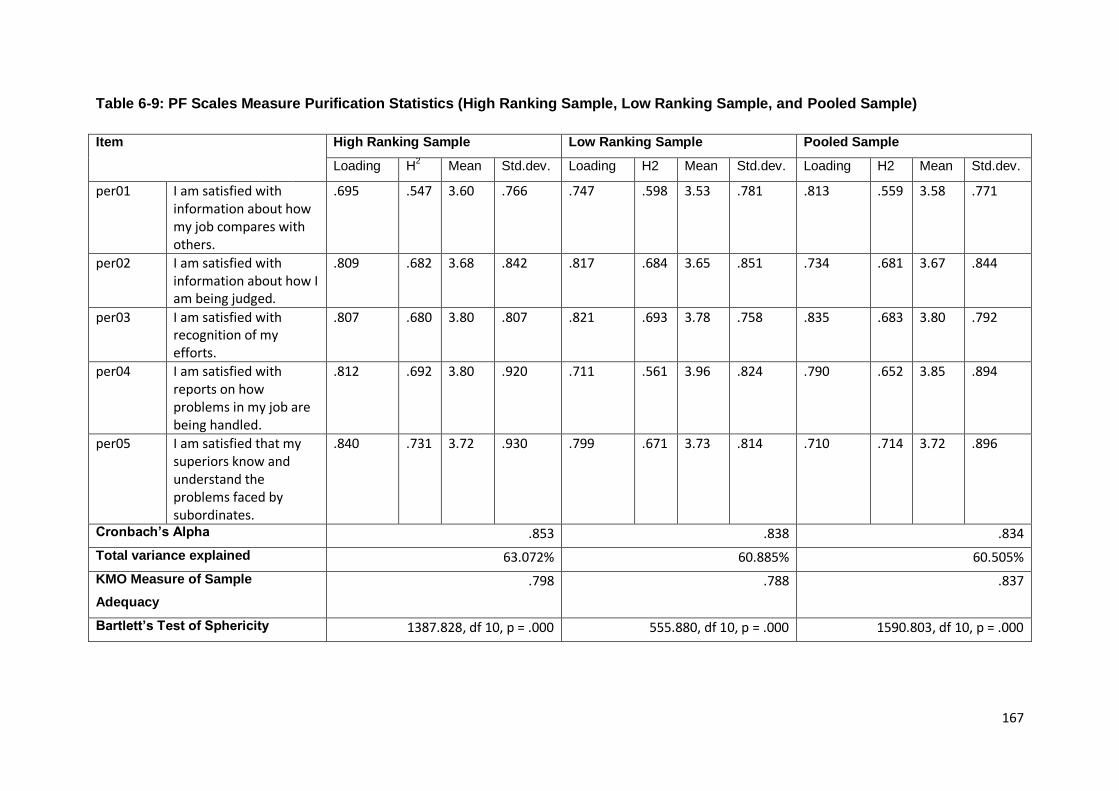
167
Table 6-9: PF Scales Measure Purification Statistics (High Ranking Sample, Low Ranking Sample, and Pooled Sample)
Item High Ranking Sample Low Ranking Sample Pooled Sample
Loading H2
Mean Std.dev. Loading H2 Mean Std.dev. Loading H2 Mean Std.dev.
per01 I am satisfied with information about how my job compares with others.
.695 .547 3.60 .766 .747 .598 3.53 .781 .813 .559 3.58 .771
per02 I am satisfied with information about how I am being judged.
.809 .682 3.68 .842 .817 .684 3.65 .851 .734 .681 3.67 .844
per03 I am satisfied with recognition of my efforts.
.807 .680 3.80 .807 .821 .693 3.78 .758 .835 .683 3.80 .792
per04 I am satisfied with reports on how problems in my job are being handled.
.812 .692 3.80 .920 .711 .561 3.96 .824 .790 .652 3.85 .894
per05 I am satisfied that my superiors know and understand the problems faced by subordinates.
.840 .731 3.72 .930 .799 .671 3.73 .814 .710 .714 3.72 .896
Cronbach’s Alpha .853 .838 .834
Total variance explained 63.072% 60.885% 60.505%
KMO Measure of Sample
Adequacy
.798 .788 .837
Bartlett’s Test of Sphericity 1387.828, df 10, p = .000 555.880, df 10, p = .000 1590.803, df 10, p = .000

168
6.1.2 Measure Validation
Validation of CC, Relation, OI, MQ, HC, OP, and PF measures was conducted using
Maximum likelihood Confirmatory Factor Analysis (CFA) in AMOS 20. Validation was
conducted first on high and low samples of data different from samples used in the
purification stage, namely high ranking hotels (n = 606) and low ranking hotels (n = 267),
then subjected to analysis for ranking measurement invariance testing, and subsequently on
a pooled sample (n = 873). Prior to proceeding with CFA, normality was assessed by
examining individual variables’ and scale mean skewness and kurtosis, to meet the
assumptions of Structural Equation Modelling (see Appendix 6.2, for report of normality
checks).
To determine the extent to which the estimated models are consistent with the data, the
models were evaluated using goodness of fit indices. The goodness of fit is the degree to
which the actual or observed input matrix (covariances or correlations) is predicted by the
estimated model (Hair, Anderson, Tatham, & Black, 1998). Table 6-10 presents a summary
of the goodness-of-fit measures for the structural model estimated.
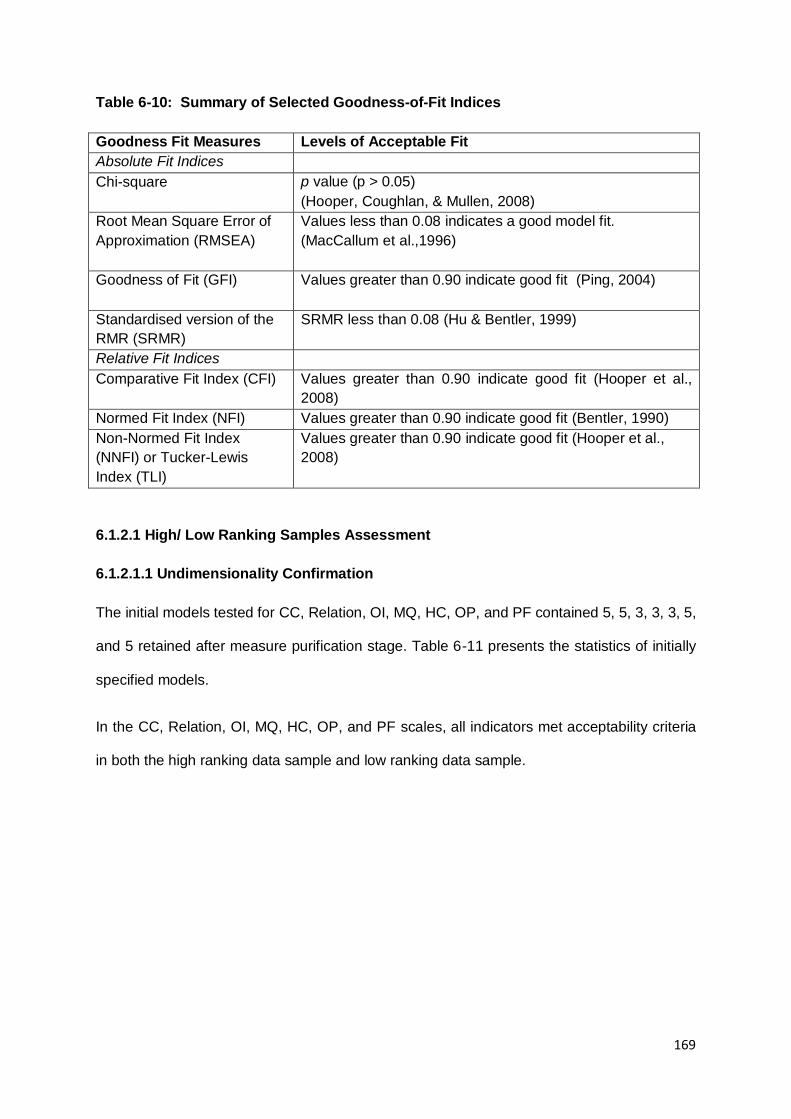
169
Table 6-10: Summary of Selected Goodness-of-Fit Indices
Goodness Fit Measures Levels of Acceptable Fit
Absolute Fit Indices
Chi-square
p value (p > 0.05)
(Hooper, Coughlan, & Mullen, 2008)
Root Mean Square Error of
Approximation (RMSEA)
Values less than 0.08 indicates a good model fit.
(MacCallum et al.,1996)
Goodness of Fit (GFI)
Values greater than 0.90 indicate good fit (Ping, 2004)
Standardised version of the
RMR (SRMR)
SRMR less than 0.08 (Hu & Bentler, 1999)
Relative Fit Indices
Comparative Fit Index (CFI)
Values greater than 0.90 indicate good fit (Hooper et al.,
2008)
Normed Fit Index (NFI) Values greater than 0.90 indicate good fit (Bentler, 1990)
Non-Normed Fit Index
(NNFI) or Tucker-Lewis
Index (TLI)
Values greater than 0.90 indicate good fit (Hooper et al.,
2008)
6.1.2.1 High/ Low Ranking Samples Assessment
6.1.2.1.1 Undimensionality Confirmation
The initial models tested for CC, Relation, OI, MQ, HC, OP, and PF contained 5, 5, 3, 3, 3, 5,
and 5 retained after measure purification stage. Table 6-11 presents the statistics of initially
specified models.
In the CC, Relation, OI, MQ, HC, OP, and PF scales, all indicators met acceptability criteria
in both the high ranking data sample and low ranking data sample.

170
Table 6-11: Initial Model for CC, Relation, OI, MQ, HC, OP, and PF Scales
Fit Indices Criteria High
Sample
Acceptability Low Sample Acceptability
CC Scales
d.f. 4 4
P >0.05 0.069 Yes 0.422 Yes
RMSEA <0.08 0.044 Yes 0.000 Yes
GFI ≥0.9 0.994 Yes 0.994 Yes
CFI ≥0.9 0.996 Yes 1.000 Yes
NFI ≥0.9 0.993 Yes 0.994 Yes
NNFI (TLI) ≥0.95 0.990 Yes 1.000 Yes
SRMR <0.08 0.0138 Yes 0.0121 Yes
Relation Scales
d.f. 4 3
P >0.05 0.604 Yes 0.131 Yes
RMSEA <0.08 0.000 Yes 0.058 Yes
GFI ≥0.9 0.998 Yes 0.992 Yes
CFI ≥0.9 1.000 Yes 0.997 Yes
NFI ≥0.9 0.998 Yes 0.993 Yes
NNFI (TLI) ≥0.95 1.002 Yes 0.990 Yes
SRMR <0.08 0.0062 Yes 0.0110 Yes
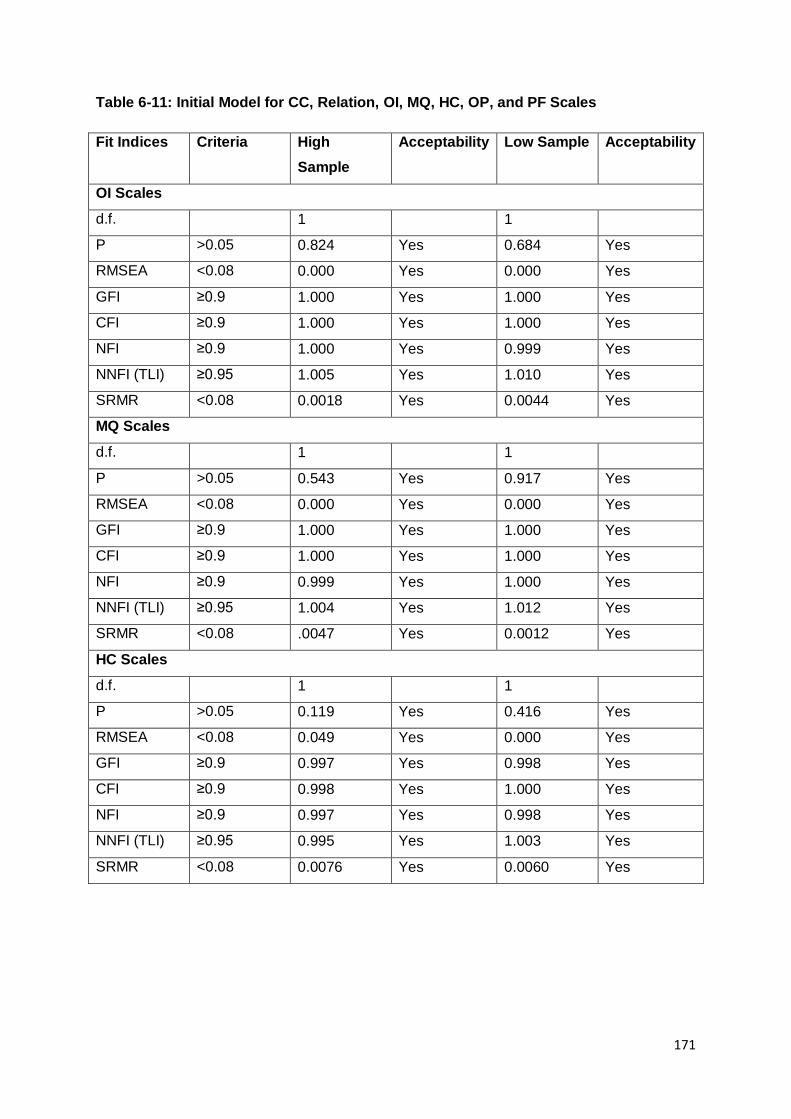
171
Table 6-11: Initial Model for CC, Relation, OI, MQ, HC, OP, and PF Scales
Fit Indices Criteria High
Sample
Acceptability Low Sample Acceptability
OI Scales
d.f. 1 1
P >0.05 0.824 Yes 0.684 Yes
RMSEA <0.08 0.000 Yes 0.000 Yes
GFI ≥0.9 1.000 Yes 1.000 Yes
CFI ≥0.9 1.000 Yes 1.000 Yes
NFI ≥0.9 1.000 Yes 0.999 Yes
NNFI (TLI) ≥0.95 1.005 Yes 1.010 Yes
SRMR <0.08 0.0018 Yes 0.0044 Yes
MQ Scales
d.f. 1 1
P >0.05 0.543 Yes 0.917 Yes
RMSEA <0.08 0.000 Yes 0.000 Yes
GFI ≥0.9 1.000 Yes 1.000 Yes
CFI ≥0.9 1.000 Yes 1.000 Yes
NFI ≥0.9 0.999 Yes 1.000 Yes
NNFI (TLI) ≥0.95 1.004 Yes 1.012 Yes
SRMR <0.08 .0047 Yes 0.0012 Yes
HC Scales
d.f. 1 1
P >0.05 0.119 Yes 0.416 Yes
RMSEA <0.08 0.049 Yes 0.000 Yes
GFI ≥0.9 0.997 Yes 0.998 Yes
CFI ≥0.9 0.998 Yes 1.000 Yes
NFI ≥0.9 0.997 Yes 0.998 Yes
NNFI (TLI) ≥0.95 0.995 Yes 1.003 Yes
SRMR <0.08 0.0076 Yes 0.0060 Yes

172
Table 6-11: Initial Model for CC, Relation, OI, MQ, HC, OP, and PF Scales
Fit Indices Criteria High
Sample
Acceptability Low Sample Acceptability
OP Scales
d.f. 4 3
P >0.05 0.372 Yes 0.407 Yes
RMSEA <0.08 0.010 Yes 0.000 Yes
GFI ≥0.9 0.997 Yes 0.996 Yes
CFI ≥0.9 1.000 Yes 1.000 Yes
NFI ≥0.9 0.997 Yes 0.995 Yes
NNFI (TLI) ≥0.95 1.000 Yes 1.001 Yes
SRMR <0.08 0.0073 Yes 0.0096 Yes
PF Scales
d.f. 4 4
P >0.05 0.051 Yes 0.154 Yes
RMSEA <0.08 0.047 Yes 0.050 Yes
GFI ≥0.9 0.994 Yes 0.990 Yes
CFI ≥0.9 0.996 Yes 0.995 Yes
NFI ≥0.9 0.992 Yes 0.989 Yes
NNFI (TLI) ≥0.95 0.989 Yes 0.989 Yes
SRMR <0.08 .0136 Yes 0.0160 Yes
6.1.2.1.2 Reliability and Validity Assessment
Having verified undimensionality, the measures were assessed for reliability and validity.
Reliability refers to the ability of the model to demonstrate things in an adequate way. There
are two formulae that are useful for establishing reliability and validity, through calculating
composite or construct reliability (CR), and by inspecting average variance extracted (AVE).
If a measure has high composite reliability, then a measure would produce the same result
from one occasion to another: its consistency. The composite reliability (CR) can be
calculated using the formula given below in Equation 6-1.

173
Equation 6-1: Composite Reliability Formula
Composite Reliability = (∑standardised loading)2 / (∑ standardised loading)
2 + (∑ indicator measurement error)
If a measure has high construct validity, then it is assessing a theoretical construct well. The
Average Variance Extracted (AVE) was calculated to measure convergent validity. The AVE
values greater than 0.5 are treated as indications of convergent validity (Fornell & Larcker,
1981). The AVE can be calculated by using the formula given below in Equation 6-2.
Equation 6-2: Average Variance Extracted Formula
AVE = (∑ standardised loadings)/ (∑ standardised loadings) + (∑ indicator measurement error)
This final stage aims to assess the set of retained items for face validity, to ensure that the
retained items reflect the conceptualised dimension.
Assessment of item convergent validity, composite reliability and Cronbach’s Alpha indicated
that the 5, 5, 3, 3, 3, 5, and 5 item solutions were acceptable across seven scales. These
results are presented below along with item reliability and validity statistics, which are
presented in Tables 6-12, 6-13, 6-14, 6-15, 6-16, 6-17, and 6-18. Convergent validity is
evidenced by AVEs ranging between 0.51 and 0.57, which is well above the 0.50 criterion
recommended by Fornell & Larcker (1981). Internal consistency reliability values for all
seven scales (assessed by Cronbach’s Alpha) all exceed the recommended benchmark of
0.6 by Nunnally et al (1967). Construct or composite reliabilities for seven scales exceed the
recommended threshold of 0.6 Bagozzi & Yi (1988). Factor loadings are high for all items for
both two hotels samples, well above the minimum value of 0.4 (Ford, MacCallum, & Tait,
1986). Item reliability averages are 0.60 and 0.68 (CC scale), 0.67 and 0.65 (Relation scale),
0.59 and 0.67 (OI scale), 0.63 and 0.68 (MQ scale), 0.74 and 0.79 (HC scale), 0.60 and 0.61
(OP scale), and 0.60 and 0.64 (PE scale) for the High and Low Ranking sample respectively,
which is in line with the threshold of 0.50 recommended by Clark & Watson (1995). Face
174
validity was concluded by contrasting the final scales with conceptual and operational
definitions of CC, Relation, OI, MQ, HC, OP, and PF constructs (see Table 6-15 for
summary of operational definitions).
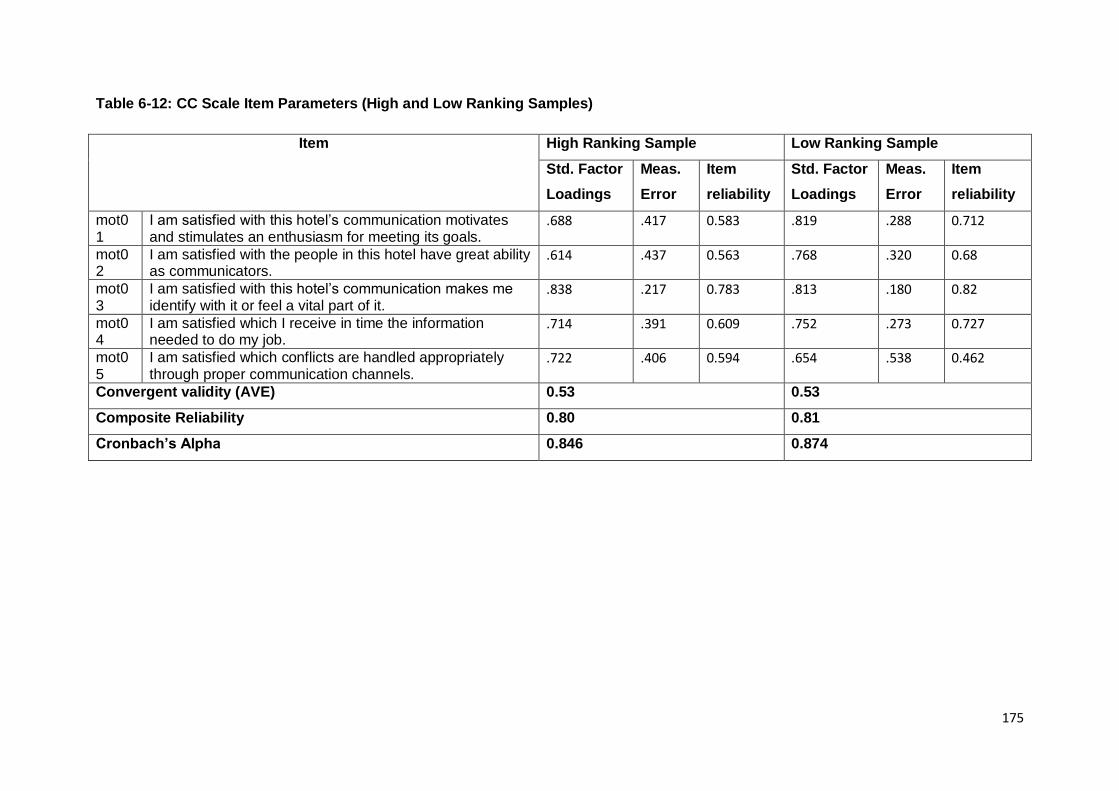
175
Table 6-12: CC Scale Item Parameters (High and Low Ranking Samples)
Item High Ranking Sample Low Ranking Sample
Std. Factor
Loadings
Meas.
Error
Item
reliability
Std. Factor
Loadings
Meas.
Error
Item
reliability
mot01
I am satisfied with this hotel’s communication motivates and stimulates an enthusiasm for meeting its goals.
.688 .417 0.583 .819 .288 0.712
mot02
I am satisfied with the people in this hotel have great ability as communicators.
.614 .437 0.563 .768 .320 0.68
mot03
I am satisfied with this hotel’s communication makes me identify with it or feel a vital part of it.
.838 .217 0.783 .813 .180 0.82
mot04
I am satisfied which I receive in time the information needed to do my job.
.714 .391 0.609 .752 .273 0.727
mot05
I am satisfied which conflicts are handled appropriately through proper communication channels.
.722 .406 0.594 .654 .538 0.462
Convergent validity (AVE) 0.53 0.53
Composite Reliability 0.80 0.81
Cronbach’s Alpha 0.846 0.874

176
Table 6-13: Relation Scale Item Parameters (High and Low Ranking Samples)
Item High Ranking Sample Low Ranking Sample
Std. Factor
Loadings
Meas.
Error
Item
reliability
Std. Factor
Loadings
Meas.
Error
Item
reliability
sup01
My line manager strikes up informal conversations with me.
.764 .391 0.609 .900 .203 0.797
sup02
My line manager jokes well naturedly with me. .710 .492 0.508 .902 .198 0.802
sup03
My line manager provides clear instructions to do my jobs. .869 .216 0.784 .818 .317 0.683
sup04
My line manager tells me why job tasks are to be done. .863 .205 0.795 .595 .514 0.486
sup05
My line manager tells me the reasons for company policies.
.768 .350 0.65 .408 .535 0.465
Convergent validity (AVE) 0.54 0.53
Composite Reliability 0.83 0.80
Cronbach’s Alpha 0.899 0.882

177
Table 6-14: OI Scale Item Parameters (High and Low Ranking Samples)
Item High Ranking Sample Low Ranking Sample
Std. Factor
Loadings
Meas.
Error
Item
reliability
Std. Factor
Loadings
Meas.
Error
Item
reliability
inf01 I am satisfied with the information I receive about my future with this hotel.
.810 .286 0.714 .859 .143 0.857
inf02 I am satisfied with the information which I receive about practical matters within this hotel (e.g. arrival of a new colleague, annual show, or important meeting).
.874 .169 0.831 .836 .175 0.825
inf03 I am satisfied with the extent to which I hear critical this hotel issues from my employer first.
.454 .790 0.21 .504 .672 0.328
Convergent validity (AVE) 0.55 0.52
Composite Reliability 0.72 0.71
Cronbach’s Alpha 0.733 0.749
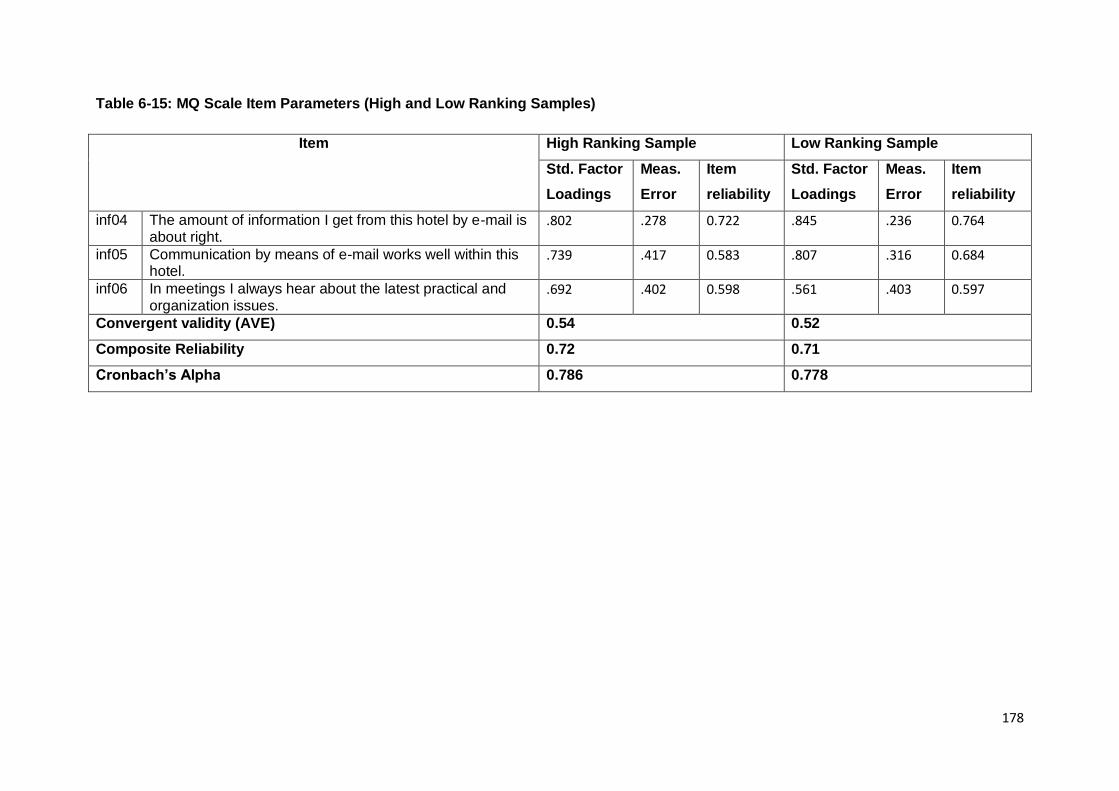
178
Table 6-15: MQ Scale Item Parameters (High and Low Ranking Samples)
Item High Ranking Sample Low Ranking Sample
Std. Factor
Loadings
Meas.
Error
Item
reliability
Std. Factor
Loadings
Meas.
Error
Item
reliability
inf04 The amount of information I get from this hotel by e-mail is about right.
.802 .278 0.722 .845 .236 0.764
inf05 Communication by means of e-mail works well within this hotel.
.739 .417 0.583 .807 .316 0.684
inf06 In meetings I always hear about the latest practical and organization issues.
.692 .402 0.598 .561 .403 0.597
Convergent validity (AVE) 0.54 0.52
Composite Reliability 0.72 0.71
Cronbach’s Alpha 0.786 0.778

179
Table 6-16: HC Scale Item Parameters (High and Low Ranking Samples)
Item High Ranking Sample Low Ranking Sample
Std. Factor
Loadings
Meas.
Error
Item
reliability
Std. Factor
Loadings
Meas.
Error
Item
reliability
cow01
There is a good atmosphere between colleagues in my unit.
.788 .319 0.681 .785 .271 0.729
cow02
If I want, I can also discuss personal matters with my colleagues.
.792 .313 0.687 .899 .135 0.865
cow03
My colleagues offer me support. .911 .136 0.864 .811 .227 0.773
Convergent validity (AVE) 0.53 0.51
Composite Reliability 0.74 0.72
Cronbach’s Alpha 0.868 0.870

180
Table 6-17: OP Scale Item Parameters (High and Low Ranking Samples)
Item High Ranking Sample Low Ranking Sample
Std. Factor
Loadings
Meas.
Error
Item
reliability
Std. Factor
Loadings
Meas.
Error
Item
reliability
inf07 I am satisfied with information about this hotel policies and goals.
.752 .382 0.618 .474 .529 0.471
inf08 I am satisfied with information about government policies and regulations affecting this hotel.
.809 .326 0.674 .851 .230 0.77
inf09 I am satisfied with information about changes in our hotel. .876 .197 0.803 .755 .282 0.718 inf10 I am satisfied with information about our hotel's financial
standing. .709 .549 0.451 .658 .447 0.553
inf11 I am satisfied with information about accomplishments and/or failures of this hotel.
.647 .556 0.444 .604 .463 0.537
Convergent validity (AVE) 0.56 0.52
Composite Reliability 0.83 0.79
Cronbach’s Alpha 0.883 0.827
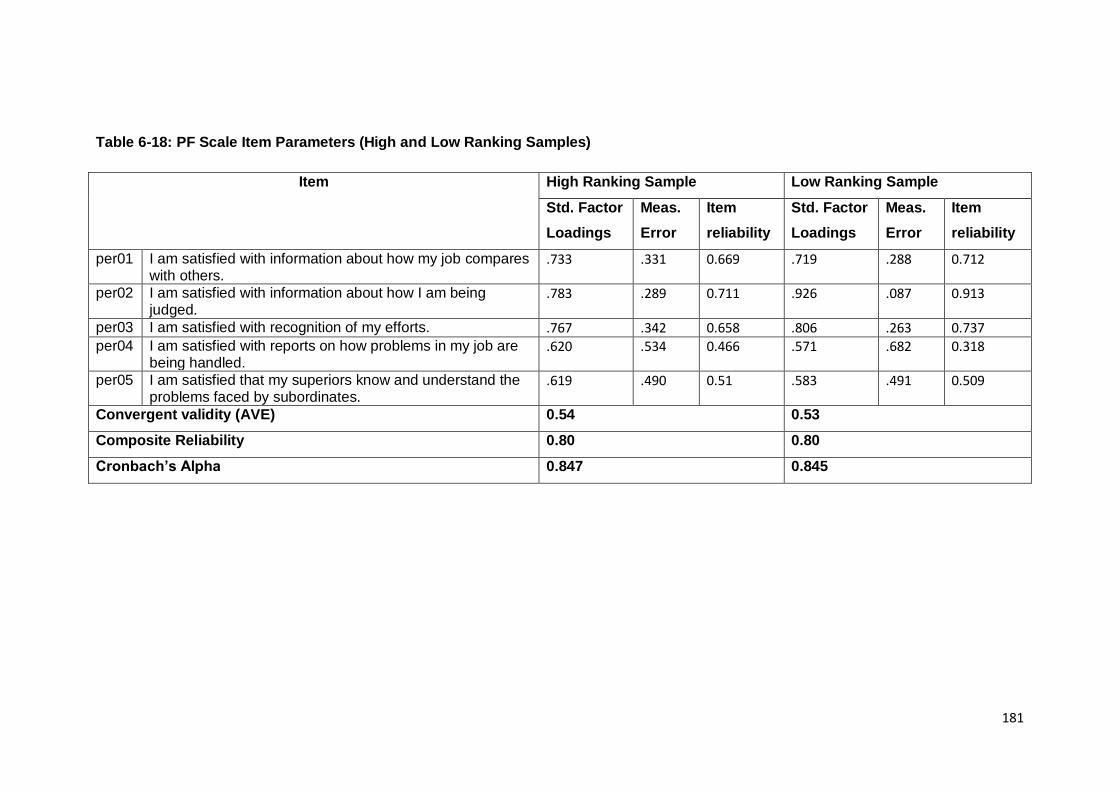
181
Table 6-18: PF Scale Item Parameters (High and Low Ranking Samples)
Item High Ranking Sample Low Ranking Sample
Std. Factor
Loadings
Meas.
Error
Item
reliability
Std. Factor
Loadings
Meas.
Error
Item
reliability
per01 I am satisfied with information about how my job compares with others.
.733 .331 0.669 .719 .288 0.712
per02 I am satisfied with information about how I am being judged.
.783 .289 0.711 .926 .087 0.913
per03 I am satisfied with recognition of my efforts. .767 .342 0.658 .806 .263 0.737 per04 I am satisfied with reports on how problems in my job are
being handled. .620 .534 0.466 .571 .682 0.318
per05 I am satisfied that my superiors know and understand the problems faced by subordinates.
.619 .490 0.51 .583 .491 0.509
Convergent validity (AVE) 0.54 0.53
Composite Reliability 0.80 0.80
Cronbach’s Alpha 0.847 0.845

182
6.1.2.2 Pooled Samples Fit Assessment
6.1.2.2.1 Unidimensionality Confirmation
The final step of measure validation was assessment of the model fit on the pooled high/ low
ranking hotels sample. 5, 5, 3, 3, 3, 5, and 5 items retained after high/ low ranking and
measurement invariance assessment and model modification were submitted, specified to
load on CC, Relation, OI, MQ, HC, OP, and PF factors respectively. As demonstrated in
Table 6-19, 6-20, 6-21, and 6-22 below, the fit of all seven models was acceptable,
confirming unidimensionality.
In the CC, Relation, OI, MQ, HC, OP, and PF scales, all indicators met acceptability criteria
in the pooled sample.
Table 6-19: Initial Model for CC, and Relation Scales
Fit Indices Criteria CC Scale Acceptability Relation
Scale
Acceptability
d.f. 3 3
P >0.05 0.202 Yes 0.430 Yes
RMSEA <0.08 0.014 Yes 0.000 Yes
GFI ≥0.9 0.998 Yes 0.999 Yes
CFI ≥0.9 0.999 Yes 1.000 Yes
NFI ≥0.9 0.997 Yes 0.999 Yes
NNFI (TLI) ≥0.95 0.997 Yes 1.000 Yes
SRMR <0.08 0.0084 Yes 0.0050 Yes
Table 6-20: Initial Model for OI, and MQ Scales
Fit Indices Criteria OI Scale Acceptability MQ Scale Acceptability
d.f. 1 1
P >0.05 0.966 Yes 0.443 Yes
RMSEA <0.08 0.000 Yes 0.000 Yes
GFI ≥0.9 1.000 Yes 1.000 Yes
CFI ≥0.9 1.000 Yes 1.000 Yes
NFI ≥0.9 1.000 Yes 0.999 Yes
NNFI (TLI) ≥0.95 1.004 Yes 1.002 Yes
SRMR <0.08 0.0003 Yes 0.0050 Yes

183
Table 6-21: Initial Model for HC and OP Scales
Fit Indices Criteria HC Scale Acceptability OP Scale Acceptability
d.f. 1 3
P >0.05 0.399 Yes 0.148 Yes
RMSEA <0.08 0.000 Yes 0.030 Yes
GFI ≥0.9 0.999 Yes 0.998 Yes
CFI ≥0.9 1.000 Yes 0.999 Yes
NFI ≥0.9 0.999 Yes 0.998 Yes
NNFI (TLI) ≥0.95 1.001 Yes 0.996 Yes
SRMR <0.08 0.0035 Yes 0.0096 Yes
Table 6-22: Initial Model for PF Scales
Fit Indices Criteria PF Scale Acceptability
d.f. 3
P >0.05 0.888 Yes
RMSEA <0.08 0.000 Yes
GFI ≥0.9 1.000 Yes
CFI ≥0.9 1.000 Yes
NFI ≥0.9 1.000 Yes
NNFI (TLI) ≥0.95 1.004 Yes
SRMR <0.08 0.0039 Yes
6.1.2.2.2 Convergent Validity Assessment
With convergent validity values of 0.54, 0.55, 0.54, 0.54, 0.52, 0.55, and 0.54; composite
reliability values of 0.81, 0.82, 0.72, .72, 0.73, 0.82, and 0.8 for CC, Relation, OI, MQ, HC,
OP, and PF scales respectively and Cronbach’s Alpha exceeding 0.6 criterion (Nunnally et
al., 1967), 5, 5, 3, 3, 3, 5, and 5 solution items are acceptable for each of the seven scales.
Factor loadings range between 0.58 and 0.88, and items’ reliability indicators range between
0.40 and 0.84, as detailed in Table 6-23, 6-24, 6-25, 6-26, 6-27, 6-28, and 6-29. Thus, CC,
Relation, OI, MQ, HC, OP, and PF scales can be concluded as reliable.

184
Table 6-23: CC Scale Item Parameters (Pooled Samples)
Item Pooled Samples
Std. Factor
Loadings
Meas.
Error
Item
reliability
mot01
I am satisfied with this hotel’s communication motivates and stimulates an enthusiasm for meeting its goals.
.748 .362 0.638
mot02
I am satisfied with the people in this hotel have great ability as communicators.
.660 .410 0.59
mot03
I am satisfied with this hotel’s communication makes me identify with it or feel a vital part of it.
.806 .235 0.765
mot04
I am satisfied which I receive in time the information needed to do my job.
.765 .309 0.691
mot05
I am satisfied which conflicts are handled appropriately through proper communication channels.
.709 .436 0.564
Convergent validity (AVE) 0.54
Composite Reliability 0.81
Cronbach’s Alpha 0.854

185
Table 6-24: Relation Scale Item Parameters (Pooled Samples)
Item Pooled Samples
Std. Factor
Loadings
Meas.
Error
Item
reliability
sup01
My line manager strikes up informal conversations with me.
.754 .426 0.574
sup02
My line manager jokes well naturedly with me. .728 .475 0.525
sup03
My line manager provides clear instructions to do my jobs. .906 .163 0.837
sup04
My line manager tells me why job tasks are to be done. .812 .274 0.726
sup05
My line manager tells me the reasons for company policies.
.683 .421 0.579
Convergent validity (AVE) 0.55
Composite Reliability 0.82
Cronbach’s Alpha 0.893

186
Table 6-25: OI Scale Item Parameters (Pooled Samples)
Item Pooled Samples
Std. Factor
Loadings
Meas.
Error
Item
reliability
inf01 I am satisfied with the information I receive about my future with this hotel.
.820 .251 0.749
inf02 I am satisfied with the information which I receive about practical matters within this hotel (e.g. arrival of a new colleague, annual show, or important meeting).
.869 .166 0.834
inf03 I am satisfied with the extent to which I hear critical this hotel issues from my employer first.
.463 .760 0.24
Convergent validity (AVE) 0.54
Composite Reliability 0.72
Cronbach’s Alpha 0.738

187
Table 6-26: MQ Scale Item Parameters (Pooled Samples)
Item Pooled Samples
Std. Factor
Loadings
Meas.
Error
Item
reliability
inf04 The amount of information I get from this hotel by e-mail is about right.
.816 .265 0.735
inf05 Communication by means of e-mail works well within this hotel.
.758 .391 0.609
inf06 In meetings I always hear about the latest practical and organization issues.
.649 .417 0.583
Convergent validity (AVE) 0.54
Composite Reliability 0.72
Cronbach’s Alpha 0.782

188
Table 6-27: HC Scale Item Parameters (Pooled Samples)
Item Pooled Samples
Std. Factor
Loadings
Meas.
Error
Item
reliability
cow01
There is a good atmosphere between colleagues in my unit.
.776 .307 0.693
cow02
If I want, I can also discuss personal matters with my colleagues.
.836 .250 0.75
cow03
My colleagues offer me support. .878 .173 0.827
Convergent validity (AVE) 0.52
Composite Reliability 0.73
Cronbach’s Alpha 0.868

189
Table 6-28: OP Scale Item Parameters (Pooled Samples)
Item Pooled Samples
Std. Factor
Loadings
Meas.
Error
Item
reliability
inf07 I am satisfied with information about this hotel policies and goals.
.715 .402 0.598
inf08 I am satisfied with information about government policies and regulations affecting this hotel.
.796 .333 0.667
inf09 I am satisfied with information about changes in our hotel. .865 .202 0.798 inf10 I am satisfied with information about our hotel's financial
standing. .704 .518 0.482
inf11 I am satisfied with information about accomplishments and/or failures of this hotel.
.630 .536 0.464
Convergent validity (AVE) 0.55
Composite Reliability 0.82
Cronbach’s Alpha 0.871
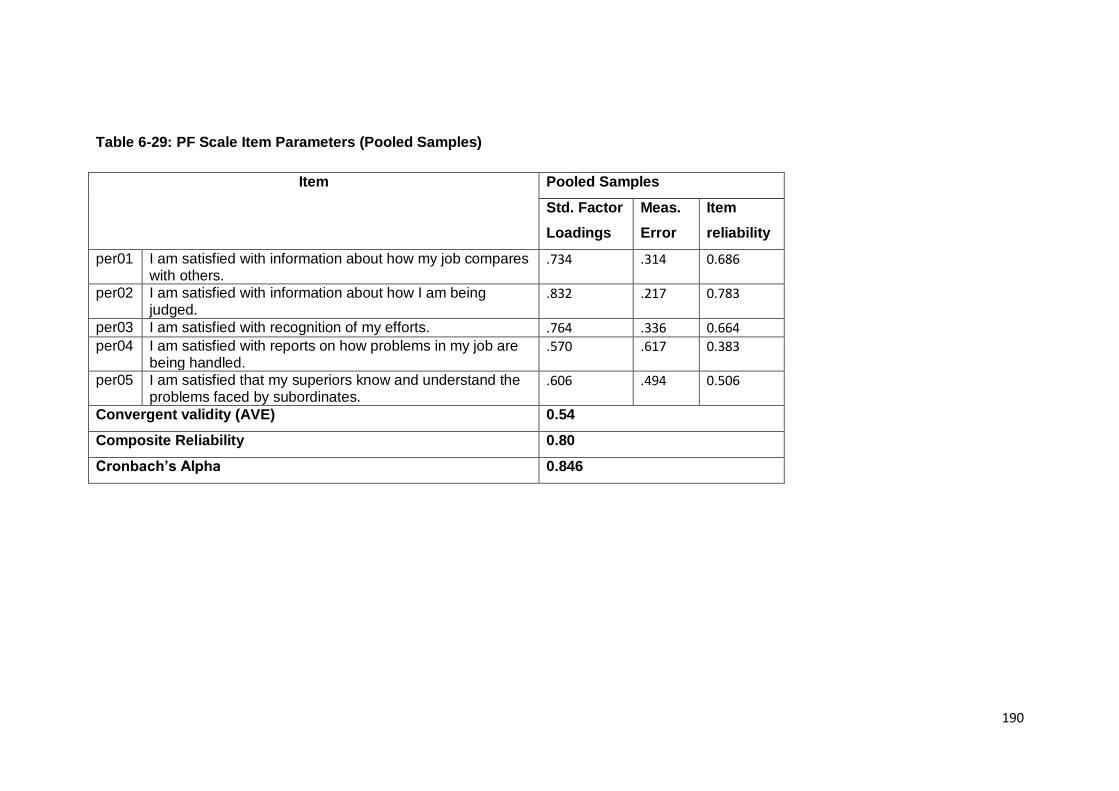
190
Table 6-29: PF Scale Item Parameters (Pooled Samples)
Item Pooled Samples
Std. Factor
Loadings
Meas.
Error
Item
reliability
per01 I am satisfied with information about how my job compares with others.
.734 .314 0.686
per02 I am satisfied with information about how I am being judged.
.832 .217 0.783
per03 I am satisfied with recognition of my efforts. .764 .336 0.664 per04 I am satisfied with reports on how problems in my job are
being handled. .570 .617 0.383
per05 I am satisfied that my superiors know and understand the problems faced by subordinates.
.606 .494 0.506
Convergent validity (AVE) 0.54
Composite Reliability 0.80
Cronbach’s Alpha 0.846
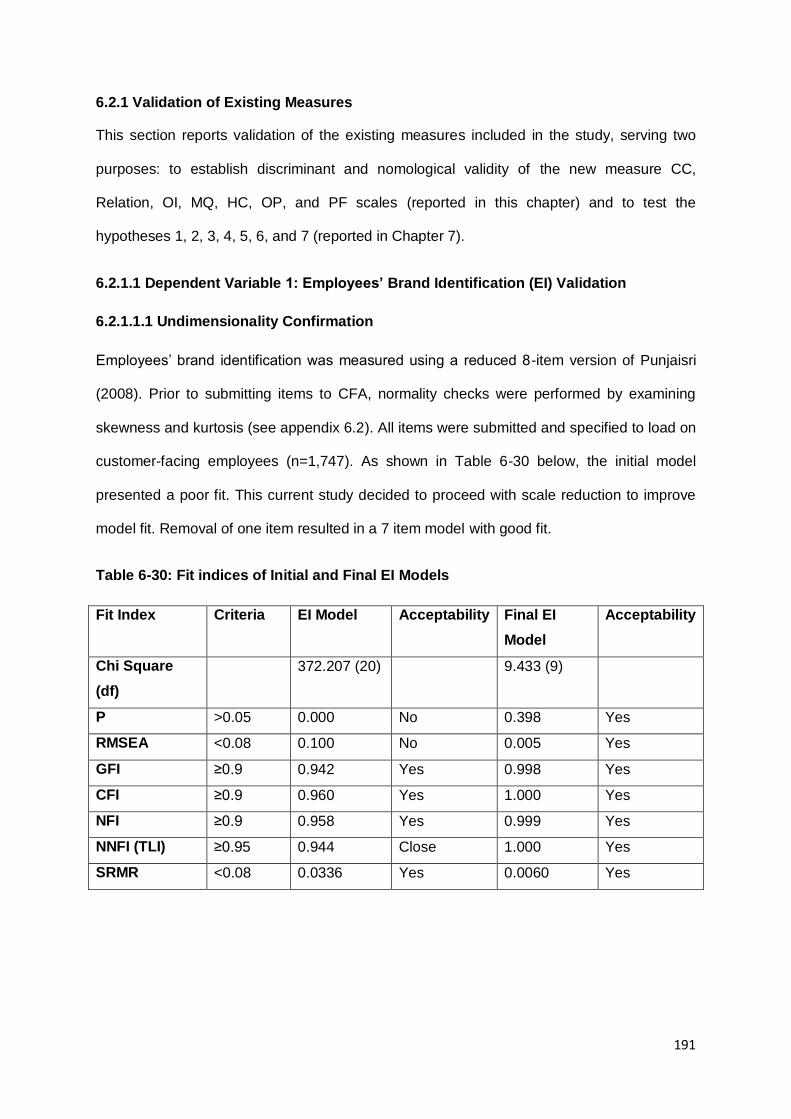
191
6.2.1 Validation of Existing Measures
This section reports validation of the existing measures included in the study, serving two
purposes: to establish discriminant and nomological validity of the new measure CC,
Relation, OI, MQ, HC, OP, and PF scales (reported in this chapter) and to test the
hypotheses 1, 2, 3, 4, 5, 6, and 7 (reported in Chapter 7).
6.2.1.1 Dependent Variable 1: Employees’ Brand Identification (EI) Validation
6.2.1.1.1 Undimensionality Confirmation
Employees’ brand identification was measured using a reduced 8-item version of Punjaisri
(2008). Prior to submitting items to CFA, normality checks were performed by examining
skewness and kurtosis (see appendix 6.2). All items were submitted and specified to load on
customer-facing employees (n=1,747). As shown in Table 6-30 below, the initial model
presented a poor fit. This current study decided to proceed with scale reduction to improve
model fit. Removal of one item resulted in a 7 item model with good fit.
Table 6-30: Fit indices of Initial and Final EI Models
Fit Index Criteria EI Model Acceptability Final EI
Model
Acceptability
Chi Square
(df)
372.207 (20) 9.433 (9)
P >0.05 0.000 No 0.398 Yes
RMSEA <0.08 0.100 No 0.005 Yes
GFI ≥0.9 0.942 Yes 0.998 Yes
CFI ≥0.9 0.960 Yes 1.000 Yes
NFI ≥0.9 0.958 Yes 0.999 Yes
NNFI (TLI) ≥0.95 0.944 Close 1.000 Yes
SRMR <0.08 0.0336 Yes 0.0060 Yes

192
6.2.1.1.2 Convergent Validity Assessment
As shown in Table 6-31, all factor loadings are high and item reliability range between 0.45
and 0.81. Convergent validity (AVE) is 0.52, above the minimum criterion recommended by
Fornell & Larcker (1981). Cronbach’s Alpha is above 0.6, indicating respectable internal
consistency reliability (Nunnally et al., 1967). The composite reliability values exceed the
critical value of 0.6 (Bagozzi & Yi, 1988).
Table 6-31: EI Scale Item Parameters
Item n=1,747
Std. Factor
Loadings
Meas.
Error
Item
reliability
att02 I feel a sense of ownership for this hotel. .832 .233 0.767
att03 My sense of pride towards the hotel brand is reinforced by the brand-related messages.
.812 .234 0.766
att04 I view the success of the brand as my own success. .850 .190 0.81
att05 The hotel is like a family to me. .776 .270 0.73
att06 I feel belonging to this hotel. .680 .343 0.657
att07 When I talk about this hotel. I usually say ‘we’ rather than ‘they’.
.724 .325 0.675
att08 When someone praises this brand, it feels like a personal compliment.
.601 .547 0.453
Convergent validity (AVE) 0.52
Composite Reliability 0.85
Cronbach’s Alpha 0.91
6.2.1.2 Dependent Variable 2: Employees’ Brand Commitment (EC) Validation
6.2.1.2.1 Undimensionality Confirmation
Employees’ brand commitment was measured using a 12-item scale where all items were
submitted and specified to load on customer-facing employees (n=1,747). Prior to submitting
items to CFA, normality checks were performed by examining skewness and kurtosis (see
Appendix 6.2). As shown in Table 6-32, the initial model presented a poor fit. Thus, the
current study decided to proceed with scale reduction to improve model fit. Removal of
seven item resulted in a 5-item model with good fit.
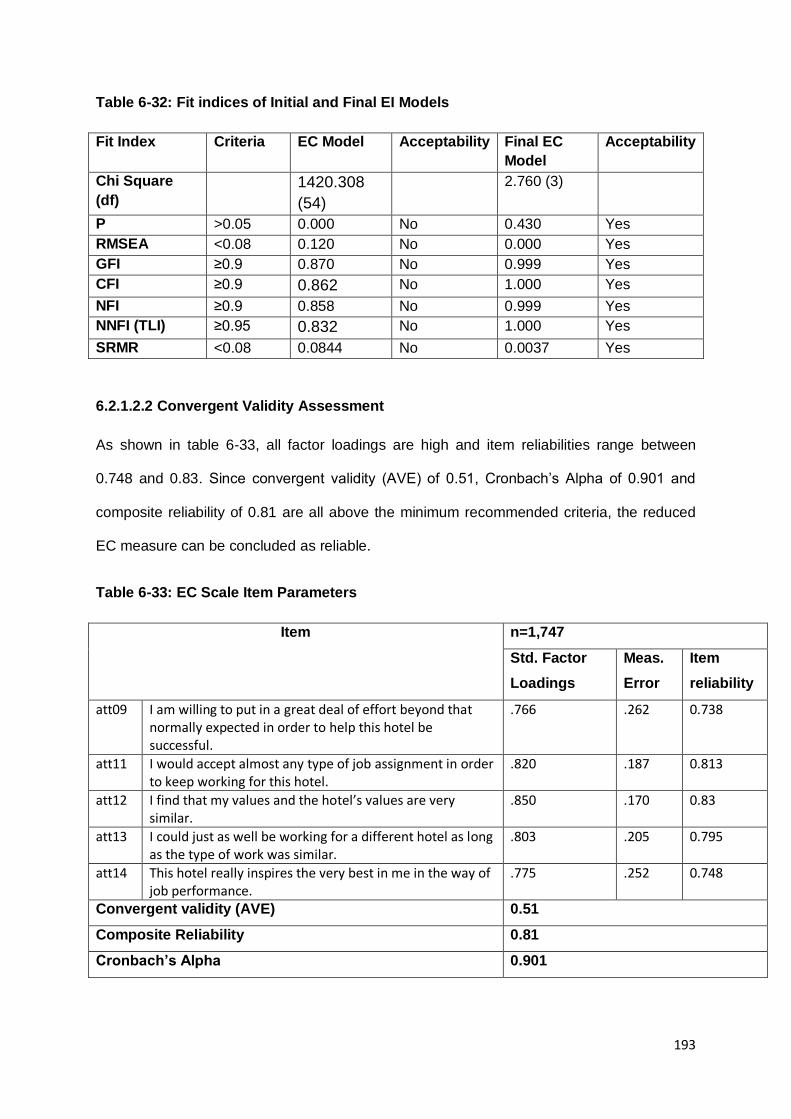
193
Table 6-32: Fit indices of Initial and Final EI Models
Fit Index Criteria EC Model Acceptability Final EC
Model
Acceptability
Chi Square
(df)
1420.308
(54)
2.760 (3)
P >0.05 0.000 No 0.430 Yes
RMSEA <0.08 0.120 No 0.000 Yes
GFI ≥0.9 0.870 No 0.999 Yes
CFI ≥0.9 0.862 No 1.000 Yes
NFI ≥0.9 0.858 No 0.999 Yes
NNFI (TLI) ≥0.95 0.832 No 1.000 Yes
SRMR <0.08 0.0844 No 0.0037 Yes
6.2.1.2.2 Convergent Validity Assessment
As shown in table 6-33, all factor loadings are high and item reliabilities range between
0.748 and 0.83. Since convergent validity (AVE) of 0.51, Cronbach’s Alpha of 0.901 and
composite reliability of 0.81 are all above the minimum recommended criteria, the reduced
EC measure can be concluded as reliable.
Table 6-33: EC Scale Item Parameters
Item n=1,747
Std. Factor
Loadings
Meas.
Error
Item
reliability
att09 I am willing to put in a great deal of effort beyond that normally expected in order to help this hotel be successful.
.766 .262 0.738
att11 I would accept almost any type of job assignment in order to keep working for this hotel.
.820 .187 0.813
att12 I find that my values and the hotel’s values are very similar.
.850 .170 0.83
att13 I could just as well be working for a different hotel as long as the type of work was similar.
.803 .205 0.795
att14 This hotel really inspires the very best in me in the way of job performance.
.775 .252 0.748
Convergent validity (AVE) 0.51
Composite Reliability 0.81
Cronbach’s Alpha 0.901

194
6.2.1.3 Dependent Variable 3: Employees’ Brand Loyalty (EL) Validation
6.2.1.3.1 Undimensionality Confirmation
Employees’ Brand Loyalty was measured using a 3-item version of Punjaisri (2008). Prior to
submitting items to CFA, normality checks were performed by examining skewness and
kurtosis (see Appendix 6.2). All items were submitted and specified to load on customer-
facing employees (n=1,747). As shown in Table 6-34 below, the initial model presented a
poor fit. The current study decided to precede in using the modification indices to cover error
terms that are part of the same factor to improve model fit. Using the modification indices
resulted in a 3-item model with good fit.
Table 6-34: Fit indices of Initial and Final EL Models
Fit Index Criteria EL Model Acceptability Final EL
Model
Acceptability
Chi Square
(df)
25.625 (1) 1.836 (1)
P >0.05 0.000 No 0.175 Yes
RMSEA <0.08 0.119 No 0.022 Yes
GFI ≥0.9 0.990 Yes 0.999 Yes
CFI ≥0.9 0.977 Yes 0.999 Yes
NFI ≥0.9 0.976 Yes 0.998 Yes
NNFI (TLI) ≥0.95 0.930 Yes 0.998 Yes
SRMR <0.08 0.0278 Yes 0.0081 Yes
6.2.1.3.2 Convergent Validity Assessment
As shown in Table 6-35, all factor loadings are high and item reliabilities range between
0.204 and 0.848. Convergent validity (AVE) is 0.55, above the minimum criterion
recommended by Fornell and Larcker (1981). Cronbach’s Alpha is 0.683, above the
minimum criterion recommended by Nunnall et al. (1967). The composite reliability value
exceeds the critical value of 0.71 (Bagozzi & Yi, 1988).
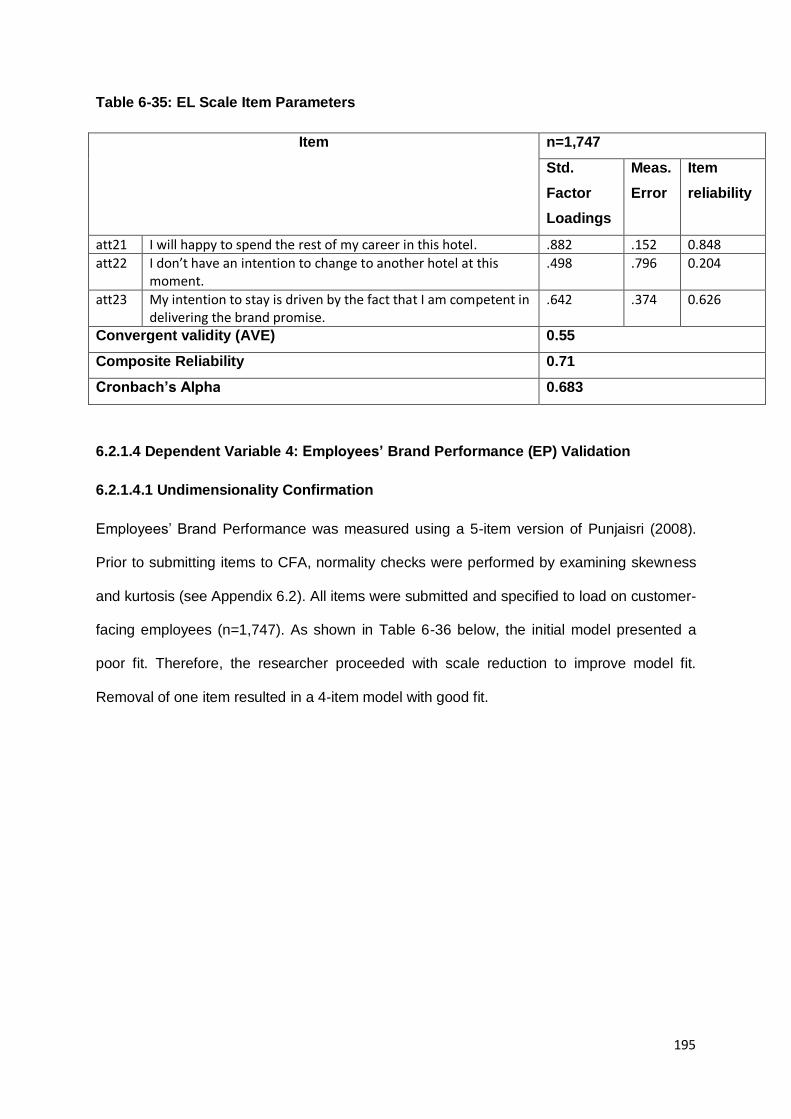
195
Table 6-35: EL Scale Item Parameters
Item n=1,747
Std.
Factor
Loadings
Meas.
Error
Item
reliability
att21 I will happy to spend the rest of my career in this hotel. .882 .152 0.848
att22 I don’t have an intention to change to another hotel at this moment.
.498 .796 0.204
att23 My intention to stay is driven by the fact that I am competent in delivering the brand promise.
.642 .374 0.626
Convergent validity (AVE) 0.55
Composite Reliability 0.71
Cronbach’s Alpha 0.683
6.2.1.4 Dependent Variable 4: Employees’ Brand Performance (EP) Validation
6.2.1.4.1 Undimensionality Confirmation
Employees’ Brand Performance was measured using a 5-item version of Punjaisri (2008).
Prior to submitting items to CFA, normality checks were performed by examining skewness
and kurtosis (see Appendix 6.2). All items were submitted and specified to load on customer-
facing employees (n=1,747). As shown in Table 6-36 below, the initial model presented a
poor fit. Therefore, the researcher proceeded with scale reduction to improve model fit.
Removal of one item resulted in a 4-item model with good fit.

196
Table 6-36: Fit indices of Initial and Final EP Models
Fit Index Criteria EL Model Acceptability Final EL
Model
Acceptability
Chi Square
(df)
60.022 (5) 1.420 (1)
P >0.05 0.000 No 0.223 Yes
RMSEA <0.08 0.079 Yes 0.016 Yes
GFI ≥0.9 0.986 Yes 1.000 Yes
CFI ≥0.9 0.979 Yes 1.000 Yes
NFI ≥0.9 0.978 Yes 0.999 Yes
NNFI (TLI) ≥0.95 0.959 Yes 0.999 Yes
SRMR <0.08 0.0239 Yes 0.0045 Yes
6.2.1.4.2 Convergent Validity Assessment
As shown in Table 5-37, all factor loadings are high and item reliabilities range between
0.699 and 0.784. Convergent validity (AVE) is 0.5, above the minimum criterion
recommended by Fornell & Larcker (1981). Cronbach’s Alpha is 0.835, above the minimum
criterion recommended by Nunnally et al. (1967). The composite reliability value exceeds the
critical value of 0.75 (Bagozzi & Yi, 1988).
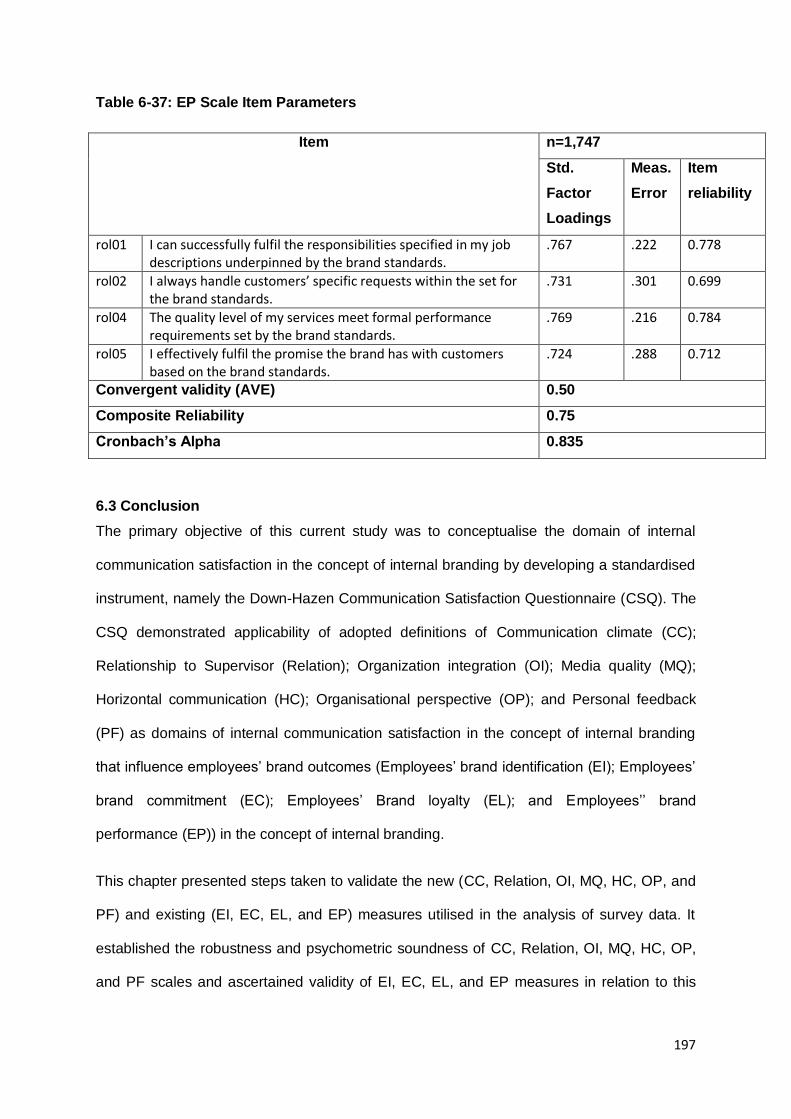
197
Table 6-37: EP Scale Item Parameters
Item n=1,747
Std.
Factor
Loadings
Meas.
Error
Item
reliability
rol01 I can successfully fulfil the responsibilities specified in my job descriptions underpinned by the brand standards.
.767 .222 0.778
rol02 I always handle customers’ specific requests within the set for the brand standards.
.731 .301 0.699
rol04 The quality level of my services meet formal performance requirements set by the brand standards.
.769 .216 0.784
rol05 I effectively fulfil the promise the brand has with customers based on the brand standards.
.724 .288 0.712
Convergent validity (AVE) 0.50
Composite Reliability 0.75
Cronbach’s Alpha 0.835
6.3 Conclusion
The primary objective of this current study was to conceptualise the domain of internal
communication satisfaction in the concept of internal branding by developing a standardised
instrument, namely the Down-Hazen Communication Satisfaction Questionnaire (CSQ). The
CSQ demonstrated applicability of adopted definitions of Communication climate (CC);
Relationship to Supervisor (Relation); Organization integration (OI); Media quality (MQ);
Horizontal communication (HC); Organisational perspective (OP); and Personal feedback
(PF) as domains of internal communication satisfaction in the concept of internal branding
that influence employees’ brand outcomes (Employees’ brand identification (EI); Employees’
brand commitment (EC); Employees’ Brand loyalty (EL); and Employees’’ brand
performance (EP)) in the concept of internal branding.
This chapter presented steps taken to validate the new (CC, Relation, OI, MQ, HC, OP, and
PF) and existing (EI, EC, EL, and EP) measures utilised in the analysis of survey data. It
established the robustness and psychometric soundness of CC, Relation, OI, MQ, HC, OP,
and PF scales and ascertained validity of EI, EC, EL, and EP measures in relation to this
198
data sample. It is now possible to utilise these measures in a further analysis to test
hypotheses 1, 2, 3, 4, 5, 6, 7, 8, 9, 10 and 11 (given in Chapter 2). The results of hypotheses
1, 2, 3, 4, 5, 6, 7, 8, 9, 10 and 11 will be presented in Chapter 7.

199
Chapter 7: Analysis and Results Part 2: Hypotheses Testing
7.0 Introduction
In Chapter 6, this study reported the reliability and validity analysis of all measured
constructs: Internal Communication Satisfaction, Employees’ Brand Attitudes and
Employees’ Brand Performance. In testing relevant objectives and hypotheses developed in
Chapter 2, 3 and 4, this Chapter details the results of the survey study and test relevant
objectives and hypotheses developed in Chapter 2, 3 and 4. Chapter 7 is structured around
different objectives and hypotheses, as described in the following Table 7-1.
Table 7-1: Objectives and hypotheses measured by empirical studies
Objective 1: To conceptualise the domain of internal communication satisfaction within the
concept of internal branding.
Hypotheses – (Section 7.1-7.8) Survey
H1: Communication climate climate has significant indirect influences on
employees’ brand performance:
H1.1 Communication climate has a positive relationship with employees’
brand attitudes (Employee brand identification, Employee brand
commitment and Employee brand loyalty).
/
H1.2 Employees’ brand attitudes play as a meditational factor in the
relationship between communication climate and employees’ brand
performance.
/
H2: Relationship to superiors has significant indirect influences on
employees’ brand performance:
H2.1 Relationship to superiors has a positive relationship with employees’
brand attitudes (Employee brand identification, Employee brand
commitment and Employee brand loyalty).
/
H2.2 Employees’ brand attitudes play as a meditational factor on the
relationship between relationship to superiors and employees’ brand
performance.
/
200
Hypotheses – (Section 6.1-6.7) Survey
H3: Organizational integration has significant indirect influences on
employees’ brand performance:
H3.1 Organizational integration has a positive relationship with employees’
brand attitudes (Employee brand identification, Employee brand
commitment and Employee brand loyalty).
/
H3.2 Employees’ brand attitudes play as a meditational factor on the
relationship between organizational integration and employees’ brand
performance.
/
H4: Media quality has significant indirect influences on employees’ brand
performance:
H4.1 Media quality has a positive relationship with employees’ brand
attitudes (Employee brand identification, Employee brand commitment
and Employee brand loyalty).
/
H4.2 Employees’ brand attitudes play as a meditational factor on the
relationship between media quality and employees’ brand performance.
/
H5: Horizontal communication has significant indirect influences on
employees’ brand performance:
H5.1 Horizontal communication has a positive relationship with employees’
brand attitudes (Employee brand identification, Employee brand
commitment and Employee brand loyalty).
/
H5.2 Employees’ brand attitudes play as a meditational factor on the
relationship between horizontal communication and employees’ brand
performance.
/
H6: Organisational perspective has significant indirect influences on
employees’ brand performance:
H6.1 Organisational perspective has a positive relationship with employees’
brand attitudes (Employee brand identification, Employee brand
commitment and Employee brand loyalty).
/
H6.2 Employees’ brand attitudes play as a meditational factor on the
relationship between organisational perspective and employees’ brand
performance.
/

201
Hypotheses – (Section 6.1-6.7) Survey
H7: Personal feedback has significant indirect influences on employees’
brand performance:
H7.1 Personal feedback has a positive relationship with employees’ brand
attitudes (Employee brand identification, Employee brand commitment
and Employee brand loyalty).
/
H7.2 Employees’ brand attitudes play as a meditational factor on the
relationship between personal feedback and employees’ brand
performance.
/
Objective 2: To determine the nomological network of internal branding.
H8: The second-order factor structure of internal communication satisfaction
has a positive relationship with employees’ brand attitudes.
/
H9: The second-order factor structure of employees’ brand attitudes acts as
a mediational factor in the relationship between internal communication
satisfaction and employees’ brand performance.
/
H10: The second-order factor structure of internal communication satisfaction
positively influences employees’ brand performance.
/
Objective 3: To evaluate the influence of internal communication on employees’ behaviour
from high/ low performance employees based on a developing country context using
evidence from the hotel sector in Thailand.
H11: Performance rankings in hotels moderate the effects that internal
communication satisfaction has on employees' brand attitudes and
employees' brand performance; specifically, the impact of internal
communication satisfaction will be stronger in hotels which are ranked
highly by customers.
/
This chapter is divided into four main sections.
Part 1 tests the seven hypotheses (H1, 2, 3, 4, 5, 6 and 7) stated in the introduction of this
chapter. Mainly, these hypotheses were tested though the results of the survey, by testing
the Structural Equation Model in Section 7.1-7.10.

202
Part 2 is a higher-order approach to internal communication satisfaction (ICS) and to
employees’ brand attitudes (EBA) in Section 7.11-7.13 and this section details the
development of a higher-order model for internal communication satisfaction and employees’
brand attitudes attributes, investigation of factor relationship, reliability and validity
assessment.
Part 3 tests the three hypotheses (H8, 9 and 10) stated in the introduction of this chapter.
This part shows model estimation and comparison in Section 7.17 and 7.20. The statistically
‘best’ model was determined through a combined use of model comparison and model
development.
Part 4 tests the hypothesis 11 stated in the introduction of this chapter. This part shows the
evaluation models used by differently ranked hotels in a developing country, which are
shown in Section 7.18 - 7.20.
Part I (Section 7.1-7.10)
7.1 Hypotheses Testing (H1, 2, 3, 4, 5, 6, and 7)
In this section, this current study analyses and reports the hypotheses testing (H1, 2, 3, 4, 5,
6, and 7) using the results of the survey. The first steps of this study have checked the
goodness of fit of the proposed structural equation models, and in the second steps, the
study has tested the seven hypotheses. The Structural Equation Model developed in
accordance with the proposed measurement model is reproduced below as figure 7-1, 7-2,
7-3, 7-4, 7-5, 7-6, and 7-7.

203
Figure 7-1: Measurement Model - Communication Climate (CC) and its influence on
Employee Identification (EI), Employee Commitment (EC), Employee Loyalty (EL) and
Employees’ Brand Performance (EBP)

204
Figure 7-2: Measurement Model - Relationship to Supervisors (Relation) and its
influence on Employee Identification (EI), Employee Commitment (EC), Employee
Loyalty (EL) and Employees’ Brand Performance (EBP)

205
Figure 7-3: Measurement Model - Organizational Integration (OI) and its influence on
Employee Identification (EI), Employee Commitment (EC), Employee Loyalty (EL) and
Employees’ Brand Performance (EBP)
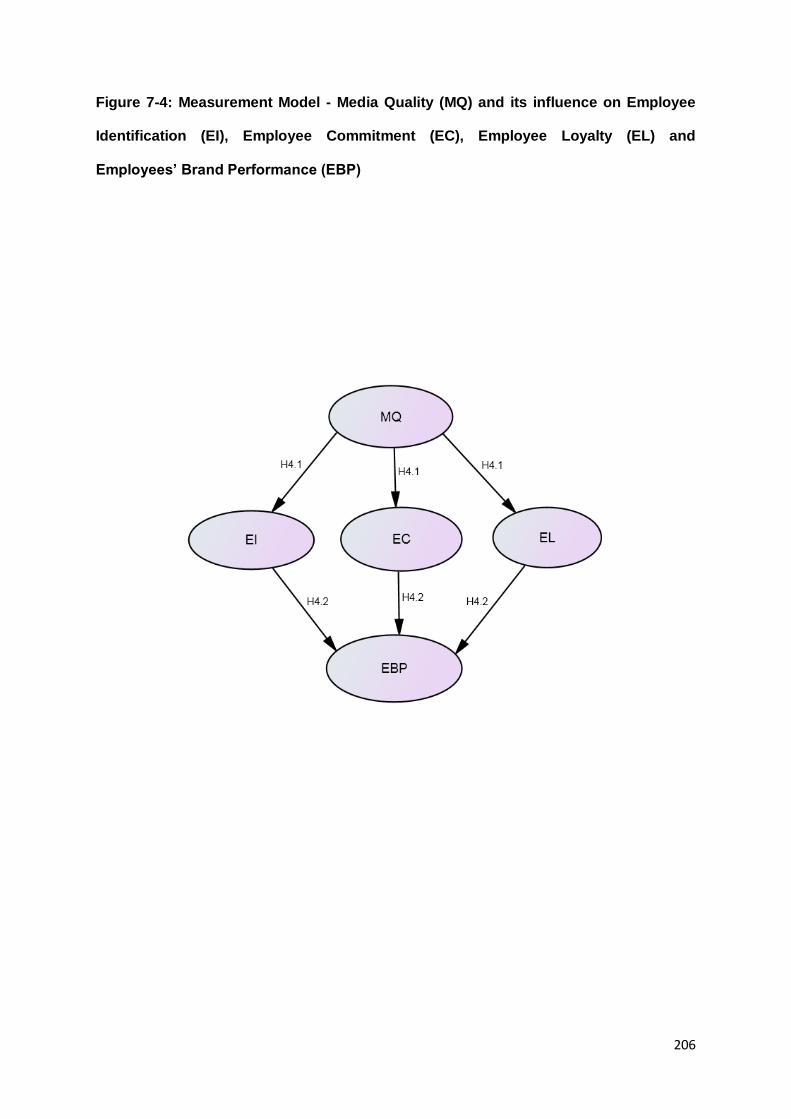
206
Figure 7-4: Measurement Model - Media Quality (MQ) and its influence on Employee
Identification (EI), Employee Commitment (EC), Employee Loyalty (EL) and
Employees’ Brand Performance (EBP)

207
Figure 7-5: Measurement Model - Horizontal Communication (HC) and its influence on
Employee Identification (EI), Employee Commitment (EC), Employee Loyalty (EL) and
Employees’ Brand Performance (EBP)
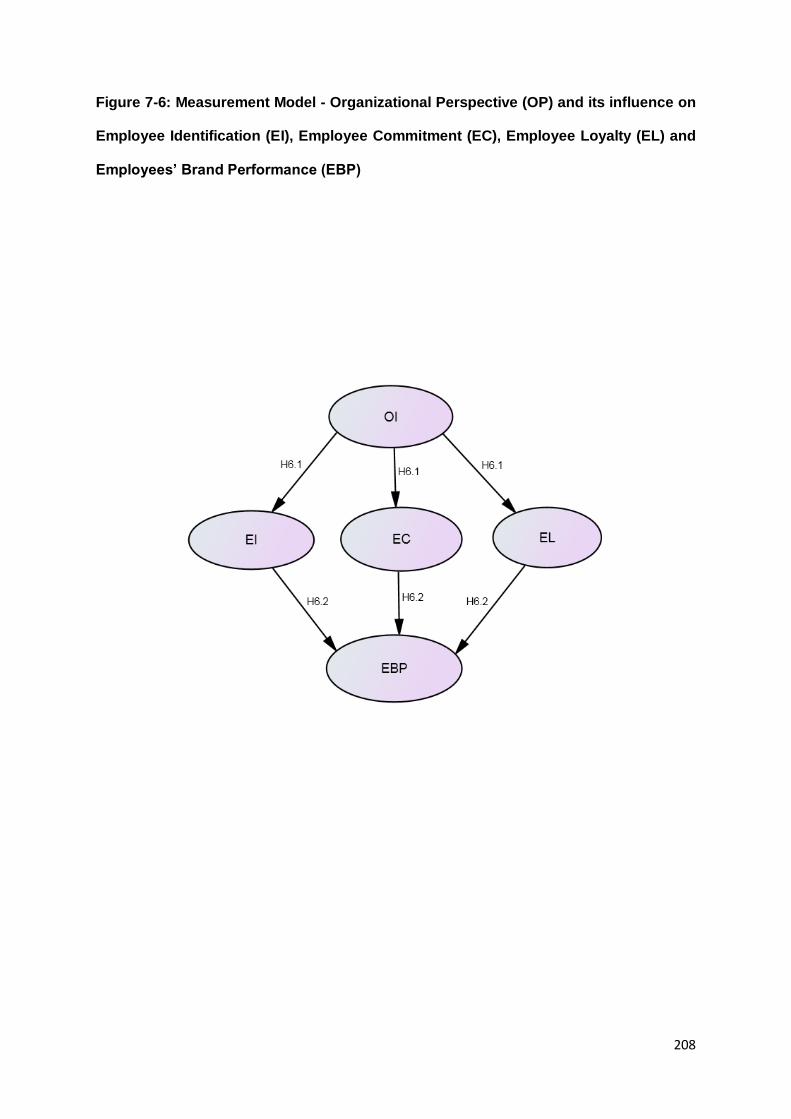
208
Figure 7-6: Measurement Model - Organizational Perspective (OP) and its influence on
Employee Identification (EI), Employee Commitment (EC), Employee Loyalty (EL) and
Employees’ Brand Performance (EBP)
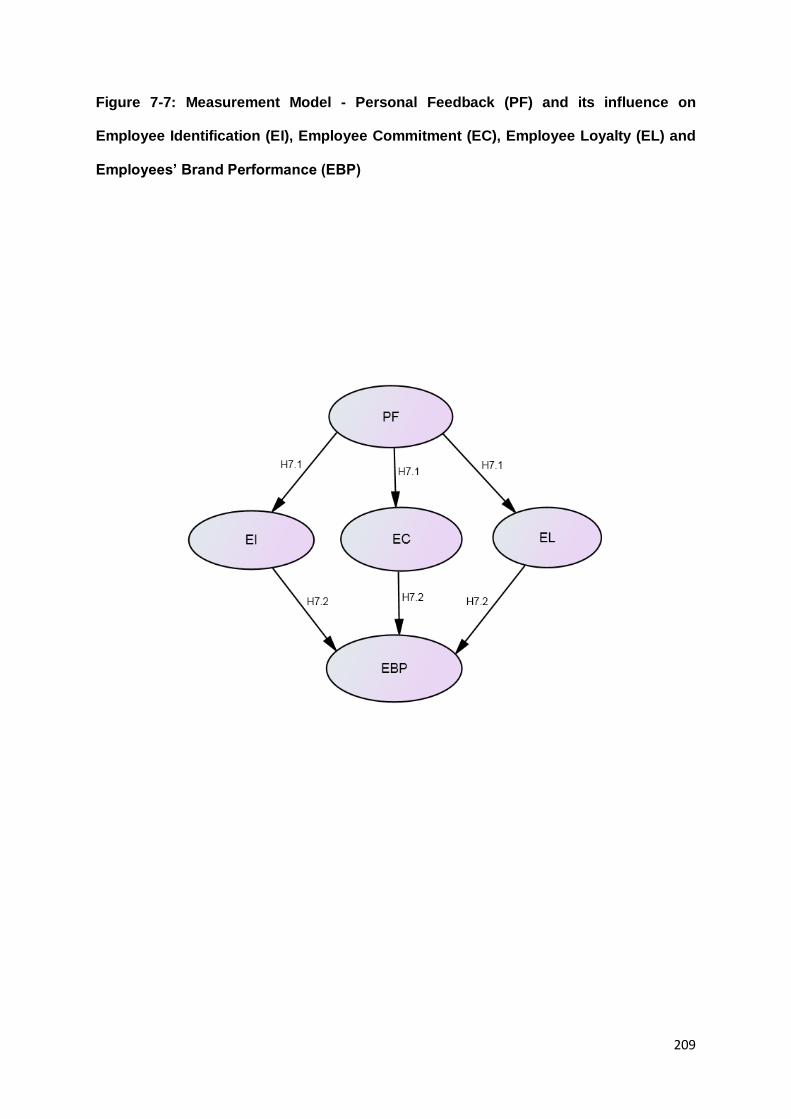
209
Figure 7-7: Measurement Model - Personal Feedback (PF) and its influence on
Employee Identification (EI), Employee Commitment (EC), Employee Loyalty (EL) and
Employees’ Brand Performance (EBP)
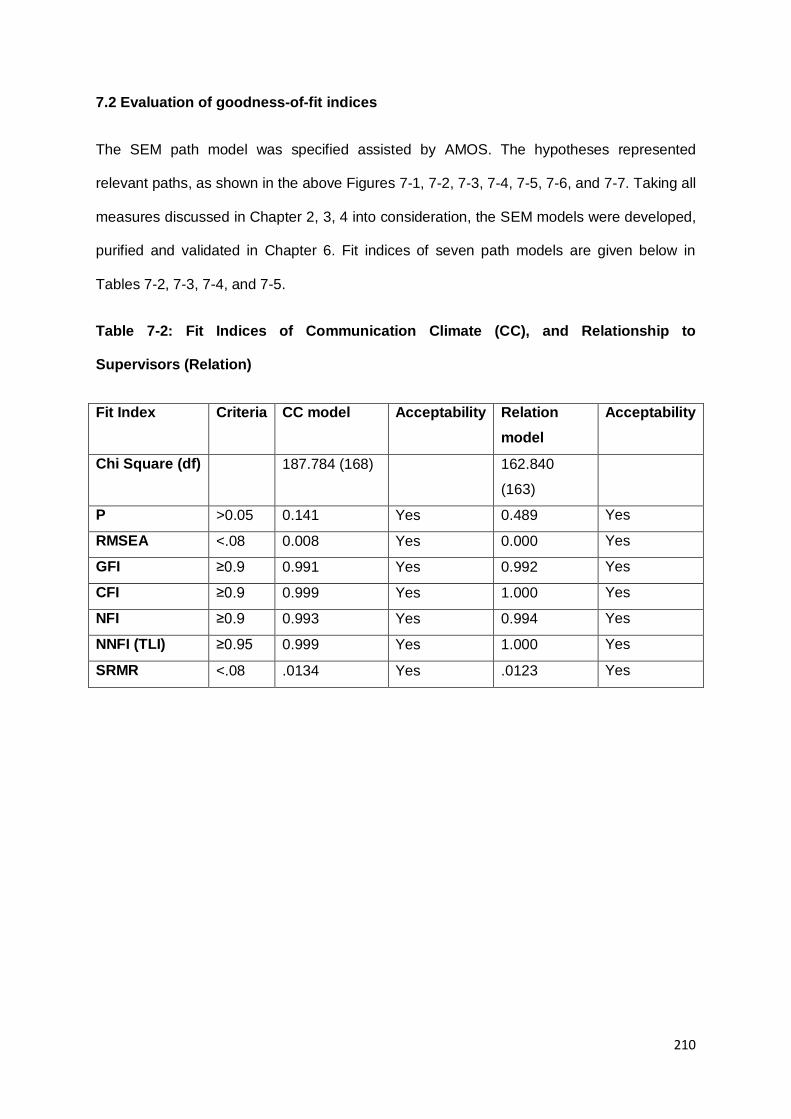
210
7.2 Evaluation of goodness-of-fit indices
The SEM path model was specified assisted by AMOS. The hypotheses represented
relevant paths, as shown in the above Figures 7-1, 7-2, 7-3, 7-4, 7-5, 7-6, and 7-7. Taking all
measures discussed in Chapter 2, 3, 4 into consideration, the SEM models were developed,
purified and validated in Chapter 6. Fit indices of seven path models are given below in
Tables 7-2, 7-3, 7-4, and 7-5.
Table 7-2: Fit Indices of Communication Climate (CC), and Relationship to
Supervisors (Relation)
Fit Index Criteria CC model Acceptability Relation
model
Acceptability
Chi Square (df) 187.784 (168) 162.840
(163)
P >0.05 0.141 Yes 0.489 Yes
RMSEA <.08 0.008 Yes 0.000 Yes
GFI ≥0.9 0.991 Yes 0.992 Yes
CFI ≥0.9 0.999 Yes 1.000 Yes
NFI ≥0.9 0.993 Yes 0.994 Yes
NNFI (TLI) ≥0.95 0.999 Yes 1.000 Yes
SRMR <.08 .0134 Yes .0123 Yes

211
Table 7-3: Fit Indices of Organizational Integration (OI) and Media Quality (MQ)
Fit Index Criteria OI model Acceptability MQ model Acceptability
Chi Square (df) 148.376 (123) 141.342
(130)
P >0.05 .059 Yes .234 Yes
RMSEA <.08 .011 Yes .007 Yes
GFI ≥0.9 .992 Yes .993 Yes
CFI ≥0.9 .999 Yes 1.000 Yes
NFI ≥0.9 .994 Yes .994 Yes
NNFI (TLI) ≥0.95 .998 Yes .999 Yes
SRMR <.08 .0122 Yes .0113 Yes
Table 7-4: Fit Indices of Horizontal Communication (HC) and Organizational
Perspective (OP)
Fit Index Criteria HC model Acceptability OP model Acceptability
Chi Square (df) 150.801 (126) 172.303
(150)
P >0.05 .065 Yes .103 Yes
RMSEA <.08 .011 Yes .009 Yes
GFI ≥0.9 .992 Yes .992 Yes
CFI ≥0.9 .999 Yes .999 Yes
NFI ≥0.9 .994 Yes .993 Yes
NNFI (TLI) ≥0.95 .998 Yes .998 Yes
SRMR <.08 .0125 Yes .0154 Yes

212
Table 7-5: Fit Indices of Personal Feedback (PF)
Fit Index Criteria PF model Acceptability
Chi Square (df) 168.273 (153)
P >0.05 .188 Yes
RMSEA <.08 .008 Yes
GFI ≥0.9 .992 Yes
CFI ≥0.9 .999 Yes
NFI ≥0.9 .994 Yes
NNFI (TLI) ≥0.95 .999 Yes
SRMR <.08 .0125 Yes
When examining the absolute fit indices based on the manner in which they assess fit and
following recommendations by Hooper, Coughlan, & Mullen (2008), all seven models show a
good and acceptable fit:
The RMSEA (Root mean square error of approximation) is below 0.08 (0.008 in CC model,
0.000 in Relation model, 0.011 in OI model, 0.007 in MQ model, 0.011 in HC model, 0.009 in
OP model, and 0.008 in PF model).
GFI is 0.90 or closer (0.991 in CC model, 0.992 in Relation model, 0.992 in OI model, 0.993
in MQ model, 0.992 in HC model, 0.992 in OP model, and 0.992 in PF model).
CFI (Comparative fit index) is 0.90 or closer (0.999 in CC model, 1.000 in Relation model,
0.999 in OI model, 1.000 in MQ model, 0.999 in HC model, 0.999 in OP model, and 0.992 in
PF model).
NFI (Normed fit index) is 0.90 or closer (0.993 in CC model, 0.994 in Relation model, 0.994
in OI model, 0.994 in MQ model, 0.994 in HC model, 0.993 in OP model, and 0.994 in PF
model).
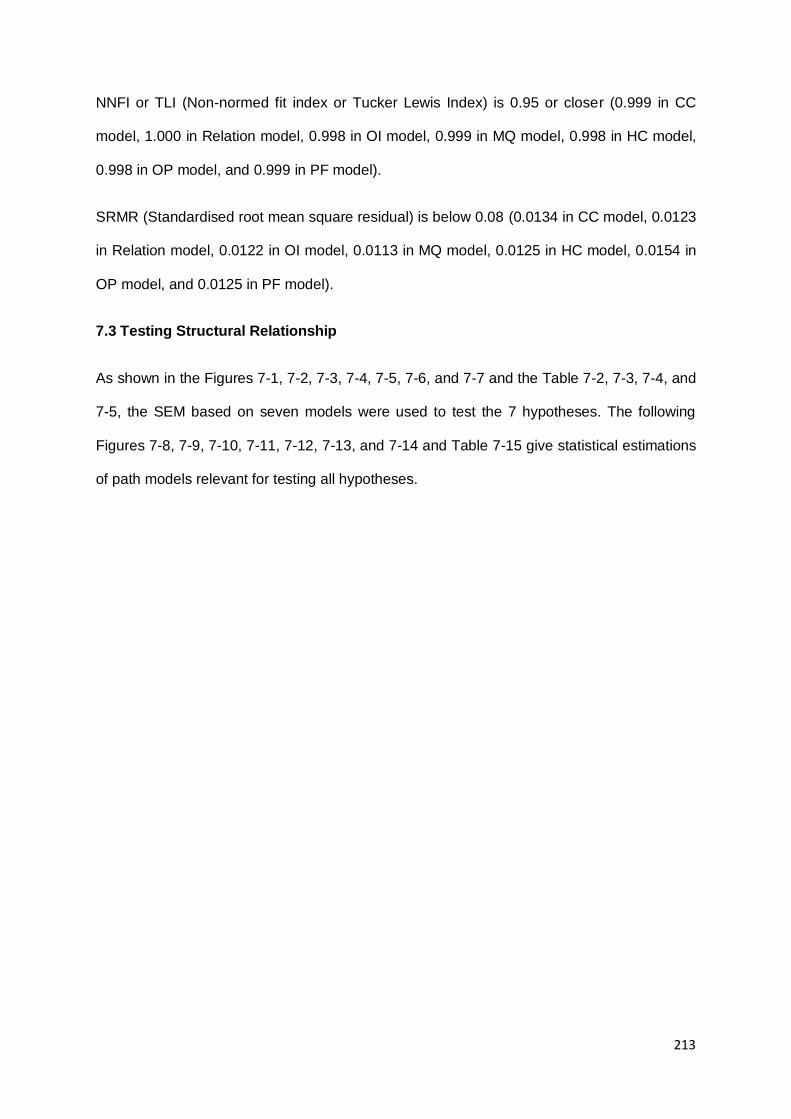
213
NNFI or TLI (Non-normed fit index or Tucker Lewis Index) is 0.95 or closer (0.999 in CC
model, 1.000 in Relation model, 0.998 in OI model, 0.999 in MQ model, 0.998 in HC model,
0.998 in OP model, and 0.999 in PF model).
SRMR (Standardised root mean square residual) is below 0.08 (0.0134 in CC model, 0.0123
in Relation model, 0.0122 in OI model, 0.0113 in MQ model, 0.0125 in HC model, 0.0154 in
OP model, and 0.0125 in PF model).
7.3 Testing Structural Relationship
As shown in the Figures 7-1, 7-2, 7-3, 7-4, 7-5, 7-6, and 7-7 and the Table 7-2, 7-3, 7-4, and
7-5, the SEM based on seven models were used to test the 7 hypotheses. The following
Figures 7-8, 7-9, 7-10, 7-11, 7-12, 7-13, and 7-14 and Table 7-15 give statistical estimations
of path models relevant for testing all hypotheses.

214
Figure 7.8 Model of Relationships between Communication Climate (CC), Employees'
Brand Attitudes (e.g. Brand Identification, Brand Commitment, and Brand Loyalty),
and Employees’ Brand Performance

215
Figure 7.9 Model of Relationships between Relationship to Supervisors (Relation),
Employees' Brand Attitudes (e.g. Brand Identification, Brand Commitment, and Brand
Loyalty), and Employees’ Brand Performance
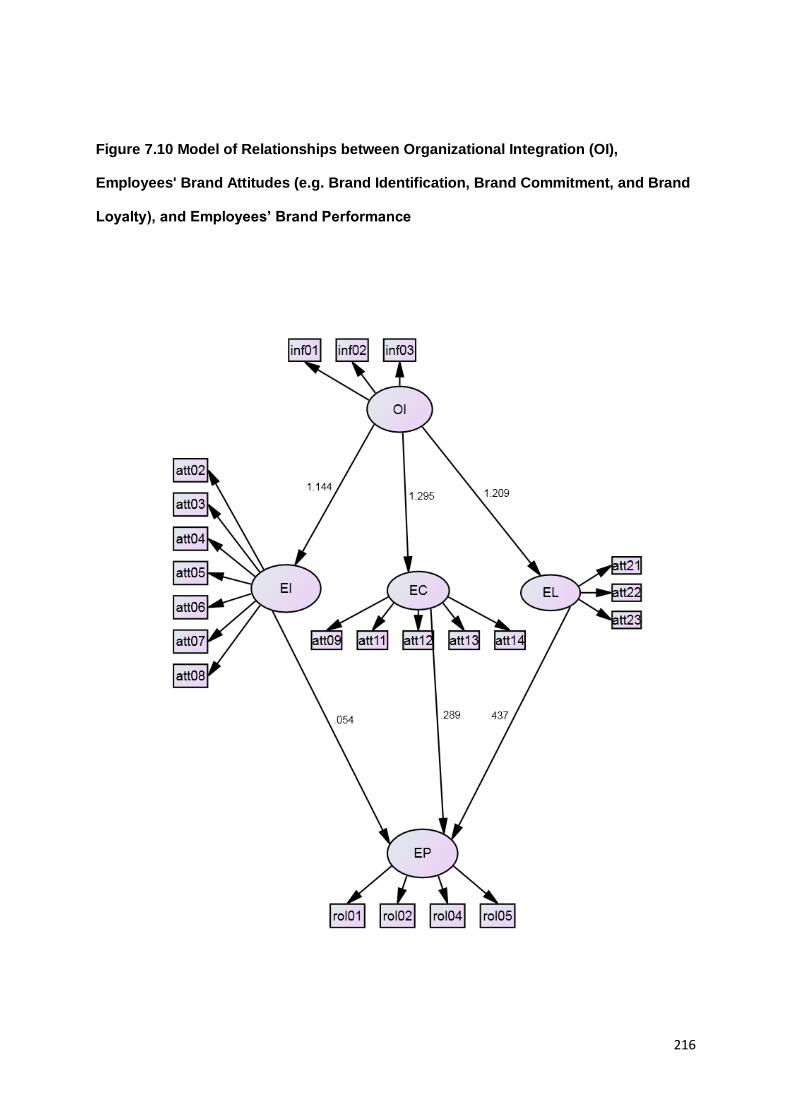
216
Figure 7.10 Model of Relationships between Organizational Integration (OI),
Employees' Brand Attitudes (e.g. Brand Identification, Brand Commitment, and Brand
Loyalty), and Employees’ Brand Performance

217
Figure 7.11 Model of Relationships between Media Quality (MQ), Employees' Brand
Attitudes (e.g. Brand Identification, Brand Commitment, and Brand Loyalty), and
Employees’ Brand Performance

218
Figure 7.12 Model of Relationships between Horizontal Communication (HC),
Employees' Brand Attitudes (e.g. Brand Identification, Brand Commitment, and Brand
Loyalty), and Employees’ Brand Performance
219
Figure 7.13 Model of Relationships between Organizational Perspective (OP),
Employees' Brand Attitudes (e.g. Brand Identification, Brand Commitment, and Brand
Loyalty), and Employees’ Brand Performance

220
Figure 7.14 Model of Relationships between Personal Feedback (PF), Employees'
Brand Attitudes (e.g. Brand Identification, Brand Commitment, and Brand Loyalty),
and Employees’ Brand Performance

221
Table 7-5: AMOS Output Extract: Standardized Regression Estimates of the
Hypotheses Tested
No. Hypotheses Causal Path Path
Coefficients
(β value)
Supported
/ not
Supported
H1: Communication climate has significant indirect influences on employees’ brand
performance:
H1.1 Communication climate
has a positive
relationship with
employees’ brand
attitudes (Employee
brand identification,
Employee brand
commitment and
Employee brand
loyalty).
EI <--- CC EC <--- CC EL<--- CC
.567
.591
.532
Supported
Supported
Supported
H1.2 Employees’ brand
attitudes play as a
meditational factor in the
relationship between
communication climate
and employees’ brand
performance.
EP <--- EI EP <--- EC EP <--- EL
.162
.092
.468
Supported Supported Supported
H2: Relationship to superiors has significant indirect influences on employees’ brand
performance:
H2.1 Relationship to
superiors has a positive
relationship with
employees’ brand
attitudes (Employee
brand identification,
Employee brand
commitment and
Employee brand
loyalty).
EI <--- Relation EC <--- Relation EL <--- Relation
.487
.510
.537
Supported Supported Supported
H2.2 Employees’ brand
attitudes play as a
meditational factor on
the relationship between
relationship to superiors
and employees’ brand
performance.
EP <--- EI EP <--- EC EP <--- EL
.125
.335
.295
Supported Supported Supported

222
Table 7-5: AMOS Output Extract: Standardized Regression Estimates of the
Hypotheses Tested
No. Hypotheses Causal Path Path
Coefficients
(β value)
Supported
/ not
Supported
H3: Organizational integration has significant indirect influences on employees’ brand
performance:
H3.1 Organizational
integration has a
positive relationship
with employees’ brand
attitudes (Employee
brand identification,
Employee brand
commitment and
Employee brand
loyalty).
EI <--- OI EC <--- OI EL <--- OI
1.144 1.295 1.209
Supported Supported Supported
H3.2 Employees’ brand
attitudes play as a
meditational factor on
the relationship
between organizational
integration and
employees’ brand
performance.
EP <--- EI EP <--- EC EP <--- EL
.054
.289
.437
Supported Supported Supported
H4: Media quality has significant indirect influences on employees’ brand
performance:
H4.1 Media quality has a
positive relationship
with employees’ brand
attitudes (Employee
brand identification,
Employee brand
commitment and
Employee brand
loyalty).
EI <--- MQ EC <--- MQ EL <--- MQ
1.456 1.561 1.477
Supported Supported Supported
H4.2 Employees’ brand
attitudes play as a
meditational factor on
the relationship
between media quality
and employees’ brand
performance.
EP <--- EI EP <--- EC EP <--- EL
.123
.236
.443
Supported Supported Supported
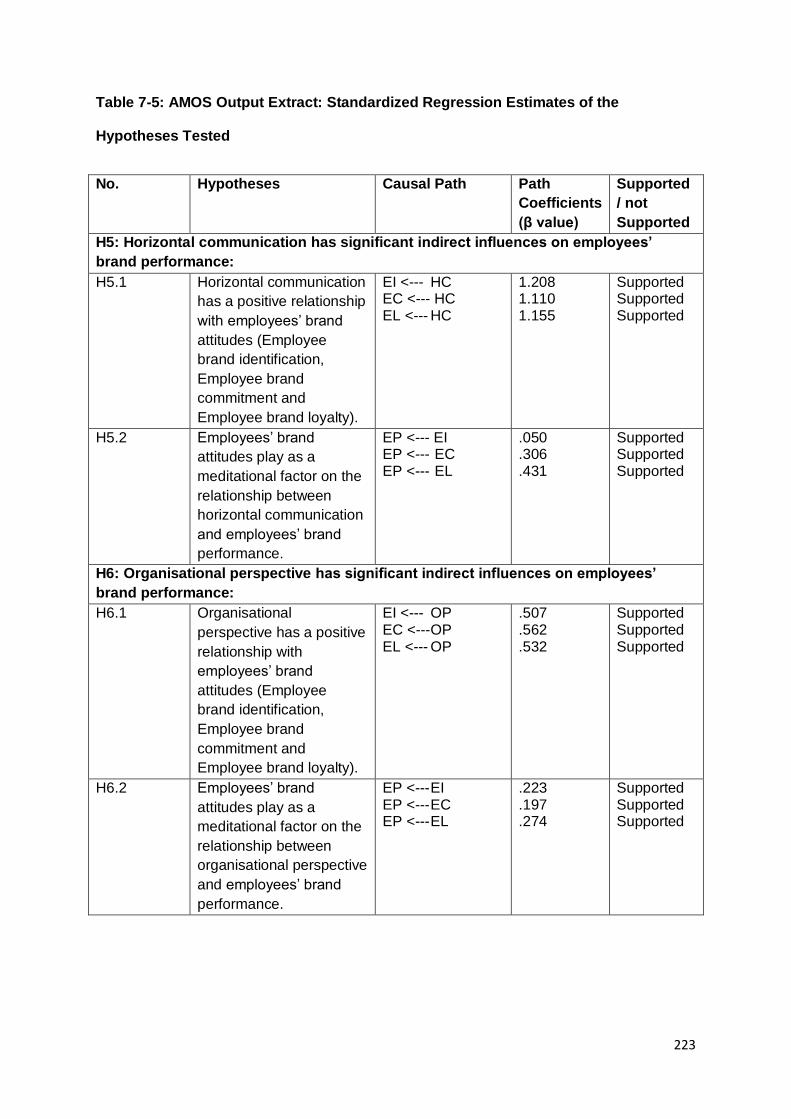
223
Table 7-5: AMOS Output Extract: Standardized Regression Estimates of the
Hypotheses Tested
No. Hypotheses Causal Path Path
Coefficients
(β value)
Supported
/ not
Supported
H5: Horizontal communication has significant indirect influences on employees’
brand performance:
H5.1 Horizontal communication
has a positive relationship
with employees’ brand
attitudes (Employee
brand identification,
Employee brand
commitment and
Employee brand loyalty).
EI <--- HC EC <--- HC EL <--- HC
1.208 1.110 1.155
Supported Supported Supported
H5.2 Employees’ brand
attitudes play as a
meditational factor on the
relationship between
horizontal communication
and employees’ brand
performance.
EP <--- EI EP <--- EC EP <--- EL
.050
.306
.431
Supported Supported Supported
H6: Organisational perspective has significant indirect influences on employees’
brand performance:
H6.1 Organisational
perspective has a positive
relationship with
employees’ brand
attitudes (Employee
brand identification,
Employee brand
commitment and
Employee brand loyalty).
EI <--- OP EC <--- OP EL <--- OP
.507
.562
.532
Supported Supported Supported
H6.2 Employees’ brand
attitudes play as a
meditational factor on the
relationship between
organisational perspective
and employees’ brand
performance.
EP <--- EI EP <--- EC EP <--- EL
.223
.197
.274
Supported Supported Supported

224
Table 7-5: AMOS Output Extract: Standardized Regression Estimates of the
Hypotheses Tested
No. Hypotheses Causal Path Path
Coefficients
(β value)
Supported
/ not
Supported
H7: Personal feedback has significant indirect influences on employees’ brand
performance:
H7.1 Personal feedback has a
positive relationship with
employees’ brand
attitudes (Employee
brand identification,
Employee brand
commitment and
Employee brand loyalty).
EI <--- PF EC <--- PF EL <--- PF
.897
.903
.876
Supported Supported Supported
H7.2 Employees’ brand
attitudes play as a
meditational factor on
the relationship between
personal feedback and
employees’ brand
performance.
EP <--- EI EP <--- EC EP <--- EL
.050
.244
.453
Supported Supported Supported
Based on the statistics, the data supports hypotheses 1, 2, 3, 4, 5, 6, and 7. The following
sections discuss these results by examining the hypotheses in detail.
7.4 Testing Hypothesis 1: The Influence of Communication Climate on Employees’
Brand Outcomes
Considering the influence of communication climate, the overall communication climate
satisfaction has a positive impact, increasing all three employees’ brand attitudes (β = .567,
p<.001 for the effect on brand identification; β = .591, p<.001 on brand commitment; β =
.532, p<.001 on brand loyalty). The results resonated with a number of previous studies that
consider a good communication climate as the barometer for employees’ attitudes in the
organization (Downs & Hazen, 1977). For example, satisfaction with communication climate
improves employee identification (Bartels et al., 2007; Cheney, 1983; Neher, 1996; Smidts,
225
Pruyn, & Van Riel, 2001; Swanson & Kent, 2015), commitment (Frenkel et al., 2012; Guzley,
1992; Neher, 1996; Niehoff, Enz, & Grover, 1990; Trombetta & Rogers, 1988; Welsch,
1981), and loyalty (McKenna, 2012; Smidts et al., 2001).
Moreover, employees’ brand performance is the extent of employees’ brand attitudes (β =
0.162, p<0.001 for the effect from brand identification; β = 0.092, p<0.001 from brand
commitment; β = 0.468, p<0.001 from brand loyalty). It means that all three attitudes of
employees toward a brand play a meditational role in the relationship between
communication climate and employees’ brand performance. Past studies have reported that
a good communication climate such as participation decision making, and open
communication within the organization enhance employees’ brand performance (Arif et al.,
2012; Chory & Hubbell, 2008; Downs & Hazen, 1977; Earley & Mosakowski, 2000; Janssen,
2005; Neher, 1996; van Vuuren, de Jong, & Seydel, 2007; Wei & Morgan, 2004; Wynia et
al., 2010; Zeffane, Tipu, & Ryan, 2011). However, they have provided little empirical
evidence, if any, to support such an argument. These results have revealed that internal
branding used to generate and foster brand values via the communication climate are
significant. A past study (Neher, 1996) has found that when employees are satisfied with the
communication climate in their workplace, they also tend to establish the positive employee-
organization relationship and they are more productive.
When considering communication climate constructs, the ability of people in the organization
to communicate with each other (mot02) is the first point discussed. As the result suggests,
the communication ability has significant effects on employees’ satisfaction on the
communication climate with standardized loading 0.660. This can be explained by the
studies of Smidts et al. (2001), Lam, Chen, and Schaubroeck (2002), and Downs and Hazen
(1977); the communication ability should be enabled to help employees identify themselves
as a vital part of the organization, understand the brand values, and ensure that employees
deliver on the brand values. Therefore, management should have an interest in improving
employees’ communication skills because it involves helping them build relationships with

226
others, transfers the values and identity of a company, develops effective listening skills,
develops effective oral and written communication and non-verbal communication skills,
enables effective use of new technology in the communication process, and improves giving
and receiving feedback. It means that employees may need HR’s attention in educating
them about important communication skills through training, coaching, and on-the-job
practices.
The handling of workplace conflict through communication channels (mot05) is considered
as one of the key constructs of the communication climate with standardized loading 0.709.
A past study has shown that employees who feel satisfied with effective conflict
management in the workplace are more likely to be engaged in their work and feel satisfied
and motivated (Downs & Hazen, 1977). This thesis has extended previous research that
management of conflict can help companies develop an internal branding campaign.
Furthermore, the study of McKenna (2012) has found that internal communication channels
such as face-to-face communication, whereby all the parties in the conflict come face to face
with each other and discuss the issues, will help employees improve performance.
Moreover, the results show that communication motivates employees to achieve a goal
(mot01) and has a significant effect on employees’ satisfaction with the communication
climate with standardized loading 0.748. The result is also in line with past research that
suggests that if the organizations want their employees to feel accountable for achieving the
objectives and goals of the organization, they need to communicate the importance of the
objectives and goals (McKenna, 2012). The study of Latham & Locke (1979) supported the
concept that good communication is an important part of motivating employees to achieve
goals.
The result revealed that internal communication makes employees feel a part of the
organization (mot03) and has a significant effect on employees’ satisfaction with the
communication climate with standardized loading 0.806. Previous studies found that internal

227
communication can provide more support in helping employees adopt a positive attitude in
order to establish that employees feel they are a vital part of the organization, which in turn
leads to meeting performance goals (McKenna, 2012; Salancik & Pfeffer, 1978). When
employees feel that they are an important part of the organization, then the employees will
adopt an attitude reflected in transferring corporate brand values to customers in order to
help achieve company goals. Therefore, a good communication climate engages employees
as a vital part of the organization, and it creates a supportive climate in order to encourage
the improvement of performance (McKenna, 2012).
Finally, the result reveals that giving employees the information they need to do their jobs
(mot04) has a significant effect on employees’ satisfaction with the communication climate
with standardized loading 0.765. This is in line with previous studies that both giving
pertinent information for employees to do their jobs and keeping employees updated on their
jobs can increase an employee's level of satisfaction and performance (Downs & Hazen,
1977; McKenna, 2012; Neher, 1996). Information about jobs is considered to be a kind of
employee support and encouragement in order to get the best performance from employees
(McKenna, 2012). They help employees understand what is expected of them and help them
through the employee evaluation process of their companies.
According to the above, the five items of the communication climate construct, which are
used in this current study, are similar to the communication climate construct with the
original items of Downs-Hazen CSQ.
To summarise, a good communication climate should probably be enabled to help
employees identify themselves as a vital part of the organization, understand the brand
values, and ensure that employees deliver on the brand values. Hypotheses 1.1 and 1.2 are
supported.

228
7.5 Testing Hypothesis 2: The Influence of Relationship to Superior on Employees’
Brand Outcomes
Similarly, Table 7-5 indicates the influence of relationship to superior on employees’ brand
outcomes in each hypothesised path. The relationship to superior has a significant effect on
employees’ brand identification (β = .487, p<0.001); commitment (β = 0.510, p<0.001); and
loyalty (β = 0.537, p<0.001). This is in line with the study of McKenna (2012) that revealed
that the support of a superior influenced not only achievement of the individual’s sense of
personal worth but also enhanced their feeling of importance. The relationships with superior
were reported to have important influences on their identification (Downs & Adrian, 2012;
Elving, 2005; Gkorezis et al., 2015; Khabir, 2014; Unzicker, Clow, & Babakus, 2000); their
commitment (Breeze, Dawson, & Khazhinsky, 2002; Jablin, 1979; Khabir, 2014; Lam et al.,
2015; McKenzie, 2015; Shipton et al., 2015; Whitener, Brodt, Korsgaard, & Werner, 1998;
Yoshimura, 2003); and their loyalty (Khabir, 2014; Salleh ei al., 2013; Smith & Rupp, 2002;
Therkelsen & Fiebich, 2004; Tjosvold, 1984; van Vuuren et al., 2007; Yuan et al., 2006).
It is not surprising then that there are links between all three attitudes of employees towards
a brand and employees’ brand performance (β = .125, p<0.001 for the effect from brand
identification; β = 0.335, p<0.001 from brand commitment; β = 0.295, p<0.001 from brand
loyalty). This can be explained by the study of Rogers, Clow, & Kash (1994); effective
communication between supervisors and employees impacts not only employees’ attitudes
but also employees’ behaviours. If employees are satisfied with the relationship to the
superior, they could improve service quality and customer satisfaction. This is in line with
previous studies that empirically indicated that good relationship to superior engenders
employees’ brand performance (Johlke & Duhan, 2000; Kim, 2002).
When considering relationship to superiors’ constructs, effective communication skills are
considered as significant for superiors as the technical skills they develop for motivating
employees in the concept of internal branding. The results suggested that communicating
229
clearly by giving clear instructions (sup03) has a significant effect on employee satisfaction
with the relationship to superiors with standardized loading 0.906. This is in line with
previous studies that supervisors must have communication skills to make sure employees
obtain a complete understanding of their job and that they have sufficient information to do a
high quality performance (Downs & Hazen, 1977; Preffer & Salancik, 1978; Riel, 1995).
When employees have clear understanding of their job, they can increase productivity and
deliver brand values to the customer (McKenna, 2012; Punjaisri & Wilson, 2007).
Additionally, the results suggest that supervisor communication practices to help employees
have an important role in the organization (sup05) and have a significant effect on employee
satisfaction on the relationship to superiors with standardized loading 0.812. This can be
explained by the studies of Herzberg (1968), Herzberg (1974) and McKenna (2012); these
supervisory communication practices help employees promote positive employees’ attitudes,
such as a sense of achievement, responsibility, and recognition. Therefore, the success in
these supervisory communication practices could make employees achieve higher in their
personal and work outcomes.
Moreover, the results suggested that informal communication between supervisors and
employees (sup01) affects employee satisfaction in relationships to superiors with
standardized loading 0.754. This is in line with a number of previous studies that consider
informal communication as an enhancer of the effect of employee development by
increasing employees’ satisfaction (Downs & Hazen, 1977) and job satisfaction (Eisenberg,
2009; Kim, 2002). According to the study of McKenna (2012), it is suggested that informal
communication creates good relationships between the employees and the supervisors in a
spontaneous way, and it can be used to supplement formal communication. It means that
any kind of conflict between the employees and the supervisors can be solved through this
informal communication system. Informal communication system helps the supervisors
exchange information, ideas and recommendations with the employees in order to build
teamwork in the office.

230
Additionally, the results suggested that using humour to communicate between supervisors
and employees (sup02) affects employee satisfaction with their relationship to superiors with
standardized loading 0.728. The results resonated with a previous study that considered
using humour to communicate as an enhancer of the effect of the employee development
process by increasing employee satisfaction and commitment (Breeze et al., 2002). It can
reduce stress and increase employee satisfaction and commitment.
Finally, the results suggested that a supervisor with the capability to communicate company
policies (sup05) has a significant effect on employee satisfaction with their relationship to
superiors with standardized loading 0.683. This is in line with a previous study that policies
of the organization are important when they are clearly stated and communicated to
employees (McKenna, 2012). As they provide a basis for making decisions and taking the
various courses of action required to achieve the objectives, policy is translated into plans,
rules, and procedures, and pervades all levels and activities within the organization
(McKenna, 2012). The immediate supervisor is considered to be the most logical choice of
candidate for the role of communicator of company policies and plays a part in building
employees’ commitment, identification and performance (McKenna, 2012). Therefore,
training in companies’ policies is a significant tool for the supervisory team to ensure each
supervisor can effectively answer employees’ questions about company policies (McKenna,
2012). A past study (McKenna, 2012) found that when employees understand the
organizational goals (through superior communication), it leads to decreased conflict
between the personal goals and organizational goals and increases employees’ productivity.
It means that when personal goals and organizational goals are congruent, employees are
satisfied with their personal goals while achieving organizational goals. With the concept of
internal branding, organizational goals are employees delivering on the brand promise.
According to the above, this current study developed the five items of the relationship with
supervisor construct with a different content from the original items of Downs-Hazen CSQ.
For example, informal communication, and instructions clearly explain and allow superiors to

231
perform their role more effectively and have an impact on employee satisfaction in the
success of internal branding. Additionally, this current research is the first to show the role of
using humour to communicate with superiors to improve employees’ brand outcomes in the
concept of internal branding.
To summarise, Hypotheses 2.1 and 2.2 are supported.
7.6 Testing Hypothesis 3: The Influence of Organizational Integration on Employees’
Brand Outcomes
Employees’ satisfaction with information individuals receive about the organization and their
immediate job environment were also found to be associated with all three employees’ brand
attitudes (β = 1.144, p<0.001 for the effect on brand identification; β = 1.295, p<0.001 on
brand commitment; β = 1.209, p<0.001 on brand loyalty). This is in line with a number of
previous studies that show that an appropriate level of employees’ perceptions of information
in their immediate work environment helps to improve employees’ brand attitudes because
they can obtain and correctly use the most appropriate information and integrate with the set
of organizational values (Byrne & LeMay, 2006; Clampitt & Downs, 1993; Downs & Hazen,
1977). Additionally, according to the study of Ebren (2006), it was found that organizational
integration helps employees feel like a valuable part of the company and the meaningfulness
of the task is enhanced. In short, satisfaction with organizational integration improves
employee identification (Henkel, Tomczak, Heitmann, & Herrmann, 2007; Kumar & Pansari,
2014); commitment (DeCotiis & Summers, 1987; Guest & Conway, 2002; King & Grace,
2010; Kumar & Pansari, 2014; Ridder, 2004; Thomson & Hecker, 2001); and loyalty
(Clampitt & Downs, 1993; Kumar & Pansari , 2014; Murthy & Guthrie, 2013).
Furthermore, the results suggest that the effect that satisfaction with organizational
integration has on employees’ brand identification (β = .054, p<.001), commitment (β = .289,
p<.001), and loyalty (β = .437, p<.001) affects the performance outcomes. Past studies have
reported that an appropriate level of employees’ perceptions of information in their

232
immediate work environment enhances employees’ brand performance (Baker et al., 2014;
Ebren, 2006; Kumar & Pansari, 2014; Pincus, 1986). It suggests that employees who are not
pleased with their perception of information in their immediate work environment need to be
influenced more by internal communication. Both information in their immediate work
environment and organizational objectives need to be more frequently reinforced to them. As
a result, employees with high satisfaction with organizational integration feel like a valuable
part of the organization and confident that they are delivering on the brand promise.
When considering organizational integration constructs, the results suggested that
communicating critical issues in the organization with employees first (inf03) has a significant
effect on employees’ satisfaction with organizational integration. It means that employees
want to know about the hotel’s issues about how their work and their team will be affected by
a change from the person they report to first. This is in line with past studies (Clampitt &
Downs, 1993; Downs & Hazen, 1977) that revealed that his/ her immediate manager is a key
conduit of information about the organization, which makes employees feel they have been
integrated. Therefore, an organization’s development of both the process for planned
change and improvement of organization need to provide talking points and pertinent
information, whilst the key consideration of this communication is that this information should
ultimately be delivered to employees by their immediate supervisor.
Additionally, the results suggested that the information about the progress of individual
employees (inf01) has great significance for employee satisfaction with standardized loading
0.820. Indeed, the results resonated with a previous study that considered information about
employees’ progress in their job as an enhancer of the effect of the employee development
process by increasing employee satisfaction and loyalty (Downs & Hazen, 1977; McKenna,
2012). Good information about employees’ progress can engender a sense of achievement,
accomplishment, and recognition (McKenna, 2012). According to the study of Latham and
Locke (1979), information about employees’ progress in their job can produce improved and

233
more creative effort in employees because it is able to help employees monitor their
progress.
Moreover, it suggests that keeping employees’ satisf ied with information received about
personnel news (e.g. arrival of a new colleague, annual show, or important meeting) (inf02)
can influence employees’ satisfaction on organizational integration with standardized loading
0.869. This can be explained by the study of McKenna (2012); when employees suffered
from information overload, it impacts not only employee attitudes but it can also block the
transmission of ideas. In order to prevent this problem and help employees retain and
understand the information they have acquired, organizations should endeavour not to
undermine the employee’s reliability by providing too much information or providing
information that cannot conveniently, easily, and accurately be used (McKenna, 2012).
Making use of personnel news as gatekeepers in the communication network is considered
to be a powerful tool to help employees manage their information overload.
When comparing the organizational integration items of the original Downs-Hazen CSQ with
the used items of organization integration in this current study, information about employees’
progress in their jobs and personnel news items are similar to the original items. However,
communicating critical issue of the organization with employees first is a new item, which is
used with the organizational integration construct in this current study.
To summarise, Hypotheses 3.1 and 3.2 are supported.
7.7 Testing Hypothesis 4: The Influence of Media Quality on Employees’ Brand
Outcomes
Media quality is considered as the media for employee communication. The results reveal
that media quality has a significant effect on employees’ brand identification (β = 1.456,
p<.001), commitment (β = 1.561, p<.001), and loyalty (β = 1.477, p<.001), lending support to
Hypothesis 4.1. Brand identification is the attitude that is least influenced by media quality. In
addition, the analysis also revealed that the three brand attitudes of the employees play a
234
meditational role in the relationship between media quality and employees’ brand
performance (β = 0.123, p<0.001 for the effect from brand identification; β = 0.236, p<0.001
from brand commitment; β = 0.443, p<0.001 from brand loyalty), lending support to
Hypothesis 4.2. This is in line with previous studies that employees who are satisfied with
effective media internal communication have positive attitudes about organizational values
and effects on their performance (Baker et al., 2014; Downs & Hazen, 1977; Punjaisri &
Wilson, 2007; Omilion-Hodges & Baker, 2014; Sharma & Kamalanabhan, 2012).
When considering media quality constructs, the results suggested that the application of new
technology to the communication of information via e-mail (inf04) has significant effects on
employees’ brand attitudes with standardized loading 0.816. Past studies have shown that
email is becoming increasingly the main way to communicate with colleagues and that the
outcome of using email helps businesses meet with the dissemination of new ideas and
practices, and in the process the organization will become a knowledge-based learning
organization, influencing employee identification and commitment (Asif & Sargeant, 2000;
De Bussy, Ewing, & Pitt, 2003; Henkel et al., 2007; McKenna, 2000).
Moreover, effective email communication within the hotels (inf05) was also found to affect all
employees’ brand attitudes with standardized loading 0.758. Employees who are more
satisfied with effective email communication in the workplace contribute to the success of the
organizational goals, as suggested by McKenna (2012). Effective information and
communication technology can help to minimise problems and difficulties, such as
information overload and loss of records in the paperless office. The application of new
technology in communication of information by using email is new items of media quality
constructs in this current study, which are different from original items of Downs-Hazen
CSQ. It means that this current study found that using email for internal communication will
improve employees’ brand attitudes. This can be explained by the studies of Luke (2009)
and McKenna (2012), which found that email communication is a very flexible way to
communicate using new technology. According to the study of McKenna (2012), it was

235
suggested that email communication creates an organizational culture that facilitates
teamwork and team spirit, which has significantly better employee performance. Email
facilitates teamwork for when team members receive messages at the same time it makes
instant communication possible (McKenna, 2012).
Employee meetings (inf06) were also found to be an item of media quality constructs that
include both original items of Downs-Hazen CSQ and using items in this current study. Past
studies have shown that employee meetings are considered to be oral and written
communication in that if the meeting were well-organized, it might attempt to create positive
employee attitudes (Clampitt & Downs, 1993; Downs & Hazen, 1977; McKenna, 2012).
Employee meetings use both oral communication and face-to-face in a small group, which
are considered to be the richest mediums on the communication channel continuum. It is
most suitable for non-routine messages, whereas routine messages use the poorest media:
flyers, bulletins or general reports (Bratton, Forshaw, Callinan, Sawchuk, & Corbett, 2010).
Additionally, employee meetings usually consist of both the spoken and the written word.
Written communication is used as a back-up of the spoken word and it can provide more
information to the receiver and provide an opportunity to observe feedback from the receiver
(McKenna, 2012).
According to the above, the employee meetings item of media quality in this current study is
similar to the original item of Downs-Hazen CSQ. However, the application of new
technology to the communication of information via e-mail and effective email
communication within the organization are new items of media quality construct. This current
study found that media quality constructs in the concept of internal branding consists of both
new technology and oral and written communication that can influence an employee's
attitudes and help with the dissemination of new ideas and practice, and in the process
organizations will become knowledge-based learning organizations, which creates a
collaborative learning environment and impacts on employees’ brand performance.

236
To summarise, Hypotheses 4.1 and 4.2 are supported.
7.8 Testing Hypothesis 5: The Influence of Horizontal Communication on Employees’
Brand Outcomes
The influence of horizontal communication, known as the grapevine, is formed and
maintained by social relationships (Bratton et al., 2010; Downs & Adrian, 2012). The results
reveal that Horizontal Communication has a significant effect on employees’ brand
identification (β = 1.208, p<0.001), commitment (β = 1.110, p<0.001), and loyalty (β = 1.155,
p<0.001), lending support to Hypothesis 5.1. In addition, the analysis also revealed that all
three brand attitudes play a meditational role in the relationship between Horizontal
Communication and employees’ brand performance (β = 0.050, p<0.001 for the effect from
brand identification; β = 0.306, p<0.001 from brand commitment; β = 0.431, p<0.001 from
brand loyalty), lending support to Hypothesis 5.2.
When considering horizontal communication constructs, the results suggested that both
offering support to a colleague (cow3) and good atmosphere between colleagues (cow1) can
help employees to develop positive brand attitudes with standardized loading 0.878 and
0.776. This is in line with the study of McKenna (2012) that revealed good relationships
between people that arises in a spontaneous way, and one that can be used to supplement
formal communication channels. The studies of McKenna (2012) and Zaremba (1988)
suggests that successful companies know that good communication with colleagues is
essential to their success because it is an important way to influence employees’ brand
attitudes and performance. Good communication with colleagues provides groups with a
feeling of security and belonging (employees’ identification), which in turn fosters satisfaction
and group stability (Chan & Mak, 2014; Gkorezis et al., 2015; Guerber et al., 2014; Lin et al.,
2013; McKenna, 2000; Zaremba, 1988). Good communication with colleagues can raise
employees’ commitment when it transmits positive information about the organization
(McKenna, 2000; Zaremba, 1988). Good communication with colleagues enables an
237
employee to relieve frustration and stress in situations where anger cannot be realistically
directed at an authority figure and it significantly affects employees’ loyalty (McKenna, 2012).
Additionally, the results suggested that sharing a personal problem with colleagues (cow2)
affects employees’ brand attitudes with standardized loading 0.836. Indeed, the results
resonated with the study of Robbins & Hunsaker (2005), that considered the development of
listening skills of employees as an enhancing effect of the employee development process
by developing employees’ positive attitudes and performance. The active listening is
important in the context of interpersonal perceptions (McKenna, 2012). According to the
study of Robbins & Hunsaker (2005), it was found that, employees’ patterns of behaviour in
listening to colleagues links to employees’ perceptions. For example, showing an interest in
what has been said including an appropriate facial expression together with eye contact can
reduce negative emotion in the employees and leads to attraction and cohesiveness to sub-
units in the organization (Meyer, 1997; Levine & Moreland, 1990; McKenna, 2012). This item
is the new item of Horizontal Communication constructs that is used in this current study and
has not been used in the original Downs-Hazen CSQ items.
According to the above, the three items of horizontal communication constructs in this
current study are new items, which are different from the construct with original items of
Downs-Hazen CSQ. However, horizontal communication can be used to supplement formal
communication channels in order to help employees achieve brand attitudes and
performance. To summarise, Hypotheses 5.1 and 5.2 are supported.
7.9 Testing Hypothesis 6: The Influence of Organizational Perspective on Employees’
Brand Outcomes
In particular, the results suggested that organizational perspective affect all three attitudes of
employees towards brand (β = 0.507, p<0.001 for the effect on brand identification; β =
0.562, p<0.001 on brand commitment; β = 0.532, p<0.001 on brand loyalty) is heightened
when employees are satisfied with the broadest kind of information about their company as a

238
whole lending support to Hypothesis 6.1. This is in line with a number of previous studies
that show all the category information for organizational perspective, which includes changes
in the company, information about the company’s financial standing, and its overall policies
and goals as influencing employees’ satisfaction (Clampitt & Downs, 1993; Downs & Hazen,
1977; Meintjes & Steyn, 2006). Additionally, satisfaction with organizational perspective
improves employee identification (Edwards & Edwards, 2012; Hilton & Sherman, 2015;
Jeavons, 1994; Rho et al., 2015), commitment (Diamond, 1992; Foote, Seipel, Johnson, &
Duffy, 2005; Foreman, 1997; McDonald, 1996; Thomson & Hecker, 2001), and loyalty
(Ridder, 2004).
Moreover, employees’ brand performance is the extent of employees’ brand attitudes (β =
0.223, p<0.001 for the effect from brand identification; β = 0.197, p<0.001 from brand
commitment; β = 0.274, p<0.001 from brand loyalty) lending support to Hypothesis 6.2. It
means that all three attitudes of employees towards a brand play a meditational role in the
relationship between organizational perspective and employees’ brand performance. Past
studies have reported that organizational perspective enhances employees’ brand
performance (Bart, Bontis, & Taggar, 2001; Jeavons, 1994; Juriova & Durkova, 2012;
Mullane, 2002; Rho et al., 2015).
When considering organizational perspective constructs, the results indicated that the item
of organizational perspective used in this current study of providing information to help
employees manage organizational change (inf09) has a significant impact on employee
satisfaction about organizational perspective with standardized loading 0.865. A past study
reported that organizational change such as restructuring, restrategizing, or re-engineering
enhances employees’ performance (McKenna, 2012). They can influence employee
resistance to organizational change; therefore, organizations need to develop organizational
change communication strategies. Communicating organizational change is considered as a
way of controlling and overcoming employee resistance to change because the source of
resistance lies in misinformation or poor communication (Kotter, 2008). Therefore, effective

239
communication brings successful organizational change, as misunderstandings will
disappear and resistance becomes less of a problem and increases employees’ positive
attitudes and performance, which were also reflected in the results (McKenna, 2012).
Moreover, the results revealed that communication of non-task-related information, which
includes information about organizational policies and goals (inf07), government policies and
regulations affecting organizations (inf08), and organization's financial situation (inf10), has a
significant effect on employee satisfaction regarding organizational perspectives with
standardized loading 0.715, 0.796, and 0.704. This can be explained by the studies of
McKenna (2012) and Ridder (2004) where communication of non-task-related information is
a powerful motivational device in the sense that it can help employees work towards meeting
organizational goals. Communication of organizational policies and goals will improve
employee identification and influence employees to work towards the accomplishment of
organizational goals because it helps employees understand how or why their jobs support
the policies and goals of the company (Bart et al., 2001; Jeavons, 1994; Mullane, 2002).
Finally, the results revealed that communicating information about accomplishments and/ or
failures of organizations (inf11) has a significant effect on employee satisfaction about
organizational perspectives with standardized loading 0.630. Communication of this
information is considered to be learning from success and failure of business, which is one
of the most important capacities for employees to develop employees’ performance (Gino &
Pisano, 2011). Learning from success of business can present even greater challenges, and
learning from failure is one of the most important capacities for employees to develop
employees’ performance (Gino & Pisano, 2011).
According to the above, the four items of organization perspective constructs in this current
study, including communicating organisational policies and goals, government policies and
regulations, the organization's financial position, and organizational change to employees,
are similar to the original items of Downs-Hazen CSQ. However, communicating information

240
about accomplishments and/ or failures of organizations is a new item of organization
perspective construct in the concept of internal branding. To summarise, Hypotheses 6.1
and 6.2 are supported.
7.10 Testing Hypothesis 7: The Influence of Personal Feedback on Employees’ Brand
Outcomes
When employees are satisfied with personal feedback, they have a more positive attitude
and better performance (Downs & Hazen, 1977). The result reveals that satisfaction with
personal feedback has a significant effect on employees’ brand identification (β = 0.897,
p<0.001), commitment (β = 0.903, p<0.001), and loyalty (β = 0.876, p<0.001) lending
support to Hypothesis 7.1. In addition, the analysis also revealed that the three brand
attitudes of employees play a meditational role in the relationship between personal
feedback and employees’ brand performance (β = 0.050, p<0.001 for the effect from brand
identification; β = 0.244, p<0.001 from brand commitment; β = 0.453, p<0.001 from brand
loyalty) lending support to Hypothesis 7.2. This is in line with previous studies that
empirically indicate that giving positive feedback to employees can make them develop their
employee identification, and hence improve employee performance (Ibarra, 1999; Swann,
1987). Therefore, employees can create and deliver brand value to meet the needs of a
customer.
When considering personal feedback constructs, the results indicated that communicating
information about how employees are being judged (per02) and employee recognition efforts
(per03) are capable of inducing employees’ satisfaction on personal feedback with
standardized loading 0.832 and 0.764. This is in line with previous studies that show that the
performance review procedure to all employees engenders employees’ performance
(Armstrong & Taylor, 2014; McKenna, 2012). Explaining the employee performance review
procedure to all employees is considered an important part of the reward system in an
organization in order to attract, retain, and motivate people in the desired direction

241
(McKenna, 2012). Moreover, recognition of employees’ efforts influences employees'
positive attitudes and behaviour because it helps employees feel that leaders recognize the
importance of their contribution to the organization (Moorehead & Griffin, 2010).
This current study purported that communicating information about an employee's
performance as compared with others (per01) is capable of inducing employees’ satisfaction
on personal feedback with standardized loading 0.734. This can be explained by the study of
McKenna (2012) where communicating each employee's performance in comparison with
others can promote teamwork, which is the backbone of a company. Using this
communication can be a review of employees with emphasis on contribution to the team's
overall success, increased ability to the accomplishment of the team's goals, and success of
fitting into the team (McKenna, 2012).
Additionally, the results show that if an employee has a problem, the supervisor should know
how to act. It is important to let employees know that supervisors understand the employees’
problems (per05) because it has a significant effect on employees’ satisfaction with personal
feedback with standardized loading 0.606. The results are also in line with past research that
suggested that the provision of feedback from the supervisor is significant with employees’
attitudes and behaviours (McKenna, 2012). The provision of positive feedback is a function
that allows supervisors to show support for the employees’ problems and to communicate an
understanding of both content and employees' feelings. According to the study of McKenna
(2012), it is suggested that supervisors are continually faced with providing both positive and
negative feedback on various aspects of subordinates’ performance. The provision of
positive feedback is a function that the supervisor could warmly embrace in order to support
employees’ relative contribution to the effectiveness of the company.
Finally, the results revealed that communication of the employees’ problem resolution
techniques (per04) has a significant effect on employees’ satisfaction with personal feedback
with standardized loading 0.570. The result is also in line with a past study that collaborative

242
problem solving requires transparent communication where stakeholders’ concerns and
different ideas and points of view are freely expressed (McKenna, 2012). It means that
effective communication is considered to be a key tool for decreasing misunderstanding and
reducing workplace stress. According to the study of Fedor, Caldwell, and Herold (2006), it is
suggested that improving the process of employees’ problem-solving can help employees to
feel better about their problems.
According to the above, all five items of the personal feedback construct used in this current
study are similar to all five items of the original items of Downs-Hazen CSQ. To summarise,
Hypotheses 7.1 and 7.2 are supported.
Part II (Section 7.11 – 7.13)
Objective 2 was examined through the survey findings by determining the nomological
network of internal branding. This current study used two step processes. First of all, it
evaluated a second order factor model of internal communication satisfaction and
employees’ brand attitudes (Section 7.11-7.14). Second of all, hypotheses 8, 9 and 10 were
tested through the results of the survey, by testing the Structural Equation Model in Part III.
7.11 The development of a second-order model for internal communication
satisfaction (ICS) and for employees’ brand attitudes (EBA)
According to the internal communication satisfaction literature (Chapter 2, Section 2.9),
internal communication satisfaction is the main construct, which consists of seven constructs
(Communication Climate (CC), Relationship to Supervisors (RS), Organizational Integration
(OI), Media Quality (MQ), Horizontal Communication (HC), Organizational Perspective (OP),
Personal Feedback (PF)). Additionally, employees’ brand attitudes are also a main
construct, which consists of three constructs (Employees’ brand identification (EI),
Employees’ brand commitment (EC), and Employees’ brand loyalty (EL)). Therefore, both
the seven constructs of internal communication satisfaction (ICS) and the three constructs of
243
employees’ brand attitudes (EBA) were considered as sub-constructs and each sub-
construct is measured using a certain number of items.
Additionally, according to the studies of Comer & Kendall (2013) and Markon (2010), it is
suggested that a second order factor was fairly narrow in scope. A second order factor
bordered the first-order factor and included the internalizing and externalizing dimensions.
The figure 7-15, 7-16, 7-17, and 7-18 show two alternative path models developed for
selecting the most suitable internal communication satisfaction model and employees’ brand
attitudes model to determine the nomological network of internal branding. The first-order
model proposed in the study is reproduced in figures 7-16 and 7-17 and the second-order
model is reproduced in the figures 7-17 and 7-18 below.

244
Figure 7-15: First order model of internal communication satisfaction

245
Figure 7-16: First order model of Employees’ Brand Attitudes

246
Figure 7-17: Second order structure of internal communication satisfaction

247
Figure 7-18: Second order structure of Employees’ Brand Attitudes

248
7.12 A Comparison of Results of the first-order model and the second-order model of
internal communication satisfaction
As per the Table 7-6 below, considering the fit indices between the first-order model and the
second-order model, results suggest that the second-order model is the most suitable.
Table 7.6: Internal Communication Satisfaction Attributes: Fit indices of the first-order
and the second-order model
Fit Indices The first-order
model (A)
The second-
order model (B)
Model
Selected
DF 235 211
CMIN 263.955 229.923
CMIN/DF 1.123 1.090 B
P .094 .177 B
RMSEA .008 .007 B
GFI (Goodness of Fit Index) 0.990 0.991 B
NFI 0.991 0.992 B
CFI 0.999 0.999 A, B
NNFI (TLI) 0.998 0.999 B
SRMR .0145 .0141 B
7.13 Assessing the second-order model for internal communication satisfaction
attributes
A higher-order model was developed with seven dimensions that contribute to the internal
communication satisfaction construct. The figure 7-19 gives statistical estimations of the
second-order model for internal communication satisfaction attributes.

249
Figure 7-19: Second-order Factor Model for Internal Communication Satisfaction
Attributes

250
The results suggested that the construct of internal communication satisfaction can be
expressed by seven domains, Communication Climate (CC), Relationship to Supervisors
(RS), Organizational Integration (OI), Media Quality (MQ), Horizontal Communication (HC),
Organizational Perspective (OP), and Personal Feedback (PF). In other words, these seven
domains parsimoniously explain the concept of internal communication satisfaction. These
seven constructs of internal communication satisfaction are discussed below.
Communication climate
Communication climate refers to a psychological atmosphere in an organization that is
warm, tolerant, and participative. Satisfaction with communication climate is directly related
to a higher quality of work life, innovative and organizational development (Clampitt &
Downs, 1993; Downs & Hazen, 1977; Meintjes & Steyn, 2006). The result reveals that a
communication climate features: communication that motivates employees to work with
others to achieve a goal, an individual's ability to communicate within an organization,
helping employees to feel valued, frequent communication and handling conflict in the
workplace. The findings revealed that an effective communication climate will reflect on both
the organizational and personal levels. It means that the communication climate can help
improve employee motivation and stimulation of employees to increase commitment and
engagement in company goals and norms.
Relationship to Supervisors
Satisfaction with the relationship with supervisor measures satisfaction with upward and
downward communication with the respondents’ supervisors (Downs & Hazen, 1977;
Grunig, Grunig, Sriramesh, Huang, & Lyra, 1995; Meintjes & Steyn, 2006; Riel, 1995). The
results show that supervisory communication includes using informal communication,
supervisors’ sense of humour, giving clear instructions, giving reasons for doing the job, and
giving reasons for decisions about company policies. Additionally, supervisors should inform
251
all employees of what is happening in other parts of the organization and explain what their
responsibilities are, and how they can meet them.
Organizational Integration
Organizational integration involves the extent to which employees receive information about
the immediate work environment (Clampitt & Downs, 1993; Downs & Hazen, 1977; Meintjes
& Steyn, 2006; Riel, 1995). The results reveal that this includes the degree of satisfaction
with information about employee promotions in the organization, personnel news, and
getting critical information first hand. Additionally, these findings revealed that personal news
includes arrival of a new colleague, annual shows, and important meetings.
Media Quality
Media quality focuses on the extent to which meetings are well organized, written directives
are short and clear, and the degree to which the communication is about right (Downs &
Hazen, 1977; Hamilton, 1987; Meintjes & Steyn, 2006; Riel, 1995). The results of this current
study found that media quality deals with general satisfaction that the meetings are well
organised, the application of e-mail to the communication of information, and the
effectiveness of the email system.
Horizontal Communication
Horizontal Communication relates to satisfaction with co-worker communication or horizontal
communication relationships in the company (Clampitt & Downs, 1993; Downs & Hazen,
1977; Meintjes & Steyn, 2006; Riel, 1995). The results reveal that satisfaction with horizontal
communication deals with a good atmosphere between colleagues, feeling free to consult
personal matters with co-workers, and support from colleagues.

252
Organizational Perspective
Organizational Perspective deals with information about the organization as a whole
(Clampitt & Downs, 1993; Downs & Hazen, 1977; Meintjes & Steyn, 2006; Riel, 1995). The
results of this current study reveal that satisfaction with organizational perspective includes
notification about organizational policies and goals, the impact of government policy and
regulation on organization performance, information about the corporation’s financial
standing, as well as the lessons of success and failure existing in the organization.
Personal Feedback
Personal Feedback concerns what employees need to know about how they are judged and
how their performance is appraised (Clampitt & Downs, 1993; Downs & Hazen, 1977;
Meintjes & Steyn, 2006; Riel, 1995). The results of this current study reveal that satisfaction
with personal feedback includes information about employee performance relative to other
employees' performance, judging employees by their work performance, employee
recognition efforts, showing the progression of handling employees’ problems, and working
with problem employees.
In summary, this current study found that internal communication satisfaction is seen as a
multidimensional concept. This is in line with previous studies that internal communication
satisfaction was considered as a multidimensional concept (Clampitt & Downs, 1993; Downs
& Hazen, 1977; Meintjes & Steyn, 2006).
253
7.14 A Comparison of Results of the first-order model and the second-order model of
employees’ brand attitudes
In order to operationalise the concept of Employees’ Brand Attitudes, extant studies related
to employees’ attitudes in internal branding, organizational behaviour and marketing were
investigated. The majority of studies have investigated employees’ brand identification,
commitment, and loyalty associated with Employees’ Brand Attitudes (Asif & Sargeant,
2000; Backhaus & Tikoo, 2004; Papasolomou & Vrontis, 2006; Punjaisri, Evanschitzky, &
Wilson, 2009; Sharma & Kamalanabhan, 2012; Steers, 1977). Therefore, it is determined
that the construct of Employees’ Brand Attitudes is essentially manifested through the three
brand attitudes of employees in comparison to the Employees’ Brand Attitudes.
As discussed in Chapter 2, three factors were identified in manifesting Employees’ Brand
Attitudes: Employees’ Brand Identification, Employees’ Brand Commitment, and Employees’
Brand Loyalty. Therefore, a second-order model will be examined here.
As per the Table 7-7 below, by considering the fit indices between the first-order model and
the second-order model, results suggest that the second-order model is the most suitable.

254
Table 7.7: Employees’ Brand Attitudes Attributes: Fit indices of the first-order and the
second-order model
Fit Indices The first-order
model (A)
The second-
order model (B)
Model
Selected
DF 49 50
CMIN 52.222 52.922
CMIN/DF 1.066 1.058 B
P 0.350 0.362 B
RMSEA .006 .006 A, B
GFI (Goodness of Fit Index) 0.996 0.996 A, B
NFI 0.997 0.997 A, B
CFI 1.000 1.000 A, B
NNFI (TLI) 1.000 1.000 A, B
SRMR .0080 .0081 A
7.15 Assessing the second-order model for employees’ brand attitudes attributes
A higher-order model was developed with three dimensions that contribute to the employees’
brand attitudes construct. The figure 7-20 gives statistical estimations of the second-order
model for employees’ brand attitudes attributes.

255
Figure 7-20: Second-order Factor Model for Employees’ Brand Attitudes Attributes
The results reveal that the construct of employees’ brand attitudes can be expressed by
three domains: Employees’ Brand Identification (EI), Employees’ Brand Commitment (EC),
and Employees’ Brand Loyalty (EL). In other words, these three domains parsimoniously
explain the concept of employees’ brand attitudes.
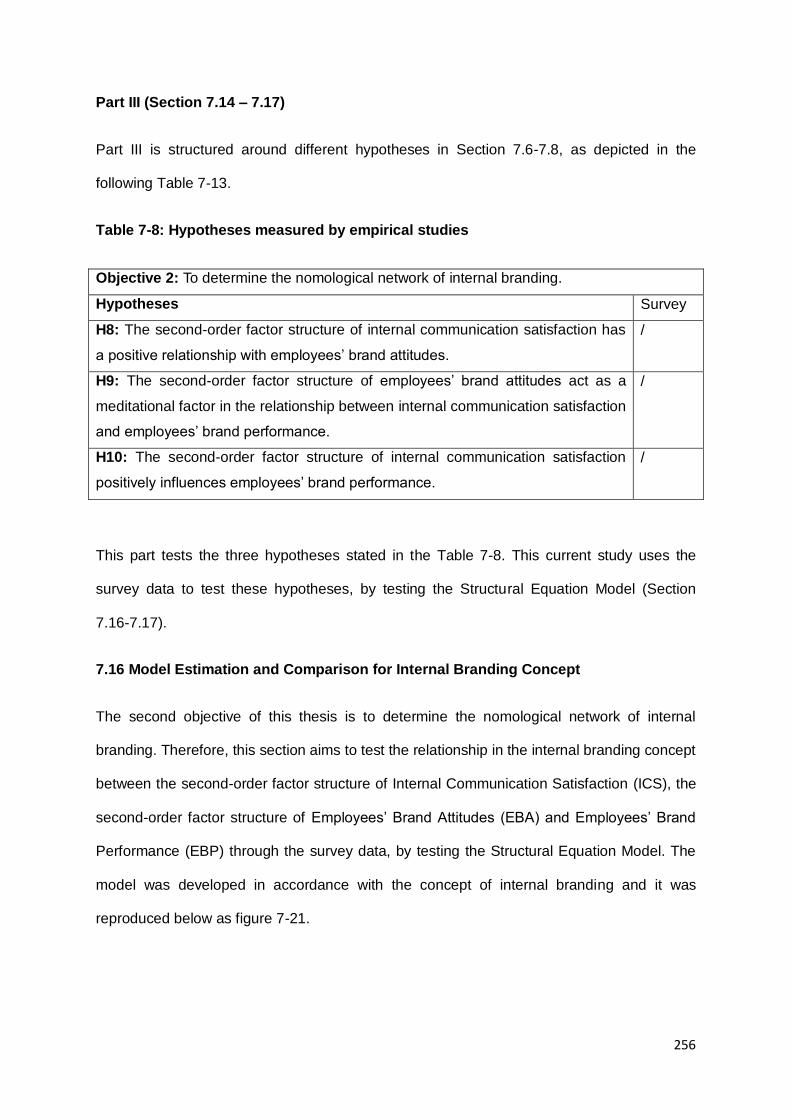
256
Part III (Section 7.14 – 7.17)
Part III is structured around different hypotheses in Section 7.6-7.8, as depicted in the
following Table 7-13.
Table 7-8: Hypotheses measured by empirical studies
Objective 2: To determine the nomological network of internal branding.
Hypotheses Survey
H8: The second-order factor structure of internal communication satisfaction has
a positive relationship with employees’ brand attitudes.
/
H9: The second-order factor structure of employees’ brand attitudes act as a
meditational factor in the relationship between internal communication satisfaction
and employees’ brand performance.
/
H10: The second-order factor structure of internal communication satisfaction
positively influences employees’ brand performance.
/
This part tests the three hypotheses stated in the Table 7-8. This current study uses the
survey data to test these hypotheses, by testing the Structural Equation Model (Section
7.16-7.17).
7.16 Model Estimation and Comparison for Internal Branding Concept
The second objective of this thesis is to determine the nomological network of internal
branding. Therefore, this section aims to test the relationship in the internal branding concept
between the second-order factor structure of Internal Communication Satisfaction (ICS), the
second-order factor structure of Employees’ Brand Attitudes (EBA) and Employees’ Brand
Performance (EBP) through the survey data, by testing the Structural Equation Model. The
model was developed in accordance with the concept of internal branding and it was
reproduced below as figure 7-21.
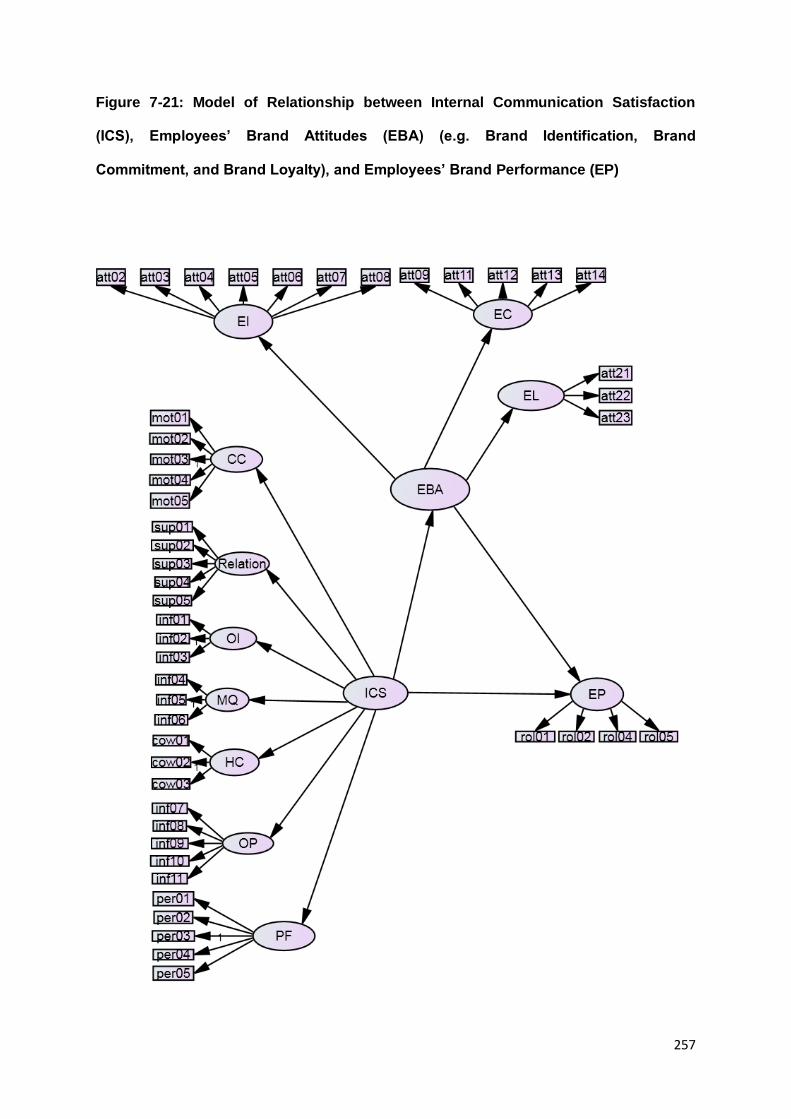
257
Figure 7-21: Model of Relationship between Internal Communication Satisfaction
(ICS), Employees’ Brand Attitudes (EBA) (e.g. Brand Identification, Brand
Commitment, and Brand Loyalty), and Employees’ Brand Performance (EP)
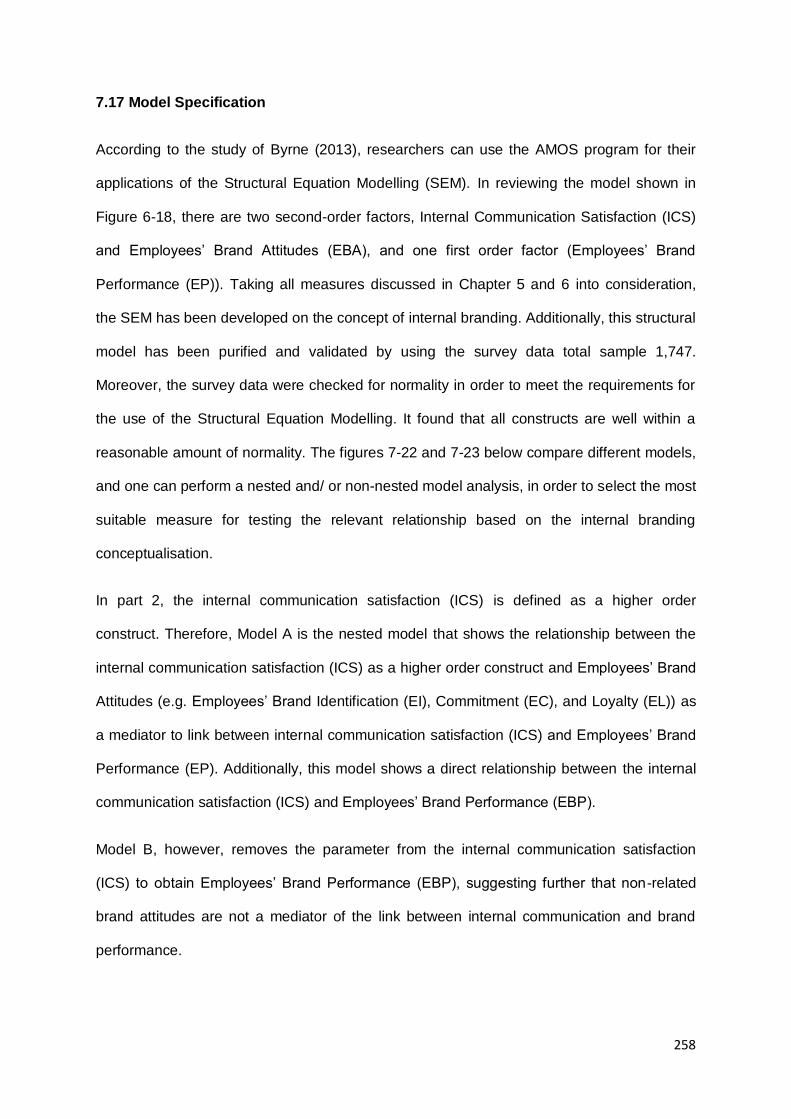
258
7.17 Model Specification
According to the study of Byrne (2013), researchers can use the AMOS program for their
applications of the Structural Equation Modelling (SEM). In reviewing the model shown in
Figure 6-18, there are two second-order factors, Internal Communication Satisfaction (ICS)
and Employees’ Brand Attitudes (EBA), and one first order factor (Employees’ Brand
Performance (EP)). Taking all measures discussed in Chapter 5 and 6 into consideration,
the SEM has been developed on the concept of internal branding. Additionally, this structural
model has been purified and validated by using the survey data total sample 1,747.
Moreover, the survey data were checked for normality in order to meet the requirements for
the use of the Structural Equation Modelling. It found that all constructs are well within a
reasonable amount of normality. The figures 7-22 and 7-23 below compare different models,
and one can perform a nested and/ or non-nested model analysis, in order to select the most
suitable measure for testing the relevant relationship based on the internal branding
conceptualisation.
In part 2, the internal communication satisfaction (ICS) is defined as a higher order
construct. Therefore, Model A is the nested model that shows the relationship between the
internal communication satisfaction (ICS) as a higher order construct and Employees’ Brand
Attitudes (e.g. Employees’ Brand Identification (EI), Commitment (EC), and Loyalty (EL)) as
a mediator to link between internal communication satisfaction (ICS) and Employees’ Brand
Performance (EP). Additionally, this model shows a direct relationship between the internal
communication satisfaction (ICS) and Employees’ Brand Performance (EBP).
Model B, however, removes the parameter from the internal communication satisfaction
(ICS) to obtain Employees’ Brand Performance (EBP), suggesting further that non-related
brand attitudes are not a mediator of the link between internal communication and brand
performance.

259
Figure 7-22: Alternative path models: Model A
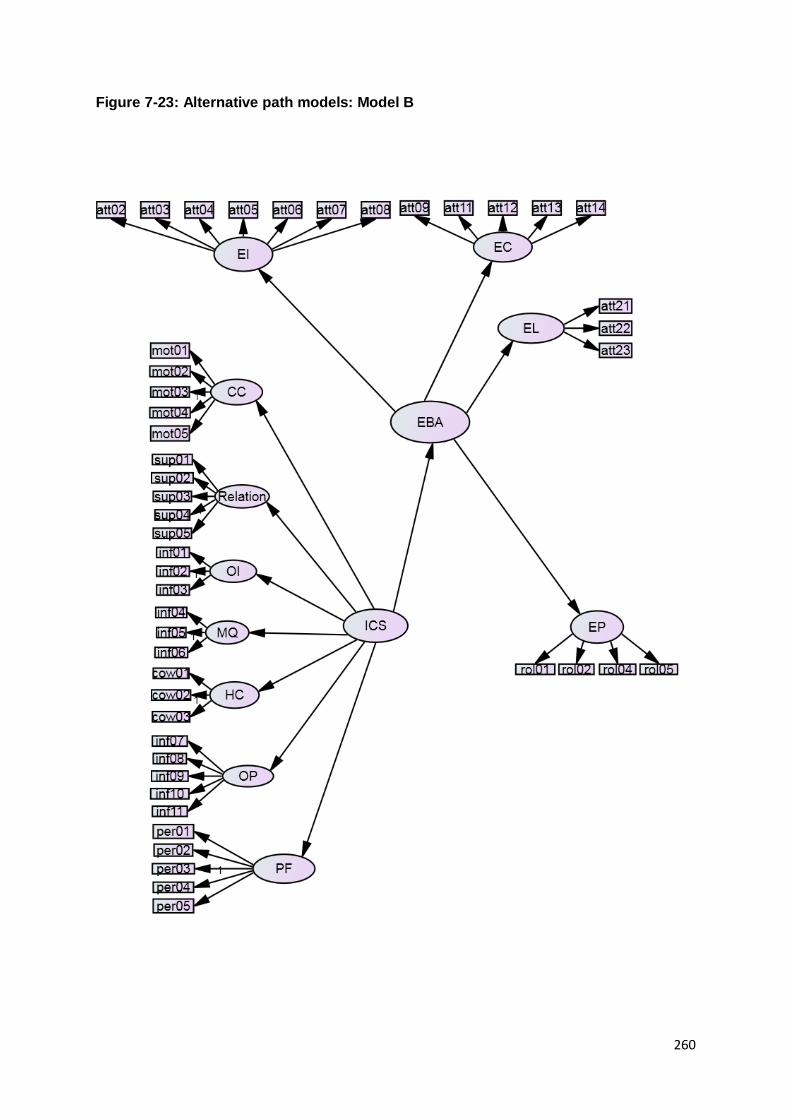
260
Figure 7-23: Alternative path models: Model B

261
7.18 Results Comparison
The results of fit indices of different models were evaluated and demonstrated by Table 7.9.
Table 7-9: Fit statistics of models – A and B
Fit Indices Model A Model B Model
Selected
DF 787 801
CMIN 826.871 863.870
CMIN/DF 1.051 1.078 A
P .157 .061 A
RMSEA .005 .007 A
GFI (Goodness of Fit Index) .980 .980 A, B
NFI .984 .984 A, B
CFI .999 .999 A, B
NNFI (TLI) .999 .998 A
SRMR .0188 .0203 A
According to the study of Anderson and Gerbing (1988), the lower the values of CMIN/DF
and RMSEA, the better the model fits with the observed data. This supports the goodness-
of-fit indexes (GFI, NFI, CFI, and TLI); these values of Model A are higher than Model B
values, thus being indicative of a better fit to the data. Moreover, the values of SRMR of
Model A are the lowest. This then suggests that Model A is superior to the other models in
terms of an overall model fit.
Model A results, as shown in the table above, can also be used to assess the main effects of
internal communication satisfaction and employees’ brand outcome models. The goodness-
of-fit indexes revealed that the model fits the data reasonably well: the CMIN/DF values of
262
1.051 indicate a satisfactory level, as it is below the recommended 3.0 (Bollen, 1989). Other
representative indexes also suggest that the results of structural model analysis are a good
fit for the proposed data: GFI is 0.98, NFI is 0.984, CFI is 0.999, TLI is 0.999, RMSEA is
0.005, and SRMR is 0.0188.
7.19 Hypotheses Testing
As discussed through the Figure 7-23 and the Table 7-9, the SEM based on Model A was
used to test the relationship. The following Figure 7-24 and Table 7-10 give statistical
estimations of the path model relevant for testing all hypotheses.

263
Figure 7-24: Relationships between Internal Communication Satisfaction (ICS),
Employees’ Brand Attitudes (EBA) and Employees’ Brand Performance (EP)
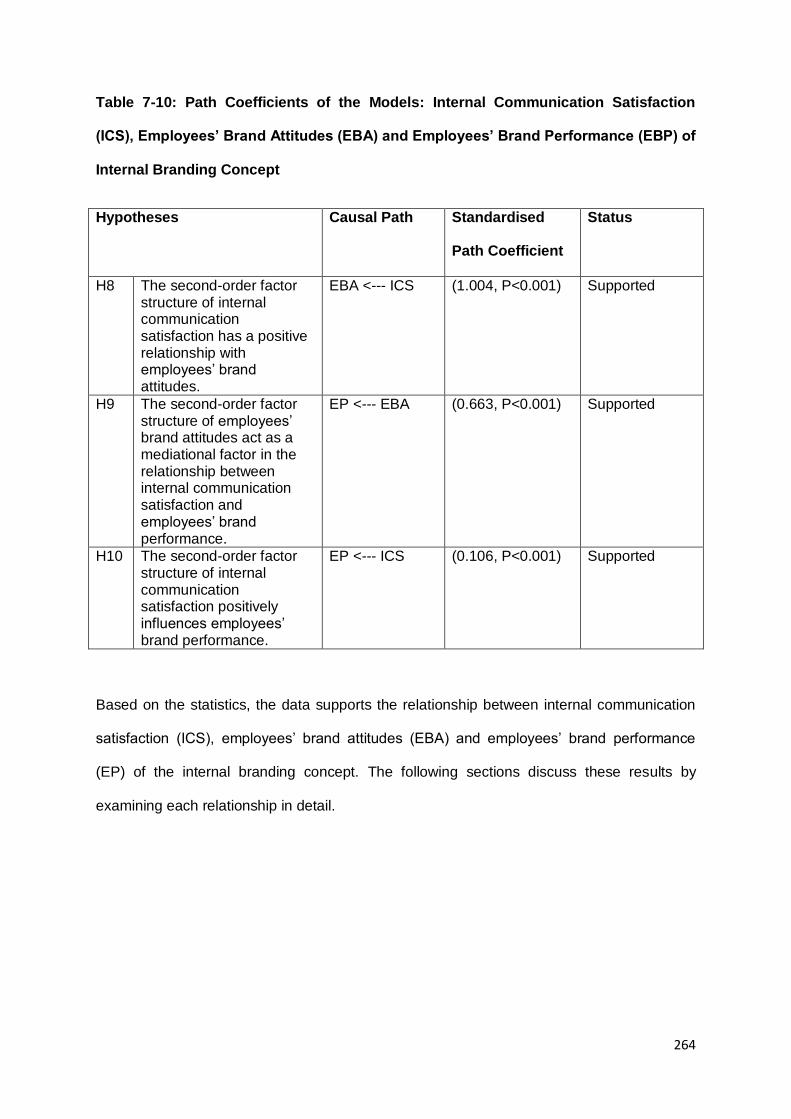
264
Table 7-10: Path Coefficients of the Models: Internal Communication Satisfaction
(ICS), Employees’ Brand Attitudes (EBA) and Employees’ Brand Performance (EBP) of
Internal Branding Concept
Hypotheses Causal Path Standardised
Path Coefficient
Status
H8 The second-order factor structure of internal communication satisfaction has a positive relationship with employees’ brand attitudes.
EBA <--- ICS (1.004, P<0.001) Supported
H9 The second-order factor structure of employees’ brand attitudes act as a mediational factor in the relationship between internal communication satisfaction and employees’ brand performance.
EP <--- EBA (0.663, P<0.001) Supported
H10 The second-order factor structure of internal communication satisfaction positively influences employees’ brand performance.
EP <--- ICS (0.106, P<0.001) Supported
Based on the statistics, the data supports the relationship between internal communication
satisfaction (ICS), employees’ brand attitudes (EBA) and employees’ brand performance
(EP) of the internal branding concept. The following sections discuss these results by
examining each relationship in detail.

265
7.20 Testing Hypothesis 8: The second-order factor structure of internal
communication satisfaction has a positive relationship with employees’ brand
attitudes.
Hypothesis 8 examined the relationship between the Internal Communication Satisfaction
(ICS) and Employees’ Brand Attitudes (EBA). The standard path coefficient between ICS
and EBA was 1.004 (P<0.001). Based on the p-values, there is a relationship between ICS
and EBA.
This current study has purported that internal communication satisfaction that coordinates
the wisdom from both organizational communication and management communication is
capable of inducing employees’ brand attitudes. This is in line with previous studies that
empirically indicate that internal communication satisfaction engenders employees’ brand
attitudes (Punjaisri et al., 2009; Punjaisri & Wilson, 2007; Sharma & Kamalanabhan, 2012).
7.21 Testing Hypothesis 9 and 10
Hypothesis 9: The second-order factor structure of employees’ brand attitudes act as
a meditational factor in the relationship between internal communication satisfaction
and employees’ brand performance.
Hypothesis 10: The second-order factor structure of internal communication
satisfaction positively influences employees’ brand performance.
Hypothesis 9 examined the relationship between Employees’ Brand Attitudes (EBA) and
Employees’ Brand Performance (EBP). The standard path coefficient between EBA and
EBP was 0.663 (P<0.001). Therefore, there is evidence to support that Employees’ Brand
Performance can be explained by the Employees’ Attitudes towards the brand.

266
Hypothesis 10 examined the link between Internal Communication Satisfaction (ICS) and
Employees’ Brand Performance (EBP). The standard path coefficient between ICS and EBP
was 0.106 (P<0.001). Based on the P-values, there is a link between Internal
Communication Satisfaction and Employees’ Brand Performance.
The current study involves testing the mediational effects of employees’ brand attitudes in
the link between internal communication satisfaction and employees’ brand performance.
According to the study of Baron and Kenny (1986), it is shown that testing steps in mediation
models (Figure 7-25), the hypotheses 9 and 10, reveals that the first two steps of the
meditational model are fulfilled. That is, internal communication satisfaction has a significant
relationship with employees’ brand performance (the outcome) and employees’ brand
attitudes (the mediators). However, the comparison between the employees’ brand attitudes
and employees’ brand performance (EP <--- EBA); and internal communication satisfaction
and employees’ brand performance (EP <--- ICS) is the value of the standard path
coefficient. The standard path coefficient between EBA and EP was 0.663 and ICS and EP
was 0.106, the relationship between ICS and EP has the standard path coefficient values
smaller than the relationship between EBA and EP.

267
Figure 7-25: Testing Steps in mediation Models
Step 1
Step 2
Step 3
1) Predictor (P) is significantly related to Outcome (O).
2) P is significantly related to Hypothesised Mediator (M).
M is significantly related to O in an equation that contains both P and M.
Source: (Punjaisri, 2008, p. 262)
Part 4 (Section 7.18 – 7.20)
The third objective of this thesis is to evaluate the influence of internal communication
satisfaction on employees’ brand outcomes based on a developing country context using
evidence from the hotel sector in Thailand. Therefore, Part 4 aims to evaluate whether the
relationship between internal communication satisfaction, employees’ brands attitudes and
Predictor
(P)
Outcome
(O)
Predictor
(P)
Mediator
(M)
Predictor
(P)
Outcome
(O)
Mediator
(M)

268
employees’ brand performance in the internal branding concept will differ based on the value
of the moderator (Hotel Ranking) in Thailand. This part is structured around different
hypotheses, as depicted in the following Table 7-10.
Table 7-11: Objective and hypothesis measured by empirical studies
Objective 3: To evaluate the influence of internal communication on employees’ brand
performance from high/ low performance employees based on a developing country context
using evidence from the hotel sector in Thailand.
Hypotheses Survey
H11: Performance rankings in hotels moderate the effects that internal
communication satisfaction has on employees' brand attitudes and employees'
brand performance; specifically, the impact of internal communication satisfaction
will be stronger in hotels that are ranked highly by customers.
/
Evaluating the influence of internal communication satisfaction on employees’ brand
performance from high/ low performance employees in Thailand was conducted using critical
ratios in AMOS. The following Table 7-11 outlines the process followed in the multi-group
moderation testing.
Table 7-12: The Testing Procedure
Step Methodology
Total Sample (n) = 1,747
High Ranking = 1,212
Low Ranking = 535
1.Baseline Model Evaluation of goodness-of-fit indices
2. Relationship Testing Assess path coefficients
Examine P-values

269
7.22 Baseline Model
In this section, this thesis evaluates the SEM model with each set of data. Using the ranking
of hotel, the baseline model is tested for high and low ranking separately. Fit indices of the
two moderators are given below in Table 7-12 in order to consider the model of factor
structure fit for the two moderators.
Table 7-13: Fit indices of baseline model – High and Low Range Hotels
Fit Indices High Range
Hotels
Low Range
Hotels
Acceptability
DF 814 821
CMIN 834.834 792.094
CMIN/DF 1.026 .965
P >0.05 .299 .760 Yes
RMSEA <.08 .005 .000 Yes
GFI
(Goodness
of Fit Index)
≥0.9 .972 .944 Yes
NFI ≥0.9 .978 .956 Yes
CFI ≥0.9 .999 1.000 Yes
NNFI (TLI) ≥0.95 .999 1.002 Yes
SRMR <.08 .0222 .0262 Yes
By considering the Chi-square and the degree of freedom, results suggest that the two
ranges of hotel are suitable for testing. The CMIN/DF is below 3 (1.026 in High Range, 0.965
in Low Range), which is considered as the cut-off point (Hoyle, 1995; Steiger, 2007).
When examining the absolute fit indices, the two range hotels show a good and acceptable
fit in CFI: the CFI is more than 0.90 (0.999 in High Range and 1.002 in Low Range).
High Range and Low Range Hotels show a good and acceptable fit in RMSEA and GFI: the
RMSEA is below 0.05 (0.005 in High Range and 0.000 in Low Range), which is considered

270
as the cut-off point (Hoyle, 1995; Steiger, 2007); GFI is more than 0.90 (0.972 in High Range
and 0.944 in Low Range). When considering the p-value for the model, High Range and Low
Range Hotels show the goodness of fit: P-value is more than 0.05 (0.299 in High Range and
0.460 in Low Range).
Yet, High Range and Low Range Hotels show a good absolute fit.
7.23 Hypothesis 11: Performance rankings in hotels moderate the effects that internal
communication satisfaction have on employees' brand attitudes and employees'
brand performance; specifically, the impact of internal communication satisfaction
will be stronger in hotels that are ranked highly by customers.
As shown through the Table 7-12, the SEM was used to test the hypothesis of both high
range and low range. The following Figure 7-26 and Table 7-27 give statistical estimations of
the path model relevant for testing all relationships.
Figure 7-26: Measurement Model – Internal Communication and its impact on
Employees’ Brand Attitudes and Employees’ Brand Performance of both High Range
and Low Range.

271
High Ranking

272
Low Ranking
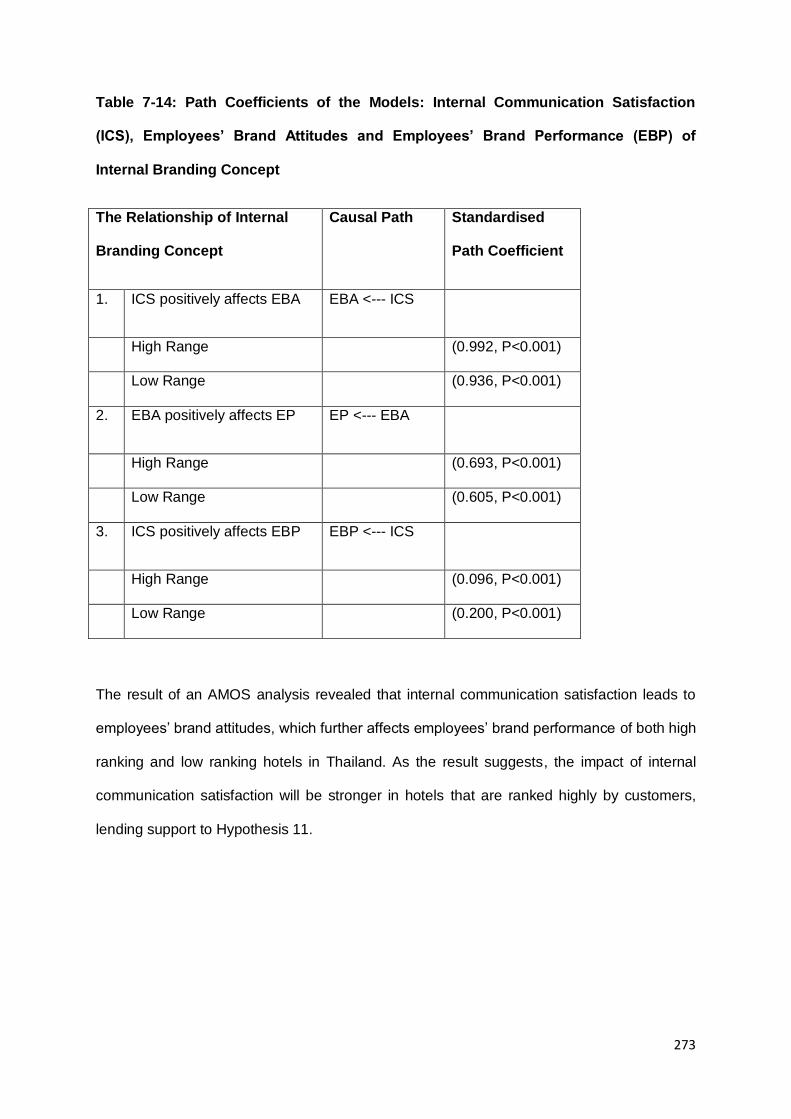
273
Table 7-14: Path Coefficients of the Models: Internal Communication Satisfaction
(ICS), Employees’ Brand Attitudes and Employees’ Brand Performance (EBP) of
Internal Branding Concept
The Relationship of Internal
Branding Concept
Causal Path Standardised
Path Coefficient
1. ICS positively affects EBA EBA <--- ICS
High Range (0.992, P<0.001)
Low Range (0.936, P<0.001)
2. EBA positively affects EP EP <--- EBA
High Range (0.693, P<0.001)
Low Range (0.605, P<0.001)
3. ICS positively affects EBP EBP <--- ICS
High Range (0.096, P<0.001)
Low Range (0.200, P<0.001)
The result of an AMOS analysis revealed that internal communication satisfaction leads to
employees’ brand attitudes, which further affects employees’ brand performance of both high
ranking and low ranking hotels in Thailand. As the result suggests, the impact of internal
communication satisfaction will be stronger in hotels that are ranked highly by customers,
lending support to Hypothesis 11.

274
7.24 Conclusion
This chapter has discussed the findings related to the objectives and hypotheses examined
in the previous chapter through the empirical data obtained by the quantitative methodology.
Part 1 of this chapter aimed at discussing the hypothesised relationships between each of
the seven domains of internal communication satisfaction, (including Communication
Climate, Relationship to Supervisors, Organizational Integration, Media Quality, Horizontal
Communication, Organizational Perspective, and Personal Feedback), and employees’
brand attitudes, (including employees’ brand identification, commitment, and loyalty), and
employees’ brand performance. Through the results, it is clear that each of the seven
domains of internal communication satisfaction is positively associated with employees’
brand attitudes (employees’ brand identification, commitment, and loyalty). Importantly, the
three brand attitudes act as a mediational factor in the relationship between the seven
constructs of internal communication and employees’ brand performance.
Part 2 of this chapter, the second-order model confirmed both the seven dimensionalities of
the internal communication satisfaction scale (Communication Climate, Relationship to
Supervisors, Organizational Integration, Media Quality, Horizontal Communication,
Organizational Perspective, and Personal Feedback) and the three dimensionalities of the
employees’ brand attitudes scale (Employees’ brand identification, commitment, and loyalty)
that can be deployed as complementary measures to investigate internal communication
satisfaction and employees’ brand attitudes in the concept of internal branding.
Part 3 of this chapter intended to discuss the hypothesised relationships between the
internal communication satisfaction (Communication Climate, Relationship to Supervisors,
Organizational Integration, Media Quality, Horizontal Communication, Organizational
Perspective, and Personal Feedback), employees’ brand attitudes (Employees’ brand
identification, commitment, and loyalty) and employees’ brand performance, or assess the
nomological validity of the internal branding network. In this nomological assessment, it is
275
clear that internal communication satisfaction is positively associated with employees’ brand
attitude. Through the results, internal communication satisfaction has a significant
relationship with employees’ brand performance (the outcome) and employees’ brand
attitudes (the mediators). It means that employees’ brand attitudes act as a mediational
factor in the relationship between internal communication satisfaction and employees’ brand
performance. Importantly, internal communication satisfaction also has a direct relationship
with employees’ brand performance. However, the direct impact of internal communication
satisfaction on employees’ brand performance is smaller than the impact of mediation
(employees’ brand attitudes).
Part 4 of this chapter aimed at evaluating the influence of internal communication
satisfaction on employees’ brand outcomes from high/ low performance of employees in a
developing economy. Through the results, it is clear that internal communication satisfaction
is positively associated with employees’ brand attitudes and employees’ brand performance
of both high/ low performance employees. Importantly, the impact of internal communication
satisfaction will be stronger in hotels that are ranked highly by customers.

276
Chapter 8: Conclusions and Implications
8.0 Introduction
Chapter 7 revealed the results of the quantitative findings of this thesis. The discussions of
their findings have also been provided. This chapter will present the conclusions of this
thesis, which will be constructed in line with the research objectives discussed in Chapter 1
in Part 1 (Section 8.2-8.5). The second part of this final chapter will highlight the significance
of this research from both academic and managerial points of view (Section 8.6-8.7). The
chapter will end with the directions for future research in Part 3 (Section 8.8).
Part 1 (Section 8.1-8.4)
8.1 The Downs-Hazen (CSQ) Constructs as the Domain of Internal Communication in
the Internal Branding Concept
The first objective of this thesis was to explore the domain of internal communication
satisfaction in the internal branding concept. Previous research has established the crucial
role of both organizational and management communication forms as internal corporate
communication that influence employees’ brand outcomes in the internal branding concept,
as well as the fact that marketing’s focus needs to be on both internal communication to their
staff and external communication to their customers to achieve a successful corporate brand
(Asha & Jyothi, 2013; Asif & Sargeant, 2000; Bambacas & Patrickson, 2008; Brunetto &
Farr-Wharton, 2004; Camilleri, 2008; Carriere & Bourque, 2009; Chong, 2007; Chowdhury et
al., 2015; Clutterbuck, 2005; Du Preez , 2015 ; Elving, 2005; Fawkes & Gregory, 2001;
Hargie & Dickson, 2007; Hawabhay, Abratt, & Peters, 2009; Kapoor, 2010; Karanges et al. ,
2015; Lee et al., 2014; Matanda & Ndubisi, 2013; Mazzei, 2010; Melewar & Akel, 2005;
Mestre, Stainer, Stainer, & Strom, 2000; Power & Rienstra, 1999; Punjaisri & Wilson, 2007;
To et al., 2015; Tukiainen, 2001; van Vuuren, de Jong, & Seydel, 2007; Welch & Jackson,
2007). Hence, it was not a surprise that the seven domains of internal communication
satisfaction, which were created from the Downs-Hazen CSQ constructs and include both
277
organizational and management communication forms, corroborated the literature. Each of
the seven domains of internal communication satisfaction has a relationship with employees’
brand attitudes (commitment, identification, and loyalty) and employees’ brand performance.
This means that the seven CSQ’s constructs as the domain of internal communication
satisfaction in the internal branding concept can help employees represent a brand to
customers that come into contact with the brand.
Results of the literature review revealed there was a need for empirical research that shows
an association between each of the seven domains of internal communication and
employees’ brand outcomes in the internal branding concept in order to understand this
concept from the employees’ viewpoint. As a result, a balanced perspective between the
internal communication (organizational and management communication) and external
communication (marketing communication) of the brand is realised. The following section
discusses each of the seven domains of internal communication satisfaction in detail to give
deeper insights.
8.1.1 Communication Climate
The previous research studies have revealed a number of different communication climate
scales. In particular, it supports Downs and Hazen (1977) who show the five factors of ideal
communication climate: 1) The ability of people in the organization to communicate with one
another, 2) The handling of workplace conflict through communication channels, 3)
Communication motivating employees to achieve a goal, 4) Communication which makes
employees feel a part of the organization, and 5) Giving the information employees need to
do their jobs.
This current study agrees with the literature that the ability of people in the organization to
communicate with one another was mostly embraced by employees. The rationale for their
preference reflected the studies of Ayoko (2007), Spaho (2013), Smidts, Pruyn, and Van Riel
(2001), Swanson & Kent, (2015); the ability of people in the organization to communicate
278
provided employees the opportunity to interact with their leaders or colleagues or message
senders and to clarify any uncertainties of messages optimises the effectiveness of internal
branding. Furthermore, these techniques were believed to decrease employee conflict by
encouraging strong relationships among staff members. This study found that
communication motivates employees to achieve a goal, which is available to improve
creative ability and tackle complex problems of employees. Additionally, communication that
makes employees feel a part of the organization could reinforce the positive employees’
brand attitudes and performance. Failure to communicate effectively often leads to conflict,
therefore, handling of workplace conflict via effective communication channels can help
reduce conflict in the workplace and enable their employees to achieve more. Finally,
updating employee job information was found to convey the brand message to both
employees and external stakeholders.
All communication climate factors suggested by Downs and Hazen (1977) and other authors
were supported by this case study representing the hotel industry in Thailand, as it reveals
that not only communication with employees about job information is important, but also
handling of workplace conflict via effective communication channels and communication,
which makes employees feel a part of the organization were practised within these
organizations, which in turn leads to employees’ brand outcomes. Furthermore, the findings
suggest the importance of good communication skills in the workplace. When employees are
satisfied with the staff members who have great ability as communicators, the positive brand
attitudes and the delivery of the brand promise were more effective. This suggests the
prevailing role of the development of employees’ communication skills.
8.1.2 Relationship to Supervisors
A group of authors (Breeze, Dawson, & Khazhinsky, 2002; Downs & Adrian, 2012; Elving,
2005; Gkorezis et al., 2015; Khabir, 2014; Jablin, 1979; Johlke & Duhan, 2000; Lam et al.,
2015; McKenzie, 2015; Salleh ei al., 2013; Shipton et al., 2015; Smith & Rupp, 2002;

279
Tjosvold, 1984; Unzicker, Clow, & Babakus, 2000; van Vuuren et al., 2007; Whitener, Brodt,
Korsgaard, & Werner, 1998; Yoshimura, 2003; Yuan et al., 2006) have suggested
supervisor-employee relationship practices in order to optimise the success of internal
branding programmes.
This study agrees with the literature that there is a need to develop a positive working
relationship between supervisor and employee in terms of internal communication. Several
relationships with supervisors’ tools were listed during the expert judgement phase.
Supervisor communication skill was mentioned as instrumental in engendering employees’
brand attitudes and performance. The literature placed much emphasis on the upward and
downward aspects of communicating with supervisors (Downs & Hazen, 1977), the quality of
the supervisor communication (Elving, 2005), vertical communication (Downs & Adrian,
2012), using humour in communication in the workplace (Breeze et al., 2002), openness in
communication (Jablin, 1979), supervisors’ listening skills (Khabir, 2014; Therkelsen &
Fiebich, 2004; van Vuuren et al., 2007), feedback from supervisors to employees (van
Vuuren et al., 2007), effective supervisory communication skills (Tjosvold, 1984), and
supervisor’s recognition of the importance of personal and family life of employee (Smith &
Rupp, 2002).
This current study revealed that using informal communication and humour to improve
communication were perceived as ideal and practical in the internal communication in the
internal branding concept. In addition, this current study reveals that the supervisor provides
information about company policies and why employees need to do the job and why their job
is important; the result reveals that employees use them to support their brand promise
delivery to customers.
Therefore, under relationship to supervisors as a construct of internal communication in the
internal branding concept, not only was improving supervisors’ communication skills
280
revealed, but also the value of informal communication was found to have a positive
influence on the success of internal branding programme.
8.1.3 Organizational Integration
Previous studies suggest the company could use organizational integration as an internal
communication tool in order to optimise the success of internal branding programmes (Baker
et al., 2014; Clampitt & Downs, 1993; DeCotiis & Summers, 1987; Ebren, 2006; Guest &
Conway, 2002; Henkel, Tomczak, Heitmann, & Herrmann, 2007; King & Grace, 2010; Kumar
& Pansari, 2014; Pincus, 1986; Ridder, 2004; Thomson & Hecker, 2001). This study agrees
with the literature that there is a need to provide information about the organization and their
immediate working environment for employees in the workplace. The literature placed much
emphasis on organizational integration based on information about the immediate work
environment (Downs & Hazen, 1977), the quality of task-related communication (DeCotiis &
Summers, 1987; Guest & Conway, 2002; Kumar & Pansari, 2014; Ridder, 2004), and brand-
related information (Baker et al., 2014; Henkel et al., 2007).
This study revealed that information about the immediate work environment whose values
are aligned with the brand and the company is perceived as ideal and practical. The
rationale for their preference reflected the studies of McKenna (2012) and Punjaisri (2008),
when employees receive the information about the organization and their immediate job
environment from their company, they use it to interpret into daily activities that they can link
to their job responsibilities. Additionally, the results of this current study revealed that the
organizational integration, which includes information about employees’ and company’s
progress, practical matters within the company, and the critical issues facing the company
could reinforce the employees’ brand outcomes.
8.1.4 Media Quality
Many researchers argue for the importance of media quality in internal communication (Asif
& Sargeant, 2000; Baker et al., 2014; Daft & Lengel, 1983; Daft, Lengel, & Trevino, 1987;
281
Downs & Adrian, 2012; Fornes, Rocco, & Wollard, 2008; Omilion-Hodges & Baker, 2014;
Ridder, 2004; Stein, 2006). Several media quality tools were listed during the literature
review phase. However, internal communication with emails and meetings were the media
quality tools that were mentioned by expert judgement as instrumental in engendering
employees’ shared understanding of the brand concept, its values, and its miss ion engraved
in the brand promise. The rationale for their preference reflected the study of McKenna
(2012); these techniques were believed to be the fastest channel for internal communication.
The meetings usually consist of both the spoken and written word. For the written word, it
allows the communicator to organize his/ her thoughts carefully and provides a written
record of happenings and transactions for future reference (McKenna, 2012). Also, for the
spoken word, it provides opportunity for the sender to observe feedback and to provide
clarification (McKenna, 2012). In short, both emails and meetings could reinforce the
employees’ brand outcomes towards the use of these channels.
This study revealed that communicating in meetings and emails were perceived as ideal and
practical. Additionally, the coordination of both internal communications with emails and
meetings practices are needed in order to optimise the success of internal branding
programmes.
8.1.5 Horizontal Communication
According to the literature, effective internal communication is achieved in organizations
through the degree to which the grapevine helps internal communication and the degree to
which horizontal communication is free-flowing and accurate (Ashforth & Mael, 1989; Asif &
Sargeant, 2000; Bratton & Gold, 1994; Chan & Mak, 2014; Galbraith, 1973; Gkorezis et al.,
2015; Guerber et al., 2014; Hall, 2001; Jarvenpaa & Staples, 2001; John P. Meyer, 1997;
Levine & Moreland, 1990; Lin et al., 2013; McKenna, 2012; Narteh & Odoom, 2015; Parolia,
Goodman, Li, & Jiang, 2007; Richmond, McCroskey, & McCroskey, 2001; Thomson &
Hecker, 2001; van den Hooff & De Ridder, 2004; Wallace, 1995; Yammarino & Naughton,
282
1988). According to the studies of McKenna (2012) and Harley (2001), it is suggested that
horizontal and informal communication creates possible teams and encourages
decentralization of authority and initiative, and teamwork can lead to business success.
This study agrees with the literature that the effective horizontal communication refers to
information about personal matters and other everyday issues that flow between employees
and colleagues. It means that employees want to have a good atmosphere between them
and colleagues in their workplace. Therefore, the horizontal communication based on a good
atmosphere between employees and colleagues was perceived as ideal and practical.
8.1.6 Organisational perspective
According to the literature, employees in the workplace require a company to provide both
non-task-related information and task-related information (Bart, Bontis, & Taggar, 2001;
Diamond, 1992; Edwards & Edwards, 2012; Foote, Seipel, Johnson, & Duffy, 2005;
Foreman, 1997; Hilton & Sherman, 2015; Jeavons, 1994; Juriova & Durkova, 2012;
McDonald, 1996; Mullane, 2002; Rho et al., 2015; Ridder, 2004; Thomson & Hecker, 2001).
When a company arranges organizational perspective programmes, it aims to share
information about non-task-related information, which is related to goals, organization
problems, organization change, and organization policy. According to the literature,
organizational perspective creates corporate guidelines for the employees and aims achieve
the desired and results.
In the hotel business in Thailand, the results of this current study agree with the literature
that organizational perspective programmes are needed to provide information about
company policies/ goals and organizational change to employees. Additionally, this study
revealed that organizational perspective programmes, which are based on government
policies, organization’s financial standing, and organization accomplishments and/ or failures
can influence employees’ brand attitudes and behaviour. An organization may deploy several

283
tools to provide this information with its brand in terms of attitudes, qualifications, and
personalities.
8.1.7 Personal Feedback
The literature has accumulated an increasing number of studies to explore ‘how’ personal
feedback should be implemented. While some authors suggest an employee will find
information about the job itself (Maanen & Katz, 1976), others argue that they will find
information about their performance (Daft et al., 1987; Downs & Hazen, 1977; Young &
Steelman, 2014; Eisenberger, Fasolo, & Davis-LaMastro, 1990; Goleman, 1998; Ibarra,
1999; Maanen & Katz, 1976; Narteh & Odoom, 2015; Neher, 1996; Porter & Steers, 1973;
Ross & Zander, 1957; Steers, 1977; Swann, 1987).
This study agrees with the literature that there is a need to provide sufficient performance
feedback to employees through effective internal communication techniques to improve the
effective internal branding programmes, such as how their job compares with others and
how they are being judged. In addition, this study has revealed that employee perceptions
about personal feedback include the recognition of positive employee efforts, how the
problems of employees are being handled and understanding any staff problems. They were
regarded as important to influence employees’ brand outcomes, which positively influence
customer satisfaction.
8.2 Influence of Internal Communication Satisfaction on the Employees’ Brand
Attitudes and Employees’ Brand Performance
The thesis has fulfilled research objective 2, which aimed at determining the nomological
network of internal branding. It means that this study aimed at investigating the influence of
the seven domains of internal communication in the internal branding concept on employees’
brand attitudes and behaviour. The literature has recently seen the role of internal
communication satisfaction in the internal branding, the knowledge that is argued to
influence employees’ brand attitudes and behaviour (Punjaisri & Wilson, 2007; Sharma &

284
Kamalanabhan, 2012). A number of research studies (Khanyapuss Punjaisri, Evanschitzky,
& Wilson, 2009; Punjaisri & Wilson, 2007, 2011; Sharma & Kamalanabhan, 2012) argue for
the influence of internal communication satisfaction in the internal branding on employees’
brand attitudes (identification, commitment and loyalty). Furthermore, while a number of
authors (Punjaisri & Wilson, 2007; Sharma & Kamalanabhan, 2012) have suggested the
relationship between internal communication satisfaction and employees’ performance in
delivering the brand promise, they are not clear what the domains of internal communication
satisfaction in the internal branding concept are.
This study supports the seven domains of internal communication satisfaction, which are
created from CSQ’s constructs as influential in the extent to which employees follow the
brand standards that ensure employees' delivery of the brand promise. This study
discovered that the seven domains of internal communication satisfaction were integrated
with brand values, mission, and goals, as they were implied within an organization, and the
brand concept was constantly reinforced to the employees. The quantitative research of this
study affirms that the coordination of all internal communication satisfaction tools is
influential on both employees’ brand attitudes (identification, commitment, and loyalty) and
their performance.
Hence, this thesis confirms previous studies that internal communication satisfaction is a key
factor for establishing the cause of employees’ brand attitudes (e.g. identification,
commitment, and loyalty). Significantly, this study has provided empirical evidence
supporting the assumption that the seven domains of internal communication exert certain
degrees of influence on employees' brand behaviours in delivering their brand promise.
The following section discusses the employees’ brand attitudes as a medium of internal
branding process, and employees’ brand performance as the aim of internal branding
process.
285
8.3 Employees Brand Attitudes as the Mechanism of Internal Branding Process
Under research objective 2, this current study of the Thai hotel industry also reveals that
employees’ brand attitudes act as partial mediators in the relationship between internal
communication satisfaction and employees’ brand performance. In orther words, internal
communication satisfaction exerts part of its influence on employees’ brand performance
through its influences on employees’ brand attitudes. Yet, it has a direct influence on the
extent to which employees’ brand behaviours deliver the brand promise to customers.
Therefore, this study supports previous studies (Punjaisri & Wilson, 2007; Sharma &
Kamalanabhan, 2012) that postulate that employees’ brand attitudes, which include brand
identification, brand commitment and brand loyalty, influence the extent to which employees
can deliver on the brand promise. Therefore, internal communication satisfaction is found to
enhance employees’ understanding about their corporate brand and build them with positive
brand attitudes, which, in turn, gives good customer service for the company’s brand
promise.
8.4 Evaluating the Influence of Internal Communication Satisfaction on Employees’
Behaviour in a Developing Economy
The final objective of this research study was to evaluate the influence of internal
communication satisfaction on employees’ behaviour based on a developing country context
using evidence from the hotel sector in Thailand. This means that the study was to explore
the seven domains of internal communication satisfaction (which are created from the CSQ)
in the internal branding concept that influences employees’ brand behaviour in Thailand (a
developing economy). Previous research has established the crucial role of internal
communication satifaction with employees (which used the CSQ constructs) in developed
countries and that there is a lack of empirical research of the CSQ constructs in the internal
branding concept within developing countries. Additionally, this study used TripAdvisor hotel

286
ranking in Thailand as moderating factors in order to expore the difference between the
internal communication satisfaction of high ranking hotels and low ranking hotels in Thailand.
The study has revealed that the seven domains of internal communication satisfaction
(which are created from the CSQ) in the internal branding concept can cover the hotel
businesses in Thailand as a developing country and this study has tested them through two
different ranking hotels. One is the high ranking hotel, which is very high in experience
qualities and the other one is the low ranking hotel, which has a need for development for
delivering quality service. This study’s operationalized models support this by showing high
levels of good fits. Additionally, the impact of internal communication satisfaction will be
stronger in hotels that are ranked highly by customers.
Part 2 (Section 8.5-8.7)
8.5 Theoretical Contribution
Referring to the research objectives mentioned in the introduction part, here this thesis
illustrates the research results that contribute to marketing academics.
Firstly, previous research about internal branding studies suggests that the internal
communication satisfaction has played a major role in the positive employees’ brand
attitudes and performance in the internal branding concept. However, they are not clear on
the domain of internal communication in the internal branding concept. This current study
captures the role of internal communication satisfaction in the internal branding concept in
the hotel business context. This thesis showed the conceptualisation of the domain of
internal communication satisfaction in the internal branding concept. The seven domains of
internal communication include Organizational Perspective, Organizational Integration,
Personal Feedback, Relation with Supervisor, Horizontal Informal Communication, Media
Quality and Communication climate.

287
Additionally, an internal communication review reveals important gaps that need to be
considered is that the current internal communication literature explored is obtained from the
developed country contexts (especially Australia, Western Europe, and North America) and
to a little extent from the developing country contexts. Consequently, the extent to which the
underlying theory of the influence of internal communication on employees’ outcomes is
relevant to developing economies (especially Asian economies), which has received very
little attention and need to be addressed. Previous studies have suggested the importance of
the influence of internal communication on employees’ outcomes in the third world (Akaah &
Riordan, 1988; Cui et al., 2006; Frimpong & Wilson, 2013; Tsui, 2004). Both businesses in
developed countries and developing countries now live in a global economy and participate
in a global village. According to Miller (2014), the global village has led many organizations
to a multinational or international presence; therefore, businesses are no longer centered in
Australia, Western Europe, and North America, but are spread among nations throughout
the developing world as well.
Apart from identifying the seven domains of internal communication satisfaction in the
concept of internal branding, this current study further adds to the existing literature by
revealing the domain of internal communication satisfaction in the developing economy
context, and this case study that represents the hotel industry in Thailand. This thesis shows
that the seven domains of internal communication satisfaction can be used for both high and
low ranking hotels in Thailand. It means that the same domains were communicated
differently according to the receivers, while the seven domains of internal communication
satisfaction still ensure any potential for creating a positive atmosphere, employee
commitment, belonging, unified identity, buy-in involvement, and engagement in support of
the achievement of internal branding goals as argued by different authors (Punjaisri &
Wilson, 2007; Sharma & Kamalanabhan, 2012).
The findings from this thesis indicate some support for the influence of internal
communication satisfaction on employees’ brand outcomes literature even in a non-

288
developed economy. Understanding the influences of internal communication satisfaction on
employees’ brand outcomes in a developing economy is a key success factor to internal
branding strategy implementation. The influences of internal communication satisfaction on
employees’ brand outcomes are felt not only in the developed countries, but in the
developing countries as well.
Effective internal communication and internal branding effectiveness depend on
understanding the influences of internal communication satisfaction on employees’ brand
outcomes. When managements’ businesses in the developing countries understand the
influence of internal communication satisfaction on employees’ brand outcomes in the
developing country contexts then they will use them to operate the societies and
organizations they live within and adapt internal communication strategies in the internal
branding concept to the organizational situations that they face and their resources available
to meet them.
Effective internal communication and internal branding effectiveness in the developing
country contexts help businesses in the developing countries deal with globalization, as the
world economy has become increasingly globalized, creating new challenges and new
opportunities for their organizations, their employees, and their governments. It means that
effective internal communication and internal branding effectiveness can contribute to both
the business sectors they are applying to and the economic growth of a developing country.
Secondly, this thesis has created operationalized models and they are the empirical
evidence to support the concept of internal branding in the hotel business. There are some
previous articles (Bakar & Mustaffa, 2013; Punjaisri & Wilson, 2007) stating the importance
of internal communication satisfaction towards employees’ brand attitudes, which influence
employees’ brand performance. This thesis has found that regarding the relationship
between the internal communication satisfaction and employees’ brand performance there
are two types of relationship. One is a direct relationship where the seven domains of
289
internal communication satisfaction can directly influence employees’ brand performance
and the other one is an indirect relationship in which the internal communication satisfaction
leads to employees’ brand performance through employees’ brand attitudes. However, the
operationalized models of this thesis support the indirect relationship by showing high
loadings more than the direct relationship.
This current study has confirmed the nomological network of internal branding that internal
communication satisfaction empowers employees to create employees’ brand attitudes
(employees’ commitment, identification, and loyalty) that facilitate the delivery of the brand
promise (employees’ brand performance). The total effect internal communication
satisfaction has on employees’ brand performance could be enhanced when internal
communication satisfaction successfully heightens the level of employees’ attitudes to the
brand. Previous literature also supports this claim (Bakar & Mustaffa, 2013), regarding the
employees’ attitudes (Punjaisri & Wilson, 2007), and the employees’ performance (Bakar &
Mustaffa, 2013; Punjaisri & Wilson, 2007).
Finally, this current study has confirmed the importance of internal corporate communication,
both organizational communication and management communication, which will help
employees engage in the brand promise and invest in the company. Employees that
understand and live the brand promise play an important role in developing the corporate
image, which is perceived by customers and has been recognised as a strategic resource
and source of competitive advantage. By considering corporate communication specialists,
Riel (1995) has identified three main specialists, namely marketing, organizational and
management communication. All three specialists are integrated with the totality of
organizational message and their influence internally, by means of helping to define the
corporate image as a means to improving corporate performance. Marketing communication
enables a company to develop avenues for reaching out and interacting with customers.
Both organizational and management communication help a company to develop
relationships and build ambassadors among employees. It means that corporate
290
communication needs a balance between external corporate communication (via marketing
communication) and internal corporate communication (via both organizational and
management communication) in order to achieve a successful corporate image.
The seven domains of internal communication satisfaction are developed in this current
study, which includes both organizational communication and management communication
that influence employees’ brand behaviour through employees’ brand attitudes. Therefore,
this current study has confirmed the essential role of organizational communication and
management communication programmes. Both are identified as key mechanisms for
implementing successful internal branding. Furthermore, this current study confirms that
both mechanisms need to be coordinated to optimise the internal branding process.
From the literature review, the internal branding approach will require an integrated
approach from both organizational communication and management communication. The
seven domains of internal communication are developed by this current study that shows
significant progress in promoting both integrated approaches. The empirical research in this
thesis has revealed that using both organizational and management communication are
associated with employees’ brand attitudes and performance in the internal branding
approach. These results are extremely important and provide information of internal
corporate communication (both organizational and management communication) that
marketers should consider when building a corporate brand. Various authors also support
the importance of internal corporate communication (De Chernatony & Segal-Horn, 2003;
Palmer, 1994; Piercy & Morgan, 1990), and they have suggested that marketing’s focus
needs to be on both internal corporate communication to their staff members and external
corporate communication to their customers to achieve a successful corporate brand. Riel
(1995, p. xi) also supports the link between internal and external corporate communication,
as he stated that both internal corporate communication (organizational and management
communication) and external corporate communication (marketing communication) need to
291
integrate the totality of the organizational message so that it could not only lead to defining
the corporate image, but also to improving corporate performance.
8.6 Managerial Implications
There are a number of issues that can be applied to business implications and these can be
explained as follows.
Firstly, the current study has confirmed that the internal communication is a subset of
corporate communication, which also includes organizational communication and
management communication. It empowers employees to understand and live the brand
promise and ensure that all are aligned with corporate image. Therefore, business leaders
should pay attention to factors suitable for the domain of internal communication, including
Organizational Perspective, Organizational Integration, Personal Feedback, Relation with
Supervisor, Horizontal Informal Communication, Media Quality and Communication Climate.
Using these seven domains of internal communication satisfaction through internal
communication, organizations gain competitive advantage by winning brand attitudes from
all employees, harnessing the company’s values through internal communication and
supporting the company’s brand promise.
Secondly, measuring the effectiveness of internal communications should be playing a
crucial role in internal branding concept. Not only does it help management assess and
show the worth of internal communication, but it also enables business leaders to determine
which constructs and tactics are working and which are not. Traditional business leaders
consider internal communication as a supportive role and a sunk cost. Therefore, they have
questioned how internal communication generates business results in the long term or even
translates into immediate success in the short term. The seven domains of internal
communication satisfaction, which were developed in this current study, are the way to
answer these questions.
292
The seven domains of internal communication could include the identification of internal
communication constructs with high potential and the spotting of obstacles or barriers to
employees’ brand outcomes. They will help management in making their internal
communication more effective. Therefore, the seven domains of internal communication
satisfaction which were developed in this current study articulate the ways to measure the
success of internal communication in the concept of internal branding.
Thirdly, the impact of internal communication satisfaction in hotel business in Thailand will
be stronger in hotels that are ranked highly by customers. The qualitative study suggests
that emplyees in high-performance hotels expressed higher levels of brand attitudes and
brand behaviours than employees in low-performance hotels. This suggests that employees
in low ranking hotels in Thailand need to be influenced more by internal communication to
induce their brand attitudes (identification, commitment, and loyalty) and brand bahaviours.
As employees’ brand identification is defined as their sense of belonging to the hotel and a
perception of being aligned to the organization’s brand values and promises (Punjaisri et al.,
2009), employees in low ranking hotels may not believe that they are contributing to the
success of the brand. According to Khanyapuss Punjaisri et al. (2009), employees’ brand
commitment is defined as their psychological attachment to the brand which influences their
willingness to exert extra effort towards reaching the brand goals (Punjaisri et al., 2009),
employees in low ranking hotels may not have emotional attachment to the brand and the
hotels they work in. Moreover, as employees’ brand loyalty is defined as their willingness to
remain with the current hotel (Punjaisri et al., 2009), therefore, employees in low ranking
hotels may not want to continue to work in the same hotel. Moreover, the three employees’
brand attitudes can influence employees in low ranking hotels to deliver the brand promise to
their customers.
The quantitative findings also supported that employees were believed to deliver the brand
promise effectively, which relates to the level of internal communication satisfaction. This is
293
supported by the study of McKenna (2012) that affirmed that when employees were satisfied
with their internal communication they were more productive at work. This means that there
is the relationship between employees’ satifaction with internal communication and their
productivity at work. The internal communication satifaction is the importance factor of
internal branding concept that enables employees to transform brand promise into practice,
effective internal communication helps employees coordinate activities to achieve internal
branding goals by giving them detailed information about the brand, which influences
employees’ brand behaviour.
With the influence of internal communication satifaction on employees’ brand outcomes,
employees in high ranking hotels feel valued to their hotels because effective internal
communication in these hotels make employees aware about delivering the brand promise
of them that can help their hotels become successful. The understanding of how to deliver
their brand promise through efective internal communication helps employees in high
ranking hotels to build their confidence with their brand knowledge, seeking to do their best
for delivering the brand promise. Therefore, when employees in high ranking hotels are
satified with internal communication they would have more employees’ brand attitudes and
can have an impact on the employees’ brand behaviours.
Contrarily, employees in low ranking hotels need to be influenced more by internal
communication that are offered by their hotels to engender their brand attitudes and
performance. This thesis found that employees in low ranking hotels in Thailand have
potential and aspiration to be the successful corporate brand ambassador. Therefore,
management in low ranking hotels in Thailand need to communicate with employees to
increase their brand knowledge and to ensure that they have bought into the brand promise.
The seven constructs of internal communication from this thesis can help the low ranking
hotels in Thailand to achieve internal branding goals by developing their employees with
success on delivering brand promise to their customers. When their customers are happy

294
with services provided by their employees, it can help the hotels to increase customer loaylty
and repeat bookings and use a wide range of services offered by these hotels. This means
that the low ranking hotels in Thailand can gain a competitive advantage and it is necessarry
for their success.
Moreover, this thesis has refined the domains of internal communication satifaction in the
internal branding concept into seven principal techniques that were found to be significant
tools used by the low ranking hotels in Thailand: Organizational Perspective, Organizational
Integration, Personal Feedback, Relationship to Supervisors, Horizontal Communication,
Media Quality and Communication climate. According to the study of Miller (2014), internal
communication practice can help businsess (e.g. the low ranking hotels in Thailand) to
provide their employees the support they need to cope with organization goals, especially
internal branding goals. The three common supports are emotional support, informational
support, and instrumental support. Emotional support is most likely to come in the form of
Relationship to Supervisors, and Horizontal Communication. Emotional support helps
employees in low ranking hotels know that they are loved and cared for (Miller, 2014).
Information support is most likely to come in the form of Organizational Perspective,
Organizational Integration, and Personal Feedback. According to Miller (2014), information
support helps their employees to involve the provision of facts and advice to help employees
cope with problem issues about service delivery at their hotels. Information support might
serve to decrease employees’ stress levels, conflict between employees, and employees
overload in the low ranking hotels. Additionally, information support might provide
suggestions for dealing with their cutomers to achieve the internal branding goals. Finally,
instrumental support is most likely to come in the form of Media Quality, and Communication
climate. According to Miller (2014), instrumental support involes providing the resources for
employees that thay need to cope with workplace problems.
This thesis has further shown that these seven domains are effective in inducing the brand
positive attitudes and behaviours. However, this thesis found that these seven constructs of
295
internal communication satifaction are interdependent and indispensable. It means that
these seven constructs need to be practised together to improve their employees’ attitudes
and behaviours.
The findings of this thesis suggest not only the internal communication satifaction can help
the low ranking hotels in Thailand to achieve the internal branding outcomes but that it exists
on social support in the workplace as a means of protecting employees from the major and
minor stresses of life (Miller, 2014). Internal communication can provide employees the
support they need to cope with workplace problems and enhance the feeling of ‘oneness’,
which positively affects the relationships among employees in the hotels. Therefore, not only
the seven internal communication constructs in the internal branding concept can help the
low ranking hotels in Thailand to increase competitive advantage, but also they improve
quality of work life in the low ranking hotels in Thailand.
For example, Relationship to Supervisors can provide information support and the access to
resources to provide instrumental support (Miller, 2014). The outcomes of this support are
the reducing ambiguity in the workplace, clarifying customers’ expectations, and reducing
employees workload. As Horizontal Communication, support from coworkers can help their
employees to receive valuable information about corporate brand promise and how to deal
with their customers. According to Miller (2014), coworkers are considered significant
sources of emotional support in the workplace because they have a clear understanding of
the workplace context. As Organizational Perspective, Organizational Integration, and
Personal Feedback, information support involves the information about corporate values and
their jobs that can help their employees to deliver the brand promise. Finally, as Media
Quality and Communication climate, instrumental support involves tangible and intangible
assistance that helps their employees to solve their own problems both work-related issues
and personal problems in the workplace.

296
In summary, the effective internal communication in the internal branding concept from this
thesis can help the low ranking hotels in Thailand to gain sustainable competitive advantage,
to help Thailand’s hotel industry to gain sustainable industrial development in a global
context. Additionally, the effective internal communication from this thesis can help the low
ranking hotels in Thailand to develop quality of work life for their employees though
emotional support, informational support, and instrumental support.
Fourth, the partnerships working between the marketing department and human resource
department (HR) in the company are instrumental to the success of internal communication
strategies in the concept of corporate communication because both have a significant role in
integrating all communication specialists (marketing, organizational and management
communication) of corporate communication.
Marketing leaders can use the seven domains in this thesis to guide and coach HR on the
nuances of effective internal communication of both organizational and management
communication. They also support HR by giving guidance in ways of communication,
transaction communications, improving communication, and important communication skills.
Therefore, the partnerships working between marketing and human resources (HR) is
internal the communication team’s presence, which can help the company to achieve
internal branding outcomes. The benefits of consistent internal communication include
employees’ brand performance, employees’ commitment, employees’ identification, and
lower turnover.
The fifth point is that, the challenge facing business leaders in internal branding
management is employee information overload, which can hinder effective internal
communication and it can block the transmission of ideas (McKenna, 2012). With regards to
the design of internal communication in the concept of internal branding, business leaders
should endeavour not to undermine the employees’ reliability by provid ing too much
information or providing information that cannot conveniently, easily, and accurately be used

297
(McKenna, 2012). The seven domains of internal communication in the current study can be
used to coach internal stakeholders and aid managers with internal communication
knowledge in the concept of internal branding to ensure the totality of organizational
messages are received, understood, and acted upon.
The sixth point is that, empowering employees to contribute and manage internal
communication channels and flow are the key success factors in the concept of internal
branding. This current study confirmed that horizontal communication such as good
communication with colleagues can be used to supplement formal communication channels
and it can influence employees’ brand attitudes and behaviour. This current study also sends
a message to management about considering each individual in the company as a potential
internal communicator. It is beneficial to develop an understanding of this role in order to
assist manager and supervisor to facilitate communication and to capitalize on the strengths
and orientation of various individuals (McKenna, 2012). According to the study of Zaremba
(1988), good communication with colleagues provides groups with a feeling of security and
belonging, which in turn fosters satisfaction and group stability. Additionally, it can raise
morale when it transmits positive information about the company (Zaremba, 1988).
The seventh point is that, according to the results in this current study, the most effective
internal communication channels in the concept of internal branding were email, meetings
and face-to-face communication. Both meetings and face-to-face communication are
traditional ways of internally communicating via oral and written communication.
To use email as an internal communication channel, according to the study of McKenna
(2012), some researchers in the past viewed email as a poor substitute for face-to-face
communication because it lacks the depth of understanding most employees have face-to-
face. Additionally, using email for internal communication is denies the opportunity of hearing
the person’s tone of voice or seeing a facial expression, and the receivers are not able to tell
the mood of the emailer (McKenna, 2012). However, this current study sends a message to

298
management about viewing email as a new way to communicate with employees because
present day email can place characters with, for example, a smiley face to indicate humour,
and can assist the receiver in better understanding the intended meaning (McKenna, 2012).
Moreover, email is hard to beat as a transmitter of documents and data (Luke, 2009), and
the senders need time to think about their arguments and express themselves concisely and
logically (McKenna, 2012). It allows employees to exchange information with the senders of
different questions when time is short. It makes possible instant communication, which offers
real-time transmission of information, irrespective of the location of those involved, and it
facilitates teamwork and team spirit when all team members receive a message at the same
time (McKenna, 2012).
The next point is that, the role of the supervisor in developing employees’ brand knowledge
is a big boost to employees’ morale and helps them to understand the brand knowledge.
According to the seven domains in this thesis, supervisors can help employees understand
the corporate’s brand meaning, expectation and roles of them as brand deliverer. However,
many studies focus on customers’ brand knowledge more than supervisors’ brand
knowledge.
This current study sends a message to management leaders about the importance of
supervisors’ brand knowledge that influences employees' brand promise delivery and
employees’ understand the brand. For this reason, developing supervisors as coaches of
brand knowledge requires them to be adequately educated and trained about brand
knowledge, in order to ensure all supervisors in the company are trained, prepared and
supported in their educational roles.
The new focus on supervisors’ brand knowledge changes the role of the Human Resource
Management (HRM) function. The degree of success is directly linked to achieving
cooperation between the Human Resource Management (HRM) and the Marketing function.

299
It is important therefore that both the Human Resource Management and Marketing
department work together effectively.
The Human Resource Management (HRM) is responsible for training supervisors, which can
underpin effective delivery of messages the company wishes to convey as part of the brand
knowledge to all supervisors. Through HRM, Marketing department can be given the brand
information that is appropriate for supervisors. A strong relationship between HRM and the
Marketing department leads to building the Corporate’s Internal Communication Team.
There are numerous benefits of this team, such as enhanced supervisors’ brand knowledge,
employees’ brand attitudes, employees’ brand performance, employees’ turnover,
absenteeism, and better business growth. However, to be accepted as leaders, the team
needs to prove its worth.
Next, creating forums for employees to develop and share ideas to improve how they deliver
on the brand promise is the new way of internal communication to get the internal branding
outcomes. The seven domains of internal communication satisfaction, which are developed
in this thesis, have challenged business leaders to think differently about the ways to
communicate effectively to employees. These domains show characteristics of good internal
communication, which help to make the internal communication effective, such as
participation, informal communication, and feedback from employees.
According to the characteristics of effective internal communication from the seven domains,
this current study found that creating forums for employees within and between the
departments is a way of organising effective internal communications channels. It can be a
source of innovative ideas and sharing ideas and practices, and it will become a knowledge-
based learning organization (McKenna, 2012). Employee forums can play a part in both
formal and informal communication in order to enable effective internal communication,
which in turn can lead to achieving internal branding outcomes. Additionally, it would be

300
forums for the top management to meet the staff members in order to boost employees’
morale and help set a context for organizational direction.
Finally, this current study sends a message to management about the influence of new
media that has challenged internal communication planners to think differently. The findings
suggest not only traditional internal communication channels but also new media channels
could have a positive impact on employees’ brand outcomes. Communicating face-to-face
with employees is becoming extremely difficult and the reasons given include the fact that
supervisors may be geographically distant from certain types of subordinate (McKenna,
2012). Therefore, usage of new media tools like email, video conferencing on PCs, along
with mobile phones, offering voicemail, text messaging, and PC integration should be
explored to increase two-way communication and to help leaders motivate employees to
develop positive employees’ attitudes in the concept of internal branding.
New media channels in internal communication affect the way people within the organization
communicate with each other. For example, email is using written communication to support
the face-to-face meeting of internal communication and it is devoid of the benefits of the
verbal intonations and emotions gleaned from telephone conversations. Video conferencing
helps people within the company bring colleagues and collaborators closer, although large
distances might separate them, and may fail to satisfy our affiliation needs in the way that
the conventional meeting does (McKenna, 2012). In short, new media channels seemed like
a privilege for employees to meet with their colleagues, supervisors, and leaders.
With the growing importance and power of new media, business leaders will therefore have
no choice but to embrace these new media channels. Successful leaders need to
understand what employees say about service issues through new media channels that can
affect perceptions of the corporate brand and they can help employees stop problems before
they occur. Therefore, leaders who are yet to get into the new media channels will need to
quickly upgrade their skills. This current study sends a message to management about the

301
development of new media communication skills in their business leaders as an important
factor in creating effective internal communication as part of fostering employees’ brand
outcomes in the concept of internal branding.
Part 3 (Section 8.7)
8.7 Limitations and Future Research Directions
For the purpose of this current study, the communication with subordinates sub scale was
eliminated from the study because the participants of this thesis are those in the employees-
customer interface who are not supervisory personnel and thus, do not have subordinates.
However, future research should improve some measurements of this model such as
relations with subordinates because, in the case of the hotel industry, adding relation with
subordinates to the internal communication measurements may be more appropriate for
internal branding concept. These will make them a better fit to the hotel business.
This current study focuses on the hotel industry, which covers both high and low ranking
hotels. Future research may replicate and investigate the study of these two types and see
whether similar results occur in areas such as the hospital industry, health care, financial
services, and tourism.
As this thesis investigates the internal communication in seven domains, it has asked all the
respondents of both high and low ranking hotels to give their comments regarding those
domains. Some of the respondents, especially those who are employees with less than two
years’ service, reveal that it is rather difficult for them to recall their comments towards seven
domains of internal communication. They may guess their answers and the domain of
internal communication from these employees may not project their true decisions and
comments. Although the number of these employees is not high, they create some impact
on the study’s analysis. For future research, this thesis would recommend combining the
survey data with actual employee data in the hotel. This is to check the answers of these

302
respondents against the actual data, such as behavioural consequences. It can be applied
to the business of which employee data are kept from time to time.
Another aspect that needs to be examined is the number of internal communication domains
in the internal branding concept, especially domains about cultural factors in internal
communication in a developing country context. According Bakar & Mustaffa (2013), internal
communication theories are not universal that they have been influenced by national culture.
According to Bakar & Mustaffa (2013), national cultural factors are the significant factors that
have influence on approaches to business leaders who use internal communication
approaches to marketing implementations in the developing country contexts, both external
communication to their customers and internal communication to their employees. The
knowledge of national culture in internal communication approaches can help their business
leaders understand the whole picture about how overall internal communication
implementations might be effective. Future research of the internal communication
constructs can contribute a great deal to this debate about national culture with internal
communication strategies in the developing country contexts by conducting both qualitative
studies and quantitative studies. According to the study of Tsui (2004), using a qualitative
approach can help researchers analyse the role of national culture with management
theories in the developing country contexts, with cultural roots drastically different from
Western cultures in the developed countries. Therefore, future research should conduct
some qualitative studies prior to the main surveys and seek information about the national
culture with internal communication that employees really consider and which satisfies them
according to the main survey. Any other statistical techniques rather than structural equation
models may be applied to see whether any nonlinear relationships occur.

303
Appendix A
Appendix for Chapter 5
Appendix 5.1 : Original Items Used to Measure Internal Communication Satisfaction
Communication Climate
Item Original Item Reference Items used in the questionnaire
1 Extent to which the organization’s communication motivates and stimulates an enthusiasm for meeting its goals
Downs & Hazen ,1977 I am satisfied that this hotel’s communication motivates and stimulates an enthusiasm for meeting its goals.
2 Extent to which the people in my organization have great ability as communicators
Downs & Hazen ,1977 I am satisfied that the people in this hotel have great ability as communicators.
3 Extent to which the organization’s communication makes me identify with it or feel a vital part of it
Downs & Hazen ,1977 I am satisfied that this hotel’s communication makes me identify with it or feel a vital part of it.
4 Extent to which I receive in time the information needed to do my job
Downs & Hazen ,1977 I am satisfied that I receive in time the information needed to do my job.
5 Extent to which conflicts are handled appropriately through proper communication channels
Downs & Hazen ,1977 I am satisfied that conflicts are handled appropriately through proper communication channels.
6 Generally speaking, everyone at [name organization] is honest with one another
Bartels et al. 2006 Generally speaking, everyone at this hotel is honest with one another
7 If I talk with colleagues at [name organization], I feel I am being taken seriously'
Bartels et al. 2006 If I talk with colleagues at this hotel, I feel I am being taken seriously
8 Colleagues at [name organization] genuinely listen to me when I say something
Bartels et al. 2006 Colleagues at this hotel genuinely listen to me when I say something
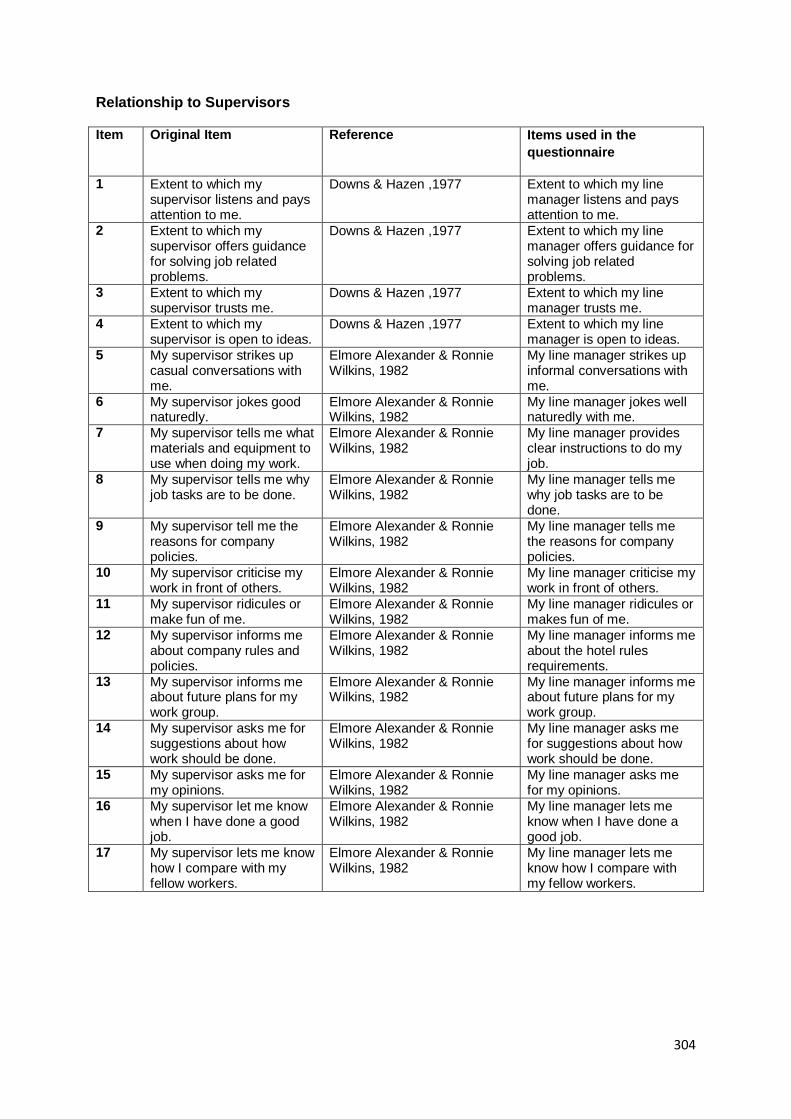
304
Relationship to Supervisors
Item Original Item Reference Items used in the
questionnaire
1 Extent to which my supervisor listens and pays attention to me.
Downs & Hazen ,1977 Extent to which my line manager listens and pays attention to me.
2 Extent to which my supervisor offers guidance for solving job related problems.
Downs & Hazen ,1977 Extent to which my line manager offers guidance for solving job related problems.
3 Extent to which my supervisor trusts me.
Downs & Hazen ,1977 Extent to which my line manager trusts me.
4 Extent to which my supervisor is open to ideas.
Downs & Hazen ,1977 Extent to which my line manager is open to ideas.
5 My supervisor strikes up casual conversations with me.
Elmore Alexander & Ronnie Wilkins, 1982
My line manager strikes up informal conversations with me.
6 My supervisor jokes good naturedly.
Elmore Alexander & Ronnie Wilkins, 1982
My line manager jokes well naturedly with me.
7 My supervisor tells me what materials and equipment to use when doing my work.
Elmore Alexander & Ronnie Wilkins, 1982
My line manager provides clear instructions to do my job.
8 My supervisor tells me why job tasks are to be done.
Elmore Alexander & Ronnie Wilkins, 1982
My line manager tells me why job tasks are to be done.
9 My supervisor tell me the reasons for company policies.
Elmore Alexander & Ronnie Wilkins, 1982
My line manager tells me the reasons for company policies.
10 My supervisor criticise my work in front of others.
Elmore Alexander & Ronnie Wilkins, 1982
My line manager criticise my work in front of others.
11 My supervisor ridicules or make fun of me.
Elmore Alexander & Ronnie Wilkins, 1982
My line manager ridicules or makes fun of me.
12 My supervisor informs me about company rules and policies.
Elmore Alexander & Ronnie Wilkins, 1982
My line manager informs me about the hotel rules requirements.
13 My supervisor informs me about future plans for my work group.
Elmore Alexander & Ronnie Wilkins, 1982
My line manager informs me about future plans for my work group.
14 My supervisor asks me for suggestions about how work should be done.
Elmore Alexander & Ronnie Wilkins, 1982
My line manager asks me for suggestions about how work should be done.
15 My supervisor asks me for my opinions.
Elmore Alexander & Ronnie Wilkins, 1982
My line manager asks me for my opinions.
16 My supervisor let me know when I have done a good job.
Elmore Alexander & Ronnie Wilkins, 1982
My line manager lets me know when I have done a good job.
17 My supervisor lets me know how I compare with my fellow workers.
Elmore Alexander & Ronnie Wilkins, 1982
My line manager lets me know how I compare with my fellow workers.
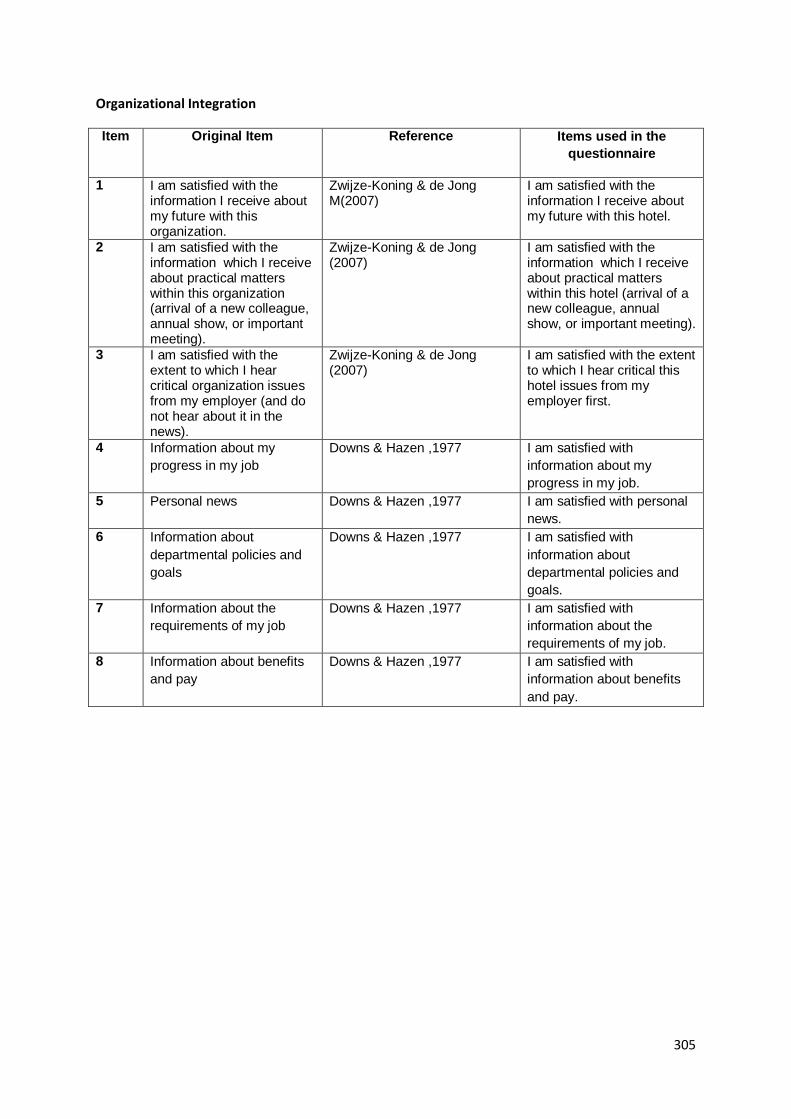
305
Organizational Integration
Item Original Item Reference Items used in the
questionnaire
1 I am satisfied with the information I receive about my future with this organization.
Zwijze-Koning & de Jong M(2007)
I am satisfied with the information I receive about my future with this hotel.
2 I am satisfied with the information which I receive about practical matters within this organization (arrival of a new colleague, annual show, or important meeting).
Zwijze-Koning & de Jong (2007)
I am satisfied with the information which I receive about practical matters within this hotel (arrival of a new colleague, annual show, or important meeting).
3 I am satisfied with the extent to which I hear critical organization issues from my employer (and do not hear about it in the news).
Zwijze-Koning & de Jong (2007)
I am satisfied with the extent to which I hear critical this hotel issues from my employer first.
4 Information about my
progress in my job
Downs & Hazen ,1977 I am satisfied with
information about my
progress in my job.
5 Personal news Downs & Hazen ,1977 I am satisfied with personal
news.
6 Information about
departmental policies and
goals
Downs & Hazen ,1977 I am satisfied with
information about
departmental policies and
goals.
7 Information about the
requirements of my job
Downs & Hazen ,1977 I am satisfied with
information about the
requirements of my job.
8 Information about benefits
and pay
Downs & Hazen ,1977 I am satisfied with
information about benefits
and pay.

306
Media quality
Item Original Item Reference Items used in the
questionnaire
1 Extent to which the organization's communications are interesting and helpful.
Downs & Hazen ,1977 Extent to which the organization's communications are interesting and helpful.
2 Extent to which our meetings are well organized.
Downs & Hazen ,1977 Extent to which our meetings are well organized.
3 Extent to which written directives and reports are clear and concise.
Downs & Hazen ,1977 Extent to which written directives and reports are clear and concise.
4 Extent to which the attitudes toward communication in the organization are basically healthy.
Downs & Hazen ,1977 Extent to which the attitudes toward communication in the organization are basically healthy.
5 Extent to which the amount of communication in the organization is about right.
Downs & Hazen ,1977 Extent to which the amount of communication in the organization is about right.
6 The amount of information I get by means of the mailbox is about right.
Zwijze-Koning & de Jong (2007)
The amount of information I get from this hotel by e-mail is about right.
7 Communication by means of e-mail works well within this organization.
Zwijze-Koning & de Jong (2007)
Communication by means of e-mail works well within this hotel.
8 In meetings I always hear about the latest practical and organization issues.
Zwijze-Koning & de Jong (2007)
In meetings I always hear about the latest practical and organization issues.
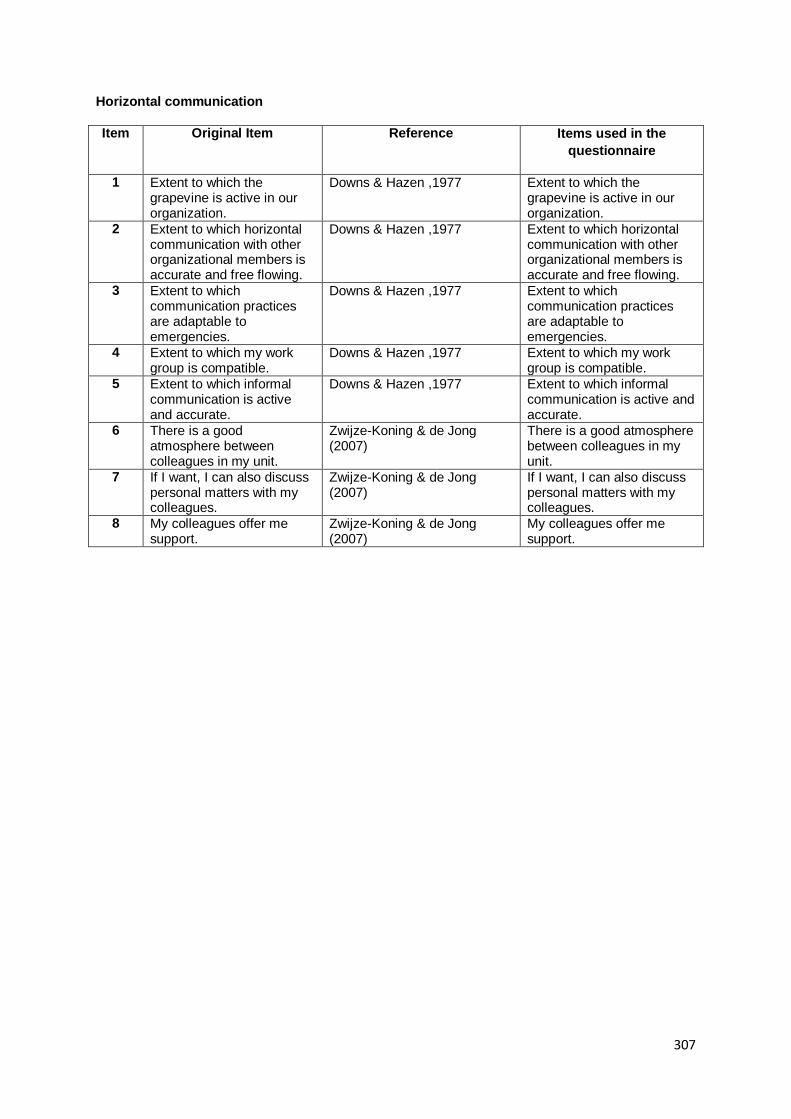
307
Horizontal communication
Item Original Item Reference Items used in the
questionnaire
1 Extent to which the grapevine is active in our organization.
Downs & Hazen ,1977 Extent to which the grapevine is active in our organization.
2 Extent to which horizontal communication with other organizational members is accurate and free flowing.
Downs & Hazen ,1977 Extent to which horizontal communication with other organizational members is accurate and free flowing.
3 Extent to which communication practices are adaptable to emergencies.
Downs & Hazen ,1977 Extent to which communication practices are adaptable to emergencies.
4 Extent to which my work group is compatible.
Downs & Hazen ,1977 Extent to which my work group is compatible.
5 Extent to which informal communication is active and accurate.
Downs & Hazen ,1977 Extent to which informal communication is active and accurate.
6 There is a good atmosphere between colleagues in my unit.
Zwijze-Koning & de Jong (2007)
There is a good atmosphere between colleagues in my unit.
7 If I want, I can also discuss personal matters with my colleagues.
Zwijze-Koning & de Jong (2007)
If I want, I can also discuss personal matters with my colleagues.
8 My colleagues offer me support.
Zwijze-Koning & de Jong (2007)
My colleagues offer me support.

308
Organisational perspective
Item Original Item Reference Items used in the
questionnaire
1 Information about
organizational policies
and goals
Downs & Hazen ,1977 I am satisfied with information about this hotel policies and goals.
2 Information about government action affecting my organization
Downs & Hazen ,1977 I am satisfied with information about government policies and regulations affecting this hotel.
3 Information about changes in our organization
Downs & Hazen ,1977 I am satisfied with information about changes in our organization.
4 Information about our organization's financial standing
Downs & Hazen ,1977 I am satisfied with information about our organization's financial standing.
5 Information about accomplishments and/or failures of the organization
Downs & Hazen ,1977 I am satisfied with information about accomplishments and/or failures of the organization.

309
Personal Feedback
Item Original Item Reference Items used in the
questionnaire
1 Information about how my job compares with others
Downs & Hazen ,1977 I am satisfied with information about how my job compares with others.
2 Information about how I am being judged
Downs & Hazen ,1977 I am satisfied with information about how I am
being judged. 3 Recognition of my efforts Downs & Hazen ,1977 I am satisfied with
recognition of my efforts. 4 Reports on how problems
in my job are being handled Downs & Hazen ,1977 I am satisfied with reports
on how problems in my job are being handled.
5 Extent to which my superiors know and
understand the problems faced by subordinates
Downs & Hazen ,1977 I am satisfied that my superiors know and
understand the problems faced by subordinates.
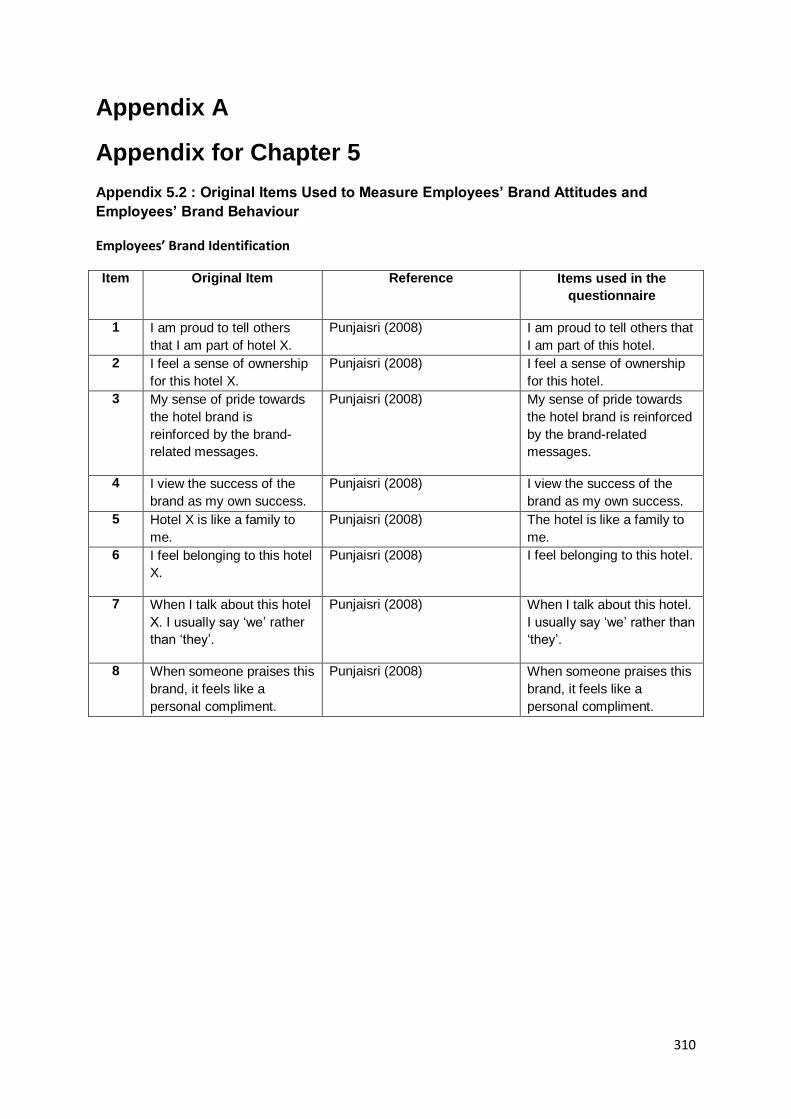
310
Appendix A
Appendix for Chapter 5
Appendix 5.2 : Original Items Used to Measure Employees’ Brand Attitudes and
Employees’ Brand Behaviour
Employees’ Brand Identification
Item Original Item Reference Items used in the
questionnaire
1 I am proud to tell others
that I am part of hotel X.
Punjaisri (2008)
I am proud to tell others that
I am part of this hotel.
2 I feel a sense of ownership
for this hotel X. Punjaisri (2008)
I feel a sense of ownership
for this hotel.
3 My sense of pride towards
the hotel brand is
reinforced by the brand-
related messages.
Punjaisri (2008)
My sense of pride towards
the hotel brand is reinforced
by the brand-related
messages.
4 I view the success of the
brand as my own success.
Punjaisri (2008)
I view the success of the
brand as my own success.
5 Hotel X is like a family to
me.
Punjaisri (2008)
The hotel is like a family to
me.
6 I feel belonging to this hotel
X.
Punjaisri (2008)
I feel belonging to this hotel.
7 When I talk about this hotel
X. I usually say ‘we’ rather
than ‘they’.
Punjaisri (2008)
When I talk about this hotel.
I usually say ‘we’ rather than
‘they’.
8 When someone praises this
brand, it feels like a
personal compliment.
Punjaisri (2008)
When someone praises this
brand, it feels like a
personal compliment.
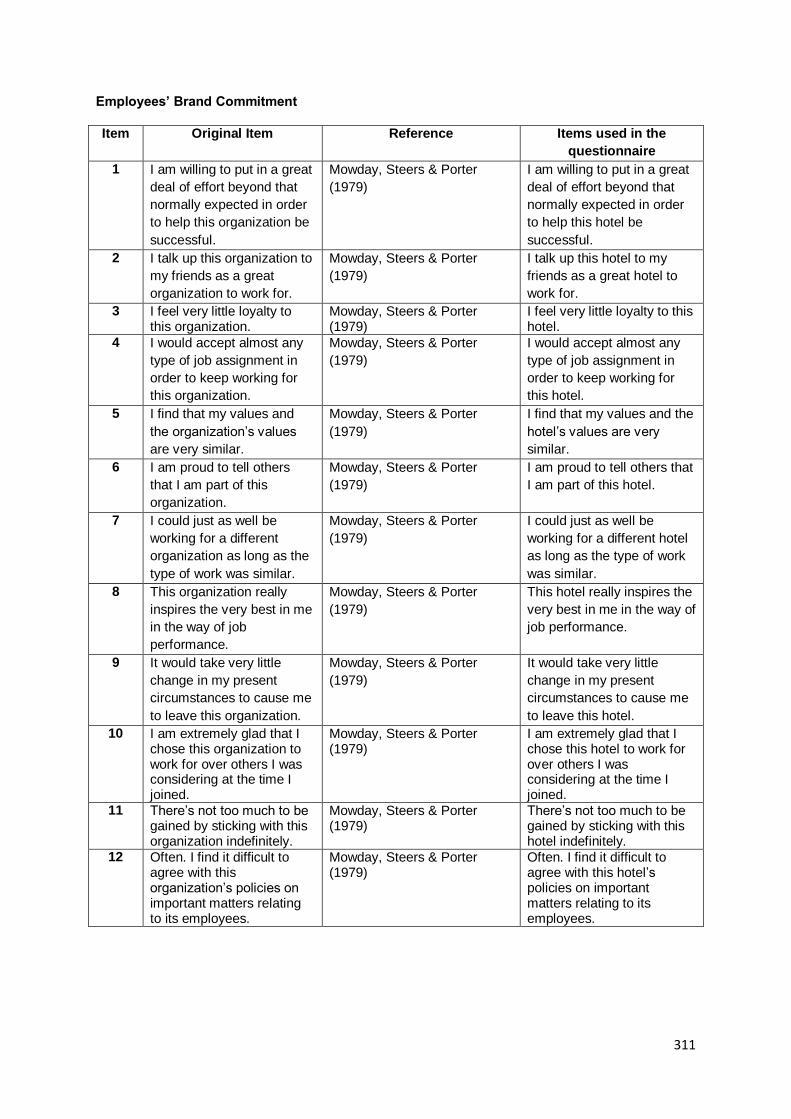
311
Employees’ Brand Commitment
Item Original Item Reference Items used in the
questionnaire
1 I am willing to put in a great
deal of effort beyond that
normally expected in order
to help this organization be
successful.
Mowday, Steers & Porter
(1979)
I am willing to put in a great
deal of effort beyond that
normally expected in order
to help this hotel be
successful.
2 I talk up this organization to
my friends as a great
organization to work for.
Mowday, Steers & Porter
(1979)
I talk up this hotel to my
friends as a great hotel to
work for.
3 I feel very little loyalty to this organization.
Mowday, Steers & Porter (1979)
I feel very little loyalty to this hotel.
4 I would accept almost any
type of job assignment in
order to keep working for
this organization.
Mowday, Steers & Porter
(1979)
I would accept almost any
type of job assignment in
order to keep working for
this hotel.
5 I find that my values and
the organization’s values
are very similar.
Mowday, Steers & Porter
(1979)
I find that my values and the
hotel’s values are very
similar.
6 I am proud to tell others
that I am part of this
organization.
Mowday, Steers & Porter
(1979)
I am proud to tell others that
I am part of this hotel.
7 I could just as well be
working for a different
organization as long as the
type of work was similar.
Mowday, Steers & Porter
(1979)
I could just as well be
working for a different hotel
as long as the type of work
was similar.
8 This organization really
inspires the very best in me
in the way of job
performance.
Mowday, Steers & Porter
(1979)
This hotel really inspires the
very best in me in the way of
job performance.
9 It would take very little
change in my present
circumstances to cause me
to leave this organization.
Mowday, Steers & Porter
(1979)
It would take very little
change in my present
circumstances to cause me
to leave this hotel.
10 I am extremely glad that I chose this organization to work for over others I was considering at the time I joined.
Mowday, Steers & Porter (1979)
I am extremely glad that I chose this hotel to work for over others I was considering at the time I joined.
11 There’s not too much to be gained by sticking with this organization indefinitely.
Mowday, Steers & Porter (1979)
There’s not too much to be gained by sticking with this hotel indefinitely.
12 Often. I find it difficult to agree with this organization’s policies on important matters relating to its employees.
Mowday, Steers & Porter (1979)
Often. I find it difficult to agree with this hotel’s policies on important matters relating to its employees.
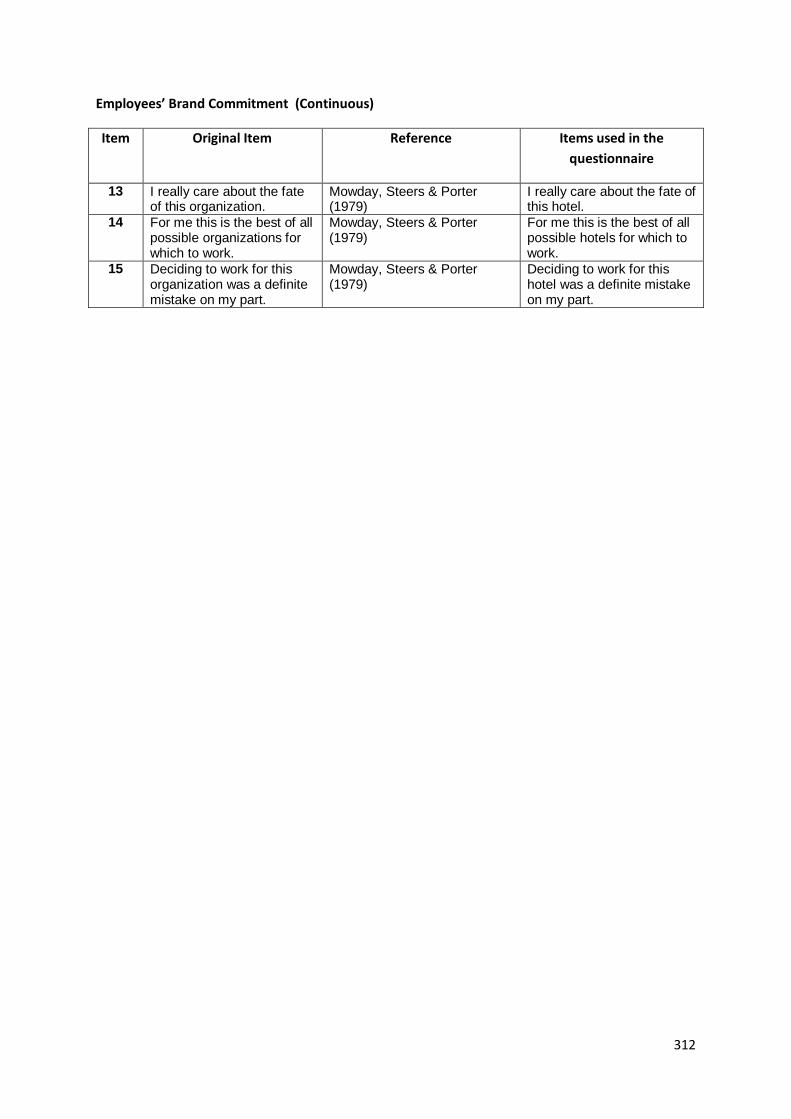
312
Employees’ Brand Commitment (Continuous)
Item Original Item Reference Items used in the
questionnaire
13 I really care about the fate of this organization.
Mowday, Steers & Porter (1979)
I really care about the fate of this hotel.
14 For me this is the best of all possible organizations for which to work.
Mowday, Steers & Porter (1979)
For me this is the best of all possible hotels for which to work.
15 Deciding to work for this organization was a definite mistake on my part.
Mowday, Steers & Porter (1979)
Deciding to work for this hotel was a definite mistake on my part.

313
Employees’ Brand Loyalty
Item Original Item Reference Items used in the
questionnaire
1 I will happy to spend the
rest of my career in this
hotel chain.
Punjaisri (2008)
Chen, & Francesco (2003)
Meyer et al. (1993)
I will happy to spend the rest
of my career in this hotel.
2 I don’t have an intention to
change to another hotel
chain at this moment.
Punjaisri (2008)
I don’t have an intention to
change to another hotel at
this moment.
3 My intention to stay is
driven by the fact that I am
competent in delivering the
brand promise.
Punjaisri (2008)
My intention to stay is driven
by the fact that I am
competent in delivering the
brand promise.
4 I really feel as if this organization’s problems are my own.
Chen, & Francesco (2003) Meyer et al. (1993)
I really feel as if this hotel’s problems are my own.
5 I do not feel a strong sense of belonging to my organization.
Chen, & Francesco (2003) Meyer et al. (1993)
I do not feel a strong sense of belonging to my organization.
6 I do not feel emotionally attached to this organization.
Chen, & Francesco (2003) Meyer et al. (1993)
I do not feel emotionally attached to this hotel.
7 I do not feel like part of the family at my organization.
Chen, & Francesco (2003) Meyer et al. (1993)
I do not feel like part of the family at my hotel.
8 This organization has a great deal of personal meaning for me.
Chen, & Francesco (2003) Meyer et al. (1993)
This hotel has a great deal of personal meaning for me.

314
Employees’ Brand Behaviour
Item Original Item Reference Items used in the
questionnaire
1 I can successfully fulfil the responsibilities specified in my job descriptions underpinned by the brand standards.
Punjaisri (2008) Williams & Anderson (1991)
I can successfully fulfil the
responsibilities specified in
my job descriptions
underpinned by the brand
standards.
2 I always handle customers’ specific requests within the set for the brand standards.
Punjaisri (2008) Williams & Anderson (1991)
I always handle customers’
specific requests within the
set for the brand standards.
3 Sometimes, I neglect some aspects of the job that I am obligated to perform during brand promise delivery.
Punjaisri (2008) Williams & Anderson (1991)
Sometimes, I neglect some
aspects of the job that I am
obligated to perform during
brand promise delivery.
4 The quality level of my services meet formal performance requirements set by the brand standards.
Punjaisri (2008) Williams & Anderson (1991)
The quality level of my
services meet formal
performance requirements
set by the brand standards.
5 I effectively fulfil the promise the brand has with customers based on the brand standards.
Punjaisri (2008) Williams & Anderson (1991)
I effectively fulfil the promise
the brand has with
customers based on the
brand standards.
315
Appendix A
Appendix for Chapter 5
Appendix 5.3 : Question Items for Expert Judgement
_______________________________________________________________________
Project Title: The influence of internal communication on employees’ brand behaviour
1. Research Overview
Brief Overview
Studies indicate that organizations are pointing to effective internal communication as an
influential factor in business success in ensuring the delivery of the brand promise by their
employees, particularly the customer-interface employees. Internal communication makes
employees feel that they are identified with, committed and loyal to the brand, they would
behave in ways that support the brand reality. Therefore, this research’s aim was to
conceptualise and evaluate the role of internal communication in employees’ brand
performance. Furthermore, this study provides empirical evidence to support the link
between the domain of internal communication and employees’ brand attitudes and brand
behaviours.
Target group for data collection
In this research we use the multi-organizational survey of the hotel industry in Thailand as a
single unit of study with quantitative research. Every customer-interface employee in the
hotel industry who delivers on the brand promise was selected to test the hypotheses.
The benefits of this study
The key objective of the study is to propose theoretically and test empirical study in the area
of construct of internal communication and internal branding of employee in the hotel

316
industry. Findings were significant in three areas. First, to conceptualise the domain of
internal communication. Second, to determine the nomological research of internal branding.
Third, to evaluate the moderating of internal communication in developing economy.
2. Main Constructs and definitions
Construct/Variables Definition
Internal Branding
Internal branding represents a firm’s internal communication efforts
to promote both within the firm, a clear view of what makes it
different and desirable as an employer
Internal
Communication
Communicating with people inside an organization and it means to
create and implement behaviour changes
Communication climate The extent to which communication in an organisation motivates and
stimulates workers to meet organisational goals.
Relationship to
superiors
The upward and downward aspects of communicating with superiors.
Organisational
integration
The degree to which individuals receive information about their
immediate work environment.
Media quality The extent to which meetings are well organized and written
directives are short and clear.
Horizontal
communication
The extent to which informal communication is accurate and free
flowing, and includes perceptions of the grapevine.
Organisational
perspective
Information about the organisation as a whole, which includes
notifications about changes, overall policies, and goals of the
organisation.
Personal feedback Information concerning how workers are being judged and how their
performance is being appraised.

317
Question items for expert judgement
Question items
Based on the definition for each dimension, please give the weight of them from 1-5
(based on the relative importance, ‘5’ as the most important) in the “Rank of Importance”
column for each item.
Contextual Information/ Specificity Rank of Importance (1-5)
Communication climate
1. I am satisfied that this hotel’s communication motivates and stimulates an enthusiasm for meeting its goals.
2. I am satisfied that the people in this hotel have great ability as communicators.
3. I am satisfied that this hotel’s communication makes me identify with it or feel a vital part of it.
4. I am satisfied that I receive in time the information needed to do my job.
5. I am satisfied that conflicts are handled appropriately through proper communication channels.
6. Generally speaking, everyone at this hotel is honest with one another.
7. If I talk with colleagues at this hotel, I feel I am being taken seriously'
8. Colleagues at this hotel genuinely listen to me when I say something
Relationship to Supervisor
9. Extent to which my line manager listens and pays attention to me.
10. Extent to which my line manager offers guidance for solving job related problems.
11. Extent to which my line manager trusts me.
12. Extent to which my line manager is open to ideas.
13. My line manager strikes up informal conversations with me.
14. My line manager jokes well naturedly with me.
15. My line manager provides clear instructions to do my job.
16. My line manager tells me why job tasks are to be done.
17. My line manager tells me the reasons for company policies.
18. My line manager criticise my work in front of others.
19. My line manager ridicules or makes fun of me.
20. My line manager informs me about the hotel rules requirements.
21. My line manager informs me about future plans for my work group.
22. My line manager asks me for suggestions about how work should be done.
23. My line manager asks me for my opinions.
24. My line manager lets me know when I have done a good job.
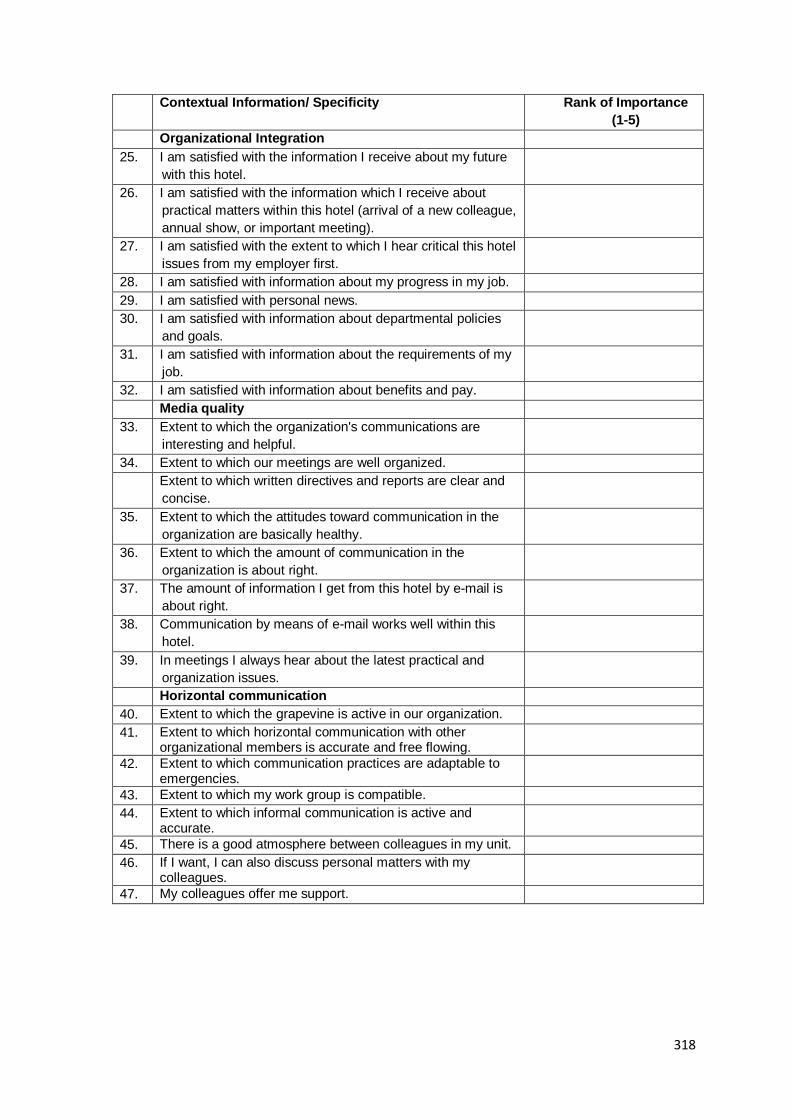
318
Contextual Information/ Specificity Rank of Importance
(1-5)
Organizational Integration
25. I am satisfied with the information I receive about my future
with this hotel.
26. I am satisfied with the information which I receive about
practical matters within this hotel (arrival of a new colleague,
annual show, or important meeting).
27. I am satisfied with the extent to which I hear critical this hotel
issues from my employer first.
28. I am satisfied with information about my progress in my job.
29. I am satisfied with personal news.
30. I am satisfied with information about departmental policies
and goals.
31. I am satisfied with information about the requirements of my
job.
32. I am satisfied with information about benefits and pay.
Media quality
33. Extent to which the organization's communications are
interesting and helpful.
34. Extent to which our meetings are well organized.
Extent to which written directives and reports are clear and
concise.
35. Extent to which the attitudes toward communication in the
organization are basically healthy.
36. Extent to which the amount of communication in the
organization is about right.
37. The amount of information I get from this hotel by e-mail is
about right.
38. Communication by means of e-mail works well within this
hotel.
39. In meetings I always hear about the latest practical and
organization issues.
Horizontal communication
40. Extent to which the grapevine is active in our organization.
41. Extent to which horizontal communication with other organizational members is accurate and free flowing.
42. Extent to which communication practices are adaptable to emergencies.
43. Extent to which my work group is compatible.
44. Extent to which informal communication is active and accurate.
45. There is a good atmosphere between colleagues in my unit.
46. If I want, I can also discuss personal matters with my colleagues.
47. My colleagues offer me support.
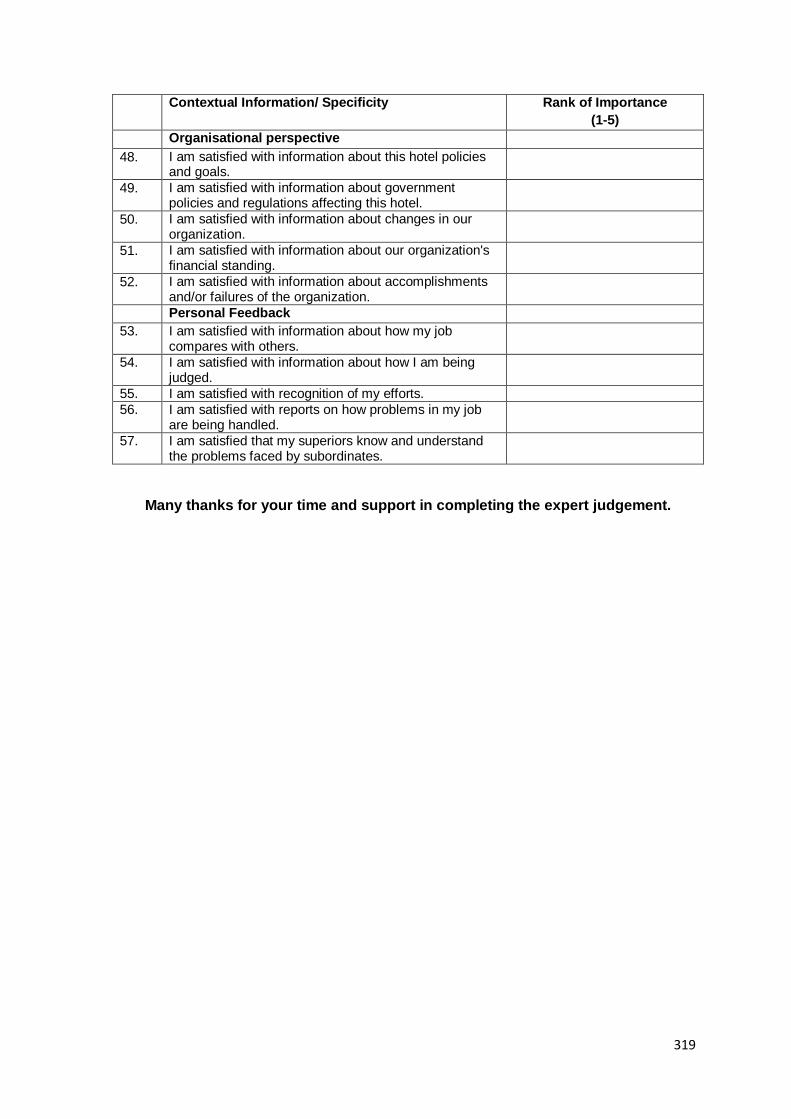
319
Contextual Information/ Specificity Rank of Importance
(1-5)
Organisational perspective
48. I am satisfied with information about this hotel policies and goals.
49. I am satisfied with information about government policies and regulations affecting this hotel.
50. I am satisfied with information about changes in our organization.
51. I am satisfied with information about our organization's financial standing.
52. I am satisfied with information about accomplishments and/or failures of the organization.
Personal Feedback
53. I am satisfied with information about how my job compares with others.
54. I am satisfied with information about how I am being judged.
55. I am satisfied with recognition of my efforts.
56. I am satisfied with reports on how problems in my job are being handled.
57. I am satisfied that my superiors know and understand the problems faced by subordinates.
Many thanks for your time and support in completing the expert judgement.
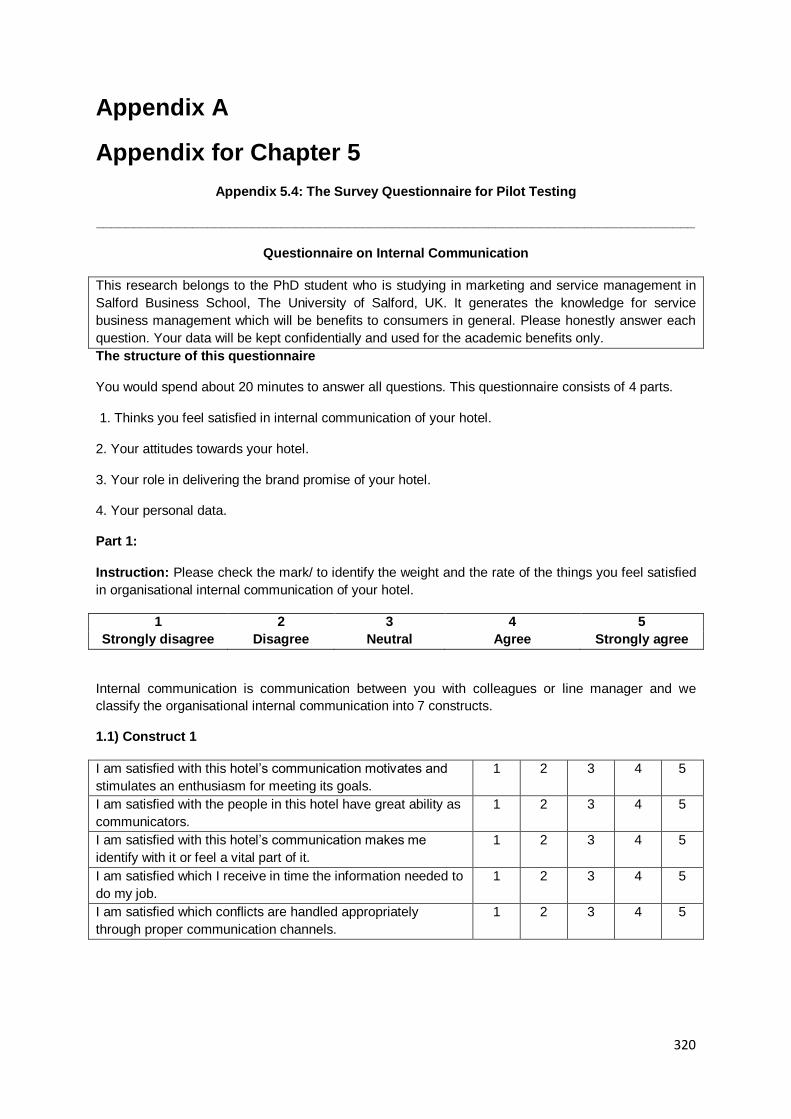
320
Appendix A
Appendix for Chapter 5
Appendix 5.4: The Survey Questionnaire for Pilot Testing
_________________________________________________________________________________
Questionnaire on Internal Communication
This research belongs to the PhD student who is studying in marketing and service management in
Salford Business School, The University of Salford, UK. It generates the knowledge for service
business management which will be benefits to consumers in general. Please honestly answer each
question. Your data will be kept confidentially and used for the academic benefits only.
The structure of this questionnaire
You would spend about 20 minutes to answer all questions. This questionnaire consists of 4 parts.
1. Thinks you feel satisfied in internal communication of your hotel.
2. Your attitudes towards your hotel.
3. Your role in delivering the brand promise of your hotel.
4. Your personal data.
Part 1:
Instruction: Please check the mark/ to identify the weight and the rate of the things you feel satisfied
in organisational internal communication of your hotel.
1 2 3 4 5
Strongly disagree Disagree Neutral Agree Strongly agree
Internal communication is communication between you with colleagues or line manager and we
classify the organisational internal communication into 7 constructs.
1.1) Construct 1
I am satisfied with this hotel’s communication motivates and
stimulates an enthusiasm for meeting its goals.
1 2 3 4 5
I am satisfied with the people in this hotel have great ability as
communicators.
1 2 3 4 5
I am satisfied with this hotel’s communication makes me
identify with it or feel a vital part of it.
1 2 3 4 5
I am satisfied which I receive in time the information needed to
do my job.
1 2 3 4 5
I am satisfied which conflicts are handled appropriately
through proper communication channels.
1 2 3 4 5

321
1.2) Construct 2
My line manager strikes up informal conversations with me. 1 2 3 4 5
My line manager jokes well naturedly with me. 1 2 3 4 5
My line manager provides clear instructions to do my jobs. 1 2 3 4 5
My line manager tells me why job tasks are to be done. 1 2 3 4 5
My line manager tells me the reasons for company policies. 1 2 3 4 5
My line manager critizes my work in front of others. 1 2 3 4 5
My line manager ridicules or makes fun of me. 1 2 3 4 5
My line manager informs me about this hotel rules
requirements.
1 2 3 4 5
My line manager informs me about future plans for my work
group.
1 2 3 4 5
My line manager asks me for suggestions about how work
should be done.
1 2 3 4 5
My line manager asks me for my opinions. 1 2 3 4 5
My line manager lets me know when I have done a good job. 1 2 3 4 5
My line manager lets me know how I compare with my fellow
workers.
1 2 3 4 5
1.3) Construct 3
I am satisfied with the information I receive about my future
with this hotel.
1 2 3 4 5
I am satisfied with the information which I receive about
practical matters within this hotel (e.g. arrival of a new
colleague, annual show, or important meeting).
1 2 3 4 5
I am satisfied with the extent to which I hear critical this hotel
issues from my employer first.
1 2 3 4 5
1.4) Construct 4
The amount of information I get from this hotel by e-mail is
about right.
1 2 3 4 5
Communication by means of e-mail works well within this
hotel.
1 2 3 4 5
In meetings I always hear about the latest practical and
organization issues.
1 2 3 4 5
1.5) Construct 5
There is a good atmosphere between colleagues in my unit. 1 2 3 4 5
If I want, I can also discuss personal matters with my
colleagues.
1 2 3 4 5
My colleagues offer me support. 1 2 3 4 5

322
1.6) Construct 6
I am satisfied with information about this hotel policies and
goals.
1 2 3 4 5
I am satisfied with information about government policies and
regulations affecting this hotel.
1 2 3 4 5
I am satisfied with information about changes in our hotel. 1 2 3 4 5
I am satisfied with information about our hotel's financial
standing.
1 2 3 4 5
I am satisfied with information about accomplishments and/or
failures of this hotel.
1 2 3 4 5
1.7) Construct 7
I am satisfied with information about how my job compares
with others.
1 2 3 4 5
I am satisfied with information about how I am being judged. 1 2 3 4 5
I am satisfied with recognition of my efforts. 1 2 3 4 5
I am satisfied with reports on how problems in my job are
being handled.
1 2 3 4 5
I am satisfied that my superiors know and understand the
problems faced by subordinates.
1 2 3 4 5
Part 2:
Instruction: Please identify your attitudes towards your hotel and we classify the attitudes into 3
constructs. The scores 1 to 5 are ranging from strongly disagree to strongly agree.
1 2 3 4 5
Strongly disagree Disagree Neutral Agree Strongly agree
2.1) Construct 1
I am proud to tell others that I am part of this hotel. 1 2 3 4 5
I feel a sense of ownership for this hotel. 1 2 3 4 5
My sense of pride towards the hotel brand is reinforced by the
brand-related messages.
1 2 3 4 5
I view the success of the brand as my own success. 1 2 3 4 5
The hotel is like a family to me. 1 2 3 4 5
I feel belonging to this hotel. 1 2 3 4 5
When I talk about this hotel. I usually say ‘we’ rather than
‘they’.
1 2 3 4 5
When someone praises this brand, it feels like a personal
compliment.
1 2 3 4 5
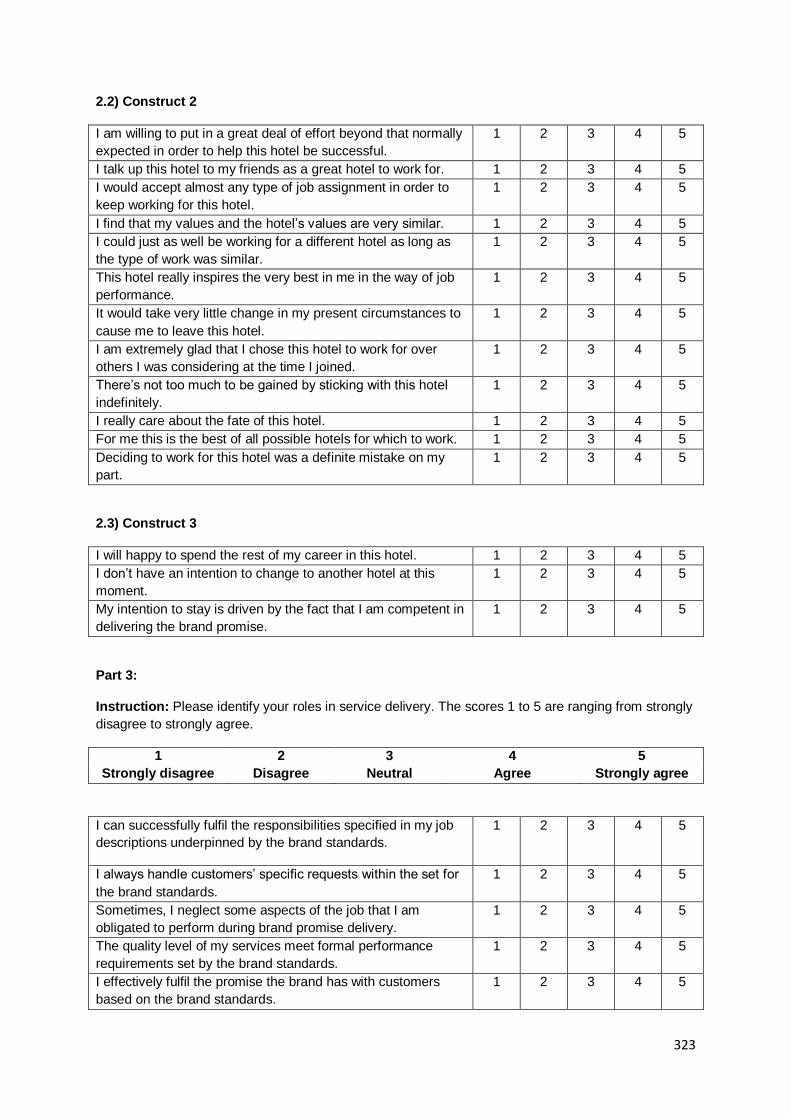
323
2.2) Construct 2
I am willing to put in a great deal of effort beyond that normally
expected in order to help this hotel be successful.
1 2 3 4 5
I talk up this hotel to my friends as a great hotel to work for. 1 2 3 4 5
I would accept almost any type of job assignment in order to
keep working for this hotel.
1 2 3 4 5
I find that my values and the hotel’s values are very similar. 1 2 3 4 5
I could just as well be working for a different hotel as long as
the type of work was similar.
1 2 3 4 5
This hotel really inspires the very best in me in the way of job
performance.
1 2 3 4 5
It would take very little change in my present circumstances to
cause me to leave this hotel.
1 2 3 4 5
I am extremely glad that I chose this hotel to work for over
others I was considering at the time I joined.
1 2 3 4 5
There’s not too much to be gained by sticking with this hotel
indefinitely.
1 2 3 4 5
I really care about the fate of this hotel. 1 2 3 4 5
For me this is the best of all possible hotels for which to work. 1 2 3 4 5
Deciding to work for this hotel was a definite mistake on my
part.
1 2 3 4 5
2.3) Construct 3
I will happy to spend the rest of my career in this hotel. 1 2 3 4 5
I don’t have an intention to change to another hotel at this
moment.
1 2 3 4 5
My intention to stay is driven by the fact that I am competent in
delivering the brand promise.
1 2 3 4 5
Part 3:
Instruction: Please identify your roles in service delivery. The scores 1 to 5 are ranging from strongly
disagree to strongly agree.
1 2 3 4 5
Strongly disagree Disagree Neutral Agree Strongly agree
I can successfully fulfil the responsibilities specified in my job
descriptions underpinned by the brand standards.
1 2 3 4 5
I always handle customers’ specific requests within the set for
the brand standards.
1 2 3 4 5
Sometimes, I neglect some aspects of the job that I am
obligated to perform during brand promise delivery.
1 2 3 4 5
The quality level of my services meet formal performance
requirements set by the brand standards.
1 2 3 4 5
I effectively fulfil the promise the brand has with customers
based on the brand standards.
1 2 3 4 5

324
Part 4:
Instruction: Please provide your personal data.
1.) Age
(a) less than 20 (b) 21-25 (c) 26-30 (d) 31-35 (e) 36-40 (f) 41-45
(g) 46-50 (h) 51-55 (i) 56-60 (j) more than 60
2.) Gender
(a) male (b) female
3.) Department of ………………………………………………
4.) Education
(a) below bachelor’s degree (b) bachelor’s degree
(c) master degree (d) doctoral degree
5.) Length of service
(a) less than 2 years (b) more than 2 years
------------ end --------------

325
Appendix A
Appendix for Chapter 5
Appendix 5.5: The Survey Questionnaire
_________________________________________________________________________________
Employee Survey
We are investigating the types and impact of organizational internal communication in a rage of hotels
across Thailand as part of a doctoral research project (PhD) in marketing and service management in
Salford Business School, The University of Salford, UK. Please honestly answer each question. Your
data will be kept strictly confidential, anonymous and summary results only used to inform academic
knowledge and management practice.
The structure of this questionnaire
It will take approximately 20 minutes to answer all questions. This questionnaire consists of 4 parts.
1. Your thoughts on the internal communication practice in your hotel.
2. Your attitudes towards your hotel.
3. Your role in delivering the brand promise of your hotel.
4. Your personal data.
Part 1:
Instruction: Please circle the number to identify the extent to which you feel satisfied about the
following statement about your hotel.
1 2 3 4 5
Strongly disagree Disagree I don’t have an
opinion on
this.
Agree Strongly agree
Organisational internal communication is communication between you with colleagues or line
manager.
1.1) Motivation
I am satisfied that this hotel’s communication motivates and
stimulates an enthusiasm for meeting its goals.
1 2 3 4 5
I am satisfied that the people in this hotel have great ability as
communicators.
1 2 3 4 5
I am satisfied that this hotel’s communication makes me
identify with it or feel a vital part of it.
1 2 3 4 5
I am satisfied that I receive in time the information needed to
do my job.
1 2 3 4 5
I am satisfied that conflicts are handled appropriately through
proper communication channels.
1 2 3 4 5
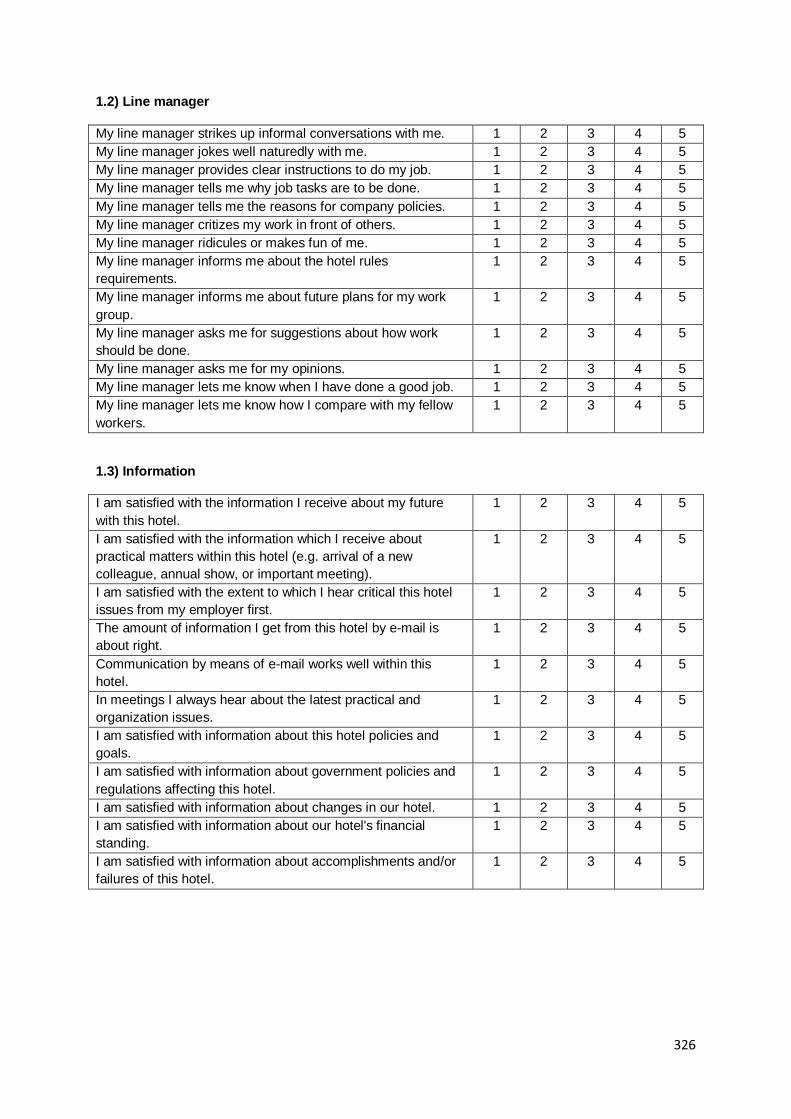
326
1.2) Line manager
My line manager strikes up informal conversations with me. 1 2 3 4 5
My line manager jokes well naturedly with me. 1 2 3 4 5
My line manager provides clear instructions to do my job. 1 2 3 4 5
My line manager tells me why job tasks are to be done. 1 2 3 4 5
My line manager tells me the reasons for company policies. 1 2 3 4 5
My line manager critizes my work in front of others. 1 2 3 4 5
My line manager ridicules or makes fun of me. 1 2 3 4 5
My line manager informs me about the hotel rules
requirements.
1 2 3 4 5
My line manager informs me about future plans for my work
group.
1 2 3 4 5
My line manager asks me for suggestions about how work
should be done.
1 2 3 4 5
My line manager asks me for my opinions. 1 2 3 4 5
My line manager lets me know when I have done a good job. 1 2 3 4 5
My line manager lets me know how I compare with my fellow
workers.
1 2 3 4 5
1.3) Information
I am satisfied with the information I receive about my future
with this hotel.
1 2 3 4 5
I am satisfied with the information which I receive about
practical matters within this hotel (e.g. arrival of a new
colleague, annual show, or important meeting).
1 2 3 4 5
I am satisfied with the extent to which I hear critical this hotel
issues from my employer first.
1 2 3 4 5
The amount of information I get from this hotel by e-mail is
about right.
1 2 3 4 5
Communication by means of e-mail works well within this
hotel.
1 2 3 4 5
In meetings I always hear about the latest practical and
organization issues.
1 2 3 4 5
I am satisfied with information about this hotel policies and
goals.
1 2 3 4 5
I am satisfied with information about government policies and
regulations affecting this hotel.
1 2 3 4 5
I am satisfied with information about changes in our hotel. 1 2 3 4 5
I am satisfied with information about our hotel's financial
standing.
1 2 3 4 5
I am satisfied with information about accomplishments and/or
failures of this hotel.
1 2 3 4 5

327
1.4) Colleagues
There is a good atmosphere between colleagues in my unit. 1 2 3 4 5
If I want, I can also discuss personal matters with my
colleagues.
1 2 3 4 5
My colleagues offer me support. 1 2 3 4 5
1.5) Performance
I am satisfied with information about how my job compares
with others.
1 2 3 4 5
I am satisfied with information about how I am being judged. 1 2 3 4 5
I am satisfied with recognition of my efforts. 1 2 3 4 5
I am satisfied with reports on how problems in my job are
being handled.
1 2 3 4 5
I am satisfied that my superiors know and understand the
problems faced by subordinates.
1 2 3 4 5
Part 2:
Instruction: Please identify your attitudes towards your hotel. The scores 1 to 5 are ranging from
strongly disagree to strongly agree.
1 2 3 4 5
Strongly disagree Disagree I don’t have an
opinion on
this.
Agree Strongly agree
I am proud to tell others that I am part of this hotel. 1 2 3 4 5
I feel a sense of ownership for this hotel. 1 2 3 4 5
My sense of pride towards the hotel brand is reinforced by the
brand-related messages.
1 2 3 4 5
I view the success of the brand as my own success. 1 2 3 4 5
The hotel is like a family to me. 1 2 3 4 5
I feel belonging to this hotel. 1 2 3 4 5
When I talk about this hotel. I usually say ‘we’ rather than
‘they’.
1 2 3 4 5
When someone praises this brand, it feels like a personal
compliment.
1 2 3 4 5
I am willing to put in a great deal of effort beyond that normally
expected in order to help this hotel be successful.
1 2 3 4 5
I talk up this hotel to my friends as a great hotel to work for. 1 2 3 4 5
I would accept almost any type of job assignment in order to
keep working for this hotel.
1 2 3 4 5
I find that my values and the hotel’s values are very similar. 1 2 3 4 5
I could just as well be working for a different hotel as long as
the type of work was similar.
1 2 3 4 5

328
This hotel really inspires the very best in me in the way of job
performance.
1 2 3 4 5
It would take very little change in my present circumstances to
cause me to leave this hotel.
1 2 3 4 5
I am extremely glad that I chose this hotel to work for over
others I was considering at the time I joined.
1 2 3 4 5
There’s not too much to be gained by sticking with this hotel
indefinitely.
1 2 3 4 5
I really care about the fate of this hotel. 1 2 3 4 5
For me this is the best of all possible hotels for which to work. 1 2 3 4 5
Deciding to work for this hotel was a definite mistake on my
part.
1 2 3 4 5
I will happy to spend the rest of my career in this hotel. 1 2 3 4 5
I don’t have an intention to change to another hotel at this
moment.
1 2 3 4 5
My intention to stay is driven by the fact that I am competent in
delivering the brand promise.
1 2 3 4 5
Part 3:
Instruction: Please identify your roles in the service delivery of this hotel. The scores 1 to 5 are
ranging from strongly disagree to strongly agree.
1 2 3 4 5
Strongly disagree Disagree I don’t have an
opinion on
this.
Agree Strongly agree
I can successfully fulfil the responsibilities specified in my job
descriptions underpinned by the brand standards.
1 2 3 4 5
I always handle customers’ specific requests within the set for
the brand standards.
1 2 3 4 5
Sometimes, I neglect some aspects of the job that I am
obligated to perform during brand promise delivery.
1 2 3 4 5
The quality level of my services meet formal performance
requirements set by the brand standards.
1 2 3 4 5
I effectively fulfil the promise the brand has with customers
based on the brand standards.
1 2 3 4 5
Part 4:
Instruction: Please provide your personal data.
1.) Age
(a) less than 20 (b) 21-25 (c) 26-30 (d) 31-35 (e) 36-40 (f) 41-45
(g) 46-50 (h) 51-55 (i) 56-60 (j) more than 60

329
2.) Gender
(a) male (b) female
3.) Department of ………………………………………………
4.) Education
(a) below bachelor’s degree (b) bachelor’s degree
(c) master degree (d) doctoral degree
5.) Length of service
(a) less than 2 years (b) more than 2 years
------------ end --------------

330
Appendix B
Appendix for Chapter 6
Appendix 6.1
Internal Communication Satisfaction Measures Purification
6.1 Introduction
This Appendix reports purification of internal communication satisfaction. Internal
communication satisfaction measures include Communication climate (CC); Relationship to
Supervisory (Relation); Organization integration (OI); Media quality (MQ); Horizontal
communication (HC); Organisational perspective (OP); and Personal feedback (PF).
These were conceptualised in seven independent unidimensional constructs (See Chapter
3). Attribute measures of CC, Relation, OI, MQ, HC, OP, and PF included 5, 13, 3, 3, 3, 5,
and 5 identically-worded items that referred to CC, Relation, OI, MQ, HC, OP, and PF as per
operational definitions provided in Chapter 4. For ease of reference, these definitions are
reported below.
Abbreviation
Construct Operational Definition
CC Communication climate
The extent to which communication in an organisation motivates and stimulates workers to meet organisational goals (Downs & Hazen, 1977)
Relation Relationship to superiors
The upward and downward aspects of communicating with superiors (Downs & Hazen, 1977)
OI Organisational integration
The degree to which individuals receive information about their immediate work environment (Downs & Hazen, 1977)
MQ Media quality The extent to which meetings are well organized and written directives are short and clear (Downs & Hazen, 1977)
HC Horizontal communication
The extent to which informal communication is accurate and free flowing, and includes perceptions of the grapevine (Downs & Hazen, 1977)
OP Organisational perspective
Information about the organisation as a whole, which includes notifications about changes, overall policies, and goals of the organisation (Downs & Hazen, 1977)
PF Personal feedback Information concerning how workers are being judged and how their performance is being appraised (Downs & Hazen, 1977)
Measure purification process was described in Chapter 5, and consisted of internal
consistency and reliability assessment; unidimensionality exploration and normality
assessment steps were first conducted on customer-interfaced employees of both high and

331
low ranking hotels survey data (High n = 606; Low n = 268) and subsequently, on a pooled
sample (n = 874). These steps are reported in this Appendix for CC, Relation, OI, MQ, HC,
OP, and PF scales respectively.
6.2 Communication Climate Scale (CC)
6.2.1 High Ranking Hotels Sample
Internal Consistency and Reliability Assessment
As a first step, items developed to tap the CC construct were subjected to initial Exploratory
Factor Analysis (PCA) method. Before proceeding with PCA, the items were assessed for
reliability and suitability for factor analysis through examination of inter-item correlations,
item-to-total correlations and communality values of 0.2 or 0.3 for inter-item correlations
(Everitt & Skrondal, 2002), 0.3 for item-to-total correlations (Nunnally & Bernstein, 1994) and
0.4 for communality (Ford, MacCallum, & Tait, 1986). Parallel analysis (Watkins, 2005)
suggested presence of one component with Eigenvalue exceeding 1, which was consistent
with a priori criteria of communication climate dimensionality derived conceptually. Table
A6.1-1 shows inter-item correlation and Table A6.1-2 shows communalities.
Table A6.1-1: CC Scale (High Ranking Hotels) Inter-Item Correlations
mot01 mot02 mot03 mot04 mot05
Correlation
mot01 1.000 0.505 0.661 0.500 .0535
mot02 0.505 1.000 0.519 0.513 .0337
mot03 0.661 0.519 1.000 0.567 0.479
mot04 0.500 0.513 0.567 1.000 0.481
mot05 0.535 0.337 0.479 0.481 1.000

332
Table A6.1-2: Communication Climate Scale (High Ranking Hotels) Communalities
Items Extraction
mot01 I am satisfied with this hotel’s communication motivates and
stimulates an enthusiasm for meeting its goals.
.686
mot02 I am satisfied with the people in this hotel have great ability as
communicators.
.533
mot03 I am satisfied with this hotel’s communication makes me identify with it
or feel a vital part of it.
.700
mot04 I am satisfied which I receive in time the information needed to do my
job.
.616
mot05 I am satisfied which conflicts are handled appropriately through proper
communication channels.
.513
All items had acceptable corrected item-total correlations ranging between 0.566 and 0.714.
Table A6.1-3: Communication Climate Scale (High Ranking Hotels) Items Statistics
Item Mean Std. Dev. Corrected
Item-Total
Correlation
Squared
Multiple
Correlation
Cronbach’s
Alpha if Item
Deleted
mot01 3.95 0.885 0.703 0.526 0.787
mot02 3.60 0.831 0.577 0.368 0.822
mot03 3.93 0.797 0.714 0.533 0.786
mot04 3.83 0.814 0.648 0.433 0.803
mot05 3.75 0.875 0.566 0.355 0.826
Dimensionality Exploration
PCA of 5 items returned one factor with 60.993% total variance explained. Both Kaiser-
Meyer-Olkin’s (KMO) measure of sampling adequacy and Bartell’s Test of Sphericity
provided strong evidence of data suitability for factor analysis. As detailed in Table A6-4
below, all items had strong factor loadings, above the cut-off point of 0.55 recommended by
Hair, Tatham, Anderson, & Black (2006).
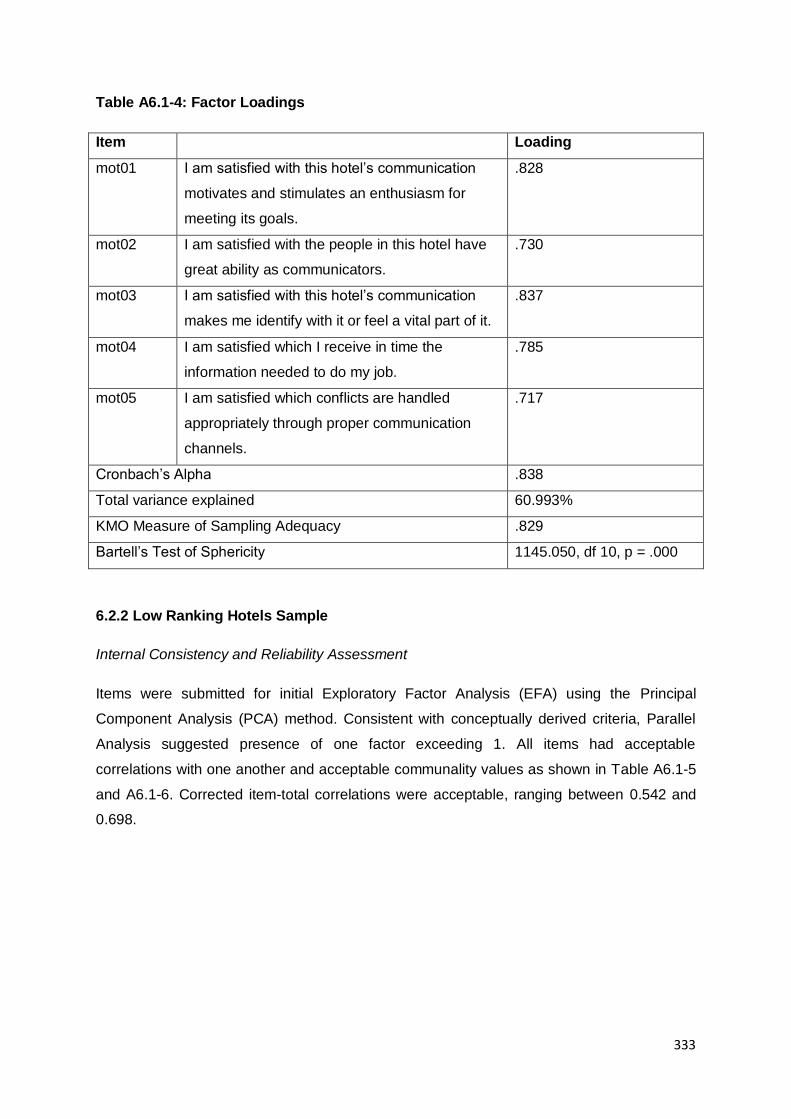
333
Table A6.1-4: Factor Loadings
Item Loading
mot01 I am satisfied with this hotel’s communication
motivates and stimulates an enthusiasm for
meeting its goals.
.828
mot02 I am satisfied with the people in this hotel have
great ability as communicators.
.730
mot03 I am satisfied with this hotel’s communication
makes me identify with it or feel a vital part of it.
.837
mot04 I am satisfied which I receive in time the
information needed to do my job.
.785
mot05 I am satisfied which conflicts are handled
appropriately through proper communication
channels.
.717
Cronbach’s Alpha .838
Total variance explained 60.993%
KMO Measure of Sampling Adequacy .829
Bartell’s Test of Sphericity 1145.050, df 10, p = .000
6.2.2 Low Ranking Hotels Sample
Internal Consistency and Reliability Assessment
Items were submitted for initial Exploratory Factor Analysis (EFA) using the Principal
Component Analysis (PCA) method. Consistent with conceptually derived criteria, Parallel
Analysis suggested presence of one factor exceeding 1. All items had acceptable
correlations with one another and acceptable communality values as shown in Table A6.1-5
and A6.1-6. Corrected item-total correlations were acceptable, ranging between 0.542 and
0.698.
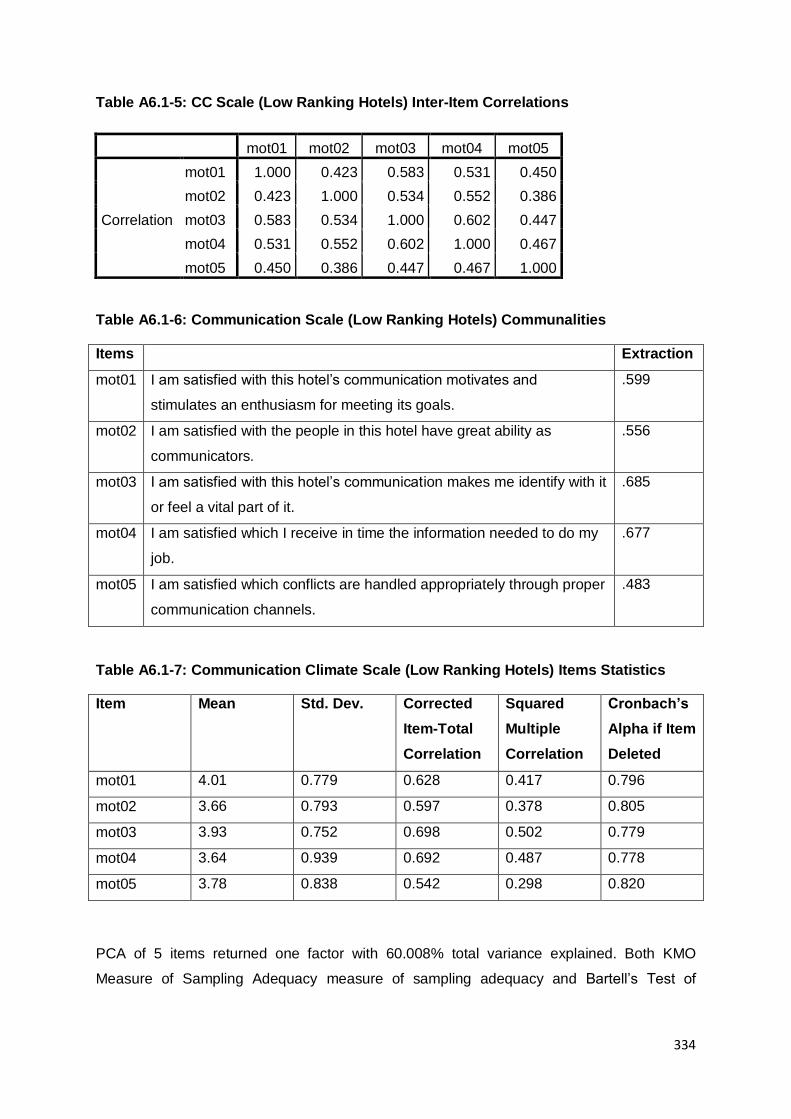
334
Table A6.1-5: CC Scale (Low Ranking Hotels) Inter-Item Correlations
mot01 mot02 mot03 mot04 mot05
Correlation
mot01 1.000 0.423 0.583 0.531 0.450
mot02 0.423 1.000 0.534 0.552 0.386
mot03 0.583 0.534 1.000 0.602 0.447
mot04 0.531 0.552 0.602 1.000 0.467
mot05 0.450 0.386 0.447 0.467 1.000
Table A6.1-6: Communication Scale (Low Ranking Hotels) Communalities
Items Extraction
mot01 I am satisfied with this hotel’s communication motivates and
stimulates an enthusiasm for meeting its goals.
.599
mot02 I am satisfied with the people in this hotel have great ability as
communicators.
.556
mot03 I am satisfied with this hotel’s communication makes me identify with it
or feel a vital part of it.
.685
mot04 I am satisfied which I receive in time the information needed to do my
job.
.677
mot05 I am satisfied which conflicts are handled appropriately through proper
communication channels.
.483
Table A6.1-7: Communication Climate Scale (Low Ranking Hotels) Items Statistics
Item Mean Std. Dev. Corrected
Item-Total
Correlation
Squared
Multiple
Correlation
Cronbach’s
Alpha if Item
Deleted
mot01 4.01 0.779 0.628 0.417 0.796
mot02 3.66 0.793 0.597 0.378 0.805
mot03 3.93 0.752 0.698 0.502 0.779
mot04 3.64 0.939 0.692 0.487 0.778
mot05 3.78 0.838 0.542 0.298 0.820
PCA of 5 items returned one factor with 60.008% total variance explained. Both KMO
Measure of Sampling Adequacy measure of sampling adequacy and Bartell’s Test of
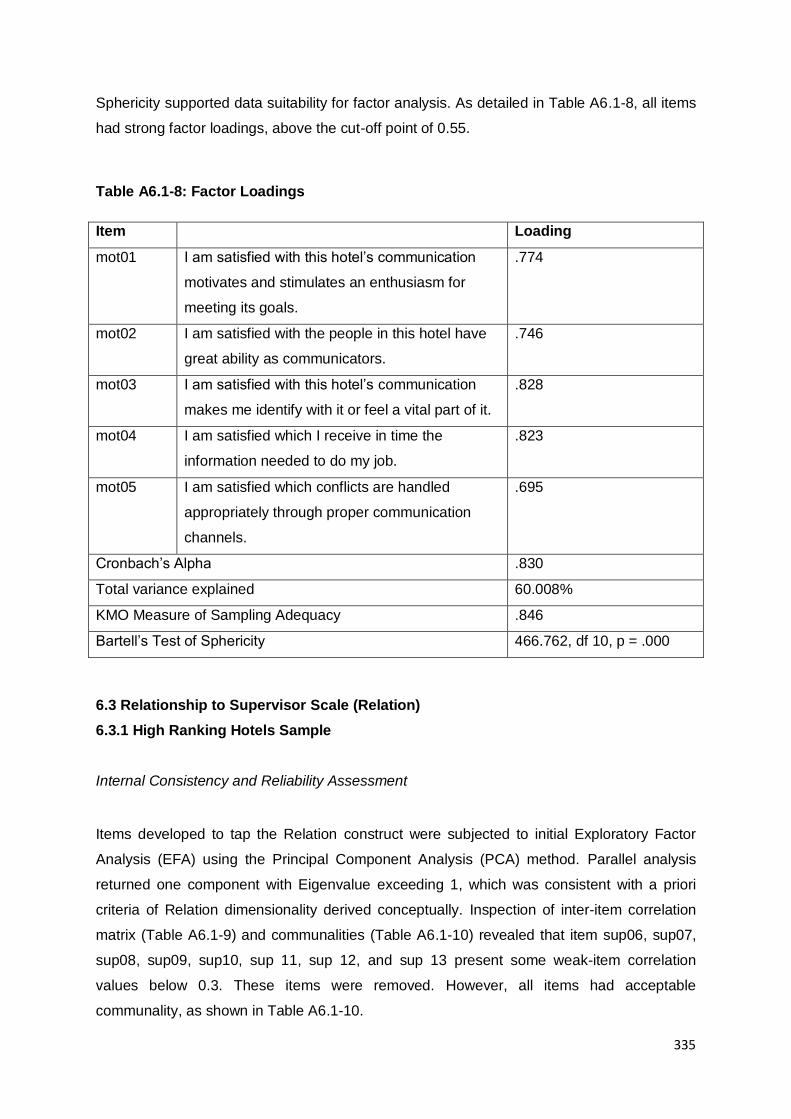
335
Sphericity supported data suitability for factor analysis. As detailed in Table A6.1-8, all items
had strong factor loadings, above the cut-off point of 0.55.
Table A6.1-8: Factor Loadings
Item Loading
mot01 I am satisfied with this hotel’s communication
motivates and stimulates an enthusiasm for
meeting its goals.
.774
mot02 I am satisfied with the people in this hotel have
great ability as communicators.
.746
mot03 I am satisfied with this hotel’s communication
makes me identify with it or feel a vital part of it.
.828
mot04 I am satisfied which I receive in time the
information needed to do my job.
.823
mot05 I am satisfied which conflicts are handled
appropriately through proper communication
channels.
.695
Cronbach’s Alpha .830
Total variance explained 60.008%
KMO Measure of Sampling Adequacy .846
Bartell’s Test of Sphericity 466.762, df 10, p = .000
6.3 Relationship to Supervisor Scale (Relation)
6.3.1 High Ranking Hotels Sample
Internal Consistency and Reliability Assessment
Items developed to tap the Relation construct were subjected to initial Exploratory Factor
Analysis (EFA) using the Principal Component Analysis (PCA) method. Parallel analysis
returned one component with Eigenvalue exceeding 1, which was consistent with a priori
criteria of Relation dimensionality derived conceptually. Inspection of inter-item correlation
matrix (Table A6.1-9) and communalities (Table A6.1-10) revealed that item sup06, sup07,
sup08, sup09, sup10, sup 11, sup 12, and sup 13 present some weak-item correlation
values below 0.3. These items were removed. However, all items had acceptable
communality, as shown in Table A6.1-10.

336
Table A6.1-9: Relation Scale (High Ranking Hotels)
sup01 sup02 sup03 sup04 sup05 sup06 sup07 sup08 sup09 Sup10 Sup11 Sup12 Sup13
sup01 1.000 0.651 0.603 0.587 0.504 -0.192 0.475 0.483 0.513 0.381 0.269 0.396 -0.023
sup02 0.651 1.000 0.466 0.465 0.356 -0.060 0.454 0.374 0.385 0.303 0.323 0.335 0.078
sup03 0.603 0.466 1.000 0.685 0.571 -0.084 0.511 0.549 0.540 0.441 0.269 0.365 -0.043
sup04 0.587 0.465 0.685 1.000 0.623 -0.082 0.515 0.562 0.574 0.492 0.287 0.430 -0.010
sup05 0.504 0.356 0.571 0.623 1.000 -0.104 0.470 0.563 0.487 0.388 0.217 0.405 -0.004
sup06 -0.192 -0.060 -0.084 -0.082 -0.104 1.000 -0.043 -0.010 -0.053 -0.005 0.212 0.012 0.451
sup07 0.475 0.454 0.511 0.515 0.470 -0.043 1.000 0.555 0.461 0.470 0.367 0.378 0.056
sup08 0.483 0.374 0.549 0.562 0.563 -0.010 0.555 1.000 0.581 0.467 0.318 0.436 0.106
sup09 0.513 0.385 0.540 0.574 0.487 -0.053 0.461 0.581 1.000 0.617 0.378 0.492 0.087
Sup10 0.381 0.303 0.441 0.492 0.388 -0.005 0.470 0.467 0.617 1.000 0.527 0.478 0.194
Sup11 0.269 0.323 0.269 0.287 0.217 0.212 0.367 0.318 0.378 0.527 1.000 0.409 0.328
Sup12 0.396 0.335 0.365 0.430 0.405 0.012 0.378 0.436 0.492 0.478 0.409 1.000 0.162
Sup13 -0.023 0.078 -0.043 -0.010 -0.004 0.451 0.056 0.106 0.087 0.194 0.328 0.162 1.000

337
Table A6.1-10: Relation Scale (High Ranking Hotels) Communalities
Items Extraction
sup01 My line manager strikes up informal conversations with me. .629
sup02 My line manager jokes well naturedly with me. .422
sup03 My line manager provides clear instructions to do my jobs. .643
sup04 My line manager tells me why job tasks are to be done. .674
sup05 My line manager tells me the reasons for company policies. .553
sup06 My line manager critizes my work in front of others. .571
sup07 My line manager ridicules or makes fun of me. .520
sup08 My line manager informs me about this hotel rules requirements. .575
sup09 My line manager informs me about future plans for my work group. .601
Sup10 My line manager asks me for suggestions about how work should be
done.
.558
Sup11 My line manager asks me for my opinions. .569
Sup12 My line manager lets me know when I have done a good job. .451
Sup13 My line manager lets me know how I compare with my fellow workers. .652
All remaining items had acceptable corrected item-total correlations ranging between 0.584
and 0.734. Given that removal of these items did not substantially weaken scale reliability as
indicated by Cronbach’s Alpha, these items were removed. Item characteristics are
presented in Table A6.1-11 below.

338
Table A6.1-11: Relation Scale (High Ranking Hotels) Items Statistics
Item Mean Std. Dev. Corrected
Item-Total
Correlation
Squared
Multiple
Correlation
Cronbach’s
Alpha if Item
Deleted
sup01 4.01 0.898 0.734 0.569 0.812
sup02 3.71 0.951 0.584 0.437 0.854
sup03 3.91 0.832 0.718 0.551 0.818
sup04 3.89 0.852 0.730 0.576 0.814
sup05 3.90 0.851 0.616 0.440 0.843
Dimensionality Exploration
PCA of 5 retained items returned one factor with 64.304% total variance explained. Both
Kaiser-Meyer-Olkin’s (KMO) measure of sampling adequacy and Bartell’s Test of Sphericity
provide strong evidence of data suitability for factor analysis. As detailed in Table A6.1-12
below, all items had strong factor loading, above the cut-off point of 0.55 recommended by
(Hair et al., 2006).
Table A6.1-12: Factor Loadings
Item Loading
sup01 My line manager strikes up informal conversations with me.
0.837
sup02 My line manager jokes well naturedly with me. 0.722
sup03 My line manager provides clear instructions to do my jobs.
0.837
sup04 My line manager tells me why job tasks are to be done.
0.846
sup05 My line manager tells me the reasons for company policies.
0.760
Cronbach’s Alpha 0.858
Total variance explained 64.304%
KMO Measure of Sampling Adequacy 0.825
Bartell’s Test of Sphericity 1404.976, df 10, p = 0.000
339
6.3.2 Low Ranking Hotels Sample
Internal Consistency and Reliability Assessment
Items developed to tap the Relation construct were subjected to initial Exploratory Factor
Analysis (EFA) using the Principal Component Analysis (PCA) method. Consistent with
conceptually derived criteria, Parallel Analysis suggested presence of one factor exceeding
1. Inspection of inter-item correlation matrix (Table A6.1-13) revealed that item sup06,
sup08, sup07, sup09, sup10, sup 11, sup 12, and sup 13 presented some weak inter-item
correlation values below 0.3. These items were removed. However, all items had acceptable
communality values, as shown in Table A6.1-14.

340
Table A6.1-13: Relation Scale (Low Ranking Hotels)
sup01 sup02 sup03 sup04 sup05 sup06 sup07 sup08 sup09 Sup10 Sup11 Sup12 Sup13
sup01 1.000 0.707 0.678 0.609 0.556 -0.092 0.545 0.539 0.569 0.434 0.283 0.376 0.013
sup02 0.707 1.000 0.573 0.531 0.477 0.009 0.594 0.512 0.505 0.441 0.423 0.366 0.110
sup03 0.678 0.573 1.000 0.709 0.677 -0.116 0.534 0.571 0.584 0.400 0.286 0.365 -0.005
sup04 0.609 0.531 0.709 1.000 0.740 -0.041 0.571 0.623 0.616 0.442 0.282 0.419 0.014
sup05 0.556 0.477 0.677 0.740 1.000 -0.049 0.508 0.607 0.592 0.490 0.358 0.383 0.012
sup06 -0.092 0.009 -0.116 -0.041 -0.049 1.000 0.015 0.039 -0.100 -0.087 0.057 -0.001 0.515
sup07 0.545 0.594 0.534 0.571 0.508 0.015 1.000 0.705 0.641 0.442 0.371 0.561 0.059
sup08 0.539 0.512 0.571 0.623 0.607 0.039 0.705 1.000 0.645 0.462 0.344 0.458 0.101
sup09 0.569 0.505 0.584 0.616 0.592 -0.100 0.641 0.645 1.000 0.541 0.387 0.416 0.002
Sup10 0.434 0.441 0.400 0.442 0.490 -0.087 0.442 0.462 0.541 1.000 0.580 0.370 0.092
Sup11 0.283 0.423 0.286 0.282 0.358 0.057 0.371 0.344 0.387 0.580 1.000 0.365 0.196
Sup12 0.376 0.366 0.365 0.419 0.383 -0.001 0.561 0.458 0.416 0.370 0.365 1.000 0.141
Sup13 0.013 0.110 -0.005 0.014 0.012 0.515 0.059 0.101 -0.002 0.092 0.196 0.141 1.000
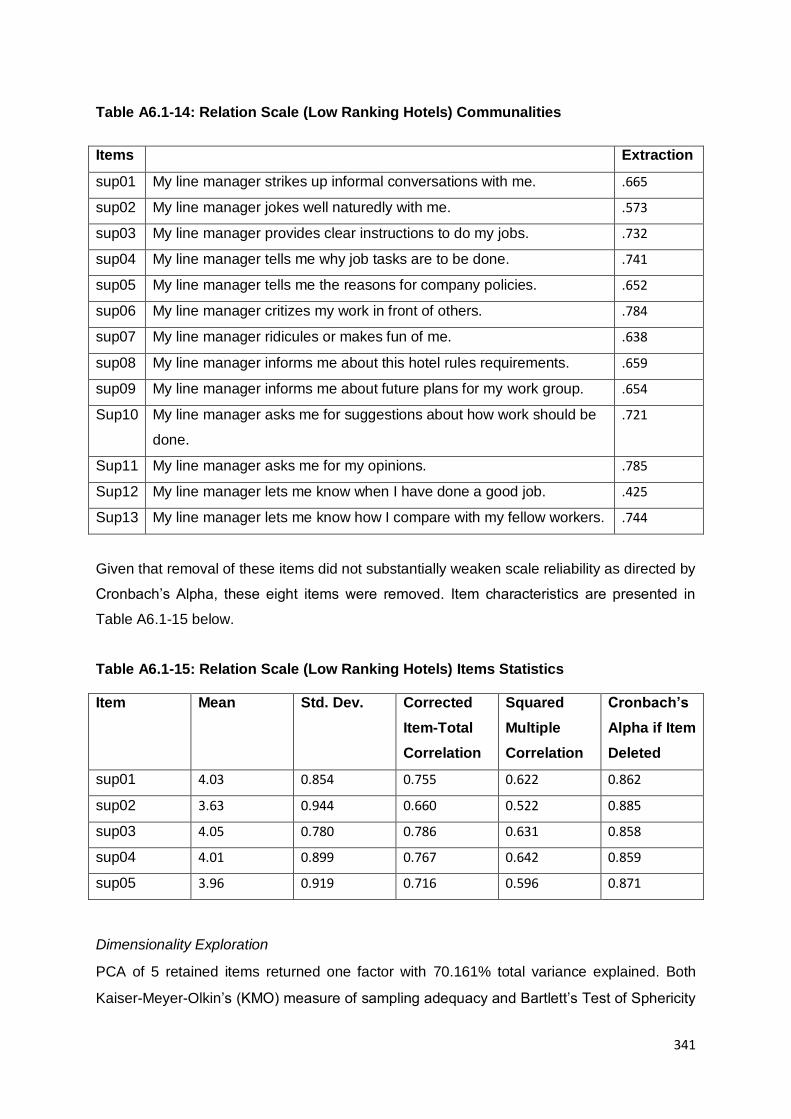
341
Table A6.1-14: Relation Scale (Low Ranking Hotels) Communalities
Items Extraction
sup01 My line manager strikes up informal conversations with me. .665
sup02 My line manager jokes well naturedly with me. .573
sup03 My line manager provides clear instructions to do my jobs. .732
sup04 My line manager tells me why job tasks are to be done. .741
sup05 My line manager tells me the reasons for company policies. .652
sup06 My line manager critizes my work in front of others. .784
sup07 My line manager ridicules or makes fun of me. .638
sup08 My line manager informs me about this hotel rules requirements. .659
sup09 My line manager informs me about future plans for my work group. .654
Sup10 My line manager asks me for suggestions about how work should be
done.
.721
Sup11 My line manager asks me for my opinions. .785
Sup12 My line manager lets me know when I have done a good job. .425
Sup13 My line manager lets me know how I compare with my fellow workers. .744
Given that removal of these items did not substantially weaken scale reliability as directed by
Cronbach’s Alpha, these eight items were removed. Item characteristics are presented in
Table A6.1-15 below.
Table A6.1-15: Relation Scale (Low Ranking Hotels) Items Statistics
Item Mean Std. Dev. Corrected
Item-Total
Correlation
Squared
Multiple
Correlation
Cronbach’s
Alpha if Item
Deleted
sup01 4.03 0.854 0.755 0.622 0.862
sup02 3.63 0.944 0.660 0.522 0.885
sup03 4.05 0.780 0.786 0.631 0.858
sup04 4.01 0.899 0.767 0.642 0.859
sup05 3.96 0.919 0.716 0.596 0.871
Dimensionality Exploration
PCA of 5 retained items returned one factor with 70.161% total variance explained. Both
Kaiser-Meyer-Olkin’s (KMO) measure of sampling adequacy and Bartlett’s Test of Sphericity

342
supported data suitability for factor analysis. As detailed in Table A6.1-16, all items had
strong factor loadings, above the cut-off point of 0.55.
Table A6.1-16: Factor Loadings
Item Loading
sup01 My line manager strikes up informal conversations with me.
.847
sup02 My line manager jokes well naturedly with me. .778
sup03 My line manager provides clear instructions to do my jobs.
.873
sup04 My line manager tells me why job tasks are to be done.
.861
sup05 My line manager tells me the reasons for company policies.
.825
Cronbach’s Alpha .890
Total variance explained 70.161%
KMO Measure of Sampling Adequacy .841
Bartell’s Test of Sphericity 799.051, df 10, p = .000
6.4 Organizational Integration Scale (OI)
6.4.1 High Ranking Hotels Sample
Internal Consistency and Reliability Assessment
Items developed to tap the OI constructs were subjected to initial Exploratory Factor
Analysis (EFA) using the Principal Component Analysis (PCA) method. Parallel analysis
returned one component with Eigenvalue exceeding 1, which was consistent with a priori
criteria of OI dimensionality derived conceptually. All items had acceptable correlations with
one another and acceptable communality values, as shown in Table A6.1-17 and A6.1-18.
Table A6.1-17: OI Scale (High Ranking Hotels Sample) Inter-Item Correlations
inf01 inf02 inf03
Correlation
inf01 1.000 0.653 0.205
inf02 0.653 1.000 0.237
inf03 0.205 0.237 1.000
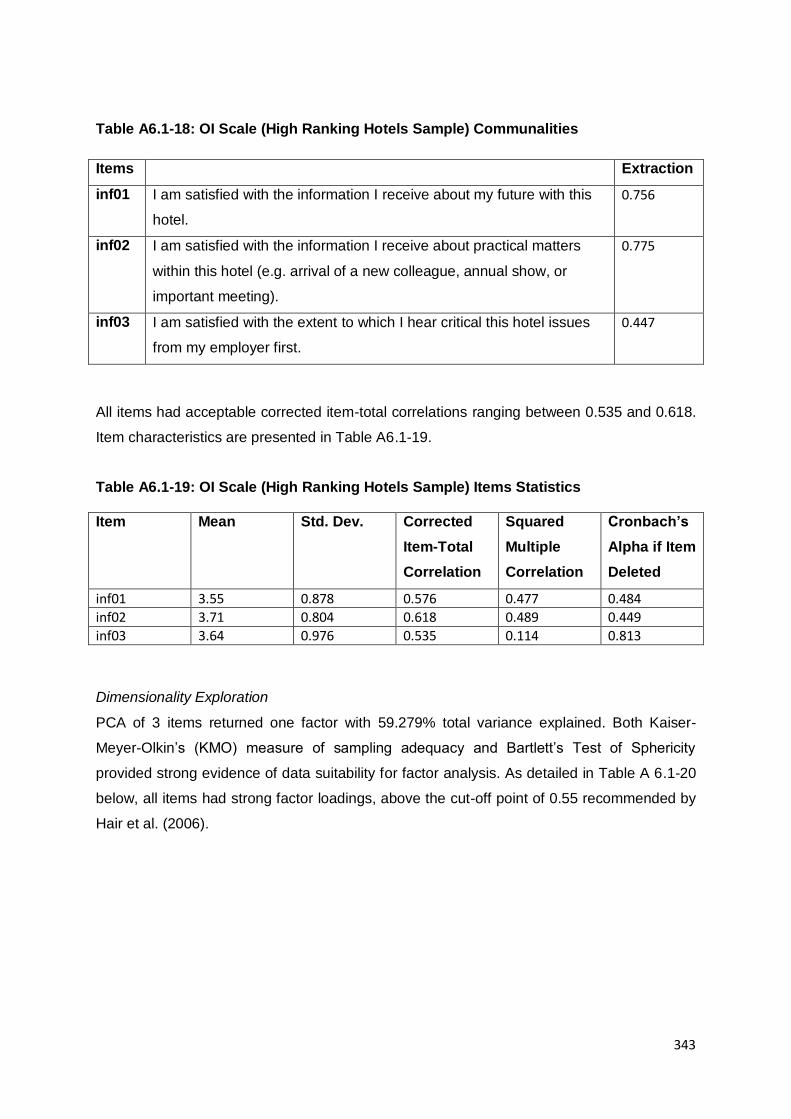
343
Table A6.1-18: OI Scale (High Ranking Hotels Sample) Communalities
Items Extraction
inf01 I am satisfied with the information I receive about my future with this
hotel.
0.756
inf02 I am satisfied with the information I receive about practical matters
within this hotel (e.g. arrival of a new colleague, annual show, or
important meeting).
0.775
inf03 I am satisfied with the extent to which I hear critical this hotel issues
from my employer first.
0.447
All items had acceptable corrected item-total correlations ranging between 0.535 and 0.618.
Item characteristics are presented in Table A6.1-19.
Table A6.1-19: OI Scale (High Ranking Hotels Sample) Items Statistics
Item Mean Std. Dev. Corrected
Item-Total
Correlation
Squared
Multiple
Correlation
Cronbach’s
Alpha if Item
Deleted
inf01 3.55 0.878 0.576 0.477 0.484
inf02 3.71 0.804 0.618 0.489 0.449
inf03 3.64 0.976 0.535 0.114 0.813
Dimensionality Exploration
PCA of 3 items returned one factor with 59.279% total variance explained. Both Kaiser-
Meyer-Olkin’s (KMO) measure of sampling adequacy and Bartlett’s Test of Sphericity
provided strong evidence of data suitability for factor analysis. As detailed in Table A 6.1-20
below, all items had strong factor loadings, above the cut-off point of 0.55 recommended by
Hair et al. (2006).

344
Table A6.1-20: Factor Loadings
Item Loading
inf01 I am satisfied with the information I receive about my future with this hotel.
.869
inf02 I am satisfied with the information which I receive about practical matters within this hotel (e.g. arrival of a new colleague, annual show, or important meeting).
.881
inf03 I am satisfied with the extent to which I hear critical this hotel issues from my employer first.
.597
Cronbach’s Alpha .609
Total variance explained 59.279%
KMO Measure of Sampling Adequacy .551
Bartell’s Test of Sphericity 372.784, df 3, p = .000
6.4.2 Low Ranking Hotels Sample
Internal Consistency and Reliability Assessment
Items developed to tap the OI constructs were subjected to initial Exploratory Factor
Analysis (EFA) using the Principal Component Analysis (PCA) method. Parallel analysis
returned one component with Eigenvalue exceeding 1, which was consistent with a priori
criteria of OI dimensionality derived conceptually. All items had acceptable correlations with
one another and acceptable communality values, as shown in Table A6.1-21 and A6.1-22.
Table A6.1-21: OI Scale (Low Ranking Hotels Sample) Inter-Item Correlations
inf01 inf02 inf03
Correlation
inf01 1.000 0.697 0.393
inf02 0.697 1.000 0.328
inf03 0.393 0.328 1.000

345
Table A6.1-22: OI Scale (Low Ranking Hotels Sample) Communalities
Items Extraction
inf01 I am satisfied with the information I receive about my future with this hotel.
.791
inf02 I am satisfied with the information which I receive about practical matters within this hotel (e.g. arrival of a new colleague, annual show, or important meeting).
.746
inf03 I am satisfied with the extent to which I hear critical this hotel issues from my employer first.
.430
All items had acceptable corrected item-total correlations ranging between 0.394 and 0.653.
Item characteristics are presented in Table A6.1-23 below.
Table A6.1-23: OI Scale (Low Ranking Hotels Sample) Items Statistics
Item Mean Std. Dev. Corrected
Item-Total
Correlation
Squared
Multiple
Correlation
Cronbach’s
Alpha if Item
Deleted
inf01 3.52 0.914 0.653 0.516 0.490
inf02 3.71 0.810 0.610 0.489 0.564
inf03 3.81 0.949 0.394 0.161 0.818
Dimensionality Exploration
PCA of 3 items returned one factor with 65.557% total variance explained. Both Kaiser-
Meyer-Olkin’s (KMO) measure of sampling adequacy and Bartlett’s Test of Sphericity
provided strong evidence of data suitability for factor analysis. As detailed in Table A 6.1-24
below, all items had strong factor loadings, above the cut-off point of 0.55 recommended by
Hair et al. (2006).

346
Table A6.1-24: Factor Loadings
Item Loading
inf01 I am satisfied with the information I receive about my future with this hotel.
.889
inf02 I am satisfied with the information which I receive about practical matters within this hotel (e.g. arrival of a new colleague, annual show, or important meeting).
.864
inf03 I am satisfied with the extent to which I hear critical this hotel issues from my employer first.
.655
Cronbach’s Alpha .722
Total variance explained 65.557%
KMO Measure of Sampling Adequacy .603
Bartell’s Test of Sphericity 222.696, df 3, p = .000
6.1.5 Media quality Scale (MQ)
6.5.1 High Ranking Hotels Sample
Internal Consistency and Reliability Assessment
Items developed to tap MQ construct were subjected to initial Exploratory Factor analysis
(EFA) using the Principal Component Analysis (PCA) method. Parallel analysis returned one
component with Eigenvalue exceeding 1, which was consistent with priori criteria of GPA
dimensionality derived conceptually. All items had acceptable correlation with one another
and acceptable communality values, as shown in Table A6.1-25 and A6.1-26. Corrected
item-total correlations were acceptable, ranging between 0.478 and 0.556, as shown in
Table A6.1-27.
Table A6.1-25: MQ Scale (High Ranking Hotels Sample) Inter-Item Correlations
inf04 inf05 inf06
Correlation
inf04 1.000 0.482 0.442
inf05 0.482 1.000 0.383
inf06 0.442 0.383 1.000

347
Table A6.1-26: MQ Scale (High Ranking Hotels Sample) Communalities
Items Extraction
inf04 The amount of information I get from this hotel by e-mail is about right. .673
inf05 Communication by means of e-mail works well within this hotel. .620
inf06 In meetings I always hear about the latest practical and organization
issues.
.580
Table A6.1-27: MQ Scale (High Ranking Hotels Sample) Items Statistics
Item Mean Std. Dev. Corrected
Item-Total
Correlation
Squared
Multiple
Correlation
Cronbach’s
Alpha if Item
Deleted
inf04 3.52 0.881 0.556 0.309 0.545
inf05 3.73 0.950 0.513 0.268 0.609
inf06 3.79 0.769 0.478 0.233 0.649
Dimensionality Exploration
MQ of 3 items returned one factor with 62.404% total variance explained. Both Kaiser-
Meyer-Olkin’s (KMO) measure of sampling adequacy and Bartell’s Test of Sphericity
supported data suitability for factor analysis. As detailed in Table A6.1-28, all items had
strong factor loadings, above cut-off point of 0.55.
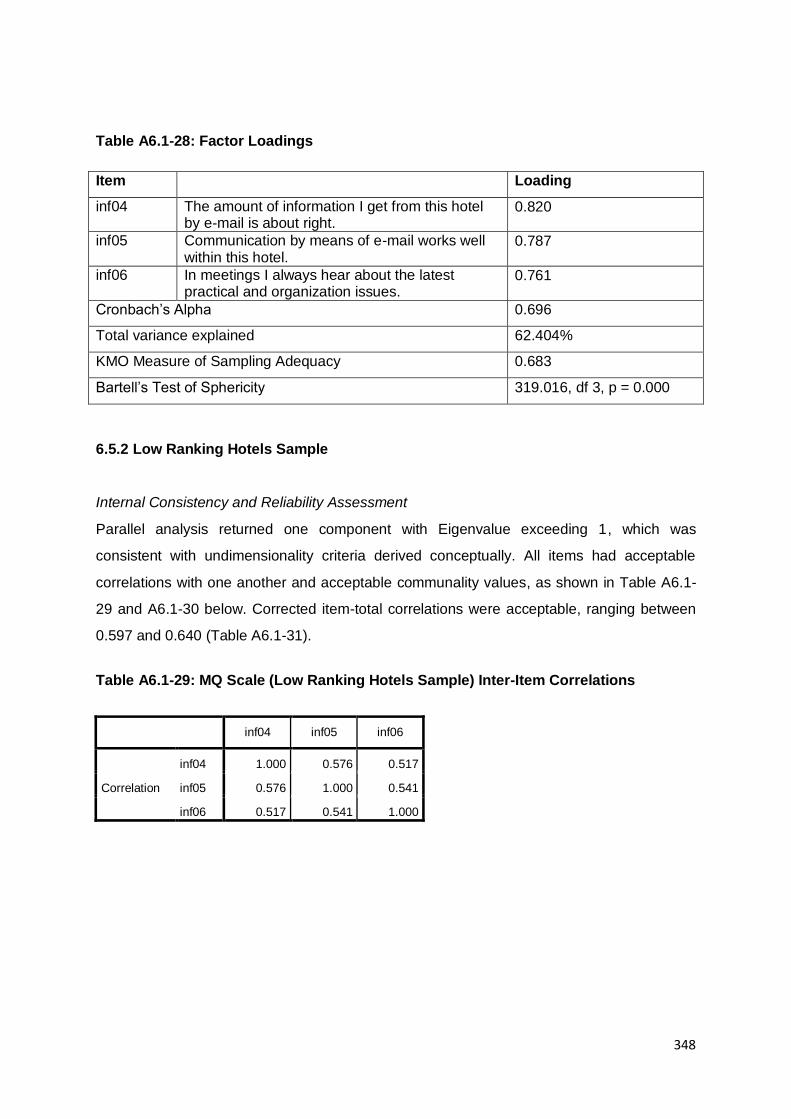
348
Table A6.1-28: Factor Loadings
Item Loading
inf04 The amount of information I get from this hotel by e-mail is about right.
0.820
inf05 Communication by means of e-mail works well within this hotel.
0.787
inf06 In meetings I always hear about the latest practical and organization issues.
0.761
Cronbach’s Alpha 0.696
Total variance explained 62.404%
KMO Measure of Sampling Adequacy 0.683
Bartell’s Test of Sphericity 319.016, df 3, p = 0.000
6.5.2 Low Ranking Hotels Sample
Internal Consistency and Reliability Assessment
Parallel analysis returned one component with Eigenvalue exceeding 1, which was
consistent with undimensionality criteria derived conceptually. All items had acceptable
correlations with one another and acceptable communality values, as shown in Table A6.1-
29 and A6.1-30 below. Corrected item-total correlations were acceptable, ranging between
0.597 and 0.640 (Table A6.1-31).
Table A6.1-29: MQ Scale (Low Ranking Hotels Sample) Inter-Item Correlations
inf04 inf05 inf06
Correlation
inf04 1.000 0.576 0.517
inf05 0.576 1.000 0.541
inf06 0.517 0.541 1.000
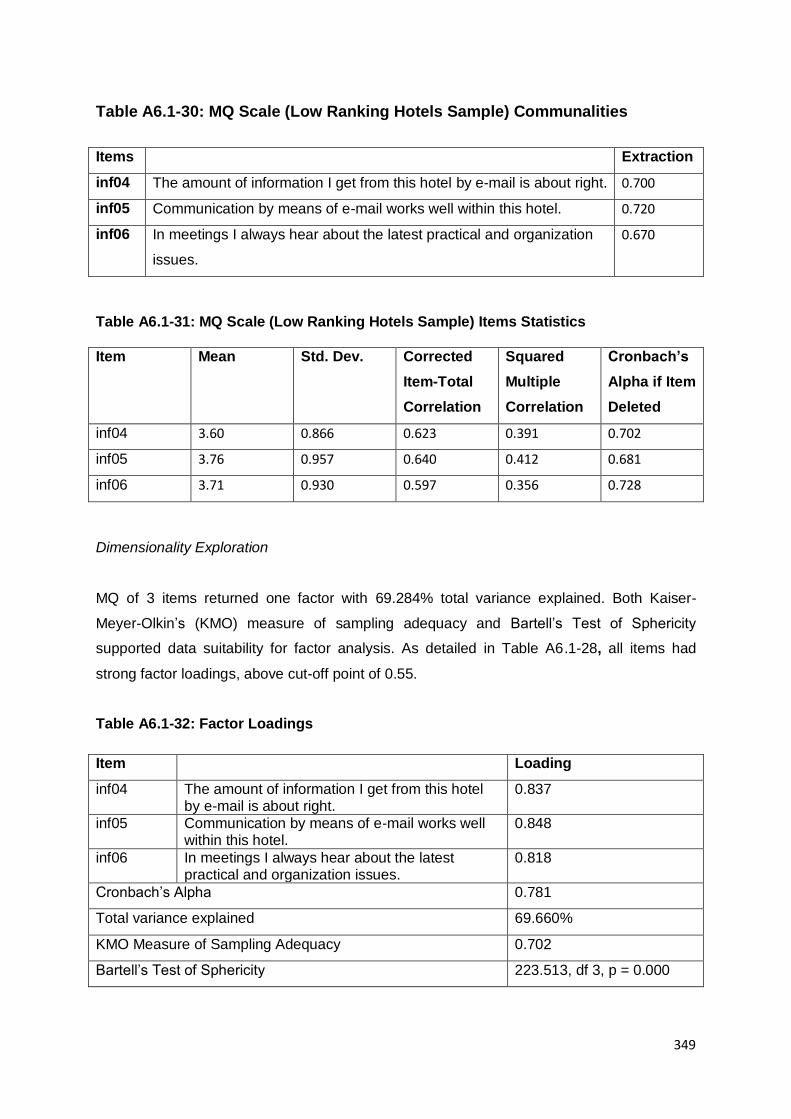
349
Table A6.1-30: MQ Scale (Low Ranking Hotels Sample) Communalities
Items Extraction
inf04 The amount of information I get from this hotel by e-mail is about right. 0.700
inf05 Communication by means of e-mail works well within this hotel. 0.720
inf06 In meetings I always hear about the latest practical and organization
issues.
0.670
Table A6.1-31: MQ Scale (Low Ranking Hotels Sample) Items Statistics
Item Mean Std. Dev. Corrected
Item-Total
Correlation
Squared
Multiple
Correlation
Cronbach’s
Alpha if Item
Deleted
inf04 3.60 0.866 0.623 0.391 0.702
inf05 3.76 0.957 0.640 0.412 0.681
inf06 3.71 0.930 0.597 0.356 0.728
Dimensionality Exploration
MQ of 3 items returned one factor with 69.284% total variance explained. Both Kaiser-
Meyer-Olkin’s (KMO) measure of sampling adequacy and Bartell’s Test of Sphericity
supported data suitability for factor analysis. As detailed in Table A6.1-28, all items had
strong factor loadings, above cut-off point of 0.55.
Table A6.1-32: Factor Loadings
Item Loading
inf04 The amount of information I get from this hotel by e-mail is about right.
0.837
inf05 Communication by means of e-mail works well within this hotel.
0.848
inf06 In meetings I always hear about the latest practical and organization issues.
0.818
Cronbach’s Alpha 0.781
Total variance explained 69.660%
KMO Measure of Sampling Adequacy 0.702
Bartell’s Test of Sphericity 223.513, df 3, p = 0.000
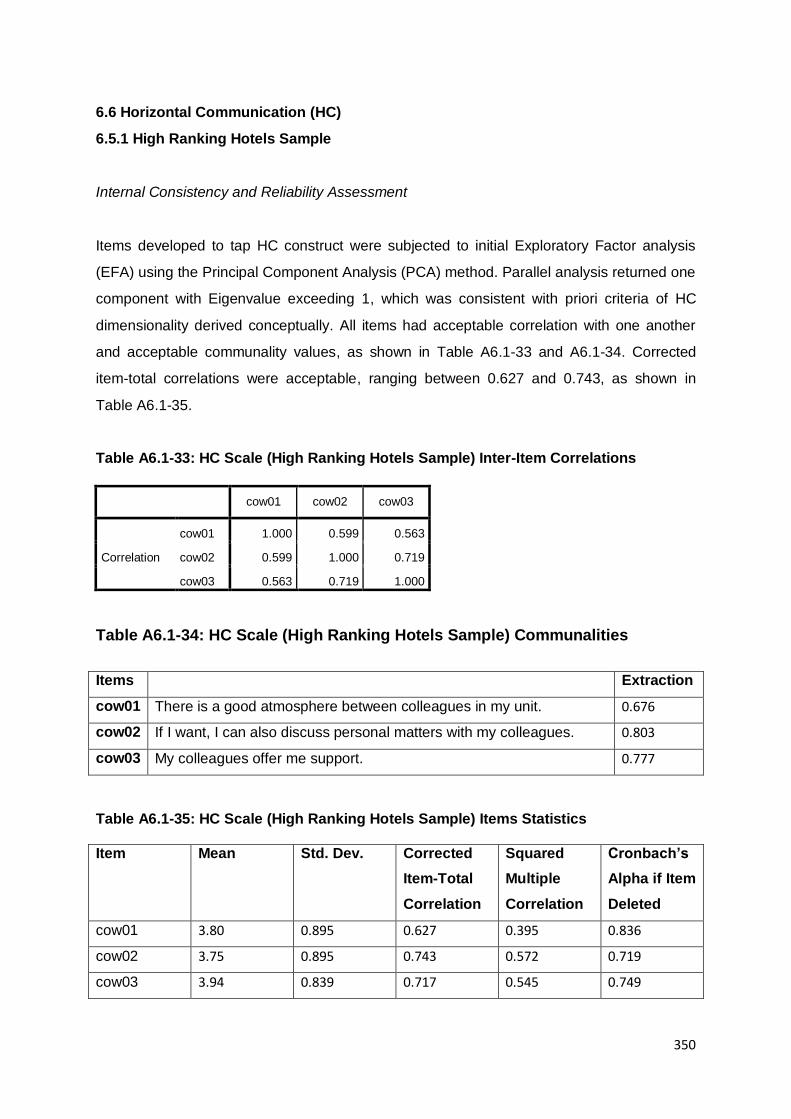
350
6.6 Horizontal Communication (HC)
6.5.1 High Ranking Hotels Sample
Internal Consistency and Reliability Assessment
Items developed to tap HC construct were subjected to initial Exploratory Factor analysis
(EFA) using the Principal Component Analysis (PCA) method. Parallel analysis returned one
component with Eigenvalue exceeding 1, which was consistent with priori criteria of HC
dimensionality derived conceptually. All items had acceptable correlation with one another
and acceptable communality values, as shown in Table A6.1-33 and A6.1-34. Corrected
item-total correlations were acceptable, ranging between 0.627 and 0.743, as shown in
Table A6.1-35.
Table A6.1-33: HC Scale (High Ranking Hotels Sample) Inter-Item Correlations
cow01 cow02 cow03
Correlation
cow01 1.000 0.599 0.563
cow02 0.599 1.000 0.719
cow03 0.563 0.719 1.000
Table A6.1-34: HC Scale (High Ranking Hotels Sample) Communalities
Items Extraction
cow01 There is a good atmosphere between colleagues in my unit. 0.676
cow02 If I want, I can also discuss personal matters with my colleagues. 0.803
cow03 My colleagues offer me support. 0.777
Table A6.1-35: HC Scale (High Ranking Hotels Sample) Items Statistics
Item Mean Std. Dev. Corrected
Item-Total
Correlation
Squared
Multiple
Correlation
Cronbach’s
Alpha if Item
Deleted
cow01 3.80 0.895 0.627 0.395 0.836
cow02 3.75 0.895 0.743 0.572 0.719
cow03 3.94 0.839 0.717 0.545 0.749

351
Dimensionality Exploration
HC of 3 items returned one factor with 75.214% total variance explained. Both Kaiser-Meyer-
Olkin’s (KMO) measure of sampling adequacy and Bartell’s Test of Sphericity supported
data suitability for factor analysis. As detailed in Table A6.1-36, all items had strong factor
loadings, above cut-off point of .55.
Table A6.1-36: Factor Loadings
Item Loading
cow01 The amount of information I get from this hotel by e-mail is about right.
0.822
cow02 Communication by means of e-mail works well within this hotel.
0.896
cow03 In meetings I always hear about the latest practical and organization issues.
0.882
Cronbach’s Alpha 0.834
Total variance explained 75.214%
KMO Measure of Sampling Adequacy 0.703
Bartell’s Test of Sphericity 742.211, df 3, p = 0.000
6.6.2 Low Ranking Hotels Sample
Internal Consistency and Reliability Assessment
Parallel analysis returned one component with Eigenvalue exceeding 1, which was
consistent with undimensionality criteria derived conceptually. All items had acceptable
correlations with one another and acceptable communality values, as shown in Table A6.1-
37 and A6.1-38 below. Corrected item-total correlations were acceptable, ranging between
0.498 and 0.657 (Table A6.1-39).
Table A6.1-37: HC Scale (Low Ranking Hotels Sample) Inter-Item Correlations
cow01 cow02 cow03
Correlation
cow01 1.000 0.454 0.457
cow02 0.454 1.000 0.674
cow03 0.457 0.674 1.000
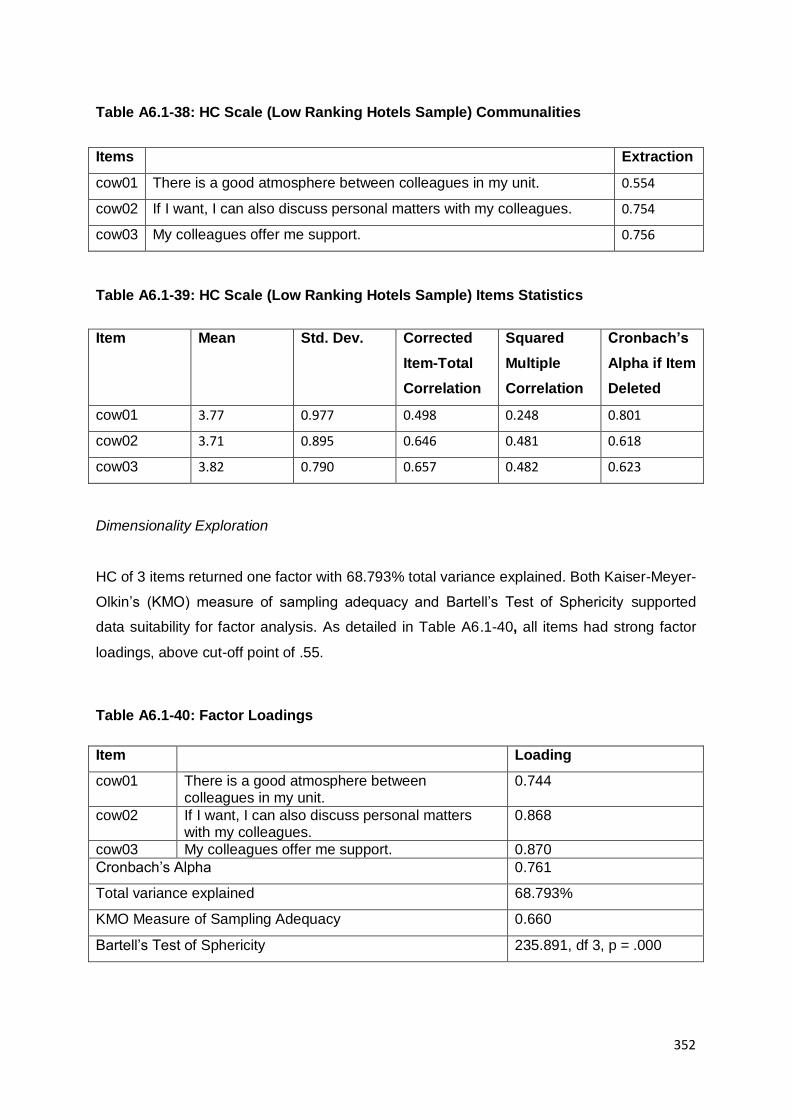
352
Table A6.1-38: HC Scale (Low Ranking Hotels Sample) Communalities
Items Extraction
cow01 There is a good atmosphere between colleagues in my unit. 0.554
cow02 If I want, I can also discuss personal matters with my colleagues. 0.754
cow03 My colleagues offer me support. 0.756
Table A6.1-39: HC Scale (Low Ranking Hotels Sample) Items Statistics
Item Mean Std. Dev. Corrected
Item-Total
Correlation
Squared
Multiple
Correlation
Cronbach’s
Alpha if Item
Deleted
cow01 3.77 0.977 0.498 0.248 0.801
cow02 3.71 0.895 0.646 0.481 0.618
cow03 3.82 0.790 0.657 0.482 0.623
Dimensionality Exploration
HC of 3 items returned one factor with 68.793% total variance explained. Both Kaiser-Meyer-
Olkin’s (KMO) measure of sampling adequacy and Bartell’s Test of Sphericity supported
data suitability for factor analysis. As detailed in Table A6.1-40, all items had strong factor
loadings, above cut-off point of .55.
Table A6.1-40: Factor Loadings
Item Loading
cow01 There is a good atmosphere between colleagues in my unit.
0.744
cow02 If I want, I can also discuss personal matters with my colleagues.
0.868
cow03 My colleagues offer me support. 0.870
Cronbach’s Alpha 0.761
Total variance explained 68.793%
KMO Measure of Sampling Adequacy 0.660
Bartell’s Test of Sphericity 235.891, df 3, p = .000
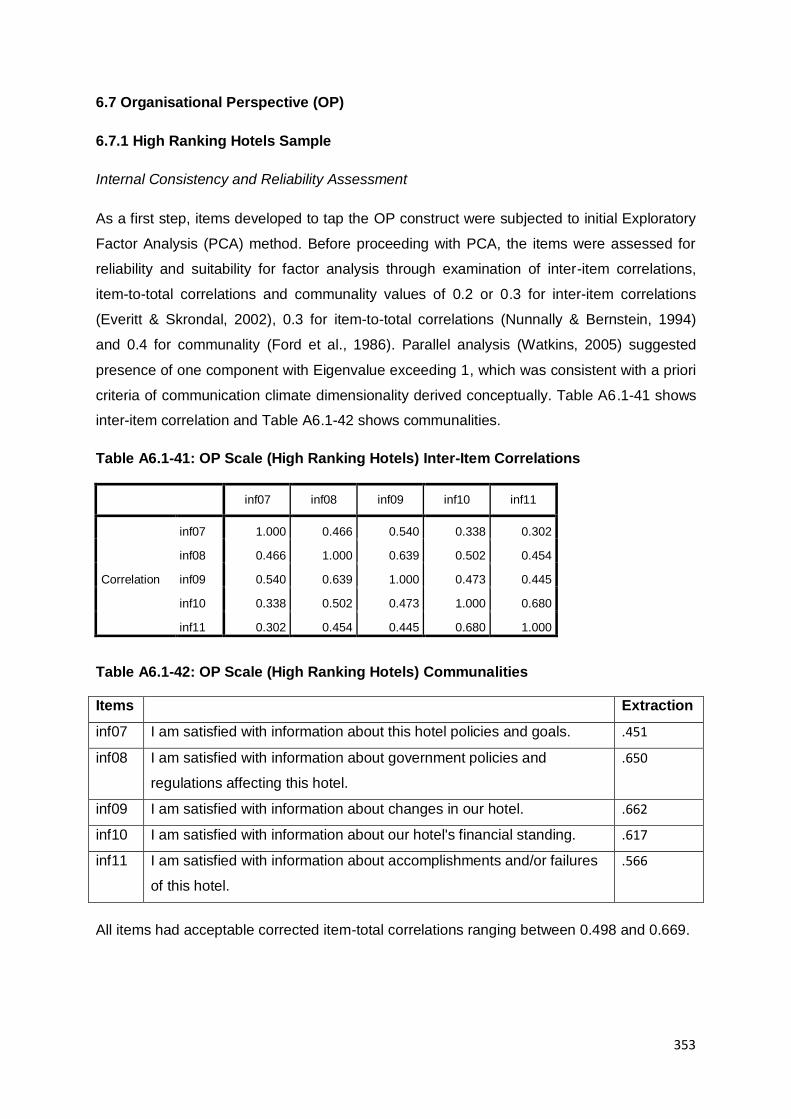
353
6.7 Organisational Perspective (OP)
6.7.1 High Ranking Hotels Sample
Internal Consistency and Reliability Assessment
As a first step, items developed to tap the OP construct were subjected to initial Exploratory
Factor Analysis (PCA) method. Before proceeding with PCA, the items were assessed for
reliability and suitability for factor analysis through examination of inter-item correlations,
item-to-total correlations and communality values of 0.2 or 0.3 for inter-item correlations
(Everitt & Skrondal, 2002), 0.3 for item-to-total correlations (Nunnally & Bernstein, 1994)
and 0.4 for communality (Ford et al., 1986). Parallel analysis (Watkins, 2005) suggested
presence of one component with Eigenvalue exceeding 1, which was consistent with a priori
criteria of communication climate dimensionality derived conceptually. Table A6.1-41 shows
inter-item correlation and Table A6.1-42 shows communalities.
Table A6.1-41: OP Scale (High Ranking Hotels) Inter-Item Correlations
inf07 inf08 inf09 inf10 inf11
Correlation
inf07 1.000 0.466 0.540 0.338 0.302
inf08 0.466 1.000 0.639 0.502 0.454
inf09 0.540 0.639 1.000 0.473 0.445
inf10 0.338 0.502 0.473 1.000 0.680
inf11 0.302 0.454 0.445 0.680 1.000
Table A6.1-42: OP Scale (High Ranking Hotels) Communalities
Items Extraction
inf07 I am satisfied with information about this hotel policies and goals. .451
inf08 I am satisfied with information about government policies and
regulations affecting this hotel.
.650
inf09 I am satisfied with information about changes in our hotel. .662
inf10 I am satisfied with information about our hotel's financial standing. .617
inf11 I am satisfied with information about accomplishments and/or failures
of this hotel.
.566
All items had acceptable corrected item-total correlations ranging between 0.498 and 0.669.

354
Table A6.1-43: OP Scale (High Ranking Hotels) Items Statistics
Item Mean Std. Dev. Corrected
Item-Total
Correlation
Squared
Multiple
Correlation
Cronbach’s
Alpha if Item
Deleted
inf07 3.84 0.856 0.498 0.319 0.817
inf08 3.46 0.867 0.659 0.478 0.774
inf09 3.71 0.846 0.669 0.508 0.773
inf10 3.18 1.086 0.652 0.518 0.777
inf11 3.18 1.003 0.616 0.487 0.786
Dimensionality Exploration
OP of 5 items returned one factor with 58.935% total variance explained. Both Kaiser-Meyer-
Olkin’s (KMO) measure of sampling adequacy and Bartell’s Test of Sphericity provided
strong evidence of data suitability for factor analysis. As detailed in Table A6.1-44 below, all
items had strong factor loadings, above the cut-off point of 0.55 recommended by Hair et al.,
(2006).
Table A6.1-44: Factor Loadings
Item Loading
inf07 I am satisfied with information about this hotel’s policies and goals.
0.672
inf08 I am satisfied with information about government policies and regulations affecting this hotel.
0.806
inf09 I am satisfied with information about changes in our hotel.
0.814
inf10 I am satisfied with information about our hotel's financial standing.
0.785
inf11 I am satisfied with information about accomplishments and/ or failures of this hotel.
0.753
Cronbach’s Alpha 0.821
Total variance explained 58.935%
KMO Measure of Sampling Adequacy 0.780
Bartell’s Test of Sphericity 1156.587, df 10, p = 0.000

355
6.7.2 Low Ranking Hotels Sample
Internal Consistency and Reliability Assessment
Items were submitted for initial Exploratory Factor Analysis (EFA) using the Principal
Component Analysis (PCA) method. Consistent with conceptually derived criteria, Parallel
Analysis suggested presence of one factor exceeding 1. All items had acceptable
correlations with one another and acceptable communality values as shown in Table A6.1-
45 and A6.1-46. Corrected item-total correlations were acceptable, ranging between 0.684
and 0.807.
Table A6.1-45: OP Scale (Low Ranking Hotels) Inter-Item Correlations
inf07 inf08 inf09 inf10 inf11
Correlation
inf07 1.000 0.610 0.763 0.657 0.623
inf08 0.610 1.000 0.696 0.546 0.556
inf09 0.763 0.696 1.000 0.666 0.621
inf10 0.657 0.546 0.666 1.000 0.779
inf11 0.623 0.556 0.621 0.779 1.000
Table A6.1-46: OP Scale (Low Ranking Hotels) Communalities
Items Extraction
inf07 I am satisfied with information about this hotel’s policies and goals. 0.744
inf08 I am satisfied with information about government policies and
regulations affecting this hotel.
0.635
inf09 I am satisfied with information about changes in our hotel. 0.782
inf10 I am satisfied with information about our hotel's financial standing. 0.741
inf11 I am satisfied with information about accomplishments and/ or failures
of this hotel.
0.710
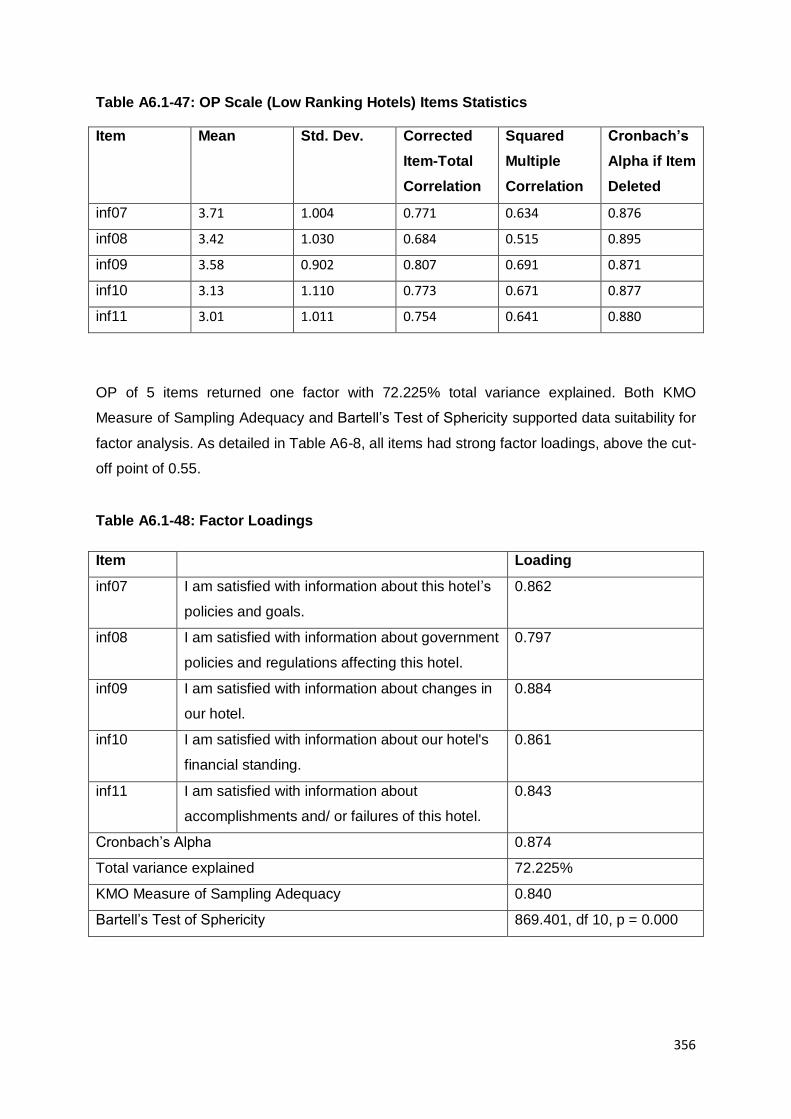
356
Table A6.1-47: OP Scale (Low Ranking Hotels) Items Statistics
Item Mean Std. Dev. Corrected
Item-Total
Correlation
Squared
Multiple
Correlation
Cronbach’s
Alpha if Item
Deleted
inf07 3.71 1.004 0.771 0.634 0.876
inf08 3.42 1.030 0.684 0.515 0.895
inf09 3.58 0.902 0.807 0.691 0.871
inf10 3.13 1.110 0.773 0.671 0.877
inf11 3.01 1.011 0.754 0.641 0.880
OP of 5 items returned one factor with 72.225% total variance explained. Both KMO
Measure of Sampling Adequacy and Bartell’s Test of Sphericity supported data suitability for
factor analysis. As detailed in Table A6-8, all items had strong factor loadings, above the cut-
off point of 0.55.
Table A6.1-48: Factor Loadings
Item Loading
inf07 I am satisfied with information about this hotel’s
policies and goals.
0.862
inf08 I am satisfied with information about government
policies and regulations affecting this hotel.
0.797
inf09 I am satisfied with information about changes in
our hotel.
0.884
inf10 I am satisfied with information about our hotel's
financial standing.
0.861
inf11 I am satisfied with information about
accomplishments and/ or failures of this hotel.
0.843
Cronbach’s Alpha 0.874
Total variance explained 72.225%
KMO Measure of Sampling Adequacy 0.840
Bartell’s Test of Sphericity 869.401, df 10, p = 0.000

357
6.8 Personal Feedback (PF)
6.8.1 High Ranking Hotels Sample
Internal Consistency and Reliability Assessment
Items developed to tap PF construct were subjected to initial Exploratory Factor analysis
(EFA) using the Principal Component Analysis (PCA) method. Parallel analysis returned one
component with Eigenvalue exceeding 1, which was consistent with priori criteria of PF
dimensionality derived conceptually. All items had acceptable correlation with one another
and acceptable communality values as shown in Table A6.1-49 and A6.1-50. Corrected
item-total correlations were acceptable, ranging between 0.547 and 0.731, as shown in
Table A6.1-51.
Table A6.1-49: PF Scale (High Ranking Hotels Sample) Inter-Item Correlations
per01 per02 per03 per04 per05
Correlation
per01 1.000 0.535 0.501 0.405 0.393
per02 0.535 1.000 0.605 0.500 0.567
per03 0.501 0.605 1.000 0.521 0.567
per04 0.405 0.500 0.521 1.000 0.765
per05 0.393 0.567 0.567 0.765 1.000
Table A6.1-50: PF Scale (High Ranking Hotels Sample) Communalities
Items Extraction
per01 I am satisfied with information about how my job compares with
others.
0.483
per02 I am satisfied with information about how I am being judged. 0.654
per03 I am satisfied with recognition of my efforts. 0.651
per04 I am satisfied with reports on how problems in my job are being
handled.
0.660
per05 I am satisfied that my superiors know and understand the problems
faced by subordinates.
0.706
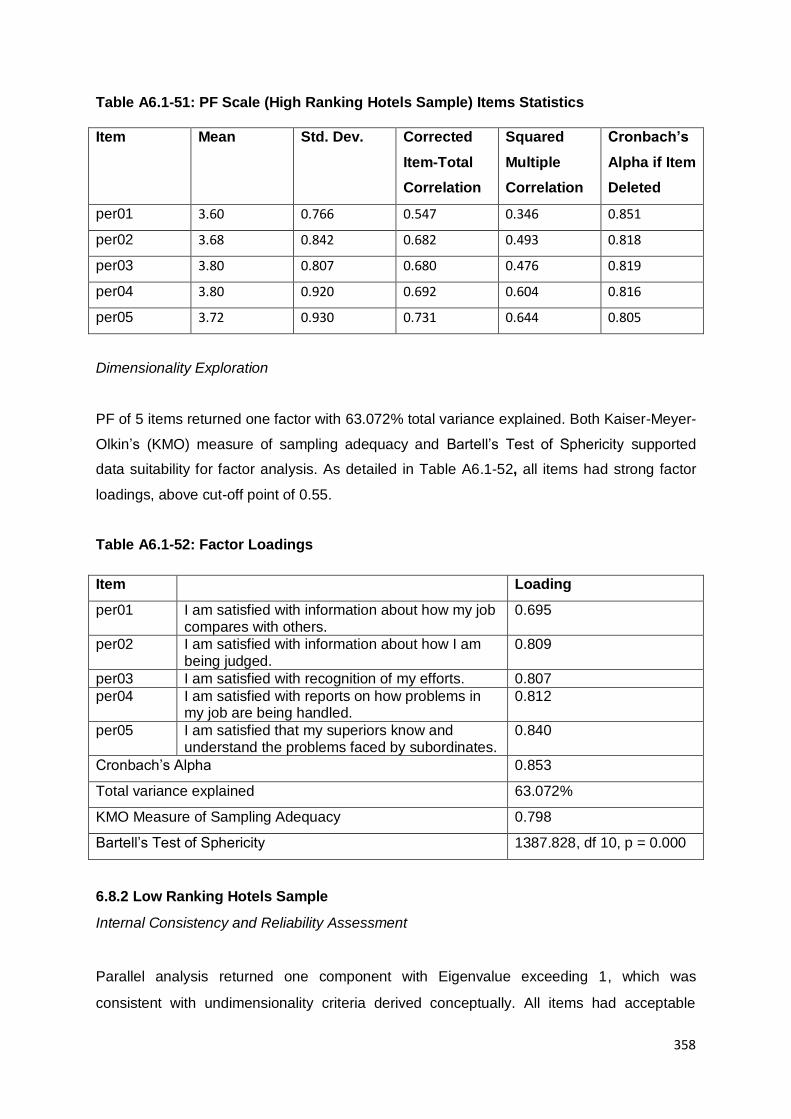
358
Table A6.1-51: PF Scale (High Ranking Hotels Sample) Items Statistics
Item Mean Std. Dev. Corrected
Item-Total
Correlation
Squared
Multiple
Correlation
Cronbach’s
Alpha if Item
Deleted
per01 3.60 0.766 0.547 0.346 0.851
per02 3.68 0.842 0.682 0.493 0.818
per03 3.80 0.807 0.680 0.476 0.819
per04 3.80 0.920 0.692 0.604 0.816
per05 3.72 0.930 0.731 0.644 0.805
Dimensionality Exploration
PF of 5 items returned one factor with 63.072% total variance explained. Both Kaiser-Meyer-
Olkin’s (KMO) measure of sampling adequacy and Bartell’s Test of Sphericity supported
data suitability for factor analysis. As detailed in Table A6.1-52, all items had strong factor
loadings, above cut-off point of 0.55.
Table A6.1-52: Factor Loadings
Item Loading
per01 I am satisfied with information about how my job compares with others.
0.695
per02 I am satisfied with information about how I am being judged.
0.809
per03 I am satisfied with recognition of my efforts. 0.807
per04 I am satisfied with reports on how problems in my job are being handled.
0.812
per05 I am satisfied that my superiors know and understand the problems faced by subordinates.
0.840
Cronbach’s Alpha 0.853
Total variance explained 63.072%
KMO Measure of Sampling Adequacy 0.798
Bartell’s Test of Sphericity 1387.828, df 10, p = 0.000
6.8.2 Low Ranking Hotels Sample
Internal Consistency and Reliability Assessment
Parallel analysis returned one component with Eigenvalue exceeding 1, which was
consistent with undimensionality criteria derived conceptually. All items had acceptable

359
correlations with one another and acceptable communality values as shown in Table A6.1-
53 and A6.1-54 below. Corrected item-total correlations were acceptable, ranging between
0.561 and 0.693 (Table A6.1-55).
Table A6.1-53: PF Scale (Low Ranking Hotels Sample) Inter-Item Correlations
per01 per02 per03 per04 per05
Correlation
per01 1.000 0.661 0.523 0.322 0.410
per02 0.661 1.000 0.618 0.394 0.487
per03 0.523 0.618 1.000 0.458 0.571
per04 0.322 0.394 0.458 1.000 0.646
per05 0.410 0.487 0.571 0.646 1.000
Table A6.1-54: PF Scale (Low Ranking Hotels Sample) Communalities
Items Extraction
per01 I am satisfied with information about how my job compares with
others.
0.558
per02 I am satisfied with information about how I am being judged. 0.668
per03 I am satisfied with recognition of my efforts. 0.674
per04 I am satisfied with reports on how problems in my job are being
handled.
0.506
per05 I am satisfied that my superiors know and understand the problems
faced by subordinates.
0.638
Table A6.1-55: PF Scale (Low Ranking Hotels Sample) Items Statistics
Item Mean Std. Dev. Corrected
Item-Total
Correlation
Squared
Multiple
Correlation
Cronbach’s
Alpha if Item
Deleted
per01 3.53 0.781 0.598 0.461 0.816
per02 3.65 0.851 0.684 0.551 0.792
per03 3.78 0.758 0.693 0.495 0.791
per04 3.96 0.824 0.561 0.430 0.827
per05 3.73 0.814 0.671 0.525 0.796
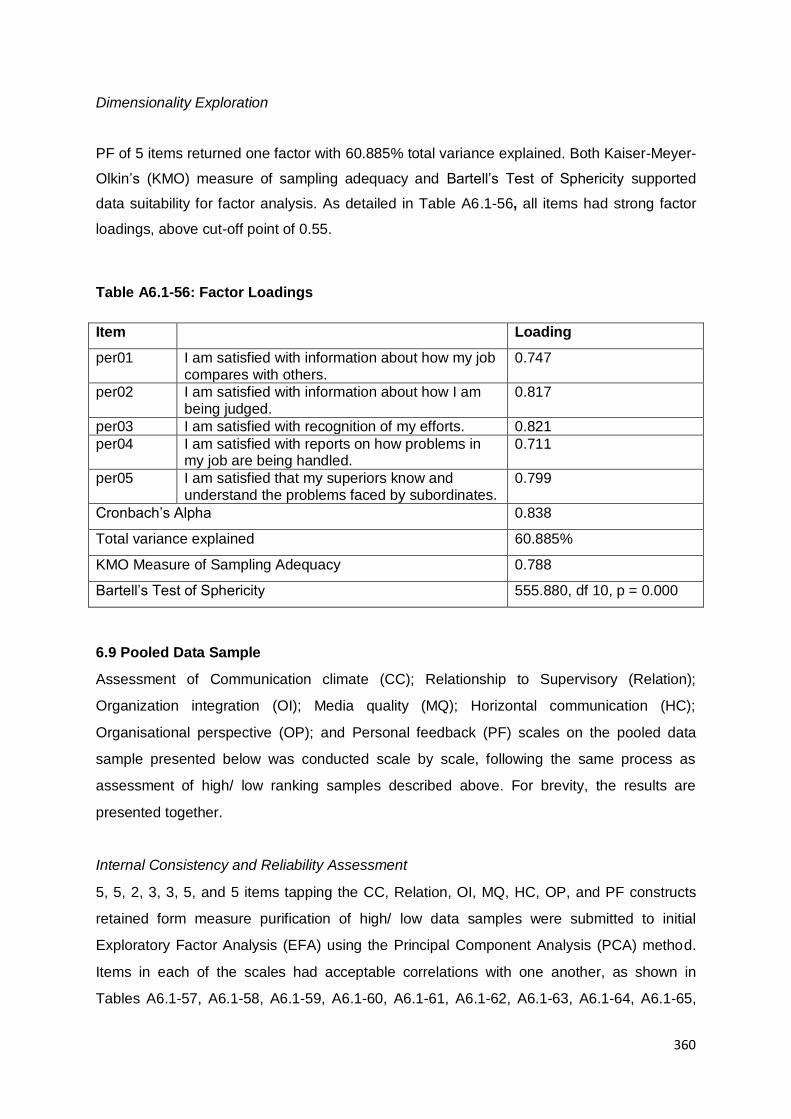
360
Dimensionality Exploration
PF of 5 items returned one factor with 60.885% total variance explained. Both Kaiser-Meyer-
Olkin’s (KMO) measure of sampling adequacy and Bartell’s Test of Sphericity supported
data suitability for factor analysis. As detailed in Table A6.1-56, all items had strong factor
loadings, above cut-off point of 0.55.
Table A6.1-56: Factor Loadings
Item Loading
per01 I am satisfied with information about how my job compares with others.
0.747
per02 I am satisfied with information about how I am being judged.
0.817
per03 I am satisfied with recognition of my efforts. 0.821
per04 I am satisfied with reports on how problems in my job are being handled.
0.711
per05 I am satisfied that my superiors know and understand the problems faced by subordinates.
0.799
Cronbach’s Alpha 0.838
Total variance explained 60.885%
KMO Measure of Sampling Adequacy 0.788
Bartell’s Test of Sphericity 555.880, df 10, p = 0.000
6.9 Pooled Data Sample
Assessment of Communication climate (CC); Relationship to Supervisory (Relation);
Organization integration (OI); Media quality (MQ); Horizontal communication (HC);
Organisational perspective (OP); and Personal feedback (PF) scales on the pooled data
sample presented below was conducted scale by scale, following the same process as
assessment of high/ low ranking samples described above. For brevity, the results are
presented together.
Internal Consistency and Reliability Assessment
5, 5, 2, 3, 3, 5, and 5 items tapping the CC, Relation, OI, MQ, HC, OP, and PF constructs
retained form measure purification of high/ low data samples were submitted to initial
Exploratory Factor Analysis (EFA) using the Principal Component Analysis (PCA) method.
Items in each of the scales had acceptable correlations with one another, as shown in
Tables A6.1-57, A6.1-58, A6.1-59, A6.1-60, A6.1-61, A6.1-62, A6.1-63, A6.1-64, A6.1-65,

361
A6.1-66, A6.1-67, A6.1-68, A6.1-69, and A6.1-70. Communality values and item-to-total
statistics were also acceptable (see Table A6.1-71, A6.1-72, A6.1-73, A6.1-74, A6.1-75,
A6.1-76, and A6.1-77).
Table A6.1-57: Communication climate (CC) Scale (Pooled Sample) Inter-Item
Correlation
mot01 mot02 mot03 mot04 mot05
Correlation
mot01 1.000 0.483 0.640 0.500 0.512
mot02 0.483 1.000 0.523 0.517 0.352
mot03 0.640 0.523 1.000 0.573 0.470
mot04 0.500 0.517 0.573 1.000 0.470
mot05 0.512 0.352 0.470 0.470 1.000
Table A6.1-58: Relationship to Supervisory (Relation) Scale (Pooled Sample) Inter-
Item Correlation
sup01 sup02 sup03 sup04 sup05
Correlation
sup01 1.000 0.666 0.623 0.593 0.519
sup02 0.666 1.000 0.493 0.482 0.393
sup03 0.623 0.493 1.000 0.693 0.603
sup04 0.593 0.482 0.693 1.000 0.662
sup05 0.519 0.393 0.603 0.662 1.000
Table A6.1-59: Organization integration (OI) Scale (Pooled Sample) Inter-Item
Correlation
inf01 inf02 inf03
Correlation
inf01 1.000 0.669 0.260
inf02 0.669 1.000 0.261
inf03 0.260 0.261 1.000

362
Table A6.1-60: Media quality (MQ) Scale (Pooled Sample) Inter-Item Correlation
inf04 inf05 inf06
Correlation
inf04 1.000 0.510 0.463
inf05 0.510 1.000 0.436
inf06 0.463 0.436 1.000
Table A6.1-61: Horizontal communication (HC) Scale (Pooled Sample) Inter-Item
Correlation
cow01 cow02 cow03
Correlation
cow01 1.000 0.551 0.528
cow02 0.551 1.000 0.705
cow03 0.528 0.705 1.000
Table A6.1-62: Organisational perspective (OP) Scale (Pooled Sample) Inter-Item
Correlation
inf07 inf08 inf09 inf10 inf11
Correlation
inf07 1.000 0.521 0.621 0.447 0.414
inf08 0.521 1.000 0.658 0.516 0.488
inf09 0.621 0.658 1.000 0.536 0.504
inf10 0.447 0.516 0.536 1.000 0.710
inf11 0.414 0.488 0.504 0.710 1.000
Table A6.1-63: Personal feedback (PF) Scale (Pooled Sample) Inter-Item Correlation
per01 per02 per03 per04 per05
Correlation
per01 1.000 0.575 0.508 0.376 0.396
per02 0.575 1.000 0.609 0.466 0.543
per03 0.508 0.609 1.000 0.501 0.568
per04 0.376 0.466 0.501 1.000 0.732
per05 0.396 0.543 0.568 0.732 1.000

363
Table A6.1-64: CC Scale (Pooled Sample) Communalities and Item Statistics
Item Mean Std. Dev. Corrected
Item-Total
Correlation
Squared
Multiple
Correlation
Cronbach’s
Alpha if Item
Deleted
mot01 3.97 0.854 0.680 0.491 0.788
mot02 3.62 0.819 0.582 0.363 0.815
mot03 3.93 0.783 0.709 0.523 0.782
mot04 3.77 0.858 0.652 0.435 0.796
mot05 3.76 0.863 0.559 0.333 0.823
Table A6.1-65: Relation Scale (Pooled Sample) Communalities and Item Statistics
Item Mean Std. Dev. Corrected
Item-Total
Correlation
Squared
Multiple
Correlation
Cronbach’s
Alpha if Item
Deleted
sup01 4.02 0.884 0.739 0.583 0.828
sup02 3.69 0.949 0.604 0.458 0.864
sup03 3.95 0.819 0.737 0.571 0.830
sup04 3.93 0.868 0.742 0.596 0.828
sup05 3.92 0.872 0.649 0.486 0.851
Table A6.1-66: OI (Pooled Sample) Communalities and Item Statistics
Item Mean Std. Dev. Corrected
Item-Total
Correlation
Squared
Multiple
Correlation
Cronbach’s
Alpha if Item
Deleted
inf01 3.61 0.860 0.555 0.456 0.407
inf02 3.77 0.769 0.572 0.456 0.410
inf03 3.71 0.954 0.285 0.081 0.799
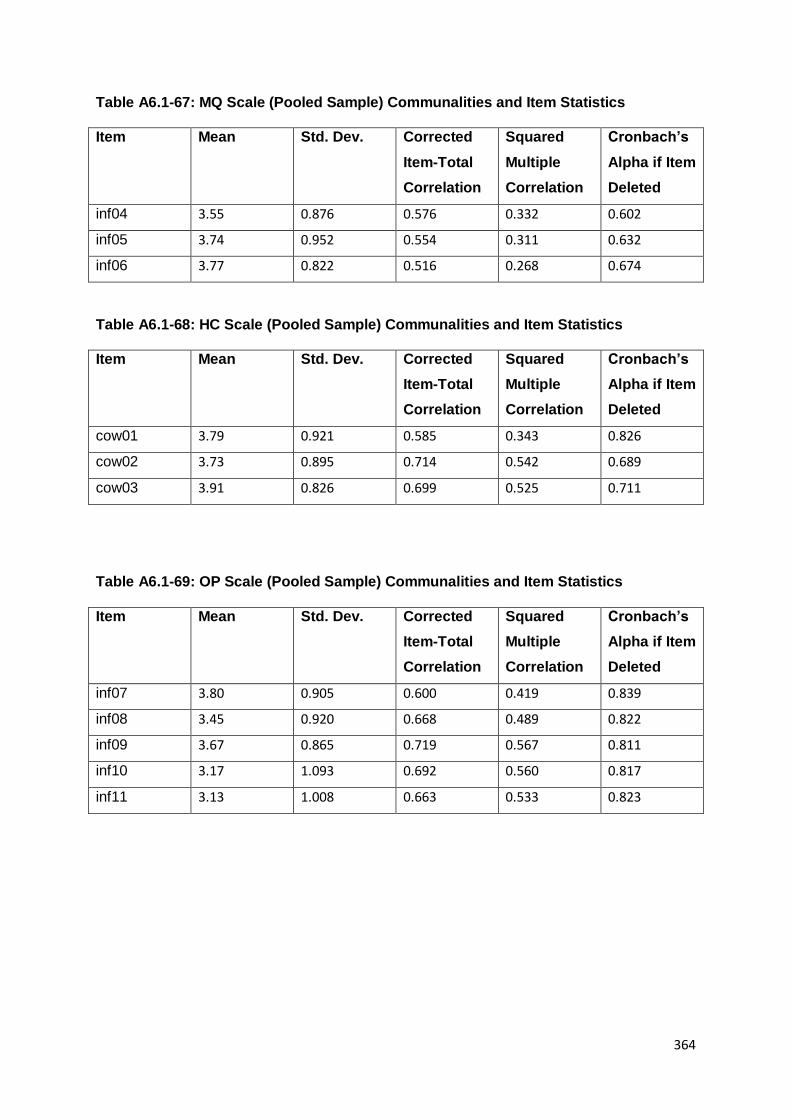
364
Table A6.1-67: MQ Scale (Pooled Sample) Communalities and Item Statistics
Item Mean Std. Dev. Corrected
Item-Total
Correlation
Squared
Multiple
Correlation
Cronbach’s
Alpha if Item
Deleted
inf04 3.55 0.876 0.576 0.332 0.602
inf05 3.74 0.952 0.554 0.311 0.632
inf06 3.77 0.822 0.516 0.268 0.674
Table A6.1-68: HC Scale (Pooled Sample) Communalities and Item Statistics
Item Mean Std. Dev. Corrected
Item-Total
Correlation
Squared
Multiple
Correlation
Cronbach’s
Alpha if Item
Deleted
cow01 3.79 0.921 0.585 0.343 0.826
cow02 3.73 0.895 0.714 0.542 0.689
cow03 3.91 0.826 0.699 0.525 0.711
Table A6.1-69: OP Scale (Pooled Sample) Communalities and Item Statistics
Item Mean Std. Dev. Corrected
Item-Total
Correlation
Squared
Multiple
Correlation
Cronbach’s
Alpha if Item
Deleted
inf07 3.80 0.905 0.600 0.419 0.839
inf08 3.45 0.920 0.668 0.489 0.822
inf09 3.67 0.865 0.719 0.567 0.811
inf10 3.17 1.093 0.692 0.560 0.817
inf11 3.13 1.008 0.663 0.533 0.823

365
Table A6.1-70: PF Scale (Pooled Sample) Communalities and Item Statistics
Item Mean Std. Dev. Corrected
Item-Total
Correlation
Squared
Multiple
Correlation
Cronbach’s
Alpha if Item
Deleted
per01 3.58 0.771 0.559 0.374 0.841
per02 3.67 0.844 0.681 0.504 0.810
per03 3.80 0.792 0.683 0.480 0.811
per04 3.85 0.894 0.652 0.551 0.819
per05 3.72 0.896 0.714 0.608 0.801
Dimensionality Exploration
Communication climate (CC) of 5; Relationship to Supervisory (Relation) of 5; Organization
integration (OI) of 3; Media quality (MQ) of 3; Horizontal communication (HC) of 3;
Organisational perspective (OP) of 5; and Personal feedback (PF) of 5 retained itemed
returned one factor with Internal communication satisfaction.
Table A6.1-71: CC Scales Factor Loadings
Item Loading
mot01 0.813
mot02 0.734
mot03 0.835
mot04 0.790
mot05 0.710
Cronbach’s Alpha 0.834
Total variance explained 60.505%
KMO Measure of Sampling Adequacy 0.837
Bartlett’s Test of Sphericity 1590.803, df 10, p = 0.000

366
Table A6.1-72: Relation Scales Factor Loadings
Item Loading
sup01 0.839
sup02 0.737
sup03 0.847
sup04 0.851
sup05 0.782
Cronbach’s Alpha 0.868
Total variance explained 68.451%
KMO Measure of Sampling Adequacy 0.831
Bartlett’s Test of Sphericity 2184.740, df 10, p = 0.000
Table A6.1-73: OI Scales Factor Loadings
Item Loading
inf01 0.875
inf02 0.876
inf03 0.548
Cronbach’s Alpha 0.646
Total variance explained 61.071%
KMO Measure of Sampling Adequacy 0.567
Bartlett’s Test of Sphericity 591.206, df 3, p = 0.000
Table A6.1-74: MQ Scales Factor Loadings
Item Loading
inf04 0.823
inf05 0.809
inf06 0.780
Cronbach’s Alpha 0.725
Total variance explained 64.658%
KMO Measure of Sampling Adequacy 0.679
Bartlett’s Test of Sphericity 534.462, df 3, p = 0.000
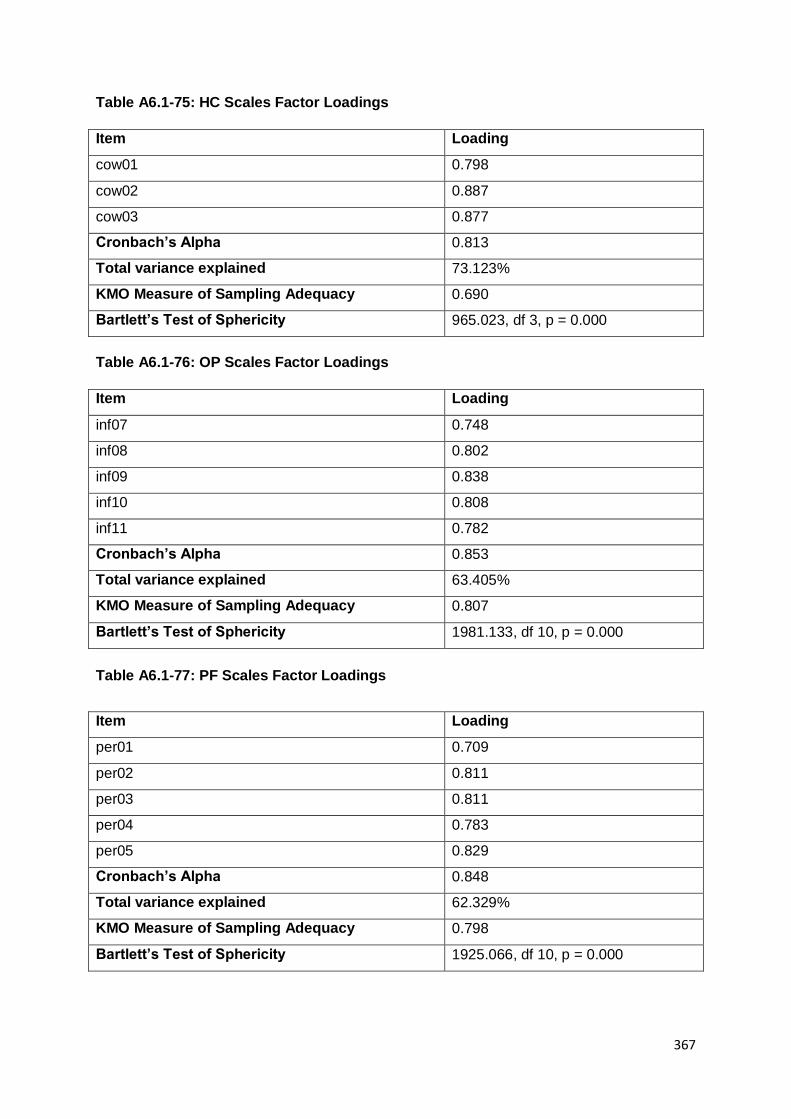
367
Table A6.1-75: HC Scales Factor Loadings
Item Loading
cow01 0.798
cow02 0.887
cow03 0.877
Cronbach’s Alpha 0.813
Total variance explained 73.123%
KMO Measure of Sampling Adequacy 0.690
Bartlett’s Test of Sphericity 965.023, df 3, p = 0.000
Table A6.1-76: OP Scales Factor Loadings
Item Loading
inf07 0.748
inf08 0.802
inf09 0.838
inf10 0.808
inf11 0.782
Cronbach’s Alpha 0.853
Total variance explained 63.405%
KMO Measure of Sampling Adequacy 0.807
Bartlett’s Test of Sphericity 1981.133, df 10, p = 0.000
Table A6.1-77: PF Scales Factor Loadings
Item Loading
per01 0.709
per02 0.811
per03 0.811
per04 0.783
per05 0.829
Cronbach’s Alpha 0.848
Total variance explained 62.329%
KMO Measure of Sampling Adequacy 0.798
Bartlett’s Test of Sphericity 1925.066, df 10, p = 0.000
368
Appendix B
Appendix for Chapter 6
Appendix 6.2
Normality Assessment at Measure Development and Validation Stage
Normality is an important assumption of Confirmatory Factor Analysis and Structural
Equation Modeling. An early step in screening data for normality is to consider statistic
values (Z) of skewness and kurtosis of continuous variables. Z-value of 0 indicated perfect
normality of data distribution in the sample. If the calculated z-valued exceed the critical
value of ± 2.58 (.01 significance level) or ± 1.96 (.05 significance level), this indicates
departure from normality assumption (Hair, Tatham, Anderson, & Black, 2006).
Tables A6.2-1, A6.2-2, A6.2-3, A6.2-4, A6.2-5, A6.2-6, and A6.2-7 present skewness and
kurtosis statistics for independent variables, specifically: Communication climate (CC);
Relationship to Supervisory (Relation); Organization integration (OI); Media quality (MQ);
Horizontal communication (HC); Organisational perspective (OP); and Personal feedback
(PF). Since new measure validation was conducted on high/low ranking and pooled
samples, skewness and kurtosis are presented for high/low ranking sample (High: n=1,212;
Low: n=535) and pooled samples (n=1,747).
Tables A6.2-8, A6.2-9, A6.2-10, and A6.2-11 present pooled sample (n= 1,747) skewness
and kurtosis statistics for dependent variables, Employees’ Brand Attitudes and Employees’
Brand Behaviour. Three employees’ brand attitudes and one employees’ brand behaviour
were utilised with wording adapted to measure of Punjaisri, Evanschitzky, & Wilson (2009),
and Mowday, Steers, & Porter (1979) that represent four different meanings, namely:
Employees’ brand identification (EI); Employees’ brand commitment (EC); Employees’ brand
loyalty (EL) and Employees’ brand behaviours (EB). Skewness and kurtosis statistics are
presented for each of these scales.

369
Table A6.2-1: Skewness and Kurtosis Statistics for Communication Climate (CC)
Scale
Item Skewness Std. Error of
Skewness
Kurtosis Std. Error of
Kurtosis
High Ranking Sample (n= 1,212)
mot01 -.814 .070 .746 .140
mot02 -.542 .070 .194 .140
mot03 -.597 .070 .445 .140
mot04 -.496 .070 .145 .140
mot05 -.565 .070 .235 .140
Low Ranking Sample (n= 535)
mot01 -.790 .106 .815 .211
mot02 -.825 .106 .779 .211
mot03 -.670 .106 1.162 .211
mot04 -.638 .106 .495 .211
mot05 -.768 .106 .646 .211
Pooled Sample (n=1,747)
mot01 -.804 .059 .758 .117
mot02 -.628 .059 .360 .117
mot03 -.607 .059 .625 .117
mot04 -.540 .059 .265 .117
mot05 -.628 .059 .363 .117
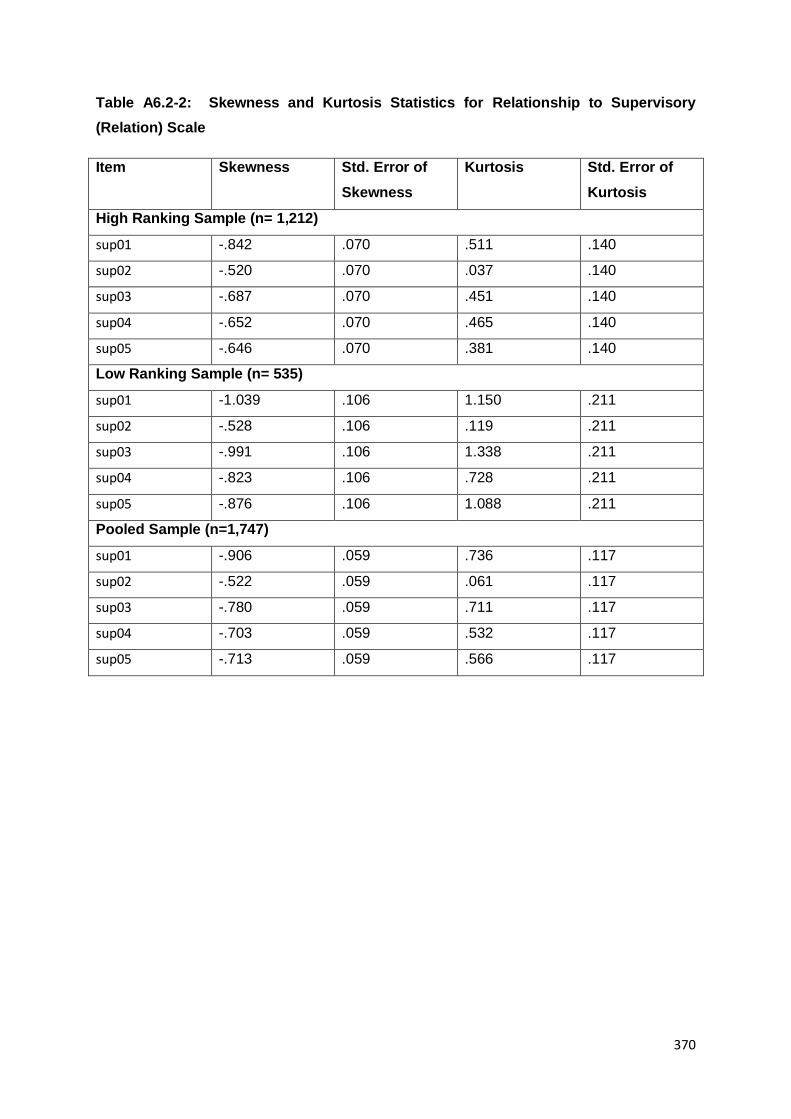
370
Table A6.2-2: Skewness and Kurtosis Statistics for Relationship to Supervisory
(Relation) Scale
Item Skewness Std. Error of
Skewness
Kurtosis Std. Error of
Kurtosis
High Ranking Sample (n= 1,212)
sup01 -.842 .070 .511 .140
sup02 -.520 .070 .037 .140
sup03 -.687 .070 .451 .140
sup04 -.652 .070 .465 .140
sup05 -.646 .070 .381 .140
Low Ranking Sample (n= 535)
sup01 -1.039 .106 1.150 .211
sup02 -.528 .106 .119 .211
sup03 -.991 .106 1.338 .211
sup04 -.823 .106 .728 .211
sup05 -.876 .106 1.088 .211
Pooled Sample (n=1,747)
sup01 -.906 .059 .736 .117
sup02 -.522 .059 .061 .117
sup03 -.780 .059 .711 .117
sup04 -.703 .059 .532 .117
sup05 -.713 .059 .566 .117

371
Table A6.2-3: Skewness and Kurtosis Statistics for Organization integration (OI)
Scale
Item Skewness Std. Error of
Skewness
Kurtosis Std. Error of
Kurtosis
High Ranking Sample (n= 1,212)
inf01 -.559 .070 .434 .140
inf02 -.536 .070 .597 .140
inf03 -.400 .070 -.264 .140
Low Ranking Sample (n= 535)
inf01 -.582 .106 .655 .211
inf02 -.582 .106 .723 .211
inf03 -.474 .106 -.160 .211
Pooled Sample (n=1,747)
inf01 -.569 .059 .496 .117
inf02 -.550 .059 .628 .117
inf03 -.423 .059 -.238 .117
Table A6.2-4: Skewness and Kurtosis Statistics for Media quality (MQ) Scale
Item Skewness Std. Error of
Skewness
Kurtosis Std. Error of
Kurtosis
High Ranking Sample (n= 1,212)
inf04 -.433 .070 .194 .140
inf05 -.462 .070 -.095 .140
inf06 -.523 .070 .471 .140
Low Ranking Sample (n= 535)
inf04 -.483 .106 .013 .211
inf05 -.488 .106 -.142 .211
inf06 -.688 .106 .569 .211
Pooled Sample (n=1,747)
inf04 -.447 .059 .130 .117
inf05 -.470 .059 -.112 .117
inf06 -.574 .059 .493 .117

372
Table A6.2-5: Skewness and Kurtosis Statistics for Horizontal communication (HC)
Scale
Item Skewness Std. Error of
Skewness
Kurtosis Std. Error of
Kurtosis
High Ranking Sample (n= 1,212)
cow01 -.585 .070 .298 .140
cow02 -.570 .070 .358 .140
cow03 -.682 .070 .629 .140
Low Ranking Sample (n= 535)
cow01 -.614 .106 .352 .211
cow02 -.230 .106 -.270 .211
cow03 -.279 .106 -.164 .211
Pooled Sample (n=1,747)
cow01 -.594 .059 .312 .117
cow02 -.478 .059 .200 .117
cow03 -.564 .059 .394 .117

373
Table A6.2-6: Skewness and Kurtosis Statistics for Organisational perspective (OP)
Scale
Item Skewness Std. Error of
Skewness
Kurtosis Std. Error of
Kurtosis
High Ranking Sample (n= 1,212)
inf07 -.587 .070 .326 .140
inf08 -.522 .070 .303 .140
inf09 -.533 .070 .179 .140
inf10 -.353 .070 -.411 .140
inf11 -.337 .070 -.214 .140
Low Ranking Sample (n= 535)
inf07 -.868 .106 .904 .211
inf08 -.443 .106 -.003 .211
inf09 -.757 .106 .632 .211
inf10 -.399 .106 -.235 .211
inf11 -.305 .106 -.098 .211
Pooled Sample (n=1,747)
inf07 -.675 .059 .507 .117
inf08 -.495 .059 .199 .117
inf09 -.597 .059 .298 .117
inf10 -.370 .059 -.359 .117
inf11 -.327 .059 -.182 .117
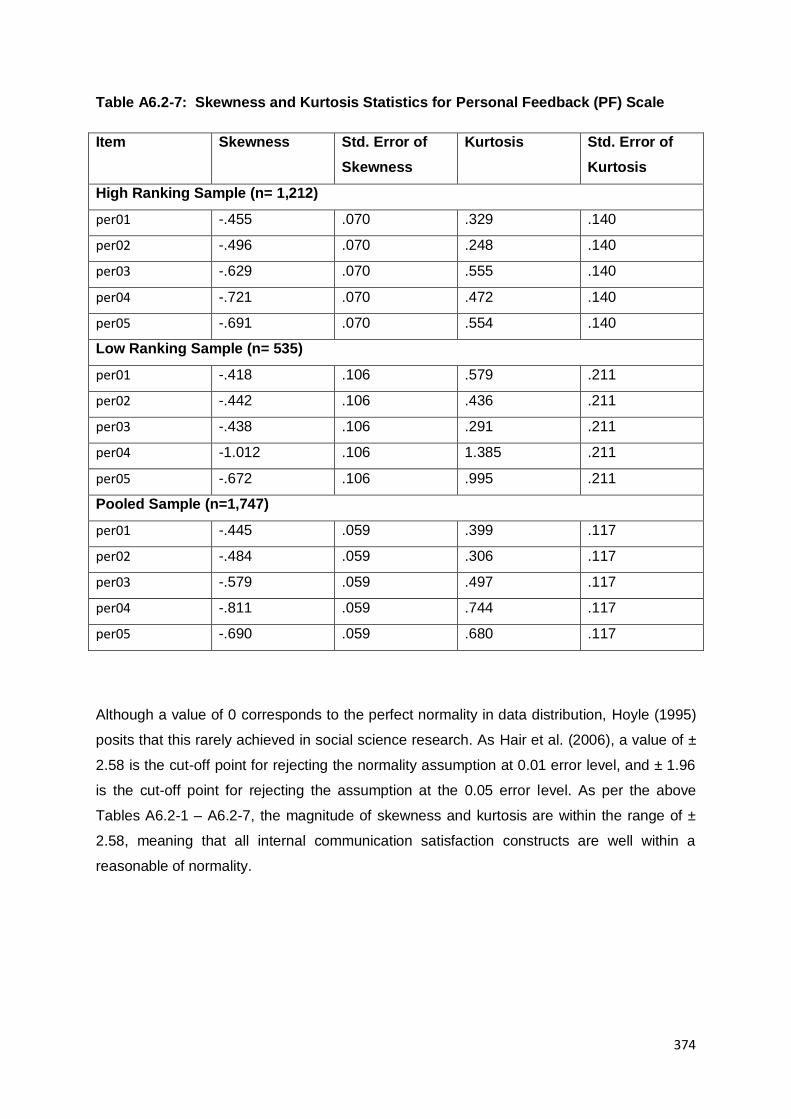
374
Table A6.2-7: Skewness and Kurtosis Statistics for Personal Feedback (PF) Scale
Item Skewness Std. Error of
Skewness
Kurtosis Std. Error of
Kurtosis
High Ranking Sample (n= 1,212)
per01 -.455 .070 .329 .140
per02 -.496 .070 .248 .140
per03 -.629 .070 .555 .140
per04 -.721 .070 .472 .140
per05 -.691 .070 .554 .140
Low Ranking Sample (n= 535)
per01 -.418 .106 .579 .211
per02 -.442 .106 .436 .211
per03 -.438 .106 .291 .211
per04 -1.012 .106 1.385 .211
per05 -.672 .106 .995 .211
Pooled Sample (n=1,747)
per01 -.445 .059 .399 .117
per02 -.484 .059 .306 .117
per03 -.579 .059 .497 .117
per04 -.811 .059 .744 .117
per05 -.690 .059 .680 .117
Although a value of 0 corresponds to the perfect normality in data distribution, Hoyle (1995)
posits that this rarely achieved in social science research. As Hair et al. (2006), a value of ±
2.58 is the cut-off point for rejecting the normality assumption at 0.01 error level, and ± 1.96
is the cut-off point for rejecting the assumption at the 0.05 error level. As per the above
Tables A6.2-1 – A6.2-7, the magnitude of skewness and kurtosis are within the range of ±
2.58, meaning that all internal communication satisfaction constructs are well within a
reasonable of normality.

375
Table A6.2-8: Skewness and Kurtosis Statistics for Employees’ brand identification
(EI) Scale
Item Skewness Std. Error of
Skewness
Kurtosis Std. Error of
Kurtosis
Pooled Sample (n=1,747)
att02 -.625 .059 .236 .117
att03 -.538 .059 .297 .117
att04 -.682 .059 .167 .117
att05 -.461 .059 .123 .117
att06 -.627 .059 .708 .117
att07 -.634 .059 .398 .117
att08 -.814 .059 .631 .117
Table A6.2-9: Skewness and Kurtosis Statistics for Employees’ brand commitment
(EC) Scale
Item Skewness Std. Error of
Skewness
Kurtosis Std. Error of
Kurtosis
Pooled Sample (n=1,747)
att09 -.698 .059 .863 .117
att11 -.709 .059 .735 .117
att12 -.685 .059 .756 .117
att13 -.640 .059 .616 .117
att14 -.555 .059 .465 .117
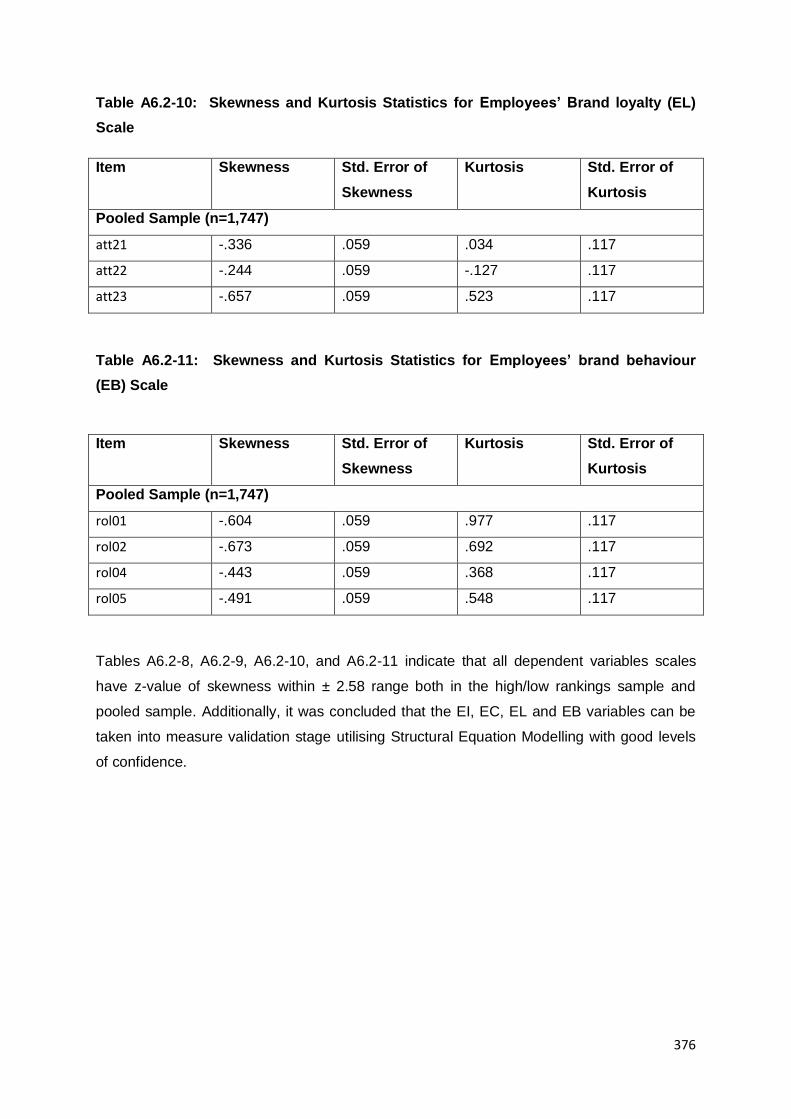
376
Table A6.2-10: Skewness and Kurtosis Statistics for Employees’ Brand loyalty (EL)
Scale
Item Skewness Std. Error of
Skewness
Kurtosis Std. Error of
Kurtosis
Pooled Sample (n=1,747)
att21 -.336 .059 .034 .117
att22 -.244 .059 -.127 .117
att23 -.657 .059 .523 .117
Table A6.2-11: Skewness and Kurtosis Statistics for Employees’ brand behaviour
(EB) Scale
Item Skewness Std. Error of
Skewness
Kurtosis Std. Error of
Kurtosis
Pooled Sample (n=1,747)
rol01 -.604 .059 .977 .117
rol02 -.673 .059 .692 .117
rol04 -.443 .059 .368 .117
rol05 -.491 .059 .548 .117
Tables A6.2-8, A6.2-9, A6.2-10, and A6.2-11 indicate that all dependent variables scales
have z-value of skewness within ± 2.58 range both in the high/low rankings sample and
pooled sample. Additionally, it was concluded that the EI, EC, EL and EB variables can be
taken into measure validation stage utilising Structural Equation Modelling with good levels
of confidence.
377
Bibliography
Abimbola, T., Lim, M., Foster, C., Punjaisri, K., & Cheng, R. (2010). Exploring the
relationship between corporate, internal and employer branding. Journal of Product &
Brand Management, 19(6), 401-409.
Abu Bakar, H., Dilbeck, K. E., & McCroskey, J. C. (2010). Mediating role of supervisory
communication practices on relations between leader–member exchange and
perceived employee commitment to workgroup. Communication Monographs, 77(4),
637-656.
Ahmed, P. K., Rafiq, M., & Saad, N. M. (2003). Internal marketing and the mediating role of
organisational competencies. European journal of Marketing, 37(9), 1221-1241.
Akaah, I. P., & Riordan, E. A. (1988). Applicability of marketing knowhow in the Third
World. International Marketing Review, 5(1), 41-55.
Akkirman, A. D., & Harris, D. L. (2005). Organizational communication satisfaction in the
virtual workplace. Journal of Management Development, 24(5), 397-409.
Alexander, E. R., & Wilkins, R. D. (1982). Performance rating validity: The relationship of
objective and subjective measures of performance. Group & Organization
Management, 7(4), 485-496.
Allan, S. (2004). Internal branding blueprint. B to B, 89(10), 9.
Allen, D. G., Scotter, J. R., & Otondo, R. F. (2004). Recruitment communication media:
Impact on prehire outcomes. Personnel Psychology, 57(1), 143-171.
Allen, N. J., & Meyer, J. P. (1990). The measurement and antecedents of affective,
continuance and normative commitment to the organization. Journal of occupational
psychology, 63(1), 1-18.
Allen, N. J., & Meyer, J. P. (1996). Affective, continuance, and normative commitment to the
organization: An examination of construct validity. Journal of vocational behavior,
49(3), 252-276.
Ambler, T., & Barrow, S. (1996). The employer brand. Journal of Brand Management, 4(3),
185-206.
Ambler, T., & Styles, C. (1997). Brand development versus new product development:
toward a process model of extension decisions. Journal of Product & Brand
Management, 6(4), 222-234.
Anderson, J. C., & Gerbing, D. W. (1988). Structural equation modeling in practice: A review
and recommended two-step approach. Psychological bulletin, 103(3), 411.
Appelbaum, E. (2000). Manufacturing advantage: Why high-performance work systems pay
off: Cornell University Press.

378
Argenti, P. A. (2007). Strategic Corporate Communication: Tata McGraw-Hill Publishing
Company.
Arif, S., Zubair, A., & Manzoor, Y. (2012). Innovative work behavior and communication
climate among employees of advertising agencies. FWU Journal of Social
Sciences, 6(1), 65.
Armstrong, M., & Taylor, S. (2014). Armstrong's handbook of human resource management
practice: Kogan Page Publishers.
ASEAN. (2011). Establishment. Retrieved 29 August, 2011, from
http://www.asean.org/64.htm
Asha, C.S. and Jyothi, P., (2013). Internal Branding: A Determining Element of
Organizational Citizenship Behaviour. Journal of Contemporary Management
Research, 7(1).
Ashforth, B. E., & Mael, F. (1989). Social identity theory and the organization. Academy of
management review, 14(1), 20-39.
Asif, S., & Sargeant, A. (2000). Modelling internal communications in the financial services
sector. European journal of Marketing, 34(3/4), 299-318.
Ayoko, O. B. (2007). Communication openness, conflict events and reactions to conflict in
culturally diverse workgroups. Cross Cultural Management: An International Journal,
14(2), 105-124.
Backhaus, K., & Tikoo, S. (2004). Conceptualizing and researching employer branding.
Career Development International, 9(5), 501-517.
Bagozzi, R. P., & Yi, Y. (1988). On the evaluation of structural equation models. Journal of
the Academy of Marketing Science, 16(1), 74-94.
Bakanauskienė, I., Bendaravičienė, R., & Krikštolaitis, R. (2015). Empirical evidence on
employees’ communication satisfaction and job satisfaction: Lithuania’s university
case. Management of Organizations: Systematic Research, (54), 21-36.
Bakar, H. A., Mohamad, B., & Mustafa, C. S. (2007). Superior–Subordinate Communication
Dimensions and Working Relationship: Gender Preferences in a Malaysian
Organization. Journal of Intercultural Communication Research, 36(1), 51-69.
Bakar, H. A., & Mustaffa, C. S. (2013). Organizational communication in Malaysia
organizations: Incorporating cultural values in communication scale. Corporate
Communications: An International Journal, 18(1), 87-109.
Baker, T. L., Rapp, A., Meyer, T., & Mullins, R. (2014). The role of brand communications on
front line service employee beliefs, behaviors, and performance. Journal of the
Academy of Marketing Science, 42(6), 642-657.
Bakar, H. A., Walters, T., & Halim, H. (2014). Measuring Communication Styles in the
Malaysian Workplace: Instrument Development and Validation.Journal of Intercultural

379
Communication Research, 43(2), 87-112.
Bambacas, M., & Patrickson, M. (2008). Interpersonal communication skills that enhance
organisational commitment. Journal of Communication Management, 12(1), 51-72.
Baron, R. M., & Kenny, D. A. (1986). The moderator–mediator variable distinction in social
psychological research: Conceptual, strategic, and statistical considerations. Journal
of personality and social psychology, 51(6), 1173.
Bart, C. K., Bontis, N., & Taggar, S. (2001). A model of the impact of mission statements on
firm performance. Management Decision, 39(1), 19-35.
Bartels, J., Pruyn, A., De Jong, M., & Joustra, I. (2007). Multiple organizational identification
levels and the impact of perceived external prestige and communication climate.
Journal of organizational Behavior, 28(2), 173-190.
Baumgartner, H., & Steenkamp, J.-B. E. (1996). Exploratory consumer buying behavior:
Conceptualization and measurement. International Journal of Research in Marketing,
13(2), 121-137.
Bentler, P. M. (1990). Comparative fit indexes in structural models. Psychological bulletin,
107(2), 238.
Bergstrom, A., Blumenthal, D., & Crothers, S. (2002). Why internal branding matters: the
case of Saab. Corporate Reputation Review, 5(2-3), 133-142.
Berry, L. L. (2000). Cultivating service brand equity. Journal of the Academy of Marketing
Science, 28(1), 128-137.
Berthon P, Ewing M, Hah LL. (2005). Captivating company: dimensions of attractiveness
in employer branding. International Journal of Advertising; 24(2),151–72.
Blombäck, A., & Brunninge, O. (2009). Corporate identity manifested through historical
references. Corporate Communications: An International Journal, 14(4), 404-419.
Bollen, K. A. (1989). Structural Equations with Latent Variables. New York: John Wiley &
Sons, Inc.
Boone, M. (2000). The importance of internal branding. Sales & Marketing Management, 9,
36-38.
BOT (2013). Annual Economic Report of Thailand (2012).
Bratton, J., Forshaw, C., Callinan, M., Sawchuk, P., & Corbett, M. (2010). Work and
Organizational Behaviour 2nd Edition: Understanding the Workplace: Palgrave
Macmillan.
Bratton, J., & Gold, J. (1994). Human resource management: theory and practice: Macmillan
Basingstoke.
Breeze, L., Dawson, A., & Khazhinsky, S. (2002). Humor in the Workplace: Anecdotal
Evidence Suggests Connection to Employee Performance. Humor, 2.
Brunetto, Y., & Farr-Wharton, R. (2004). Does the talk affect your decision to walk: A

380
comparative pilot study examining the effect of communication practices on
employee commitment post-managerialism. Management Decision, 42(3/4), 579-
600.
Brunetto, Y., Farr-Wharton, R., & Shacklock, K. (2011). The Impact of Supervisor–
Subordinate Relationships on Nurses' Ability to Solve Workplace Problems:
Implications for their Commitment to the Organization. Advances in health care
management, 10, 215-237.
Burmann, C., & Zeplin, S. (2005). Building brand commitment: A behavioural approach to
internal brand management. The Journal of Brand Management, 12(4), 279-300.
Buttle, F. A. (1994). The co-ordinated management of meaning: A case exemplar of a new
consumer research technology. European journal of Marketing, 28(8/9), 76-99.
Burris, E., Rockmann, K. W., & Kim, Y. (2014). The Value of Voice (to Managers): Employee
Identification and the Content of Voice. Academy of Management Proceedings, Vol.
2014, No. 1, p. 16330.
Byrne, B. M. (2013). Structural equation modeling with AMOS: Basic concepts, applications,
and programming: Routledge.
Byrne, B. M., Shavelson, R. J., & Muthén, B. (1989). Testing for the equivalence of factor
covariance and mean structures: The issue of partial measurement invariance.
Psychological bulletin, 105(3), 456.
Byrne, Z. S., & LeMay, E. (2006). Different media for organizational communication:
perceptions of quality and satisfaction. Journal of Business and Psychology, 21(2),
149-173.
Camilleri, C. S. (2008). True blue: authenticity and Yalumba's journey of discovery.[This is a
revised version of a paper delivered at the Conference on Corporate Communication
at Wroxton College, June 6-9, 2008.]. Australian Journal of Communication, 35(3),
41.
Carriere, J., & Bourque, C. (2009). The effects of organizational communication on job
satisfaction and organizational commitment in a land ambulance service and the
mediating role of communication satisfaction. Career Development International,
14(1), 29-49.
Carson, D., Gilmore, A., Perry, C., & Gronhaug, K. (2001). Qualitative marketing research:
Sage.
Chan, S. C., & Mak, W. M. (2014). Team Identification and Interpersonal Helping Behavior in
Work Teams: A Hotel Industry Study. Journal of Human Resources in Hospitality &
Tourism, 13(1), 17-33.
Chava, F.-N., & David, N. (1996). Research methods in the social sciences. St. Martins
Press.
381
Chen, S. Y., Wu, W. C., Chang, C. S., & Lin, C. T. (2015). Job rotation and internal marketing
for increased job satisfaction and organisational commitment in hospital nursing
staff. Journal of nursing management, 23(3), 297-306.
Chen, P.-J., Okumus, F., Hua, N., & Nusair, K. K. (2011). Developing effective
communication strategies for the Spanish and Haitian-Creole-speaking workforce in
hotel companies. Worldwide Hospitality and Tourism Themes, 3(4), 335-353.
Chen, Z. X., & Francesco, A. M. (2003). The relationship between the three components of
commitment and employee performance in China. Journal of vocational behavior,
62(3), 490-510.
Cheney, G. (1983). The rhetoric of identification and the study of organizational
communication. Quarterly journal of speech, 69(2), 143-158.
Chong, M. (2007). The role of internal communication and training in infusing corporate
values and delivering brand promise: Singapore Airlines' experience. Corporate
Reputation Review, 10(3), 201-212.
Chory, R. M., & Hubbell, A. P. (2008). Organizational justice and managerial trust as
predictors of antisocial employee responses. Communication Quarterly, 56(4), 357-
375.
Churchill, G., & Iacobucci, D. (2005). Market research. Mason, Ohio: Thomson South-
Western.
Churchill Jr, G. A. (1979). A paradigm for developing better measures of marketing
constructs. Journal of marketing research, 64-73.
Chowdhury, A. H., Chowdhury, M. S. A., & Imran, M. (2015). Branding strategies for service
firms-a study on the selected Internet Service Providers (ISPs) in Bangladesh. Asian
Business Review, 2(1), 47-53.
Clampitt, P. G., & Downs, C. W. (1993). Employee perceptions of the relationship between
communication and productivity: A field study. Journal of business communication,
30(1), 5-28.
Clark, L. A., & Watson, D. (1995). Constructing validity: Basic issues in objective scale
development. Psychological assessment, 7(3), 309.
Clegg, C. W. (1983). Psychology of employee lateness, absence, and turnover: A
methodological critique and an empirical study. Journal of Applied Psychology, 68(1),
88.
Clutterbuck, D. (2005). Communication and the psychological contract. Journal of
Communication Management, 9(4), 359-364.
Collis, D. J., & Montgomery, C. A. (2008). Competing on resources. Harvard Business
Review.
Collis, J. H., & Hussey, R. (2003). Business Research-A practical guide for undergraduate
382
and postgraduate students. Hampshire: Palgrave Macmillan.
Comer, J. S., & Kendall, P. C. (2013). The Oxford handbook of research strategies for clinical
psychology: Oxford University Press.
Cui, A. S., Griffith, D. A., Cavusgil, S. T., & Dabic, M. (2006). The influence of market and
cultural environmental factors on technology transfer between foreign MNCs and
local subsidiaries: A Croatian illustration. Journal of World Business, 41(2), 100-111.
Cuyvers, L., De Lombaerde, P., & Verherstraeten, S. (2005). From AFTA towards an ASEAN
economic community... and beyond: Centre for ASEAN studies (CAS).
Czinkota, M. R., Ronkainen, I. A., Moffett, M. H., Marinova, S., & Marinov, M. (2009).
International business (Vol. 4): Dryden Press.
Daft, R. L., & Lengel, R. H. (1983). Information richness. A new approach to managerial
behavior and organization design: DTIC Document.
Daft, R. L., Lengel, R. H., & Trevino, L. K. (1987). Message equivocality, media selection,
and manager performance: Implications for information systems. MIS quarterly, 355-
366.
Dasgupta, S. A., Suar, D., & Singh, S. (2012). Impact of managerial communication styles on
employees' attitudes and behaviours. Employee Relations, 35(2), 173-199.
Davies, G., Chun, R. and Kamins, M.A. (2010), “Reputation gaps and the performance of service organizations”, Strategic Management Journal, Vol. 31 No. 5, pp. 530-546.
Dawson, M., Madera, J. M., Neal, J. A., & Chen, J. (2012). The Influence of Hotel
Communication Practices on Managers' Communication Satisfaction With Limited
EnglishSpeaking Employees. Journal of Hospitality & Tourism Research,
1096348012461552.
De Bussy, N. M., Ewing, M. T., & Pitt, L. F. (2003). Stakeholder theory and internal marketing
communications: a framework for analysing the influence of new media. Journal of
Marketing Communications, 9(3), 147-161.
De Chernatony, L. (2002). From brand vision to brand evaluation. JOURNAL OF
COMMUNICATION MANAGEMENT-LONDON-, 6, 295-296.
De Chernatony, L., & Cottam, S. (2006). Why are all financial services brands not great?
Journal of Product & Brand Management, 15(2), 88-97.
De Chernatony, L., & Segal-Horn, S. (2001). Building on services' characteristics to develop
successful services brands. Journal of Marketing Management, 17(7-8), 645-669.
De Chernatony, L., & Segal-Horn, S. (2003). The criteria for successful services brands.
European journal of Marketing, 37(7/8), 1095-1118.
DeCotiis, T. A., & Summers, T. P. (1987). A path analysis of a model of the antecedents and
consequences of organizational commitment. Human Relations, 40(7), 445-470.
Denison, D. R., Haaland, S., & Goelzer, P. (2004). Corporate culture and organizational

383
effectiveness: Is Asia different from the rest of the world? Organizational Dynamics,
33(1), 98-109.
DeVellis, R. F. (2012). Scale development: Theory and applications (Vol. 26): Sage
publications.
Diamond, G. A. (1992). Field theory and rational choice: A Lewinian approach to modeling
motivation. Journal of Social Issues, 48(2), 79-94.
Dortok, A. (2006). A managerial look at the interaction between internal communication and
corporate reputation. Corporate Reputation Review, 8(4), 322-338.
Downs, C. W. (1988). Communication audits: Scott, Foresman Glenview, IL.
Downs, C. W., & Adrian, A. D. (2012). Assessing organizational communication: Strategic
communication audits: Guilford Press.
Downs, C. W., & Hazen, M. D. (1977). A factor analytic study of communication satisfaction.
Journal of business communication, 14(3), 63-73.
Drake, S., Gulman, M., & Roberts, S. (2005). Light their fire: using internal marketing to
ignite employee performance and wow your customers: Kaplan Publishing.
Du Preez, R. and Bendixen, M.T., 2015. The impact of internal brand management on
employee job satisfaction, brand commitment and intention to stay. International
Journal of Bank Marketing, 33(1), pp.78-91.
Dunmore. (2002). Inside-out Marketing: How to Create an Internal Marketing Strategy.
London: Kogan Page.
Dutton, J. E., Dukerich, J. M., & Harquail, C. V. (1994). Organizational images and member
identification. Administrative science quarterly, 239-263.
Earley, C. P., & Mosakowski, E. (2000). Creating hybrid team cultures: An empirical test of
transnational team functioning. Academy of Management Journal, 43(1), 26-49.
Easterby-Smith, M., Thorpe, R., & Jackson, P. (2012). Management research: Sage
Publications.
Ebren, F. (2006). Impact of Integrated Marketing Communications Programs in Enhancing
Manager and Employee Performance. HUMAN AND ECONOMIC RESOURCES
PROCEEDINGS BOOK, 14.
Edwards, M. R., & Edwards, T. (2012). Company and country effects in international mergers
and acquisitions: Employee perceptions of a merger in three European
countries. Economic and Industrial Democracy, 33(3), 505-529.
Ehrenberg, A. (2000). Repeat Buying. Journal of Empirical Generalisations in Marketing
Science, 5(2).
Eisenberg, E. M. (2009). Organizational Communication: Balancing Creativity And Constraint
Author: Eric M. Eisenberg, HL Goodall, Angela Trethwey.
Eisenberger, R., Fasolo, P., & Davis-LaMastro, V. (1990). Perceived organizational support
384
and employee diligence, commitment, and innovation. Journal of Applied Psychology,
75(1), 51.
Elving, W. (2005). The role of communication in organizational change. Corporate
Communications: An International Journal, 10(2), 12-138.
Everitt, B. S., & Skrondal, A. (2002). The Cambridge dictionary of statistics. Cambridge:
Cambridge.
F. Young, S., & A. Steelman, L. (2014). The role of feedback in supervisor and workgroup
identification. Personnel Review, 43(2), 228-245.
Fawkes, J., & Gregory, A. (2001). Applying communication theories to the internet. Journal of
Communication Management, 5(2), 109-124.
Fedor, D. B., Caldwell, S., & Herold, D. M. (2006). The effects of organizational changes on
employee commitment: A multilevel investigation. Personnel Psychology, 59(1), 1-29.
Foote, D. A., Seipel, S. J., Johnson, N. B., & Duffy, M. K. (2005). Employee commitment and
organizational policies. Management Decision, 43(2), 203-219.
Ford, J. K., MacCallum, R. C., & Tait, M. (1986). The application of exploratory factor
analysis in applied psychology: A critical review and analysis. Personnel Psychology,
39(2), 291-314.
Foreman, J., & Argenti, P. A. (2005). How corporate communication influences strategy
implementation, reputation and the corporate brand: an exploratory qualitative study.
Corporate Reputation Review, 8(3), 245-264.
Foreman, S. (1997). IC and the healthy organisation. Handbook of internal communication.
Fornell, C., & Larcker, D. F. (1981). Evaluating structural equation models with unobservable
variables and measurement error. Journal of marketing research, 39-50.
Fornes, S. L., Rocco, T. S., & Wollard, K. K. (2008). Workplace commitment: A conceptual
model developed from integrative review of the research. Human Resource
Development Review.
Free, C. (1999). The internal brand. Journal of Brand Management, 6(4), 231-236.
Frenkel, S., Restubog, S. L. D., & Bednall, T. (2012). How employee perceptions of HR
policy and practice influence discretionary work effort and co-worker assistance:
evidence from two organizations. The International Journal of Human Resource
Management, 23(20), 4193-4210.
Frimpong, K., & Wilson, A. (2013). Relative importance of satisfaction dimensions on service
performance: A developing country context. Journal of Service Management, 24(4),
401-419.
Fu, Y.-Y., & Mount, D. J. (2002). Older Workers' Communication Satisfaction in the Lodging
Industry. Journal of Human Resources in Hospitality & Tourism, 1(1), 59-73.
Gaines, J. H. (1980). Upward communication in industry: An experiment. Human Relations,

385
33(12), 929-942.
Galbraith, J. R. (1973). Designing complex organizations: Addison-Wesley Longman
Publishing Co., Inc.
Gapp, R., & Merrilees, B. (2006). Important factors to consider when using internal branding
as a management strategy: A healthcare case study. Journal of Brand Management,
14(1), 162-176.
Gardner, C. M. (2009). Demographic characteristics that influence leadership,
communication, and citizenship behaviors in a military hospital: THE UNIVERSITY
OF OKLAHOMA.
Gelb, B. and Rangarajan, D. (2014), “Employee contributions to brand equity”, California
Management Review, Vol. 56 No. 2, pp. 95-112.
Gill, R. (2011). Corporate storytelling as an effective internal public relations strategy.
International Business and Management, 3(1), 17-25.
Gilly, M. C., & Wolfinbarger, M. (1998). Advertising's internal audience. The Journal of
Marketing, 69-88.
Gino, F., & Pisano, G. P. (2011). Why leaders don’t learn from success. Harvard Business
Review, 89(4), 68-74.
Gkorezis, P., Bellou, V., & Skemperis, N. (2015). Nonverbal communication and relational
identification with the supervisor: Evidence from two countries.Management
Decision, 53(5), 1005-1022.
Goldhaber, G. M., & Rogers, D. P. (1979). Auditing organizational communication systems:
the ICA commmunication audit: Kendall/Hunt Pub. Co.
Goleman, D. (1998). Working with emotional intelligence: Random House LLC.
Goodman, M., & Koul, S. (2009). Communication structure of the public sector in India: an
empirical analysis. Corporate Communications: An International Journal, 14(3), 320-
332.
Goris, J. R., Vaught, B. C., & Pettit, J. D. (2000). Effects of communication direction on job
performance and satisfaction: a moderated regression analysis. Journal of business
communication, 37(4), 348-368.
Gray, J., & Laidlaw, H. (2002). Part-time employment and communication satisfaction in an
Australian retail organisation. Employee Relations, 24(2), 211-228.
Gray, J., & Laidlaw, H. (2004). Improving the measurement of communication satisfaction.
Management Communication Quarterly, 17(3), 425-448.
Greenbaum, H. H., Clampitt, P., & Willihnganz, S. (1988). Organizational Communication An
Examination of Four Instruments. Management Communication Quarterly, 2(2), 245-
282.
Gronroos, C. (1990). Service management: a management focus for service competition.
386
International Journal of Service Industry Management, 1(1), 0-0.
Grunig, J. E., Grunig, L. A., Sriramesh, K., Huang, Y.-H., & Lyra, A. (1995). Models of public
relations in an international setting. Journal of Public Relations Research, 7(3), 163-
186.
Gu, Q., Tang, T. L. P., & Jiang, W. (2015). Does moral leadership enhance employee
creativity? Employee identification with leader and leader–member exchange (LMX)
in the Chinese context. Journal of Business Ethics, 126(3), 513-529.
Guerber, A., Reychav, I., & Anand, V. (2014). Searching Inside and Out: Organizational
Identification Relationships and Information-Sourcing among Managers and
Knowledge-Workers. Journal of Managerial Issues, 26(1), 22.
Guest, D. E., & Conway, N. (2002). Communicating the psychological contract: an employer
perspective. Human Resource Management Journal, 12(2), 22-38.
Gümüş, M., & Hamarat, L. B. (2014). Communication Satisfaction and Communicative
Adaptability Reinforce Organizational Identification. Journal of Tourism and
Hospitality Management, 2(1), 19-37.
Guzley, R. M. (1992). Organizational climate and communication climate predictors of
commitment to the organization. Management Communication Quarterly, 5(4), 379-
402.
Hair, J. F., Tatham, R. L., Anderson, R. E., & Black, W. (2006). Multivariate data analysis
(Vol. 6): Pearson Prentice Hall Upper Saddle River, NJ.
Hair, J. F. J., Anderson, R.E., Tatham, R.L., & Black, W.C. (1998). Multivariate Data Analysis.
Upper Saddle River, NJ: Prentice Hall.
Hair Jr, J. F., & Lukas, B. (2014). Marketing research: McGraw-Hill Education Australia.
Hall, H. (2001). Input-friendliness: motivating knowledge sharing across intranets. Journal of
information science, 27(3), 139-146.
Hall, M. (2005). Assessing the information and consultation of employees regulations.
Industrial Law Journal, 34(2), 103-126.
Hamilton, S. (1987). A communication audit handbook: helping organizations communicate:
Pitman.
Hardesty, D. M., & Bearden, W. O. (2004). The use of expert judges in scale development:
Implications for improving face validity of measures of unobservable constructs.
journal of Business Research, 57(2), 98-107.
Hargie, O., & Dickson, D. (2007). Are important corporate policies understood by
employees?: A tracking study of organizational information flow. Journal of
Communication Management, 11(1), 9-28.
Harley, B. (2001). Team membership and the experience of work in Britain: an analysis of
the WERS98 data. Work, Employment & Society, 15(4), 721-742.

387
Hart, C., Vroman, M., & Stulz, K. (2015). Experiential, Collaborative And Team Projects:
Communication Audits In The MBA Communication Course.American Journal of
Business Education (Online), 8(4), 289.
Hawabhay, B. B., Abratt, R., & Peters, M. (2009). The role of corporate communications in
developing a corporate brand image and reputation in Mauritius. Corporate
Reputation Review, 12(1), 3-20.
Hecht, M. L. (1978). The conceptualization and measurement of interpersonal
communication satisfaction. Human Communication Research, 4(3), 253-264.
Henderson, A., Cheney, G., & Weaver, C. K. (2015). The role of employee identification and
organizational identity in strategic communication and organizational issues
management about genetic modification. International Journal of Business
Communication, 52(1), 12-41.
Henkel, S., Tomczak, T., Heitmann, M., & Herrmann, A. (2007). Managing brand consistent
employee behaviour: relevance and managerial control of behavioural branding.
Journal of Product & Brand Management, 16(5), 310-320.
Herstein, R., Mitki, Y., & Jaffe, E. D. (2008). Communicating a new corporate image during
privatization: the case of El Al airlines. Corporate Communications: An International
Journal, 13(4), 380-393.
Herzberg, F. (1968). How do you motivate employees? Harvard Business Review(Jan.-
Feb.), 53-62.
Herzberg, F. (1974). Wise Old Turk. Harvard Business Review, 52(5), 70-80.
Heskett, J. L., & Schlesinger, L. (1994). Putting the service-profit chain to work. Harvard
Business Review, 72(2), 164-174.
Hilton, N., & Sherman, R. O. (2015). Promoting Work Engagement: One Medical Center’s
Journey. Nurse Leader, 13(6), 52-57.
Hofstede, G. (2003). What is culture? A reply to Baskerville. Accounting, Organizations and
Society, 28(7), 811-813.
Hooper, D., Coughlan, J., & Mullen, M. (2008). Structural equation modelling: Guidelines for
determining model fit. Articles, 2.
Horomia, K. (2007). An investigation of internal communication within the New Zealand
financial sector.
Howard, C. M. (1998). How your employee communications programs can boost productivity
and pride. Public Relations Quarterly, 43(3), 15-23.
Hoyle, R. H. (1995). Structural equation modeling: Concepts, issues, and applications: Sage
Publications.
Hu, L. t., & Bentler, P. M. (1999). Cutoff criteria for fit indexes in covariance structure
analysis: Conventional criteria versus new alternatives. Structural equation modeling:

388
a multidisciplinary journal, 6(1), 1-55.
Huczynski, A., & Buchanan, D. A. (2013). Organizational behaviour. Financial Times Prentice
Hall.
Hui-Chun, Yu, & Miller, P. (2003). The generation gap and cultural influence-a Taiwan
empirical investigation. Cross Cultural Management: An International Journal, 10(3),
23-41.
Hunt, O., Tourish, D., & Hargie, O. D. (2000). The communication experiences of education
managers: identifying strengths, weaknesses and critical incidents. International
Journal of Educational Management, 14(3), 120-129.
Hunt, S. D. (1993). Objectivity in marketing theory and research. The Journal of Marketing,
76-91.
Husse, J., & Hussey, R. (1997). Business research: a practical guide for undergraduate and
postgraduate students. Basingstock: Macmillan Business.
Hytti, U., Kuoppakangas, P., Suomi, K., Chapleo, C. and Giovanardi, M., 2015. Challenges in
delivering brand promise–focusing on municipal healthcare
organisations. International Journal of Public Sector Management,28(3), pp.254-272.
Ibarra, H. (1999). Provisional selves: Experimenting with image and identity in professional
adaptation. Administrative science quarterly, 44(4), 764-791.
Ind, N. (2003). Inside out: How employees build value. The Journal of Brand Management,
10(6), 393-402.
Ind, N. (2014). How participation is changing the practice of managing brands.Journal of
Brand Management, 21(9), 734-742.
Jablin, F. M. (1979). Superior–subordinate communication: The state of the art.
Psychological bulletin, 86(6), 1201.
Janssen, O. (2005). The joint impact of perceived influence and supervisor supportiveness
on employee innovative behaviour. Journal of occupational and organizational
psychology, 78(4), 573-579.
Jarvenpaa, S. L., & Staples, D. S. (2001). Exploring perceptions of organizational ownership
of information and expertise. Journal of Management Information Systems, 18(1),
151-183.
Jeavons, T. H. (1994). When the bottom line is faithfulness: Management of Christian service
organizations: Indiana University Press.
Johlke, M. C., & Duhan, D. F. (2000). Supervisor communication practices and service
employee job outcomes. Journal of Service Research, 3(2), 154-165.
John P. Meyer, N. J. A. (1997). Commitment in the Workplace: Theory, Research, and
Application. London: Sage Publications.
Jöreskog, K. a. L., J.S. (1993). "Introduction," in Testing Structural Equation Models.

389
Newbury Park, CA: Sage.
Joseph, W. B. (1996). Internal marketing builds service quality. Journal of Health Care
Marketing, 16(1), 54-59.
Juholin, E., Åberg, L., & Aula, P. (2015). Towards responsible dialogue: Searching for the
missing piece of strategic employee communication.Communication ethics in a
connected world. Brussels: Peter Lang.
Jurišová, V., & Ďurková, K. (2012). CSR communication and its impact on corporate
image. Review of Applied Socio-Economic Research, 4(2), 145-149.
Kalla, H. K. (2005). Integrated internal communications: a multidisciplinary perspective.
Corporate Communications: An International Journal, 10(4), 302-314.
Kapoor, V. (2010). Employer branding: A study of its relevance in India. The IUP Journal of
Brand Management, 7(1), 51-75.
Karanges, E., Johnston, K., Beatson, A., & Lings, I. (2015). The influence of internal
communication on employee engagement: A pilot study. Public Relations
Review, 41(1), 129-131.
Katz, R. (1978). The influence of job longevity on employee reactions to task characteristics.
Human Relations, 31(8), 703-725.
Khabir, M. L. (2014). What are the Factors that Make an Employer Attractive in the Eyes of
Prospective Employees in Bangladesh?. Development, 4, 704.
Khan, B. M. (2009). Internal branding: aligning human capital strategy with brand strategy.
ICFAI Journal of Brand Management, 6(2), 22-36.
Kim, S. (2002). Participative management and job satisfaction: Lessons for management
leadership. Public Administration Review, 62(2), 231-241.
Kimpakorn, N., & Tocquer, G. (2010). Service brand equity and employee brand
commitment. Journal of Services Marketing, 24(5), 378-388.
King, C., & Grace, D. (2010). Building and measuring employee-based brand equity.
European journal of Marketing, 44(7/8), 938-971.
King, C. and Grace, D. (2012), “Examining the antecedents of positive employee brand-
related attitudes and behaviours”, European Journal of Marketing, Vol. 46 Nos 3/4,
469-488.
King Jr, W. C., Lahiff, J. M., & Hatfield, J. D. (1988). A discrepancy theory of the relationship
between communication and job satisfaction. Communication Research Reports,
5(1), 36-43.
Kipnis, Y. (2015). Consumer Multiculturation: Consequences of Multicultural Identity
Dynamics for Consumption. (PhD), Durham University.
Kitchen, P. (1997). Public Relations: Principle and Practice (1st Ed.). London: Thomson
Business Press.

390
Kotter, J. P. (2008). Corporate culture and performance: Simon and Schuster.
Kotler, P. and Armstrong, G., (2013). Principles of Marketing 15th Global Edition. Pearson.
Kumar, V., & Pansari, A. (2014). The Construct, Measurement, and Impact of Employee
Engagement: a Marketing Perspective. Customer Needs and Solutions, 1(1), 52-67.
Lai, C.S. and Hsu, K.T., (2015). Internal branding with corporate ethical values and corporate
social responsibility: The case of the life insurance industry in Taiwan. South African
Journal of Business Management, 46(1), pp.47-55.
Lam, S. S., Chen, X.-P., & Schaubroeck, J. (2002). Participative decision making and
employee performance in different cultures: The moderating effects of
allocentrism/idiocentrism and efficacy. Academy of Management Journal, 45(5), 905-
914.
Lam, M., O'Donnell, M., & Robertson, D. (2015). Achieving employee commitment for
continuous improvement initiatives. International Journal of Operations & Production
Management, 35(2), 201-215.
Larson, J. R. (1989). The dynamic interplay between employees' feedback-seeking
strategies and supervisors' delivery of performance feedback. Academy of
management review, 14(3), 408-422.
Latham, G. P., & Locke, E. A. (1979). Goal setting—A motivational technique that works.
Organizational Dynamics, 8(2), 68-80.
Lee, Y.-K., Kim, S., & Kim, S. Y. (2013). The Impact of Internal Branding on Employee
Engagement and Outcome Variables in the Hotel Industry. Asia Pacific Journal of
Tourism Research(ahead-of-print), 1-22.
Lee, Y. K., Kim, S., & Kim, S. Y. (2014). The impact of internal branding on employee
engagement and outcome variables in the hotel industry. Asia Pacific Journal of
Tourism Research, 19(12), 1359-1380.
Levine, J. M., & Moreland, R. L. (1990). Progress in small group research. Annual review of
psychology, 41(1), 585-634.
Lin, S. H., Huang, L. C., Chang, C. C., Lin, C. S., Chang, P. C., & Chen, P. F. (2013). The
role of person and organizational variables in the three component model of
occupational commitment. Canadian Journal of Administrative Sciences/Revue
Canadienne des Sciences de l'Administration, 30(2), 115-126.
Liu, G., Chapleo, C., Ko, W.W. and Ngugi, I.K., 2015. The Role of Internal Branding in
Nonprofit Brand Management An Empirical Investigation.Nonprofit and Voluntary
Sector Quarterly, 44(2), pp.319-339.
Löhndorf, B. and Diamantopoulos, A. (2014), “Internal branding social identity and social
391
exchange perspectives on turning employees into brand champions”, Journal of
Service Research, Vol. 17 No. 3, 310-325.
Lovelock, C. (1992). Designing and managing the customer-service function. Managing
Services (Marketing, Operations and Human Resources).
Loveman, G. W. (1998). Employee satisfaction, customer loyalty, and financial performance
an empirical examination of the service profit chain in retail banking. Journal of
Service Research, 1(1), 18-31.
Luke, J. (2009). When a quiet word beat sending e-mial. Retrieved 9 July, 2015, from
http://www.ft.com/cms/s/0/58d9366c-600e-11de-a09b-
00144feabdc0.html#axzz3fOfRRrOL
Iyer, S., & Israel, D. (2012). Structural equation modeling for testing the impact of
organization communication satisfaction on employee engagement. South Asian
Journal of Management, 19(1), 51.
Maanen, J., & Katz, R. (1976). INDIVIDUALS AND THEIR CAREERS: SOME TEMPORAL
CONSIDERATIONS FOR WORK SATISFACTION1. Personnel Psychology, 29(4),
601-616.
MacLaverty, N., McQuillan, P., & Oddie, H. (2007). Internal Branding Best Practices Study.
Canadian Marketing Association. Retrieved December, 2, 2008.
MacLeod, D., & Clarke, N. (2011). Engaging for success: enhancing performance through
employee engagement, a report to Government.
Mael, F., & Ashforth, B. E. (1992). Alumni and their alma mater: A partial test of the
reformulated model of organizational identification. Journal of organizational
Behavior, 13(2), 103-123.
Mahnert, K. F., & Torres, A. M. (2007). The Brand Inside: The Factors of Failure and Success
in Internal Branding-Special Issue on Irish Perspectives on Marketing Relationships
and Networks. Irish Marketing Review.
Malhotra, N. K. (2008). Marketing research: An applied orientation, 5/e: Pearson Education
India.
Malhotra, N. K., Agarwal, J., & Peterson, M. (1996). Methodological issues in cross-cultural
marketing research: A state-of-the-art review. International Marketing Review, 13(5),
7-43.
Markon, K. (2010). Modeling psychopathology structure: a symptom-level analysis of Axis I
and II disorders. Psychological Medicine, 40(02), 273-288.
Matanda, M. J., & Ndubisi, N. O. (2013). Internal marketing, internal branding, and
organisational outcomes: The moderating role of perceived goal congruence. Journal
of Marketing Management, 29(9-10), 1030-1055.
392
Mayer, R. C., Davis, J. H., & Schoorman, F. D. (1995). An integrative model of organizational
trust. Academy of management review, 20(3), 709-734.
Mazzei, A. (2010). Promoting active communication behaviours through internal
communication. Corporate Communications: An International Journal, 15(3), 221-
234.
McDonald, M. (1996). Strategic marketing planning: theory, practice and research agendas.
Journal of Marketing Management, 12(1-3), 4-27.
McGregor, D. (1960). The human side of enterprise. New York, 21, 166.
McKenna, E. F. (2012). Business psychology and organisational behaviour: a student's
handbook: Psychology Press.
McKenzie, K. L. (2015). The Relationship Between Organizational Communication and
Campus Climate as an Indicator of Organizational Effectiveness (Doctoral
dissertation, Indiana University of Pennsylvania).
McMurray, A. J., Scott, D. R., & Pace, R. W. (2004). The relationship between organizational
commitment and organizational climate in manufacturing. Human Resource
Development Quarterly, 15(4), 473-488.
Meintjes, C., & Steyn, B. (2006). A critical evaluation of the Downs-Hazen instrument (CSQ)
by measuring employee communication satisfaction at a private higher education
institution in South Africa.
Melewar, T., & Akel, S. (2005). The role of corporate identity in the higher education sector: a
case study. Corporate Communications: An International Journal, 10(1), 41-57.
Mellinger, G. D. (1956). Interpersonal trust as a factor in communication. The Journal of
Abnormal and Social Psychology, 52(3), 304.
Mestre, M., Stainer, A., Stainer, L., & Strom, B. (2000). Visual communications–the
Japanese experience. Corporate Communications: An International Journal, 5(1), 34-
41.
Meyer, J. P., Allen, N. J., & Smith, C. A. (1993). Commitment to organizations and
occupations: Extension and test of a three-component conceptualization. Journal of
Applied Psychology, 78(4), 538.
Meyer, J. P., Paunonen, S. V., Gellatly, I. R., Goffin, R. D., & Jackson, D. N. (1989).
Organizational commitment and job performance: It's the nature of the commitment
that counts. Journal of Applied Psychology, 74(1), 152.
Michlitsch, J. F. (2000). High-performing, loyal employees: the real way to implement
strategy. Strategy & Leadership, 28(6), 28-33.
Miller, K. (2014). Organizational communication: Approaches and processes: Cengage
Learning.
Mishra, N., Sharma, N. and Kamalanabhan, T.J., 2015. Is Internal Communication Important
393
for Sport Commitment Survey of Indian Cricket Players. Communication & Sport.
Mohamad, S. F. (2008). Effects of communication on turnover intention: a case of hotel
employees in Malaysia: ProQuest.
Moorehead, G., & Griffin, R. W. (2010). Organizational behavior: Managing people and
organizations: South-Western/Cengage Learning.
Morhart, F.M., Herzog, W. and Tomczak, T. (2009), “Brand-specific leadership: turning
employees into brand champions”, Journal of Marketing, Vol. 73 No. 5, pp. 122-142.
Mount, D. J., & Back, K.-J. (1999). A factor-analytic study of communication satisfaction in
the lodging industry. Journal of Hospitality & Tourism Research, 23(4), 401-418.
Mount, D. J., & Bartlett, A. B. (2002). Development of a job satisfaction factor model for the
lodging industry. Journal of Human Resources in Hospitality & Tourism, 1(1), 17-39.
Mowday, R. T., Porter, L. W., & Steers, R. M. (2013). Employee—organization linkages: The
psychology of commitment, absenteeism, and turnover: Academic Press.
Mowday, R. T., Steers, R. M., & Porter, L. W. (1979). The measurement of organizational
commitment. Journal of vocational behavior, 14(2), 224-247.
Mueller, B. H., & Lee, J. (2002). Leader-member exchange and organizational
communication satisfaction in multiple contexts. Journal of business communication,
39(2), 220-244.
Mullane, J. V. (2002). The mission statement is a strategic tool: when used properly.
Management Decision, 40(5), 448-455.
Murthy, V., & Guthrie, J. (2013). Accounting for workplace flexibility: Internal communication
in an Australian financial institution. Accounting Research Journal, 26(2), 109-129.
Mustamil, N., Yazdi, A. M., Syeh, S. S., & Ali, M. A. (2014). A Dimensional Analysis of the
Relationship between Communication Satisfaction and Turnover Intention: The
Mediating Role of Organizational Commitment. International Journal of Business and
Management, 9(9), 75.
Nakra, R. (2006). Relationship between communication satisfaction and organizational
identification: an empirical study. Vision: The Journal of Business Perspective, 10(2),
41-51.
Narangajavana, Y., & Hu, B. (2008). The relationship between the hotel rating system,
service quality improvement, and hotel performance changes: a canonical analysis of
hotels in Thailand. Journal of quality assurance in hospitality & tourism, 9(1), 34-56.
Narteh, B., & Odoom, R. (2015). Does Internal Marketing Influence Employee Loyalty?
Evidence From the Ghanaian Banking Industry. Services Marketing Quarterly, 36(2),

394
112-135.
Naz, S., & Gul, S. (2014). Moderating Role of Organizational Commitment between
Communication Satisfaction and Turnover Intentions Among Nurses.Pakistan Journal
of Psychological Research, 29(1), 39.
Neher, W. W. (1996). Organizational communication: Challenges of change, diversity, and
continuity: Allyn and Bacon.
Nelson, S., Brunetto, Y., Farr-Wharton, R., & Currant, N. (2007). The impact of NPM on the
stress level of Australian nurses.
Netemeyer, R. G., Bearden, W. O., & Sharma, S. (2003). Scaling procedures: Issues and
applications: Sage.
Neves, P. and Eisenberger, R., (2012). Management communication and employee
performance: The contribution of perceived organizational support.Human
Performance, 25(5), pp.452-464.
Niehoff, B. P., Enz, C. A., & Grover, R. A. (1990). The impact of top-management actions on
employee attitudes and perceptions. Group & Organization Management, 15(3), 337-
352.
Nilsson, L., Johnson, M. D., & Gustafsson, A. (2001). The impact of quality practices on
customer satisfaction and business results: product versus service organizations.
Journal of Quality Management, 6(1), 5-27.
Nunnally, J. C., Bernstein, I. H., & Berge, J. M. t. (1967). Psychometric theory (Vol. 226):
McGraw-Hill New York.
Nunnally, J. C., & Bernstein, I. (1994). The assessment of reliability. Psychometric theory, 3,
248-292.
O'Loughlin, D., Szmigin, I., & Turnbull, P. (2004). From relationships to experiences in retail
financial services. International Journal of Bank Marketing, 22(7), 522-539.
Olins, W., Selame, E. (2000). The Corporate Identity Audit. London: Prentice-Hall.
Omilion-Hodges, L. M., & Baker, C. R. (2014). Everyday talk and convincing conversations:
Utilizing strategic internal communication. Business Horizons,57(3), 435-445.
Palmer, A. (1994). Principles of services marketing: McGraw-Hill Book Company Limited.
Papasolomou, I., & Vrontis, D. (2006). Building corporate branding through internal
marketing: the case of the UK retail bank industry. Journal of Product & Brand
Management, 15(1), 37-47.
Parasuraman, A., Zeithaml, V. A., & Berry, L. L. (1985). A conceptual model of service quality
and its implications for future research. The Journal of Marketing, 41-50.
Parolia, N., Goodman, S., Li, Y., & Jiang, J. J. (2007). Mediators between coordination and
IS project performance. Information & Management, 44(7), 635-645.
Peter, J. P., & Olson, J. C. (1989). The relativist/constructionist perspective on scientific

395
knowledge and consumer research. Interpretive consumer research, 24-28.
Petty, R. E., & Cacioppo, J. T. (1984). The effects of involvement on responses to argument
quantity and quality: Central and peripheral routes to persuasion. Journal of
personality and social psychology, 46(1), 69.
Piercy, N., & Morgan, N. (1990). Internal marketing: making marketing happen. Marketing
Intelligence & Planning, 8(1), 4-6.
Pincus, J. D. (1986). Communication satisfaction, job satisfaction, and job performance.
Human Communication Research, 12(3), 395-419.
Pincus, J. D., Rayfield, R. E., & Cozzens, M. D. (1991). The chief executive officer's internal
communication role: A benchmark program of research. Journal of Public Relations
Research, 3(1-4), 1-35.
Ping, R. A. (2004). On assuring valid measures for theoretical models using survey data.
journal of Business Research, 57(2), 125-141.
Porter, L. W., & Steers, R. M. (1973). Organizational, work, and personal factors in employee
turnover and absenteeism. Psychological bulletin, 80(2), 151.
Potterfield, T. A. (1999). The business of employee empowerment: Democracy and ideology
in the workplace: Greenwood Publishing Group.
Power, M., & Rienstra, B. (1999). Internal communication in new corporate conglomerates:
Developing a corporate communication model for loosely coupled businesses in local
government. International Journal of Public Sector Management, 12(6), 501-515.
Pratt, M. G., Rockmann, K. W., & Kaufmann, J. B. (2006). Constructing professional identity:
The role of work and identity learning cycles in the customization of identity among
medical residents. Academy of Management Journal, 49(2), 235-262.
Preffer, J., & Salancik, G. (1978). The external control of organizations: A resource
dependence perspective. The external control of organizations: a resource
dependence perspective.
Punjaisri, K. (2008). Brand Promise Delivery from the Customer Interface Employees'
Perspective. (PhD), University of Strathclyde.
Punjaisri, K., Evanschitzky, H., & Wilson, A. (2009). Internal branding: an enabler of
employees' brand-supporting behaviours. Journal of Service Management, 20(2),
209-226.
Punjaisri, K., Evanschitzky, H., & Rudd, J. (2013). Aligning employee service recovery
performance with brand values: The role of brand-specific leadership.Journal of
Marketing Management, 29(9-10), 981-1006.
Punjaisri, K., & Wilson, A. (2007). The role of internal branding in the delivery of employee
brand promise. Journal of Brand Management, 15(1), 57-70.
Punjaisri, K., & Wilson, A. (2011). Internal branding process: key mechanisms, outcomes

396
and moderating factors. European journal of Marketing, 45(9/10), 1521-1537.
Quirke, B. (2000). Making the Connections; Using Internal Communication to Turn Strategy
into Action. Aldershot: Gower.
Rho, E., Yun, T., & Lee, K. (2015). Does Organizational Image Matter? Image, Identification,
and Employee Behaviors in Public and Nonprofit Organizations.Public Administration
Review, 75(3), 421-431.
Richard, A. J., & Dean, W. W. (2002). Applied multivariate statistical analysis. Prenticee Hall,
London, 265.
Richmond, V. P., McCroskey, J. C., & McCroskey, L. L. (2001). Organizational
communication for survival: Making work, work: Allyn and Bacon.
Ridder, J. A. (2004). Organisational communication and supportive employees. Human
Resource Management Journal, 14(3), 20-30.
Riel, C. v. (1995). Principles of corporate communication. Hemel Hempstead, Prenntice–
Hall.
Robbins, S. P., & Judge, T. (2014). Essentials of organizational behavior. Pearson Higher
Ed.
Robbins, S. P., & Hunsaker, P. L. (2005). Training In Interpersonal Skills: Tips For Managing
People At Work Author: Stephen P. Robbins, Phillip L. Hu.
Roberts, K. H., & O'Reilly, C. A. (1974). Measuring organizational communication. Journal of
Applied Psychology, 59(3), 321.
Rogelberg, S. G., Allen, J. A., Shanock, L., Scott, C., & Shuffler, M. (2010). Employee
satisfaction with meetings: A contemporary facet of job satisfaction. Human Resource
Management, 49(2), 149-172.
Rogers, D. P. (1987). Relationships Between Communication Climate Variables and
Organizational Commitment: The Case of a Food Processing Plant. Academy of
Management Best Papers Proceedings, 8(1), 230-234.
Rogers, J. D., Clow, K. E., & Kash, T. J. (1994). Increasing job satisfaction of service
personnel. Journal of Services Marketing, 8(1), 14-26.
Ross, I. C., & Zander, A. (1957). Need satisfactions and employee turnover. Personnel
Psychology, 10(3), 327-338.
Rucci, A. J., Kirn, S. P., & Quinn, R. T. (1998). The employee-customer-profit chain at Sears.
Harvard Business Review, 76, 82-98.
Ruppel, C. P., & Harrington, S. J. (2000). The relationship of communication, ethical work
climate, and trust to commitment and innovation. Journal of business Ethics, 25(4),
313-328.
Salancik, G. R., & Pfeffer, J. (1978). A social information processing approach to job
attitudes and task design. Administrative science quarterly, 224-253.

397
Salleh, S., Hussin, Z., Pangil, F., Hasan, H., Mokhtar, S. S., & Shaari, H. (2013). An
Empirical Investigation of Brand Loyalty Behavior among Hotel Employees in
Northern Malaysia. International Journal of Business and Social Science, 4(2).
Samuel Craig, C., & Douglas, S. P. (2001). Conducting international marketing research in
the twenty-first century. International Marketing Review, 18(1), 80-90.
Saunders, M. N., Saunders, M., Lewis, P., & Thornhill, A. (2011). Research methods for
business students, 5/e: Pearson Education India.
SCB, S. C. B. E. I. C. (2011). Insight: Moving forward with the AEC. Retrieved 29 August
2011, from
http://www.scb.co.th/eic/doc/en/insight/SCB%20Insight%20Feb%202011%20Eng_AE
C.pdf
Schulz, J., & Auld, C. (2006). Perceptions of role ambiguity by chairpersons and executive
directors in Queensland sporting organisations. Sport Management Review, 9(2),
183-201.
Scott, C. R., Connaughton, S. L., Diaz-Saenz, H. R., Maguire, K., Ramirez, R., Richardson,
B., . . . Morgan, D. (1999). The Impacts of Communication and Multiple Identifications
on Intent to Leave A Multimethodological Exploration. Management Communication
Quarterly, 12(3), 400-435.
Scott, K. D., & Taylor, G. S. (1985). An examination of conflicting findings on the relationship
between job satisfaction and absenteeism: A meta-analysis. Academy of
Management Journal, 28(3), 599-612.
Sharma, N., & Kamalanabhan, T. (2012). Internal corporate communication and its impact on
internal branding: Perception of Indian public sector employees. Corporate
Communications: An International Journal, 17(3), 300-322.
Shipton, H., Sanders, K., Atkinson, C., & Frenkel, S. (2015). Sense‐giving in health care: the
relationship between the HR roles of line managers and employee
commitment. Human Resource Management Journal.
Siegel, J., Dubrovsky, V., Kiesler, S., & McGuire, T. W. (1986). Group processes in computer-
mediated communication. Organizational behavior and human decision processes,
37(2), 157-187.
Silverman, D. (2010). Qualitative research: Sage.
Silvestro, R. (2002). Dispelling the modern myth: Employee satisfaction and loyalty drive
service profitability. International Journal of Operations & Production Management,
22(1), 30-49.
Smidts, A., Pruyn, A. T. H., & Van Riel, C. B. (2001). The impact of employee communication
and perceived external prestige on organizational identification. Academy of
Management Journal, 44(5), 1051-1062.

398
Smircich, L., & Morgan, G. (1982). Leadership: The management of meaning. Journal of
applied behavioral science, 18(3), 257-273.
Smith, A. D., & Rupp, W. T. (2002). Communication and loyalty among knowledge workers: a
resource of the firm theory view. Journal of Knowledge Management, 6(3), 250-261.
Smyth, P. C. B., Wu, G., & Greene, D. (2010). Does tripadvisor makes hotels better:
Technical Report.
Snipes, R. L., Oswald, S. L., LaTour, M., & Armenakis, A. A. (2005). The effects of specific
job satisfaction facets on customer perceptions of service quality: an employee-level
analysis. journal of Business Research, 58(10), 1330-1339.
Spaho, K. (2013). Organizational communication and conflict management. Management:
Journal of Contemporary Management Issues, 18(1), 103-118.
Sproull, L., & Kiesler, S. (1986). Reducing social context cues: Electronic mail in
organizational communication. Management science, 32(11), 1492-1512.
Steenkamp, J.-B. E., & Baumgartner, H. (1998). Assessing measurement invariance in
cross-national consumer research. Journal of consumer research, 25(1), 78-107.
Steenkamp, J.-B. E., & Van Trijp, H. (1991). The use of LISREL in validating marketing
constructs. International Journal of Research in Marketing, 8(4), 283-299.
Steers, R. M. (1977). Antecedents and outcomes of organizational commitment.
Administrative science quarterly, 46-56.
Steiger, J. H. (2007). Understanding the limitations of global fit assessment in structural
equation modeling. Personality and Individual Differences, 42(5), 893-898.
Stein, A. (2006). Employee communications and community: An exploratory study. Journal of
Public Relations Research, 18(3), 249-264.
Stershic, S. F. a. S. D. (2006). Internal Marketing vs. Internal Branding. Retrieved 2 July,
2013, from http://www.iabc.com/cwb/archive/2006/0406/stershicsemans.htm
Stewart, M. B. (2004). The employment effects of the national minimum wage*. The
Economic Journal, 114(494), C110-C116.
Swann, W. B. (1987). Identity negotiation: where two roads meet. Journal of personality and
social psychology, 53(6), 1038.
Swanson, S., & Kent, A. (2015). Fandom in the Workplace: Multi-target Identification in
Professional Team Sports. Journal of Sport Management, 29(4).
Tavassoli, N.T., Sorescu, A. and Chandy, R. (2014), “Employee-based brand equity: why
firms with strong brands pay their executives less”, Journal of Marketing Research,
Vol. 51 No. 6, 676-690.
Taylor, C. B. (1997). Communication satisfaction: its role in church membership satisfaction
and involvement among southern Baptist churches. Southern Journal of
Communication, 62(4), 293-304.

399
Thai-Commerce. (2010). Branding, Sufficiency Economy and AEC. Thai Commerce,
January, 34-36.
Therkelsen, D. J., & Fiebich, C. L. (2004). The supervisor: The linchpin of employee
relations. Journal of Communication Management, 8(2), 120-129.
Thomson, K., De Chernatony, L., Arganbright, L., & Khan, S. (1999). The buy-in benchmark:
how staff understanding and commitment impact brand and business performance.
Journal of Marketing Management, 15(8), 819-835.
Thomson, K., & Hecker, L. (2001). Value-adding communication: Innovation in employee
communication and internal marketing. Journal of Communication Management,
5(1), 48-58.
Tjosvold, D. (1984). Effects of leader warmth and directiveness on subordinate performance
on a subsequent task. Journal of Applied Psychology, 69(3), 422.
To, W. M., Martin, E. F., & Billy, T. W. (2015). Effect of management commitment to internal
marketing on employee work attitude. International Journal of Hospitality
Management, 45, 14-21.
Tosti, D. T., & Stotz, R. D. (2001). Building your brand from the inside out. Marketing
Management, 10(2), 28-33.
Trombetta, J. J., & Rogers, D. P. (1988). Communication climate, job satisfaction, and
organizational commitment the effects of information adequacy, communication
openness, and decision participation. Management Communication Quarterly, 1(4),
494-514.
Tsai, M.-T., Chuang, S.-S., & Hsieh, W.-P. (2009). An integrated process model of
communication satisfaction and organizational outcomes. Social Behavior and
Personality: an international journal, 37(6), 825-834.
Tsui, A. S. (2004). Contributing to global management knowledge: A case for high quality
indigenous research. Asia Pacific Journal of Management, 21(4), 491-513.
Tukiainen, T. (2001). An agenda model of organisational communication. Corporate
Communications: An International Journal, 6(1), 47-52.
Tuominen, P. (2011). The influence of TripAdvisor consumer-generated travel reviews on
hotel performance.
Unzicker, D., Clow, K. E., & Babakus, E. (2000). The role of organizational communications
on employee perceptions of a firm. Journal of Professional Services Marketing, 21(2),
87-103.
Valackiene, A. (2015). Efficient corporate communication: decisions in crisis
management. Engineering Economics, 66(1).
Vallaster, C., & De Chernatony, L. (2005). Internationalisation of services brands: The role of
leadership during the internal brand building process. Journal of Marketing
400
Management, 21(1-2), 181-203.
Van de Vijver, F. (2001). The evolution of cross-cultural research methods. The handbook of
culture and psychology, 77-97.
Van den Bosch, A. L., De Jong, M. D., & Elving, W. J. (2004). Managing corporate visual
identity: use and effects of organizational measures to support a consistent self-
presentation. Public Relations Review, 30(2), 225-234.
van den Hooff, B., & De Ridder, J. A. (2004). Knowledge sharing in context: the influence of
organizational commitment, communication climate and CMC use on knowledge
sharing. Journal of Knowledge Management, 8(6), 117-130.
Van Knippenberg, D., Van Knippenberg, B., De Cremer, D., & Hogg, M. A. (2004).
Leadership, self, and identity: A review and research agenda. The Leadership
Quarterly, 15(6), 825-856.
van Vuuren, M., de Jong, M. D., & Seydel, E. R. (2007). Direct and indirect effects of
supervisor communication on organizational commitment. Corporate
Communications: An International Journal, 12(2), 116-128.
Varona, F. (1996). Relationship between communication satisfaction and organizational
commitment in three Guatemalan organizations. Journal of business communication,
33(2), 111-140.
Voss, C., Tsikriktsis, N., & Frohlich, M. (2002). Case research in operations management.
International Journal of Operations & Production Management, 22(2), 195-219.
Wagenheim, M., & Rood, A. S. (2010). The relationship between employee satisfaction with
organizational communication and customer orientation. Managing Leisure, 15(1-2),
83-95.
Wallace, J. E. (1995). Corporatist control and organizational commitment among
professionals: The case of lawyers working in law firms. Social Forces, 73(3), 811-
840.
Wallace, E., de Chernatony, L., & Buil, I. (2013). Building bank brands: How leadership
behavior influences employee commitment. Journal of Business Research, 66(2),
165-171.
Walumbwa, F. O., Avolio, B. J., & Zhu, W. (2008). How transformational leadership weaves
its influence on individual job performance: The role of identification and efficacy
beliefs. Personnel Psychology, 61(4), 793-825.
Walumbwa, F. O., Cropanzano, R., & Hartnell, C. A. (2009). Organizational justice, voluntary
learning behavior, and job performance: A test of the mediating effects of
identification and leader‐member exchange. Journal of organizational Behavior,
30(8), 1103-1126.
Ward, S., Goldstine, J., & Light, L. (1999). What high-tech managers need to know about

401
brands. Harvard Business Review, 77(4), 85-95.
Warren, J. R., & Halpern-Manners, A. (2012). Panel conditioning in longitudinal social
science surveys. Sociological Methods & Research, 41(4), 491-534.
Watkins, M. W. (2005). Determining parallel analysis criteria. Journal of Modern Applied
Statistical Methods, 5(2), 8.
Wei, Y. S., & Morgan, N. A. (2004). Supportiveness of organizational climate, market
orientation, and new product performance in Chinese firms. Journal of Product
Innovation Management, 21(6), 375-388.
Weick, K. E. (1987). Theorizing about organizational communication. Handbook of
organizational communication, 97, 122.
Welch, M., & Jackson, P. R. (2007). Rethinking internal communication: a stakeholder
approach. Corporate Communications: An International Journal, 12(2), 177-198.
Welsch, H. P., & LaVan, H. (1981). Inter-relationships between organizational commitment
and job characteristics, job satisfaction, professional behavior, and organizational
climate. Human Relations, 34(12), 1079-1089.
Whitehead, L. (2011). Identifying future research opportunities in online consumer reviews:
the case study of'TripAdvisor'. International Journal of Technology Marketing, 6(4),
341-354.
Whitener, E. M., Brodt, S. E., Korsgaard, M. A., & Werner, J. M. (1998). Managers as
initiators of trust: An exchange relationship framework for understanding managerial
trustworthy behavior. Academy of management review, 23(3), 513-530.
Wiio, O. A., & Helsila, M. (1974). Auditing communication in organizations: A standard
survey, LTT communication audits. Finnish Journal of Business Economics, 4(1),
303-315.
Williams, L. J., & Anderson, S. E. (1991). Job satisfaction and organizational commitment as
predictors of organizational citizenship and in-role behaviors. Journal of
management, 17(3), 601-617.
Wright, P. M., Gardner, T. M., & Moynihan, L. M. (2003). The impact of HR practices on the
performance of business units. Human Resource Management Journal, 13(3), 21-36.
WTTC, T. W. T. T. C. (2014). Travel and Tourism, Economic Impact 2014: Thailand. WTTC
Travel & Tourism Economic Impact 2014.
Wyatt, W. (2006). Effective communication: a leading indicator of financial performance –
2005/2006 Communication ROI Study™. Retrieved 20 June, 2012, from
www.watsonwyatt.com/research/reports.asp
Wynia, M. K., Johnson, M., McCoy, T. P., Griffin, L. P., & Osborn, C. Y. (2010). Validation of
an organizational communication climate assessment toolkit. American Journal of
Medical Quality, 25(6), 436-443.
402
Xiang, Z., & Gretzel, U. (2010). Role of social media in online travel information search.
Tourism management, 31(2), 179-188.
Yammarino, F. J., & Naughton, T. J. (1988). Time spent communicating: A multiple levels of
analysis approach. Human Relations, 41(9), 655-676.
Yee, R. W., Yeung, A. C., & Edwin Cheng, T. (2010). An empirical study of employee loyalty,
service quality and firm performance in the service industry. International Journal of
Production Economics, 124(1), 109-120.
Yoshimura, K. E. (2003). Employee traits, perceived organizational support, supervisory
communication, affective commitment, and intent to leave: Group differences.
Yuan, J. J., Houston, K., & Cai, L. A. (2006). Foreign Language Ability: A Core Attribute of
Hospitality Graduates' Competency?. Journal of Human Resources in Hospitality &
Tourism, 5(1), 77-90.
Zaremba, A. (1988). Working with the organizational grapevine. Personnel Journal, 67(7),
38-&.
Zeffane, R., Tipu, S. A., & Ryan, J. C. (2011). Communication, commitment & trust: exploring
the triad. International Journal of Business and Management, 6(6), p77.
Zwijze-Koning, K., & de Jong, M. (2007). Evaluating the communication satisfaction
questionnaire as a communication audit tool. Management Communication Quarterly,
20(3), 261-282.