influence of methanogenic bacterial degradation … · influence of methanogenic bacterial...
TRANSCRIPT

1
INFLUENCE OF METHANOGENIC
BACTERIAL DEGRADATION OF
PETROLEUM HYDROCARBONS
ON MOBILE LNAPL
Bruce Tease, PhD1, Keith Cole, P.E.2 and Juliette Rose, P.E.2
Ramboll Environ
Amherst, MA 010021 and Atlanta, GA 303392
ABSTRACT
A case study is presented highlighting changes in geochemical conditions
induced by the anaerobic degradation of petroleum hydrocarbons (PHCs) that enhanced
the coalescence of dissolved phase PHCs into light non-aqueous phase liquid (LNAPL).
Forensic analysis detected the presence of weathered light, middle and heavy weight
PHCs in groundwater and LNAPL samples that were consistent with straight run
gasoline, diesel fuel and crude oil. Dissolved phase concentrations migrated over 1,500
feet through dense silt and clay alluvium and mobile LNAPL was observed in recovery
wells bisecting the migration path. The combined concentration of PHCs in soil,
groundwater and vapor phases exceeded the Soil Saturation Concentration (Csat) literature
values for gasoline and diesel fuel in fine sand and silt, indicating the presence of
immobile LNAPL. Combined PHC concentrations, however, were well below the
LNAPL Saturation Concentration (Cres) literature values for gasoline, diesel fuel and
crude oil PHCs in fine sand, silt and clay soil. The ample storage capacity available for
PHCs, particularly in soil, suggests that the presence of LNAPL in the central area of the
site did not migrate there as a contiguous plume, but rather formed from the enhanced
coalescence of dissolved phase PHCs. The findings of subsurface investigations
performed to confirm a conceptual site model (CSM) developed for the long range
migration of dissolved phase PHCs and the formation of isolated pockets of LNAPL are
presented. Also discussed are the results of a pilot test involving the injection of an
anionic surfactant and brine solution that simulated similar geochemical conditions
associated with the coalescence of PHCs to LNAPL that resulted in the recovery of
approximately 80 gallons of LNAPL downgradient of the treatment area.
INTRODUCTION
The recovery of petroleum hydrocarbons (PHCs) from poorly permeable soils
continues to be a challenge for the effective remediation of groundwater.1 A case study is
1 Innovations in Groundwater and Soil Cleanup. From Concept to Commercialization (1997)
ISBN: 978-0-309-06358-6. Commission on Geosciences, Environment and Resources. Water
Science and Technology Board

2
presented that defines the degree and extent of straight run gasoline, diesel fuel and crude
oil PHCs partitioned among soil, groundwater, vapor and LNAPL phases and how the
anaerobic biodegradation of PHCs that altered the dynamic equilibrium among these
phases influenced the long range migration of dissolved phase PHCs over 1,500 feet and
the isolated occurrence of LNAPL.
This paper presents the recent findings of subsurface investigations performed to
evaluate a Conceptual Site Model (CSM) that was developed to explain the long range
migration of PHCs through seemingly impenetrable silt and clay soil and the appearance
of LNAPL in wells that bisected the contaminant flow path. The information obtained
was used to design and perform a pilot test that resulted in the recovery of approximately
80 gallons of LNAPL.
Key to the design of effective remedial actions is an understanding of the
distinction between immobile and mobile LNAPL, and how changes in the dynamic
phase partitioning equilibrium of PHCs in soil, groundwater, vapor and LNAPL phases
can enhance PHC migration and LNAPL formation, but also aid in the design and
performance of effective remedial actions.
Distinction between Mobile and Immobile LNAPL
Upon the release of petroleum to soil, the migration of the free product phase (i.e.
mobile LNAPL) is typically restricted to the immediate vicinity of the release, and is
directly related to soil permeability and the type and volume of product released. For
small releases, soil pore capillary forces are effective at retaining LNAPL to site soil. For
larger releases, gravitational forces create a pressure head that exceeds the capillary
retention forces, promoting further migration until the volume of mobile LNAPL
diminishes.
In cases where mobile LNAPL reaches the groundwater table, groundwater will
be displaced to the extent gravitational head pressure and soil permeability permit. Once
the LNAPL plume ceases to be mobile, PHCs comprising this immobile LNAPL will
continue to migrate by advection and/or dispersion via groundwater according to their
water solubility or volatilize into saturated as well as unsaturated soil pores based on their
vapor pressure.
As dissolved phase PHCs continue to migrate, their overall hydrophobic nature
drives their coalescence into LNAPL, in accordance with their effective water solubility
and vapor pressure. While this LNAPL is not capable of migrating as free product, it
serves as a secondary source capable of partitioning into soil, groundwater and vapor
phases.2 It is the recovery of immobile LNAPL that is most central to achieving the
required remediation of groundwater and vapor phase PHCs.
2 Three and Four Phase Partitioning of Petroleum Hydrocarbons and Human Health Risk
Calculations (December 2006) Geosphere, Inc. and CH2MHILL for the Alaska Department of
Environmental Conservation, Statement of Cooperation Working Group

3
Phase Partitioning of PHCs
A prerequisite for the design of effective remedial measures is an awareness of
the type of petroleum product(s) present, the PHCs comprising them, and their
distribution among soil, groundwater, vapor and LNAPL phases. The partitioning of
PHCs among these phases is in dynamic equilibrium where changes in the mass present
in one phase affects the distribution among the others.
Henry’s Law essentially describes the tendency of a substance to dissolve in
groundwater and/or volatilize into soil pores. For example, gasoline related PHCs have a
greater propensity to volatilize into soil gas and dissolve into groundwater compared to
diesel fuel and crude oil PHCs. As the product weathers or as PHC vapors are actively
remediated, the amount of PHCs capable of occupying the vapor phase decreases and the
equilibrium shifts towards groundwater, soil or LNAPL phases. Under conditions where
decreases in the effective water solubility of PHCs occur as the number and/or mass of
dissolved phase constituents increases, the tendency for PHCs to coalesce into LNAPL
increases.
Differences in absolute and effective water solubility of benzene is a prime
example of how changes in the number of constituents present in a solution can affect the
phase partitioning equilibrium. The absolute solubility of benzene (the maximum amount
that can be dissolved in pure water) is approximately 1,780,000 ug/l. When present in
groundwater the maximum amount of benzene that can dissolve decreases as the number
of constituents in groundwater increases. This effective water solubility of benzene when
present in groundwater impacted by gasoline is approximately 100 times lower than its
absolute water (i.e. 17,000 ug/l), and 2,000 times lower in groundwater impacted by
diesel fuel (i.e. 880 ug/l).3 As will be discussed further, the effective water solubility of
benzene proximate to the LNAPL wells is as high as 4,000 ug/l with the highest
concentration in soil being 3 mg/kg (restricted target remediation goal (TRG) of 1.36
mg/kg).
The combined concentration of PHCs adsorbed to soil, dissolved in groundwater
and volatilized into soil gas provides a measure of the amount of petroleum that can be
stored in the subsurface. The maximum storage capacity of soil, groundwater, and soil
gas for PHCs is referred to as the Soil Saturation Concentration (Csat), which varies
depending upon the types of PHCs and soil present. At concentrations below Csat, the
mass of PHCs is insufficient to coalesce into immobile LNAPL and groundwater is not
expected to be impacted. At concentrations above Csat, the mass of PHCs is capable of
coalescing into immobile LNAPL which serves as a secondary source of PHCs capable
of diffusing into groundwater or volatizing into soil gas.
Proximate to the immediate vicinity of a release of mobile LNAPL, the combined
PHC concentration is expected to exceed the LNAPL Residual Concentration (Cres),
which like Csat, is dependent upon the types of petroleum product and soil present.4
3 Natural attenuation of fuels and chlorinated solvents. Wiedemeier T. H. et al (1999). John Wiley
& Sons, Inc. ISBN 0-471-19749-1.
4 Non-aqueous phase liquid (NAPL) mobility limits in soil. Brost, E.J and DeVaull, G.E. (June
2000) American Petroleum Institute Soil & Groundwater Research Bulletin

4
Comparing the combined PHC concentrations in soil, groundwater and vapor
phases to literature values of Csat and Cres for a given petroleum product and soil type
provides a measure of the presence of immobile and mobile LNAPL.3 Literature values
for Csat and Cres have been developed for various soil types impacted by gasoline, diesel
fuel or crude oil. The Csat values for gasoline and diesel fuel PHCs for fine sand and silt
soil are 387 mg/kg and 18 mg/kg, respectively. The Cres values in fine sand, silt and clay
soil for gasoline, diesel fuel and crude oil are 5,000 mg/kg, 10,000 mg/kg and 20,000
mg/kg, respectively.
Case Study
The study area is located at an elevation of approximately 120 feet above mean
sea level (amsl) within an agricultural field downgradient and west of a decommissioned
asphalt refinery at the eastern limit of the Mississippi River delta. Surface topography
gradually descends towards the western limit of the study area rising to approximately
240 feet amsl at the top of a bluff located approximately 2,000 feet east of the former
refinery. A site plan showing the former refinery and stormwater impoundment, and
groundwater monitoring and recovery wells is presented as Figure 1.
Depth to groundwater ranges from approximately 2-8 feet proximate to the former
refinery and 15-30 feet in the western limits of the study area. Regional and localized
groundwater flow is to the west trending locally to the northwest in the western part of the
study area. The average hydraulic gradient is approximately 2.4% in the east and 0.7% in
the west, corresponding to an average groundwater transport velocity of approximately 81
feet/year and 23 feet/year, respectively.
The surficial geology of the study area is dominated by relatively dense alluvium
of the Mississippi River delta comprised of poorly permeable silt and clay soil.
Discontinuous lenses of fine to medium sand and silt exist at varying depths where the
depth and frequency of occurrence of these preferential groundwater flow pathways
decreases from east to west, as depicted in Figure 2.
Petroleum hydrocarbons were initially detected in soil and groundwater samples
collected from the former stormwater impoundment. Subsurface investigations confirmed
the presence of PHCs in soil and groundwater further downgradient within the agricultural
field west of a highway. Assessment and remedial actions involving the installation of 29
monitoring wells and 47 dual phase extraction (DPE) wells were conducted from 2009 to
2013. Quarterly groundwater analysis of BTEX compounds, naphthalene, and 2-
methylnaphthalene by EPA Method 8021B and total petroleum hydrocarbon-diesel range
organics (TPH-DRO) via EPA Method 8015C detected maximum concentrations of
benzene (4,100 ug/l), naphthalene (360 ug/l) and TPH-DRO (4,800 ug/l) above the
Mississippi Department of Environmental Quality (MDEQ) target remediation goals
(TRGs) of 5 ug/l, 6.2 ug/l and 650 ug/l, respectively. Of the 13 perimeter wells, only PW-
10, PW-11 and PW-12 exhibited benzene, naphthalene and TPH-DRO in groundwater
samples above minimum reporting limits (RL), with benzene (310 ug/l) exceeding its TRG
in PW-12.
Two fixed DPE systems were installed to recover impacted groundwater and
LNAPL. Scaling of the transfer piping and equipment resulted in frequent system shut

5
downs requiring biweekly flushing and cleaning with muriatic acid. The large number of
recovery wells and long connection piping runs limited the DPE operations to 4 to 10 wells
per fixed system, which constrained the recovery of vapor and groundwater phase PHCs.
The highest levels of TOVs reported by PID meter in vapors recovered by the DPE systems
positioned in the impoundment and agricultural field were 10 ppmv and 330 ppmv,
respectively.
In November 2013, Ramboll Environ was asked to perform a 3rd party review of
the effectiveness of the fixed DPE systems. The forensic analysis of samples of LNAPL
and impacted groundwater were recommended to identify the type of petroleum product(s)
present. Samples were submitted to Alpha Analytical, Inc. of Westborough, MA, a MS
certified laboratory, for comprehensive analyses. The results were reviewed by NewFields
who identified the petroleum products to be a very weathered mix of light, middle and
heavy weight PHCs consistent with straight run gasoline (C5-9 carbon fractions), diesel fuel
(C9-28 carbon fractions) and crude oil (C28-44 carbon fractions).
Ramboll Environ presented a comprehensive work plan in 2014 recommending
the use of mobile DPE equipment to define the extent of contamination throughout the
study area through the recovery of vapor and groundwater phase PHCs. Real time total
organic vapors (TOVs) and methane levels were measured via an in-line Foxboro Model
1000A flame ionization detector (FID) and groundwater samples were collected daily from
a 15-gallon scrub tank on the mobile DPE units. TOV and methane levels as high as 20,000-
25,000 ppmv were detected in the former impoundment area and in areas of the agricultural
field proximate to recovery wells A 4-7 and C 1-10, with lower levels detected elsewhere.
Vapor phase PHCs accounted for the majority of the mass of contaminants
recovered via DPE, exceeding the recovery of groundwater phase PHCs by 2-3 orders of
magnitude. DPE performed at varying depths within the existing recovery wells
demonstrated the potential for preferential PHC migration pathways along the A-series
recovery wells to the north and C-series recovery wells to the south. The proportion of
gasoline and diesel fuel PHCs in groundwater recovered during DPE events was
approximately 20% and 80%, respectively, which was the inverse to that detected in well
samples. The concentrations of PHCs detected in groundwater recovered during DPE
events were considered to be representative of the PHCs comprising immobile LNAPL.
Based on the results of the DPE events conducted at the existing recovery wells,
Ramboll Environ oversaw the installation of a total of 29 recovery wells (ERW 1-29). Five
recovery wells were installed north of the former impoundment area upgradient of the A-
series wells and seven wells were installed upgradient of the C-series wells within the
impoundment area east of the highway. The remaining wells were installed across the study
area to evaluate soil conditions and analyze PHCs in soil to further characterize potential
migration pathways.
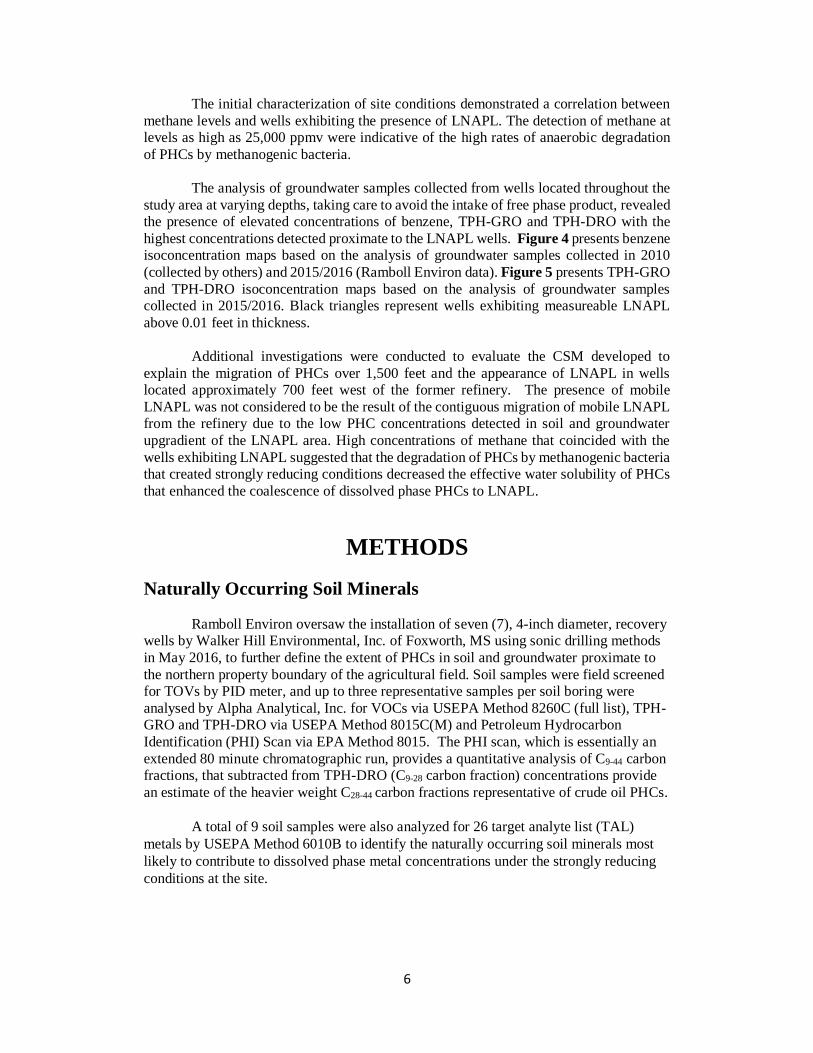
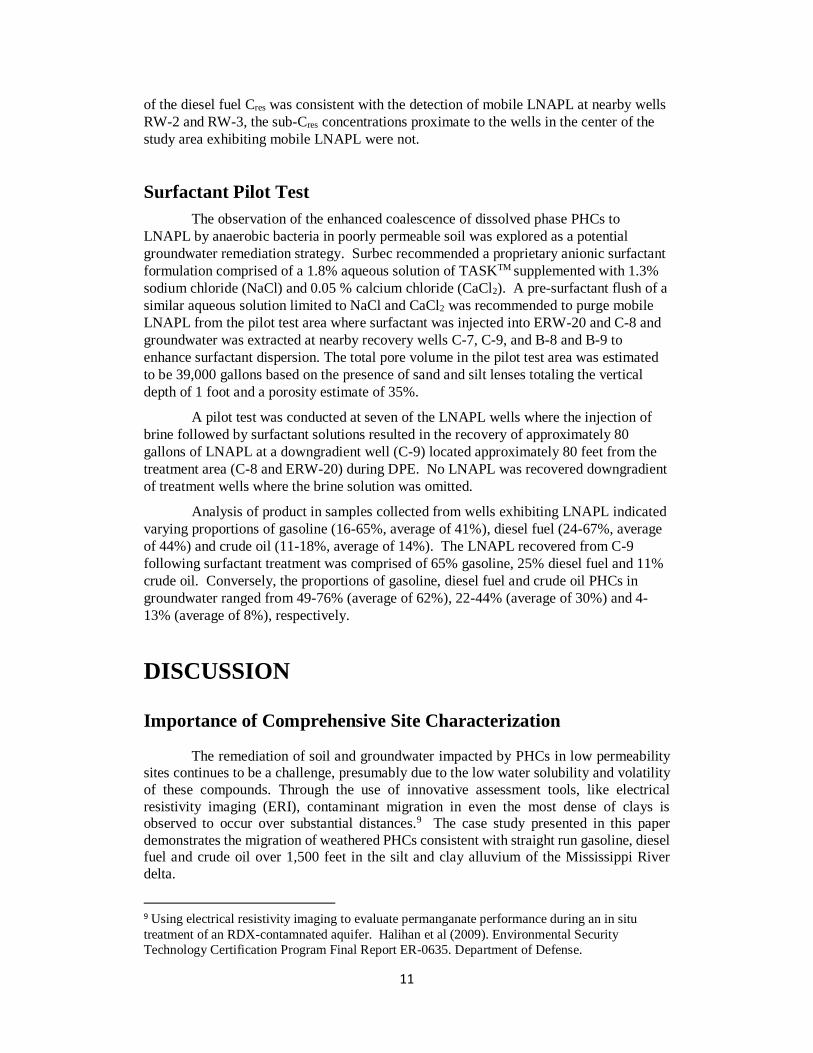
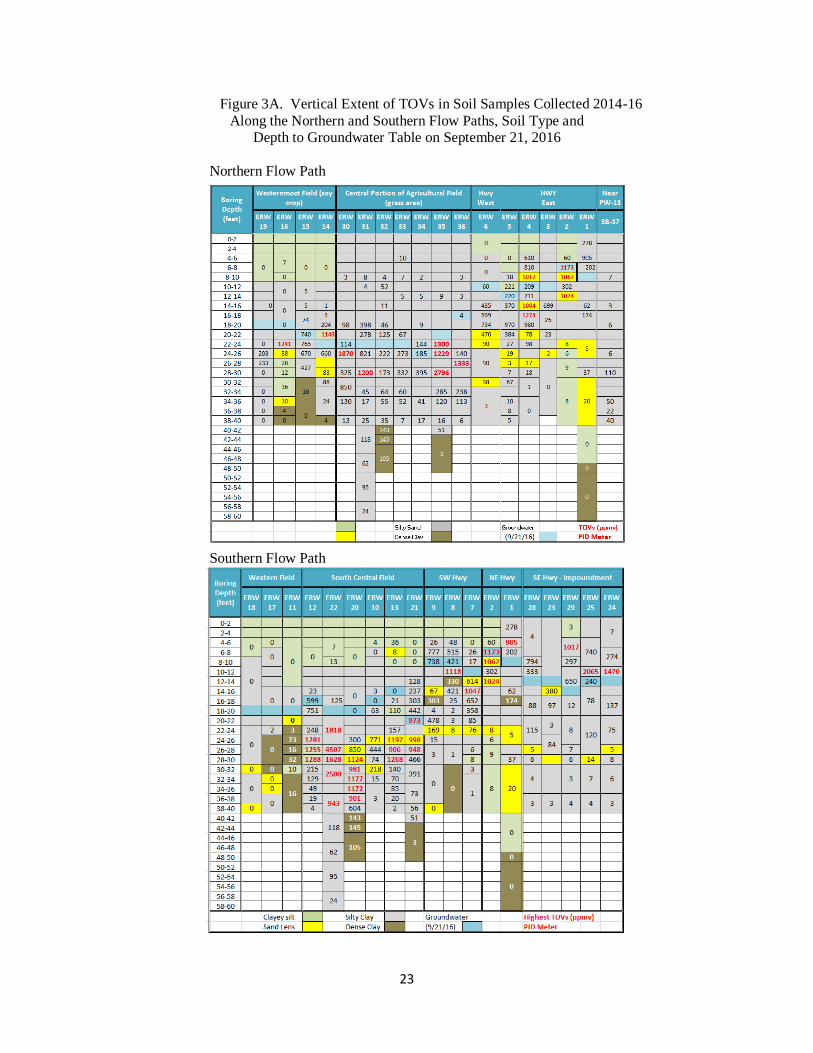
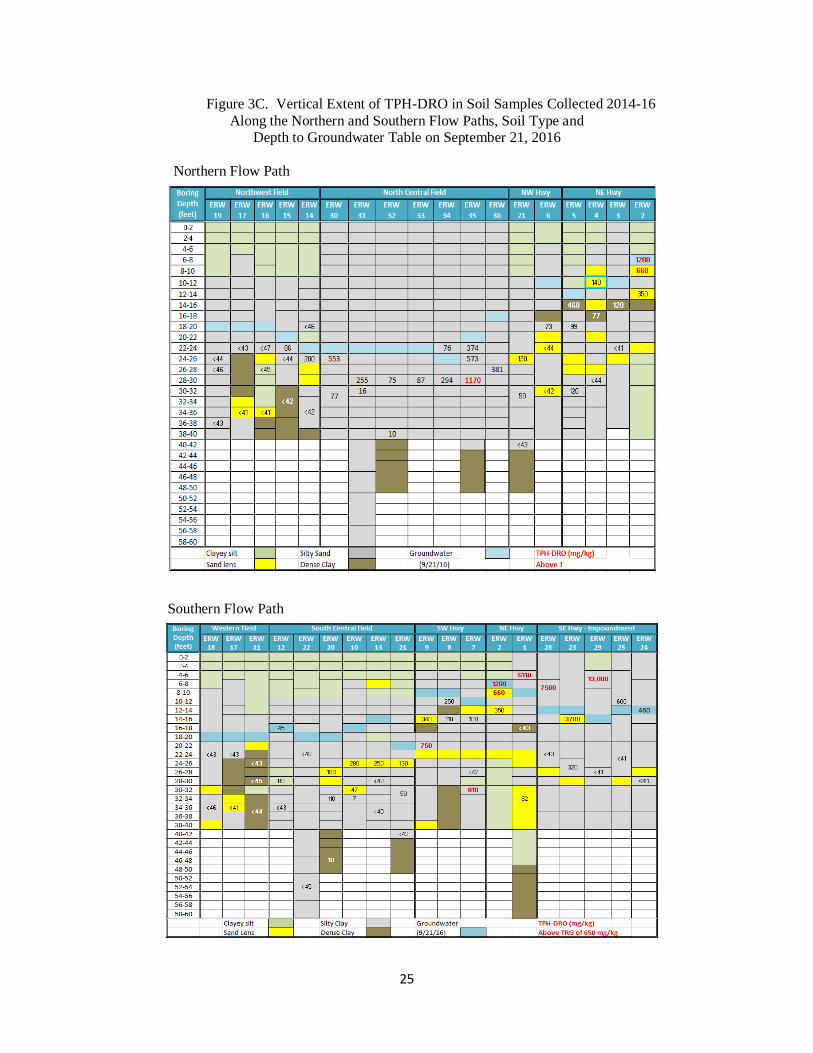
The vertical extent of TOVs and PHCs coincided with sand and silt lenses
occurring most frequently in the eastern portion of the study area and least to non-existent
in the west and northwest areas. The horizontal and vertical extent of TOVs by PID meter,
and TPH-GRO and TPH-DRO concentration by laboratory analyses, in soil, are depicted
in Figures 3A, 3B and 3C, respectively. Soils analyzed for VOCs (full list) exhibited very
low concentrations and as such are not presented graphically.
6
The initial characterization of site conditions demonstrated a correlation between
methane levels and wells exhibiting the presence of LNAPL. The detection of methane at
levels as high as 25,000 ppmv were indicative of the high rates of anaerobic degradation
of PHCs by methanogenic bacteria.
The analysis of groundwater samples collected from wells located throughout the
study area at varying depths, taking care to avoid the intake of free phase product, revealed
the presence of elevated concentrations of benzene, TPH-GRO and TPH-DRO with the
highest concentrations detected proximate to the LNAPL wells. Figure 4 presents benzene
isoconcentration maps based on the analysis of groundwater samples collected in 2010
(collected by others) and 2015/2016 (Ramboll Environ data). Figure 5 presents TPH-GRO
and TPH-DRO isoconcentration maps based on the analysis of groundwater samples
collected in 2015/2016. Black triangles represent wells exhibiting measureable LNAPL
above 0.01 feet in thickness.
Additional investigations were conducted to evaluate the CSM developed to
explain the migration of PHCs over 1,500 feet and the appearance of LNAPL in wells
located approximately 700 feet west of the former refinery. The presence of mobile
LNAPL was not considered to be the result of the contiguous migration of mobile LNAPL
from the refinery due to the low PHC concentrations detected in soil and groundwater
upgradient of the LNAPL area. High concentrations of methane that coincided with the
wells exhibiting LNAPL suggested that the degradation of PHCs by methanogenic bacteria
that created strongly reducing conditions decreased the effective water solubility of PHCs
that enhanced the coalescence of dissolved phase PHCs to LNAPL.
METHODS
Naturally Occurring Soil Minerals
Ramboll Environ oversaw the installation of seven (7), 4-inch diameter, recovery
wells by Walker Hill Environmental, Inc. of Foxworth, MS using sonic drilling methods
in May 2016, to further define the extent of PHCs in soil and groundwater proximate to
the northern property boundary of the agricultural field. Soil samples were field screened
for TOVs by PID meter, and up to three representative samples per soil boring were
analysed by Alpha Analytical, Inc. for VOCs via USEPA Method 8260C (full list), TPH-
GRO and TPH-DRO via USEPA Method 8015C(M) and Petroleum Hydrocarbon
Identification (PHI) Scan via EPA Method 8015. The PHI scan, which is essentially an
extended 80 minute chromatographic run, provides a quantitative analysis of C9-44 carbon
fractions, that subtracted from TPH-DRO (C9-28 carbon fraction) concentrations provide
an estimate of the heavier weight C28-44 carbon fractions representative of crude oil PHCs.
A total of 9 soil samples were also analyzed for 26 target analyte list (TAL)
metals by USEPA Method 6010B to identify the naturally occurring soil minerals most
likely to contribute to dissolved phase metal concentrations under the strongly reducing
conditions at the site.

7
Dissolved Phase Soil Minerals
Groundwater samples were collected in June and July 2016 from 35 recovery wells
in accordance with USEPA low flow methods5. Samples were analysed by Alpha
Analytical, Inc. for VOCs (full list), TPH-GRO, TPH-DRO, PHI Scan, dissolved methane
and carbon dioxide via US EPA Method RSK SOP-175. Total and dissolved metals
previously identified as being most prevalent at the site were analysed by USEPA Method
6010B. Groundwater samples for the analysis of dissolved metals were field filtered using
GoPro Inline 0.45u filters prior to nitric acid preservation.
Dual Phase Extraction (DPE) Employing Mobile Equipment
Mobile DPE units provided by Fruits & Associates of Acworth, GA were used to
characterize groundwater and vapor phase PHCs throughout the study area. Each unit
was capable of performing DPE at up to six recovery wells, achieving groundwater
recovery rates of up to 500 gallons/hour, applied vacuums of up to 15 inches of mercury
and total air flow rates of up to 400 air cubic feet/minute (acfm). Real time TOV and
methane levels were measured via an in-line Foxboro Model 1000A flame ionization
detector (FID) calibrated to methane. Daily groundwater samples were collected from a
15-gallon scrub tank for laboratory analysis of PHCs where the results were used to
calculate the proportions and mass of PHCs in the groundwater recovered during DPE
events.
PHC vapors were combusted by a 95-99% efficient on-board thermal incinerator
fueled by propane gas when the thermal BTUs provided from the recovered PHCs were
insufficient to sustain effective combustion. Recovered groundwater was stored in a
3,400 gallon on-board tank until transfer to 21,000 gallon frac tank(s) via tanker truck.
Groundwater was treated on-site by pumping through two in-line bag filters, two filters
containing 1,000 pounds of liquid phase granular activated carbon (LGAC), and one filter
containing 1,800 pounds of activated alumina (provided by Carbonair) for the removal of
PHCs and naturally occurring arsenic, respectively, before being discharged to a drainage
ditch in accordance with a National Pollution Discharge Elimination System (NPDES)
permit. The mobile DPE equipment and on site treatment and disposal of recovered
groundwater avoided problems associated with the scaling of the fixed DPE systems that
required frequent muriatic acid cleaning to maintain limited operational capabilities.
Comparison of Total PHCs in Soil, Groundwater and Soil Gas to
Literature Values for Csat and Cres
The total mass of PHCs partitioned in soil, groundwater and vapor phases were
calculated on a weight to weight basis (i.e. in mg/kg) using the analytical results obtained
for gasoline (TPH-GRO), diesel fuel (TPH-DRO) and crude oil (PHI Scan minus TPH-
DRO) PHCs in samples collected upgradient, within and downgradient of the LNAPL
wells.
5 Low Stress (Low Flow) Purging and Sampling Procedure for the Collection of Groundwater
Samples from Monitoring Wells. US EPA EQA SOP-GW 001 Revision 3 January 19, 2010

8
Since PHCs in groundwater were reported by the laboratory on a weight by
volume basis (i.e. mg/l), the conversion factor of 0.3 liter/kg soil6 was used to determine
the average mass of PHCs in groundwater present in one kilogram of soil.
Total organic vapors (TOVs) measured in ppmv by FID Analyzer at individual
recovery wells were averaged and converted to vapor phase PHC concentrations in
mg/m3 using the linear regression equation of y = 0.263x + 181, where and x equals
TOVs minus methane in ppmv and y equals laboratory derived VOCs in mg/m3 based on
the analysis of volatile PHCs by the MADEP air phase petroleum hydrocarbon (APH)
Method and USEPA Method 7C(M) in air samples collected from recovery wells C-8, C-
9 and B-10 in July 2016. The conversion factor of 0.0003 m3/kg soil was used to
determine the average mass of PHCs in soil gas (i.e. vadose zone) present in one
kilogram of soil.7
Surfactant Feasibility Study and Pilot Test
Surfactant Enhanced Aquifer Remediation (SEAR) involves the injection of a
solution of engineered compounds and minerals designed to reduce the interfacial tension
between immobile LNAPL and groundwater within soil pores, thereby making the
LNAPL more mobile and recoverable. In general, nonionic surfactants increase the
solubility of LNAPL through the formation of an emulsion, whereby a mixture of
petroleum and water is recovered via groundwater extraction. Conversely, anionic
surfactants enhance the mobilization potential of immobile LNAPL minimizing the
formation of emulsions, whereby remedial efforts primarily focus on the recovery of
LNAPL. Anionic surfactants are preferred over cationic surfactants due to their net
negative charge that repels negatively charged soil so that more surfactant is available to
liberate LNAPL. Anionic surfactants are also biodegradable and nontoxic to PHC
degrading bacteria, and the LNAPL liberated is less likely to migrate beyond property
boundaries as would emulsions formed from non-ionic surfactants.8
A treatability study was performed by Surbec, a company comprised of senior
researchers at the School of Chemical, Biological and Materials Engineering at the
University of Oklahoma, in Norman, OK, in cooperation with Tersus Environmental of
Wake Forest, NC. Samples of site soil, groundwater and mobile LNAPL were used in
batch testing and column studies to confirm whether or not the use of anionic surfactants
was feasible at the site.
6 Conversion factor for mg/l of PHCs in groundwater to mg/kg of soil = 0.037 tons soil/ cf = 74
lbs/cf = 33.6 kg/cf; 33.6 kg soil/28.4 liters = 1.18 kg/liter or 0.847 liter/kg soil x 35% =
0.3 liter/kg soil 7 Conversion factor for mg/m3 of PHCs in soil gas to mg/kg of soil = 0.037 tons soil/ cf = 74 lbs/cf
= 33.6 kg/cf; 33.6 kg/0.028 m3 = 0.00084 m3/kg soil x 35% = 0.0003 m3/kg soil 8 Technology Practices Manual for Surfactants and Cosolvents, Chapter 4. Surfactant/Cosolvent
Enhanced Recovery of NAPLs. February 1997) CH2MHILL. https://clu-
in.org/products/aatdf/toc.htm

9
RESULTS
Naturally Occurring Minerals in Site Soil and Groundwater
Of the 26 TAL metals analyzed, 14 were detected above minimum laboratory
reporting limits (RL), as summarized in Table 1, together with maximum TOV levels
(ppmv). The sum of TAL metal concentrations (mg/kg) were inversely related to TOV
levels where metal concentrations were lowest in soil exhibiting the highest TOV levels.
Similar trends were observed when metal concentrations were compared to PHC
concentrations. There was no apparent correlation in metal concentrations to soil type,
moisture content or sample location. Of the 14 TAL metals detected in soil, iron,
calcium, magnesium, aluminum, potassium, manganese and barium were present at
concentrations considered to contribute the greatest to dissolved phase metal
concentrations under strongly reducing conditions.
Results of the analysis of groundwater samples collected upgradient (ERW6, A4,
C4, ERW21), within (A6, B6, C6, C8, ERW20, C9, C11) and downgradient (B10, C14,
B14, A14) of the mobile LNAPL for the selected metals and PHCs are summarized in
Table 2. No significant difference was noted between total and dissolved metal
concentrations, and based on their predominance, calcium (56%), magnesium (36%), iron
(5%), manganese (2.5%) and barium (0.1%) were used to represent the sum of metals
present in groundwater at the site.
Correlation of Dissolved Metals and Methane to Mobile LNAPL
The relationship between soluble metals and methane concentrations in
groundwater is presented in Figure 6. Solid symbols represent samples collected from
recovery wells exhibiting mobile LNAPL.
The wells exhibiting mobile LNAPL coincided with dissolved metal
concentrations above approximately 140,000 ug/l and methane concentrations above
approximately 5,000 ug/l. Background concentrations of dissolved metals and dissolved
methane were (56,000 ug/l) and (<1 ug/l), respectively.
Correlation between Dissolved PHCs and Mobile LNAPL
The relationship between dissolved carbon dioxide, dissolved methane, PHCs
and LNAPL thickness is depicted in Figure 7. The trends in PHC, dissolved carbon
dioxide and methane concentrations were similar in groundwater samples collected
between recovery wells ERW-6 and B-6, which are located upgradient of the wells
exhibiting the majority of LNAPL. The spike in dissolved methane and gasoline PHC
concentrations corresponds to the wells containing LNAPL, where care was taken not to
recover any LNAPL during sample collection. The continued decreasing trend in carbon
dioxide within the area of LNAPL is consistent with its use as an electron acceptor by
methanogenic bacteria. The rise in carbon dioxide concentrations downgradient of
LNAPL wells is consistent with its high water solubility despite decreases in the
methanogenic degradation of PHCs.

10
Petroleum degradation via methanogenic bacteria is unique to other anaerobic
catabolic processes in that it does not rely on the availability of exogenous terminal
electron acceptors (i.e. nitrate, iron and sulfate). Instead methanogenic bacteria produce
their own electron acceptor, carbon dioxide, which like methane, is a byproduct of the
anaerobic degradation of PHCs. This process was first demonstrated by Zengler et al
(1999) using hexadecane as a petroleum food source per the stoichiometric equation
below.
4 C16H34 + 30 H2O -> 15 CO2 + 49 CH4
Given that carbon dioxide has an absolute water solubility of approximately
1,450,000 ug/l compared to 23,000 ug/l for methane, much higher concentrations of
dissolved phase carbon dioxide can accumulate in groundwater compared to methane,
which readily enters the vapor phase. Methane levels as high as 20,000 ppmv (i.e.
20,000,000 parts per billion by volume) were detected by FID Analyzer during DPE
events. Air samples collected in July 2016 and analyzed for methane confirmed the
detection of methane concentrations comparable to that measured by the FID Analyzer.
The concentration (ug/l) and proportion (%) of gasoline and diesel fuel related
PHCs in groundwater samples collected upgradient, within and downgradient of the
LNAPL are depicted in Figure 8. The wells are arranged from west (B-14) to east (RW-
4). Gasoline PHC concentrations exceeded diesel fuel related PHC concentrations in
groundwater with the highest concentrations coinciding with wells exhibiting mobile
LNAPL and decreasing thereafter. Changes in diesel fuel PHC concentrations were less
distinct. An inverse relationship between gasoline and diesel fuel PHCs was
demonstrated when the proportion of TPH-GRO and TPH-DRO to their total
concentration was determined.
Phase Partitioning of PHCs in Soil, Groundwater and Soil Gas
Gasoline, diesel fuel and crude oil PHC concentrations in soil, groundwater and
soil gas are depicted on a weight to weight basis in milligrams per kilogram of soil
(mg/kg) in Table 3. The total PHC concentrations per petroleum product type are
presented separately to permit comparison to their individual Csat and Cres literature
values. PHI Scan analyses were limited to groundwater and soil samples collected from
the former storm water impoundment southeast of US Highway 3 (ERW 23-29) and the
north-central portion of the agricultural field (ERW 30-36). The average ratios of crude
oil PHC to diesel fuel PHC concentrations in soil from the former impoundment (2.2x)
and north-central (0.28x) wells were used to estimate crude oil concentrations for
samples located proximate to these locations (see bolded data).
As expected, PHC concentrations were most prevalent in the soil phase, followed
by groundwater, and soil gas. Total gasoline PHC concentrations exceeded the Csat
literature value of 387 mg/kg in 50% (11 of 22) of the samples evaluated, whereas the
Csat value of 18 mg/kg for diesel fuel was exceeded in 77% (17 of 22) of the samples.
Gasoline, diesel fuel and crude oil total PHC concentrations were well below
their respective Cres literature values of 5,000 mg/kg, 10,000 mg/kg and 20,000 mg/kg,
respectively in fine sand, silt and clay, except for the total diesel fuel PHC concentration
of 13,001 mg/kg located southeast of US Highway 3 at ERW-29. While this exceedance
11
of the diesel fuel Cres was consistent with the detection of mobile LNAPL at nearby wells
RW-2 and RW-3, the sub-Cres concentrations proximate to the wells in the center of the
study area exhibiting mobile LNAPL were not.
Surfactant Pilot Test
The observation of the enhanced coalescence of dissolved phase PHCs to
LNAPL by anaerobic bacteria in poorly permeable soil was explored as a potential
groundwater remediation strategy. Surbec recommended a proprietary anionic surfactant
formulation comprised of a 1.8% aqueous solution of TASKTM supplemented with 1.3%
sodium chloride (NaCl) and 0.05 % calcium chloride (CaCl2). A pre-surfactant flush of a
similar aqueous solution limited to NaCl and CaCl2 was recommended to purge mobile
LNAPL from the pilot test area where surfactant was injected into ERW-20 and C-8 and
groundwater was extracted at nearby recovery wells C-7, C-9, and B-8 and B-9 to
enhance surfactant dispersion. The total pore volume in the pilot test area was estimated
to be 39,000 gallons based on the presence of sand and silt lenses totaling the vertical
depth of 1 foot and a porosity estimate of 35%.
A pilot test was conducted at seven of the LNAPL wells where the injection of
brine followed by surfactant solutions resulted in the recovery of approximately 80
gallons of LNAPL at a downgradient well (C-9) located approximately 80 feet from the
treatment area (C-8 and ERW-20) during DPE. No LNAPL was recovered downgradient
of treatment wells where the brine solution was omitted.
Analysis of product in samples collected from wells exhibiting LNAPL indicated
varying proportions of gasoline (16-65%, average of 41%), diesel fuel (24-67%, average
of 44%) and crude oil (11-18%, average of 14%). The LNAPL recovered from C-9
following surfactant treatment was comprised of 65% gasoline, 25% diesel fuel and 11%
crude oil. Conversely, the proportions of gasoline, diesel fuel and crude oil PHCs in
groundwater ranged from 49-76% (average of 62%), 22-44% (average of 30%) and 4-
13% (average of 8%), respectively.
DISCUSSION
Importance of Comprehensive Site Characterization
The remediation of soil and groundwater impacted by PHCs in low permeability
sites continues to be a challenge, presumably due to the low water solubility and volatility
of these compounds. Through the use of innovative assessment tools, like electrical
resistivity imaging (ERI), contaminant migration in even the most dense of clays is
observed to occur over substantial distances.9 The case study presented in this paper
demonstrates the migration of weathered PHCs consistent with straight run gasoline, diesel
fuel and crude oil over 1,500 feet in the silt and clay alluvium of the Mississippi River
delta.
9 Using electrical resistivity imaging to evaluate permanganate performance during an in situ
treatment of an RDX-contamnated aquifer. Halihan et al (2009). Environmental Security
Technology Certification Program Final Report ER-0635. Department of Defense.

12
Earlier investigations limited site characterization to the analysis of BTEX
compounds, naphthalene and TPH-DRO in groundwater. Based on these results, a total of
46 recovery wells were installed in a 6 acre area to facilitate DPE operations from two
fixed systems. This remedial approach proved to be ineffective at the recovery of vapor,
groundwater and LNAPL phase contaminants where frequent system shutdowns,
equipment scaling and pump failure, and the inability to perform DPE at more than 10
wells at a time constrained the effectiveness of remedial efforts.
The forensic analysis of groundwater and LNAPL samples revealed the presence
of a complex mix of weathered straight run gasoline, diesel fuel and crude oil PHCs. A
total of 36 additional recovery wells were installed to characterize soil conditions and
define the lateral and vertical extent of PHCs in soil, groundwater, vapor, and LNAPL.
Impacted soil was shown to contain approximately 50% diesel fuel, 34% gasoline,
and 16% crude oil, and dissolved phase PHCs contained approximately 30% diesel fuel,
62% gasoline, and 8% crude oil. Groundwater recovered during DPE events contained
approximately 80% diesel fuel, 15% crude oil and 5% gasoline, which was considered to
be consistent with PHCs comprising immobile LNAPL in soil pores that were recovered
during DPE. Conversely, mobile LNAPL collected from recovery wells was comprised of
approximately 43% diesel fuel, 44% gasoline, and 14% crude oil.
This comprehensive characterization of site conditions and analysis of the PHCs
present at the site was used to enhance the recovery of dissolved and LNAPL phase
contaminants and to develop a more accurate CSM for the distribution of contaminants
present and preferential migration flow paths across the site.
Phase Partitioning of PHCs and the Shift towards Mobile LNAPL
The isolated occurrence of LNAPL appearing in recovery wells approximately 700
feet from the former refinery is attributed to increases in the coalescence of dissolved phase
PHCs resulting from decreases in their effective water solubility. Strongly reducing
conditions induced by the anaerobic biodegradation of PHCs increased the effective water
solubility of soil minerals thereby shifting the phase partitioning equilibrium of PHCs
towards LNAPL.
While the combined concentration of PHCs in soil, groundwater and vapor phases
exceeded the Csat literature values for gasoline and diesel fuel in fine sand and silt,
indicating the presence of immobile LNAPL, the combined PHC concentrations were well
below the Cres literature values. This finding suggests the presence of ample PHC storage
capacity, particularly in soil, and that the mobile LNAPL in the central recovery wells did
not originate as a contiguous plume from the refinery but rather occurred as dissolved phase
PHCs coalesced to LNAPL as a result of a shift in the phase partitioning equilibrium
primarily from dissolved to LNAPL phase PHCs.
It should be mentioned that, for low permeable sites, the migration of LNAPL into
monitoring or recovery wells may not be representative of how LNAPL would migrate
through the subsurface in the absence of these artificial pathways. The void spaces created

13
by such wells reduces the capillary forces in soil pores contributing to the liberation of
immobile LNAPL into the annulus and/or well screen of nearby wells.10
Conceptual Site Model for the Presence of Mobile LNAPL and
Long Range Migration of PHCs in Groundwater
The biodegradation of PHCs substantially altered the geochemical conditions at
the site as various microbial populations reduced the complete supply of electron
acceptors (i.e. oxygen, nitrate, iron and sulfate) to electron rich byproducts that created
the strongly reducing conditions required for the growth of methanogenic bacteria. The
presence of LNAPL in recovery wells located approximately 700 feet downgradient of
the former refinery coincided with high concentrations of dissolved and vapor phases of
carbon dioxide and methane, and high concentrations of dissolved phase soil minerals.
Carbon dioxide generated from the oxidation of PHCs by methanogenic bacteria served
as an exogenous electron acceptor that was reduced to methane during the anaerobic
degradation of PHCs.
The proportions of diesel fuel and crude oil PHCs in groundwater decreased as
their proportions increased in LNAPL. Despite their presence in mobile LNAPL, the
proportion of dissolved phase gasoline PHCs increased further downgradient. These
trends are attributed to increases in the effective water solubility of gasoline PHCs as a
result of the diminished concentrations of dissolved phase diesel fuel and crude oil PHC,
and soluble soil minerals.
Methanogenic bacteria may also be contributing to the formation of LNAPL
and/or long range migration of dissolved phase PHCs through the production of anionic
or nonionic biosurfactants released into the groundwater to enhance the bacterial access
to and degradation of LNAPL The generation of high concentrations of vapor phase
carbon dioxide and methane may also be contributing to the long range migration of
PHCs by creating preferential migration pathways formed by the fracturing of poorly
permeable silt and clay soil below the groundwater table11. This is consistent with the
observation of dry silt and clay soil below the groundwater table.
The Design of Feasible Remedial Options
The recovery of immobile LNAPL from soil pores to levels where the dissolution
of PHCs into groundwater is controlled is key to preventing the formation and entry of
mobile LNAPL into site wells, and the continued migration of dissolved phase PHCs.
While methanogenic bacteria can contribute substantially to the formation of LNAPL and
the long range migration of PHCs in groundwater, they also play a substantial role in
their biodegradation.
While the use of in situ chemical oxidation (ISCO) technology may prove
beneficial to limiting the potential for the migration of dissolved phase PHCs beyond
property boundaries, its implementation in areas bordering property boundaries needs to
10 LNAPL and the MCP: Guidance for Site Assessment and Closure (2014). MASSDEP 11 Communication with Todd Halihan, associate professor of hydrology at the School of Geology,
Oklahoma State University, Stillwater, OK

14
be carefully evaluated given the likely repercussions on the biodegradation of PHCs and
potential precipitation of high concentrations of dissolved phase soil minerals that could
plug what limited soil pores exist thereby complicating remedial actions.
The use of anionic surfactants to enhance desorption, liberation and recovery of
immobile LNAPL was shown to be an effective remedy that is not expected to impact the
biodegradation of PHCs. Accommodations must be made, however, for the treatment
and disposal of groundwater containing surfactant materials recovered during the
dispersion of surfactant and recovery of liberated LNAPL, as the surfactants have a
similar liberating effect on LGAC-based treatment systems.
States where the reinjection of remedial additives is not permitted should
reconsider approving the closed loop injection, dispersion, and reinjection of surfactant
solutions that would enhance desorption and removal of immobile LNAPL and thereby
address complications posed by the treatment and disposal of surfactant containing
groundwater. In states like Mississippi, the injection of surfactant, its subsurface
dispersion, treatment and/or disposal, and subsequent LNAPL recovery must be treated
as separate operations that prolong site cleanup and increase costs substantially.
ACKNOWLEDGEMENTS
The authors greatly appreciate the technical assistance of Shiar Rahaim of
Summit Environmental Group, Inc. of Jackson, MS who, as the MS Registered
Professional Geologist during this work, was in responsible charge of all geology related
field work. Additionally we thank Ben Dismukes, Thomas Rahaim and Spencer Rucker
of Summit, and Sarah Rogers, Lucy Cross and Hilary Adam of Ramboll Environ for their
dedicated field work. Many thanks also go to the mobile DPE team from Fruits &
Associates, Inc, Walker Hill Environmental, Inc. and Alpha Analytical Inc. for their very
professional services involving mobile DPE events, well installation and analytical
services, respectively.
REFERENCES
1. Innovations in Groundwater and Soil Cleanup. From Concept to
Commercialization (1997) Commission on Geosciences, Environment and
Resources. Water Science and technology Board. ISBN: 978-0-309-06358-6.
2. Three and Four Phase Partitioning of Petroleum Hydrocarbons and Human Health
Risk Calculations (December 2006) Geosphere, Inc. and CH2MHILL for the
Alaska Department of Environmental Conservation, Statement of Cooperation
Working Group
3. Natural Attenuation of Fuels and Chlorinated Solvents. Wiedemeier T. H. et al.
(1999). John Wiley & Sons, Inc. ISBN 0-471-19749-1.

15
4. Non-aqueous phase liquid (NAPL) mobility limits in soil. Brost, E.J and DeVaull,
G.E. American Petroleum Institute Soil & Groundwater Research Bulletin (June
2000)
5. Low Stress (Low Flow) Purging and Sampling Procedure for the Collection of
Groundwater Samples from Monitoring Wells. US EPA EQA SOP-GW 001
Revision 3 January 19, 2010
6. Conversion factor calculations to mg/kg for PHCs in groundwater
7. Conversion factor calculations to mg/kg for PHCs in soil gas
8. Technology Practices Manual for Surfactants and Cosolvents, Chapter 4.
Surfactant/Cosolvent Enhanced Recovery of NAPLs. CH2MHILL, February 1997.
https://clu-in.org/products/aatdf/toc.htm
9. LNAPL and the MCP: Guidance for Site Assessment and Closure (2014).
Massachusetts Department of Environmental Protection
10. Using electrical resistivity imaging to evaluate permanganate performance during
an in situ treatment of an RDX-contaminated aquifer. Halihan et al (2009).
Environmental Security Technology Certification Program Final Report ER-0635.
Department of Defense.
11. Communication with Todd Halihan. (November 2016) Associate Professor of
Hydrology at the School of Geology, Oklahoma State University, Stillwater, OK

16
TABLES

17
Table 1. Summary of Naturally Occurring Soil Minerals (mg/kg) and TOVs (ppmv)
<RL below minimum detection limit
SB-37 control soil boring

18
Table 2. Summary of Dissolved Metal, Methane, and Carbon Dioxide, and TPH-GRO,
TPH-DRO and C28-44 Carbon Fraction Concentrations in Groundwater Samples
Collected Upgradient, Within and Downgradient of Mobile LNAPL Areas

19
Table 3. Total Mass of PHCs in Soil, Groundwater and Vapor Phases (mg/kg)

20
FIGURES

21
Figure 1. Site Plan Showing Former Asphalt Refinery and Stormwater Impoundment,
Recovery and Monitoring Wells and Wells Exhibiting Mobile LNAPL

22
Figure 2. Geological Cross-Section
23
Figure 3A. Vertical Extent of TOVs in Soil Samples Collected 2014-16
Along the Northern and Southern Flow Paths, Soil Type and
Depth to Groundwater Table on September 21, 2016
Northern Flow Path
Southern Flow Path

24
Figure 3B. Vertical Extent of TPH-GRO in Soil Samples Collected 2014-16
Along the Northern and Southern Flow Paths, Soil Type and
Depth to Groundwater Table on September 21, 2016
Northern Flow Path
Southern Flow Path
25
Figure 3C. Vertical Extent of TPH-DRO in Soil Samples Collected 2014-16
Along the Northern and Southern Flow Paths, Soil Type and
Depth to Groundwater Table on September 21, 2016
Northern Flow Path
Southern Flow Path

26
Figure 4. Benzene (ug/l) Isoconcentration Maps for Samples Collected
September 2010 and 2015/2016 Including Location of LNAPL Wells
September 2010 (LNAPL depicted by black triangles)
September 2015/2016 (LNAPL depicted by black triangles)

27
Figure 5. TPH-GRO and TPH-DRO Isoconcentration Maps for
Groundwater Samples Collected in 2016 Including LNAPL Wells
TPH-GRO (LNAPL depicted by black triangles)
TPH-DRO (LNAPL depicted by black triangles)

28
Figure 6. Dissolved Metals and Methane Concentrations in Groundwater
Figure 7. Summary of Dissolved Phase Carbon Dioxide and Methane Concentrations
versus LNAPL Thickness in Recovery Wells Upgradient, Within and Downgradient of
the LNAPL Plume in June and July 2016
0
2,000
4,000
6,000
8,000
10,000
12,000
14,000
16,000
0
50
100
150
200
250
Dis
solv
ed M
eth
ane
and
P
HC
Co
nce
ntr
atio
ns
(ug/
l)
Dis
solv
ed C
arb
on
Dio
xid
e (m
g/l)
an
dLN
AP
L Th
ickn
ess
(fee
t x
100)
Recovery Wells Arranged West (A-14) to East (ERW-6)
LNAPL x 100 Carbon Dioxide Methane
TPH-GRO TPH-DRO Crude Oil
A2
A4
C4
A6
B6 C6
C8
ERW20
C9
C…
0
50,000
100,000
150,000
200,000
250,000
0 2,000 4,000 6,000 8,000 10,000 12,000 14,000
Dis
solv
ed M
etal
s (u
g/l
)
Dissolved Methane (ug/l)

29
Figure 8. Trends in Gasoline and Diesel Fuel PHCs Proximate to the LNAPL Plume