influence of noul typhoon on sea surface temperature, heat … · international journal of...
TRANSCRIPT

International Journal of Scientific and Research Publications, Volume 3, Issue 6, June 2013 1 ISSN 2250-3153
www.ijsrp.org
Influence of Noul Typhoon on Sea Surface Temperature,
Heat Fluxes and Precipitation Rate
Tahereh Haghroosta1, Wan Ruslan Ismail
1, 2
1Center for Marine and Coastal Studies (CEMACS), Universiti Sains Malaysia
2Section of Geography, School of Humanities, Universiti Sains Malaysia
Abstract- This paper presents how a typhoon can change the sea surface temperature (SST) and heat fluxes trend. As a case study,
Noul typhoon was investigated over the South China Sea. It affected South China Sea from November 14 to November 17 in 2008.
Using archived data of National Centers for Environmental Prediction / National Center for Atmospheric Research data set, the effects
of Noul typhoon on SST, latent heat flux (LHF), and sensible heat flux (SHF), were studied. Furthermore, the precipitation rate (Prate)
during the typhoon was investigated as well. As a contribution, comparing daily and monthly contour maps for the desired parameters
showed the important variations which resulting from typhoon intensity. The results also indicated that SST decreased in the area
(SST contours occupy a smaller area) and Heat Fluxes reduced during the storm as well, from range of 100-300 W/m2 to 80-140
W/m2. The parameters must remain in a special range (shown in the figures, at least 302 ºK for SST and 90 and 10 W/m
2 for LHF and
SHF respectively), to help the storm to be alive and grow. Results indicate that the amount of Prate is also affected by the storm’s
severity. Index Terms- Heat flux; Noul typhoon; precipitation rate; sea surface temperature; tropical cyclone
I. INTRODUCTION
he South China Sea is a large marginal sea placed at the west side of the tropical Pacific Ocean. It is a semi-closed ocean basin
restricted by South China, Peninsular Malaysia, Borneo Island, Philippines and Indo-China Peninsula. It connects with the East
China Sea, the Indian and the Pacific Ocean through the Taiwan Straits, the Straits of Malacca and the Luzon Straits, respectively [1].
The area of this study is from 0º to 15º north and from 100º to 130º east.
At the ocean-atmosphere interface, heat exchanging occurs with a number of processes such as: solar radiation, long-wave
radiation, sensible heat flux (SHF) by convection and conduction, and latent heat flux (LHF) by sea-surface water evaporation [2]. The
oceanic LHF is heat energy released or absorbed by the ocean during a phase transition without a change in temperature such as water
surface evaporation. SHF is heat energy transferred by conduction (molecular movement) and convection (observable movement of
fluid) at the atmosphere–ocean interface that creates a change in the system temperature [3]. The distribution of heat flux over the
oceans is a key element for climate studies [2], and they have an essential role in developing and maintaining of the cyclones [4].
However, operational predicting of typhoon intensity variation is still a challenging task.
Tropical cyclones (TCs) are a synoptic phenomenon over warm waters. They often generate rainstorms and storm surges, which are
caused many financial and human losses in countries. Research on this issue can improve understanding on the mechanisms of TC
variation and provide a scientific foundation for short-term forecasting, increasing capability for defending against this kind of
disasters, and reducing losses [5]. TCs are also created by disturbances in ocean heat fluxes and caused quick variation in the heat,
buoyancy fluxes and the currents, in the oceanic mixed layer over a short limited time (a few days to weeks). Thus, it indicates that the
upper ocean response to the storm moving has an important role in controlling the intensity of cyclone from related changing in the
upper ocean status like surface temperature and in atmospheric status such as winds and precipitation. Earlier investigations in the
tropical Indian Ocean, showed that sea surface temperature (SST) are induced by the passing cyclones in the Bay of Bengal and
Arabian Sea. It also indicated that because of the stratification in the area, magnitude of the SST reduction is caused by the cyclone [6,
7, 8, and 9].
It is well known that TCs achieve their energy from warm water and ocean provides energy for typhoon’s strengthening [10 and
11]. The TC intensity is due to its interaction with the warm water which provides fuel. When the cyclone spins, lower water stirs, and
it brings cooler water from the depths. This cooling effect is caused reducing the TC intensity. Most severe cyclones are feed by warm
water, but some of them are self-feeding and self-strengthen by releasing energy from evaporated water when it condenses back into
the water. When air moves rapidly over warm water, it can absorb huge evaporated water. The air rises when it coverage the center of
the cyclone. It cools during rising, and cooled water vapor changes into droplets. This is the process of releasing energy, which is
called heat of condensation [12].
T

International Journal of Scientific and Research Publications, Volume 3, Issue 6, June 2013 2 ISSN 2250-3153
www.ijsrp.org
The energy source of storms is due to the imbalance in thermodynamic aspect between atmosphere and oceans in the tropical area
[10]. This is related to an actual temperature difference between air and water and also the air saturation of near-surface. The water
evaporation transfers heat from the ocean which has a large effective heat capacity compared with the atmosphere.
An experiment showed the effect of the ocean response to the behavior of storm. Similar experiments were also done with the constant
SST. The experiments demonstrated that the SST cooling by the TCs resulted in an important effect on the storm intensity due to
decreasing of total heat flux related to the TC over the area of decreased SST. It was found that cooling of the sea-surface due to TCs
was larger when the storms moved slower [13].
In another study in the tropical area of Pacific Ocean using moored buoy data, relationship between SST and LHF in the ocean was
investigated. It showed that at low SST, the LHF enhances with SST; at high SST, the LHF reduces with increasing SST. It also
considered wind speed and humidity as two factors, which can affect on SST and LHF. The distribution of SST, LHF, wind speed and
humidity is longitudinal. For example, SST has the lowest value in eastern Pacific; wind speed is large; and SST is the highest,
whereas the wind speed is low in the western Pacific. LHF increases from the east of Pacific and reaches to maximum point in the
central Pacific, and it reduces toward the western Pacific [14].
The effect of Vamei typhoon on the amount of precipitation over Singapore and some part of Malaysia such as south of Johor
investigated by [15]. The typhoon landed in Singapore on 27 December 2001. He said that higher SST could explain the contribution
of LHF that maintained the durability of the Borneo Vortex over the sea. While one of the direct effects of Vamei typhoon was on the
understanding of how TC forms in an equatorial region, a more perceptible effect was heavy rainfall that it brought to Singapore and
south of Johor.
The impact of tropical cyclones in the Western Pacific (WP) Ocean and South China Sea on the precipitation in Malaysia was
studied by [16]. It was found that tropical cyclones in the WP and South China Sea not only have affection on the precipitation in the
East of Malaysia such as Sabah and Sarawak, but also there are some effects in the northwestern regions of Peninsular Malaysia. So
predicting the TCs in this area can be useful for studying climate change in the area.
In this study, the effect of presence of a typhoon in the area was studied. It will be shown how a typhoon affected on SST, LHF,
SHF and Prate values. As a case study, Noul typhoon has been selected because according to the report of Asian Disaster Reduction
Center [17], Noul typhoon hit the central part of Vietnam and caused flooding and killed 15 people in November 2008. At December,
the southern of Thailand also faced intensive flooding several times and at least 28 death people.
A. Noul Typhoon overview
Noul typhoon (Figure 1) happened in November 2008 in South China Sea. At first, a tropical disturbance formed in the Philippines
(the east of Mindanao) on November 12. Later, that day, the Joint Typhoon Warning Center (JTWC) estimated that the disturbances
have chances to form an important TC in next 24 hours. It changed from a tropical depression to a tropical disturbance on November
14. It also changed to a tropical storm at 0060 UTC on November 16 and reached its maximum point at 0000 UTC on November 17
with a 993 mbar minimum central pressure and maximum sustained winds of 40 knots as a tropical storm (Figure 2, 3). The Noul was
weakened slightly after made landfall in Vietnam almost at the middle of November 17 and finally disappeared at the end of the day
near Cambodia [18].
Figure1. Noul typhoon trace in November [19]

International Journal of Scientific and Research Publications, Volume 3, Issue 6, June 2013 3 ISSN 2250-3153
www.ijsrp.org
Figure2. Noul typhoon, maximum wind speed [18]
Figure3. Noul typhoon, minimum central pressure [18]
II. DATA AND METHODS
Data for this study consist of two major sources. The first of which contains the monthly mean and daily NCEP reanalysis data [20]
available from the Climate Prediction Center (CDC). For this topic, SST, LHF, SHF and Prate were used. The data have a resolution
of 2.5 degrees in both the north/south and east/west directions. The second of which is the best track data from the National Oceanic
and Atmospheric Administration (NOAA) that consists of six hourly TC positions at 0000, 0600, 1200, and 1800 UTC, for each day
of a TC existence [19]. Therefore, one can analyze the individual pattern of the parameters and also monthly mean value of the
parameters to find the possible relation between typhoon and specified parameters.
III. RESULTS
A. Typhoon effects on SST, LHF, SHF
In order to describe the effects of Noul typhoon over the South China Sea completely, it should be desirable to have full
observational images of these waters two days before and after the typhoon to compare with that obtained during the typhoon. Results
from comparing the daily changes and also monthly mean value of SST, LHF and SHF during Noul typhoon indicates that the net
surface heat flux still has major contribution to the SST variation tendency during typhoon and there is a correlation between SST and
heat fluxes changing with the speed of storm moving. When a storm has a sluggish variation in its speed, the SST and heat fluxes
change with a slow slope.
Compared with monthly mean values (Figure 4), Figure5 shows that, two days before the Noul typhoon, a huge area with SST of
302 ºK was reported. It can be seen that more compact lines and different shapes of these parameters contours. Increasing of LHF
values in the south of the typhoon area is considerable (nearly two times bigger than the monthly mean value, about 300 by 150
W/m2), but this parameter decreased about 45% (50 by 90) at the north of the typhoon area. LHF variations indicate the evaporation
changes, and also SHF changes show the environmental temperature variations.

International Journal of Scientific and Research Publications, Volume 3, Issue 6, June 2013 4 ISSN 2250-3153
www.ijsrp.org
Figure 4: Monthly Mean value of SST (solid blue lines) in Kelvin, LHF (solid green lines), SHF (long dash purple lines) in W/m
2, and
Noul trace are shown at November 2008. The contours intervals are 2, 50, and 10 respectively.
Figure5. SST (solid blue lines) in Kelvin, LHF (solid green lines) and SHF (long dash purple lines) in W/m2, and Noul trace are
shown at November 12, 2008. The contours intervals are 2, 50, and 10 respectively.
In Figure 6 a strong declining is observed in the area for LHF but no considerable changes for SHF. Some changes in the shape of
contours indicate a little circulation in the area. A hole inside the SST contour has been created, which shows that the SST is also
reducing to feed typhoon, which has been claimed by [12] as well.

International Journal of Scientific and Research Publications, Volume 3, Issue 6, June 2013 5 ISSN 2250-3153
www.ijsrp.org
Figure6. SST (solid blue lines) in Kelvin, LHF (solid green lines), SHF (long dash purple lines) in W/m
2, and Noul trace are shown at
November 13, 2008. The contours intervals are 2, 50, and 10 respectively.
In Figure 7, disturbances in the area are obvious. A little more decline in LHF and also a bigger hole inside the SST contour were
observed (it was going to be divided into two parts). The next-day, SST contour is separated (Figure 8), and some loop contours were
as well seen (LHF and SHF) these variations show that typhoon feeding is still ongoing. Figure 8 shows a decline in LHF when
compared with its previous day and monthly mean value (Figure 4).
Figure7. SST (solid blue lines) in Kelvin, LHF (solid green lines), SHF (long dash purple lines) in W/m
2, and Noul trace are shown at
November 14, 2008. The contours intervals are 2, 50, and 10 respectively.

International Journal of Scientific and Research Publications, Volume 3, Issue 6, June 2013 6 ISSN 2250-3153
www.ijsrp.org
Figure8. SST (solid blue lines) in Kelvin, LHF (solid green lines), SHF (long dash purple lines) in W/m
2, and Noul trace are shown at
November 15, 2008. The contours intervals are 2, 50, and 10 respectively.
Wind speed of the typhoon changed from 20 to 35 knots between November 15 and the end of November 16 (Figure 9). This
considerable change in speed caused decreasing in SST; the area of 302 ºK was going to be smaller because of cooling effect [13].
Most variations were in the left side of the typhoon movement. On the next day (Figure 10), the typhoon had higher intensity and
disappeared at the end of the day, after land-falling, a strong reduction in LHF and fewer intensive contours were obvious. SHF
contours were more visible throughout the land near to the place of the land-falling area.
Figure9. SST (solid blue lines) in Kelvin, LHF (solid green lines), SHF (long dash purple lines) in W/m
2, and Noul trace are shown at
November 16, 2008. The contours intervals are 2, 50, and 10 respectively.

International Journal of Scientific and Research Publications, Volume 3, Issue 6, June 2013 7 ISSN 2250-3153
www.ijsrp.org
Figure10. SST (solid blue lines) in Kelvin, LHF (solid green lines), SHF (long dash purple lines) in W/m
2, and Noul trace are shown
at November 17, 2008. The contours intervals are 2, 50, and 10 respectively.
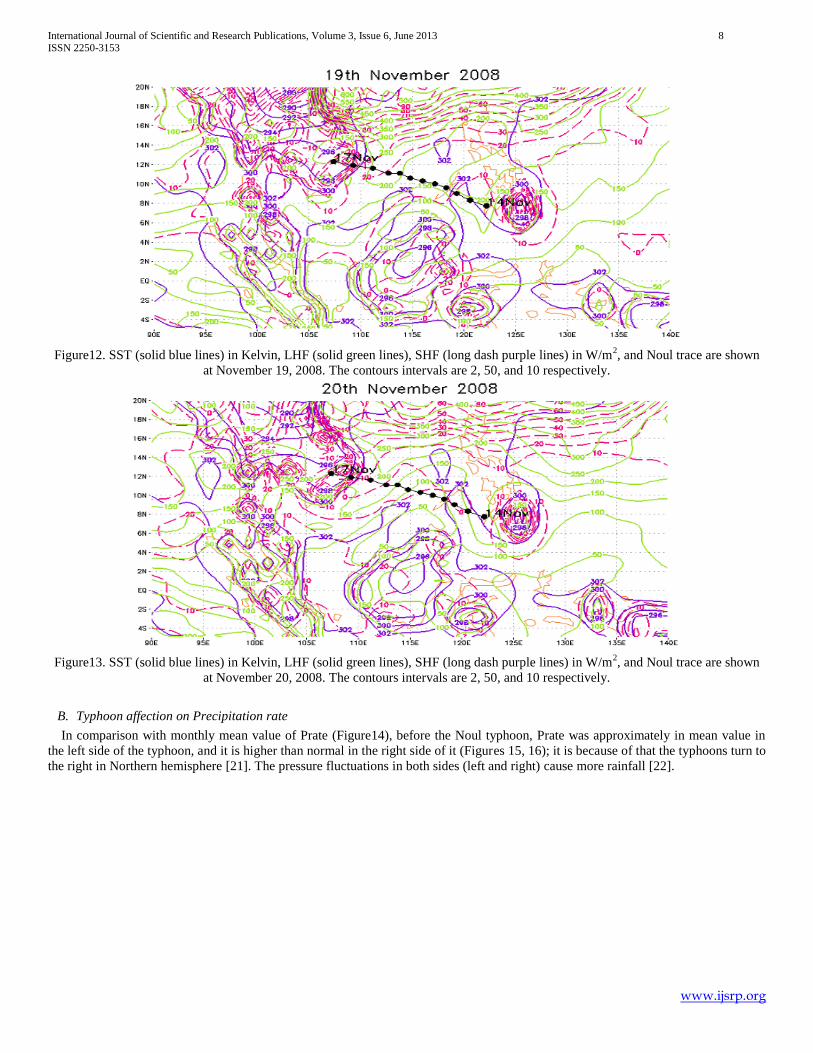
Figure 11 to Figure 13 indicate that according to the variation in contours shape, SST was declining slowly in south of Noul, which
showed the cooling effect during, and after typhoon. Some fluctuations could be seen in LHF, and a remarkable increase was observed
in the density of SHF contours, which was moving towards normal, compared with the monthly mean value. The rapid warming
around the land-falling area, in comparison with that on November 17 was because of increasing of heat fluxes.
Figure11. SST (solid blue lines) in Kelvin, LHF (solid green lines), SHF (long dash purple lines) in W/m
2, and Noul trace are shown
at November 18, 2008. The contours intervals are 2, 50, and 10 respectively.
International Journal of Scientific and Research Publications, Volume 3, Issue 6, June 2013 8 ISSN 2250-3153
www.ijsrp.org
Figure12. SST (solid blue lines) in Kelvin, LHF (solid green lines), SHF (long dash purple lines) in W/m
2, and Noul trace are shown
at November 19, 2008. The contours intervals are 2, 50, and 10 respectively.
Figure13. SST (solid blue lines) in Kelvin, LHF (solid green lines), SHF (long dash purple lines) in W/m
2, and Noul trace are shown
at November 20, 2008. The contours intervals are 2, 50, and 10 respectively.
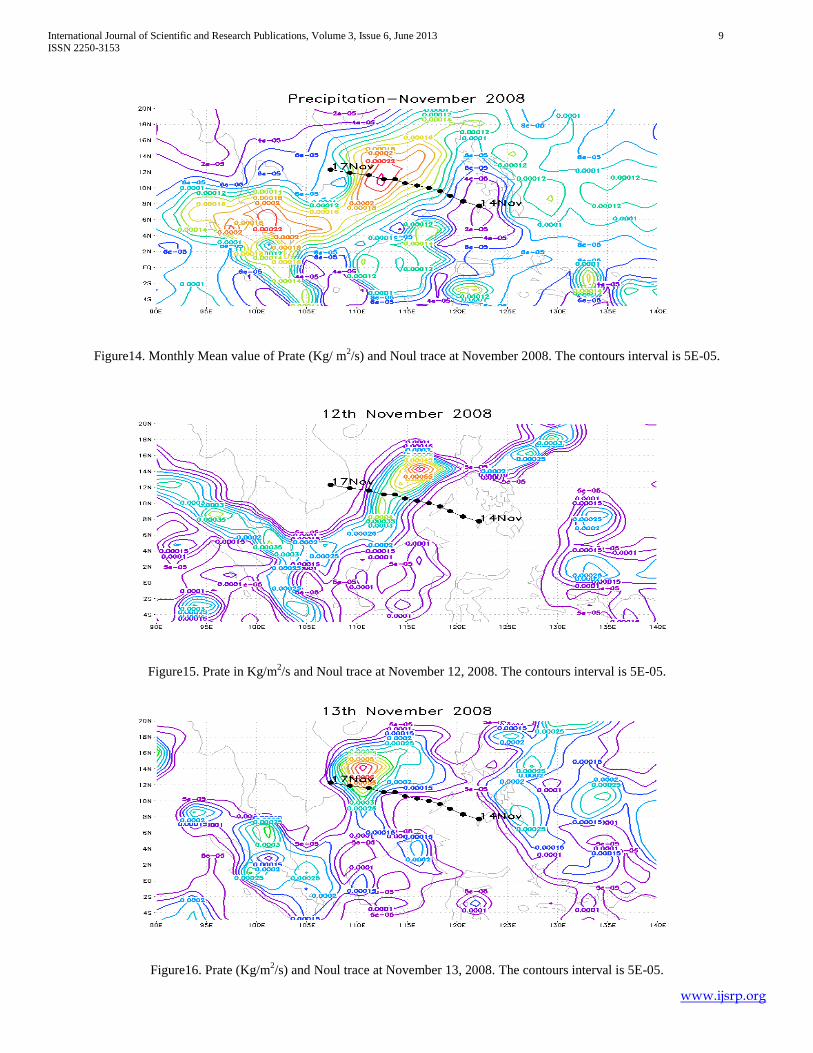
B. Typhoon affection on Precipitation rate
In comparison with monthly mean value of Prate (Figure14), before the Noul typhoon, Prate was approximately in mean value in
the left side of the typhoon, and it is higher than normal in the right side of it (Figures 15, 16); it is because of that the typhoons turn to
the right in Northern hemisphere [21]. The pressure fluctuations in both sides (left and right) cause more rainfall [22].
International Journal of Scientific and Research Publications, Volume 3, Issue 6, June 2013 9 ISSN 2250-3153
www.ijsrp.org
Figure14. Monthly Mean value of Prate (Kg/ m
2/s) and Noul trace at November 2008. The contours interval is 5E-05.
Figure15. Prate in Kg/m
2/s and Noul trace at November 12, 2008. The contours interval is 5E-05.
Figure16. Prate (Kg/m
2/s) and Noul trace at November 13, 2008. The contours interval is 5E-05.

International Journal of Scientific and Research Publications, Volume 3, Issue 6, June 2013 10 ISSN 2250-3153
www.ijsrp.org
In Figure 17, the considerable Prate is seen around the area which high moisture can be injected into the storm area. Maximum
Prate is shown in Vietnam, the south of Cambodia, and the east of Malaysia with the amount of 3.5*10-4
Kg/m2/s. Figure 18 indicates
that the maximum Prate is exactly over the trace of typhoon and some area such as Indonesia, and the east of Malaysia have a high
Prate in comparison with the monthly mean value.
Figure17. Prate (Kg/m
2/s) and Noul trace at November 14, 2008. The contours interval is 5E-05.
Figure18. Prate (Kg/m
2/s) and Noul trace at November 15, 2008. The contours interval is 5E-05.
Figure 19 shows that the maximum Prate area has moved with the storm moving. In November 17 (Figure 20), the east of Malaysia
and also near Cambodia had a large increasing in Prate. In the last day of typhoon’s life the amount of Prate over water is not
considerable and on the other hand, Prate value over the lands is higher than normal that is because of land falling, which is approved
by other studies [23].

International Journal of Scientific and Research Publications, Volume 3, Issue 6, June 2013 11 ISSN 2250-3153
www.ijsrp.org
Figure19. Prate (Kg/ m
2/s) and Noul trace at November 16, 2008. The contours interval is 5E-05.
Figure20. Prate (Kg/ m
2/s) and Noul trace at November 17, 2008. The contours interval is 5E-05.
A day-after typhoon land falling (Figure 21), the Prate over lands was still in high value. It is also seen over water but in low values,
in comparison with the monthly mean value of Prate (Figure14). The Prate variation two days after that are also shown (Figures 22
and 23).

International Journal of Scientific and Research Publications, Volume 3, Issue 6, June 2013 12 ISSN 2250-3153
www.ijsrp.org
Figure21. Prate (Kg/ m
2/s) and Noul trace at November 18, 2008. The contours interval is 5E-05.
Figure22. Prate (Kg/ m
2/s) and Noul trace at November 19, 2008. The contours interval is 5E-05.

International Journal of Scientific and Research Publications, Volume 3, Issue 6, June 2013 13 ISSN 2250-3153
www.ijsrp.org
Figure23. Prate (Kg/ m2/s) and Noul trace at November 20, 2008. The contours interval is 5E-05.
IV. CONCLUSIONS
The variations of the daily and monthly mean SST and Heat Fluxes were effective factors in the South China Sea during Noul
typhoon. This has been investigated by using the monthly mean and daily SST, and surface heat fluxes data from NCEP/NCAR
reanalyzed data set. It was found that quick warming occurred before reporting the Noul, increasing of LHF values in the south of the
typhoon area is considerable (almost two times bigger than the monthly mean value, about 300 by 150 W/m2), but this parameter
decreased about 45% (50 by 90) at the north of the typhoon area (Figure 5). The SST variation after passing storm showed dist inctive
features of the spatial distribution: the decrease of SST in the south of South China Sea and the increase of SST in the north of South
China Sea appear clearly. The rapid warming before the death of cyclone and also around the land-falling area is associated with the
increasing of the net surface heat fluxes at the air-sea interface (Figures 11 to 13). Although SST and Heat Fluxes decrease during
storm, they must remain in a special range to help the storm to be alive and grow.
According to the analyzing maps, the fluctuation in SST and heat fluxes values can increase the cold tongue in the area and Prate as
well. The Prate in the area had high values comparing with the monthly mean values of Prate. When a typhoon landed, a high rate of
precipitation occurred over lands.
ACKNOWLEDGMENT
This study is supported by a fellowship from Center for Marine and Coastal Studies (CEMACS), Universiti Sains Malaysia.
REFERENCES
[1] Ho, C.R., Zheng, Q., Soong, Y.S., Kuo, N.J. and Hu, J.H., 2000. Seasonal variability of sea surface height in the South China Sea observed with TOPEX/Poseidon altimeter data. Journal of Geophysical Research, 105(C6)(13): 981-990.
[2] Yu, L. and Weller, R.A., 2007. Objectively analyzed air-sea heat fluxes for the global ice-free oceans (1981-2005). Bulletin of the American Meteorological
Society, 88: 527-539. [3] Clark, J.O.E., 2004. The essential dictionary of science. Barnes & Noble Books, New York.
[4] Bayers, H.R., 1944. General Meteorology. McGraw-Hill.
[5] Zhou, B.T. and Cui, X., 2011. Sea surface temperature east of Australia: A predictor of tropical cyclone frequency over the western North Pacific? Chinese Science Bulletin, 56(2): 196-201.
[6] Rao, R., 1987. Further analysis on the thermal response of the upper Bay of Bengal to the forcing of pre-monsoon cyclonic storm and summer monsoonal
onset during MONEX-79. Mausam, 38(2): 147-156.
[7] Gopalakrishna, V., Murty, V., Sarma, M. and Sastry, J., 1993. Thermal response of upper layers of Bay of Bengal to forcing of a severe cyclonic storm: A
case study. Indian Journal of Marine Sciences, 22(1): 8-11p.
[8] Murty, V.S.N., Sarma, Y.V.B. and Rao, D., 1996. Variability of the oceanic boundary layer characteristics in the northern Bay of Bengal during MONTBLEX-90. Journal of Earth System Science, 105(1): 41-61.
[9] Seetaramayya, P., Nagar, S. and Mullan, A., 2001. Response of the north Bay of Bengal(Head Bay) to monsoon depression during MONTBLEX-90. The
Global Atmosphere and Ocean System, (0743-0876), 7(4): 325-345. [10] Emanuel, K.A., 1991. The theory of hurricanes. Annual Review of Fluid Mechanics, 23(1): 179-196.
[11] Lin, I.I., Chen, C.H., Pun, I.F., Liu, W.T. and Wu, C.C., 2009. Warm ocean anomaly, air sea fluxes, and the rapid intensification of tropical cyclone Nargis
(2008). Geophysical Research Letters, 36(3): L03817. [12] Uram, H., 2005. Meteorological modification method and apparatus CIP. Google Patents.
[13] Bender, M.A., Ginis, I. and Kurihara, Y., 1993. Numerical simulations of tropical cyclone-ocean interaction with a high-resolution coupled model. Journal
of Geophysical Research 98: 23-27. [14] Zhang, G.J. and Mcphaden, M.J., 1995. The relationship between sea surface temperature and latent heat flux in the equatorial Pacific. Journal of climate,
8(3): 589-605.
[15] Chang, C.H., 2010. The impact of global warming on storms and storm preparedness in Southeast Asia. Kajian Malaysia 28: 53-82. [16] Ariffin, M. and Moten, S., 2009. The impact of Tropical Cyclones in the Western Pacific Ocean and South China Sea on the Rainfall in Malaysia. Research
Publication of Malaysian Meteorological Department, 5/2009.
[17] Asian Disaster Reduction Center, 2008. Disaster Information Archive. Accessed on 1th September 2012, http://web.adrc.or.jp/latest_disaster.php.
[18] Joint Typhoon Warning Center, 2008. Best Track Data Set, Accessed on 1th September 2012, http://www.usno.navy.mil/JTWC/.
[19] NOAA, 2008. Best track data set, Accessed on 1th September 2012, http://csc.noaa.gov/hurricanes/.
[20] Kalnay, E., Kanamitsu, M., Kistler, R., Collins, W., Deaven, D., Gandin, L., Iredell, M., Saha, S., White, G., Woollen, J., 1996. The NCEP/NCAR 40-year reanalysis project. Bulletin of the American Meteorological Society, 77, 437-471.
[21] Holland, G.J., 1997. The maximum potential intensity of tropical cyclones. Journal of the atmospheric sciences, 54(21): 2519-2541. [22] Thompson, R. and Green, D.N., 2009. Mediterranean precipitation and its relationship with sea level pressure patterns. Annals of Geophysics, 47(5): 1617-
1633.
[23] Yang, M.J. and Huang, H., 2004. Precipitation processes associated with the landfalling Typhoon Nari (2001), Extended Abstracts, 26th Conf. on Hurricanes and Tropical Meteorology, Miami, FL.
AUTHORS
First Author - Tahereh Haghroosta, PhD student, CEMACS, Universiti Sains Malaysia, [email protected]
Second Author – Wan Ruslan Ismail, Professor, CEMACS, Universiti Sains Malaysia,
And Section of Geography, School of Humanities, Universiti Sains Malaysia.

International Journal of Scientific and Research Publications, Volume 3, Issue 6, June 2013 14 ISSN 2250-3153
www.ijsrp.org
Corresponding Author - Tahereh Haghroosta, [email protected], +60124767225