influence of organic surface coatings on the … of organic surface coatings on the sorption of...
TRANSCRIPT

Supplemental Information for
Influence of Organic Surface Coatings on the Sorption of Anticonvulsants on Mineral Surfaces
Shen Qu, and David M. Cwiertny*
Department of Civil and Environmental Engineering University of Iowa
4105 Seamans Center Iowa City, IA 52242
September 15, 2013
Environmental Science: Processes and Impacts
16 Pages, 1 Table, 12 Figures
Supporting information contains additional details regarding materials and methods, as well as figures and a table of supplemental results to support discussion presented in the main text.
Electronic Supplementary Material (ESI) for Environmental Science: Processes & ImpactsThis journal is © The Royal Society of Chemistry 2013

I. Supplemental Materials and Methods
Metal oxide characterization. The mineralogy of all materials was investigated via
powder X-ray diffraction (XRD) using a Bruker D8 Advance Diffractometer with Cu Kα
radiation (λ= 1.54 Å).4 The tube current was 40mA with tube voltage of 40 kV. 2θ ranged from
5° to 80° with a scanning rate of 0.5 sec/step and a step size of 0.02°, producing a sample
analysis time of approximately 30 minutes.
Specific surface areas were measured using a Quantachrome BET Nova 4200e automated
surface area analyzer. Samples were outgassed overnight at 110°C prior to analysis via a seven
point N2 BET adsorption isotherm. The nanoscale iron oxides of hematite (100 m2/g), goethite
(110 m2/g) and ferrihydrite (250 m2/g) exhibited the greatest specific surface areas relative to the
commercially available alumina (25 m2/g) and titanium dioxide (anatase; vendor reported 50
m2/g) nanopowders and the silica dioxide particles (7 m2/g).
As electrostatic interactions were expected to influence anticonvulsant sorption, the zeta
potential, defined as the average potential at an imaginary surface (i.e., the surface of shear) that
is considered to lie close to the solid surface, and within which the fluid is stationary during an
electrokinetic process,5 of each sorbent suspension was measured as a function of pH (from pH
6.8 to 8.2). Analysis was conducted on a ZetaPALs zeta potential analyzer (Brookhaven
Instruments), which required suspensions to have an absorbance of ~0.30-0.35 at 546 nm. The
suspensions of each metal oxide (typically 0.15-0.5 g/L) were prepared and allowed to
equilibrate overnight prior to analysis. Approximately 1.5 mL of well-mixed suspension was
then transferred to 3 mL microcuvette for analysis.
2
Electronic Supplementary Material (ESI) for Environmental Science: Processes & ImpactsThis journal is © The Royal Society of Chemistry 2013

II. Supplemental Results and Discussion
Table S1. Summary of best-fit Freundlich isotherm parameters (values of Kf and n) obtained from non-linear regression analysis of experimental data presented in Figures 2, 5 and 6 of the main text. Unless noted, uncertainties represent 95% confidence intervals for these best fit values obtained from non-linear regression analysis of experiment data using the software program Igor Pro (Wavemetrics).
Influence of surfactants on phenytoin adsorption on ferrihydrite (Figure 2) Surfactant & Concentration (mg/L) Kf [(µg/g)(mg/L)-n] n
SDBS 70 150 ± 30 0.79 ± 0.10 SDBS 35 91 ± 12 0.76 ± 0.06 SDBS 9 36 ± 25 0.8 ± 0.3 SDBS 0 12 ± 5 1.00 ± 0.15 CPC 70 64 ± 62 0.7 ± 0.4 CPC 35 42 ± 12 0.95 ± 0.13 CPC 9 30 ± 18 0.8 ± 0.2
CPC 3.5 26 ± 33 0.8 ± 0.5 CPC 0 11 ± 5 0.91 ± 0.19
Influence of surfactants on phenytoin adsorption on different metal oxides (Figure 5) Metal Oxide Kf [(mg/g)(mg/L)-n] n
Ferrihydrite (SDBS) 0.15 ± 0.03 0.79 ± 0.10 Hematite (SDBS) 0.11 ± 0.03 0.75 ± 0.12 Goethite (SDBS) 0.018 ± 0.005 1.03 ± 0.13
Al2O3 (SDBS) 0.011 ± 0.003 1.04 ± 0.12 SiO2 (CPC) 0.16 ± 0.06 0.81 ± 0.18 TiO2 (CPC) 0.039 ± 0.012 0.97 ± 0.14
Ferrihydrite (CPC) 0.064 ± 0.062 0.7 ± 0.4 Hematite (CPC) 0.05 ± 0.04 0.7 ± 0.3 Goethite (CPC) 0.06 ± 0.03 0.76 ± 0.17
Al2O3 (CPC) 0.026 ± 0.012 0.79 ± 0.19 Influence of SDBS on carbamazepine sorption on goethite (Figure 6)*
SDBS Concentration (mg/L) Kf [(µg/g)(mg/L)-n] n 70 55 ± 9 0.77 ± 0.07 35 24 ± 3 0.82 ± 0.05 8.7 8 ± 2 0.97 ± 0.11 3.5 5.0± 1.3 0.95 ± 0.11
*uncertainties represent one standard deviation
3
Electronic Supplementary Material (ESI) for Environmental Science: Processes & ImpactsThis journal is © The Royal Society of Chemistry 2013
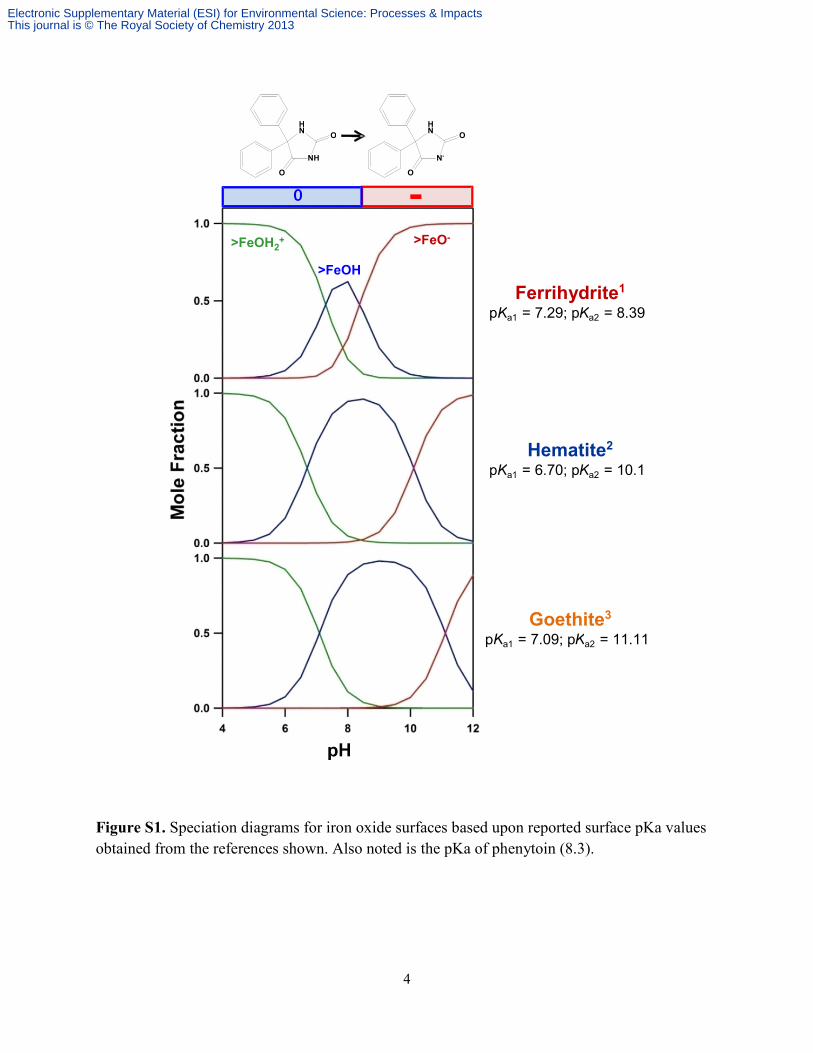
Figure S1. Speciation diagrams for iron oxide surfaces based upon reported surface pKa values obtained from the references shown. Also noted is the pKa of phenytoin (8.3).
-
>FeOH 2 +
>FeOH
0
>FeO -
N H
H N O
O N -
H N O
O
Ferrihydrite1 p K a1 = 7.29; p K a2 = 8.39
Hematite2 p K a1 = 6.70; p K a2 = 10.1
Goethite3 p K a1 = 7.09; p K a2 = 11.11
-
4
Electronic Supplementary Material (ESI) for Environmental Science: Processes & ImpactsThis journal is © The Royal Society of Chemistry 2013

Figure S2. Zeta potential as a function of pH for metal oxide suspensions considered herein. MES was used to maintain pH at 5-6.5, HEPEs was used to maintain pH at 7-7.5 and Trizma was used to maintain pH at 8-9. To achieve the absorbance of 0.3-0.35 at 546 nm as required by the system for zeta potential measurement, the solid loadings for ferrihydrite, goethite, hematite, alumina, titanium dioxide and silica dioxide were 0.5 g/L, 0.3 g/L, 0.5 g/L, 0.2 g/L, 0.2 g/L and 0.15 g/L, respectively.
5
Electronic Supplementary Material (ESI) for Environmental Science: Processes & ImpactsThis journal is © The Royal Society of Chemistry 2013

Figure S3. (a) Adsorption isotherms for phenytoin in ferrihydrite and hematite suspensions. Lines represent Freundlich model fits for sorption isotherms, for which equations from non-linear regression are provided (with 95% confidence intervals associated with model fit parameters). Uncertainty associated with experimental data represents standard deviation of at least triplicate measurements. (b) Equilibrium adsorption and desorption isotherms for phenytoin in ferrihydrite suspensions. After 2 h of adsorption equilibrium, ferrihydrite solids and associated phenytoin were recovered and resuspended while replacing 2 mL of the supernatant with fresh buffer to introduce disequilibrium. After 2 h, additional aqueous samples were collected and analyzed to construct the desorption isotherm. Results of duplicate experiments are shown. All isotherm experiments were conducted with a solid loading of 10 g/L and initial phenytoin concentrations ranging between 2.5-18 mg/L. Solutions contained 25 mM of HEPES buffer and 25 mM NaCl at pH 7.5.
Aqueous Phenytoin (mg/L)
Adso
rbed
Phe
nyto
in (m
g/g)
a)
b)
Csorb = (0.020 ± 0.009) Caq(1.1±0.2)
Csorb = (0.014 ± 0.007) Caq(0.9±0.2)
6
Electronic Supplementary Material (ESI) for Environmental Science: Processes & ImpactsThis journal is © The Royal Society of Chemistry 2013
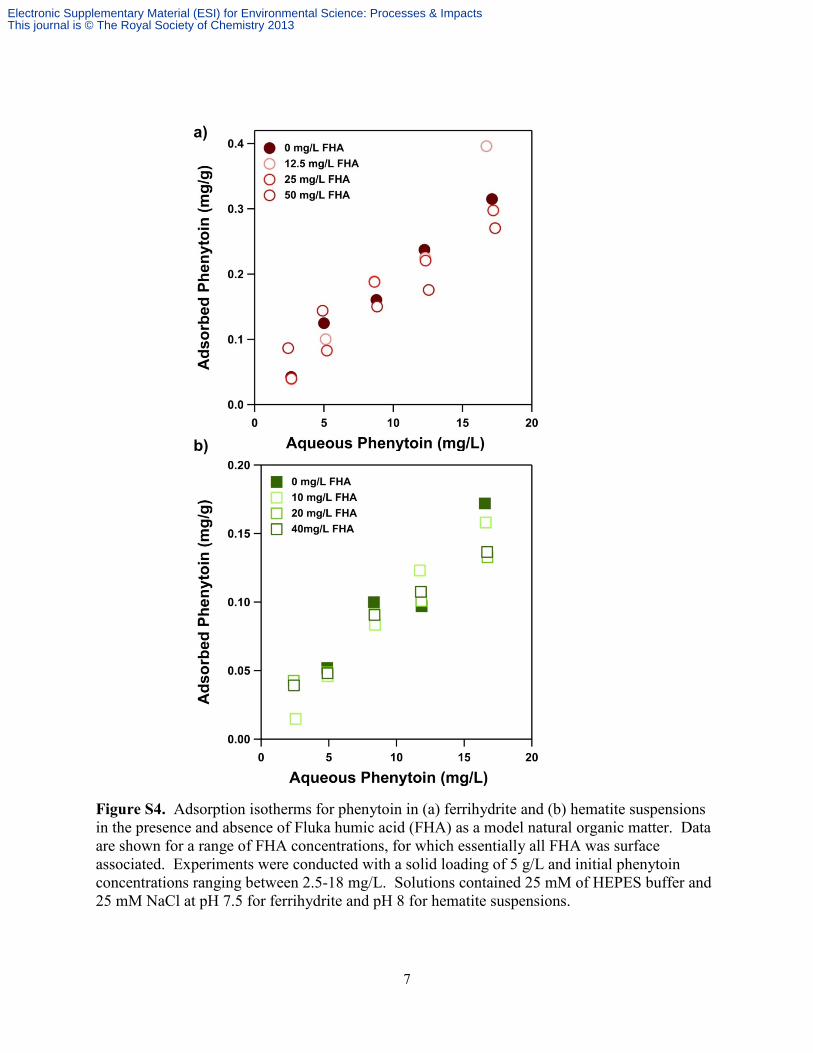
Figure S4. Adsorption isotherms for phenytoin in (a) ferrihydrite and (b) hematite suspensions in the presence and absence of Fluka humic acid (FHA) as a model natural organic matter. Data are shown for a range of FHA concentrations, for which essentially all FHA was surface associated. Experiments were conducted with a solid loading of 5 g/L and initial phenytoin concentrations ranging between 2.5-18 mg/L. Solutions contained 25 mM of HEPES buffer and 25 mM NaCl at pH 7.5 for ferrihydrite and pH 8 for hematite suspensions.
a)
b)
7
Electronic Supplementary Material (ESI) for Environmental Science: Processes & ImpactsThis journal is © The Royal Society of Chemistry 2013
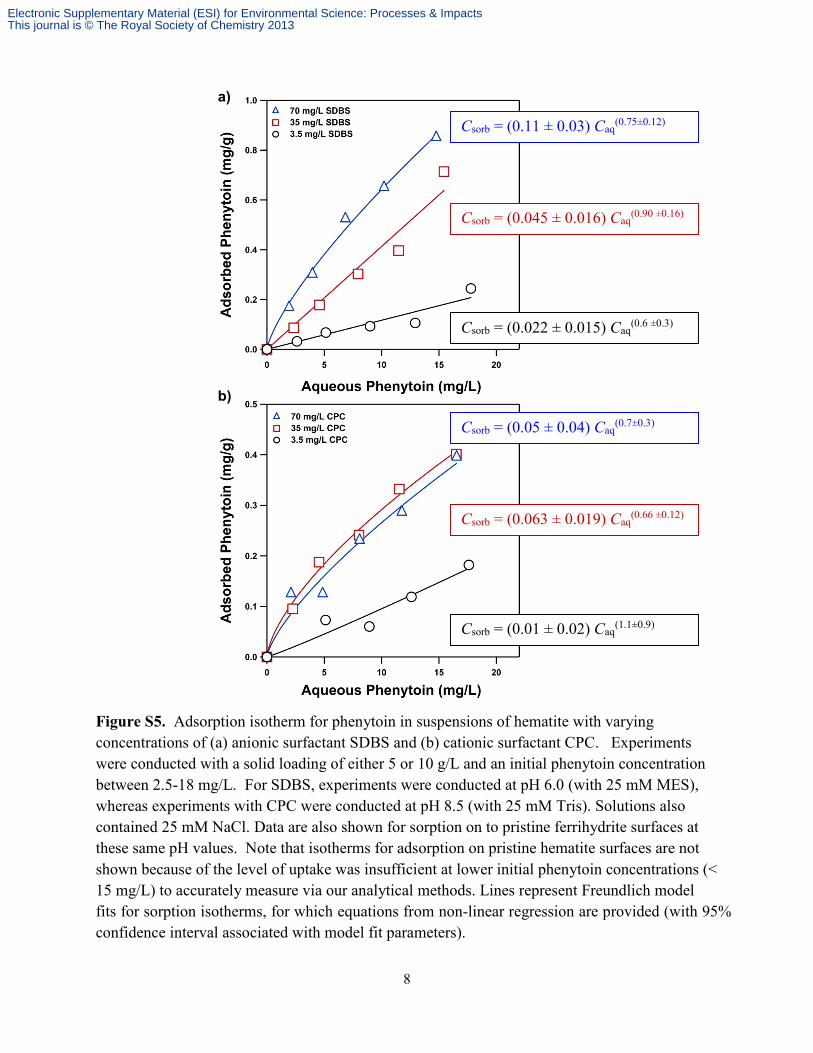
Figure S5. Adsorption isotherm for phenytoin in suspensions of hematite with varying concentrations of (a) anionic surfactant SDBS and (b) cationic surfactant CPC. Experiments were conducted with a solid loading of either 5 or 10 g/L and an initial phenytoin concentration between 2.5-18 mg/L. For SDBS, experiments were conducted at pH 6.0 (with 25 mM MES), whereas experiments with CPC were conducted at pH 8.5 (with 25 mM Tris). Solutions also contained 25 mM NaCl. Data are also shown for sorption on to pristine ferrihydrite surfaces at these same pH values. Note that isotherms for adsorption on pristine hematite surfaces are not shown because of the level of uptake was insufficient at lower initial phenytoin concentrations (< 15 mg/L) to accurately measure via our analytical methods. Lines represent Freundlich model fits for sorption isotherms, for which equations from non-linear regression are provided (with 95% confidence interval associated with model fit parameters).
a)
b)
Csorb = (0.11 ± 0.03) Caq(0.75±0.12)
Csorb = (0.045 ± 0.016) Caq(0.90 ±0.16)
Csorb = (0.022 ± 0.015) Caq(0.6 ±0.3)
Csorb = (0.05 ± 0.04) Caq(0.7±0.3)
Csorb = (0.063 ± 0.019) Caq(0.66 ±0.12)
Csorb = (0.01 ± 0.02) Caq(1.1±0.9)
8
Electronic Supplementary Material (ESI) for Environmental Science: Processes & ImpactsThis journal is © The Royal Society of Chemistry 2013

Figure S6. Adsorption isotherm for cationic surfactant CPC on ferrihydrite at pH 8.5. Experiments were conducted with a ferrihydrite loading of either 5 or 10 g/L and an initial CPC concentration between 3-60 mg/L. Solutions contained 25 mM NaCl and were conducted in the absence of pH buffer to avoid interference during TOC analysis for CPC quantification. Uncertainties represent one standard deviation for at least duplicate analyses.
9
Electronic Supplementary Material (ESI) for Environmental Science: Processes & ImpactsThis journal is © The Royal Society of Chemistry 2013
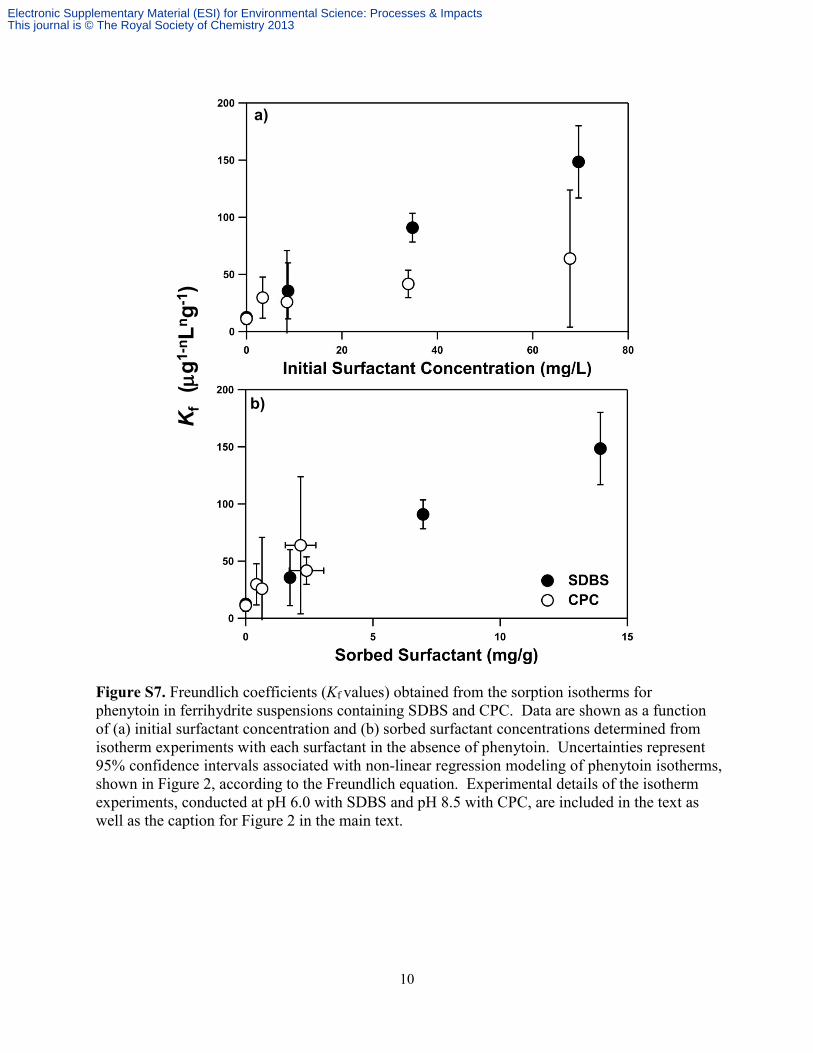
Figure S7. Freundlich coefficients (Kf values) obtained from the sorption isotherms for phenytoin in ferrihydrite suspensions containing SDBS and CPC. Data are shown as a function of (a) initial surfactant concentration and (b) sorbed surfactant concentrations determined from isotherm experiments with each surfactant in the absence of phenytoin. Uncertainties represent 95% confidence intervals associated with non-linear regression modeling of phenytoin isotherms, shown in Figure 2, according to the Freundlich equation. Experimental details of the isotherm experiments, conducted at pH 6.0 with SDBS and pH 8.5 with CPC, are included in the text as well as the caption for Figure 2 in the main text.
Kf
(µg1
-nLn
g-1 )
a)
b)
10
Electronic Supplementary Material (ESI) for Environmental Science: Processes & ImpactsThis journal is © The Royal Society of Chemistry 2013

Figure S8. pH edge adsorption data for phenytoin on SiO2 and ferrihydrite in the presence of SBDS and CPC. Notably, all data were collected at an initial surfactant concentration of 100 µM, below the CMC for both surfactants. Experiments were conducted with a solid loading of either 5 or 10 g/L and an initial phenytoin concentration of 15 mg/L. Solutions contained 25 mM of an appropriate pH buffer and 25 mM NaCl.
11
Electronic Supplementary Material (ESI) for Environmental Science: Processes & ImpactsThis journal is © The Royal Society of Chemistry 2013

Figure S9. (a) Increase in phenytoin sorption due to the presence of CPC in ferrihydrite suspensions as a function of pH. This enhancement factor was calculated by normalizing measured uptake in CPC-containing suspensions to uptake observed in the absence of CPC. As is observed, the degree of enhancement is not constant, nor does it change monotonically with pH, indicating that multiple mechanisms are likely at play and contributing to phenytoin sorption in CPC systems. (b) Influence of CPC sorption on zeta potential of ferrihydrite suspensions. Details of analysis are analogous to those described in Figure S1. CPC uptake results in a more positively charged ferrihydrite surface at all pH values considered.
pH
Zeta
Pot
entia
l (m
V)C
PC E
nhan
cem
ent F
acto
r
a)
b)
FerrihydriteFerrihydrite + 200 µM CPCFerrihydrite + 200 µM SDBS
12
Electronic Supplementary Material (ESI) for Environmental Science: Processes & ImpactsThis journal is © The Royal Society of Chemistry 2013

Figure S10. Sorption isotherms for carbamazepine as a function SDBS concentration in ferrihydrite suspensions. Experiments were conducted with a solid loading of 5 g/L, an initial carbamazepine concentration between 2.5-18 mg/L and at pH 6.0 (with 25 mM MES). Solutions also contained 25 mM NaCl. No sorption of carbamazepine was observed on pristine ferrihydrite surfaces, thus data in the absence of surfactant is not presented. Lines represent Freundlich model fits for sorption isotherms, for which equations from non-linear regression are provided (with 95% confidence interval associated with model fit parameters). For 3.5 mg/L SDBS, for which a fit is not shown, there were insufficient data to perform a reasonable modeling analysis.
Csorb = (0.04 ± 0.03) Caq(0.6±0.3)
Csorb = (0.052 ± 0.014) Caq(0.85 ±0.11)
13
Electronic Supplementary Material (ESI) for Environmental Science: Processes & ImpactsThis journal is © The Royal Society of Chemistry 2013

Figure S11. Sorption isotherms for CPC on SiO2 at pH 6 and 8. Consistent with pH edge results, the amount of CPC sorbed was essentially constant over this pH range. Suspensions contained 5 g/L SiO2 and 200 µM of CPC.
14
Electronic Supplementary Material (ESI) for Environmental Science: Processes & ImpactsThis journal is © The Royal Society of Chemistry 2013

Figure S12. Reversibility of phenytoin sorption in surfactant coated ferrihydrite suspensions. Results from duplicate experiments are shown. Experiments were conducted with 5 g/L ferrihydrite in the presence of 70 mg/L SDBS at pH 6.0.
15
Electronic Supplementary Material (ESI) for Environmental Science: Processes & ImpactsThis journal is © The Royal Society of Chemistry 2013

Literature Cited 1. Dzombak, D. A.; Morel, F. M. M., Surface complexation modeling. Hydrous ferric oxide.
J. Wiley: New York, 1990.
2. Breeuwsma, A. Adsorption of ions on hematite (α-Fe2O3). A colloid-chemical study. Ph.D. Thesis, Wageningen Agriculture University, The Netherlands, 1973.
3. Lumsdon, D. O.; Evans, L. J., Surface Complexation Model Parameters for Goethite (α-FeOOH). J. Colloid Interface Sci. 1994, 164, (1), 119-125.
4. Xie, Y.; Cwiertny, D. M., Use of Dithionite to Extend the Reactive Lifetime of Nanoscale Zero-Valent Iron Treatment Systems. Environ. Sci. Technol. 2010, 44, (22), 8649-8655.
5. Hunter, R. J., "Zeta potential in colloid science." Academic Press, New York, 1981.
16
Electronic Supplementary Material (ESI) for Environmental Science: Processes & ImpactsThis journal is © The Royal Society of Chemistry 2013