influence of starch digestion rate on feedlot …
TRANSCRIPT
Influence of starch digestion rate on feedlot performance and site of starch digestion in beef steers fedhigh concentrate diets of corn or barleyby Thomas James Milner
A thesis submitted in partial fulfillment of the requirement for the degree of Master of Science inAnimal and Range SciencesMontana State University© Copyright by Thomas James Milner (2000)
Abstract:Two trials were conducted to determine the effects of high concentrate diets of corn or barley. Dietswere corn (control); Gunhilde barley (GUN); Harrington barley (HAR); and 50% Gunhilde + 50%Harrington (MIX). Trial one evaluated feedlot performance and carcass characteristics of beef steersfed corn or barley. Eighty crossbred steers were utilized in a randomized complete block design. Trialtwo examined ruminal digestion of steers fed high concentrate diets of corn or barley. Four ruminallyand duodenally cannulated steers were used in a 4 X 4 Latin square designed metabolism trial.Corn-fed steers gained 7% faster (P = .04) than barley-fed steers. No other differences (P > .10) inanimal performance were seen when barleys were compared. Dry matter intake for corn-fed steers washigher (P = .0002) yet feed efficiency was not different (P > .05) between diets. Harrington had greater(P = .01) total starch and digestible starch intake than GUN. Gunhilde had greater (P = .01) DMD thanHAR-fed steers. Corn-fed steers had greater (P < .10) hot carcass and kidney/heart/pelvic fat% thanbarley-fed steers. Feed cost and cost of gain for barley rations was lower (P = .002) than corn rations.Starch flow to the duodenum was greater (P = .004) for corn-fed diets. Total tract starch digestion,along with DM and N, were greater (P = .03) for barley-fed steers. No associative effects (P > .10)were seen in nutrient flow to the duodenum or ruminal digestion (%) when MIX was compared toGUN/HAR. GUN had greater (P = .003) retention time and lower (P = .007) flow rate than HAR-fedsteers. Corn-fed steers had greater (P < .05) animal performance when compared to steers fed barley.With feed efficiencies similar (P > .05), lower feed cost of barley based diets make them an attractivealternative to corn in the Northern Great Plains and Pacific Northwest region. We observed similaranimal performance and metabolic traits of GUN and HAR in these trials. This trial reaffirms the needfor research into environmental and growing location that affect feeding values of barley.

INFLUENCE OF STARCH DIGESTION RATE ON FEEDLOT PERFORMANCE
AND SITE OF STARCH DIGESTION IN BEEF STEERS FED HIGH
CONCENTRATE DIETS OF CORN OR BARLEY
by
Timothy James Milner
A thesis submitted in partial fulfillment of the requirement for the degree
of
Master of Science
in
Animal and Range Sciences
MONTANA STATE UNIVERSITY Bozeman, Montana
July, 2000

APPROVAL
of a thesis submitted by
Timothy James Milner
This thesis has been read by each member of the thesis committee and has been found to be satisfactory regarding content, English usage, format, citations, bibliographic style, and consistency, and is ready for submission to the College of Graduate Studies.
Dr. Janice G. P. BowmanSignature) Date
Approved for the Department of Animal and Range Science
Dr. Peter J. Burfening(Signature)
7-! Z-(TZ) Date
Approved for the College of Graduate Studies
s -
(Signature) DateDr. Bruce R. McLeod

iii
STATEMENT OF PERMISSION TO USE
In presenting this thesis in partial fulfillment of the requirements for a
master’s degree at Montana State University, I agree that the Library shall make
it available to borrowers under rules of the Library.
If I have indicated my intention to copyright this thesis by including a
copyright notice page, copying is allowable only for scholarly purposes,
consistent with “fair use” as prescribed in the U.S. Copyright Law. Requests for
permission for extended quotations from or reproduction of this thesis in whole or
in parts may be granted only by the copyright holder.
Signatur
Date 10, ZO O O

iv
ACKNOWLEDGMENTS
I would like to extend my sincere thanks to the Montana Beef Council and
Montana Wheat and Barley Committee for funding this project. To the Nut
Center staff, present and past, thank you for your time, and support; you did
more than I ever would have expected.
Thank you to my committee members Dr. Sowell and Dr. Tess; gentlemen
you have my respect. To Linda McDonald, thanks for pushing and prodding me
on, this Hogs for you. Lisa, an acknowledgment is not enough. Without your
friendship and guidance I would not have completed this.
Dr. Bowman, thank you for your time, expertise, and, above all, your
understanding that sometimes life has its own plans. Your patience and
willingness to share your knowledge throughout the stormy course of this paper
will always be appreciated.
It is sometimes easy to overlook those that support you the most when
going through the events that coincide with completing a thesis. To my wife
Corinna, thank you for being there even when I did not know it. Looking back it
made things much easier. Finally, to my family, thanks for all the support into
something you did not understand (a cow is a ruminant) and for knowing when to
stop asking if I was done. Ma, thank you for always believing in me; if I ever do a
Ph.D. that one will be for you, but this one goes to Dad. Now I shall take my
leave into that orange and blue sunset.

TABLE OF CONTENTS
LIST OF TABLES................................. vi
LIST OF FIGURES............................................................. vii
ABSTRACT..........................................................................................................viii
1. INTRODUCTION............................... ............................................................. 1
2. LITERATURE REVIEW....................................................................................4
Grain Processing............. 4Digestive Disorders......................................... ■■■■7Starch Structure and Function......... ...i...................................................... 12Ruminal Starch Utilization............................................................................15
3. FEEDLOT PERFORMANCE AND CARCASS CHARACTERISTICSOF BEEF STEERS FED CORN OR BARLEY............................................ 21
Introduction..................................................................................................21Materials and Methods.................................................................................22Results and Discussion.............. 26Implications..................................................................................................32
4. RUMINAL DIGESTION BY STEERS FED HIGH CONCENTRATEDIETS CONTAINING CORN OR BARLEY................................................. 34
Introduction..................................................................................................34Materials and Methods.................................................................................35Results and Discussion............... ............................................. 39Implications........................... 52
5. CONCLUSION................................................:.............................................. 53
LITERATURE CITED.......................... 55
APPENDIX A - ANALYSIS OF VARIANCE TABLES...:...................................... 62

Table Page
1. Composition (% DM basis) of finishing diets containing corn,Gunhilde barley (GUN), Harrington barley (HAR), or 50%Gunhilde + 50% Harrington (MIX) as basal grains...................................... 24
2. Performance by steers consuming finishing diets containingcorn, Gunhilde barley (GUN), Harrington barley (HAR), or50% Gunhilde + 50% Harrington (MIX) as basal grains............................. 29
3. In vivo digestion of finishing diets containing corn,Gunhilde barley (GUN), Harrington barley (HAR), or50% Gunhilde + 50% Harrington (MIX) as basal grains.............................. 30
4. Carcass characteristics of steers fed finishing dietscontaining corn, Gunhilde barley (GUN), Harrington barley,or 50% Gunhilde + 50% Harrington (MIX) as basal grains................... .......32
5. Characteristics of digestion in steers fed finishing diets of corn,Gunhilde barley (GUN), Harrington barley (HAR), or 50%Gunhilde + 50% Harrington (MIX) as basal grains...................................... 41
6. Ruminal volatile fatty acids of steers fed finishing diets of corn,Gunhilde barley (GUN), Harrington barley (HAR), or 50%Gunhilde + 50% Harrington (MIX) as basal grains...................................... 49
7. Analysis of variance for feed lot trial comparing finishing dietsof corn, Gunhilde barley (GUN), Harrington barley (HAR),or 50% Gunhilde + 50% Harrington (MIX) as basal grains.......................... 63
vi
LIST OF TABLES
8. Analysis of variance for metabolism trial comparing finishing diets of corn, Gunhilde barley (GUN), Harrington barley (HAR), or 50% Gunhilde + 50% Harrington (MIX) as basal grains........ 64

vii
Figure Page
1. Ruminal fluid ammonia concentration of steers fed finishing dietsof corn, Gunhilde barley (GUN), Harrington barley (HAR), or50% Gunhilde + 50% Harrington (MIX) as basal grains.............................. 46
2. Ruminal fluid pH of steers fed finishing diets containingcorn, Gunhilde barley (GUN), Harrington barley (HAR),or 50% Gunhilde + 50% Harrington (MIX) as basal grains......................... 48
3. In situ dry matter disappearance of steers fed finishing dietscontaining corn, Gunhilde barley (GUN), Harrington barley(HAR), or 50% Gunhilde + 50% Harrington (MIX) as basal grains...... ........50
LIST OF FIGURES
viii
ABSTRACT
Two trials were conducted to determine the effects of high concentrate diets of corn or barley. Diets were corn (control); Gunhilde barley (GUN); Harrington barley (HAR); and 50% Gunhilde + 50% Harrington (MIX). Trial one evaluated feedlot performance and carcass characteristics of beef steers fed corn or barley. Eighty crossbred steers were utilized in a randomized complete block design. Trial two examined ruminal digestion of steers fed high concentrate diets of corn or barley. Four ruminally and duodenally cannulated steers were used in a 4 X 4 Latin square designed metabolism trial. Corn-fed steers gained 7% faster (P = .04) than barley-fed steers. No other differences (P > .10) in animal performance were seen when barleys were compared. Dry matter intake for corn-fed steers was higher (P = .0002) yet feed efficiency was not different (P > .05) between diets. Harrington had greater (P = .01) total starch and digestible starch intake than GUN. Gunhilde had greater (P = .01) DMD than HAR-fed steers. Corn-fed steers had greater (P < .10) hot carcass and kidney/heart/pelvic fat% than barley-fed steers. Feed cost and cost of gain for barley rations was lower (P = .002) than corn rations. Starch flow to the duodenum was greater (P = .004) for corn-fed diets. Total tract starch digestion, along with DM and N, were greater (P = .03) for barley-fed steers. No associative effects (P > .10) were seen in nutrient flow to the duodenum or ruminal digestion (%) when MIX was compared to GUN/HAR. GUN had greater (P = .003) retention time and lower (P = .007) flow rate than HAR-fed steers. Corn-fed steers had greater (P < .05) animal performance when compared to steers fed barley. With feed efficiencies similar (P > .05), lower feed cost of barley based diets make them an attractive alternative to corn in the Northern Great Plains and Pacific Northwest region. We observed similar animal performance and metabolic traits of GUN and HAR in these trials. This trial reaffirms the need for research into environmental and growing location that affect feeding values of barley.
I
CHAPTER 1
INTRODUCTION
In 1999 1.25 million acres of Montana were planted in barley. This ranked
second in the nation behind North Dakota which planted 1.42 million acres. The
major varieties of barley planted in Montana were: Harrington (49.9%),
Baronesse (7.6%), Busch 1202 (5.2%), and a number of other varieties at < 5.0%
(Montana Agricultural Statistics Service, 1999). In the United States, barley is
used mainly in brewing beer and as an energy supplying cereal grain in livestock
feeds. Grown for many centuries, barley performs well in the arid, cold climate of
the Northern Great Plains and Pacific Northwest region . Regional feed lot
operators utilize barley as the principal energy source in many of their finishing
feed lot rations. The national standard for the malting cu Itivars is the Morex
variety. However, no current standard exists for the feeding grades.
Classification of these cultivars, whether of a feeding or malting type, is typically
based on malting characteristics rather than actual feeding value (Gibson et al.,
1994; MoIinarCanO et al., 1997).
Commonly viewed as the ‘second sister’ to corn as a livestock feed, the
importance of barley has not been over looked by the scientific community.
Barley varieties have demonstrated differences in test weight, chemical
composition, nutritive values, and yield potentials (Kemalyan et al., 1989), as well
as differences in animal performance and carcass characteristics (Milner et al.,

1995). Variability in cultivars has been attributed to geographical location,
growing conditions, year (Kemalyan et al., 1989), and head morphology
(Bowman et al., unpublished).
These variations in barley cultivars have caused differing results in feed
trials. Boss and Bowman (1996a) reported corn-fed steers had greater ADG and
DMI than did those steers fed barley. Conversely, Milner et al. (1995) found no
differences in animal performance with high concentrate diets of either corn or
barley as the basal grain. A major advantage of feeding corn over barley is its
consistent performance. Differences in corn varieties do not seem as
pronounced as those differences observed with barley cultivars. It is generally
accepted that this is due to a greater amount of corn starch escaping ruminal
fermentation and being presented to the small intestine for digestion (0rskov,
1986).
Metabolically, the main focus of barley research has fallen on site and rate
of starch digestion by the ruminant animal. Factors affecting barley starch
digestion include cultivar type, bulk density, grain processing techniques, and
flow rate and retention time both ruminal and post-ruminal. Few trials have been
published that compare different barley varieties and their effect oh animal
performance. Fewer still have compared metabolic factors that may be affecting
these differences between barley varieties. Boss and Bowman (1996b) found ho
differences in extent of starch digestion among three barley cultivars. The
authors did report that Gunhilde (a feed grade barley) had a 30% slower rate of
ruminal starch digestion than did Flarrington (a malting variety).

Based on the Boss and Bowman (1996a; 1996b) trials, the objectives of
this study were to:
1. Evaluate feed lot performance of beef cattle consuming high grain diets
differing in rate of starch digestion.
2. Determine if an associative effect would result from feeding a malting variety
barley with a fast rate of ruminal starch digestion in combination with a
feed barley with a slow rate of ruminal starch digestion.
3. Evaluate site and efficiency of starch digestion in beef calves consuming high
grain diets differing in rate of starch digestion.

CHAPTER 2
LITERATURE REVIEW
Grain Processing
The goal of all grain processing techniques is to damage the pericarp
making starch granules contained within the endosperm more readily digestible
and fermentable. Processing has been shown to be one of the simplest ways to
manipulate nutritive values of cereal grains. Fibrolytic, proteolytic and amylolytic
enzyme activity is improved by processing, increasing ruminal efficiency
(McAllister et al., 1993a). When whole barley was compared to dry-rolled or
steam-rolled barley, improved utilization and digestibility was observed by
processing (NRC, 1996). Processing of cereal grains as described by Church
(1986) can be classified as either dry processing or wet processing. Dry
processing includes whole grain, grinding, dry rolling or cracking, popping,
extruding, micronizing, roasting and pelleting. Wet processing includes soaking,
steam rolling, steam processing and flaking, exploding, pressure cooking and
high-moisture fermentation of early harvested and reconstituted grains.
Zinn (1993b) found that steam-rolling oats increased energy values 7.6%
over dry-rolling oats. In a review paper, Owens et al. (1997) reported no
differences (P > .05) in ADG or DMI when steam-flaked barley or milo were
compared to dry-rolled. Average daily gain for corn was not different in the same
comparison, however DMI and feed:gain were greater (P < .05) for dry-rolled
corn (9.45 kg/d and 6.57) when compared to steam-rolled corn (8.35 kg/d and
5.87).
In addition to steam-rolling, Zinh (1993b) also examined flake size.
Results showed that steers fed steam-rolled thin flaked Oats had 13.2% lower (P
< .01) ADG and 11.1% higher (P < .05) feed:gain than those steers fed steam-
rolled coarse flaked oats. He also observed greater (P < .01) hot carcass
weights (310.1 vs 295.0 kg) and % KPH (2.26 vs 1.95, P < .05) for coarse flakes
when compared to thin flakes. Net energy values were negatively affected in the
trial by thin flaking. This is in agreement with other reports that over-processing
may be detrimental to animal performance.
Owens et al. (1997) stated that in general, ADG was reduced the more
grain was processed. This may be attributed to a decrease in DMI brought about
by an increase in acid production within the rumen as fermentation rate
increases. The more a grain is processed, the faster the rate of fermentation and
passage, Causing an increase in the production of acids within the ruminant
environment. This can lead to sub-clinical acidosis and a day-to-day change in
DMI.
Bradshaw et al. (1992) compared two barley varieties (Steptoe and
Klages) and found that processing method affected (P < .05) DMD, DB, and
gross energy digestibility while having no influence (P > .05) on ADF, NDF, and
CR digestibility. They tested dry-rolling, tempering and rolling, tempering plus
ammoniating and rolling, and tempering plus ammoniating and whole. Steers fed
6
dry-rolled grain had higher ADG for the growing phase as well as 15% better (P <
.05) total trial feed efficiency than those steers fed whole barley.
Pritchard and Stateler (1997) studied diet-mixing characteristics of
processed grains. They determined that processing could have a positive or
negative effect depending upon mixing conditions and other dietary ingredients.
They also addressed the possibility of associative effects when combining
differing grains, suggesting that positive performance results may be attributed to
the integrity of diet mixing.
Processing may alter how a diet is consumed, which may in turn effect
animal nutritional status and performance. Digestible energy and ME values of
the Pritchard and Stateler (1997) trial closely compared to NRC (1996) values
(3.58 and 2.91 Mcal/kg compared to 3.44 and 2.82 Mcal/kg, respectively).
Though there appears to be minimal benefits to processing oats (NRC, 1996 and
Zinn, 1993b), differences in animal performance have been observed with
processing of other cereal grains. Bradshaw et al. (1996) reported improvements
in animal performance when fed processed as compared to whole grain barley.
Average daily gain for steers fed processed grains were greater (P < .05) then
those fed whole grains, prompting the authors to suggest that processing is a
must for optimal performance. Combs and Hinman (1989) and Zinn (1993a) also
observed improvements in animal growth performance with various types of
barley processing. While examining corn hybrids, Ladely et al. (1995) found that
method of grain processing had a greater affect on animal performance than did
hybrid. Their report showed that processing method could influence animal gain
7
and feed efficiency. High-moisture grain-fed animals gained faster on less feed
than those animals fed dry-rolled grains.
Anderson and Boyles (1989) suggested that there was an advantage to
feeding grain combinations as opposed to feeding one particular grain. They fed
three diets of corn and barley reporting that the diet containing 60% barley/24%
corn had slower daily gains (1.17 kg/d) than those diets containing 35%
barley/47% corn (1.29 kg/d) or 10% barley/70% corn (1.30 kg/d). However they
did not compare any of the diets to a single grain source.
Digestive Disorders
Ruminant animals evolved consuming predominantly roughage-based
diets. The addition of processed grains as a primary food source to these
animals is a man-made decision. Conversion of a forage diet to a cereal grain,
changes microbial fermentation from plant cell walls to cereal grain starch
(McAllister and Cheng, 1996). Feeding high concentrate diets creates the
possibility of certain health disorders developing due to the rapid fermentation of
these high grain diets. With this increased digestibility and rate of passage,
incidences of acidosis and bloat also increase in feedlot animals. To properly
diagnose fatal digestive disorders, a complete necropsy is necessary including
checking ruminal pH. Miles et al. (1998) suggested that many cases should be
diagnosed as “unknown” or “undetermined”.

8
Acidosis is defined as a decrease in the alkali (base excess) in body fluids
relative to the acid (hydrogen ion) content (Owens et al, 1998). It is important to
note that there is no clear description of an acidotlc animal but rather degrees to
which an animal is acidotic. These degrees range from reducing the animals
daily feed intake to death (Stock and Britton, 1992). Diseases related to acidosis
include: sudden death syndrome, polioencephalomalacia, founder, rumenitis,
liver abscesses, malabsorption, clostridial infestations, and reduced feed intake.
The most common occurrences of acidosis occur in the initial warm-up
stages of high-concentrate diets. At this time the animal consumes a large
quantity of readily fermentable starches and other carbohydrates. These
starches are rapidly hydrolyzed to glucose creating a large presence of free
glucose in the rumen. Owens et al. (1998) suggested that this could have three
adverse effects. In a free glucose environment, Streptococcus bovis, a normally
non-competitive bacterium, may thrive producing lactic acidosis. Second,
microbes such as coliforms and amino acid decarboxylating microbes produce or
release endotoxins or amides. Finally, there is an increase in osmolality that
intensifies the accumulation of acid within the rumen by inhibiting VFA
absorption.
Actual identification of acidosis depends on a clinical measurement of
blood and ruminal pH, with chronic and acute acidosis ruminal pH values of 5.6
and 5.2 being used as marks (Owens et al., 1998). Acidosis may be broken into
acute and subacute. Included in acute acidosis is polioencephalomalacia (PEM).
Since this disease affects the brain, diagnosis is marked by blindness,
9
incoordination, and seizures (Gould, 1998). Feedlot causes of this disease may
be associated with, but not confined to, diets high in sulfates such as those
containing molasses. Animals afflicted with this disease often respond to
injections of thiamin though there may or may not be any metabolic alterations in
thiamin status (Gould, 1998). Prevention of acidosis may decrease the
occurrence of this disease (Galyean and Eng, 1998).
Many cases of acute acidosis go undetected. However due to a decrease
in ruminal pH, damage to the lining of the ruminal wall, abomasa! and intestinal
linings reduces the absorption of nutrients creating what are known in the
industry as “poor doers”. These are animals that have low average daily gains
and poor feed to gain ratios (Stock and Britton, 1992). Common conditions such
as founder, which may show up well into the feeding period or sudden death, are
often closely associated with bloat.
In a feedlot situation virtually every animal will experience some form of
subacute acidosis. A very difficult condition to detect, some signs such as
panting, excessive salivation, kicking the belly, and eating dirt may be observed
(Stock and Britton, 1992). These cases are often followed by decreases in feed
intake. Besides management techniques, another factor that may create
subacute acidosis is a change in the animals’ environmental conditions.
Extremes in temperatures, storms, or mud may all cause the animals to change
their level of feed intake.
As common as, and often associated with, acidosis in feedlot animals is
bloat. Bloat is a ruminal dysfunction that results from the accumulation of
10
excessive gas within the rumen (Cheng et al„ 1998). Under normal conditions,
gases produced by fermentation are eliminated by eructation (Duren and Miller,
1992). Causes of bloat are feeding management, individual animal physiology,
diet, and microbial factors. Bloat may be classified as either free-gas bloat or
frothy bloat. Frothy bloat accounts for 90% of all feed lot bloat cases though free-
gas bloat has the higher mortality rate (Cheng et al., 1998).
Free-gas bloat can occur when gases are prevented from escaping the
rumen by a blockage of the esophagus. Impaired rumen motility, as caused by
acidosis, may also result in this form of bloat (Cheng et al., 1998). Much like
acidosis, feed lot bloat occurs most commonly as animals are being adapted to
high-concentrate diets. Similar to acidosis, the bacteria Streptococcus bovis is
commonly associated with bloat. With high availability of glucose (high energy)
in the rumen, these bacteria can produce an increased rate of rumen fluid
viscosity (slime). This high viscosity is associated with frothy bloat (Cheng et al.,
1998; Russell, 1998).
Sudden death in feedlot cattle is a loosely used term. Often this term is
used to cover a number of undiscovered factors that attributed to the death of an
animal. Most often the term is used in cases where an animal, usually near
market weight, dies unexpectedly and usually at night (Clock and DeGroot,
1998). These animals rarely exhibit any form of illness or discomfort and lack a
clear cause of death. In a review on the subject, Clock and DeGroot (1998)
reported that the most common causes of sudden death were acidosis and bloat.

11
Nagaraja and Chengappa (1998) found that liver abscesses, commonly
occurred in animals on an aggressive high-concentrate feeding program. They
reported finding that most feed lots had from 12 to 32% of their animals affected
by liver abscesses. Incidences and severity was attributed to amount of
roughage in the diet. The less roughage in the diet the greater the level of
abscesses. Addition of tylosin (fed at a rate of 90 mgoanimar1°d"1) to the ration
can reduce the incidence of liver abscesses from 40 to 70%. The addition of
tylosin was also reported to increase average daily gains 2.1% and feed to gain
ratios by 2.6%.
More important for the producer is the economic impact that these
disorders have on production. The focus then becomes prevention. As
discussed earlier, cereal grains differ in their rates of digestion. A list of grains
from rapid to slower rates of fermentation are wheat, barley, sorghum, and corn.
Differences in ruminal digestion of starch may be attributed to the protein matrix
surrounding it within the endosperm of the various grains (McAllister et al.,
1993a). An increased rate of fermentation also results from grain processing.
Understanding the causative factors will help reduce the occurrence of many of
these feeding disorders. Control of these disorders starts with proper bunk
management. Proper formulation of rations, thorough ration mixing, and
consistent feeding time all will help in reducing these diseases. It is accepted that
increasing the amount of roughage within the diet will reduce incidences of both
acidosis and bloat. In addition to increasing roughage amounts, including
bicarbonate buffers and ionophores to high-concentrate diets has been shown to

reduce acidosis and bloat. Monensin was reported by Owens et al. (1998) to
reduce variations in daily feed intakes by controlling certain lactate-producing
bacteria. Both these factors would positively influence these digestive disorders.
Starch Structure and Function
Starch is the storage form of polysaccharides in plant cells (Lehninger et
al., 1993) and the major component of non-structural carbohydrates in ruminant
diets. Polyaccharides, or glycans, are carbohydrates that upon oxidation provide
the central-energy-yielding pathway in most non-photosynthetic cells. Volatile
fatty acids are the product of fermentation of non-structural carbohydrates within
the rumen or large intestine. Starches may also be digested and absorbed as
glucose in the small intestine (Allen and Knowlton, 1995). There are two types of
glucose polymers (semi-crystalline structures) within starch. AmylOse1 which is
unbranched, and amylopectin, which is highly branched. These polymers are
primarily connected by a 1 - 4 linkages. At the branch points are a 1 - 6 linkages.
In animal cells the storage form of polysaccharides is glycogen which contains
both forms of linkages (Kotarski et al, 1992). Research has focused oh energy
content and availability within cereal grains and howto maximize its utilization.
Protected by the pericarp of the cereal grain is the starch-containing
endosperm. Within this endosperm is a protein matrix that may determine
ruminal bacterial access to starch granules (McAllister et al., 1993a). McAllister
et al., (1993a) examined the protein matrix of corn and barley starch and found
13
that, when isolated, these starches were digested equally in the rumen. They
concluded that starch granule structure was not the cause of differences in
ruminal digestion between the two grains. They identified structural components
of the endosperm’s protein matrix in corn and structural carbohydrates in barley
as the limiting factors. Their result demonstrated that barley protein matrix is
more readily digested by ruminal microbes than its corn counterpart. This does
not mean that the protein matrix of barley is readily digestible. Allen and
Knowlton (1995) reported that disrupting the matrix allows increased access to
starch granules by microbial enzymes, and may be the major factor affecting
ruminal starch digestion. Bowman et al. (1996) suggested that specific proteins
within the barley endosperm may control the ability of ruminal microorganisms to
digest this cereal grain. McAllister et al. (1993b) presented data that rumen fungi
are proteolytic and effective in breaking down the protein matrix of wheat and
barley.
Studying endosperm structure and starch in waxy, normal and high
amylose barleys, Oscarsson et al. (1997) reported that different types of starch
granules could be found in different parts of the endosperm. They reported that
in Glacier barley (a high amylose variety) starch granules were more even in size
and tightly packed in the subaleurone layer. Starch granules were larger in size
in Golf barley (a normal variety) which demonstrated bimodal distribution.
Wester et al. (1992) stated that most starch is not as susceptible to enzymatic
degradation as the primary component of waxy starches, amylopectin. Within
the floury endosperm, located beneath the protective protein matrix layers, are

starch granules that are most susceptible to digestion or grain processing
(Huntington, 1997; McAllister and Cheng, 1996). Lorenz (1995) suggested that
amylose reinforced starch granule structure became more resistant to enzymatic
activity. With barley varieties being reported as having differences in chemical
composition and nutritive values (Kemalyan et al., 1989), it is interesting to note
that Oscarsson et al. (1997) found no differences in cell-wall thickness, cell size,
or starch granule characteristics between the different barleys studied due to
growing location.
Brown (1996) proposed three categories of cereal grain starch digestion;
1)Rapidly digested starch, Such as in those cases where the grain has been
processed in some way; 2) Slowly digested starch, from unprocessed grain
sources; 3) Starches that are resistant to digestion. Resistant starch granules
are present in processed and unprocessed grains and are trapped within the
protein matrix of the grain. When the hydrogen bonds that make up the matrix
are broken, such as occurs with gelatinizatioh, the starch then becomes available
for fermentation. It has been shown that with extensive processing techniques
gelatinization of starches does occur (Theurer, 1986). In order for the animal to
better utilize grain starch, the endosperm needs to be damaged in some way.
Increasing the surface area of a grain by processing increases both the rate of
fermentation and ruminal digestion of starch. With increased digestion rates, rate
of passage also increases. Theurer (1986) showed that steam-flaked sorghum
had approximately a three fold greater rate of ruminal starch digestion than
ground sorghum.
15
Leloup et al. (1992) reported that both granular disorganization and
increased porosity of the grain, once gelatinized, greatly increased digestibility.
They reported that amylose and amylopectin react differently due to porosity,
chain length, chain orientation, accessibility of chain extremities, and
temperature. They concluded that physico-chemical properties of starch control
the rate and extent of enzymatic hydrolysis and its digestibility.
In an effort to understand feed quality characteristics of differing barley
varieties, research has focused on the genetic factors that influence cereal
grains. Bowman et al. (1996), in cooperation with the North American Barley
Genome Mapping Project, reported substantial differences among barley
genotypes for starch, crude protein, digestibility and particle size. They found
that chromosome 4 contained the primary region (quantitative trait loci) that was
responsible for digestibility of ground barley. Also found in this region of
chromosome 4 were quantitative trait loci for ADF content and crude protein.
There was a correlation between grain characteristics that are located in the
same loci and endosperm degradation during germination and within the rumen.
Ruminant Starch Utilization
Cereal grains have differing amounts of starch content. Barley and oats
are lowest at 58% starch, followed by sorghum and corn (72%), and finally wheat
at 77% on a DM basis (Huntington, 1997). In addition, ruminant utilization of
starch from these grain sources also differs.
16
Ruminal digestion of starch can be extensive and varies depending upon
the grain and processing technique used. Huntington (1997) found that steam
processing increased starch digestibility of sorghum by 26%, corn by 10%, and
6% or less for other grains, over dry-rolling. In a review, Allen and Knowlton
(1995) reported that steam-flaking sorghum, corn or barley consistently
increased ruminal starch digestion when compared to dry-rolling of these
respective grains. Theurer et al. (1999) examined the effect of grain processing
method and degree of processing on site and extent of DM, starch, and N
digestion. Comparing steam-flaking and dry-rolling Sorghum, they found that
starch flow to the duodenum was greater for dry-rolled sorghum (1322 vs 665
g/d). Ruminal and total tract digestibility, as a percent of intake, were both lower
(P = .01) for steers fed dry-rolled as compared to steam-flaked sorghum. This
resulted in lower small (P = .01) and large (P = .05) intestine starch digestibility
for dry-rolling compared to steam-flaking. These results reaffirm the findings on
lower tract starch digestibility reported by Theurer (1986). Reduction of flake
density in the trial increased (P = .01) overall percentage of starch digested by
the steers. Owens et al. (1986) reported that large granule starch reaching the
duodenum is poorly digested by both the small and large intestine.
Up to 90% of oat, barley or wheat starch can be fermented within the
rumen (0rskov, 1986). With corn, as much as 40% of the starch can escape
ruminal fermentation and be presented to the small intestine for further digestion.
This slow rate of ruminal starch digestion can be attributed to the protein matrix
resistance to invasion. This is not the case with barley or wheat grain, where the

17
protein matrix is readily attacked by proteolytic bacteria (McAllister and Cheng,
1996). Spicer et al. (1982) suggested that total tract starch digestibility was
related to the amount of starch fermented in the rumen. However, increased rate
of ruminal starch digestion does not always positively relate to improved animal
performance (Wester et al., 1992)
Within the rumen is a biomass containing bacteria, protozoa, fungi and
various enzymes. This microflora competes for colonialization of the substrates
presented to the rumen. High concentrate diets increase rate of fermentation
and subsequently effect ruminal pH and the microbial population. Levels of
these microbes vary depending on rumen environmental conditions.
Accounting for up to 8% of the total ruminal biomas, fungi are adapted to
breaking down structural carbohydrates (McAllister and Cheng, 1996). While
studying three fungi strains (Orpinomyces joyonii, Neocallimastix patriciarum,
and Piromyces communis), McAllister et al. (1993a) noted that all strains were
proteolytic. This allows the fungi the ability to breakdown the protein matrix and
digest starch granules. Due to slow growth, they are limited in their ability to
compete with ruminal bacteria for starch. Ruminal fungi have been reported to
exist in equal numbers whether the diet is high in forage or concentrate
(McAllister and Cheng, 1996). They have also been reported by the authors to
be the only microorganisms capable of breaking down the protein matrix of corn.
The damage fungi cause to cereal grains may allow bacterial attachment
(McAllister et al., 1994).
18
Protozoa are estimated to make up 20 to 45% of the amylolytic activity in
the rumen (McAllister and Cheng, 1996), with a starch ingestion rate inversely
correlated with starch granule size. The rumen environment also controls
populations of protozoa. Numbers will increase as concentrates are added, but
decrease when the diet is 80% concentrate or greater. Lowered ruminal pH is
thought to hinder protozoan populations (Kotarski et al., 1992). One of the
benefits of protozoa is their ability to reduce starch degradation rate and to
moderate ruminal pH after feeding by predation of amylolytic bacteria. Protozoa
are capable of storing large amounts of starch and metabolizing it at a slow rate.
This limits lactic acid production and the resulting lower pH level due to rapid
starch fermentation (Kotarski et al., 1992; Noziere and Michalet-Doreau, 1997).
Protozoa, however, are not essential to starch digestion.
Streptococcus bovis and Ruminobacter amylophilus are the primary
amylolytic bacterial species within the rumen (Noziere and Michalet-Doreau,
1997). A number of other amylolytic species have also been identified including:
Bacteroides sp., Bifidobacteruim pseudolongum, thermophilum and adolescentis,
Borrelia sp., Butyrivibrio sp., Eubactefuim ruminantium, Ruminobacter
amylophilus, Ruminococcus bromii, Succinimonas amylolytica and Lactobacillus
sp.. These bacteria secrete amylase or produce surface-associated amylases in
order to hydrolyze starch. They are not capable of ingesting the granules like
protozoa (Kotarski et al., 1992), but are responsible for the majority of ruminal
starch fermentation (Huntington, 1997). Ruminal carbohydrate-fermenting
bacteria produce volatile fatty acids (VFA’s), mainly acetate and propionate.
19
When a grain, whole or processed, becomes part of the rumen substrate, it is
colonized by site-specific bacteria (McAllister et al., 1990; Kotarski et al., 1992).
As digestion continues, these bacterial colonies work together to become larger.
Many different bacteria may colonize starch of cereal grains other than corn.
However, for corn coccoid bacteria are the predominant colonizers.
Research has shown that amylase activity increases after feeding cereal
grains such as barley (Noziere and Michalet-Doreau, 1997). Activity levels for
barley were reported to be higher than that of corn. The authors also showed
that maximum amylase production from amylolytic bacteria was dependent upon
amount of starch available. This was digestible starch available and not total
starch. When an excess of carbohydrates are available, as occurs from feeding
high concentrate diets, the glucose is converted to lactate (Russell, 1998).
Fifteen to twenty percent of glucose production by the liver is from lactate
(Nocek, 1990).
0rskov (1986) and Theurer (1986) suggested that increased ruminal
starch digestion would improve efficiency of gain. Owens et al. (1986) and
Nocek (1990), conversely, stated that starch digested in the small intestine of
growing ruminants increased energetic efficiency. This is due to ruminal losses
in heat and methane production during fermentation (0rskov, 1986). Owens et
al. (1986) also reported that ruminally digested starch of corn and sorghum grain
was utilized 42% more efficiently in the small intestine than if digested in the
rumen. This is to say that energy absorption by the small intestine is more
efficient that fermentation in the rumen. Of total starch intake, 5 to 20% is
20
digested postruminally, most in the small intestine (Huntington, 1997). In the
Allen and Knowlton (1995) review, it was reported that with processed grains,
starch digestion in the small intestine was from 47 to 88% and in the large
intestine 33 to 66% of total starch presented to these respective organs. Grain
processing not only increases ruminal starch digestion, but also lower tract and
therefore total tract starch digestion. Owens et al (1986) concluded that intestinal
starch digestion is limited only by the amount of starch escaping ruminal
fermentation. The efficiency of starch digestion, however, decreases as more
starch enters the lower tract.

21
CHAPTER 3
FEEDLOT PERFORMANCE AND CARCASS CHARACTERISTICS OF BEEF
STEERS FED CORN OR BARLEY
Introduction
Barley has long been the grain of choice for finishing rations in the
Northern Great Plains and Pacific Northwest region, since it is well adapted to
the growing conditions of the region. Area farmers currently grow many different
barley varieties of both malting and feed grades. Recent research has
demonstrated that animal performance varies depending on variety of barley fed
(Milner et al., 1995; Boss and Bowman, 1996a; Ovenell-Roy et al., 1998a).
Variations in carcass characteristics have also been observed when different
barley varieties were fed (Boss and Bowman, 1996a; Ovenell-Roy et al., 1998a).
Boss and Bowman (1996a) reported steers fed Gunhilde barley had lower
ADG and DM intake compared with steers fed Harrington barley. In addition,
Gunhilde had 30% slower ruminal starch digestion rate than Harrington (Boss
and Bowman, 1996b). Tyrrell and Moe (1974) reported slow ruminal starch
digestion to be desirable in a feed grain. Their study was designed to determine
the effects of barley variety and corn on animal performance, and to determine if
associative effects resulted from feeding a malting barley variety in combination
with a feed grade barley.
Materials and Methods
Eighty crossbred Hereford/Angus, steers (average wt 420 kg) were used to
evaluate animal performance and carcass characteristics when fed high
concentrate diets of barley or corn. Steers were contemporaries selected from
three Montana Agricultural Experiment Station beef herds. These stations were:
Red Bluff Research Station (Norris, MT) supplying 34 steers; Livestock Teaching
and Research Center (Bozeman, MT) 30 steers; and Bandy Research Ranch
(Ovando, MT) with 16 steers.
Calves from Red Bluff Station and Livestock Center were vaccinated
August 31, 1994 with a clostridial 8-way and Triangle 4+ Haemaphilus somnus.
Calves were then weaned October 19. All calves (steers and heifers) were
penned together at the Livestock Teaching and Research Center. Calves were
group fed grass hay on October 20. October 21 they were given 2.3 kg/h barley,
3.7 kg/h on October 22, and 4.5 kg/h on October 23. This final ration was fed up
to November 1. Corn (of an unknown variety) for the finishing trial was received
on October 28 with a bushel weight of 55 Ibs/bu. On November 1, all calves
were placed on a ration of 50% chopped hay and 50% barley. Heifer and steer
calves were separated on November 19. Steers from Bandy Research Ranch
arrived at the Livestock Center November 2, 1994. These animals were kept
separate from the main group of calves until November 19 when they mixed with
the other steers.

23
Steer calves were implanted with Synovex S, wormed with Ivomectin and
fed a starter ration (40/60 barley to chopped grass hay) as a group beginning
January 10, 1995. This ration was stepped up 10% . every six days to a final
ration not exceeding 80% barley in the total diet. The 80% barley ration was fed
up to the beginning of the finishing trial oh April 6. Intakes on an as-fed basis on
February 7 were 7.7 kg/h/d. On February 21 the intakes were 8.3 kg/h/d. Steers
were weighed February 24, at which time steers for the Gibson/Bowman calan
gate trial were selected and removed from the main group of steers. Steers to be
cannulated were also removed from the group at this time. Three steers from
Red Bluff and one steer from Livestock Center (no implants) were used in the
corresponding 4 X 4 trials.
Steers were assigned by weight to one of 16 pens in a randomized
complete block design, with 4 pens per treatment. The four treatments were 1)
corn; 2) Gunhilde, a six-row European feed grade barley (GUN); 3) Harrington, a
two-row malting barley (HAR); and 4) 50% GunhiIde/50% Harrington (MIX).
Gunhilde represented a slow rate of ruminal starch digestion, with Harrington
having a fast rate of ruminal starch digestion (Boss and Bowman, 1996b). Diets
were balanced to be isonitrogenous (13.5% CP), isocaloric (1.93 Mcal/kg NEm,
1.28 Mcal/kg NEg), and to contain 83% grain on a dry matter basis.

24
Table 1. Composition (%DM basis) of finishing diets containing corn, Gunhilde barley (GUN), Harrington barley (HAR), and 50% Gunhilde + 50% Harrington (MIX) as basal grains.
Item Corn GUN HAR MIXIngredients, % o f DM
Corn 82.00 —
Gunhilde barley 83.00 41.50Harrington barley 83.00 41.50Oatlage 6.00 6.00 6.00 6.00Molasses 4.00 5.00 5.00 5.00Soybean Meal 3.54 1.69 1.31 2.24Urea 1.25 .30 .83 .42Sodium bicarbonate 1.30 1.30 1.30 1.30Calcium bicarbonate .57 1.38 1.25 .72Sodium chloride .50 .50 .50 .50Potassium chloride .50 .50 .50 .50TM prem ix3 .25 .25 .25 .25Vit. A, D, E prem ixb .05 .05 .05 .05Rumensin 80c .024 .024 .024 .024Tylan 40° .013 .013 .013 .013
Chemical com positionDM % 87.64 91.02 91.24 90.95OM, % o f DM 94.17 92.53 93.99 92.83CP, % o f DM 13.46 14.36 15.07 14.36Starch, % o f DM 48.47 37.00 41.85 40.43ADF, % o f DM 6.38 8.80 8.03 8.94AIA, % o f DM .4914 .6980 .8178 1.0435
aContains 20.0% Mg, 6.0% Zn, 4.0% Mn, 5.0% Fe, 2.7% S1 1.5% Cu, .11% I, .01% Se, and .01% Co.
bContains 30,000 lU/g vitamin A, 6,000 lU/g vitamin D, and 7.5 lU/g vitamin E. cRumensin 80 contained 132 g/kg of monensin. Tylan 40 contained 88 g/kg
tylosin
Barley with similar bushel weights were used (average .62 kg/L or 49.5
Ibs/bu) to remove any differences in performance that might be attributed to
bushel weight. All grains were coarsely cracked through a Denver, Inc. hammer
mill prior to mixing. Molasses and oatlage were added to each respective ration
to reduce dust and attempt to equalize payability of the four diets. Steers were
fed once daily between 0730 and 0900. Each diet supplied 360 mg monensin
and 90 mg tylosin per d. Diet composition is presented in Table 1.
An adaptation period of 28 d was used to adjust steers to their respective
high concentrate diets. Initial (April 4 & 5, 1995) and final (July 9 & 10, 1995)
weights were obtained on consecutive days and averaged, with steers weighed
before feeding to remove differences that might occur due to individual fill.
These average weights represented on and off trial weights for steers. Over the
96 d trial animals were weighed every 28 d. Weigh days were May 3, and 31,
and June 28,1995.
Feed grab samples were collected throughout the trial, composited by diet
and analyzed for DM, OM, CP, (AOAC, 1997), AIA (Van Keulen and Young,
1977), ADF (Van Soest et al., 1991), and starch (Megazyme, Sidney, Australia).
Feed samples were collected on April 17 and 25, May 9 and 23, and June 2, 13,
and 20. Grab samples of the supplement were taken May 2, June 2, and June
20. Acid insoluble ash was used as ah internal marker to estimate fecal output.
Fecal grab samples were taken from each steer during the 56 d weighing and
composited by pen. Analysis for DM, OM, CP, AIA, ADF, and starch were
performed. Fecal samples were taken on the last days of the trial, July 9 and 10
and composited by pen. Analysis of samples was performed to determine in vivo
nutrient digestibilities.
Steers were slaughtered (E. A. Miller, Hyrum, Utah) when it was visually
estimated that 80% would grade Choice. Steers were shipped from the
Livestock Center on two consecutive days. Forty head were shipped July 11 and
slaughtered July 12, with carcass data collected July 13. The second shipment
of 40 head left July 12, was slaughtered July 13, with carcass data collected July
26
14. After a 24 h chill, backfat thickness, and ribeye area were measured.
Percentage kidney, heart, and pelvic fat, marbling score, and yield and quality
grades were assigned by a USDA grader.
Data were analyzed using the GLM procedure of SAS (1993) with pen as
the experimental unit. Performance and carcass data were analyzed in a
randomized complete block design. The blocks were the north and south sides
of the feed lot. Hot carcass weight was used as a covariate for carcass
characteristics. Planned comparisons were made for: corn vs barley, GUN vs
HAR, and MIX vs GUN and HAR. Treatment least square means were
separated by the LSD method of SAS (1993) if treatment F-test was significant
(P < .10). Least square means and associated standard errors are reported.
Results and Discussion
Corn-fed steers gained 7% faster (P = .06) than barley-fed steers (1.63 vs
1.52 kg/d; Table 2). These results agree with Boss and Bowman (1996a) who
reported corn-fed steers gained 10% faster (P < .01) than steers fed HAR (1.43
vs 1.30 kg/d). They also reported that HAR fed steers gained 8% faster (P =
.002) and were 22 kg heavier than those steers fed GUN or MED at the
conclusion of the study. Milner et al. (1995) reported no differences (P > .10) in
ADG between steers fed finishing diets of corn or barley. This trial observed
corn-fed steers having a 12% greater DM intake than the barley varieties
examined. No differences between diets (P > .10) in feed:gain occurred.

27
Boss and Bowman (1996a) found steers fed corn were 23 kg heavier (P =
.001) than steers fed barley, In this trial, corn fed steers weighed 10.6 kg more
than barley fed steers (P = .06) in final weights. Ovenell-Roy et al. (1998a and
1998b), in similar feed trials comparing six barley varieties, found few differences
in ADG between varieties. Average daily gain over the length of their trial was
improved in the second year, with feed:gain remaining about the same (6.6 and
6.4 respectively). Boss and Bowman (1996a) also reported no difference (P >
.10) between GUN and HAR in feed:gain. In our trial We found no differences (P
> .10) in ADG or feed:gain when comparing GUN- and HAR-fed steers. Looking
at the Boss and Bowman (1996a) results, our steers consuming HAR and GUN
gained .22 and .30 kg/d more and had better feed:gain ( 15.8 vs 14.01 and 15.4
vs 13.70) when comparing the two trials.
Bradshaw et al. (1996) found that animal performance of steers fed a
malting and a feed grade barley resulted in no differences in ADG until they
altered processing technique. By feeding barley cuItivars with similar bushel
weights and processing the grains in the same manner, possible variations in
animal performance brought about by these factors appear to have been
controlled on our trial. Unlike Ovenell-Roy et al. (1998a), Boss and Bowman
(1996a), and Milner et al. (1995), who reported differences in feedlot
performance between animals fed diets based on different barley cuItivars, our
trial found no differences (P > .10).
Intake of DM and starch was greater (P = .0002) by corn-fed than by
barley-fed steers. Starch intake by HAR-fed steers was also greater (P = .0006)
28
than that of GUN-fed steers. Feed conversions (feed:gain) was not different (P >
.05) for barley compared to corn. This does not agree with the Boss and
Bowman (1996a) study where barley-fed steers had more desirable (P = .03)
gain deed than corn fed steers (average 16,0 vs 14.3). No other differences (P >
.10) in animal performance were observed between GUN vs HAR or MIX vs GUN
and HAR. Feed cost for corn ($. 14/kg) and barley ($.13/kg) were up $.02 to
$.03/kg compared to the Boss and Bowman (1996a) trial. Feed cost per day (P =
.001) and gain cost (P = .002) for barley-fed steers were lower (average $ 1.47/d
and $.97/kg, respectively) than for Corn-fed steers ($ 1.82/d and $1.12/kg). There
were no differences (P > .10) observed in feed cost or gain cost between GUN vs
HAR or MIX vs GUN/HAR. The lower cost of the barley diets and high
availability in the Pacific Northwest makes them an attractive basal grain
compared to corn.

29
Table 2. Performance by steers consuming finishing diets containing corn, Gunhilde barley (GUN), Harrington barley (HAR)1 or 50% Gunhilde + 50% Harrington barley (MIX) as basal grains.__________________________
Item C om G U N H A R M IX SE com vs barley3
PG U N vs H A R b
G U N /H A R vs M IX c
No. o f steers In itia l wt, kg
20419.0
20419.2
20418.7
20419.5 1.77 .96 .82 .80
Final wt, kg 575.1 561.1 564.6 567.8 8.77 .06 .59 .36A D G , kg 1.63 1.48 1.52 1.55 .041 .06 .49 .35Nutrient intake, kg/d
D M 13.01 11.12 11.32 11.65 .208 .0002 .48 .14Starch 6.31 4.12 4.74 4.71 .086 .0001 .0006 .03
FE, gain/100 kg fed 12.52 13.30 13.41 13.32 .335 .07 .93 .81D iet, M cal/kg
N E m 1.90 1.98 2.00 1.98 .039 .09 .59 .76N E 6 1.25 1.32 1.35 1.32 .035 .09 .59 .76
Feed cost, $/kg .14 .13 .13 .13 — — — — ————
Feed cost, $/d 1.82 1.44 1.47 1.50 .027 .0001 .56 .25Gain cost, $/kg 1.12 .98 .97 .97 .027 .002 .80 .83^Comparison of corn vs barley.^Comparison of Gunhilde and Harrington barley. ^Comparison of Gunhilde and Harrington barley vs MIX.
Dry matter and starch digestibility, and digestible DM intake were greater
(P = .001) for steers fed barley diets than for steers fed corn (Table 3). No
differences (P > .10) in digestible starch intake were seen due to diet. Boss and
Bowman (1996a) and Milner et al. (1995) reported that corn-fed steers had
greater (P > .01) digestible DM intakes than did those steers fed barley. Boss
and Bowman (1996a) also found corn-fed steers had greater (P = .001) digestible
starch intake than HAR fed steers. We observed similar results as reported
earlier. We also found digestible starch intake was greater (P = .01) for HAR
when compared to GUN. This is in agreement with Boss and Bowman (1996a)
who also reported HAR with greater (P < .10) digestible starch intake than GUN.
Harrington had lower (P = .01) DMD than GUN on our trial.

30
Zinn (1993a and 1993b) showed that steam processing of grains
maintained a more stable ruminal pH than more destructive processing
techniques. Ovenell-Roy et al. (1998a and 1998b) used steam processing on
their respective trials and reported ADG1 intakes, and ruminal pH values similar
to those seen on this trial. Grains on this trial were dry rolled prior to feeding,
one of the more destructive of the processing techniques.
Estimated grain NEm and NEg were higher (P < .01) for barley than for
corn. These values are in agreement with Boss and Bowman (1996a), which
also reported higher NEm and NEg values for barley over corn. No differences (P
> .10) were seen in diet digestibility, or estimated grain energy value between
barley varieties. No differences (P > .10) in in vivo digestion were seen when
MIX was compared to GUN and HAR.
Table 3. In vivo digestion of finishing diets containing corn, Gunhilde barley (GUN), Harrington barley (HAR), or 50% Gunhilde + 50% Harrington
_____ barley (MIX) as basal grains._____________________________
Item Com G U N H A R M IX SE com vs barley3
PG U N vs
H A R bG U N /H A R
vs M IX cFecal output, kg/d
D M 4.65 1.80 2.90 3.09 .286 .0004 .02 .07Starch 874.9 36.0 160.8 89.7 69.62 .0001 .21 .92
In vivo digestibility, %D M 64.05 83.80 74.41 73.41 2.284 .001 .01 .08Starch 86.02 99.13 96.62 98.07 1.194 .0001 .15 .90
Digestible intake, kg/dD M 8.36 9.32 8.43 8.56 .318 .32 .06 .45Starch 5.43 4.08 4.58 4.62 .115 .0001 .01 .08
Grain N E m, M cal/kg 2.05 2.14 2.19 2.13 .046 .09 .49 .54Grain N E g, M cal/kg 1.39 1.47 1.51 1.46 .040 .09 .49 .53
^Comparison of corn vs barley.^Comparison of Gunhilde and Harrington barley. ^Comparison of Gunhilde and Harrington barley vs MIX.

31
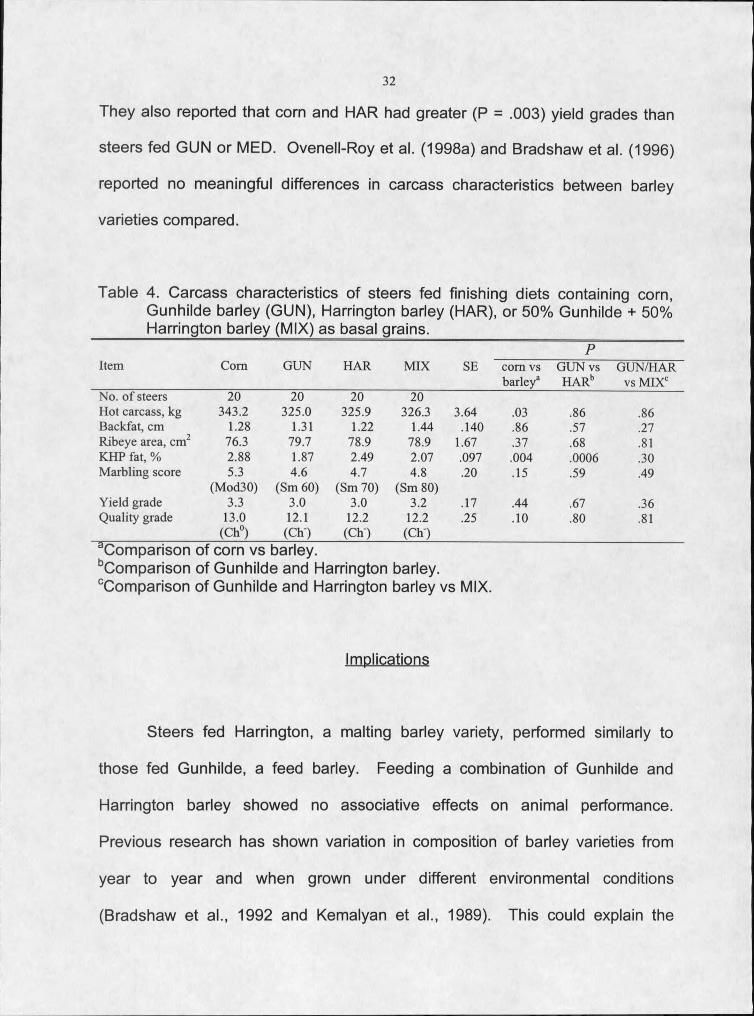
Hot carcass weight was 17.5 kg heavier (P = .03) for corn-fed steers than
for steers fed barley (Table 4), This agrees with Boss and Bowman (1996a) and
Milner et al. (1995) whose corn-fed Steer hot carcass weights were heavier (16.0
kg on both trials) than those fed barley. Boss and Bowman (1996a) also
reported that HAR-fed steers had hot carcass weights 12.4 kg heavier than those
steers fed GUN or Medallion barley. On this trial we observed no difference (P >
.10) in hot carcass weight when HAR was compared to GUN or when MIX was
compared to GUN and HAR.
Carcasses from corn-fed steers had greater (P = .004) %KPH compared
to barley-fed steers, although there were no differences between MIX and GUN
or HAR. Carcasses from steers fed HAR had greater (P = .0006) %KPH than
steers fed GUN. No effect (P > .10) of diet was seen on backfat thickness, ribeye
area, marbling score, yield grade, or quality grade. These results are in
agreement with Ovenell-Roy et al. (1998a), Bradshaw et al. (1992), and Milner et
al. (1995) who reported that no differences (P > .10) in marbling Score, yield
grade, or quality grade occurred due to barley variety. However, Milner et al.
(1995) did find that steers fed Steptoe barley had greater (P > .05) ribeye area
than those steers fed either HAR or Morex barley. Ovenell-Roy et al. (1998a)
also reported differences (P < .05) in steer hot carcass weight, backfat, ribeye
area, and %KPH when comparing six barley varieties. Further, Boss and
Bowman (1996a) found that HAR fed steers had greater (P = .06) marbling
scores and carcass quality grades than steers fed GUN, Medallion, or corn.
32
They also reported that corn and HAR had greater (P = .003) yield grades than
steers fed GUN or MED. Ovenell-Roy et al. (1998a) and Bradshaw et al. (1996)
reported no meaningful differences in carcass characteristics between barley
varieties compared.
Table 4. Carcass characteristics of steers fed finishing diets containing corn, Gunhilde barley (GUN), Harrington barley (HAR), or 50% Gunhilde + 50%
_____ Harrington barley (MIX) as basal grains._______
Item C om G U N H A R M IX SE com vs barley3
PG U N vs H A R b
G U N /H A R vs M IX c
N o. o f steers 20 20 20 20H ot carcass, kg 343.2 325.0 325.9 326.3 3.64 .03 .86 .86Backfat, cm 1.28 1.31 1.22 1.44 .140 .86 .57 .27Ribeye area, cm2 76.3 79.7 78.9 78.9 1.67 .37 .68 .81K H P fat, % 2.88 1.87 2.49 2.07 .097 .004 .0006 .30M arbling score 5.3
(M od 30)4.6
(Sm 60)4.7
(Sm 70)4.8
(Sm 80).20 .15 .59 .49
Y ie ld grade 3.3 3.0 3.0 3.2 .17 .44 .67 .36Quality grade
_•
13.0(C h0)
12.1(C h )
12.2(C h )
12.2(C h )
.25 .10 .80 .81
^Comparison of corn vs barley.^Comparison of Gunhilde and Harrington barley. ^Comparison of Gunhilde and Harrington barley vs MIX.
Implications
Steers fed Harrington, a malting barley variety, performed similarly to
those fed Gunhilde, a feed barley. Feeding a combination of Gunhilde and
Harrington barley showed no associative effects on animal performance.
Previous research has shown variation in composition of barley varieties from
year to year and when grown under different environmental conditions
(Bradshaw et al., 1992 and Kemalyan et al., 1989). This could explain the

33
differences reported in animal performance between barley varieties by Boss and
Bowman (1996a and b) and Our trial. Ovenell-Roy et al. (1998a) alluded in their
discussion that a year-to-year variation between the barley varieties fed could
have accounted for differences in animal performance.
Lack of differences in carcass characteristics on this trial could be
attributed to number of days on feed rather than basal grain variety.
Identification of factors causing differences in feed values of the different barley
cultivars could lead to the development of varieties having consistent animal
performance.
34
CHAPTER 4
RUMINAL DIGESTION BY STEERS FED HIGH CONCENTRATE DIETS
CONTAINING CORN OR BARLEY
Introduction
Suited to the semi-arid growing conditions of the Great Northern Plains
and Pacific Northwest region, barley is a major cash crop for the region. Wide
availability has allowed area livestock producers to utilize barley in many aspects
of their feeding programs. However, with a number of varieties On the market
less is known about the feeding quality of individual cuItivars than about malting
quality. Classification of these cultivars, whether of a feeding or malting type, is
typically based on malting characteristics rather than actual feeding value
(Gibson et al., 1994).
Characterized by a fast rate of ruminal fermentation, barley varieties have
demonstrated a wide range of performance differences in feeding as well as
metabolism trials. Boss and Bowman (1996a) reported steers fed Harrington had
higher ADG and DM intakes when compared to steers fed Gunhilde. These
differences may be attributed to rate and /or site of starch utilization by the
ruminant animal. Surber and Bowman (1998) and 0rskov (1986) reported that
more starch from corn escapes ruminal digestion than barley starch. Slow
ruminal starch digestion has been reported to be desirable for animal
35
performance (Tyrrell and Moe, 1974). Our objectives were to evaluate ruminal
digestion characteristics of corn and barley concentrate diets, and to determine if
associative effects resulted from feeding a malting barley variety in combination
with a feed barley.
Materials and Methods
Four ruminally and duodenally cannulated steers (Hereford/Angus
average wt 635 kg) were used in a 4 X 4 Latin square design to evaluate site,
rate, and extent of digestion of corn and barley high concentrate diets. Diets
compared were: 1) corn, used as a control; 2) Gunhilde, a six-row European feed
grade barley (GUN); 3) Harrington, a two-row malting barley (HAR); or 4) 50%
Gunhilde/50% Harrington (MIX). Steers were housed in individual concrete
floored pens (15 m2). Diets were balanced to be isonitrogenous (13.5% CP) and
isocaloric (1.93 Mcal/kg NEm, 1.28 Mcal/kg NEg). Diet compositions are
presented in Table 1 and are identical to those used in the feed lot trial. Diets
were hand mixed and limit fed at 10.9 kg/d, with half fed at 0800, and the other
half fed at 1800. Water was available free choice throughout the metabolism trial.
Pens were cleaned and bedded with straw at the beginning of each period.
Grains were coarsely cracked through a Denver, Inc. hammer mill during
the feedlot trial and stored in nylon grain storage sacks until the start of the
metabolism trial. Oatlage for the metabolism trial was obtained from the same

36
bag used for the feedlot trial. During the metabolism trial, oatlage was stored in
tight sealing [50 gal] Rubbermaid trashcans and used as needed.
Cannulated steers used in the experiment were contemporaries to those
used in the feedlot trial. These steers were fitted with permanent ruminal and T-
type duodenal cannulas (trial protocol approved by Montana State University
Animal Care and Use Committee). Montana State University Research Staff and
graduate students performed ruminal cannulations. Dr. Bruce Sorenson,
attending veterinarian, performed duodenal cannulations. Surgeries were
performed at Livestock Teaching and Research Center in Bozeman, MT in the
Spring of 1995.
Each trial period consisted of 21 d. Fourteen days for diet adaptation
followed by a 7-d collection period. Diet changes between periods were done
using a step-wise substitution of 25% Of the new ration to the total as-fed diet per
day over the first 4 d. Feed grab samples were taken at each feeding during the
collection period, composited, and ground through a 1-mm screen in a Wiley mill
for analyzed of DM, CM, N, starch (AOAC, 1997), and ADF (Van Soest et
al.,1991).
On day seven of the adaptation period, sustained release boluses (Captec
Chrome, Nufarm, Aukland, New Zealand) were, placed in the rumen of each
steer. This administered chromium sesquioxide as an external marker to
estimate DM flow to the duodenum and fecal output. A release rate of 1.0198
g/d Cr was calculated by multiplying the percent of Cr in chromium sesquioxide
(.6842) by the mean release rate supplied by the manufacturer (1.49 g/d). Steers

37
were pulse dosed 300 g of their respective grains which had been labeled with
Yb (Poore et al., 1991) into the rumen at the first feeding of the collection period
(time 0 h) as a digestion kinetics marker. Duodenal and fecal grab samples were
taken at 0, 3, 6, 9, 12, 15, 18, 21, 24, 30, 36, 42, 48, 54, 60, and 72 h after
dosing.
Fecal samples were dried at 60°C for 72 h in a forced-air oven, and then
ground through a 1-mm screen in a Wiley mill. A portion of hourly fecal samples
was composited on a DM basis within steer and period. Composited fecal
samples were analyzed for DM, CM, N, ADF, starch, and Cr (Hill and Anderson,
1958). A portion of each hourly duodenal samples was dried at 60QC in a forced-
air oven for 72 h, ground in a mortar and pestle, further ground in a Udy mill and
composited within steer and period. These samples were analyzed for DM, CM,
N, ADF, Cr, starch and purine content (Zinn and Owens, 1986).
Half of the remaining portion of the hourly duodenal was used for VFA
analysis, the other used for ammonia analysis (AOAC, 1997). Hourly dried
duodenal, hourly dried fecal, and Yb-Iabeled grain samples were analyzed for Yb
content (Poore et al., 1991) by a ICP-ES (Fison Instrument Accuris) with a wave
length of 369.42 jam (Fassel, 1978). Hourly duodenal Yb concentrations were
fitted into a one-compartment model to estimate particulate flow rate, retention
time, time delay (Tau) and DM output (Ellis et al., 1979). On the final day of the
collection period, 1.5 L/steer of rumen fluid was collected from each steer. Raw
fluid was filtered through four layers of cheesecloth into a different 2000 ml flask.

38
Differential centrifugation (Smith and McAllen, 1974) was used to extract a
microbial pellet, which was then analyzed for DM, N (AOAC, 1997), and purine
content (Zinn and Owens, 1986).
On day four of the collection period at 0800, duplicate nylon bags plus one
blank per set (total 36 bags) were placed in the rumen (time 0 h). Nylon bags
(Ankom, Spencerport, NY) contained 5 g of the respective grain source fed to
each steer. This grain was processed identically to that of the feed lot trial. Bags
were 10 cm X 20 cm with a pore size of 50 p,m, and were removed from rumen
after incubation periods of 0, 2, 4, 6, 9, 12, 15, 18, 21, 24, 30, and 36h. Rumen
fluid pH was also measured at these times. Once removed from the rumen, bags
were washed in cold water by hand until water ran clearly through them. They
were then placed in a 60°C forced-air oven for 54 h. Bag residues were
analyzed for starch, with in situ rate and extent of starch and DM disappearance
calculated (Bowman and Firkins, 1993).
Data were analyzed as a 4 X 4 Latin square design using the GLM
procedure of SAS (1993). Planned comparisons were made for: corn vs barley,
GUN vs HAR, and MIX vs GUN and HAR. Treatment least square means were
separated by the LSD method of SAS (1993) if treatment F-test was significant
(P < .10). Least square means and associated standard errors are reported

39
Results and Discussion
Diet nutrient analysis is presented in Table I. Organic matter and starch
content were higher for the corn diet (94.17 and 48.4%) compared to the barley
diets (average 93.12 and 39.76% respectively). Ovenell-Roy et al. (1998a and
1998b) compared six barley cultivars in two feed trials. One of the cuItivars in
each trial was Harrington. In their first trial, nutrient analysis of grains found HAR
had starch and CP values (52.4 and 10.4% of OM) similar to the six varieties
examined. In the second trial, HAR supplied the second highest amount of CR
(11.2% of OM) of the six barleys studied behind Camelot barley, which supplied
15.0%. Starch content of HAR was 62.5% of OM in the second trial.
Interestingly, all of the barleys grown for the trial were grown in the same year
under the same conditions in the Pullman, WA-Moscdw, ID area.
No differences (P > .10) were seen in DM intake when corn was compared
to barley or when GUN was compared to HAR (Table 5). The average DM intake
of GUN and HAR, however, was greater (P = .05) than MIX-fed steers (average
9899.5 and 9846 g/d, respectively). Comparison of GUN vs HAR and GUN/HAR
vs MIX were not different (P > .10) for starch intake. Starch intake was greater
(P = .006) for corn-fed steers than for barley-fed steers. With the corn diet
providing more starch, steers fed corn consumed 861 g/d of starch more when
compared to the barleys. This large difference in amount of supplied starch
between corn and barley grain sources is repeated in literature but not to the
extent seen in this trial. Boss and Bowman (1996b), in a similar trial, observed a

40
greater amount of starch intake from a corn-based diet as compared to barley,
though the difference was not significant. Surber and Bowman (1998), also in a
restricted intake study, saw corn fed steers consume 292 g/d more starch than
steers fed barley.
In the Boss and Bowman (1996b) trial, HAR steers consumed 17 g/d less
N than those steers fed corn, GUN, or Medallion barley. Results of this study
found HAR fed steers with greater (P = .01) N intake than GUN steers (238 vs
228 g/d), and the average of the barley-fed steers (231 g/d) was greater (P =
.0003) than corn-fed steers (213 g/d). The MIX diet had lower (P = .04) N intake
than the average of GUN and HAR (226 vs 233 g/d). Since both GUN and MIX
diets supplied nearly the same amount of N, this difference may be attributed to
the fact that the HAR diet supplied more CR and therefore greater N to the
steers.
41
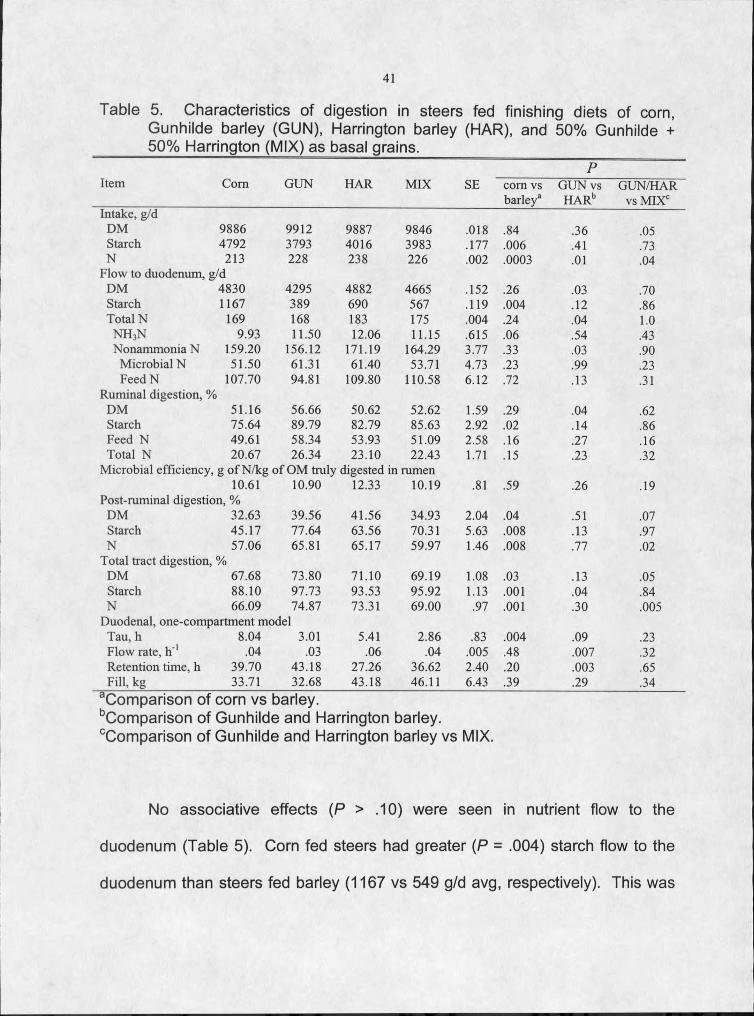
Table 5. Characteristics of digestion in steers fed finishing diets of corn,Gunhilde barley (GUN), Harrington barley (HAR)1 and 50% Gunhilde +
_____ 50% Harrington (MIX) as basal grains._________
Item Com G U N H A R M IX SE com vs barley3
PG U N vs H A R b
G U N /H A R vs M IX c
Intake, g/dD M 9886 9912 9887 9846 .018 .84 .36 .05Starch 4792 3793 4016 3983 .177 .006 .41 .73N 213 228 238 226 .002 .0003 .01 .04
F low to duodenum, g/dD M 4830 4295 4882 4665 .152 .26 .03 .70Starch 1167 389 690 567 .119 .004 .12 .86Total N 169 168 183 175 .004 .24 .04 1.0
N H 3N 9.93 11.50 12.06 11.15 .615 .06 .54 .43Nonam m onia N 159.20 156.12 171.19 164.29 3.77 .33 .03 .90
M icrobial N 51.50 61.31 61.40 53.71 4.73 .23 .99 .23Feed N 107.70 94.81 109.80 110.58 6.12 .72 .13 .31
Rum inal digestion, %D M 51.16 56.66 50.62 52.62 1.59 .29 .04 .62Starch 75.64 89.79 82.79 85.63 2.92 .02 .14 .86Feed N 49.61 58.34 53.93 51.09 2.58 .16 .27 .16Total N 20.67 26.34 23.10 22.43 1.71 .15 .23 .32
M icrobia l efficiency, g o f N /kg o f O M truly digested in rumen10.61 10.90 12.33 10.19 .81 .59 .26 .19
Post-ruminal digestion, %D M 32.63 39.56 41.56 34.93 2.04 .04 .51 .07Starch 45.17 77.64 63.56 70.31 5.63 .008 .13 .97N 57.06 65.81 65.17 59.97 1.46 .008 .77 .02
Total tract digestion, %D M 67.68 73.80 71.10 69.19 1.08 .03 .13 .05Starch 88.10 97.73 93.53 95.92 1.13 .001 .04 .84N 66.09 74.87 73.31 69.00 .97 .001 .30 .005
Duodenal, one-compartment modelTau, h 8.04 3.01 5.41 2.86 .83 .004 .09 .23F low rate, h"1 .04 .03 .06 .04 .005 .48 .007 .32Retention time, h 39.70 43.18 27.26 36.62 2.40 .20 .003 .65F ill, kg 33.71 32.68 43.18 46.11 6.43 .39 .29 .34
^Comparison of corn vs barley.^Comparison of Gunhilde and Harrington barley. ^Comparison of Gunhilde and Harrington barley vs MIX.
No associative effects (P > .10) were seen in nutrient flow to the
duodenum (Table 5). Corn fed steers had greater (P = .004) starch flow to the
duodenum than steers fed barley (1167 vs 549 g/d avg, respectively). This was
42
due to lower (P = .02) ruminal starch digestion by steers fed corn than those fed
barley (75.64 vs 86.07% avg, respectively).
These results are in agreement with 0rskov (1986) and Feng et al. (1995)
who reported corn had a slower rate of ruminal starch digestion than barley.
0rskov (1986) stated that up to 90% of starch from whole or processed barley
may be lost to ruminal fermentation and suggested that on occasion, up to 40%
of corn starch could escape ruminal fermentation. This rate of degradation
seems to be reduced if there is a roughage source in the diet. Boss and
Bowman (1996b) reported corn and barley had similar digestion rates. In their
study GUN had lower (P = .04) ruminal DM digestion that HAR, resulting in more
(P = .03) DM flowing to the duodenum (4895 vs 4882 g/d, respectively). In our
study, daily starch flow, though not significant (P - .12), was over 300 g/d greater
for steers fed HAR barley than for steers fed GUN barley (690 vs 389 g/d,
respectively). This could be due to a greater percent of starch provided by the
HAR diet and subsequently greater starch intake by the steers of this treatment.
Steers fed HAR had greater (P = .04) total N and non-ammonia N (P =
.03) passage to the duodenum than GUN. Steers fed HAR had greater (P = .04)
N flow to the duodenum than steers fed GUN, which can again be related back to
the fact that more N was supplied by the diet. Feng et al. (1995) found total N,
microbial N, and non-ammonia N flow to the duodenum greater for barley than
for corn. These results agreed with Spicer et al. (1982) who reported that with
increased ruminal starch digestion, microbial N flow to the intestines will also
increase. Results of our study support this theory. An increase in amount of

43
starch digested in the rumen, expressed as a percentage for each treatment,
reflected the increase in microbial N flow to the duodenum. There were no
differences (P > .10) observed between corn or barley diets in total N, non
ammonia N, microbial N or feed N flow to the duodenum in this study. Our
results are similar to those of Surber and Bowman (1998) who found no
differences between Corn or barley diets in total N, NH3N, non-ammonia N, and
feed N flow to the abomasum. Boss and Bowman (1996b) found a corn diet had
greater (P = .01) feed N (29 g/d) flowing to the abomasum than the average of
three barley diets (average 17 g/d). Zinn et al. (1996) in studying feeding values
of hulless and covered barley, found flaked corn had less (P = .01) microbial N
flow to the duodenum than rolled or flaked barley of either the hulless or covered
variety. Like Boss and Bowman (1996b), this resulted in lower ruminal
degradation of feed N for corn vs barley (P = .05). A similar result was not
observed in our trial.
No associative effect (P > .10) in ruminal digestion from feeding a malt
and feed barley in combination was observed. The average of the barleys did
have greater (P = .02) ruminal starch digestion than corn (average 86.07 vs
75.64%, respectively). Ruminal DM digestion of GUN (56.66%) was greater (P =
.04) than that of HAR (50.62%). No other differences were detected in ruminal
nutrient digestion (P> .10).
Microbial efficiency (g of N/kg of OM truly digested in rumen) were not
different (P > .10) for any of the comparisons. This agrees with Surber and

44
Post-ruminal digestion of DM, starch, and N was greater (P < .04) for
barley than for corn. Boss and Bowman (1996b) found post-ruminal starch
digestion of corn (41.8%) lower than that of barley (82.0%). Surber and Bowman
(1998) reported similar results with corn having 55.4% and barley 90.3% poSt-
ruminal starch digestibility. In Zinn et al. (1996), no difference in post-ruminal
starch digestion was detected between corn or barley. They did report an
interaction between barley variety and type of processing for post-ruminal
digestion. Steam flaking of barley increased post-ruminal digestion of starch as
well as N, findings that agreed with results from an earlier trial (Zinn, 1993). In
the comparison of GUN vs HAR, there were no (P = .10) differences in post-
ruminal digestion. Gunhilde and HAR had greater (P = .02) post-ruminal N
digestion than MIX (average 65.49% and 59.97%, respectively). No associative
effects (P > .10) were observed in post-ruminal digestion of DM and starch.
When compared to MIX, GUN/HAR had greater (P = .02) post-ruminal digestion
of N (59.97 vs 65.49% average).
Feng et al. (1995) reported corn having lower total tract DM and starch
digestion than barley. They did not find any differences between barley varieties.
In a study comparing six barley varieties, Ovenell-Roy et al. (1998a) found no
differences between varieties in total tract starch digestion. In our study, GUN
had greater (P = .04) total tract starch digestion than HAR. Corn-fed steers had
lower (P < .03) DM, starch, and N total tract digestion than did steers fed barley.
Bowman (1998) but not with Boss and Bowman (1996b) or Zinn et al. (1996) who
both reported corn having lower microbial efficiency (P = .01) than barley diets.

45
Nutrient flow to the duodenum and ruminal digestion were not different (P
> -10) for MIX when compared to GUN and HAR. Post-ruminal and total tract
digestion of N was less (P < .02) for MIX than for GUN and HAR.
To estimate flow rates of the diet, a one-compartment model and sampling
at the duodenum was used. No differences (P > .10) were detected in particulate
flow rate or retention time between corn or barley diets or when MIX was
compared to GUN/HAR. However, HAR had lower (P = .003) retention time than
GUN (27.26 vs 43.18 h, respectively) resulting in a greater (P = .007) flow rate
(.06 vs .03 IY"1, respectively) to the duodenum. Tau for corn was greater (P =
.004) by 4.5 h than GUN, HAR, and MIX. This is very similar to the 3.5 h
difference that Boss and Bowman (1996b) reported. No differences (P > .10)
were seen between the four diets in fill (average 38.92 kg).
Figure 1 presents ruminal NH3N concentrations plotted against time. No
treatment by sampling time interaction was observed (P = .5) for ruminal NH3N
concentration. Average of barley diets ruminal NH3N concentration was greater
(P = .0001) when compared to corn (average 5.48 vs 3.74 mg/dL, respectively).
Harrington also had a higher NH3N level (6.25 mg/dL) when compared to GUN
(4.81 mg/dL; P = .001). There were no differences detected (P = .6) when MIX
was compared to GUN/HAR. Ruminal NH3N concentrations for this trial ranged
from 2.23 to 10.59 mg/dL. The lower values observed on this trial are slightly
lower than the ammonia N concentration values of 3.3 and 8.5 mg/dL that Kang-
Merznarich and Broderick (1981) reported as being required for maximum
ruminal microbial growth. This may be the case, as microbial efficiency (g of
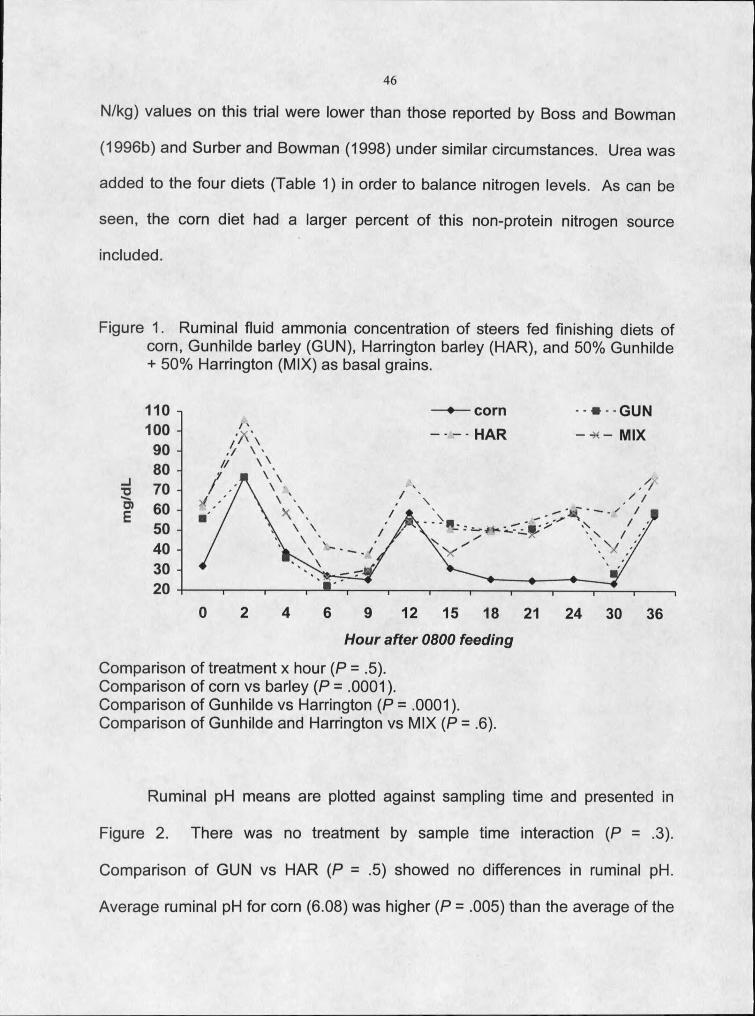
46
N/kg) values on this trial were lower than those reported by Boss and Bowman
(1996b) and Surber and Bowman (1998) under similar circumstances. Urea was
added to the four diets (Table 1) in order to balance nitrogen levels. As can be
seen, the corn diet had a larger percent of this non-protein nitrogen source
included.
Figure 1. Ruminal fluid ammonia concentration of steers fed finishing diets of corn, Gunhilde barley (GUN), Harrington barley (HAR), and 50% Gunhilde + 50% Harrington (MIX) as basal grains.
110 -i * GUNcorn100 - - H A R
/ / \ \
Hour after 0800 feeding
Comparison of treatment x hour (P = .5).Comparison of corn vs barley (P = .0001).Comparison of Gunhilde vs Harrington (P = .0001). Comparison of Gunhilde and Harrington vs MIX (P = .6).
Ruminal pH means are plotted against sampling time and presented in
Figure 2. There was no treatment by sample time interaction (P = .3).
Comparison of GUN vs HAR (P = .5) showed no differences in ruminal pH.
Average ruminal pH for corn (6.08) was higher (P = .005) than the average of the
47
barley diets (5.97). This agrees with the findings of Boss and Bowman (1996b)
and Surber and Bowman (1998). As in these two studies the slower rate of
ruminal DM and starch digestion of the corn diet on this trial resulted in a higher
pH value than for the barley diets. A higher pH (P = .007) was observed for MIX
when compared to GUN and HAR (6.05 vs 5.93 average, respectively). A
possible reason for this could be the lower (P = .0001) concentration rate of
acetate and isovalerate, greater (P = .0001) concentration of propionate, and the
absorption rate of these VFA in the MIX when compared to GUN and HAR.
Church (1998) states that rumen pH can be stabilized by VFA absorption. With
absorption increasing as pH decreases. This is a result of an increase in ruminal
papillae size (i.e. greater pH absorption surface area).
A main concern with feeding high concentrate barley diets is the
associated decrease in ruminal pH and resulting feeding disorders, such as
acidosis and bloat. With average ruminal pH of animals on high Concentrate
diets ranging from 5.5 to 6.5 (Church, 1988), it is important to maintain a constant
pH level to maintain a high level of animal metabolic performance. Evidence of
this can be found in reports of corn based diets such as those reported here and
by Boss and Bowman (1996b). These trial seem to indicate that corn diets
remain at a fairly constant pH level when compared to barley diets. Church
(1988) reports that as acidity decreases, so does cellulolytic fora activity.
Conversely, amylolytic activity will increasing. Less fluctuation in ruminal pH will
result in fewer changes in the microflora population, and subsequently fewer
feeding disorders, leading to better animal performance.
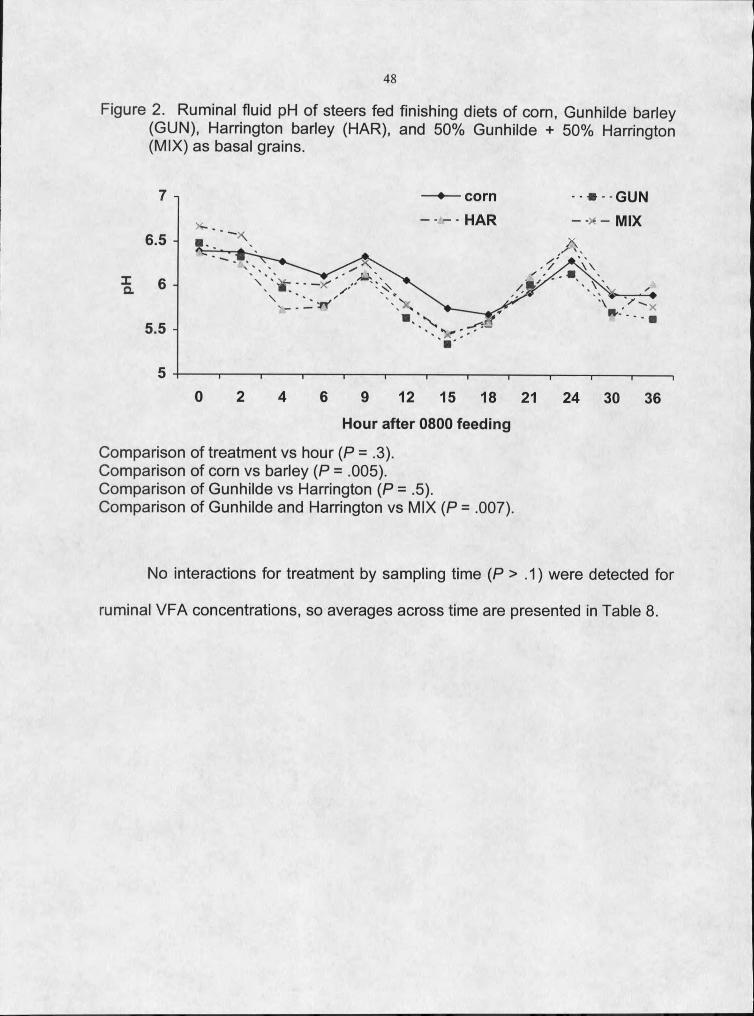
48
Figure 2. Ruminal fluid pH of steers fed finishing diets of corn, Gunhilde barley(GUN), Harrington barley (HAR)1 and 50% Gunhilde + 50% Harrington(MIX) as basal grains.
-GUNcorn- - - HAR —x — MIX
Hour after 0800 feeding
Comparison of treatment vs hour (P = .3).Comparison of corn vs barley (P = .005).Comparison of Gunhilde vs Harrington (P = .5). Comparison of Gunhilde and Harrington vs MIX (P = .007).
No interactions for treatment by sampling time (P > .1) were detected for
ruminal VFA concentrations, so averages across time are presented in Table 8.

49
Table 6. Ruminal volatile fatty acids of steers fed finishing diets of corn,Gunhilde barley (GUN), Harrington barley (HAR), and 50% Gunhilde +50% Harrington (MIX) as basal grains.________
Item C om G U N H A R M IX SE com vs barley3
PG U N vs
H A R bG U N /H A R
vs M IX cTotal V F A , mM 55.03 61.95 57.28 60.36 .893 .0001 .0003 .49V F A , m ol/100 mol
Acetate 54.22 52.96 54.07 52.25 .202 .0001 .0002 .0001Propionate 24.65 25.02 24.15 27.08 .418 T l .14 .0001Isobutyrate 1.24 1.31 1.33 1.29 .019 .002 .53 .25Butyrate 14.68 15.05 14.85 14.32 .284 .85 .63 .07Isovalerate 3.71 3.49 3.40 2.94 .091 .0001 .49 .0001Valerate 1.51 2.20 2.21 2.12 .037 .0001 .83 .08
Acetate:propionate ratio 2.25
a ■ r2.30 2.28 2.08 .042 .53 .75 .0001
^Comparison of corn vs barley.^Comparison of Gunhilde and Harrington barley. ^Comparison of Gunhilde and Harrington barley vs MIX.
Corn-fed steers had lower (P = .0001) total VFA concentration respectively
(55.03 vs 59.86 mM average, respectively) than steers fed barley. GUN-fed
steers had the highest total VFA concentration (61.95 mM) of the four diets, and
a significantly higher (P = .003) concentration than HAR-fed steers (57.28 mM).
Boss and Bowman (1996b) conversely found HAR-fed steers to have greater (P
< .10) total VFA concentration than GUN-fed steers (77.4 vs 72.7 mM).
Isobutyrate and valerate percentages were also lower (P < .002) for steers fed
corn as compared to steers fed barley. Corn fed steers had higher (P = .0001)
acetate and isovalerate percentages than barley fed steers. Acetate percentage
was lower (P = .0002) for GUN than for HAR. Associative effects were observed
in acetate, propionate, and isovalerate percentages, and acetate:proprionate
ratio. An associative effect was observed in acetate:propionate ratio with MIX
being lower (P = .001) when compared to the average of GUN and HAR.
50
Boss and Bowman (1996b) and Surber and Bowman (1998) reported
lower acetate:propionate ratio for steers fed corn as compared to steers fed
barley. In the formerly mentioned paper there is speculation that an increase in
ADG of corn-fed steers could be due to greater availability of gluconeogenic
precursors. Our trial also found acetate:propionate ratio lower for corn than
barleys though not significant (P > .10). It is important to point out two facts from
our trial on this point. First, our ADG from the feedlot trial for corn when
compared to barleys though greater, was not as pronounced as the Boss and
Bowman (1996a) findings (P = .06 vs P = .002). Secondly, though not compared
statistically, the acetate:propionate ratio for MIX was 0.166 m/M less than corn.
Interestingly MIX had the highest ADG of the barley diets in the feedlot trial
though the difference was not significant (P > .10).

51
Figure 3. In situ dry matter disappearance of steers fed finishing diets of corn,Gunhilde barley (GUN), Harrington barley (HAR), and 50% Gunhilde +50% Harrington (MIX) as basal grains.
GUNcorn- - HAR — -x — MIX
Time of incubation
Pooled SEM was 2.73%.
In situ DM disappearance (ISDMD) of the four diet grains is presented in
Figure 3. Corn had lower (P < .003) ISDMD when compared to the barleys after
hour 4. Harrington had less (P < .05) ISDMD than GUN at 2, 6, 15,18, and 21 h
of incubation. Only at hours 4 and 15 were any differences seen when MIX was
compared to GUN and HAR. Here MIX had greater (P < .05) incubation than did
GUN and HAR. These results agree with Boss and Bowman (1996b) who also
found corn with lower ISDMD when compared to barley.
52
Implications
Harrington barley-fed steers had lower retention time and therefore
greater flow rate than Gunhilde-fed steers. This did not translate into any
benefits for site of digestion or amount of total tract digestion of dry matter,
starch, or nitrogen when barleys were compared. Though not compared to corn,
GunhiIde duodenal retention time was higher by three and one half-hours.
Feeding a combination of malting variety and feed variety barley did result
in some interesting findings. Differences in volatile fatty acid concentrations and
absorption rate of 50% Gunhilde and 50% Harrington as Compared to Gunhilde
and Harrington may have helped to control ruminal pH. This along with a lower
acetate:propionate ratio may result in an increase in animal performance.
Harrington barley had greater microbial efficiency. Fifty-percent Gunhllde/ 50%
Harrington had greater total tract nitrogen digestion when compared to Gunhilde
and Harrington.

53
x CHAPTER 5
CONCLUSIONS
Results of this trial agree with Boss and Bowman (1996a) that barley diets
with fast rates of ruminal digestion may not hinder animal performance. They
found that over the course of their trial, corn-fed steers had greater average daily
gains and final weights. Our results echoed these findings. Comparisons of
carcass characteristics of steers fed corn and barley were similar. This could be
attributed to number of days on feed. We also confirmed the Surber and
Bowman (1998) findings that starch digestibility percent is greater for barley than
for corn and that digestible starch intake is higher for corn than for barely.
Monitoring the feeding of barley in high concentration diets is a must due to its
fast rate of fermentation and subsequent digestive disorders. Yet taking into
consideration feed cost and cost of gain, barley at $.35/d and $. 15/kg less than
corn along with its higher, regional availability, make it the economical common
sense choice.
We found corn to have a slower rate of ruminal fermentation when
compared to barley, as well as a greater amount of starch reaching the lower
tract for further digestion. Our findings are consistent with the literature as to site
and rate of nutrient digestion of corn when compared to barley. When barley
varieties were compared, though not significant, Harrington supplied 301 g/d of
Starch more to the duodenum than did Gunhilde. Harrington was higher in total

54
and non-ammonia nitrogen flow to the duodenum as well. Total tract digestion
and duodenal retention time favored Gunhilde over the other diets.
Few associative effects were observed. The most promising was the
volatile fatty acid concentration and absorption rate differences Seen in the MIX
diet. This may have lead to a higher rumen pH level translating into better animal
performance.
Though we did not see the slower rate of ruminal starch digestion of
Gunhilde compared to Harrington that was observed in the Boss and Bowman
(1996a and b) trials, our result on barley performance compared to corn are
encouraging. Our results reaffirm the theory that barley feed values differ within
variety and from year to year. A consistent malting variety has been established
with the Morex CUItivar being the standard. However, further research into
identifying what causes differences in feed value of barley cultivars will lead to
the development of consistent performance varieties.

LITERATURE CITED
56
Allen, M. S. and K. F. Knowlton. 1995. Non-structural carbohydrates important for ruminants. Feedstuffs. April 17. pp 13-15.
Anderson, V. L. and S. L. Boyles. 1989. Three barley/corn diets for feed lot steers. North Dakota Agric. Exp. Stn. Publ 47:16. Fargo, ND.
AOAC. 1997. Official Methods of Analysis (16th. Ed.). Association of Official Analytical Chemists, Gaitherburg, MD.
Boss, D. L., and J. G. P. Bowman. 1996a. Barley varieties for finishing steers:I. Feedlot performance, in vivo diet digestion, and carcass characteristics.J. Anim. Sci. 74:1967.
Boss, D. L., and J. G. P. Bowman. 1996b. Barley varieties for finishing steers: II. Ruminal characteristics, and rate, site and extent of digestion. J. Anim. Sci. 74:1973.
Bowman, J. G. P., and J. L. Firkins. 1993. Effects of forage species and particle size on bacterial cellulolytic activity and colonization in situ. J. Anim. Sci. 71:1623-1633.
Bowman, J. G. P., T. K. Blake, L. M. M. Surber, D. K. Habernicht, I . K. Daniels, and J. T. Daniels. 1996. Genetic factors controlling digestibility of barley for ruminants. Proc. West. Sec. Am. Soc. Anim. Sci. 47:257.
Bradshaw, W. L., D. D. Hinman, R. C. Bull, and D. 0. Everson. 1992. Steptoe vs. Klages barley varieties and processing methods on feedlot steer nutrient digestibility, carcass characteristics, and performance. Proc. West. Sec. Am. Soc. Anim. Sci. 43:548.
Bradshaw, W. L., D. D. Hihman*, R. C. Bull, D. 0. Everson, and S. J. Sorensen. 1996. Effects of barley variety and processing methods on feedlot steer performance and carcass characteristics. J. Anim. Sci. 74:18.
Brown, I. 1996. Complex carbohydrates and resistant starch. Nutr. Reviews. 54(11):S115.
Cheng, K. -J., T. A. McAllister, J. D. Popp, A. N. Hristov, Z. Mir, and H. I . Shin. 1998. A review of bloat in feedlot cattle. J. Anim. Sci. 76:299.
Church, D. C., 1986. Livestock feeds and feeding. 2nd Ed. pp 55. Reston Books. Prentice-Hall. Englewood Cliffs, New Jersey.

57
Church, D. C., 1988. The ruminant animal: Digestive physiology and nutrition, pp 155-161. Waveland Press, Inc. Prospect Heights, Illinois.
Combs, J. J., and D. D. Hinman. 1989. Performance of steers fed either dry- rolled, tempered-rolled, or steam-rolled barley based grower and finishing rations. Proc. West. Sect. Am. Soc. Anim. Sci. 40:373.
Duren, E. and C. R. Miller. 1992. Bloat prevention and treatment. Montana Beef Cow-calf Handbook. MT3625. CL625.
Ellis, W. C., J. H. Matis, and C. Lascano. 1979. Quantitating ruminal turnover. Fed. Proc. 38:2702-2706.
Fassel, V. A. 1978. Quantitative elemental analyses by plasma emission spectrophotometry. Science 202:183.
Feng, P., C. W. Hunt, G. T. Pritchard, and S. M. Parish. 1995. Effect of barley variety and dietary barley content on digestive function in beef steers fed grass hay-based diets. J. Anim. Sci. 73:3476.
Galyean, M. L., and K. S. Eng. 1998. Application of research findings and summary of research needs: Bud Britton Memorial Symposium onmetabolic disorders of feedlot cattle. J. Anim. Sci. 76:323.
Gibson, L. A., J. G. P. Bowman, L. E. Oberthur, and T. K. Blake. 1994. Determination of genetic markers associated with ruminant digestion of barley. Proc. West. Sect. Am. Soc. Anim. Sci. 45:317.
Clock, R. D,, and B. D. DeGroot 1998. Sudden death of feedlot cattle. J. Anim. Sci. 76:315.
Gould, D. H. 1998. Polioencephalomalacia. J. Anim. Sci. 76:309.
Hill, F. W., and D. L. Anderson. 1958. Comparison of metabolizable energy and productive energy and productive energy determinations with growing chicks. J. Nutr. 64:587.
Huntington, G. B. 1997. Starch utilization by ruminants: From basics to the bunk. J. Anim. Sci. 75:852.
Kang-Meznarich, J. H., and G. A. Broderick. 1981. Effects of incremental urea supplementation on ruminal ammonia concentration and bacterial protein formation. J. Anim. Sci. 51:422

58
Kemalyan, R. E., C. K. Clark, M. K. Peterson, and C. W. Newman. 1989. In vitro dry matter disappearance rate and purine accumulation of proanthocyanidin-free barley cultivars. Proc. West. Sec. Anim. Sci. 40:414.
Kotarski, S. F., R. D. Waniska, and K. K. Thurn. 1992. Starch hydrolysis by the ruminal microflora. J. Nutr. 122:178.
Ladely, S. R., R. A. Stock, F. K. Goedeken, and R. P. Huffman. 1995. Effect of corn hybrid and grain processing method on rate of starch disappearance and performance of finishing cattle. J. Anim. Sci. 73:360.
Lehninger, A. L , D. L. Nelson, and M. M. Cox. 1993. Principles of Biochemistry. (2nd Ed.) Worth Publishers, Inc., New York, N. Y. pp 298-321
Leloup, V. M., P. Colonna, and S. G. Ring. 1992. Physico-chemical aspects of resistant starch. J. Cereal Sci. 16:253.
Lorenz, K. 1995. Physicochemical characteristics and functional properties of starch from a high p-glucan waxy barley. Starch. 47:14.
McAllister, T. A., L. M. Rode, D. J. Major, K. -J. Cheng, and J. G. Buchanan- Smith. 1990. Effect of ruminal microbial colonization on cereal grain digestion. Can. J. Anim. Sci. 70:571.
McAllister, I . A., Y. Dong, L. J. Yanke, H. D. Bae, and K. -J. Cheng. 1993a. Cereal grain digestion by selected strains of ruminal fungi. Can, J. Microbiol. 39:367.
McAllister, I . A., R. C. Phillippe, L. M. Rode, and K. -J. Cheng. 1993b. Effect of the protein matrix on the digestion of cereal grains by ruminal microorganisms. J. Anim. Sci. 71:205.
McAllister, T. A., H. D. Bae, G. A. Jones, and K. -J. Cheng. 1994. Microbial attachment and feed digestion in the rumen. J. Anim. Sci. 72:3004.
McAllister, T. A., and K. -J. Cheng. 1996. Microbial strategies in the ruminal digestion of cereal grains. Anim. Feed Sci. Technol. 62:29.
Miles, D. G., D. W. Hoffman, K. C. Rogers, and J. E. Sears. 1998. Diagnosis of digestive deaths. J. Anim. Sci. 76:320.
59
Molina-Cano, J. -L., M. Francesch, A. M. Perez-Vendrell, T. Ramo, J. Voltas, and J. Brufau, 1997. Genetic and environmental variation in malting and feed quality of barley. J. Cereal Sci. 25:37
Montana Agricultural Statistics Service. 1999. Montana Agricultural Statistics. MT Dept. Agric., Helena.
Nagaraja, T. G., and M. M. Chengappa. 1998. Liver abscesses in feedlot cattle: A review. J. Anim. Sci. 76:287.
Nocek, J. E. 1990. Implications of manipulating starch site digestion in dairy cattle. Proc. Cornell Nutr. ConL Feed ManL :44.
Noziere, P., and B. Michalet-Doreau. 1997. Effects of amount and availability of starch on amylolytic activity of ruminal solid-associated microorganisms. J. Sci. Food Agric. 73:471.
NRC. 1996. Nutrient Requirements of Beef Cattle. Seventh Revised Edition. National Academy Press, Washington, D.C.
Oscarsson, M., T. Parkkonen, K. Autio, and P. Aman. 1997. Composition and microstructure of waxy, normal, and high amylose barley samples. J. Cereal Sci. 26:259.
0rskov, E. R. 1986. Starch digestion and utilization in ruminants. J. Anim. Sci. 63:1634.
Ovenell-Roy, K. H., M. L. Nelson, J. A. Froseth, S. M. Parish, and E. L. Martin. 1998a. Variation in chemical composition and nutritional quality among barley cultivars for ruminants. 1. Steer finishing performance, diet digestibilities and carcass characteristics. Can. J. Anim. Sci. 78:369- 375.
Ovenell-Roy, K. H., M. L. Nelson, J. A. Froseth, S. M. Parish, and E. L. Martin. 1998b. Variation in chemical composition and nutritional quality among barley cultivars for ruminants. 2. Digestion, ruminal characteristics and in situ disappearance kinetics. Can. J. Anim. Sci. 78:377-388.
Milner, T. J., J. G. P. Bowman, and B. F. Sowell. 1995. Effects of barley varietyor corn on feed lot performance and feeding behavior. ProC. West. Sec.Am. Soc. Anim. Sci. 46:539.
60
Owens, F. N., R. A. Zinn, and Y. K. Kim. 1986. Limits to starch digestion in the ruminant small intestine. J. Anim. Sci. 63:1634.
Owens, F. N., D. S. Secrist, W. J. Hill, and D. R. Gill. 1997. The effect of grain source and grain processing on performance of feedlot cattle: A review. J. Anim. Sci. 75:868.
Owens, F. N., D. S. Secrist, W. J. Hill, and D. R. Gill. 1998. Acidosis in cattle: A review. J. Anim. Sci. 76:275.
Poore, M. H., J. A. Moore, I . P. Eck, and R. S. Swingle. 1991. Influence of passage model, sampling site, and marker dosing time on passage of rare earth-labeled grain through Holstein cows. J. Anim. Sci. 69:2646.
Pritchard, R. H., and D. A. Stateler. 1997. Grain processing: Effects on mixing, prehension, and other characteristics of feeds. J. Anim. Sci. 75:880.
Russell, J. B. 1998. Strategies that ruminal bacteria use to handle excess carbohydrate. J. Anim. Sci. 76:1955.
SAS. 1993. SAS/STAT User Guide. SAS Inst. Inc., Cary, NO.
Smith, R. H., and A. B. McAllen. 1974. Some factors influencing the chemical composition of mixed rumen bacteria. Br. J. Nutr. 31:27.
Spicer, L., J. Sowe, and C. B. Theurer. 1982. Starch digestion of sorghum grain, barley and corn based diets by beef steers. Proc. West. Sec. Am. Soc. Anim. Sci. 33:41.
Stock, R. and R. Britton. 1992. Acidosis. Montana Beef Cow-calf Handbook. GPE3010.
Surber, L. M. M., and J. G. P. Bowman. 1998. Monensin effects on digestion of corn or barley high-concentrate diets. J. Anim. Sci. 76:1945.
Theurer, C. B. 1986. Grain processing effects on starch utilization by ruminants. J. Anim. Sci. 63:1649.
Theurer, C.B.,0. Lozano, A. Alio, A. Delgado-Elorduy, M. Sadik, J. T. Huber, and R. A. Zinn. 1999. Steam-processed corn and sorghum grain flaked at different densities alter ruminal, small intestinal, and total tract digestibility of starch by steers. J. Anim. Sci. 77:2824.
61
Tyrrell, H. F., and P. W. Moe. 1974. Net energy value of a corn and barley ration for lactation. J. Dairy Sci. 57:451.
Van Keulen, J., and B. A. Young. 1977. Evaluation of acid-insoluble ash as a natural marker in ruminant digestibility studies. J. Anim. Sci. 44:282.
Van Soest, P. J., J. B. Robertson, and B. A. Lewis. 1991. Methods for dietary fiber, neutral detergent fiber, and ndhstarch polysaccharides in relation to animal nutrition. J. Dairy Sci. 74:3583.
Wester, T. J., S. M. Gramlich, R. A. Britton, and R. A. Stock. 1992. Effect of grain sorghum hybrid on in vitro rate of starch disappearance and finishing performance of ruminants. J. Anim. Sci. 70:2866.
Zinn, R. A., and F. N. Owens. 1986. A rapid procedure for purine measurement and its use for estimating net ruminal protein synthesis. Can. J. Anim Sci. 66:157.
Zinn, R. A. 1993a. Influence of processing on the comparative feeding value of barley for feedlot cattle. J. Anim. Sci. 71:3.
Zinn, R. A. 1993b. Influence of processing on the feeding value of oats for feedlot cattle. J. Anim. Sci. 71:2303.
Zinn, R. A., M. Montano, and Y. Shen. 1996. Comparative feeding value of hulless vs covered barley for feedlot cattle. J. Anim. Sci. 74:1187.
62
APPENDIX A
ANALYSIS OF VARIANCE TABLES
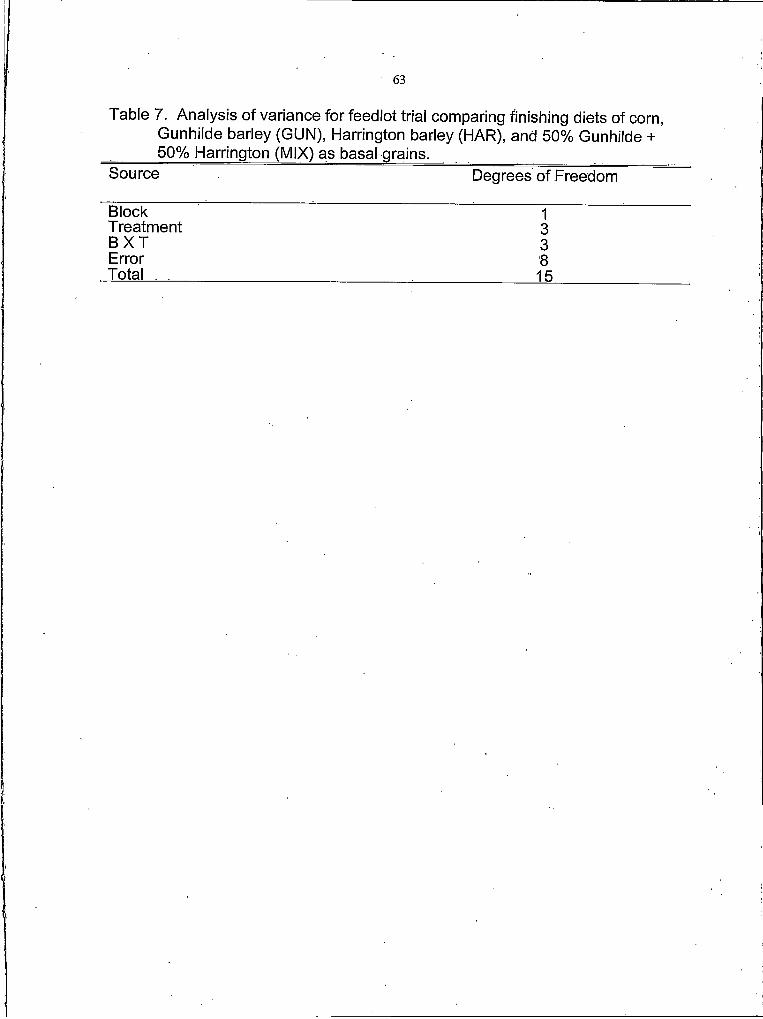
63
Table 7. Analysis of variance for feedlot trial comparing finishing diets of corn, Gunhilde barley (GUN), Harrington barley (HAR), and 50% Gunhilde + 50% Harrington (MIX) as basal grains. ________
Source Degrees of Freedom
Block 1T reatment 3B X T 3Error 8Total 15

64
Table 8. Analysis of variance for metabolism trial comparing finishing diets of corn, .Gunhilde barley (GUN)i Harrington barley (HAR), and 50% Gunhilde + 50% Harrington (MIX) as basal grains.
Source Degrees of Freedom
Animal 3Period 3T reatment 3Error 6Total 15

MONTANA STATE UNIVERSITY - BOZEMAN