influence of taungya agroforestry system on diversity of ... · influence of taungya agroforestry...
TRANSCRIPT

International Journal of Scientific and Research Publications, Volume 4, Issue 3, March 2014 1 ISSN 2250-3153
www.ijsrp.org
Influence of Taungya Agroforestry System on Diversity
of Native Woody Species and Soil Physico-Chemical
Properties in Nigeria 1Akinbisoye, O. S.,
2Oke, S. O.,
1Adebola, S. I. and
1Mokwenye, A. I
1Institute of Ecology and Environmental Studies, Faculty of Science, Obafemi Awolowo University, Ile-Ife, Osun State, Nigeria
2Department of Botany, Faculty of Science, Obafemi Awolowo University, Ile-Ife, Osun State, Nigeria.
Abstract- This study assessed the effects of agroforestry system
on diversity of native woody species and soil physico-chemical
properties. This was achieved by comparing floristic composition
and soil physico-chemical properties in four different Taungya
agroforestry sites and a natural regrowth forest reserve where
active logging has not taken place in Ondo State, Nigeria. Two
sample plots of 25 m x 25 m were assessed in each site using
systematic sampling techniques. All the plants were identified to
species level and categorized into tree, shrub, perennial herb,
scrambling shrub, epiphyte, climber and their families were
identified. Shannon-Weiner and species evenness indices were
used to assess and compare native woody species diversity and
abundance. Five soil samples were randomly collected from each
agroforest plot and natural regrowth forest at depths of 0-15 cm
and 15-30 cm using a soil auger to give a total of one hundred
soil samples which were air-dried and sieved using 2.0 mm sieve.
The results showed that the study area was richer in arable crops
compared to native woody species as there were 54 species
distributed into 28 families in the natural regrowth forest, 11
species distributed into 9 families in Aponmu, 19 species
distributed into 19 families in Owo, 11 species distributed into 10
families in Idanre, and 8 species distributed into 7 families in
Ore. Species density gradually reduced from 1392 ha-1
in natural
regrowth forest to 1192 ha-1
, 848 ha-1
, 664 ha-1
and 432 ha-1
in
Owo, Idanre, Ore and Aponmu Taungya agroforests respectively.
More climber species were encountered in natural regrowth
forest compared to the Taungya agroforest sites. Shrubs species
recorded were higher in most of the Taungya sites compared to
natural regrowth forest. The soil texture of all sites, except Owo
Taungya were sandy clay loam at the two soil depths. The soil
pH ranged from 5.3 to 7.1 for the top soil and from 4.0 to 7.0 for
the sub soil. Ore Taungya site was significantly higher (P < 0.05)
in soil organic carbon (2.46 g/kg) and total nitrogen (0.20 g/kg)
when compared with other agroforestry sites. The cation
exchangeable capacity (6.77 cmol/kg) was highest at Aponmu
site. These values however, decreased with depths. This study
concluded that Taungya agroforest averagely enhanced native
plant biodiversity conservation and significantly improved the
soil quality of the study area.
Index Terms- Taungya, natural regrowth forest, soil physico-
chemical properties, species distribution
I. INTRODUCTION
ransformation of forest reserves to other land-uses in recent
times has caused many complex changes in the forest
ecosystem (Henrik et al., 2010, Awotoye et al., 2013); one of
such changes is the emergence of Taungya agroforestry practice
within the forest reserves in Nigeria. Taungya farming is the
fore-runner to agroforestry. It is of Burmese origin and means
“hill” (Taung), “cultivation” (ya) (Nair, 1993). According to
Adedire (2005), agroforestry is a collective name for land-use
systems and practices of deliberately growing or retaining trees
or shrubs within an agricultural or pastoral land use system,
either under the same form of spatial arrangement or in temporal
sequence. Approved Taungya is the allocation of land to farmers
in forest reserves where tree seedlings and arable crops are
planted together (Adekunle and Bakare, 2004), it is considered a
management option, as a result of many degradation that has
taken place in forest ecosystems which, is beyond their capacity
to enhance and conserve native woody species diversity (Brown
and Boutin, 2009). The increasing size of the world population
has led to a tremendous rise in the demand for food and energy.
As a result, more forest reserves in the country are now being
converted at high pace to farmland and other uses than ever
before. According to Roche (1993) Taungya may prove to be one
of the cheapest means of establishing forests of all kinds and at
the same time supplying food for the general population.
Taungya farming involves the growing of annual or biennial
agricultural crops along with the forest species during the early
years of establishment of the forest plantation (Jordan et al.,
1992). The long-term effect of taungya practice on regeneration
of native woody plant diversity and soil fertility will however
depend on the management practices adopted at the initial time
as well as subsequent re-establishment phases (Jordan et al.,
1992). Many other factors such as canopy cover percentage, leaf
area index and stem density (Hardtle et al., 2003 and Lemenih et
al., 2004), substrate quality, litter mass depth (Dzwonko and
Gawronski, 2002), land use history (Gachet et al., 2007),
management practices (Brown and Boutin 2009) and Farmers
attitude (Adekunle and Bakare, 2004) determine the ability of
taungya system to allow natural regeneration of native woody
species. Adekunle and Bakare (2004) reported that, the only
species most of the respondents in Ondo State were willing to
plant was Tectona grandis and those native species retained on
farmland are tropical indigenous hardwood species such as
Triplochiton scleroxylon, Mansonia altissima, Chrysophyllum
T

International Journal of Scientific and Research Publications, Volume 4, Issue 3, March 2014 2
ISSN 2250-3153
www.ijsrp.org
albidum, Celtis zenkeri, Milicia excelsa, Khaya ivorensis, Afzelia
africana, Strombosia pustulata, Treculia africana, etc. It is
important to understand that agroforests are not specifically
conceived by farmers to allow biodiversity conservation, instead
biodiversity restoration in agroforests results mainly from
unintentional processes (Michon and de Foresta, 1995).
Nevertheless, with the wide practice of taungya and many other
agroforestry practices, it is important that further studies are
carried out to assess the extent to which these methods of land
use can provide habitat for indigenous woody species diversity
especially in the tropics. Hence this paper seeks to highlight the
contribution of taungya agroforestry system as a type of land use
method adopted in forest reserve management to conserve native
woody species diversity and maintain soil fertility.
II. MATERIALS AND METHODS
Study Area
The study was carried out in five locations namely, Idanre
(Latitude N 06⁰ 44 20¹, Longitude E 004⁰ 46 44¹), Owo (Latitude
N 06⁰ 57.32¹, Longitude E 005⁰.37.41.4¹), Aponmu (Latitude
N07⁰14.67¹, Longitude E005⁰ 02.53¹), Ore (Latitude N 06⁰ 44.
19¹, Longitude E 004⁰ 46.43¹) and Natural regrowth forest
(Latitude N07⁰ 15.03¹, Longitude E005⁰02.39¹). Aponmu in
Ondo State, Nigeria. There are two distinct geological regions in
the study area. First, is the region of sedimentary rocks in the
southern part (i.e Idanre and Ore sites), and secondly, the region
of Pre-Cambrian Basement Complex rocks in the northern part
(i.e Aponmu and Owo sites), the basement complex is mainly of
the medium grained gneisses. These are strongly foliated rocks
frequently occurring as out crops. A small proportion of the area,
especially to the northeast, overlies the coarse grained granites
and gneisses, which are poor in dark ferromagnesian minerals
(Smyth and Montgomery, 1962). And the soils derived from the
Basement complex rocks are mostly well drained, with a medium
texture. The soils, classified as Ondo Association, are of high
agricultural value for both tree and arable crops.
The climate of the sites is of the lowland tropical rain forest
type, with distinct wet and dry seasons. In the southern part (i.e
Idanre and Ore sites), the mean monthly temperature is 27°C,
with a mean monthly range of 2°C, while mean relative humidity
is over seventy five percent. However, in the northern part (i.e
Aponmu and Owo sites), the mean monthly temperature and its
range are about 30°C and 6°C respectively. The mean monthly
relative humidity is less than seventy percent. In the southern
part, rain falls throughout the year, but the three months of
November, December and January may be relatively dry. The
mean annual total rainfall exceeds 2000 millimetres. However, in
the northern part, there is marked dry season from November to
March when little or no rain falls. The total annual rainfall in the
northern part, therefore, drops considerably to about 1800
millimetres.
The natural vegetation of the sites is of the high forest,
composed of many varieties of hardwood timber. The Taungya
sites were part of forest reserve formerly but now de-reserved.
Survey Method
Four taungya agroforestry sites and one natural regrowth
forest site were used in order to determine the floristic
composition, species diversity and soil physico-chemical
properties within each site. Two sample plots of 25 m x 25 m,
were mapped out in each site. A Taungya agroforest plantation
which was established in the year 2007 was used for the whole
assessment in each location. All plant species were identified on
the field to species level. Those that could not be identified on
the field were collected, labelled and brought to Ife Herbarium
for proper identification. The woody species were identified and
enumerated and their girths at breast height (GBH) cm were
measured using girthing tape.
Plant Parameter Measurements
The following parameters were measured in each site:
Plant species density, tree height, girth at breast height
(GBH), basal area, Shannon-Weiner diversity index H1, index of
species richness, and Simpson index of similarity.
Plant species density (ha-1
): Plant species density (ha-1
) was
calculated as the number of plant species per plot converted to
hectare using the formula below:
Plant species density (ha-1
) = x 10,000
………………………………………..... (1)
Where x = Number of plant species
Relative density: This was calculated using the formula below:
RD = x 100
……………………………………………………………………
……… (2)
Where x = number of plant species
Tree height: Tree height of each woody species within each
plot was measured using a graduated ranging pole.
Girth at breast height (GBH) and Basal area ( ):
Within each plot, woody plant girths were measured at breast
height (GBH) with a tape for trees that were 3m or more tall and
at mid-point for those less than 3m tall. The girth measurements
were used to calculate the basal area of each tree using the
formula below:
Basal area ( ) =
………………………………………………………………......
(3)
Where c = girth at breast height in meters
= constant value of 3.14
The basal area (m2 ha
-1) for each species and all the woody
species were calculated for each plot according to equation (3).
Shannon-Weiner diversity index H1: It was calculated
using equation (4):
Where
H1 = Shannon-Weiner diversity index
International Journal of Scientific and Research Publications, Volume 4, Issue 3, March 2014 3
ISSN 2250-3153
www.ijsrp.org
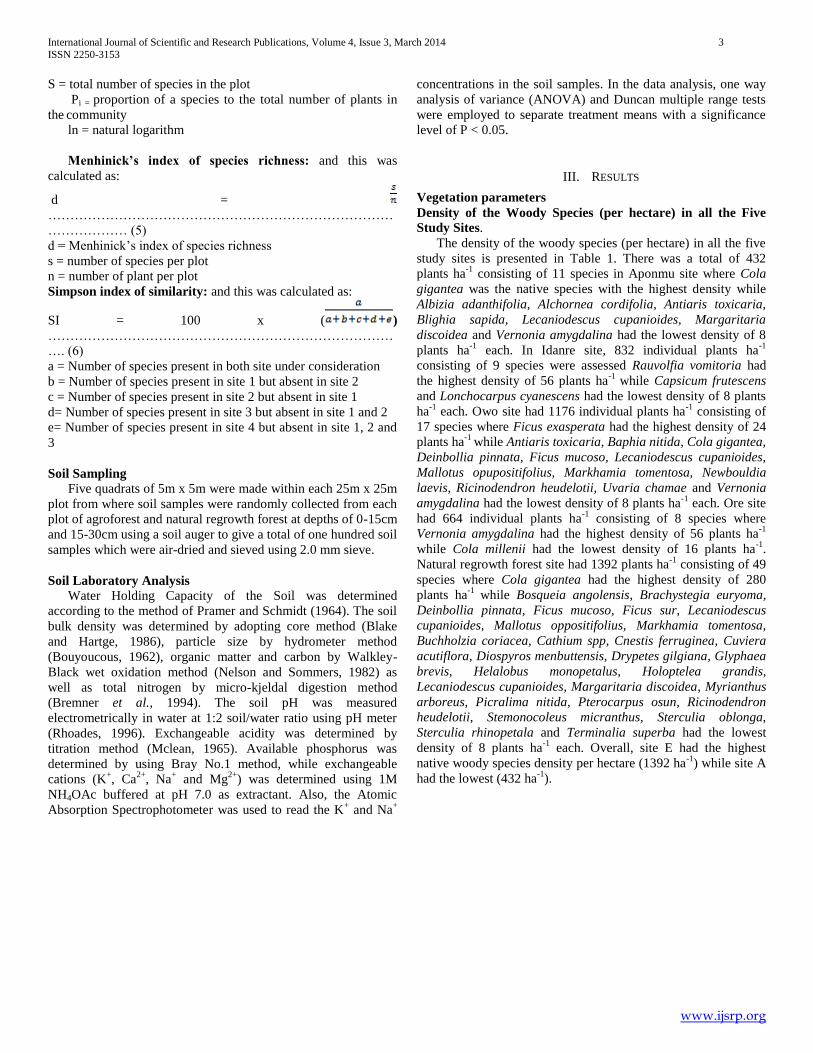
S = total number of species in the plot
Pi = proportion of a species to the total number of plants in
the community
ln = natural logarithm
Menhinick’s index of species richness: and this was
calculated as:
d =
……………………………………………………………………
……………… (5)
d = Menhinick’s index of species richness
s = number of species per plot
n = number of plant per plot
Simpson index of similarity: and this was calculated as:
SI = 100 x ( )
……………………………………………………………………
…. (6)
a = Number of species present in both site under consideration
b = Number of species present in site 1 but absent in site 2
c = Number of species present in site 2 but absent in site 1
d= Number of species present in site 3 but absent in site 1 and 2
e= Number of species present in site 4 but absent in site 1, 2 and
3
Soil Sampling
Five quadrats of 5m x 5m were made within each 25m x 25m
plot from where soil samples were randomly collected from each
plot of agroforest and natural regrowth forest at depths of 0-15cm
and 15-30cm using a soil auger to give a total of one hundred soil
samples which were air-dried and sieved using 2.0 mm sieve.
Soil Laboratory Analysis Water Holding Capacity of the Soil was determined
according to the method of Pramer and Schmidt (1964). The soil
bulk density was determined by adopting core method (Blake
and Hartge, 1986), particle size by hydrometer method
(Bouyoucous, 1962), organic matter and carbon by Walkley-
Black wet oxidation method (Nelson and Sommers, 1982) as
well as total nitrogen by micro-kjeldal digestion method
(Bremner et al., 1994). The soil pH was measured
electrometrically in water at 1:2 soil/water ratio using pH meter
(Rhoades, 1996). Exchangeable acidity was determined by
titration method (Mclean, 1965). Available phosphorus was
determined by using Bray No.1 method, while exchangeable
cations (K+, Ca
2+, Na
+ and Mg
2+) was determined using 1M
NH4OAc buffered at pH 7.0 as extractant. Also, the Atomic
Absorption Spectrophotometer was used to read the K+ and Na
+
concentrations in the soil samples. In the data analysis, one way
analysis of variance (ANOVA) and Duncan multiple range tests
were employed to separate treatment means with a significance
level of P < 0.05.
III. RESULTS
Vegetation parameters
Density of the Woody Species (per hectare) in all the Five
Study Sites.
The density of the woody species (per hectare) in all the five
study sites is presented in Table 1. There was a total of 432
plants ha-1
consisting of 11 species in Aponmu site where Cola
gigantea was the native species with the highest density while
Albizia adanthifolia, Alchornea cordifolia, Antiaris toxicaria,
Blighia sapida, Lecaniodescus cupanioides, Margaritaria
discoidea and Vernonia amygdalina had the lowest density of 8
plants ha-1
each. In Idanre site, 832 individual plants ha-1
consisting of 9 species were assessed Rauvolfia vomitoria had
the highest density of 56 plants ha-1
while Capsicum frutescens
and Lonchocarpus cyanescens had the lowest density of 8 plants
ha-1
each. Owo site had 1176 individual plants ha-1
consisting of
17 species where Ficus exasperata had the highest density of 24
plants ha-1
while Antiaris toxicaria, Baphia nitida, Cola gigantea,
Deinbollia pinnata, Ficus mucoso, Lecaniodescus cupanioides,
Mallotus opupositifolius, Markhamia tomentosa, Newbouldia
laevis, Ricinodendron heudelotii, Uvaria chamae and Vernonia
amygdalina had the lowest density of 8 plants ha-1
each. Ore site
had 664 individual plants ha-1
consisting of 8 species where
Vernonia amygdalina had the highest density of 56 plants ha-1
while Cola millenii had the lowest density of 16 plants ha-1
.
Natural regrowth forest site had 1392 plants ha-1
consisting of 49
species where Cola gigantea had the highest density of 280
plants ha-1
while Bosqueia angolensis, Brachystegia euryoma,
Deinbollia pinnata, Ficus mucoso, Ficus sur, Lecaniodescus
cupanioides, Mallotus oppositifolius, Markhamia tomentosa,
Buchholzia coriacea, Cathium spp, Cnestis ferruginea, Cuviera
acutiflora, Diospyros menbuttensis, Drypetes gilgiana, Glyphaea
brevis, Helalobus monopetalus, Holoptelea grandis,
Lecaniodescus cupanioides, Margaritaria discoidea, Myrianthus
arboreus, Picralima nitida, Pterocarpus osun, Ricinodendron
heudelotii, Stemonocoleus micranthus, Sterculia oblonga,
Sterculia rhinopetala and Terminalia superba had the lowest
density of 8 plants ha-1
each. Overall, site E had the highest
native woody species density per hectare (1392 ha-1
) while site A
had the lowest (432 ha-1
).
International Journal of Scientific and Research Publications, Volume 4, Issue 3, March 2014 4
ISSN 2250-3153
www.ijsrp.org
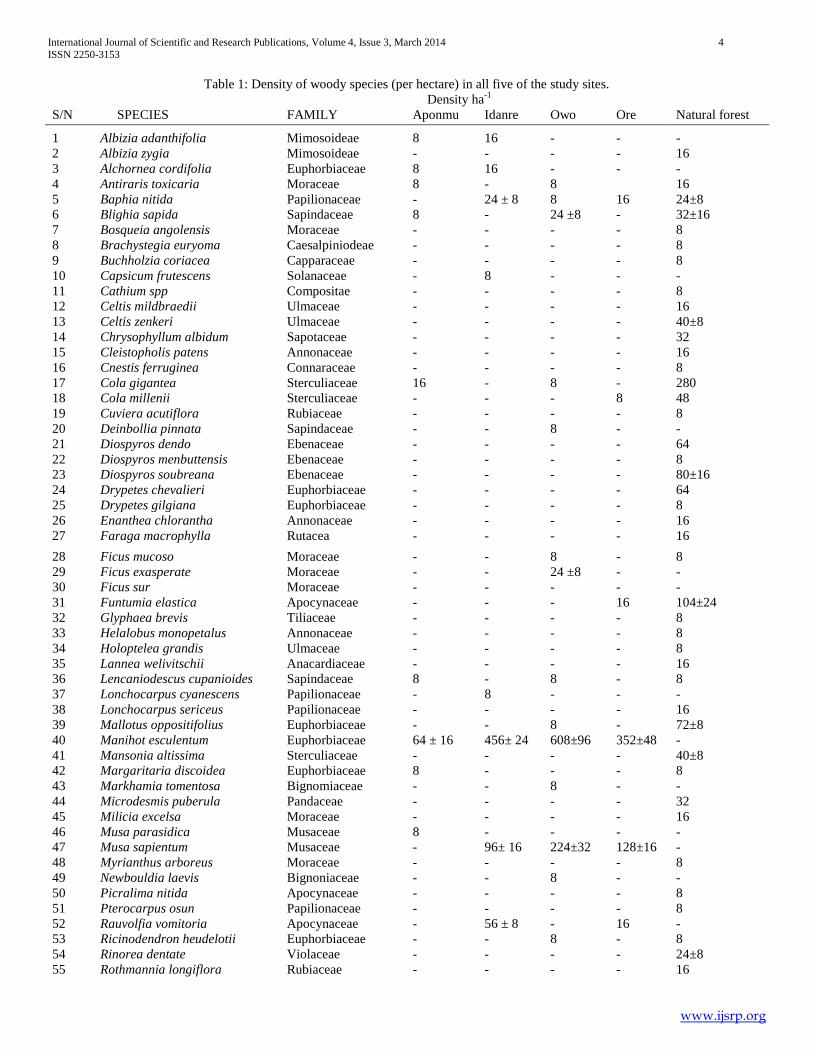
Table 1: Density of woody species (per hectare) in all five of the study sites.
Density ha-1
S/N SPECIES FAMILY Aponmu Idanre Owo Ore Natural forest
1 Albizia adanthifolia Mimosoideae 8 16 - - -
2 Albizia zygia Mimosoideae - - - - 16
3 Alchornea cordifolia Euphorbiaceae 8 16 - - -
4 Antiraris toxicaria Moraceae 8 - 8 16
5 Baphia nitida Papilionaceae - 24 ± 8 8 16 24±8
6 Blighia sapida Sapindaceae 8 - 24 ±8 - 32±16
7 Bosqueia angolensis Moraceae - - - - 8
8 Brachystegia euryoma Caesalpiniodeae - - - - 8
9 Buchholzia coriacea Capparaceae - - - - 8
10 Capsicum frutescens Solanaceae - 8 - - -
11 Cathium spp Compositae - - - - 8
12 Celtis mildbraedii Ulmaceae - - - - 16
13 Celtis zenkeri Ulmaceae - - - - 40±8
14 Chrysophyllum albidum Sapotaceae - - - - 32
15 Cleistopholis patens Annonaceae - - - - 16
16 Cnestis ferruginea Connaraceae - - - - 8
17 Cola gigantea Sterculiaceae 16 - 8 - 280
18 Cola millenii Sterculiaceae - - - 8 48
19 Cuviera acutiflora Rubiaceae - - - - 8
20 Deinbollia pinnata Sapindaceae - - 8 - -
21 Diospyros dendo Ebenaceae - - - - 64
22 Diospyros menbuttensis Ebenaceae - - - - 8
23 Diospyros soubreana Ebenaceae - - - - 80±16
24 Drypetes chevalieri Euphorbiaceae - - - - 64
25 Drypetes gilgiana Euphorbiaceae - - - - 8
26 Enanthea chlorantha Annonaceae - - - - 16
27 Faraga macrophylla Rutacea - - - - 16
28 Ficus mucoso Moraceae - - 8 - 8
29 Ficus exasperate Moraceae - - 24 ±8 - -
30 Ficus sur Moraceae - - - - -
31 Funtumia elastica Apocynaceae - - - 16 104±24
32 Glyphaea brevis Tiliaceae - - - - 8
33 Helalobus monopetalus Annonaceae - - - - 8
34 Holoptelea grandis Ulmaceae - - - - 8
35 Lannea welivitschii Anacardiaceae - - - - 16
36 Lencaniodescus cupanioides Sapindaceae 8 - 8 - 8
37 Lonchocarpus cyanescens Papilionaceae - 8 - - -
38 Lonchocarpus sericeus Papilionaceae - - - - 16
39 Mallotus oppositifolius Euphorbiaceae - - 8 - 72±8
40 Manihot esculentum Euphorbiaceae 64 ± 16 456± 24 608±96 352±48 -
41 Mansonia altissima Sterculiaceae - - - - 40±8
42 Margaritaria discoidea Euphorbiaceae 8 - - - 8
43 Markhamia tomentosa Bignomiaceae - - 8 - -
44 Microdesmis puberula Pandaceae - - - - 32
45 Milicia excelsa Moraceae - - - - 16
46 Musa parasidica Musaceae 8 - - - -
47 Musa sapientum Musaceae - 96± 16 224±32 128±16 -
48 Myrianthus arboreus Moraceae - - - - 8
49 Newbouldia laevis Bignoniaceae - - 8 - -
50 Picralima nitida Apocynaceae - - - - 8
51 Pterocarpus osun Papilionaceae - - - - 8
52 Rauvolfia vomitoria Apocynaceae - 56 ± 8 - 16 -
53 Ricinodendron heudelotii Euphorbiaceae - - 8 - 8
54 Rinorea dentate Violaceae - - - - 24±8
55 Rothmannia longiflora Rubiaceae - - - - 16

International Journal of Scientific and Research Publications, Volume 4, Issue 3, March 2014 5
ISSN 2250-3153
www.ijsrp.org
56 Sorindeia warneckei Anacardiaceae - - - - 24
57 Stemonocoleus micranthus Caesalpinioideae - - - - 8
58 Sterculia oblonga Sterculiaceae - - - - 8
59 Sterculia rhinopetala Sterculiaceae - - - - 8
60 Strombosia pustulata Olacaceae - - - - 72±24
61 Tectona grandis Verbenaceae 288 ± 32 152± 24 200±24 72±24 -
62 Terminalia superba Combretaceae - - - - 8
63 Trichilia prieuriaria Meliaceae - - - - 24
64 Uvaria chamae Annonaceae - - 8 - -
65 Vernonia amygdalina Asteraceae 8 - 8 56±24 -
Total 432 832 1176 664 1392
* ± Standard Error.
International Journal of Scientific and Research Publications, Volume 4, Issue 3, March 2014 6
ISSN 2250-3153
www.ijsrp.org
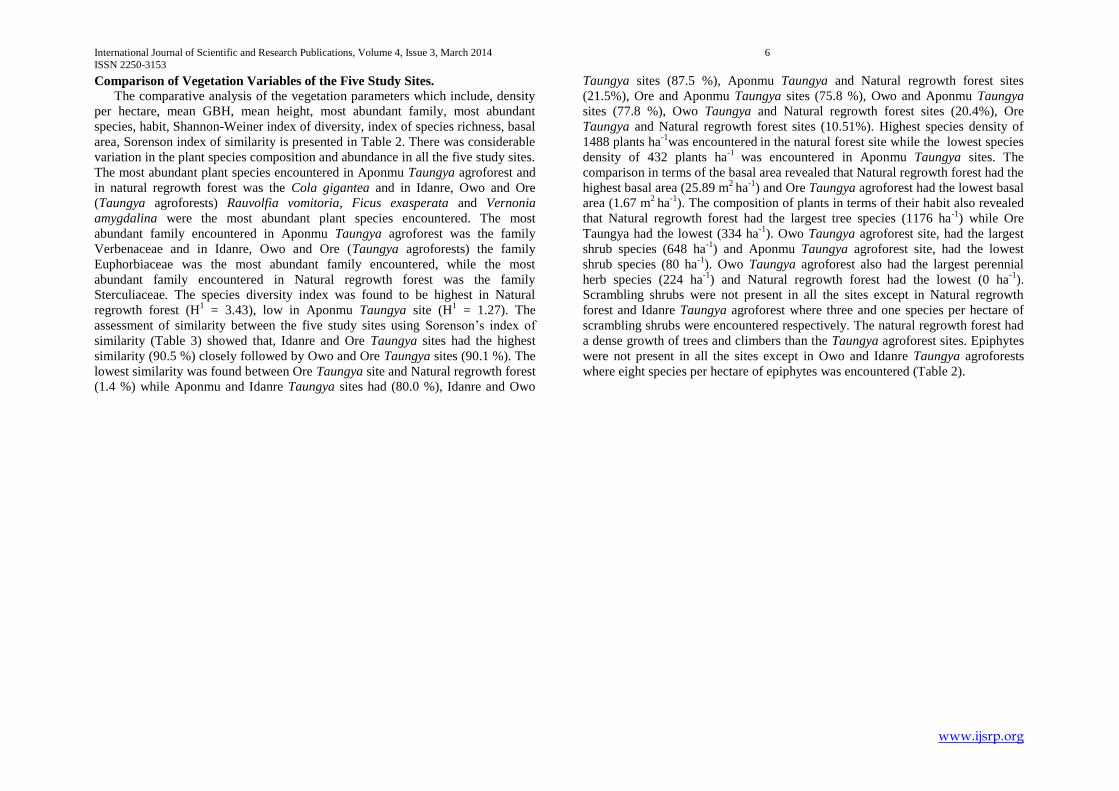
Comparison of Vegetation Variables of the Five Study Sites.
The comparative analysis of the vegetation parameters which include, density
per hectare, mean GBH, mean height, most abundant family, most abundant
species, habit, Shannon-Weiner index of diversity, index of species richness, basal
area, Sorenson index of similarity is presented in Table 2. There was considerable
variation in the plant species composition and abundance in all the five study sites.
The most abundant plant species encountered in Aponmu Taungya agroforest and
in natural regrowth forest was the Cola gigantea and in Idanre, Owo and Ore
(Taungya agroforests) Rauvolfia vomitoria, Ficus exasperata and Vernonia
amygdalina were the most abundant plant species encountered. The most
abundant family encountered in Aponmu Taungya agroforest was the family
Verbenaceae and in Idanre, Owo and Ore (Taungya agroforests) the family
Euphorbiaceae was the most abundant family encountered, while the most
abundant family encountered in Natural regrowth forest was the family
Sterculiaceae. The species diversity index was found to be highest in Natural
regrowth forest (H1 = 3.43), low in Aponmu Taungya site (H
1 = 1.27). The
assessment of similarity between the five study sites using Sorenson’s index of
similarity (Table 3) showed that, Idanre and Ore Taungya sites had the highest
similarity (90.5 %) closely followed by Owo and Ore Taungya sites (90.1 %). The
lowest similarity was found between Ore Taungya site and Natural regrowth forest
(1.4 %) while Aponmu and Idanre Taungya sites had (80.0 %), Idanre and Owo
Taungya sites (87.5 %), Aponmu Taungya and Natural regrowth forest sites
(21.5%), Ore and Aponmu Taungya sites (75.8 %), Owo and Aponmu Taungya
sites (77.8 %), Owo Taungya and Natural regrowth forest sites (20.4%), Ore
Taungya and Natural regrowth forest sites (10.51%). Highest species density of
1488 plants ha-1
was encountered in the natural forest site while the lowest species
density of 432 plants ha-1
was encountered in Aponmu Taungya sites. The
comparison in terms of the basal area revealed that Natural regrowth forest had the
highest basal area (25.89 m2
ha-1
) and Ore Taungya agroforest had the lowest basal
area (1.67 m2
ha-1
). The composition of plants in terms of their habit also revealed
that Natural regrowth forest had the largest tree species (1176 ha-1
) while Ore
Taungya had the lowest (334 ha-1
). Owo Taungya agroforest site, had the largest
shrub species (648 ha-1
) and Aponmu Taungya agroforest site, had the lowest
shrub species (80 ha-1
). Owo Taungya agroforest also had the largest perennial
herb species (224 ha-1
) and Natural regrowth forest had the lowest (0 ha-1
).
Scrambling shrubs were not present in all the sites except in Natural regrowth
forest and Idanre Taungya agroforest where three and one species per hectare of
scrambling shrubs were encountered respectively. The natural regrowth forest had
a dense growth of trees and climbers than the Taungya agroforest sites. Epiphytes
were not present in all the sites except in Owo and Idanre Taungya agroforests
where eight species per hectare of epiphytes was encountered (Table 2).

International Journal of Scientific and Research Publications, Volume 4, Issue 3, March 2014 7
ISSN 2250-3153
www.ijsrp.org
Table 2. Summary of the vegetation comparing the five study sites
SPECIES VARIABLES APONMU IDANRE OWO ORE NATURAL
REGROWTH
FOREST
TOTAL
Number of family 9 10 11 7 28 62
Number of species 11 11 19 8 54 98
Density (ha-1
) 432 848 1192 664 1488 4624
Mean basal area 10.44 3.23 9.07 1.67 25.89 50.29
Total mean GBH 234.6 120.5 414.97 80.83 1241.1 2029
Total mean height 53.3 37.7 81.3 37.18 405.3 614.78
Most abundant family Verbenaceae Euphorbiaceae Euphorbiaceae Euphorbiaceae Sterculiaceae
Most abundant native woody
species
Cola gigantea Rauvolfia
vomitoria
Ficus exasperate Vernonia
amygdalina
Cola gigantea
HABIT DESCRIPTION TOTAL
Tree 334 168 312 112 1176 2112
Shrub 80 560 648 424 192 1904
Perennial herb 8 96 224 128 0 456
Scrambling shrub 0 8 0 0 24 32
Epiphyte 0 8 8 0 0 16
Climber 0 8 0 0 96 104
Shannon-Weiner 1.26623 1.49451 1.58448 1.42582 3.4326
International Journal of Scientific and Research Publications, Volume 4, Issue 3, March 2014
8
ISSN 2250-3153
www.ijsrp.org
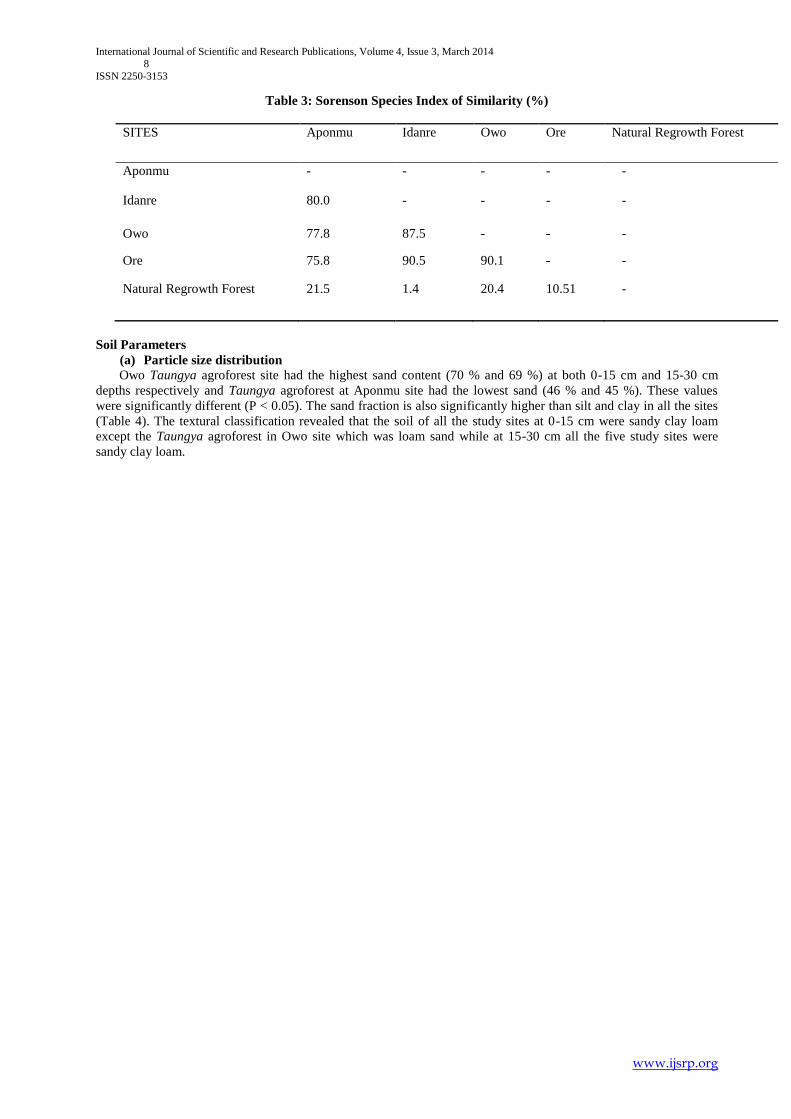
Table 3: Sorenson Species Index of Similarity (%)
SITES Aponmu Idanre Owo Ore Natural Regrowth Forest
Aponmu - - - - -
Idanre 80.0 - - - -
Owo 77.8 87.5 - - -
Ore 75.8 90.5 90.1 - -
Natural Regrowth Forest 21.5 1.4 20.4 10.51 -
Soil Parameters
(a) Particle size distribution Owo Taungya agroforest site had the highest sand content (70 % and 69 %) at both 0-15 cm and 15-30 cm
depths respectively and Taungya agroforest at Aponmu site had the lowest sand (46 % and 45 %). These values
were significantly different (P < 0.05). The sand fraction is also significantly higher than silt and clay in all the sites
(Table 4). The textural classification revealed that the soil of all the study sites at 0-15 cm were sandy clay loam
except the Taungya agroforest in Owo site which was loam sand while at 15-30 cm all the five study sites were
sandy clay loam.

International Journal of Scientific and Research Publications, Volume 4, Issue 3, March 2014 9
ISSN 2250-3153
www.ijsrp.org
Table 4: Particle size distribution of the soil in all the sites under consideration
0-15 cm depth 15-30 cm depth
Land use type Sand % Silt % Clay % Textural Class Sand
%
Silt
%
Clay
%
Textural Class
Natural regrowth forest (NRF) 64d
21c 15
b Sandy clay loam 62
c 20
c 19
c Sandy clay loam
Taungya Agroforest Idanre (TID) 52b
17b
31d
Sandy clay loam 50b
18b
20c
Sandy clay loam
Taungya Agroforest Ore (TOR) 62c
15a
23c
Sandy clay loam 61c
16a 24
d Sandy clay loam
Taungya Agroforest Owo (TOW) 70e
19bc
11a
Loam sand 69d
20c
10a
Sandy clay loam
Taungya Agroforest Aponmu (TAP) 46a
39d
15b
Sandy clay loam 45a
40d
16b
Sandy clay loam
*Values followed by the same letter in the same column are not significantly different at P < 0.05 Level according to Duncan multiple range test.
International Journal of Scientific and Research Publications, Volume 4, Issue 3, March 2014
10
ISSN 2250-3153
www.ijsrp.org
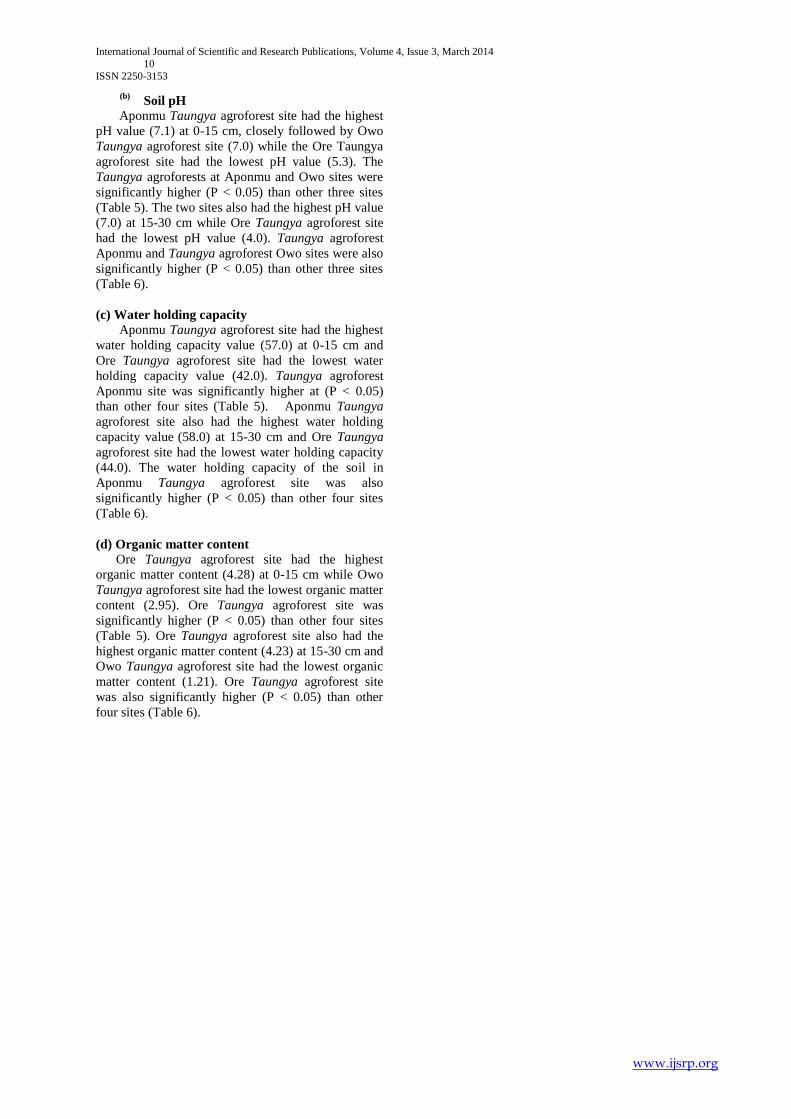
(b) Soil pH
Aponmu Taungya agroforest site had the highest
pH value (7.1) at 0-15 cm, closely followed by Owo
Taungya agroforest site (7.0) while the Ore Taungya
agroforest site had the lowest pH value (5.3). The
Taungya agroforests at Aponmu and Owo sites were
significantly higher (P < 0.05) than other three sites
(Table 5). The two sites also had the highest pH value
(7.0) at 15-30 cm while Ore Taungya agroforest site
had the lowest pH value (4.0). Taungya agroforest
Aponmu and Taungya agroforest Owo sites were also
significantly higher (P < 0.05) than other three sites
(Table 6).
(c) Water holding capacity
Aponmu Taungya agroforest site had the highest
water holding capacity value (57.0) at 0-15 cm and
Ore Taungya agroforest site had the lowest water
holding capacity value (42.0). Taungya agroforest
Aponmu site was significantly higher at (P < 0.05)
than other four sites (Table 5). Aponmu Taungya
agroforest site also had the highest water holding
capacity value (58.0) at 15-30 cm and Ore Taungya
agroforest site had the lowest water holding capacity
(44.0). The water holding capacity of the soil in
Aponmu Taungya agroforest site was also
significantly higher (P < 0.05) than other four sites
(Table 6).
(d) Organic matter content
Ore Taungya agroforest site had the highest
organic matter content (4.28) at 0-15 cm while Owo
Taungya agroforest site had the lowest organic matter
content (2.95). Ore Taungya agroforest site was
significantly higher (P < 0.05) than other four sites
(Table 5). Ore Taungya agroforest site also had the
highest organic matter content (4.23) at 15-30 cm and
Owo Taungya agroforest site had the lowest organic
matter content (1.21). Ore Taungya agroforest site
was also significantly higher (P < 0.05) than other
four sites (Table 6).
International Journal of Scientific and Research Publications, Volume 4, Issue 3, March 2014 11
ISSN 2250-3153
www.ijsrp.org
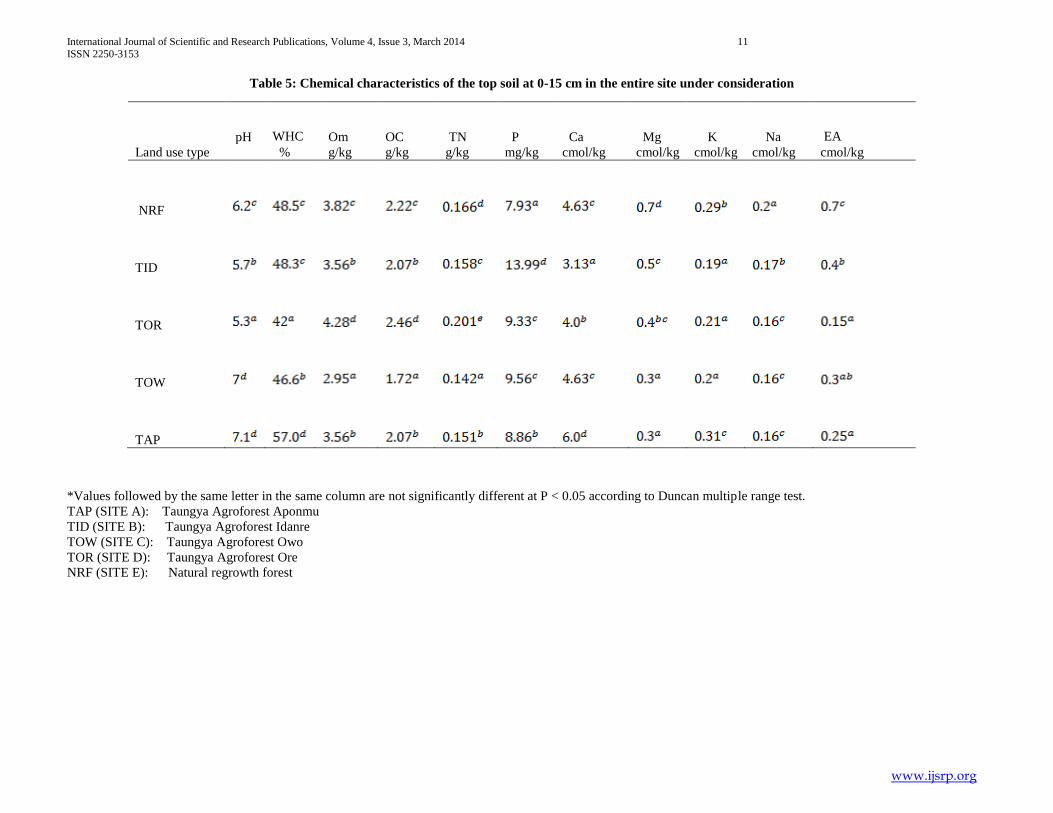
Table 5: Chemical characteristics of the top soil at 0-15 cm in the entire site under consideration
*Values followed by the same letter in the same column are not significantly different at P < 0.05 according to Duncan multiple range test.
TAP (SITE A): Taungya Agroforest Aponmu
TID (SITE B): Taungya Agroforest Idanre
TOW (SITE C): Taungya Agroforest Owo
TOR (SITE D): Taungya Agroforest Ore
NRF (SITE E): Natural regrowth forest
Land use type
pH
WHC Om
g/kg
OC
g/kg
TN
g/kg
P
mg/kg
Ca
cmol/kg
Mg
cmol/kg
K
cmol/kg
Na
cmol/kg
EA
% cmol/kg
NRF
TID
TOR
TOW
TAP
International Journal of Scientific and Research Publications, Volume 4, Issue 3, March 2014 12
ISSN 2250-3153
www.ijsrp.org
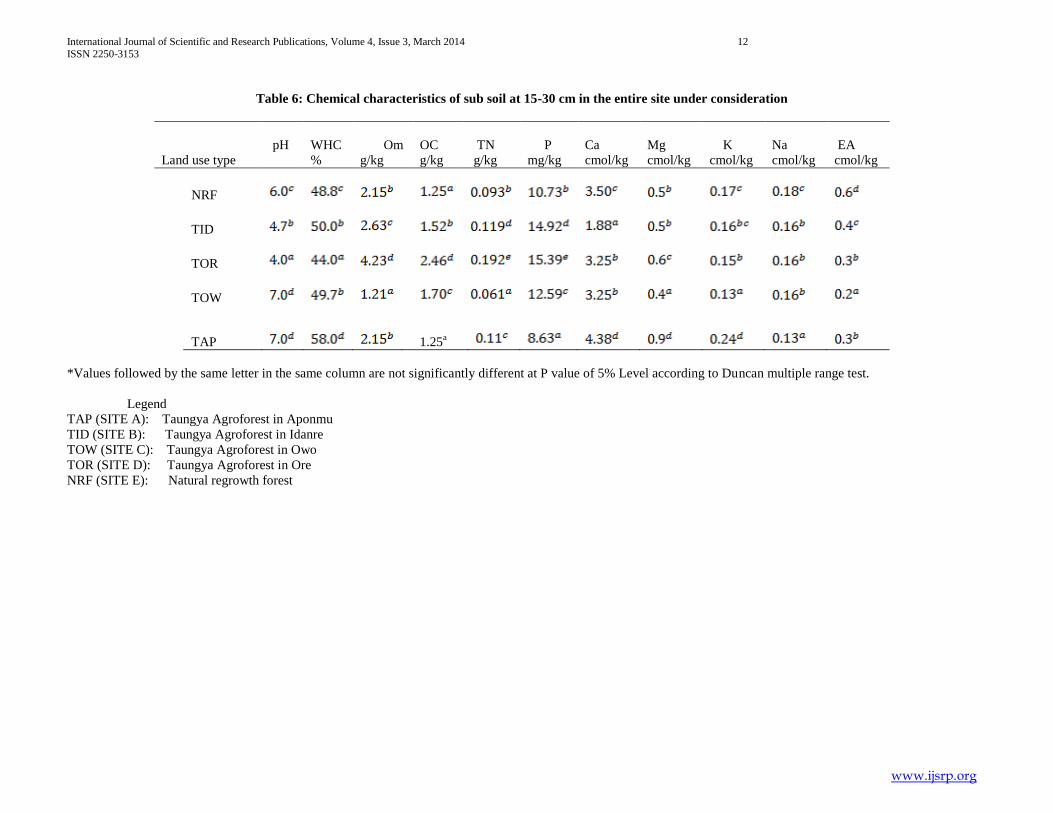
Table 6: Chemical characteristics of sub soil at 15-30 cm in the entire site under consideration
Land use type
pH
WHC
%
Om
g/kg
OC
g/kg
TN
g/kg
P
mg/kg
Ca
cmol/kg
Mg
cmol/kg
K
cmol/kg
Na
cmol/kg
EA
cmol/kg
NRF
TID
TOR
TOW
TAP
1.25a
*Values followed by the same letter in the same column are not significantly different at P value of 5% Level according to Duncan multiple range test.
Legend
TAP (SITE A): Taungya Agroforest in Aponmu
TID (SITE B): Taungya Agroforest in Idanre
TOW (SITE C): Taungya Agroforest in Owo
TOR (SITE D): Taungya Agroforest in Ore
NRF (SITE E): Natural regrowth forest

International Journal of Scientific and Research Publications, Volume 4, Issue 3, March 2014 13
ISSN 2250-3153
www.ijsrp.org
IV. DISCUSSION
Floristic Composition Studies on the floristic composition and structure are
instrumental in sustainability of forest since they play a major
role in the conservation of plant species and in management of
ecosystem as a whole (Tilman 1988; Ssegawa and Nkuutu,
2006). Measurement of species diversity is an indicator that
helps to determine the well being of an ecological system
(Magurran, 1988). Shannon-Weiner index of species diversity
indices recorded, revealed that natural regrowth forest had the
highest index (3.43), coupled with highest number of
individual species (54) and families (28). The value of
Shannon-Weiner index (H) of diversity is normally found to
fall between 1.5 and 3.5, if the value is close to five it implies
high diversity of a particular species (Michael, 1984;
Mittermeier et al., 1998). Comparatively, Owo agroforest site
had the highest species diversity index (1.58) among the
taungya sites, closely followed by Idanre (1.49) and Ore
(1.43), while the least was Aponmu agroforest site (1.27). The
implication of this is that the natural regrowth forest is more
diverse, than all the taungya sites investigated. Generally in
terms of plant species density in all the sites examined there is
variation in the plant species distribution. The result of the
study revealed that natural regrowth forest had the highest
native woody plant species density, when compared with the
agroforest sites.
The density of the native woody species (Trees and
Shrubs) varied considerably in the different sites under
consideration; the shrubs were significantly high in most of
the Taungya sites compared to the natural regrowth forest.
Perennial herbs were encountered in the four Taungya
agroforest sites, but completely absent in the Natural regrowth
forest. This was in agreement with White (1983) who noted
that, in a forest the ground layer is often sparse or absent;
grasses are absent and if present are localized or
inconspicuous. Scrambling shrubs were only present in both
natural regrowth forest and Idanre Taungya agroforest site.
The natural regrowth forest had a dense growth of trees and
climbers than the Taungya agroforest sites. Continuous
clearing of vegetation for arable and tree crops had caused
reduction in plant diversity in the Taungya agroforest sites
because it reduces the regeneration of woody trees and
climbers. The most abundant native plant species encountered
in Aponmu Taungya agroforest site was Cola gigantea, while
other economic species such as Albizia adanthifolia, Antiaris
toxicaria, Lecaniodescus cupanioides and Blighia sapida were
also present but in smaller numbers. This supports the position
of Michon and de Foresta (1995) that agroforests help to
conserve biodiversity and this is the assurance of agroforest
production and reproducibility. The success recorded in
Aponmu Taungya agroforest site was also enhanced by
effective monitoring of the forest by the forest officers, due to
the proximity of the forest to the state capital. In all the
Taungya agroforest sites examined, Tectona grandis were the
dominant species encountered and this corroborates Adekunle
and Bakare (2004) who reported that the only species most of
the respondents in Ondo State are willing to plant is Tectona
grandis since, it is a fast growing exotic species with
commercial and timber values, and this indicated that Teak
plantation strive well when it is planted with food crops on the
same site. In Idanre, Owo and Ore Taungya agroforest sites,
agricultural crops such as Manihot esculentum was the most
abundant plant species encountered this is because farmers are
more interested in their agricultural crops rather than the
government owned trees and native woody species. This
corroborates Michon and de Foresta (1991) that simple
agroforestry (i.e Taungya agroforests) is often dominated by
agricultural crops like maize, cassava, rice, cocoa, coffee, and
hence are of more interest to the agriculturists. Manihot spp
happens to be the most planted agricultural crop in these areas
due to its high yield and demand for Manihot products such as
Gari, Fufu and others. The most abundant tree species
encountered in the Natural regrowth forest were tree species
(Cola gigantea, Funtumia elastica, Diospyros species) in
Sterculiaceae, Apocynaceae and Ebenaceae families. These
three families were among the most abundant families
encountered by Adekunle (2006) in Shasha forest reserve that
fall within lowland rainforest ecosystem of Nigeria, just like
the sites investigated here. Cola gigantea and Funtumia
elastica have characteristics for conspicuous seed and easy
dispersal by wind. This must have enhanced their spread in the
areas investigated.
Overall result for the girth size distribution showed that
natural regrowth forest had the highest number of woody
species per hectare in the largest girth size (81 cm and above)
and followed by Aponmu taungya agroforestry site. The other
three (3) agroforestry sites had no woody species in the largest
girth size. The implication of this is that most of the big trees
might have been selectively removed by the farmers which are
evidenced by the presence of many plants in the small girth
sizes dominated by non-timber species. This is an indication
that the original vegetation of the study sites might have been
altered by some illegal activities of forest utilization and it
also shows that the trees are generally immature and far below
stipulated minimum girth approved for exploitation by law. It
is also an indication that the forest plots are degraded.
Sorenson’s index of similarity however revealed that the
taungya sites were not significantly different from one
another. This may be due to the fact that they were all
established in the same year, and they had the same tree-crop
combination. However, they were significantly different from
the Natural regrowth forest site. This may be attributed to the
intentional removal of other plant species considered to be
weeds by the farmers, since they were only paying attention to
the native woody species rather than their arable crops.
Soil Properties The species composition can have significant effect on
soil physical properties, which in turn can reflect the soil
fertility of a given area. The particle size distribution of the
soil in all the sites under consideration revealed that the soils
were sandy clay loam in all the sites at both depths except
Owo Taungya site which was loam sand at 0-15 cm. This
agrees with Oloyede (2008) that depending upon the pre-
existing soil conditions, tree species, rate of growth, time since
establishment and plantations on agricultural land have the
International Journal of Scientific and Research Publications, Volume 4, Issue 3, March 2014 14
ISSN 2250-3153
www.ijsrp.org
potential to change soil properties, either positively or
negatively or many have no effect at all.
The chemical properties of the soil in all the sites under
consideration showed that, the pH in all the sites examined
ranged from slightly acidic to neutral (6.0 - 7.1) and therefore
good for plant growth and development. Although soil pH is
often considered as the master variable of soil, its importance
in nutrition management cannot be understated. The soil pH is
comparatively higher in Aponmu and Owo sites compared to
the other three sites. This may be due to leaching of the base
elements. Juo and Manu (1996) found that growing vegetation
tend to decrease soil pH, with low nutrient stocks. Brandy and
Weil (1999) have reported that soil pH is strongly influenced
by the nature of the vegetation and the amount of organic
matter in the soil especially in the tropical environment.
Natural regrowth forest had the highest exchangeable acidity
value, coupled with highest sodium and magnesium content at
both 0-15 cm and 15-30 cm soil depth compared to the other
agroforest sites. This might not be unconnected with the fact
that Tectona grandis is not a nitrogen fixing tree and instead
demand for available nutrients competitively with the planted
crops. It is reported that these variation in acidity may be
explained from differences in the degree of neutralization of
the soil exchange complex (Rhoades and Binkley, 1996).
Significantly higher values of organic matter coupled with
organic carbon and total nitrogen were recorded in Ore
agroforest site and relatively low in Owo taungya site at both
soil layers compared to other sites. This observation could be
attributed to the role of agroforest inconsistent addition of
organic matter to the soil through dead and decaying roots.
Available phosphorus was significantly higher in Idanre and
Ore at both soil surface layers compared to the other sites.
This might not be unconnected with the presence of
phosphorus fixing species such as Alchornea cordifolia in
these two sites. This is in conformity with the reports of Kang
et al. (1984) that some species such as Alchornea cordifolia
and Gliricidia sepium have high phosphorus content and have
the potential of fixing phosphorus when present in the soil.
Water holding capacity was significantly low in Ore taungya
site compared to the other sites at both soil layers. This might
be as a result of the textural class which are not significantly
different in both depths coupled with high organic matter.
Overall, the result of soil properties in all the sites examined
showed that there is significant difference between the Natural
regrowth forest and the four taungya agroforest sites.
REFERENCES
[1] Adedire, M. O. (2005) Principle and Practice of Agroforestry in Nigeria. In: Strategies and modalities for the implementation of Agroforestry: Sub-component of the national special programme for food security (NSPFS) for project coordinating unit (PCU), Regional coordinators, State Facilitators and Other Support Officers. Lokoja, Kogi State, Nigeria. 23rd – 25th February.
[2] Adekunle, V. A. J. (2006). Conservation of Tree Species Diversity in Tropical Rainforest Ecosystem of Southwest Nigeria. Journal of Tropical Forest Science (Malaysia) 18(2): 91-101
[3] Adekunle, V. A. J. and Bakare, Y. (2004). Rural Livelihood Benefits from Participation in Taungya Agroforestry System in Ondo State
Nigeria. Journal of Small-Scale Forest Economic, Management and Policy 3(1): 131- 138.
[4] Awotoye, O. O., Adebola, S. I. and Matthew, O. J. (2013). The effects of land-use changes on soil properties in a humid tropical location; Little-Ose forest reserve, south-western Nigeria. Research Journal of Agricultural and Environmental Management 2(6): 176-182
[5] Blake, G. R. and Hartge, K. H. (1986). Bulk density. In: Klute A, editor. Methods of soil analysis. Part1. Physical and mineralogical methods. 2nd ed. Madison (WI): Am.Soc. Agron. p. 363-376.
[6] Bouyoucus, C. J. (1962) Hydrometer method improved for making particle size analysis of soil. Soil Sci. Soc. Proc. 26: 446-465
[7] Brady, N. C. and Weil, R. R. (1999) The nature and properties of soils 9th edition. Macmillian Publishing Company New York. 750 p.
[8] Bremer, E., Janzen, H. H. and Johnson, A. M. (1994). Sensitivity of total light fraction and mineralizable organic matter to management practices in a Lethbridge. J. Soil Sci., 74: 131-138.
[9] Brown, C. D. and Boutin, C. (2009) Linking past land use, recent disturbance and dispersal mechanism to forest composition. Biological Conservation 142(8): 1647-1656
[10] Dzwonko, Z. and Gawronski, S. (2002) Effect of litter removal on species richness and acidification of a mixed oak-pine woodland. Biological Conservation 106(3): 389-398
[11] Gachet, S., Leduc, A., Bergeron, Y., Nguyen-Xuan, T. and Tremblay, F. (2007) Understory vegetation of boreal tree plantations: Differences in relation to previous land use and natural forests. Forest Ecology and Management 242(1): 49-57
[12] Hardtle, W., von Oheimb, G. and Westphal, C. (2003) The effects of light and soil conditions on the species richness of the ground vegetation of deciduous forests in northern Germany (Schleswig-Holstein). Forest Ecology and Management 182(1-3): 327-338
[13] Henrik, H., Gaetan, D., Brigitte, B. and Christian, M. (2010). Negative or positive effects of plantation and intensive forestry on biodiversity: A matter of scale and perspective. Forestry Chronicles, 86 (3): 354-364.
[14] Jordan, C. F., Gajaseni, J. and Watanabe, H. (1992) Taungya: Forest Plantations with Agriculture in Southeast Asia (eds) CAB International, Wallingford, Oxon Ox 10 RDE
[15] Juo, A. S. R. and Manu, A. (1996). Nutrient effect on modification of shifting cultivation in West Africa. J. Agric., Ecosyst. Environ., 58: 49-60.
[16] Kang, B. T., Wilson, G. F. and Lawson, T. L. (1984). Alley cropping: a stable alternative to shifting cultivation. Ibadan, Nigeria: IITA, 22 pp.
[17] Lemenih, M., Gidyelew, T. and Teketay, D. (2004) Effects of canopy cover and understory environment of tree plantations on richness, density and size of colonizing woody species in southern Ethiopia. Forest Ecology and Management 194(1-3): 1-10
[18] Magurran, A. E. (1988) Ecological diversity & its measurement. Cambridge press, Cambridge. 179p.
[19] Mclean, E. O. (1965) Aluminium In: Methods of Soil Analysis (ed. Black, C. A.) 8 Agronomy No. 9, part 2. Amer. Soc. Agronomy, Madison, Wisconsin. pp 978-998
[20] Michael, F. (1984). Firewood or Hydropower: A case study of rate Rural Energy Markets in Tanzania. The Geographical Journal 1449: 29 – 38.
[21] Michon, G. and de Foresta, H. (1991) Agroforesteries indonesiennes: systems et approaches. [Indonesian agroforestries: systems and approaches]. Communication to the workshop which I sustainable forest management. Europ. Journal of Wood and Wood Products 58 (3): 196-201
[22] Michon, G. and de Foresta, H. (1995). The Indonesian agroforest model. In: Halladay, P. and Gilmour Gland, D. A (eds.) Conserving biodiversity outside protected areas: the role of traditional ecosystems. IUCN, Switzaland and Cambridge, UK.
[23] Mittermeier, R. A., Myers, N., Thomsen, J. B., da Fonseca, G. A. B. and Olivieri, S. (1998). Biodiversity hotspots and majour tropical wilderness areas: approaches to setting conservation priorities. Conservation Biology 12: 516-520.
[24] Nair, P. K. R. (1993). An introduction to agroforestry. Kluwer academic publishers. 499p
[25] Nelson, D. W. and Sommers, L. E. (1982). Total carbon, organic carbon and organic matter. In: Page, A. L., Miller, R. H. and Keeney, D. R.
International Journal of Scientific and Research Publications, Volume 4, Issue 3, March 2014 15
ISSN 2250-3153
www.ijsrp.org
(editors). Methods of soil analysis. Part 2. Chemical and microbiological properties. 2nd ed. Madison (WI): Am. Soc. Agron. p. 539–579.
[26] Oloyede, I. O. (2008). Afforestation and Reforestation: The Unilorin Experiment. A presentation at the high level technical workshop on afforestation and climate change in Africa. December 15 – 17, 2008. 23pp
[27] Pramer, D. E. and Schmidt, E. L. (1964). Experimental Soil Microbiology Burges publishing company Minneapolis, 15. Minnesota, USA. Sons Ltd. Beecles and London. pp. 31-32.
[28] Rhoades, C. and Binkley, D. (1996) Factors influencing decline in soil pH in Hawaiian Eucalyptus and Albizia plantations. Forest. Ecology Management. 80: 47 – 56.
[29] Rhoades, J. D. (1996). Salinity: Electrical Conductivity and Total Dissolved Solids. In: Methods of Soil Analysis, Part 3. Chemical Methods, Sparks, D. L. (Ed.). Soil Science Society of America, Madison, WI. USA. pp: 417-435
[30] Roche, L. (1993) Shifting cultivation and soil conservation in Africa: The practice of agri-silviculture in the tropics with special reference to Nigeria. Ecology Report Series No 5, UNESCO, Dakar, pp. 30-47.
[31] Smyth, A. J. and Montgomery, R. F. (1962). Soil and landuse in central western Nigeria, Ministry of Agriculture and Natural Resources Ibadan.
[32] Ssegawa, P. and Nkuutu D. N. (2006). Diversity of Vascular plants on Ssese Islands in Lake Victoria, central Uganda. African Journal of Ecology 44: 22-29.
[33] Tilman, D. (1988). Plant strategies and the dynamics and function of plant communities. Princeton University Press, Princeton, New Jersey, USA.
[34] White, F. (1983). The vegetation of Africa, a descriptive memoir to accompany the UNESCO/AETFAT/UNSO Vegetation Map of Africa (3 Plates, Northwestern Africa, Northeastern Africa, and Southern Africa, 1:5,000,000). UNESCO, Paris.
AUTHORS
First Author – Akinbisoye, O. S., Institute of Ecology and
Environmental Studies, Faculty of Science, Obafemi
Awolowo University, Ile-Ife, Osun State, Nigeria.
Second Author – Oke S. O., Department of Botany, Faculty
of Science, Obafemi Awolowo University, Ile-Ife, Osun State,
Nigeria.
Third Author – Adebola, S. I., Institute of Ecology and
Environmental Studies, Faculty of Science, Obafemi
Awolowo University, Ile-Ife, Osun State, Nigeria.
Fourth Author – Mokwenye, A. I., Institute of Ecology and
Environmental Studies, Faculty of Science, Obafemi
Awolowo University, Ile-Ife, Osun State, Nigeria.