influence of wave form on the rate of integrating … ·...
TRANSCRIPT

INFLUENCE OF WAVE FORM ON THE RATE OF INTEGRATINGINDUCTION METERS.
By E. B. Rosa, M. G. Lloyd, and C. E. Reid.
We g-ive in this paper the results obtained with five integrating
induction wattmeters, on which we have made a large number of
tests, although further work remains to be done. These results maytherefore be regarded as preliminary, illustrating the methods em-
ployed and the results obtained when changes are made in the waveform by altering the magnitude or phase of the harmonics present.
Two of the meters employed were sent to the Bureau of Standards
for test by the makers. The others were meters which we happened
to have in the laboratory when the tests were undertaken. The follow-
ing is a list of the meters:
No. 1, Stanley (magnetic suspension type), 50 amperes.
No. 2, Stanley (magnetic suspension type), 50 amperes.
No. 3, Fort Wayne, type "K," 50 amperes.
No. 4, General Electric (1902 House type), 25 amperes.
No. 5, Siemens & Halske, 25 amperes.
All the meters are made for 60 cycles, single phase. The first four
are American instruments; the last is of German make. Each meter
was tested at full load and at 110 volts, and at approximately unity
power factor.
In order to determine the effect on the rate of an induction meter
due to varying the wave form, it is necessary to eliminate carefully any
effects due to variation in the temperature of the meter or changes in
the frequency of current, or other alterations in the conditions of the
meter or circuit. In most cases the effect of a moderate distortion of
the wave is small, and unless all measurements are made with great
care the effects looked for ma}^ be masked by other effects or by errors
of measurement. The meters were tested alternately with current of
sine wave form and with a distorted wave, the distortion being
produced by adding a harmonic of three times the frequency
421

422 BULLETIN OF THE BUREAU OF STANDARDS. [vol.1, no. 3.
Phase 0°
Fig. 1.—Showing the resultant of combining the fundamental and harmonic of three times the
frequency and 25 per cent of the magnitude of the fundamental, giving first a peaked wave andsecond (when the phase of the harmonic is reversed) a flat or dimpled wave. Both fundamentaland harmonic are of sine-wave form.
Fig. 2.—Showing the resultant of a fundamental and a harmonic, as in fig, 1, except that the phase
of the harmonic has been shifted 30° by changing the coupling 5°.

, LLOYDREID •] EFFECT OF WAVE FORM ON WATTMETERS. 423
Fig. 3.—Showing the resultant of a fundamental and a harmonic as in fig. 1, except that the phase
of the harmonic has been shifted 60°.
Fig. 4.—Showing the resultant of a fundamental and a harmonic as in fig. 1, except that the phase of
the harmonic has been shifted 90° by changing the coupling 15°. The wave form for "peak " and"flat" are here alike, except that the steeper side is in advance in the "peak" and the moregradual slope is in advance on the " flat." " Peak " and "flat " are conventional terms, indicating
the phase of the harmonic. If the coupling were shifted 15° more, the " flat " curve would becomepeaked.

424 BULLETIN OF THE BUREAU OF STANDARDS. [vol. 1, no. 3.
of the fundamental, varying both the amplitude and phase of
this harmonic. This was done by means of an alternating cur-
rent generating set of three machines, two alternators and a direct
connected driving motor, one alternator having four poles and the
other twelve. The current from each machine is very nearly of sine
wave form, and tests were made of the meters alternately with the
fundamental only, and with the harmonic added. Three different
relative values and four different phases of the harmonic have been
employed. The three values of the harmonic are 10 per cent, 25 per
cent, and 50 per cent, respectively, of the value of the fundamental.
For example, since E—VE^^-\-E'^^^ in the first case the addition of
11 volts of the harmonic to 110 volts of the fundamental gives a
resultant of about 110.5 volts, the wave being more or less peaked
than a sine wave, according to the phase of the harmonic. In the
second case 108 volts of the fundamental plus 27 volts of the harmonic
gives a resultant of 111.3 volts. (The voltage in each case was
reduced to exactly 110 by resistance in series.) This resultant is
shown in figs. 1 to 4, where the 25 per cent harmonic is in different
phase in each of the four cases. This difference is produced by shift-
ing the coupling of one of the generators to the driving motor, 5*^,
10*", or 15'' in the coupling corresponding to 10*", 20°, or SO"" in the waveof the fundamental, and to SO"", 60*^, or 90° in the phase of the harmonic.
A shift of 30° in the coupling corresponds to 180° in the phase of the
harmonic, and is the same as reversing the phase by reversing the
connections at the terminals of the higher frequency generator. Thelatter is of course the more convenient, and was the usual method of
changing from what we call a flat to a peaked wave. The curves shownin figs. 1 to 4 have been frequently verified by drawing the resultant
waves by means of a curve tracer. This not only verifies the waveform, but serves to insure against errors in the connections.
The current, voltage, and power factor, as well as the temperature
and frequency, were maintained as nearly constant as possible during
a set of runs. A standard wattmeter which was calibrated by direct
currents using two potentiometers to measure simultaneously the cur-
rent and the voltage, was read by a telescope and scale. By means of
a carbon rheostat the deflection of this instrument was maintained
accurately constant while carrying alternating current during a set of
runs on the meters. The wattmeter is of the dynamometer type and
astatic. The fixed coils are stranded and wound on wooden spools, and
very little metal is used in the region of the coils. The movable coils
have very slight inductance, and every precaution is taken to avoid
errors due to eddy currents or wave form. The instrument, being

ROSA, LLOYD,REID. ] EFFECT OF WAVE FORM ON WATTMETERS. 425
carefully calibrated with direct current, is then correct for alternating
current.
Table I.—Determination of the Times of Revolution of the Disks of ThreeMeters.
RUN NO. 1, MAY 26, 1904.
Meter 1. Meter 2. Meter 3.
Interval be-tween 1st
andl5th con-tacts, 2d
and lethcon-tacts, etc.
Interval be- Interval beInterval Interval tween 1st Interval tween 1st
No. between between and 15th between and 15thTime. succes- Time. succes- contacts, Time. succes- contacts,
sive con- sive con- 2d and sive con- 2d andtacts. tacts. 16th con- tacts. 16th con-
tacts, etc. tacts, etc.
m. s. m. s. m. s.
1 1 5.301.55
45.961.60
45.701.30
2 6.851.55
47.561.68
47.001.31
3 8.401.65
49.241.57
48.311.32
4 10.051.61
50.811.61
49.631.37
5 11.661.64
52.421.63
51.001.30
6 13.301.52
54.051.54
52.301.30
7 14.821.63
55.591.66
53.601.37
8 16.451.60
57.251.65
54.971.33
9 18.051.67
58.901.60
56.301.30
10 19.721.58
1 0.501.55
57.601.40
11 21.3048.60
2.0548.25
59.0026.60
12 2 9.9032.20
50.3032.10
1 25.6039.88
13 42.1032.22
2 22.4032.10
2 5.4839.87
14 3 14.3232.33
54.5032.20
45.3539. 95
15 46.651.55
161. 35 3 26.701.65
160. 74 3 25.301.30
159.60
16 48.201.62
161. 35 28.351.60
160. 79 26.601.30
159. 60
17 49.821.59
161.42 29.951.59
160. 71 27.901.30
159.59
18 51.411.59
161.36 31.541.56
160.73 29.201.35
159.57
19 53.001.61
161. 34 33.101.68
160. 68 30.551.40
159.55
20 64.611.61
161. 31 34.781.60
160. 73 31.951.35
159.65
21 56.221.68
161.40 36.381.62
160. 79 33.301.33
159. 70
22 57.901.58
161. 45 38.001.60
160. 75 34.631.32
159. 66
23 59.481.55
161.43 39.601.59
160.70 35.951.40
159.65
24 4 1.031.59
161.31 41.191.61
160.69 37.351.33
159. 75
25 2.62 161.32 42.80 160. 75 38.68 159. 68
Mean time for lOOrevo- Mean tiiae for 100 Mean tirae for 120
lutions 161. 367 revolu tions 160. 733 revolu tions 159. 636
Time in seconds Time in secondsTime in seconds for for on e revolu- for on s revolu-
Or>P rpvnlntion 1. 6137 tion .
.
1. 6073 tion... 1. 3303
DETERMINATION OF THE RATE OF THE METERS AND THE FREQUENCY OFTHE CURRENT.
The rate of the meters was determined by means of a chronograph
and chronometer, record being made at the end of every revolution
of the disk or drum for the first ten revolutions at the beginning of a

426 BULLETIN OF THE BUEEAU OF STANDARDS. [vol. 1, NO. 3.
run and the last ten at the end of the run, and in addition once in ten
or twenty revolutions during the run. The runs average about three
minutes each. The record on the chronograph sheet was read by
means of a diagonal scale and gave the mean time of one revolution
with great accuracy. An example is given in Table I. Eleven inde-
pendent determinations of the time of 100 revolutions of the disk are
given in the fourth and seventh columns for meters 1 and 2 and of
120 revolutions in the tenth column for meter 3. The average of
these eleven values is used in deriving the mean time for one revolu-
tion. At the same time an electric circuit was closed by a contact
point connected to the generator once in every hundred revolutions,
and these contacts were recorded on the chronograph sheet. This
gave the frequency of the current very exactly. A slight correction
is applied to the rate of each meter for the small departure of the fre-
quency from 60, which is the standard frequency for the meters
tested. This correction is of course determined for each meter sepa-
rately and may be taken from the curves in fig. 10. In Table II are
given the readings from the chronograph record for determining the
frequency of the current, which in this case averaged 59.95 for the
period of the run.
Table II.—Record for Determination of the Frequency of the Current.
Time of contacts at begin-ning of run.
Time of contacts at endof run.
Time for 5,100 revolutions.
m. s.
1 3.256.609.9213.2816.60
m. s.
3 53.4056. 73
4 0.053.406.75
Seconds.170. 15170. 13170. 13170. 12170. 15
Frequency 2X5,100.170.136
"
Mean= 170. 136
=59.95 cycles per second.
Before making a series of runs on the meters the load was applied
and they were warmed up to an equilibrium temperature. In order
to eliminate errors due to any changes in temperature that might sub-
sequently occur, as well as any other constant errors due to changing
conditions, and so obtain the effect of the varying wave form alone,
the tests with distorted wave forms were interspersed with tests using
sine wave forms. Any progressive change in the meters, or the
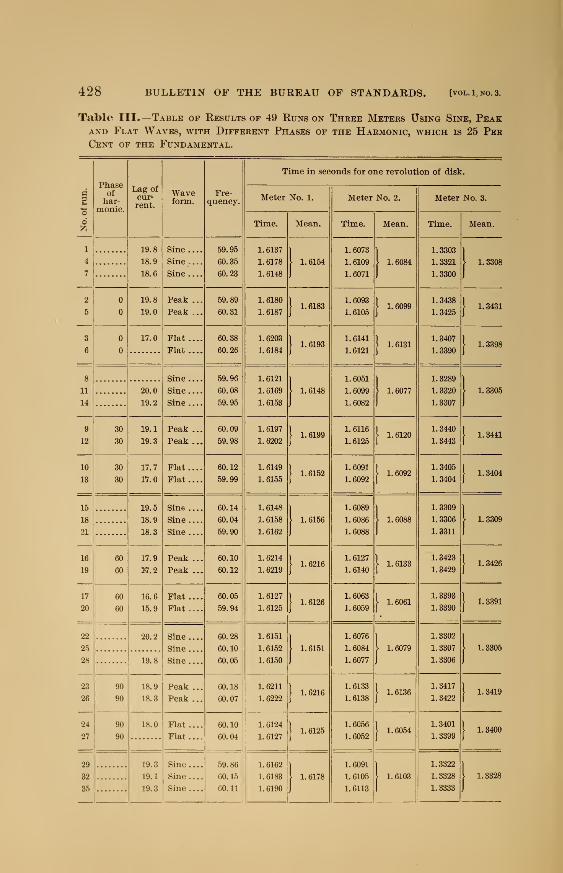
standard wattmeter, would thus be eliminated. Table III gives the

ROSA, LLOYD,REID. EFFECT OF WAVE FORM ON WATTMETERS. 427
results of 49 runs on three meters made May 26, 1904, using a sine
wave and a distorted wave due to 25 per cent harmonic, peak and flat,
as shown in figs. 1 to 4. The numbers of the runs show the order in
which they were taken. For example, the first, fourth, and seventh
were made with a sine wave and are grouped together in the table.
The actual frequency for each run is given in the table, but the times
of one revolution given in columns 6, 8, and 10 have been reduced to
60 cycles. The numbers gi^en in columns Y, 9, and 11 are the means
of the corresponding values in columns 6, 8, and 10.
1.0
0.8
0.2
au0.
O 0.2_iCO
0.4
25% OF Harmonic.M.
o-
^^-?i:3. ; ;: s Z.'_T.Z!.'Jll"——-..—
_^
,^---iir_'_'I . _ _ fM-3-.
""'"->
.^"
iii^r^rS^./ _^ak::2^ —
r^^'^^^^^^^-^^=%^
=- —„_.,Peah;:J:-,.—--Jir-- "^ ^ -^
0.6 ^.
0.4
0° 2°° PHASE OF HARMONIC ^°°90°
Fig. 5.—Showing the variation in the rate of five induction meters with 25 per cent harmonic in
the current as the phase of the harmonic is changed from 0° to 30°, 60°, and 90°.
Runs 2 and 5 were made using a peaked wave and runs 3 and 6
using a flat wave. The phase of the harmonic was then shifted 30°,
and seven runs made in the same order as before. The third set of
seven runs was made with the harmonic at 60°, the fourth set at 90°,
and then three more sets of runs were made in reverse order withrespect to the phase of the harmonic, making in all seven sets of sevenruns each. The difference in per cent obtained in Table IV, together
with corresponding differences in other runs using 10 and 50 per cent
harmonic, the detailed results of which are not here given, are shownin Table V. All these results are plotted in figs. 5 to 9. The results
obtained in the runs of May 26, given in Tables III and IV, are plot-
ted in fig. 5.
428 BULLETIN OF THE BUREAU OF STANDARDS. [vol. 1, NO.
Table III.—Table of Results of 49 Runs on Three Meters Using Sine, PeakAND Flat Waves, with Different Phases of the Harmonic, which is 25 PerCent of the Fundamental.
Phaseofhar-
monic.
Lag ofcur-rent.
Waveform.
Fre-quency.
Time in seconds for one revolution of disk.
eMeter No. 1. Meter No. 2. Meter No. 3.
i Time. Mean. Time. Mean. Time. Mean.
1
4
7
19.8
18.9
18.6
Sine
Sine....
Sine-...
59.95
60.35
60.23
1.6137
1.6178
1. 6148
1.6154
1. 6073
1.6109
1. 6071
L6084
1. 3303
L3321
1. 3300
I 1.3308
2
5
19.8
19.0
Peak ...
Peak ...
59.89
60.31
1. 6180
1. 6187[
1.61831.6093
1. 6105[
1.60991.3438
1.3425 11.3431
3
6
17.0 Flat ....
Flat....
60.38
60.26
1. 6203
1. 6184[
1.61931. 6141
1. 61211.6131
1.3407
1. 3390 1 1. 3398
8
11
14
Sine....
Sine....
Sine....
59.96
60.08
59.95
1. 6121
L6169
1. 6153
1.6148
1. 6051
1.6099
1. 6082
L6077
1. 3289
1.3320
1. 3307
1
20.0
19.2
i 1. 3305
9 30
12 30
...
19.3
Peak ...
Peak...
60.09
59.98
1.6197
1. 62021 L6199
1. 6116
1.6125I 1.6120
1.3440
1.34431. 3441
10 30
13 30
17.7
17.0
Flat ....
Flat....
60.12
59.99
1. 6149
1. 6155i 1.6152
1. 6091
1. 60921 1.6092
1.3405
1. 3404i 1.3404
15
18
21
19.5
18.9
18.3
Sine ....
Sine....
Sine....
60.14
60.04
59.90
L6148
1. 6158
1. 6162
i 1.6156
1.6089
1. 6086
1. 6088
[1.6088
1. 3309
L3306
1.3311
i 1. 3309
16 60
19 60
17.9
17.2
Peak ...
Peak ...
60.10
60.12
1. 6214
1. 6219i 1.6216
1. 6127
1. 6140 j1.6133
1.3423
1.34291.3426
17
20
22
25
28
60
60
16.6
15.9
Flat ....
Flat ....
60.05
59.94
60.28
60.10
60.05
1. 6127
1. 6125i 1.6126
1. 6063
1.60591 1.6061
1.3393
1. 33901.3391
20.2 Sine....
Sine....
Sine....
1. 6151
1. 6152
1. 6150
\ 1. 6151
1. 6076
1. 6084
1. 6077
1.6079
1.3302
1. 3307
1.3306
[1. 3305
19.8
23 90
26i
90
1
18.9
18.3
Peak ...
Peak . .
.
60.18
60.07
1. 6211
1. 6222 [1.6216
1. 6133
1.61381 1.6136
1.3417
1.3422 11. 3419
24
27
90
90
18.0 Flat....
Flat....
60.10
60.04
1. 6124
1. 6127[
1.61251. 6056
1. 6052 11.6054
1.3401
1. 3399 1L3400
29
32
35
19.3
19.1
19.3
Sine
Sine....
Sine....
59.86
60.15
60.11
1. 6162
1. 6183
1.6190
I 1.6178
1. 6091
1. 6105
1.6113
• 1.6103
1.3322
1. 3328
1. 3333
i 1. 3328

ROSA, LLOYDREID. ] EFFECT OF WAVE FOEM ON WATTMETERS. 429
Table III.—Table of Results of 49 Runs on Three Meters Using Sine, PeakAND Flat Waves, etc.—Continued.
Phaseofhar-
monic.
Waveform.
Fre-quency.
Time in seconds for one revolution of disk.
1Lag ofcur-rent.
Meter No. 1. Meter No. 2.1 Meter No. 3.
6 Time. Mean. Time. Mean. Time. , Mean.
30 60
60
18.1 Peak...
Peak . .
.
59.83
60.11
1.6234
1. 6244i 1.6239
1.6145 1
1.6154 [
'''"*> l^ --1
31
34
60 16. 8 Flat
60 16.3 i Flat ....
60.22
60.10
1. 6143
1.61551.6149
1. 6087
1. 6C91 11.6089
1.3405 ]
1.3423;}
^-^^
^^'
41j
20.0
20.1
20.1
Sine
Sine-...
Sine....
60.12
60.20
60.25
1.6184
1.6177
1. 6176
I 1.6179
1. 6116
1.6103
1.6104
1.6108
1. 3339
1.3330
1. 3326
1. 3332
37
40
30
30
19.5 Peak ...
Peak...
60.12
60.22
1. 6222
1. 6219 11.6220
1. 6132
1. 6131[ 1.6132
1.3457
1.34541. 3455
38
42
30
30
17.5 Flat....
Flat ....
60.17
60.27
1.6169
1. 61951.6182
1.6104
1. 61151.6110
1.3414
1.3417 [1.3415
44 . 20.2
20.4
Sine i 1.6178
1. 61761.6177
1.6101
1. 6112 J1.6106
1.3326
1.3328
1
47 Sine .... 60. 011.3327
45
22.0
Peak 1. 6191
1. 61901.6190
1.6104
1.61071 1.6106
1.3453
1.3460
1
49 Peak ... 60.11\ 1.3456
4S
17.6
Flat 1. 6216
1. 6224 11.6220
1.6154
1.61541.6154
1.3424
1.3429
1
46 Flat .... 60.041.3426
Table rV.—Summary of Results Shown in Table III.
MeterPhaseof har-monic.
Sine. Peak.Per centslow.
Flat.
Per cent.
No.Slow. Fast.
1
1
1
1
306090
1. 61661. 61641. 61671. 6151
1. 61861. 62101. 62281. 6216
0.120.280.380.40
1. 62061. 61671. 61381. 6125
0.250.02
*"o."i8"0.16
22
1
306090
1. 6095' 1.6092 1
1. 60961. 6079
1. 61021. 61261. 61421. 6136
0.040.210.290.35
1. 61421. 61011. 60751. 6054
0.290.06 ::::::::
0.130.16
3333
306090
1. 33181. 33181. 33181. 3305
1.34441.34481.34371. 3419
0.950.980.890.85
1. 34121. 34101. 34021. 3400
0.700.690.630.71

430 BULLETIN OF THE BUREAU OF STANDARDS. [vol. 1, no. 3.
In Table IV the values given are the means of the two values
found for the corresponding case and shown in Table III. Thus1.6166 is the average of 1.6154, the mean found for runs 1, 4, 7 and
2 0,2
10^ OF Harmonic.
Peak^.~-fmr±
=^=5=;:^^—^ZI.IZ^tH.-_1
.-
Meter No.1.'
"
—
' —HI! 1
- _ F/af^'sT
:t_____^__-- — — '^i^.___
PHASE OF HARMONIC
Fig. 6.—Showing the variation in the rate of three induction meters with 10 per cent harmonic in
the current as the phase of the harmonic is changed from 0° to 90°.
1.6177, the mean of runs 44, 47. Likewise, 1.6186 is the average
of 1.6183 (runs 2, 5) and 1.6190 (runs 45, 49). This eliminates eflfect of
changing temperature during the course of the experiments.
Peak~3.
Flat-3.
50% OF Harmonic.
.._ ., .. >• 2.
„ ,. 3.
::«^ ^^_Peahj:±__^Pjah^-
•
__ —
^^^=^^
30' PHASE OF HARMONIC 60 =
Fig. 7.—Showing the variation in the rate of three induction meters with 60 per cent harmonic in
the current as the phase of the harmonic is changed from 0° to 90°.
The maximum variation due to 25 per cent harmonic is, in the case
of meter 3, a little less than 1 per cent, being greater with the
peak than the flat, but not varying much with the phase of the
KOSA, LLOYD, ~|
REID. J EFFECT OF WAVE FORM ON WATTMETERS. 431
harmonic. On the other hand, meters 1 and 2 show smaller errors due
to the presence of the harmonic, but greater changes due to shifting
the phase of the harmonic, both changing from slow to fast on the
flat wave when the phase is shifted. Meter 4 runs faster for both
peak and flat and at all phases than on a sine wave. It is the only
meter of the five for which this is true.
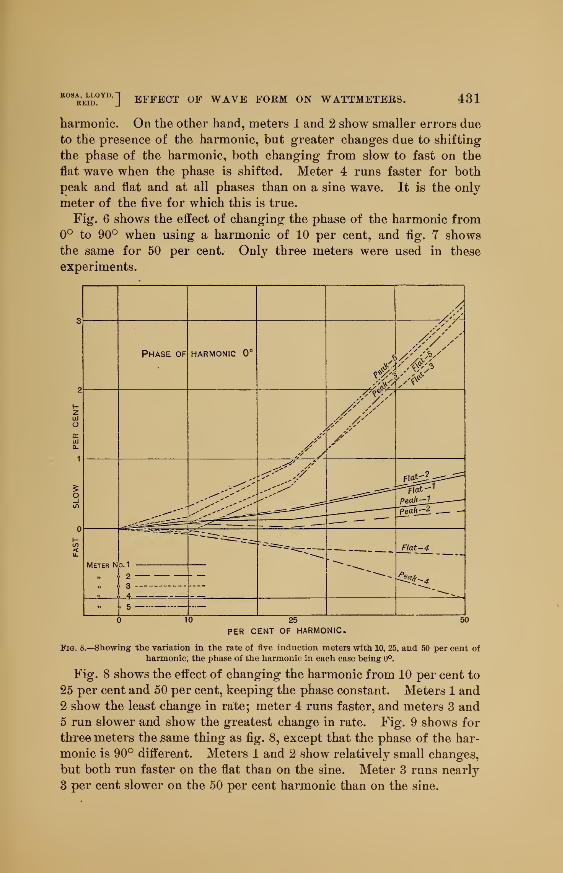
Fig. 6 shows the effect of changing the phase of the harmonic from0° to 90° when using a harmonic of 10 per cent, and ^g. 7 showsthe same for 50 per cent. Only three meters were used in these
experiments.
Phase of
Meter Np.1
„ 2J. o
-4
HARMONIC 0'
/'z
A
^z^-
Flat-
4
10 25
PER CENT OF HARMONIC.50
Fig. 8.—Showing the variation in the rate of five induction meters with 10, 25, and 50 per cent of
harmonic, the phase of the harmonic in each case being 0°.
Fig. 8 shows the effect of changing the harmonic from 10 per cent to
25 per cent and 50 per cent, keeping the phase constant. Meters 1 and
2 show the least change in rate; meter 4 runs faster, and meters 3 and
5 run slower and show the greatest change in rate. Fig. 9 shows for
three meters the^ame thing as fig. 8, except that the phase of the har-
monic is 90° different. Meters 1 and 2 show relatively small changes,
but both run faster on the flat than on the sine. Meter 3 runs nearly
3 per cent slower on the 50 per cent harmonic than on the sine.

432 BULLETIN OF THE BUREAU OF STANDARDS. [vol.1, no. 3.
J
Phase OF HARMONIC 90'
// 0. /
METER-^
II 1
f/
/ /
y /
' /
— y/3- -
a---.--
"^^^^=£3^^ Flat ^1Flat ''
10 25
PER CENT OF HARMONIC,50
Fig. .—Showing the variation in the rate of three induction meters with 10, 25, and 50 per cent of
harmonic, the phase of the harmonic in each case being 90°.
,
EFFECT F Frequency
5//
3
2
//
//
''""--^:w
///
//-^^-^?
2
//
//
Meter ^
'2
„ 2
3.. 3
r
.'
„ 4
50 55 60 65 70
CYCLES PER SECONDFig. 10.—Showing the variation in the rate of five induction meters with change of frequency.

ROSA, LLOYD,REID. ] EFFECT OF WAVE FORM ON WATTMETERS. 433
fc r-.
o i
> ^
o
'
B1P4
i ddo0.40 0.35 0.85
I—
(
CO
d dd CO
1CO
d
i t^ '• 00
d jd
-»^
oddcocoI—1
1—
1
d>d>
T-H
doco1—1 1—1
o*
S
1
1
^
S
OO 05 05CO (M GO
ddd00
d ^
1i^
is
1 d ; d
1OO CO • lO,-1 rH < (M
c5d> ;d
o' s
00 T-H GO • tJH
CM (M Oi 1 CO
odd ;d
t
1—1
CO
d
§8§ T—
1
-*
d
• CO
• d
1
i dr-H O Oi • Oi
odd '>d>
I—1 CO 1—
1
ddco CO
1 • d
• GO• (M
!do
^s
om
lO Oi O ! <M(M C^ ir^ • CO
odd ;d
!>. 1-t Tfl
t- 00 00
ddc<i
o1—1
CO
od d d«
1a
si
1
1
i
-1
> c
) a
5 '^
> c
i a
if-
) a
) a
1
1
3<! a
> c
s-
1
> a
cr
) a) a
1^
> c
) a ) a
1^
VJ c
) a
i
) a
2214—No. 3—0£

434 BULLETIN OF THE BUREAU OF STANDARDS. [vol.1, no. 3.
The effect of change of frequency on the rate of the meters is
shown in fig. 10. It is relatively small in every case but one.
These results show that with suitable precautions induction meters
may be made to repeat their readings very accurately, so that precision
methods may be applied in studying them. They also show that the
variations due to wave form depend not only on the harmonics which
are present and their magnitudes, but also on their phases.
The Bureau of Standards is now having a generating set constructed
which will give all the odd harmonics up to the fifteenth and any
desired combination of them with the fundamental. When this is
completed it will be used to study the effects of the higher harmonics
on the rate of these meters. The results given here show that for
commercial purposes all the meters so far studied may be considered
accurate on any ordinary wave form where only the third harmonic
enters appreciably, although two meters show variations of about
3 per cent when the harmonic amounts to as much as 50 per cent of
the fundamental.

AUTHOR
TITLE
Bulletin of the^ureau_of_Stan4ar^
Vol. 1

, I • 1 1 » 1 1 1 1 ; 5 ( ' : ' ! J : f . » r »J 1 « 1 5 \ ; V ; « { » i t ( ! . • .' 1 / ^ 1 1 1^
^^nijJiHUi. iji m a;
liii
• • • • •1 • 1 I i - 1 ? • •
, 1 k ' 1
»
1 * » • I ! • * 1
n\ill^
:::?r
rtfV. n
Hi: it
.$H({ii;-lf
[!i
%
/ 1*'
iiiji>i\iiUiii^UiiliiiiUimi>i^iJiiiiLiiniiA