influences of organic carbon supply rate on uranium
TRANSCRIPT
1 of 1.
Influences of Organic Carbon Supply Rate on Uranium Bioreduction in Initially Oxidizing,
Contaminated Sediment
Tetsu K. Tokunaga*1, Jiamin Wan1, Yongman Kim1, Rebecca A. Daly2, Eoin L. Brodie1,
Terry C. Hazen1, Don Herman2, and Mary K. Firestone1,2
*Corresponding author phone (510) 486-7176; e-mail: [email protected]
1Lawrence Berkeley National Laboratory, Berkeley, California 94720
2University of California, Berkeley, California 94720
Abstract
Remediation of uranium (U) contaminated sediments through in-situ stimulation of bioreduction
to insoluble UO2 is a potential treatment strategy under active investigation. Previously, we
found that newly reduced U(IV) can be reoxidized under reducing conditions sustained by a
continuous supply of organic carbon (OC) because of residual reactive Fe(III) and enhanced
U(VI) solubility through complexation with carbonate generated through OC oxidation. That
finding motivated this investigation directed at identifying a range of OC supply rates that is
optimal for establishing U bioreduction and immobilization in initially oxidizing sediments. The
effects of OC supply rate, from 0 to 580 mmol OC (kg sediment)-1 year-1, and OC form (lactate
and acetate) on U bioreduction were tested in flow-through columns containing U-contaminated
sediments. An intermediate supply rate on the order of 150 mmol OC (kg sediment)-1 year-1 was
determined to be most effective at immobilizing U. At lower OC supply rates, U bioreduction
was not achieved, and U(VI) solubility was enhanced by complexation with carbonate (from OC
2 of 2.
oxidation. At the highest OC supply rate, resulting highly carbonate-enriched solutions also
supported elevated levels of U(VI), even though strongly reducing conditions were established.
Lactate and acetate were found to have very similar geochemical impacts on effluent U
concentrations (and other measured chemical species), when compared at equivalent OC supply
rates. While the catalysts of U(VI) reduction to U(IV) are presumably bacteria, the composition
of the bacterial community, the Fe reducing community, and the sulfate reducing community had
no direct relationship with effluent U concentrations. The OC supply rate has competing effects
of driving reduction of U(VI) to low solubility U(IV) solids, as well as causing formation of
highly soluble U(VI)-carbonato complexes. These offsetting influences will require careful
control of OC supply rates in order to optimize bioreduction-based U stabilization.
Introduction
Uranium (U) contamination of soils and sediments has become a critical problem at numerous
sites used for production of nuclear fuels and weapons. Various strategies for remediation and
long-term stewardship of U-contaminated sediments and groundwaters are under active
investigation, including approaches based on in-situ bioreduction of U (1-3). The goal of in-situ
bioreduction is to stimulate indigenous microbial communities to reduce soluble U(VI) to
insoluble U(IV) solids, thereby decreasing U concentrations in groundwaters below the
Maximum Contaminant Level (MCL, for 238U = 10 pCi L-1 = 0.13 µM). A variety of
microorganisms capable of reducing U(VI) have been identified (3), including Fe(III)-reducers
(1) and sulfate reducers (4, 5). In order to accelerate U bioreduction, organic carbon (OC) is
provided as an electron donor and growth substrate for indigenous microbial communities.
However, these beneficial influences of OC addition can be offset by increases in inorganic C
3 of 3.
(IC) concentrations resulting from stimulating microbial respiration. Increased (bi)carbonate
concentrations drive aqueous U(VI) concentrations to higher levels through formation of stable
U(VI) carbonato complexes, even under reducing conditions and in the presence of active U-
reducing bacterial communities (6, 7). The impact of OC oxidation on enhanced U(VI)-
carbonate solubility under well-established reducing conditions was recently demonstrated. A
subset of sediment columns from our previous work (6) was maintained under reducing
conditions, then switched to individually different OC supply rates. Under sustained reduction,
lower U solubility was achieved with lower OC supply rate because of decreased formation of
soluble U(VI)-carbonate complexes, while increased OC supply rates lead to greatly increased U
concentrations for the same reason (8). Thus the success of in situ U bioreduction in sediments is
not assured by simply supplying OC at rates high enough to generate reducing conditions. This
previously unrecognized side effect of OC-stimulated bioreduction can impair attempts at
remediating groundwater to below the U MCL, and points to the importance of determining
whether an optimal, intermediate level of OC supply exists for effectively reducing aqueous U
concentrations in initially oxidizing, contaminated sediments.
Stimulation of in-situ U bioreduction can also depend on the form of OC supplied and
sediment geochemistry. Under acidic conditions, glucose has been reported to be more effective
in stimulating Fe(III)-reducing bacteria than lactate and acetate (9). Acetate has been used in
numerous tests because of its efficiency in stimulating Fe-reducing microbial populations (2).
Ethanol has been reported to promote more rapid U(VI) reduction than acetate or lactate in a
batch study (10), and has been used to stimulate U bioreduction in column (11) and field (10)
experiments. For Desulfovibrio desulfuricans, reduction rates of U(VI) in multidentate aliphatic
4 of 4.
complexes were slower than in monodentate aliphatic complexes, but with Shewanella alga
faster U reduction rates were achieved with multidentate aliphatics (12).
This study was conducted to test the hypothesis that U bioreduction and removal from
pore waters in initially oxidizing sediments will be most effective with an intermediate (rather
than high) rate of OC supply, because microbial oxidation of excessive OC favors the formation
of soluble U(VI)-carbonate complexes. While primarily relying on column experiments,
geochemical modeling was also performed for characteristic conditions in order to gain more
insights into impacts of increased IC. In addition to this primary goal, this study sought to
determine whether responses differ when the OC is supplied in the form of either acetate or
lactate (two carboxylic acids used in various studies on U biorection), and whether
remobilization of bioreduced U is directly dependent on the composition of the microbial
community.
Materials and Methods
Sediment columns. Historically U-contaminated sediment was provided by the U.S. Department
of Energy’s Environmental Remediation Science Program (ERSP) Field Research Center (FRC)
at Oak Ridge National Laboratory. This sediment came from the same contaminated area from
which samples were collected for our previous study (6), and had a total U concentration of 1.08
mmol kg-1 (X-ray fluorescence analysis, XRF). Geochemical analyses of the sediment are
provided in Supporting Information Table S1. Moist sediment was passed through a 4.75 mm
sieve and homogenized prior to packing into 26 columns, each to a porosity of 0.51. The 200
mm long, 31.5 mm inner diameter polycarbonate columns were similar to those used previously
(6). Platinum wire redox electrodes were embedded into the walls of most columns at distances
5 of 5.
of 50, 100, and 150 mm. Redox potentials were periodically measured with Pt electrodes
referenced to a calomel electrode tapped into the outflow end of each column. Columns for one
set of lactate treatments (from 0 up to 100 mM OC) were designed with Kapton windows in
order to obtain X-ray absorption spectra of U, Fe, and Mn (13). A parallel set of identical
columns (without Pt electrodes) was run simultaneously for microbial community analysis. All
columns were kept in an N2-purged glovebox throughout the study.
Influent and effluent solutions. The background ionic composition of influent solutions was
based on the composition of an uncontaminated groundwater from the Oak Ridge FRC. Its
major ion chemistry consisted of 0.83 mM Ca2+, 0.20 mM Mg2+, 2.00 mM Na+, 0.10 mM K+, 2.1
mM Cl-, 1.00 mM HCO3-, 0.50 mM SO4
2-, and 0.05 mM NO3-, had an ionic strength of 5.68 mM,
and pH = 7.3. Low levels of NO3- and SO4
2- were included in these solutions because of their
natural occurrence in groundwater, therefore their likely influence on remediation strategies that
involve injection of OC-amended local groundwater. Na-lactate and Na-acetate were added to
these salt solutions to contain 0, 3, 10, 30, and 100 mM OC, with all solutions prepared with
filtered deionized water in autoclaved containers. Duplicate columns were run for 0 mM OC, and
for each lactate and acetate concentration (3, 10, 30, 100 mM). Solutions were supplied via
syringe pumps at an average pore water velocity of 8.2 mm day-1 (24 day residence time). After
supplying columns with 2 pore volumes (1 PV = 79.5 mL) of the 0 mM OC solution, infusion
with different OC concentration solutions (including continuation of one column with 0 mM OC)
was initiated. The combination of influent OC concentrations and pump rate yielded column-
averaged supply rates ranging from 0 to 1.4 mmol OC kg-1 day-1. Effluents were collected using
a fraction collector, and periodically analyzed for U (kinetic phosphorescence analyzer KPA-11,

6 of 6.
Chemchek), OC and inorganic C (IC) (TOC-V-CSH, Shimadzu), and other major elements
(ICP).
Geochemical modeling. Increases in bicarbonate concentrations and PCO2 resulting from OC
oxidation affect aqueous U concentrations through increasing concentrations of numerous U(VI)-
carbonate complexes. Assuming local equilibrium, changes in effluent U species response to
increases in PCO2 during the late stage in this experiment (12 to 16 PV) were calculated with
PHREEQC2.12 (14), using the Nuclear Energy Agency database (15) and the stability constants
for aqueous CaUO2(CO3)32- and Ca2UO2(CO3)3 of Dong and Brooks (16). The pH and major ion
composition characteristic of late stage effluents were used for these calculations as described in
Supporting Information. Although some U(VI)-OC complexes are likely to be present in
effluents, they were not included in calculations because preliminary simulations showed that the
U(VI)-carbonate complexes were overwhelmingly dominant. For oxidizing conditions, the
modeled total U(VI) concentration was equated with the exchangeable U determined by the
(bi)carbonate method recommended by Kohler et al. (17), because significant fractions of the
total U inventory in contaminated sediments can be relatively refractory. The (bi)carbonate-
extractable U amounted to 59.2 ±0.4% of the total U, and may overestimate the exchangeable
inventory because the extractions were done on samples that became dry during storage. U(VI)
sorption was assumed to occur on ferrihydrite-like sites, with the citrate-dithionite-bicarbonate
extracted Fe used as an estimate of ferrihydrite Fe (18). Values of ferrihydrite specific surface
area, site densities and binding constants (Supporting Information) used in generalized two-layer
model calculations are taken from Dzombak and Morel (19), Parkhurst and Appelo (14), Appelo
et al. (20), and Payne (21). For the reducing case, U solubility was assumed to be controlled by
UO2(am). Although sorption of U(VI) under reducing conditions is likely to be important (22),
7 of 7.
surface complexation was not included in these calculations because of large uncertainties
associated with binding site densities.
DNA extraction and amplification. Nucleic acids were extracted from sediment samples
collected from the set of columns designated for microbial analysis at 5.9 and 12.1 PV relative to
OC start, near the outlet of the columns. DNA was extracted using a modification of the Fast
DNA SPIN Kit for Soil (MP Biomedicals, Irvine, CA) (see supporting information). 16S rDNA
gene amplification was performed by using primers 27F (5’-AGAGTTTGATCCTGGCTCAG-
3’) AND 1492R (5’-GGTTACCTTGTTACGACTT-3’). Each PCR reaction contained 1x Ex
Taq buffer (Takara Bio Inc., Japan), 1.25 U Ex Taq polymerase, 200 µM each dNTP, 2.5 µg
BSA, 300 nm each primer and 100 ng DNA template in a final volume of 50 µl. PCR conditions
were 95°C (3 min), followed by 25 cycles 95°C (30 s), 48-58°C (25 s), 72°C (2 min), followed
by a final extension 72°C (10 min). Each DNA extract was amplified in 8 replicate 50 µl
reactions spanning a range of annealing temperatures between 48-58°C. Amplicons from the 8
reactions were pooled, precipitated with isopropanol, washed with ethanol, and resuspended to
50 µl.
High-density oligonucleotide array analyses. From each pool of 16S rRNA gene amplicons, 2
µg was prepared for hybridization to the PhyloChip as previously described (7). Target
fragmentation, biotin labeling, PhyloChip hybridization, scanning and staining were as described
by Brodie et al. (7), while background subtraction, noise calculation, and detection and
quantification criteria were as reported in Brodie et al. (7) with some minor exceptions. For a
probe pair to be considered positive, the difference in intensity between the perfect match (PM)
and mismatch (MM) probes must be at least 130 times the squared noise value (N). A taxon was
considered present when 90% or more of the probe pairs for its corresponding probe set were
8 of 8.
positive (positive fraction, ≥0.90). The OTU (operational taxonomic group) grouping was used
for PhyloChip output, which consists of one or more sequences with typically 97% to 100%
sequence homology.
Statistical analysis of bacterial communities. Two functional groups were identified as a
subset of the PhyloChip results, iron-reducers and sulfate-reducers. Only taxa that have been
previously shown to carry out these functions were considered, although it is likely that other
taxa fall into these functional groups. OTUs that conserve energy by iron-reduction were
identified by referencing Lovley et al. (23) (see Table S4 in supporting information). OTUs that
are capable of sulfate-reduction were identified by referencing Rabus et al. (24) (see Table S5 in
supporting information). For analysis of the bacterial communities, nonmetric multidimensional
scaling (NMDS) was used within the community ecology package vegan 1.8-5 for R (25). The
function ‘metaMDS’ from the vegan library was used, which applies Bray-Curtis dissimilarities
as a measure of ecological distance and first performs a square root transformation and then a
Wisconsin double standardization (26). To determine if community structures were associated
with local column redox, average column redox, IC effluent concentrations or U effluent
concentrations, linear regressions were performed against NMDS axis scores and environmental
variables. U and IC concentrations were measured from the replicate set of columns designated
for microbial analysis at PV 5.6 and 12.0 relative to OC start. Average redox values were
calculated as the average of 6 redox measurements (3 locations within duplicate columns),
designated as “Eh average”; local redox values were calculated as the average of 2 redox
measurements (“top” location within duplicate columns), designated as “Eh local”. “Eh local” is
the portion of the column from which sediments were sampled for microbial nucleic acid
analysis. Eh measurements were taken at PV 5.8 and 12.7 relative to OC start. Bacterial
9 of 9.
community analyses were performed on identical, replicate sets of columns that did not have Pt
electrodes, and thus have no direct Eh measurements.
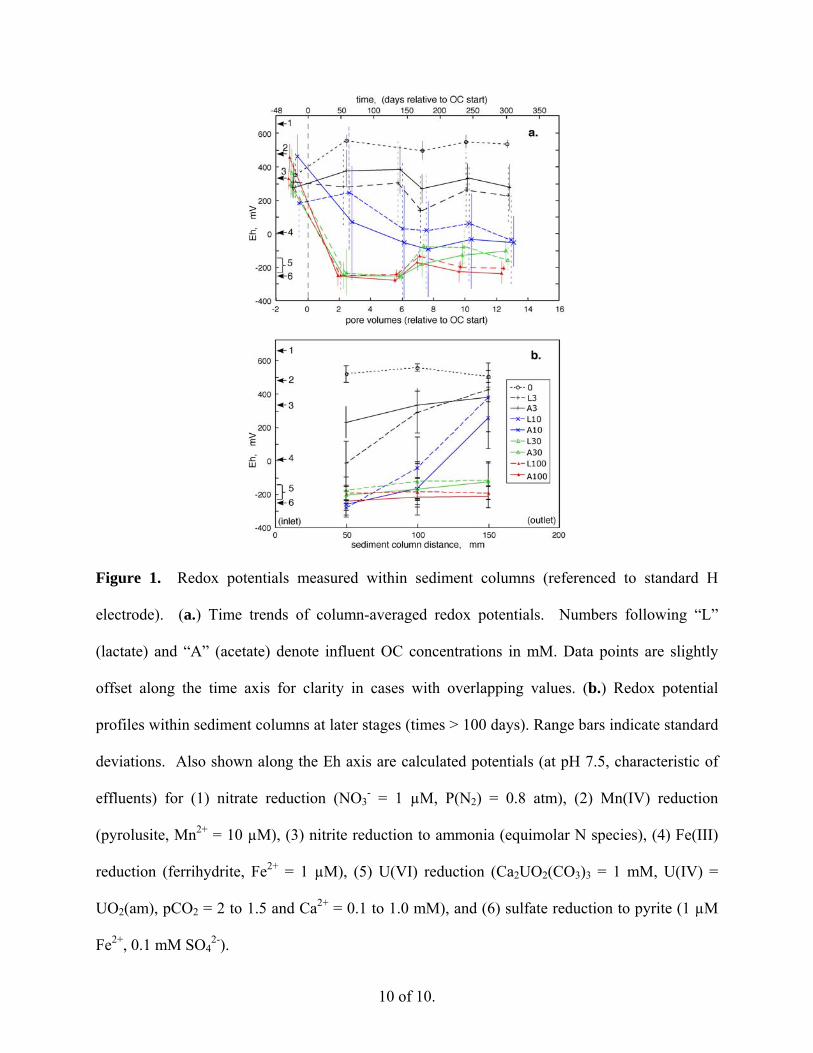
Results and Discussion
Redox potentials. Redox potential measurements indicated that oxidizing conditions were
characteristic of all columns at the beginning of the experiment. Average redox potentials
(relative to the standard H electrode reference) are shown as time trends in Figure 1a. Each data
point in Figure 1a is an average of 6 redox measurements (3 locations within duplicate columns)
obtained at a specific time. These time trends generally show responses to each of the different
levels of OC supply rate, but insensitivity to whether OC was delivered as lactate or acetate.
After about 100 days of exposure to different solutions, redox potentials within individual
columns became fairly stable, with more reducing conditions measured within sediments with
higher rates of OC supply. Without infusion of OC, and even with OC supplied at 0.04 mmol
kg-1 day-1 (3 mM OC), redox potentials measurements in sediments remained moderately
oxidizing. Calculated Eh values for various redox couples, based on conditions indicated in the
caption, are shown along the y-axis. The time trends in redox potentials suggest that the 0.14
mmol kg-1 day-1 (10 mM OC) sediments are insufficiently reducing to immobilize U as U(IV),
whereas the 0.42 and 1.4 mmol kg-1 day-1 (30 and 100 mM OC) sediments are.
Within individual sediment columns, relatively stable redox profiles were measured after
about 130 days of infusion. Uniformly oxidizing conditions without infusion of OC, uniformly
reducing conditions in the 0.42 and 1.4 mmol kg-1 day-1 (30 and 100 mM OC) sediments, and
redox gradients in the 0.14 and 0.04 mmol kg-1 day-1 (10 and 3 mM OC) sediments are shown in
time-averaged (from 5.9 to 12.7 PV) data in Figure 1b.
10 of 10.
Figure 1. Redox potentials measured within sediment columns (referenced to standard H
electrode). (a.) Time trends of column-averaged redox potentials. Numbers following “L”
(lactate) and “A” (acetate) denote influent OC concentrations in mM. Data points are slightly
offset along the time axis for clarity in cases with overlapping values. (b.) Redox potential
profiles within sediment columns at later stages (times > 100 days). Range bars indicate standard
deviations. Also shown along the Eh axis are calculated potentials (at pH 7.5, characteristic of
effluents) for (1) nitrate reduction (NO3- = 1 µM, P(N2) = 0.8 atm), (2) Mn(IV) reduction
(pyrolusite, Mn2+ = 10 µM), (3) nitrite reduction to ammonia (equimolar N species), (4) Fe(III)
reduction (ferrihydrite, Fe2+ = 1 µM), (5) U(VI) reduction (Ca2UO2(CO3)3 = 1 mM, U(IV) =
UO2(am), pCO2 = 2 to 1.5 and Ca2+ = 0.1 to 1.0 mM), and (6) sulfate reduction to pyrite (1 µM
Fe2+, 0.1 mM SO42-).
11 of 11.
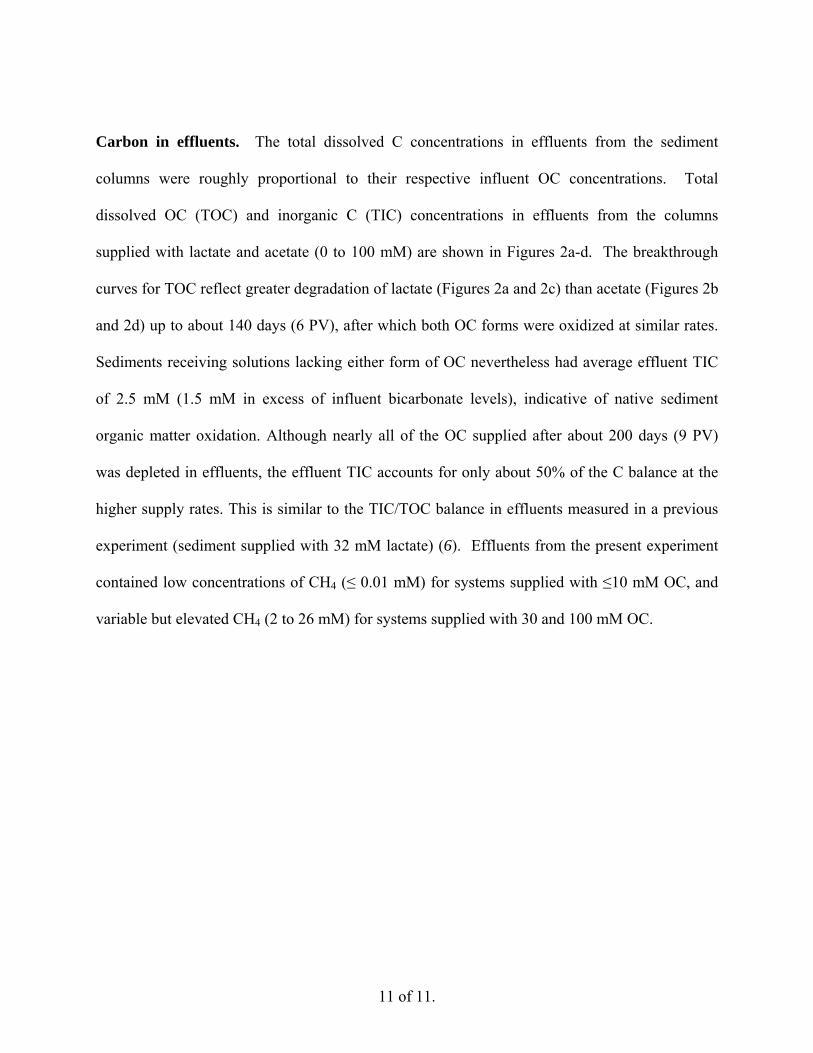
Carbon in effluents. The total dissolved C concentrations in effluents from the sediment
columns were roughly proportional to their respective influent OC concentrations. Total
dissolved OC (TOC) and inorganic C (TIC) concentrations in effluents from the columns
supplied with lactate and acetate (0 to 100 mM) are shown in Figures 2a-d. The breakthrough
curves for TOC reflect greater degradation of lactate (Figures 2a and 2c) than acetate (Figures 2b
and 2d) up to about 140 days (6 PV), after which both OC forms were oxidized at similar rates.
Sediments receiving solutions lacking either form of OC nevertheless had average effluent TIC
of 2.5 mM (1.5 mM in excess of influent bicarbonate levels), indicative of native sediment
organic matter oxidation. Although nearly all of the OC supplied after about 200 days (9 PV)
was depleted in effluents, the effluent TIC accounts for only about 50% of the C balance at the
higher supply rates. This is similar to the TIC/TOC balance in effluents measured in a previous
experiment (sediment supplied with 32 mM lactate) (6). Effluents from the present experiment
contained low concentrations of CH4 (≤ 0.01 mM) for systems supplied with ≤10 mM OC, and
variable but elevated CH4 (2 to 26 mM) for systems supplied with 30 and 100 mM OC.
12 of 12.
Figure 2. Time trends in effluent carbon concentrations. (a.) Effluent OC concentrations in
columns supplied with lactate. (b.) Effluent OC concentrations in columns supplied with acetate.
(c.) Effluent IC concentrations in columns supplied with lactate. (d.) Effluent IC concentrations
in columns supplied with acetate. Range bars indicate standard deviations.
Uranium. Time trends in effluent U concentrations showed strong dependence on the OC
supply rate, but insignificant differences with respect to OC type. At equimolar C supply rates of
lactate and acetate, time trends in effluent [U] were very similar (Figures 3a and 3b). The greater
variability among U concentrations in duplicates of lactate-treated sediments (Figure 3a) appears
to have resulted from periodic stopping of flow when one set of these columns was sent to
13 of 13.
synchrotron facilities for X-ray absorption spectroscopy (XAS) measurements (13). All columns
treated at the two highest OC supply concentrations (30 and 100 mM) exhibited rapid declines in
[U], followed by transient increases back to intermediate concentrations. This phenomenon was
identified in our previous study (6), where we showed that U(IV) was reoxidized, and
hypothesized that a residual reactive Fe(III) or Mn(III,IV) phase persisted long enough to drive
U(IV) reoxidation. Manganese XAS analyses on a subset of the present sediment columns
showed that Mn(III,IV) phases were fully reduced to Mn(II), and thus unlikely to drive the
observed U(IV) reoxidation (13). Iron and U XAS results from that study support transient
U(IV) reoxidation by Fe(III).
Complex effects of OC supply rate on effluent U concentrations were reproducibly
observed in both the lactate- and acetate-treated sediments. The supply rates of 0.04 and 0.14
mmol OC kg-1 day-1 (3 and 10 mM OC) were insufficient for generating strongly reducing
conditions, but resulted in proportional increases in bicarbonate (IC) concentrations (Figures
2c,d) which drove more U(VI) into the effluent (Figures 3a,b). Thus, at lower rates of OC
supply, effluent U concentrations increase relative to control conditions (0 mM OC) through
carbonate driven U(VI) desorption. At higher rates, 0.42 and 1.4 mmol OC kg-1 day-1 (30 and
100 mM OC), strongly reducing conditions are established, and the lower solubility of U(IV)
causes effluent U concentrations to decrease. However, the resulting proportionally higher IC
concentrations still drive U(VI) desorption and enhance solubility of important aqueous U(VI)
species. Therefore, the highest levels of OC supplied generated the highest IC levels and
supported elevated U(VI) concentrations in reducing effluents. Thus lowest effluent U
concentrations were achieved with the intermediate rate of OC supply (30 mM solutions, 0.42
mmol OC kg-1 day-1), not with the highest rate (100 mM solutions, 1.4 mmol OC kg-1 day-1).

14 of 14.
Figure 3. Time trends in effluent uranium concentrations in sediment columns supplied with
(a.) lactate, and (b.) acetate. Range bars indicate standard deviations.
Geochemical calculations. The hypothesis that OC oxidation and increased bicarbonate
concentrations were responsible for elevating aqueous U(VI) concentrations was further
examined through equilibrium geochemical calculations with PCO2 used as the independent
variable. The approximately steady-state geochemistry of these sediments and effluents were
separated into cases; one where U(VI) reduction was insignificant (0, 3, 10 mM OC), and the
other where U(VI) reduction was important (30, 100 mM OC). Comparisons between
equilibrium calculations and measured characteristic steady-state effluent U concentrations are
15 of 15.
shown in Figures 4a and 4b for oxidizing and reducing conditions, respectively. Modeled total
aqueous U concentrations were not expected to closely match measured effluent U
concentrations because of the approximations employed, and because no parameters were
adjusted. More important in these comparisons are the fairly good agreements between
calculated and measured trends for the PCO2-dependence of effluent U concentrations. Model
predictions show large increases aqueous U with increased PCO2, under both oxidizing and
reducing conditions, in good agreement with experiments. The MCL for U is exceeded over all
environmentally relevant levels of PCO2 under oxidizing conditions (Figure 4a), and even under
reducing conditions when PCO2 becomes elevated (Figure 4b). The predicted importance of
aqueous U(VI) complexes with carbonate and Ca in these types of effluents was supported by
laser fluorescence spectroscopy in an earlier study (6). It should be noted that while the
laboratory experiments and associated calculations are specific to a U-contaminated sediment
from Oak Ridge National Laboratory, the impact of IC on U geochemistry are much more
generally important, especially in the circum-neutral to alkaline range of pH found in many
environments. When data on key parameters are available, more complex biogeochemical
modeling can be used to efficiently predict U-OC-IC dynamics over a broader range of
conditions.

16 of 16.
Figure 4. Calculated effects of increased CO2 partial pressure from OC oxidation under (a.)
oxidizing conditions (pe = 11.96, Ca2+ = 2.0 mM), and (b.) reducing conditions (pe = -3.23 to –
3.35, Ca2+ = 0.4 mM, equilibrium with UO2(am)). Only concentrations of dominant species and
total calculated U are plotted for comparison with trends in measured U concentrations. Under
both conditions, increased P(CO2) allows higher aqueous U concentrations.
Microbial Communities. To evaluate the relationship between the composition of the bacterial
communities and the observed remobilization of bioreduced U we used an ordination technique,
nonmetric multidimensional scaling (NMDS). The ordination plots of the total bacterial
community, the iron-reducing bacteria (FRB) and the sulfate-reducing bacteria (SRB) are
presented in supporting information (Figure S1). NMDS Axis 1 and Axis 2 ordination scores
17 of 17.
were regressed against effluent U concentrations, local and average redox values and effluent IC
concentrations (Table 1). Significant correlations were found between the total bacterial
community composition and local column Eh (R2=0.85), average column Eh (R2=0.69) and
effluent IC (R2=0.27) along NMDS axis 2; but there was no significant relationship between
bacterial community composition and effluent U concentrations. Parallel analysis of the FRB
community revealed significant relationships with local column Eh (R2=0.90) and average
column Eh (R2=0.71) and the composition of the FRB community along NMDS axis 1. Again,
no significant relationship could be detected between the FRB community and effluent U
concentrations. Similarly, analysis of the SRB community found significant relationships with
local column Eh (R2=0.51) and average column Eh (R2=0.48) and the composition of the SRB
community along NMDS axis 1. No significant relationship could be detected between the SRB
community and effluent U concentrations.
Remobilization of bioreduced U does not appear to be directly associated with bacterial
community composition. This is consistent with the remobilization of bioreduced uranium being
primarily dependent on the concentration of bicarbonate. The balance between bioreduction and
bicarbonate-dependent remobilization must depend on the capacity of the bacterial community to
initially reduce U and sustain its reduction. However, following Fe(III)-catalyzed re-oxidation of
U(IV), subsequent U(VI) bioreduction may be inhibited by the formation of stable Ca-U-CO3
complexes (6) that are thought to be less energetically-favorable as electron acceptors (27). This
may tip the balance in favor of bicarbonate-dependent remobilization independent of microbial
community composition.

18 of 18.
NMDS axis 1 NMDS axis 2
variable R2 R2
Bacterial Community Eh local 0.00 0.85***
Eh average 0.01 0.69***
IC 0.05 0.27*
U 0.21 0.13
FRB Community Eh local 0.90*** 0.02
Eh average 0.71*** 0.00
IC 0.15 0.00
U 0.15 0.16
SRB Community Eh local 0.51** 0.03
Eh average 0.48** 0.02
IC 0.13 0.11
U 0.04 0.17
Table 1. Relationship between community compositions and local redox conditions (Eh local),
average column redox (Eh average), effluent total inorganic carbon (IC) and effluent uranium
(U). Significance indicated by *p<0.05, **p<0.01, ***p<0.001.
Implications. This study shows that establishment of U bioreduction and maintenance of low
aqueous U concentrations in contaminated sediments is strongly dependent on the rate of OC
supply because OC oxidation results in dual impacts on U mobility. At low rates of OC supply,
OC oxidation to IC, increased stability of aqueous U(VI) carbonate complexes, IC-driven U(VI)
desorption, and negligible U(VI) reduction lead to significant increases in aqueous U(VI)
concentrations. At higher rates of OC delivery, U(VI) reduction to much less soluble U(IV) is
important, resulting in decrease aqueous U(VI) concentrations at intermediate rates of OC
19 of 19.
supply. However, increased OC supply invariably promotes formation of soluble U(VI)-
carbonates, thereby driving aqueous U(VI) concentrations higher, even while maintaining U-
reducing conditions. Even under optimal rates of OC supply (between 0.14 and 1.4 mmol OC
kg-1 day-1 in this system), initial rapid decreases in soluble U(VI) are followed with large
transient increases when terminal electron acceptors are present. Some common Fe(III)
(hydr)oxides capable of driving U(IV) oxidation (6, 28, 29) can be important obstacles to
immediate establishment of U reduction. Subsurface microorganisms play two roles in this
bioreduction-remobilization process. First, specific populations mediate the reduction of U(VI)
to U(IV). As consumers of the OC supplied, the heterotrophic community produces CO2 which
then drives U(VI) complexation and increases aqueous U(VI) concentrations. We find no
evidence supporting direct involvement of microbial catalysts in reoxidation of U(IV). However,
the net re-mobilization of U(VI) may be partly due to diminished microbial reduction of the less
energetically-favorable calcium-uranyl-carbonate complexes that result from elevated IC. The
high sensitivity to OC delivery rate indicates that U bioreduction will not be a simple
remediation procedure to implement. Finally, the extremely long half-life of 238U (4.5x10⁹
years) needs to be considered in evaluating the sustainability of OC-based in-situ U remediation.
Acknowledgments
We thank Andrew Mei for technical assistance, Brian Viani (Simbol Mining Corporation) for
suggesting the presentation shown in Figure 4b, and helpful comments from the anonymous
reviewers. Funding was provided through the Environmental Remediation Sciences Program
(ERSP) of the U. S. Department of Energy, under Contract No. DE-AC02-05CH11231.

20 of 20.
Supporting Information Available
Total elemental analyses and chemical extracts of the initial sediment are provided in Table S1.
Representative effluent chemical composition data are presented in Table S2. Key
thermodynamic and surface complexation parameters are listed in Table S3 and S4, respectively.
Iron-reducing bacteria used in ordination are listed in Table S5. Sulfate-reducing bacteria used in
ordination are listed in Table S6. NMDS ordinations are presented in Figure S1. Additional
information about DNA extraction and quantification methods are included. This material is
available free of charge via the Internet at http://pubs.acs.org.
Literature Cited
(1) Lovley, D. R.; Phillips, E. J. P.; Gorby, Y. A.; Landa, E. R. Microbial reduction of
uranium. Nature 1991, 350, 413-416.
(2) Anderson, R. T.; Vrionis, H. A.; Ortiz-Bernad, I.; Resch, C. T.; Long, P. E.; Dayvault, R.;
Karp, K.; Marutzky, S.; Metzler, D. R.; Peacock, A.; White, D. C.; Lowe, M.; Lovley, D. R.
Stimulating the in situ activity of Geobacter species to remove uranium from the groundwater of
a uranium-contaminated aquifer. Applied and Environmental Microbiology 2003, 69, 5884-5891.
(3) Wall, J. D.; Krumholz, L. R. Uranium reduction. Annual Review of Microbiology 2006,
60, 149-166.
(4) Lovley, D. R.; Roden, E. E.; Phillips, E. J. P.; Woodward, J. C. Enzymatic iron and
uranium reduction by sulfate-reducing bacteria. Marine Geology 1993, 113, 41-53.
(5) Abdelouas, A.; Lutze, W.; Nuttall, H. E. Oxidative dissolution of uraninite precipitated
on Navajo sandstone. Journal of Contaminant Hydrology 1999, 36, 353-375.
21 of 21.
(6) Wan, J.; Tokunaga, T. K.; Brodie, E. L.; Wang, Z.; Zheng, Z.; Herman, D. J.; Hazen, T.
C.; Firestone, M. K.; Sutton, S. R. Reoxidation of bioreduced uranium under reducing
conditions. Environmental Science and Technology 2005, 39, 6162-6169.
(7) Brodie, E. L.; DeSantis, T. Z.; Joyner, D. C.; Baek, S. M.; Larsen, J. T.; Anderson, G. L.;
Hazen, T. C.; Richardson, P. M.; Herman, D. J.; Tokunaga, T. K.; Wan, J. M.; Firestone, M. K.
Application of a high-density oligonucleotide microarray approach to study bacterial population
dynamics during uranium reduction and reoxidation. Applied and Environmental Microbiology
2006, 72, 6288-6298.
(8) Wan, J.; Tokunaga, T. K.; Kim, Y.; Brodie, E.; Daly, R.; Hazen, T. C.; Firestone, M. K.
Effects of organic carbon supply rates on mobility of previously bioreduced uranium in a
contaminated sediment. Environ. Sci. Technol. 2008, in press.
(9) Petrie, L.; North, N. N.; Dollhopf, S. L.; Balkwill, D. L.; Kostka, J. E. Enumeration and
characterization of iron(III)-reducing microbial communities from acidic subsurface sediments
contaminated with uranium(VI). Applied and Environmental Microbiology 2003, 69, 7467-7479.
(10) Wu, W. M.; Carley, J.; Gentry, T.; Ginder-Vogel, M. A.; Fienen, M.; Mehlhorn, T.; Yan,
H.; Caroll, S.; Pace, M. N.; Nyman, J.; Luo, J.; Gentile, M. E.; Fields, M. W.; Hickey, R. F.; Gu,
B.; Watson, D.; Cirpka, O. A.; Zhuo, J.; Fendorf, S.; Kitanidis, P. K.; Jardine, P. M.; Criddle, C.
S. Pilot-scale in situ bioremediation of uranium in a highly contaminated aquifer. 2. Reduction of
U(VI) and geochemical control of U(VI) bioavailability. Environmental Science and Technology
2006, 40, 3986-3995.
(11) Gu, B.; Wu, W. M.; Ginder-Vogel, M. A.; Zhou, J.; Fendorf, S.; Criddle, C. S.; Jardine,
P. M. Bioreduction of uranium in a contaminated soil column. Environmental Science and
Technology 2005, 39, 4841-4847.

22 of 22.
(12) Ganesh, R.; Robinson, K. G.; Reed, G. D.; Sayler, G. S. Reduction of hexavalent uranium
from organic complexes by sulfate- and iron-reducing bacteria. Applied and Environmental
Microbiology 1997, 63, 4385-4391.
(13) Tokunaga, T. K., Wan, J., Kim, Y., Sutton, S. R., Newville, M., Lanzirotti, A., Rao, W.
Real-time X-ray absorption spectroscopy of uranium, iron, and manganese in contaminated
sediments during bioreduction. Environmental Science and Technology 2008, 42, 2839-2844.
(14) Parkhurst, D. L.; Appelo, C. A. J. User's Guide to PHREEQC (Version 2)--A Computer
Program for Speciation, Batch-Reaction, One-Dimensional Transport, and Inverse Geochemical
Calculations. http://wwwbrr.cr.usgs.gov/projects/GWC_coupled/phreeqc/ 2005.
(15) Guillaumont, R.; Fanghanel, T.; Fuger, J.; Grenthe, I.; Neck, V.; Palmer, D. A.; Rand, M.
H.; Mompean, F. J.; Illemassene, M.; Domenechi-Orti, C. Update on the Chemical
Thermodynamics of Uranium, Neptunium, Plutonium, Americium, and Technicium. Elsevier
2003.
(16) Dong, W. M.; Brooks, S. C. Determination of the formation constants of ternary
complexes of uranyl and carbonate with alkaline earth metals (Mg2+, Ca2+, Sr2+, and Ba2+)
using anion exchange method. Environmental Science and Technology 2006, 40, 4689-4695.
(17) Kohler, M.; Curtis, G. P.; Meece, D. E.; Davis, J. A. Methods for estimating adsorbed
uranium(VI) and distribution coefficients of contaminated sediments. Environmental Science and
Technology 2004, 38, 240-247.
(18) Barnett, M. O.; Jardine, P. M.; Brooks, S. C. U(VI) adsorption to heterogeneous
subsurface media: Application of a surface complexation model Environmental Science and
Technology 2002, 36, 937-942.
23 of 23.
(19) Dzombak, D. A.; Morel, F. M. M. Surface Complex Modeling- Hydrous Ferric Oxide.;
Wiley: New York, 1990.
(20) Appelo, C. A. J.; van der Weiden, M. J. J.; Tournassat, C.; Charlet, L. Surface
complexation of ferrous iron and carbonate on ferrihydrite and the mobilization of arsenic.
Environmental Science and Technology 2002, 36, 3096-3103.
(21) Payne, T. E. In Uranium (VI) interactions with mineral surfaces: Controlling factors and
surface complexation modelling.; University of New South Wales: School of Civil and
Environmental Engineering, 1999; Vol. Ph. D. thesis, p 332.
(22) Missana, T.; Garcia-Gutierrez, M.; Fernandez, V. Uranium (VI) sorption onto colloidal
magnetite under anoxic environment: Experimental study and surface complexation modelling.
Geochimica Cosmochimica Acta 2003, 67, 2543-2550.
(23) Lovley, D. R.; Holmes, D. E.; Nevin, K. P. Dissimilatory Fe(III) and Mn(IV) Reduction
Advances in Microbial Physiology 2004, 49, 219-286.
(24) Rabus, R.; Hansen, T. A.; Widdel, F. Dissimilatory Sulfate- and Sulfur-Reducing
Prokaryotes. In The Prokaryotes; Dworkin, M., Ed.; Springer, 2006.
(25) R Development Core Team; R Foundation for Statistical Computing: Vienna, Austria,
2005.
(26) Oksanen, J.; Kindt, R.; O'Hara, B. The vegan package
http://cc.oulu.fi/~jarioksa/softhelp/vegan.html 2005.
(27) Brooks, S. C.; Fredrickson, J. K.; Carrol, S. L.; Kennedy, D. W.; Zachara, J. M.; Plymale,
A. E.; Kelly, S. D.; Kemner, K. M.; Fendorf, S. Inhibition of bacterial U(VI) reduction by
calcium. Environmental Science and Technology 2003, 37, 1850-1858.
24 of 24.
(28) Sani, R. K.; Peyton, B. M.; Amonette, J. E.; Geesey, G. G. Reduction of uranium(VI)
under sulfate-reducing conditions in the presence of Fe(III)-(hydr)oxides. Geochimica
Cosmochimica Acta 2004, 68, 2639-2648.
(29) Ginder-Vogel, M.; Criddle, C. S.; Fendorf, S. Thermodynamic constraints on the
oxidation of biogenic UO2 by Fe(III) (hydr)oxides. Environmental Science and Technology
2006, 40, 3544-3550.

25 of 25.
Brief: Supplying organic carbon to sediments contaminated with U(VI) has opposing effects of
increasing concentrations of soluble U-carbonate complexes and reduction to less soluble U(IV).