infographic vs. data visualization
TRANSCRIPT
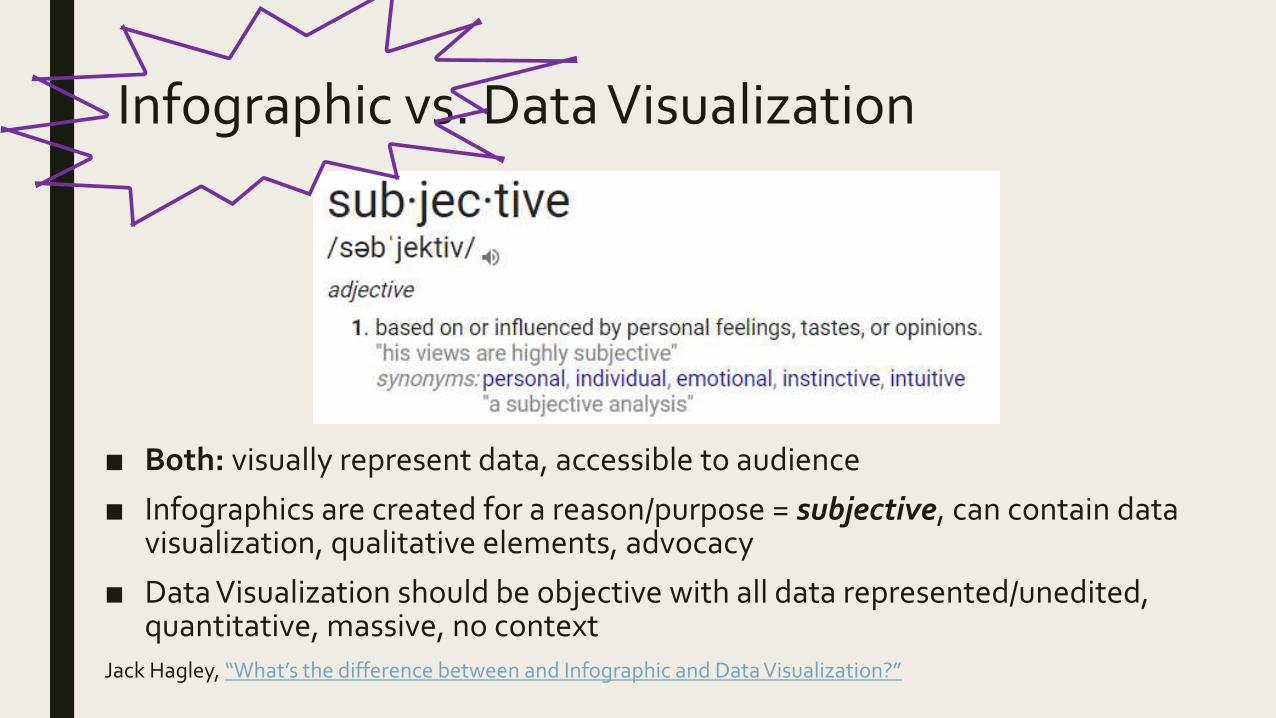
Infographic vs. Data Visualization
■ Both: visually represent data, accessible to audience
■ Infographics are created for a reason/purpose = subjective, can contain data visualization, qualitative elements, advocacy
■ Data Visualization should be objective with all data represented/unedited, quantitative, massive, no context
Jack Hagley, “What’s the difference between and Infographic and Data Visualization?”
INFOGRAPHICSWhat, Why, & How
Anne Hamland, Communications CoordinatorWisconsin Valley Library Service, Wausau
WiLSWorld July 2017
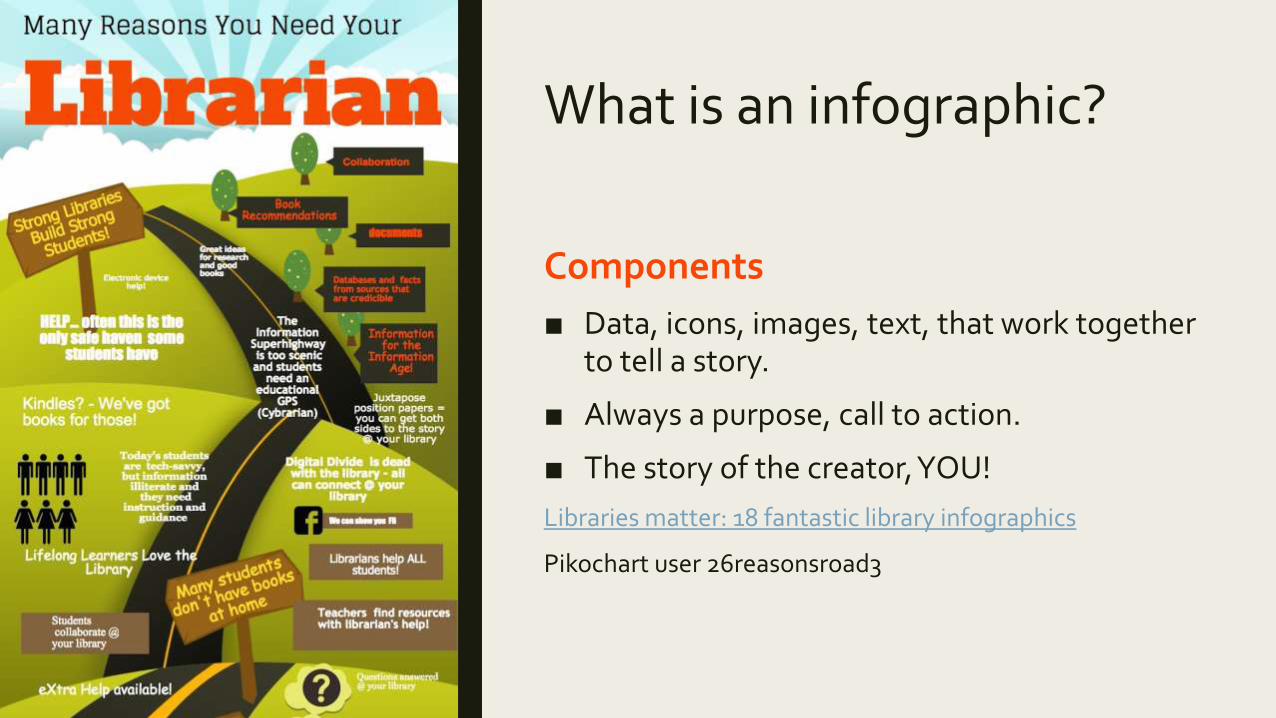
What is an infographic?
Components
■ Data, icons, images, text, that work together to tell a story.
■ Always a purpose, call to action.
■ The story of the creator, YOU!
Libraries matter: 18 fantastic library infographics
Pikochart user 26reasonsroad3
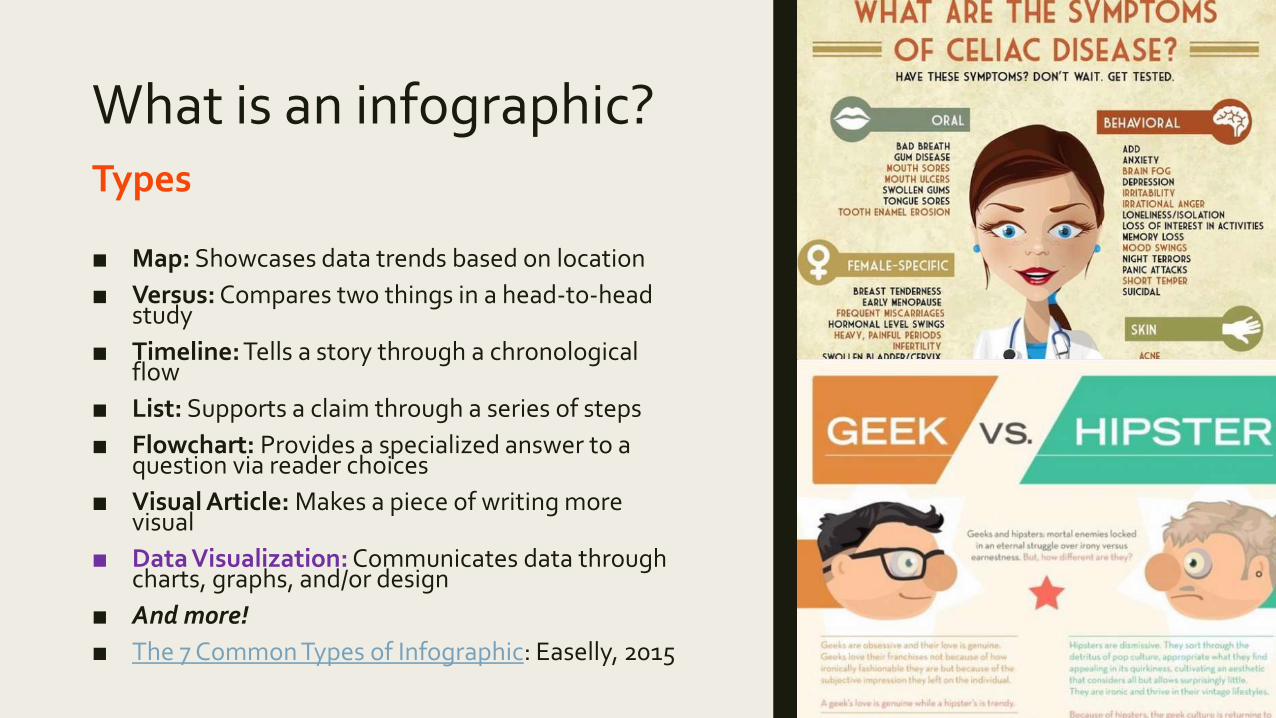
What is an infographic?Types
■ Map: Showcases data trends based on location
■ Versus: Compares two things in a head-to-head study
■ Timeline: Tells a story through a chronological flow
■ List: Supports a claim through a series of steps
■ Flowchart: Provides a specialized answer to a question via reader choices
■ Visual Article: Makes a piece of writing more visual
■ Data Visualization: Communicates data through charts, graphs, and/or design
■ And more!
■ The 7 Common Types of Infographic: Easelly, 2015
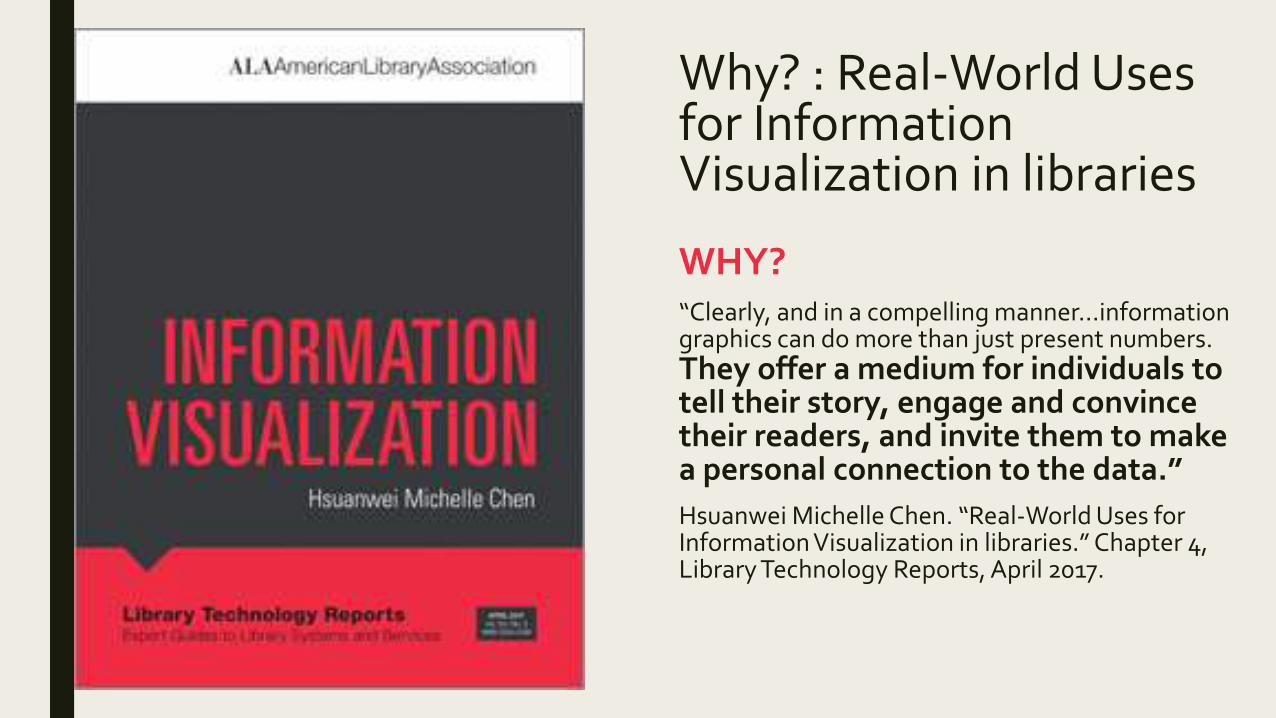
Why? : Real-World Uses for Information Visualization in libraries
WHY?“Clearly, and in a compelling manner…information graphics can do more than just present numbers. They offer a medium for individuals to tell their story, engage and convince their readers, and invite them to make a personal connection to the data.”
Hsuanwei Michelle Chen. “Real-World Uses for Information Visualization in libraries.” Chapter 4, Library Technology Reports, April 2017.
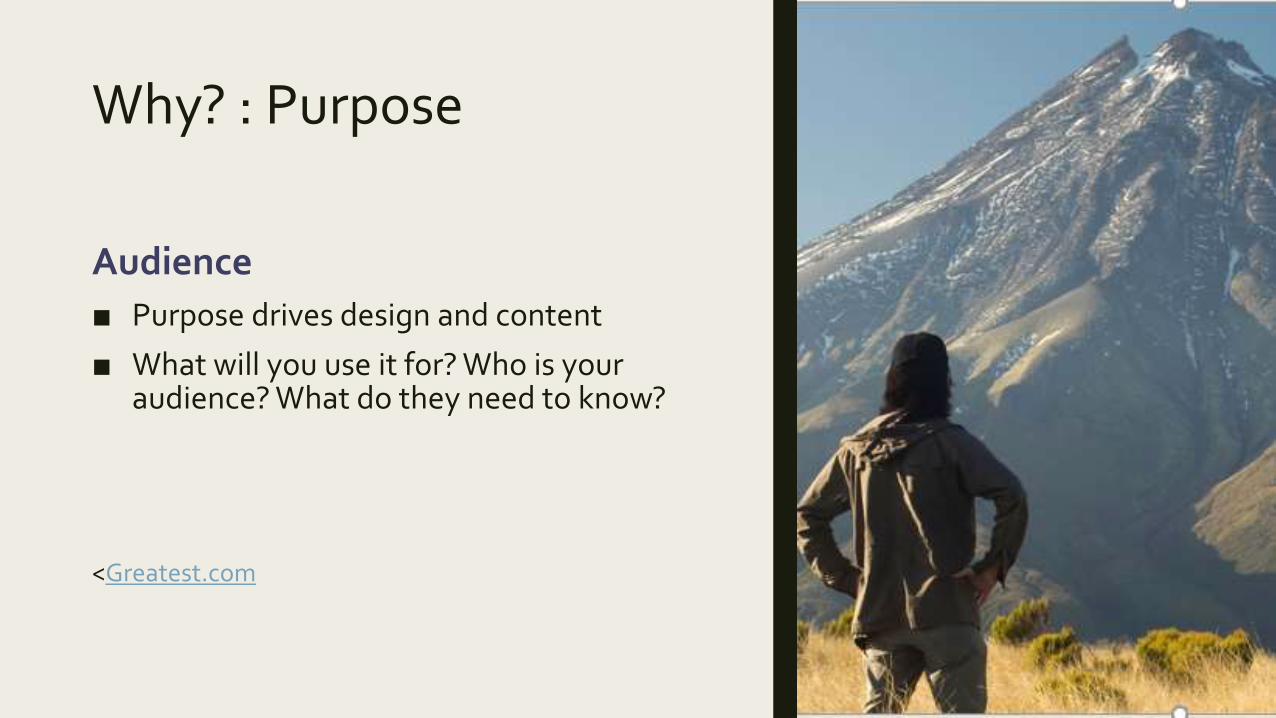
Why? : Purpose
Audience
■ Purpose drives design and content
■ What will you use it for? Who is your audience? What do they need to know?
<Greatest.com
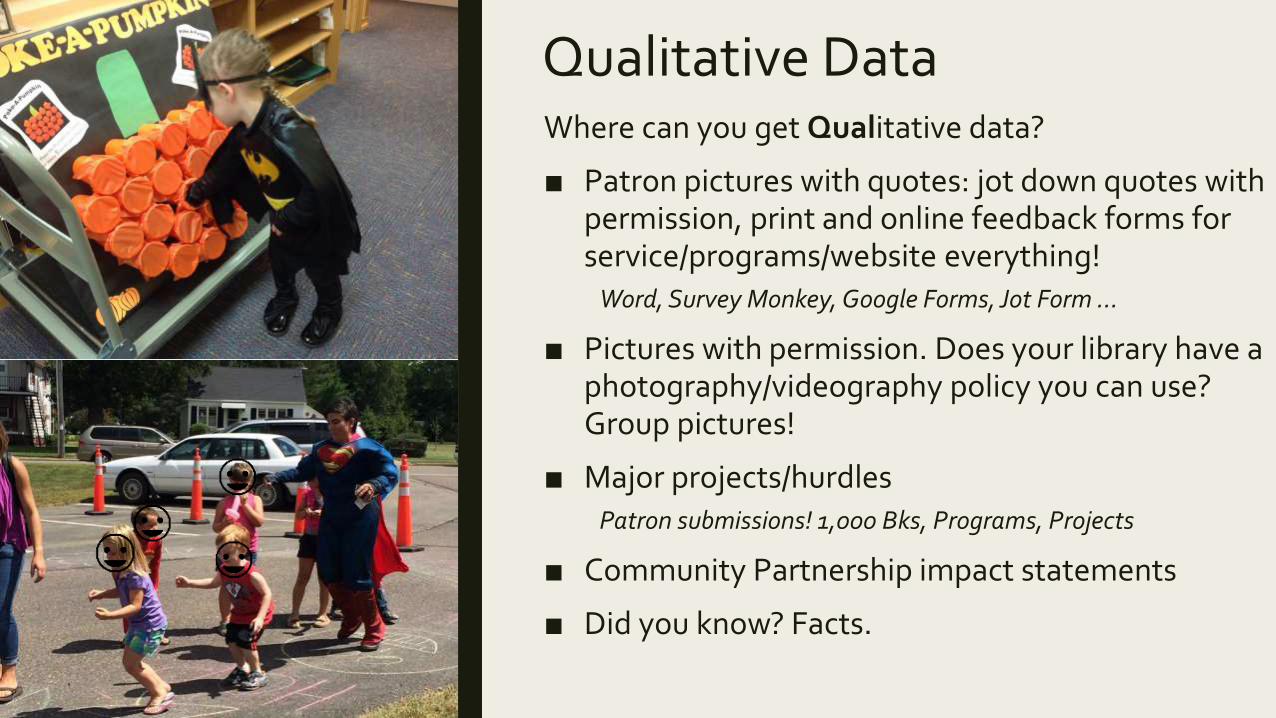
Qualitative DataWhere can you get Qualitative data?
■ Patron pictures with quotes: jot down quotes with permission, print and online feedback forms for service/programs/website everything!
Word, Survey Monkey, Google Forms, Jot Form …
■ Pictures with permission. Does your library have a photography/videography policy you can use? Group pictures!
■ Major projects/hurdlesPatron submissions! 1,000 Bks, Programs, Projects
■ Community Partnership impact statements
■ Did you know? Facts.
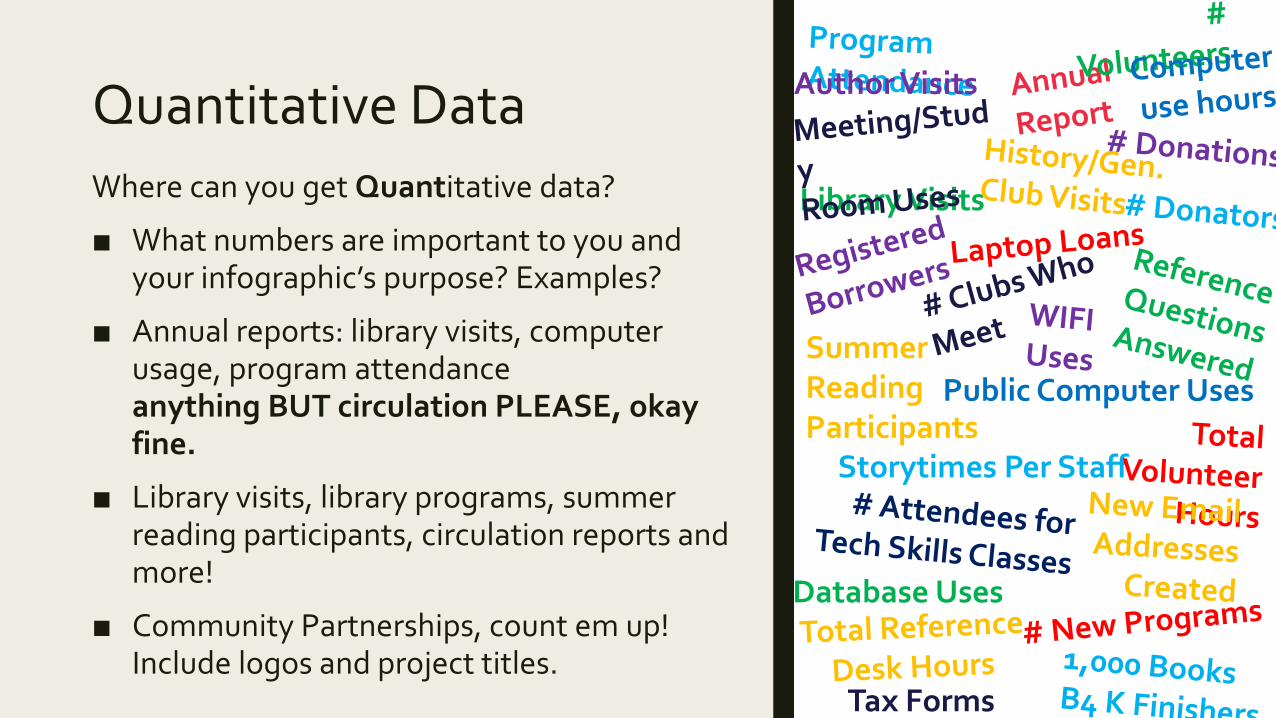
Quantitative Data
Where can you get Quantitative data?
■ What numbers are important to you and your infographic’s purpose? Examples?
■ Annual reports: library visits, computer usage, program attendance anything BUT circulation PLEASE, okay fine.
■ Library visits, library programs, summer reading participants, circulation reports and more!
■ Community Partnerships, count em up! Include logos and project titles.
Library Visits
Summer Reading Participants
Storytimes Per Staff
Author Visits
Database Uses
Public Computer Uses
Tax Forms Dist.
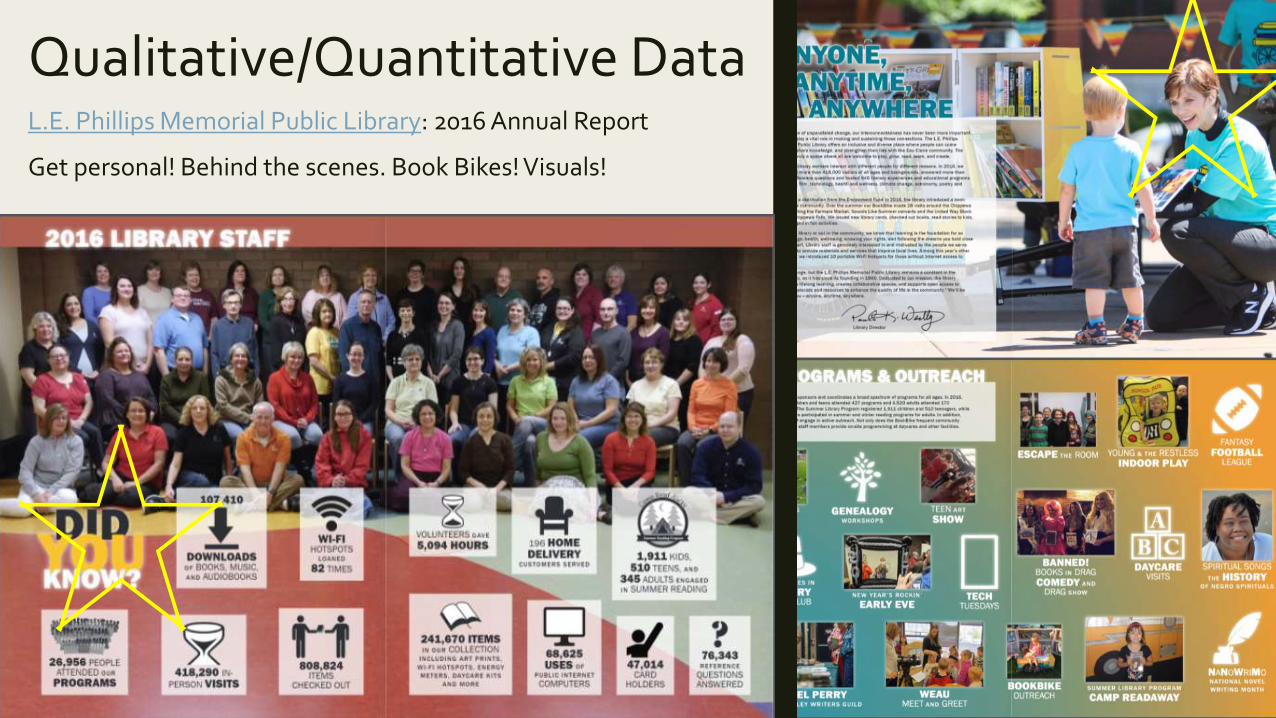
Qualitative/Quantitative DataL.E. Phillips Memorial Public Library: 2016 Annual Report
Get personal! Behind the scenes. Book Bikes! Visuals!
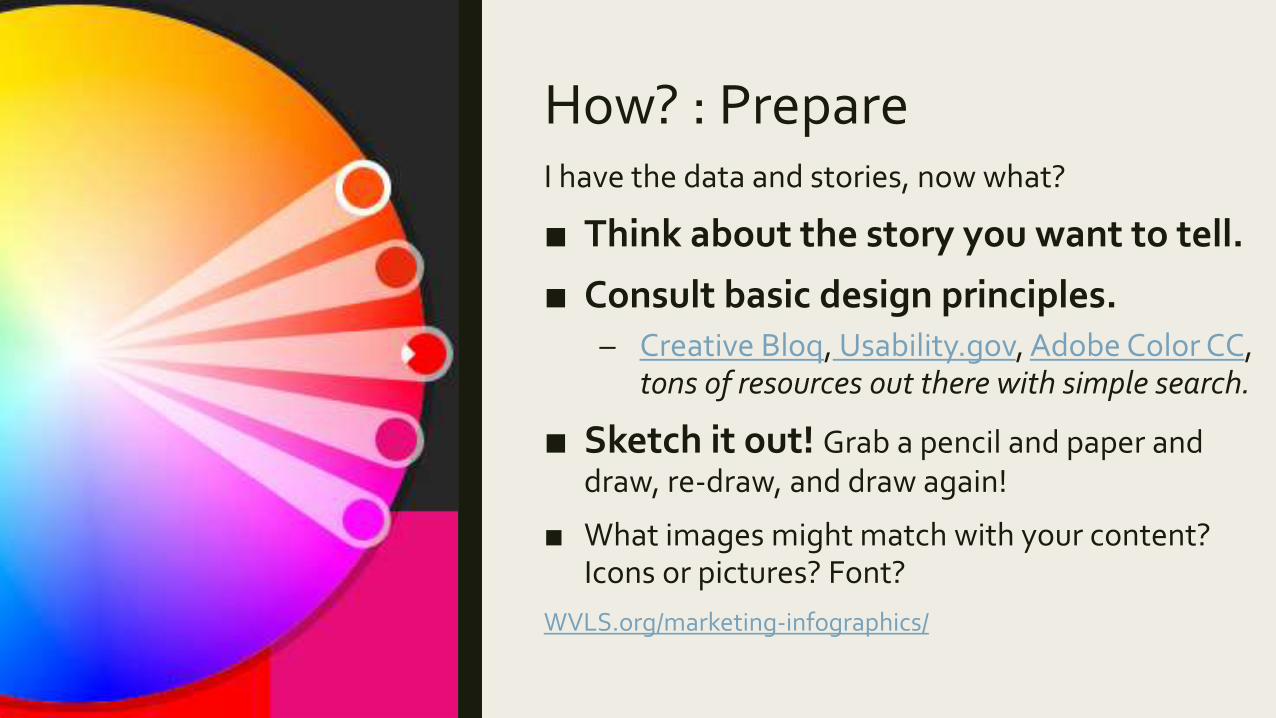
How? : PrepareI have the data and stories, now what?
■ Think about the story you want to tell.
■ Consult basic design principles.– Creative Bloq, Usability.gov, Adobe Color CC,
tons of resources out there with simple search.
■ Sketch it out! Grab a pencil and paper and draw, re-draw, and draw again!
■ What images might match with your content? Icons or pictures? Font?
WVLS.org/marketing-infographics/
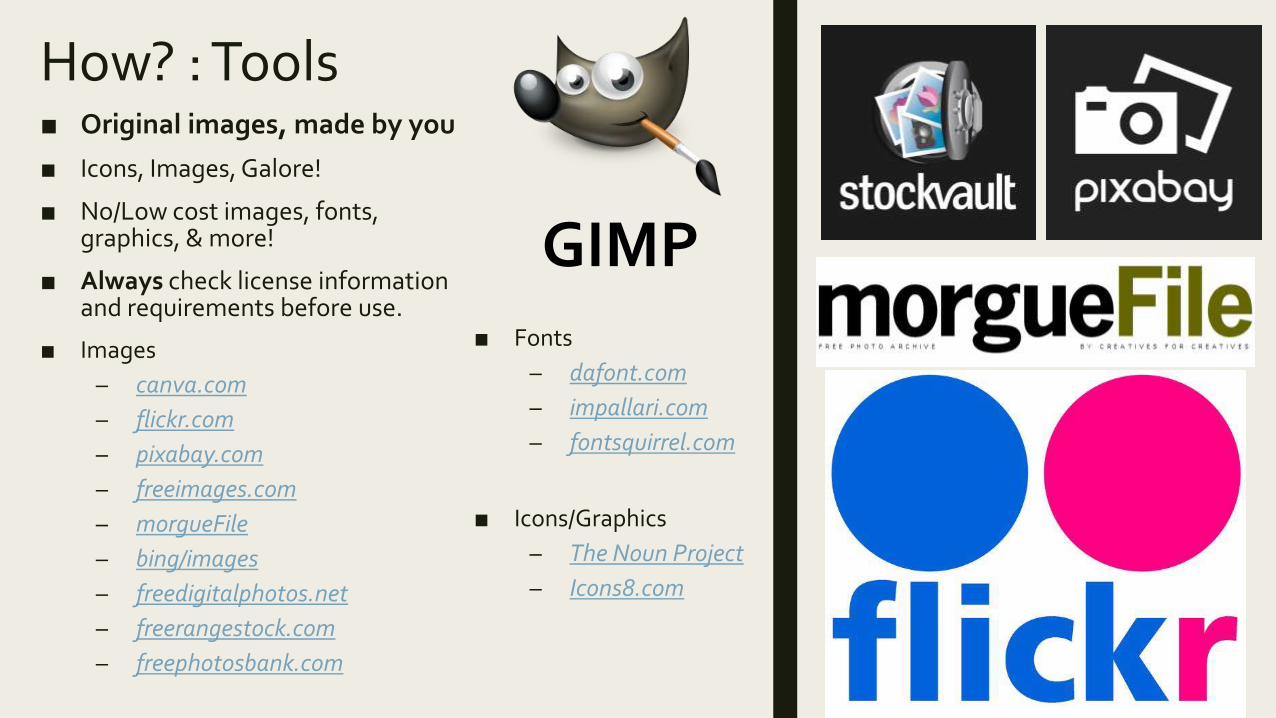
How? : Tools■ Original images, made by you
■ Icons, Images, Galore!
■ No/Low cost images, fonts, graphics, & more!
■ Always check license information and requirements before use.
■ Images
– canva.com
– flickr.com
– pixabay.com
– freeimages.com
– morgueFile
– bing/images
– freedigitalphotos.net
– freerangestock.com
– freephotosbank.com
■ Fonts
– dafont.com
– impallari.com
– fontsquirrel.com
■ Icons/Graphics
– The Noun Project
– Icons8.com
GIMP
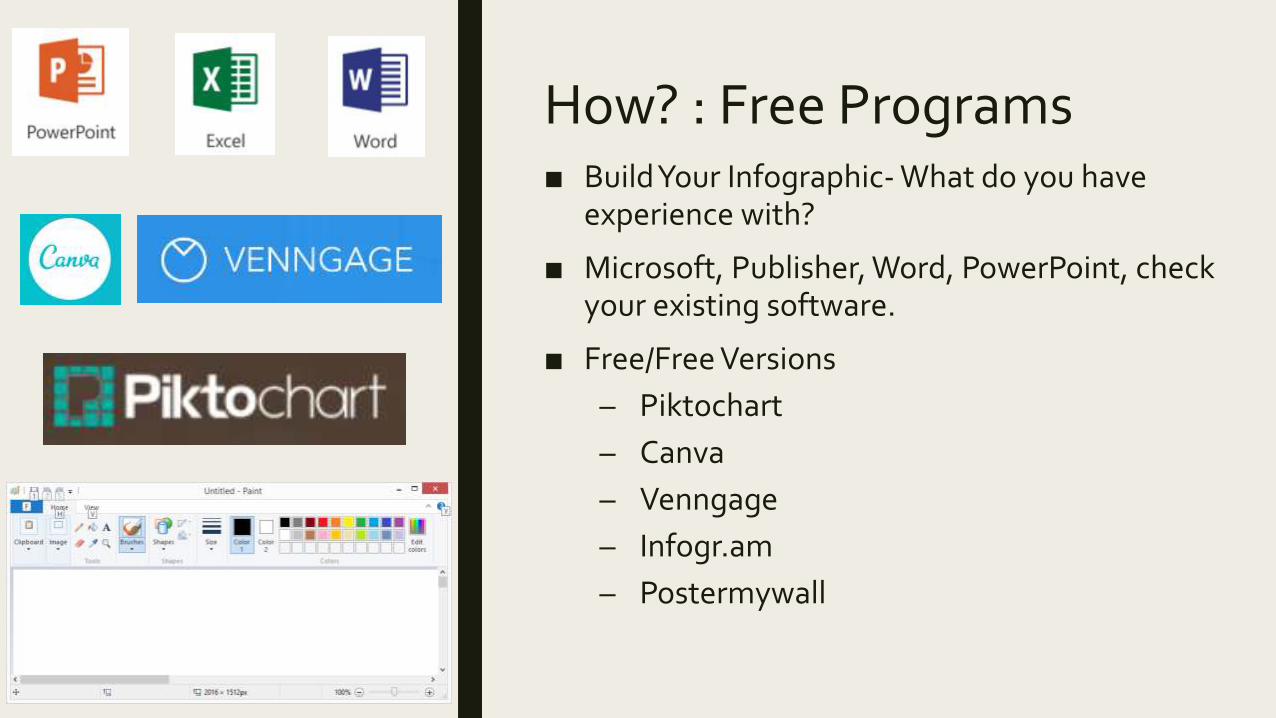
How? : Free Programs■ Build Your Infographic- What do you have
experience with?
■ Microsoft, Publisher, Word, PowerPoint, check your existing software.
■ Free/Free Versions
– Piktochart
– Canva
– Venngage
– Infogr.am
– Postermywall
Thank you!A big thank you to:
■ Marc Neufeld, DoIT Academic Technology, UW-Madison– “Infographics: Turning Data into Narrative” WiLSWorld 2016, workshop
■ Indianhead Federated Library System
Anne Hamland [email protected] 715-261-7250
Communications Coordinator, Wisconsin Valley Library Service