informal risk-sharing cooperatives: the effect of learning
TRANSCRIPT

HAL Id: halshs-01480539https://halshs.archives-ouvertes.fr/halshs-01480539
Preprint submitted on 1 Mar 2017
HAL is a multi-disciplinary open accessarchive for the deposit and dissemination of sci-entific research documents, whether they are pub-lished or not. The documents may come fromteaching and research institutions in France orabroad, or from public or private research centers.
L’archive ouverte pluridisciplinaire HAL, estdestinée au dépôt et à la diffusion de documentsscientifiques de niveau recherche, publiés ou non,émanant des établissements d’enseignement et derecherche français ou étrangers, des laboratoirespublics ou privés.
Informal Risk-Sharing Cooperatives: The Effect ofLearning and Other-Regarding Preferences
Victorien Barbet, Renaud Bourlès, Juliette Rouchier
To cite this version:Victorien Barbet, Renaud Bourlès, Juliette Rouchier. Informal Risk-Sharing Cooperatives: The Effectof Learning and Other-Regarding Preferences. 2017. �halshs-01480539�

Working Papers / Documents de travail
WP 2017 - Nr 6
Informal Risk-Sharing Cooperatives: The Effect of Learning and Other-Regarding Preferences
Victorien BarbetRenaud Bourlès
Juliette Rouchier

Informal risk-sharing cooperatives:
the effect of learning and other-regarding preferences
Victorien Barbeta, Renaud Bourlesb, Juliette Rouchierc ∗a Aix-Marseille Univ. (Aix-Marseille School of Economics), CNRS, EHESS and Centrale Marseille
Chateau Lafarge - 50 Chemin du Chateau Lafarge - Route des Milles - 13290 Les Milles, Franceb Aix-Marseille Univ. (Aix-Marseille School of Economics), CNRS, EHESS and Centrale Marseille
38 rue Frederic Joliot-Curie, 13451 Marseille Cedex 20, Francec LAMSADE, CNRS, [UMR 7243], Universite Paris-Dauphine, PSL Research University, 75016 Paris, France
February 2017
Abstract
We study the dynamics of risk-sharing cooperatives among heterogeneous agents.Based of their knowledge on their risk exposure and the performance of the coopera-tives, agents choose whether or not to remain in the risk-sharing agreement. We highlightthe key role of other-regarding preferences, both altruism and inequality aversion, in sta-bilizing less segregated (and smaller) cooperatives. Limited knowledge and learning ofown risk exposure also contributes to reducing segregation. Our finding shed light on themechanisms behind risk-sharing agreements between agents heterogeneous in their riskexposure.Keywords: Agent-Based, cooperative, risk-sharing, learning, altruism, other-regardingpreferences
1 Introduction
There is ample empirical evidence that agents who are heterogeneous in risk exposure oftenenter into informal risk-sharing agreements. Take for instance agrarian societies in developingcountries, who face a high level of risk. Compounding this is the lack of formal insurance,which prompts individuals to employ various risk-coping strategies relying on informal ar-rangements with other individuals in their network (Morduch [1995]). Apart from agronomictools aimed at reducing risk, there are two principal risk-coping strategies: either smoothingconsumption over time (mostly through savings, lending, debts within the close network),or smoothing consumption across a population, via a group risk-sharing system (Aldermanand Paxson [1992]). Access to money being limited in most agrarian villages in developingcountries, and inflation being very high, this latter strategy of risk-sharing is very common.Here we examine repeated risk-sharing within informal cooperatives, among agents who areheterogeneous in their risk while performing the same activity. We focus one observable fea-ture of risk-sharing, which is that less risky agents agree to share with more risky agents ona regular basis (DeWeerdt and Fafchamps [2011]).
∗E-mail addresses: [email protected]; [email protected]; [email protected]
1

In this paper, we are interested in exploring a risk-sharing dynamics that would yieldcooperatives mixing agents with different risk exposure. To do so, we build a model of risk-sharing cooperatives in which agents who are heterogeneous in terms of risk exposure sharetheir income equally. What we are interested in observing is the dynamics of creation anddestruction of the cooperatives and the degree of homogeneity in existing cooperatives ata moment in time (which we observe with a segregation index). The simulations help usidentify (i) the obvious role of risk-aversion, (ii) the influence of other-regarding preferences,via altruism (Becker [1974]) or inequality aversion (Fehr and Schmidt [1999]), and (iii) thepotential role of learning if it is assumed that agents do not know their risk ex-ante butdiscover it over time.
The main mechanisms behind our results are the following. First, because of risk-aversion,agents are ready to give up (expected) revenue to smooth their consumption. In our setting,this materializes in the fact that an agent with low-risk exposure may be ready to shareincome (equally) with a more exposed one, if she is risk-averse enough (as shown in Bourlesand Henriet [2012]). In that case, although she would stand to lose expected income (as shewill more often transfer wealth than receive) she might agree to share risk to decrease incomevariation. Second, other-regarding preferences – the fact the agents care about the materialwell-being of others – make low-risk agents more willing to share risk with high-risk agents,as it increases their expected utility (see for example Foster and Rosenzweig [2001] on theeffect of altruism on risk-sharing). The main contribution of our paper is to highlight howthese mechanisms can interact with learning in a situation where agents are not perfectlyinformed about their risk exposure and learn it over time. Our results show that imperfectinformation reinforces the effect of risk-aversion and other-regarding preferences. Actually,imperfect information, by making agents less sure about their risk exposure, leads them toshare income more easily. Then, once involved in a risk-sharing agreement (a cooperative),other-regarding preferences make them less inclined to leave, even though they are revealedas low-risk, because doing so would be harmful to the other agents in their cooperative.
Studying the dynamics and the stability of risk-sharing agreements goes back to Townsend[1994], who tests for the assumption of equal sharing of risk (or full insurance) in villages inIndia. He typically finds that risk-sharing is not perfect but that equal sharing providesa good benchmark to explain how individuals cope with uncertainty in village economies.Recent developments, moreover, suggest that full insurance might be rejected because risk-sharing occurs at a lower level than the village (i.e. communities or social network, seeFafchamps and Lund [2003] or Fafchamps and Gubert [2007]), or because of heterogeneityin risk-aversion (Chiappori et al. [2014]). The role of the social network in the formation ofrisk-sharing agreements has also been theoretically investigated by Bramoulle and Kranton[2007], who analyze the formation of risk-sharing agreements when connected agents sharerisk equally. We take this analysis further by adding heterogeneity in risk exposure andother-regarding preferences.
Since Arrow [1965], risk-aversion has been understood as the main motive for risk-sharing.Kimball [1988] confirms this mechanism by showing that higher risk-aversion increases thesustainability of equal sharing (by increasing the discount rate below which equal sharing canbe achieved). More recently, Lazco [2014] shows that – as soon as there is no aggregate risk– an increase in risk-aversion increases risk-sharing.
Part of the literature on risk-sharing agreements argues that the failure of full insurancecan be explained by limited commitment. This means that lucky agents need realize long-term benefits from sharing with less lucky agents (see Ligon et al. [2002] or Dubois et al.
2

[2008]). Bloch et al. [2008] apply this framework to networks and study how the stability ofinformal insurance networks depends on the sharing rule and the punishment strategies. Herewe study the evolution of informal risk-sharing cooperatives when transfers are driven bothby risk-sharing perspectives and other-regarding preferences.
The importance of other-regarding preferences – and more precisely of altruism – in theeconomy of gift giving and transfers goes back to Arrow [1981] and has been reviewed byMercier-Ythier [2006]. Moreover, altruism has been shown to be empirically relevant in ex-plaining risk-sharing (see DeWeerdt and Fafchamps [2011]). The theoretical impact of al-truism on risk-sharing has recently been studied by Alger and Weibull [2008] and Alger andWeibull [2010] in the case of pairs and by Bourles et al. [2017] in the case of arbitrary net-works. Alger and Weibull [2008] highlight the importance of altruism as a social norm thatallows transfers to be enforced, whereas Bourles et al. [2017] show that bilateral altruism canlead to a long chain of transfers under income shocks. We add to this analysis by consideringagents heterogeneous in terms of risk exposure. We also attempt an alternative modeling ofother-regarding preferences, analyzing how inequality aversion (a la Fehr and Schmidt [1999])changes our results.
Few papers have tackled the effect of heterogeneity in risk exposure. From a theoreticalpoint of view, Bourles and Henriet [2012] analyze the incentive-compatible contract betweentwo agents who can be heterogeneous in their probability distribution of wealth. They notablyshow that equal sharing of risk is then optimal if risk-aversion is high enough and heterogeneityis low enough. Empirically, DeWeerdt and Fafchamps [2011] confirm that transfers can occurbetween agents that are heterogeneous in terms of risk exposure, as chronic illness doesnot deter informal agreements. Our paper helps to explain this finding by other-regardingpreferences but also by limited information of own risk exposure, which is subsequently learnt.
In our model, agents’ learning about their profile is central and is based on observation ofrealizations of past income only. In general, learning is used when agents have limited abilityto compute or limited information. In the first case, agents are not able to grasp the fullcomplexity of a problem and need to make several attempts to identify the best response.This is related to learning models in game theory, which generally help to explain the gapsbetween theory and experimental results (Roth and Erev [1995],Camerer and Ho [1999]). Itis also consistent with Agent-based Computational Economics (ACE), a more recent branchof economics (Kirman [2010], Rouchier [2013]). Agent-Based learning models are used inparticular when agents have to learn about an evolving environment (social or physical) orwhen they are heterogeneous in type or characteristics, as in our case. For example, in Mouletand Rouchier [2008] agents learn over time, and through their interactions how to bargainwith each other. Two classic types of learning are reinforcement learning (Brenner [2006])and genetic algorithms (Vriend [2000]). The idea behind learning in this context is thatagents are not optimizing their choices, either because they are limited in information or incomputational ability (Simon [1955]), but that they choose and act on a very simple basisand evaluate ex-post the result of their actions, which they then classify so as to choose the”best” actions in the next steps. The process of learning generally converges to a dynamicequilibrium, which can be optimal (if this can be evaluated), but does not have to be.
Thus, to understand the dynamic evolution of cooperation of heterogeneous agents withlimited knowledge and where no analytical solution can be found, we decided to produce anAgent-Based Model (programming in Netlogo). Very few ABM papers actually deal with risklearning from an individual point of view. Studies have looked at agents playing one-armbandits and choosing risk dynamically, but without considering social interaction (Leloup
3

[2002]). An evolutionary setting for risk has shown that, in a context where agents can havedifferent degrees of success, micro-analysis yields a deeper understanding of possible dynamicsthan a simple macro analysis of averages of risk (Roos and Nau [2010]). However, to the bestof our knowledge, risk-sharing attitudes have not been modeled and studied with ABM.
The rest of the paper consists of four sections. Section 2 presents our model and its basicassumptions in terms of preferences, risk-sharing and information acquisition. In section 3,we describe our simulations and observation protocol for the model. In the fourth section wepresent the effect of learning and other-regarding preferences on the stability and segregationof risk-sharing cooperatives. Finally, we discuss our results and conclude in section 5.
2 A model of endogenously evolving cooperatives
We consider a community of n ≥ 2 agents who live for a fixed number of periods T and ateach period (t = 1, ..., T ) face a risk of income loss (for example, farmers facing a risk of badharvest). At each period, their income either equals y+ with probability (1 − p) or y− < y+with probability p. Agents are heterogeneous with respect to their risk exposure. They can below-risk, i.e. have a low probability (denoted p = p) of bad harvest, or high-risk (p = p > p).We denote by π the proportion of low-risk agents in the community.
2.1 Agents’ utility and learning
Agents can share this risk through cooperatives. A cooperative is here modeled as a risk-sharing agreement between m ≤ n agents who, at any period, agree to share income equally.Therefore, in a cooperative C with m members, the after-sharing income – called here con-sumption – at period t is:
ci,t =
∑j∈C
yj,t
m∀i ∈ C (1)
where yj,t ∈ {y−, y+} represents the income of agent j at time t.
We are interested here in understanding why low-risk agents may be willing to share riskin cooperatives with high-risk agents. Our agents have private preferences represented by anincreasing and strictly concave utility function u (with u′ > 0 and u′′ < 0). Beyond theseprivate preferences, we allow agents to have other-regarding preferences (ORP), i.e. to valuethe well-being of others. In this paper we investigate two forms of ORP: inequality aversion(IA) and altruism.
For altruism, following Becker [1974], Arrow [1981] or Bourles et al. [2017] we assume thatthe social preferences of agent i write:
v(ci,t, c−i,t) = u(ci,t) + α∑j∈Fi
u(cj,t) (2)
where α denotes the coefficient of altruism and Fi is the set of friends of agent i. Fi definesthe (exogenous) social network of agent i, and the sets {Fi}ni=1 describe the entire networkof our community. We focus here on the undirected network, meaning that if j ∈ Fi, theni ∈ Fj .
The overall shape of the network could be an important determinant of the dynamicsand the stability of cooperatives, as discussed in the robustness check section. For the core
4

of the paper, we assume that agents are embedded in a network exhibiting small worldcharacteristics. Following Watts and Strogat [1998], we build the network starting from aregular graph (a ring of n agents each connected to her k nearest neighbors) and rewire it bydeleting each link with probability q and replacing it by a link at random (if q = 1 we end upwith a random graph).
In addition to altruism, we also analyze the effect of another type of other-regardingpreferences: inequality aversion. Following Fehr and Schmidt [1999], we assume that anagent may suffer from creating inequality in utility when leaving a cooperative. In that case,social preferences on agent i write:
v(ci,t, c−i,t) = u(ci,t)−β
n− 1
∑j 6=i
max{u(ci,t)− u(cj,t), 0} −γ
n− 1
∑j 6=i
max{u(cj,t)− u(ci,t), 0}
(3)A key assumption of our model is the information that each agent has regarding her own
risk exposure pi. We assume that before the first period (t = 1), agents have no informationon their type (low-risk, high-risk). They do, however, know the aggregate distribution oftypes in the community (i.e. π, the proportion of low-risk types) and the probability of lossof each type. They can therefore acquire information over time by observing the realizationsof their past income. We build here a Bayesian learning model, that is a Bayesian updatingof beliefs on risk-type. We denote by πi,t agent i’s belief, at time t, about her probability ofbeing low-risk. For all agents i, at time t = 0, πi,0 = π. At each following period, each agentcomputes a Bayesian update of her belief: if at time t she has experienced k losses among thet first periods, her belief about her probability of being low-risk type writes:
πi,t =pk(1− p)t−k
pk(1− p)t−k + pk(1− p)t−k(4)
This gives a relationship between πi,t and πi,t−1 depending on the realization of past income(risk) at time t for agent i: yi,t.
• if yi,t = y−
πi,t =pπi,t−1
pπi,t−1 + p(1− πi,t−1)(5)
• if yi,t = y+
πi,t =(1− p)πi,t−1
(1− p)πi,t−1 + (1− p)(1− πi,t−1)(6)
This belief about their own risk exposure is a key driver of agents’ choice to stay in orleave their cooperative.
2.2 Staying in the cooperative of leaving
If already involved in a cooperative, at each period (after income sharing1), each agent has tochoose whether to remain in this cooperative or to leave it. Bayesian learning makes it fairly
1We assume here that an agent cannot leave the cooperative between the realization of the risk and thesharing of income. In other words, agents commit to sharing when inside a cooperative. For a discussion onlimited commitment, see Ligon et al. [2002] or Dubois et al. [2008].
5

easy to compute the expected utility for an agent of remaining alone:
Eπi,t(u(y)) = πi,t[pu(y−) + (1− p)u(y+)
]+ (1− πi,t) [pu(y−) + (1− p)u(y+)] . (7)
However, due to potential changes in the composition of cooperatives, it is very difficult toform expectations on well-being inside cooperatives. We therefore assume that when decidingwhether or not to leave her cooperative, an agent:
• uses her past experience to infer the value of staying, and more highly values the mostrecent experience (thus taking into account the dynamics of the cooperative)
• does not take into account the possibility of joining another cooperative after leaving.
Formally, in the absence of other-regarding preferences, an agent would leave her cooper-ative if
Eπt(u(y)) ≥ u(ci,t) (8)
where
u(ci,t) =∑s<=t
δ(t−s)u(ci,s)/∆ with ∆ =1− δ
1− δT(9)
u(ct) therefore represents a weighted average of the utilities the agent has had inside thecooperative, giving more weight to the recent past (thereby taking into account the dynamicsof the cooperative). According to equation (8), based on her belief and on the history of thecooperative, an agent will leave the cooperative if she is better off outside than inside thecooperative.
When other-regarding preferences are incorporated into the model, an agent considers theimpact of her choice on others’ well-being, and computes the utility the other members of thecooperative would have without her. Following the previous reasoning, an agent considersthat without her, the cooperative would provide as utility:
u(c−i,t) =∑s<=t
δ(t−s)u
(n.ci,s − yi,sn− 1
)/∆ (10)
Note here that computing all the parameters needed for an agent to make her choiceonly requires her to keep tracking over time her own income and consumption inside thecooperative.
Then, an altruistic agent i leaves her cooperative if:
Eπt(u(y)) + r.α.u(c−i,t) ≥ u(ci,t) + r.α.u(ci,t) (11)
where r represents the number of friends agent i has in her cooperative. Agent i’s decisionto leave a cooperative will only impact the well-being of those of her friends involved in thesame cooperative.
Similarly, an inequality-averse agent i leaves her cooperative if:
Eπt(u(y))− β.max{Eπt(u(y))− u(c−i,t), 0
}≥ u(ci,t) (12)
Once again, we assume here that the agent only considers the impact of her own choiceon the system. The component of inequality aversion which accounts for the dis-utility of an
agent who is disadvantaged compared to others (−γ.max{u(c−i,t)− Eπt(u(y)), 0
}) is always
0, because a necessary condition for i to leave is that Eπt(u(y)) ≥ u(c−i,t).
6

2.3 Creating cooperatives
To assess the stability of risk-sharing cooperatives, we need isolated agents to be able to joinnew cooperatives. We however assume that an agent cannot ”jump” from one cooperative toanother, and that an isolated agent cannot join an existing cooperative. Therefore, the onlyway an isolated agent can share risk is to form a new cooperative with other isolated agents.We assume that only one (randomly selected) agent is able to create a new cooperative at eachperiod. We actually allow the selected agent to build a cooperative with all the isolated agentsin her network at level 2 (i.e. all agents who do not belong to a cooperative and with whomshe has a direct link, as well as all their direct friends). For the model to remain tractable, wedo not allow the selected agent to choose among these isolated agents, nor the other agents tochoose whether or not to join the cooperative. We also consider that a cooperative is alwayscreated, since the selected agent is able to find in her network at level 2 at least one otherisolated agent.2
The social network therefore plays two major roles in our setting. It defines those towardwhom an agent is altruistic (equation (2)) and those with whom an agent can create a co-operative. Note here that the creation of a new cooperative does not involve the creation ofnew links in the network.
2.4 Observing the system: cooperative dynamics and segregation
Using this model, our aim is to study (i) how cooperatives work and evolve and (ii) whichparameters drive low-risk agents to share risk with high-risk agents. As indicators for the firstissue, we follow the size of cooperatives and the fraction of agents involved in a cooperative.To address the second issue, we build a segregation index inside cooperatives. We use anadaptation of the total segregation index based on the number of low-risk agents: nlj and
high-risk agents: nhj in each cooperative j (an isolated agent will then be considered as a
highly segregated cooperative). Denoting nl (respectively nh) the total number of low-risk(resp. high-risk) agents in the community, the total segregation index writes:
D =1
2
∑j≤J
∣∣∣∣∣nljnl − nhjnh
∣∣∣∣∣ (13)
It equals 0 when the proportion of low- and high-risk agents in each cooperative is the sameas in the whole society, and if no agent is isolated. It equals 1 when each cooperatives iscompletely segregated (no cohabitation in cooperatives) or if all agents are isolated. The
2Relaxing either this assumption or the fact that agents cannot jump from one cooperative to anotherwould render the model extremely complicated. This would first call for additional assumptions on how agentsoffer and accept a creation or a change of cooperative, and on the identity of the agent in charge of thedecision. Then, each decision would be conditional on others’ acceptance, which would lead to possibly longcomputations to achieve convergence. For example, if one agent offers to create a cooperative, she chooseson the basis of the information on all other participants, and so do they. If one participant rejects the offer,the offer changes, and a new calculation should take place, conditional on who accepted. This then has to berepeated until convergence, if ever it happens. These concerns led us to choose the most classical evolutionarylogic: any proposed cooperative is created, and all agents evaluate their satisfaction and decide to leave afterone step. This simple setting moreover prevents learning from having both a direct impact on cooperatives’creation (through the mechanism of choice) and on cooperatives’ evolution (through πt in equations (8), (11)and (12)). Automatic creation allows us to disentangle these two effects of learning and to concentrate oncooperatives’ evolution alone.
7

major bias of this index is that it includes isolated agents and does not directly indicatethe composition of the cooperatives. To correct this bias, we use a modified index based ondividing the previous index into two parts. The first part computes the index on isolatedagents (SI). SI only depends on the fraction of isolated agents and the composition of thisfraction. Denoting Il (and respectively Ih) the isolated agents of low-risk type (resp. high-risktype) we have:
SI =1
2
∑i∈Il
1
nl+
1
2
∑i∈Ih
1
nh(14)
SI is the part of D explained by the isolated agent. The second part of D comes fromthe composition of each cooperative and varies between 0, if there is no segregation in co-operatives, and 1 − SI, if cooperatives are completely segregated. Denoting C the set ofcooperatives we have:
0 ≤ SC =1
2
∑j∈C
∣∣∣∣∣nljnl − nhjnh
∣∣∣∣∣ ≤ 1− SI and D = SI + SC (15)
By normalizing SC, we obtain a segregation index on cooperatives DC that equals 0 whenthe proportion of low- and high-risk agents in each cooperative is the same as in the wholesociety, and equals 1 when cooperatives do not mix different risk types:
DC =SC
1− SI(16)
3 Simulation strategy
3.1 Description
As explained above, we analyze our model and the impact of various parameters using agent-based simulations. A typical run works as follow. At t = 0, n artificial agents are createdand the network is built. A proportion π of the agents are given probability of failure p, therest are given probability p. At each following time-step: (i) incomes are realized, beliefs areupdated, and agents in cooperatives share their income equally, (ii) all agents choose whetherto stay in the cooperative they belong to or to leave it (according to equations (8), (11) or(12)) and (iii) one isolated agent is selected up to create a cooperative with her isolated friendsat level 1 and 2, if any. We run the model for T time steps. Note here that each step doesnot necessarily correspond to a real-word time period, but represents instead a theoreticalframework for learning, as is common with this type of modeling.
3.2 Parameter values
For all our simulations, we consider: n = 200, π = 0.5, p = 0.1, p = 0.3, y− = 50 andy+ = 100. Under this setting, it takes about 50 steps for agents to know their type witha probability of 95%. Regarding the discounting of past values of consumption, we assumeδ = 0.5, i.e. a 6-step memory. The more distant past is discounted by more than 98%.
8

We assume that all agents are equally risk-averse3 and have private (or material) prefer-ences represented by a Constant Relative Risk Aversion (CRRA) utility function:
u(c) =c1−ρ − 1
1− ρ(17)
with ρ the coefficient of relative risk-aversion (−cu′′(c)/u′(c) = ρ ∀c).4The network is assumed to be a small world (see Watts and Strogat [1998]) in which each
agent has on average k = 10 friends. We use a rewiring probability q = 0.10.We are interested here in analyzing the impact of learning, risk-aversion and other-
regarding preferences. To understand the effects of limited knowledge of risk exposure and oflearning, we study two polar cases. Either agents perfectly know their risk type from t = 0or they only know π = 0.5 at that time and learn about their own exposure over time (seeequations (4) to (6)). Regarding risk-aversion, we consider alternative values of ρ between 1and 4 (see Kimball [1988], Chetty [2006] and Meyer and Meyer [2005]). For other-regardingpreferences, we consider values of 0, 0.2 and 0.4 for the coefficient of altruism α (according toHamilton’s rule, two siblings should have a coefficient of altruism of 0.5, see Hamilton [1964a],Hamilton [1964b]); and values for advantageous inequality aversion β of 0, 0.4 and 0.8, in linewith assumptions and observations in Fehr and Schmidt [1999].
3.3 Statistical methodology
Let us first provide a stability analysis of our model to define the number of time periodsover which we study the evolution. We are looking for values of T above which the modelis stable, in terms of number of cooperatives and degree of segregation. We are also able todefine a degree of relative risk-aversion that is neither too low for the agents to be willing toshare risk, nor too high for other parameters to influence the willingness of low-risk agents togroup with high-risk agents (when risk-aversion is very high, low-risk agents agree to sharerisk with high-risk agents even in the absence of learning or other-regarding preferences).
After defining the number of periods and the coefficient of relative risk-aversion, we analyzethe effect of our key parameters as follow. For each set of parameters, we run 1000 simulationsand plot the resulting distribution of our indicators (chiefly mean cooperative size , fractionof agents in cooperatives and degree of segregation in the existing cooperatives). This allowsus to analyze the effect of each parameter visually, using the notion of stochastic dominance.
To limit the path-dependence that might drive some of the results, we complement thisanalysis with deterministic histories of income (good/bad harvest). We study the effect ofeach parameter by comparing our indicators for 100 pre-defined histories (a history being ann by T matrix of y− and y+) and plot the difference using box plots, so as to determine towhat extent the effect of a parameter is significant.
3.4 Stability analysis
3.4.1 General Dynamics of the Model
Let us first analyze the dynamics and the stability of our model.
3see. ? for a discussion on heterogeneity in risk-aversion4CRRA utility functions present the advantages of having already been used by Kimball [1988] in his seminal
paper on cooperatives and of allowing for the estimation of the risk-aversion parameter (see for example Kimball[1988], Chetty [2006] or Meyer and Meyer [2005] who estimate ρ to be in the range [1.1; 6]).
9

Figure 1: Illustration of the different regimes based on the number of cooperatives. Themoving average is the mean of the indicator over the last 50 periods. We observe sharpconvergence during the learning regime, a smoother readjustment during the convergenceregime and then oscillations around the “stabilized level”. The vertical yellow and green linesindicate respectively the level reached at t = 50 and t = 100.
The first and simplest of the dynamics concerns learning. Our choice of parametersmeans that learning takes about 50 rounds (beyond which, agents have over 95% probabilityof knowing their type).
The system is however not stable once agents know their type. The learning regime isfollowed by a so-called “convergence” regime during which our indicators converge to the sta-bilized level (this is illustrated in Figure 1 using the dynamics of the number of cooperatives).The end of this convergence depends on the indicator, but it generally ends at around t = 100.Then, indicators oscillate around their stabilized level, in what we call the “stabilized” regime.
Based on these dynamics, we focus on three main dates for our analysis: t = 50, theend of the learning regime, t = 100, the end of the convergence regime, and t = 250, whenstabilization is achieved. To smooth oscillations (in the last regime) and analyze the wholeof the first two regimes, we look at mean values for our indicators for the previous 50 roundsat these 3 points in time.
3.4.2 Calibrating the level of risk-aversion
To highlight the effects of other-regarding preferences and learning, we seek to set an in-termediate level of risk-aversion. As already pointed out, risk-aversion intuitively stabilizescooperatives, increases the fraction of agents involved in cooperatives and overall helps to re-duce segregation (see e.g. Kimball [1988] and Bourles and Henriet [2012]). This is illustrated
10

in section A.1. We therefore set (as a benchmark) a level of relative risk-aversion ρ = 2.5.Below this (e.g. at 1.5), the stabilizing effect of risk-aversion is too weak, cooperatives dis-appear quickly, few agents stay in them, and segregation is very high. Above this threshold(e.g. at 3.5) the stabilizing effect is too strong, leading to a large range of scenarios, fromone in which the population is completely segregated to one in which cohabitation betweendifferent risk profiles is very easy. This would limit our ability to analyze the effect of otherparameters on segregation.
4 Results and explanatory mechanisms
We now turn to our main results: the effects of other-regarding preferences and learningon the evolution of cooperatives and segregation (the effect of network shape is detailed inappendix A.2).
Our findings are:
• ORP decrease segregation and cooperative size. In the case of altruism, cooperativesare less stable and the fraction of agents in cooperatives also decreases. This unexpectedinstability comes from the fact that altruism also induces some high-risk agents to leavetheir cooperatives because of the negative effect they have on other members. This effectindeed disappears when we restrict ourselves to cases in which agents cannot leave acooperative when they are benefiting from it.
• Limited knowledge of risk exposure has a large impact during the learning regime, whichdisappears gradually. It still reduces segregation during the convergence regime. Whencoefficients of inequality aversion or altruism are high this effect mainly comes from low-risk agents who stay in cooperatives (although they would have left if they had knowntheir type) and are then “trapped” – even when they discover their type – because oftheir other-regarding preferences.
These effects are not only due to changes in individual behaviors but also depend on moremacro mechanisms based on stocks and flows of agents, described in the next section.
4.1 The macro dynamics of the model
The macro dynamics of our model (an emerging phenomenon in ABM) is summarized inFigure 4.1. In ABM we define ex-ante the local rules for interactions and decisions of ouragents and the scheduling of the model. The macro dynamics presented here is not directlyimplemented in our model but is the consequence at macro level of the local behavior of ouragents. We chose ex-post to represent this macro dynamics as a stock and flow chart becausewe think this is the best key to understanding the results we observe. We can identify tworelevant stocks:
1. The stock of isolated agents, characterized by its composition of low- and high-riskagents and the density of the network linking these agents in autarky.
2. The stock of agents in cooperatives, characterized by the number, the size, and thecomposition of cooperatives.
11

These two stocks are mathematically linked at every point in time by the following relation:Stock.Autarky = Total.population − Stock.in.Coop. Still, this relationship alone does notsufficiently clarify the dynamics, so we detail to understand well the dynamic, so we detailthe flows between these two stocks.
There are two flows linking these stocks:
Flow A: One flow comes from the creation of cooperatives. It depletes the stock of isolatedagents and increases the stock of agents in cooperatives. This flow is shaped by thenumber of isolated agents. As there is at most one cooperative created per round, itis the same size as this new cooperative. One agent is randomly picked to create acooperative with her friends and the friends of her friends. Thus, the larger the stock ofisolated agents, the lore likely the chosen agent is to find a lot of agents in her networkto create her cooperative (arrow 1). This relationship between the size of the stockin autarky and flow A is very important for the general dynamics. A second factorinfluencing flow A is the density of the network connecting agents in autarky. For thesame stock, a higher density leads the selected agent to gather more agents (arrow 7).
Flow B: The other, opposite flow corresponds to agents leaving cooperatives. For a givenstock of agents in cooperatives, a larger flow implies (logical link) and is the consequence(causal link) of greater instability in cooperatives. The less (resp. the more) stable thecooperatives, the larger (resp. the smaller) this flow for a given stock (arrow 2). Thus,flow B is only driven by the micro level dynamics whereas flow A is essentially driven bythe level and the nature of the stock of agents in autarky (i.e. by macro components).
From this structure we can infer the following:
• As the composition of flow B influences the composition of the stock of agents in autarky(dashed arrow 3), which in turn influences the composition of the new cooperativecreated (arrow 4), when the composition of flow B is stable, all these compositionsbecome similar.
• When the stock of agents in cooperatives remains stable (as in the stabilized regimefor example), a smaller stock increases cooperatives instability at the micro level. Forthe stock to be stable, flows A and B have to be equal. If there are few agents incooperatives (and therefore a lot of agents in autarky), flow A is large, leading to alarge flow B and therefore unstable cooperatives.
This macro structure already yields some intuitions about the mechanisms behind ourindicators:
Size of cooperatives. The average size of cooperatives is influenced both by the size of thenew cooperative (dashed arrow 6) and by the micro dynamics at cooperative level.
The fraction of agents in cooperatives. The fraction of agents in cooperatives only de-pends on the stock of agents in cooperatives, as it is the ratio of this stock to thetotal number of agents. Therefore, a stable low fraction means great instability in thecooperatives.
Segregation in cooperatives. At the macro level, the most important factor influencingsegregation is the composition of the leaving flow, which impacts the composition of
12

Stock of agentsalone (in autarky)
Composition of the stock
Network density
Stock of agentsin cooperatives
Composition of coop.
Size of coop.# of coop.
Flow of agents entering coop.
# agents in the new coop. created this turn
=
Flow of agents leaving coop.
# agents leaving coop. this turn
=
Composition of the flow
Composition of the flow
++
Stability of cooperatives
-
1
2
3
4~
~
~
56
A
BStock.Autarky = Total.population - Stock.in.Coop
: Flow of agents
: Causal relationship between two elements. When dashed the relationship is weak and the second element also depends on micro mechanisms.
+ : an increase in the first element implies an increase in the second, ceteris paribus
- : an increase in the first element of the arrow implies a decrease in the second, ceteris paribus
~ : indicates similarity between the two elements of the arrow.
7 +
Figure 2: Scheme of the macro dynamics of the model
13

new cooperatives. If all the new cooperatives created are already highly segregated,segregation is likely to be large and only depends on internal cooperative mechanisms(dashed arrow 5). Segregation thus depends strongly on who leaves cooperatives, if thecomposition of this flow is stable enough.
We now turn to the micro dynamics at cooperative level (both creation and destruction),examining the relationship between these micro dynamics and the above effects, to explainthe mechanism behind our results.
4.2 The baseline scenario
Let us first briefly describe the typical evolution of cooperatives with neither ORP nor learn-ing. The effects of our various parameters can then be understood in terms of departuresfrom this baseline scenario.
At the beginning, all agents are available to form new cooperatives, which are thereforequite big. Low-risk agents, however, quickly leave these initial cooperatives, whereas mosthigh-risk agents stay. Most of the isolated agents are thus low-risk. They end up creatingstable cooperatives among themselves. At this point, homogeneous cooperatives are verystable. As all agents in these cooperatives are of the same risk type, they have the sameexpected utility in isolation, and as soon as the expected utility of a cooperative is lower thanthis utility in isolation all the agents simultaneously leave the cooperative. Hence cooperatives’survival is extremely path-dependent, as is the composition of the leaving flow. This leads tohigh levels of segregation.
4.3 Other-regarding preferences
We now analyze the effect of other-regarding preferences: inequality aversion (IA, see equa-tions (3) and (12)) and altruism (alt., see equations (2) and (11)).
The two models lead to different results due to the fact that high-risk altruistic agentsinternalize their negative effect on low-risk agents. If this effect is ignored, both ORPs reducesegregation and the mean size of cooperatives.
4.3.1 Inequality aversion
Let us first consider the effects of inequality aversion, see Figure 3.
On segregation (top right panel). IA reduces segregation. This effect lasts throughoutthe three regimes: learning (t = 50), convergence (t = 100) and stabilized (t = 250) andis non linear: a change from β = 0 to β = 0.4 has little impact, while a change fromβ = 0.4 to β = 0.8 has a major effect.
On the fraction in cooperatives (bottom right panel). IA has almost no effect on thefraction of agents involved in cooperatives in all three regimes. The only exception isfor a high level of inequality aversion (β = 0.8) during the learning regime, where thefraction of agents in cooperatives slightly increases.
On the size of cooperatives (left panels). IA durably decreases the size of cooperatives.This effect appears during the learning regime and stabilizes during the convergenceregime.
14

0.0
0.1
0.2
0.3
0.4
0.5
5.0 7.5 10.0 12.5 15.0size of coops at 50
RA = 2.5, altruistic = 0, K.h.T = true
dens
ity
Inequality.aversion0
0.4
0.8
Effect of IA on size of coops at 50
0
3
6
9
12
0.6 0.7 0.8 0.9 1.0segreg. in coops at 250
RA = 2.5, altruistic = 0, K.h.T = true
dens
ityInequality.aversion
0
0.4
0.8
Effect of IA on segreg. in coops at 250
0.00
0.25
0.50
0.75
5.0 7.5 10.0 12.5 15.0size of coops at 250
RA = 2.5, altruistic = 0, K.h.T = true
dens
ity
Inequality.aversion0
0.4
0.8
Effect of IA on size of coops at 250
0
5
10
15
0.6 0.7 0.8 0.9 1.0fraction in coops at 250
RA = 2.5, altruistic = 0, K.h.T = true
dens
ity
Inequality.aversion0
0.4
0.8
Effect of IA on fraction in coops at 250
Figure 3: The effect of inequality aversion. The left panels represent the effect of IA on thesize of cooperatives during the learning and stabilized regimes. The right panels representthe effect at t = 250 on the segregation index and the fraction of agents in cooperatives,respectively.
15

Inequality aversion thus durably decreases segregation (with a non linear effect) and en-genders smaller cooperatives in the long term. The main mechanisms behind these resultsare the following:
• IA has a greater impact on small cooperatives. This is driven by two effects. First,the impact of an agent’s realization of income on everyone’s consumption is greaterin a small cooperative. Second the impact of one agent leaving a large cooperative issmaller than the impact of her leaving a small cooperative. The stabilizing effect of IAis therefore higher in smaller cooperatives.
• Agents of the same risk type in the same cooperative can have different expected utilitiesdepending on their individual realizations of past income (see equation 12). A verysuccessful agent impacts more agents if she leaves, so that her incentive to stay is higher.The most successful agents are then “trapped” in the cooperative. Thus, contrary towhat happens in the baseline scenario, all agents of the same type will not leave theircooperatives at the same time.
We can now describe a typical scenario behind the results.As in the baseline scenario, large cooperatives of mixed composition are first created. The
low-risk agents leave them quite quickly, changing the composition of the stock of isolatedagents to almost 20% high-risk against 80% low-risk. Almost all newly created cooperativesthus reflect this in their composition, and the negative effect on consumption induced by thissmall fraction of high-risk agents is borne more easily by the low-risk agents, who stay inthe cooperatives longer. They still leave but more slowly, and not all at the same time, asexplained above. This ensures a mix which lasts longer and decreases segregation.
In terms of macro dynamics, agents now leave the cooperative individually (not in largegroups as in the basic scenario) and thus do not greatly modify the composition of the stockof agents in autarky. This stabilizes the composition of newly created cooperatives. Thisself-reinforcing process at macro level leads to lower segregation.
Surprisingly the small leaving flow does not increase the fraction of agents in cooperatives,due to the lower density of the network of isolated agents (see section 4.1). As agents of thesame type leave their cooperative at different times, they leave most of their friends behindand have less friends in autarky to create new cooperatives. Finally, as IA stabilizes smallcooperatives, cooperatives are smaller on average.
4.3.2 Altruism
To observe the effect of altruism, see Figure 4.
On segregation (left panels). Altruism decreases segregation. This effect lasts through-out the three regimes, tends to intensify as time goes by and seems almost linear inα.
On the fraction in cooperatives (top right panel). Altruism durably decreases the frac-tion of agents in cooperatives.
On the size of cooperatives (bottom right panel) Altruism durably decreases the sizeof cooperatives.
16

0.0
2.5
5.0
7.5
0.6 0.7 0.8 0.9 1.0segreg. in coops at 50
RA = 2.5, IA = 0, K.h.T = true
dens
ity
altruistic0
0.2
0.4
Effect of altruism on segreg. in coops at 50
0
5
10
0.6 0.7 0.8 0.9 1.0fraction in coops at 250
RA = 2.5, IA = 0, K.h.T = true
dens
ityaltruistic
0
0.2
0.4
Effect of altruism on fraction in coops at 250
0
3
6
9
12
0.6 0.7 0.8 0.9 1.0segreg. in coops at 250
RA = 2.5, IA = 0, K.h.T = true
dens
ity
altruistic0
0.2
0.4
Effect of altruism on segreg. in coops at 250
0.0
0.2
0.4
0.6
6 8 10 12 14 16size of coops at 250
RA = 2.5, IA = 0, K.h.T = true
dens
ity
altruistic0
0.2
0.4
Effect of altruism on size of coops at 250
Figure 4: Effect of altruism. The left panels represent the impact of altruism on segregationat the end of the learning (t = 50) and the stabilized (t = 250) regimes. The right panelsrepresent the effect on the fraction of agents in cooperatives (top-right panel), and the size ofcooperatives (bottom-right panel) at t = 250 (the end of the stabilized regime).
17

Altruism thus durably decreases segregation at the cost of fewer people in cooperativesand smaller cooperatives.
The two mechanisms at work with IA also hold for altruism. The effect of altruism isstronger in small cooperatives and the decision of an agent to leave also depends on herown realizations of past income (not only on the cooperative’s performance). In addition,a third mechanism means that altruism can lead agents who performed badly to leave theircooperatives so as to protect their friends. With altruism, utility has two parts (see equation2): a material utility agents derive from their consumptions (which only depend on the resultsof their cooperatives), and a social utility derived from the utility of their friends. Whateverthe risk profile of an agent, consecutive bad results lead to large material utility gains from thecooperative, but decreased social utility, as the utilities of other members of the cooperativedecrease. If gains in material utility are lower than losses in social utility, the agent leaves thecooperative. This mechanism makes the model with altruism less stable than the model withIA or the baseline model. This also explains why altruism decreases the fraction of agents incooperatives.
The typical scenario behind these results is the same as that for IA, except that the leavingand entering flows are larger. the compositional stability (around 20% of high-risk agents and80% of low-risk agents) of these flows is self-sustaining. The cooperatives created, whennot solely composed of low-risk agents, contain few high-risk agents. Low-risk agents leavelittle by little over time, which again makes cooperatives more mixed, less segregated. As thecooperatives get smaller and the stabilizing effect of altruism gets stronger, the remaining low-risk agents are “trapped” in the cooperatives. The eventual demise of the small cooperativesis due to the high volatility of their consumption and the departure of agents who performbadly, as explained previously.
4.3.3 Modified Altruism
We study a modified version of altruism where agents take into account the effect on theirfriends (i.e. social utility) only when it is positive. Equation (11) becomes:
Eπt(u(y)) ≥ u(ci,t) + r.α.max{u(ci,t)− u(c−i,t), 0
}(18)
It can be seen from Figure 5 illustrate that this modified version of altruism produces morestable cooperatives but also greater segregation. There is no longer the instability observedwith normal altruism (as defined in the literature): the fraction of agents in cooperatives issimilar to the level observed without ORP or with IA; and cooperatives are slightly largerthan with normal altruism. Still, they remain smaller than without ORP (see right panels ofFigure 5).
The effect on segregation is almost the same as with normal altruism during the learningregime (top left panel) but is lower during the stabilized regime (bottom left panel). Themodified altruism leads to a less stable composition of the leaving flow and of the stock ofisolated agents. The dynamics is thus closer to that observed without ORP, explaining thisincrease in the segregation index.
These results and the mechanisms behind them are further described in appendix B.1.
18

0.0
2.5
5.0
7.5
0.6 0.7 0.8 0.9segreg. in coops at 50
RA = 2.5, IA = 0, altruistic = 0.4, K.h.T = true
dens
ity
altruism.typeno
normal
modified
Effect of altruism type (0.4) on segreg. in coops at 50
0
5
10
0.55 0.65 0.75 0.85fraction in coops at 250
RA = 2.5, IA = 0, altruistic = 0.4, K.h.T = true
dens
ity
altruism.typeno
normal
modified
Effect of altruism type (0.4) on fraction in coops at 250
0
3
6
9
12
0.6 0.7 0.8 0.9segreg. in coops at 250
RA = 2.5, IA = 0, altruistic = 0.4, K.h.T = true
dens
ity
altruism.typeno
normal
modified
Effect of altruism type (0.4) on segreg. in coops at 250
0.0
0.2
0.4
0.6
6 8 10size of coops at 250
RA = 2.5, IA = 0, altruistic = 0.4, K.h.T = true
dens
ity
altruism.typeno
normal
modified
Effect of altruism type (0.4) on size of coops at 250
Figure 5: Effect of the modified version of altruism. The different colors distinguish noaltruism (α = 0), normal altruism (equation 11) and modified altruism (quation 18), bothwith α = 0.4. The right panels represent the effect on the fraction of agents in cooperativesand on the size of cooperatives at t = 250. The left panels represent the effects during thelearning and the stabilized regimes.
19

4.4 Information on risk types; Learning
We now analyze the effect of limited knowledge of risk type and Bayesian learning on segre-gation.
We correct for path dependence by considering the same histories, i.e. the same real-izations of past income with and without learning. For each set of parameters we run 10simulations for each of the 100 histories, a total of 1000 simulations. Let Ish,j be the value of
indicator I for the jth simulation of history h (with j ∈ {1, .., 10} and h ∈ {1, .., 100}) underset of parameters s. Call s and s′ two identical sets except that there is learning in s′ and nolearning in s. We can now compute the effect of learning by computing for each h and j thedifference Is
′h,j − Ish,j . By looking at the statistical characteristics of these 1000 differences,
we can infer the impact of learning. We also useIs′
h,j−Ish,j
Ish,jto look at the relative impact of
learning.We represent these results using box and whiskers plots (see Figures 6 and 7). Each box
shows the median, the 25% and the 75% quantile. The inter-quantile range (IQR) is theheight of the box, and the whiskers are the smallest (resp. the greatest) observation greater(resp. smaller) than or equal to the 25% quantile - 1.5 * IQR (resp. 75% quantile + 1.5 *IQR). Points are observations outside these limits.
Our main result therefore is that learning improves risk-sharing among heterogeneousagents during the learning and the convergence regime. This effect however disappears duringthe stabilized regime.
The mechanism behind these results is the following. During the learning regime, agentsignorant of their risk type make mistakes. Their expected utility in isolation is then computedbased on their beliefs (see equation 7), making low-risk (resp. high-risk) agents computea lower (resp. higher) expected utility than the real one. Low-risk agents will thereforestay longer in cooperatives with high-risk agents. This decreases segregation and increasescooperative size of cooperatives, at least during the learning regime.
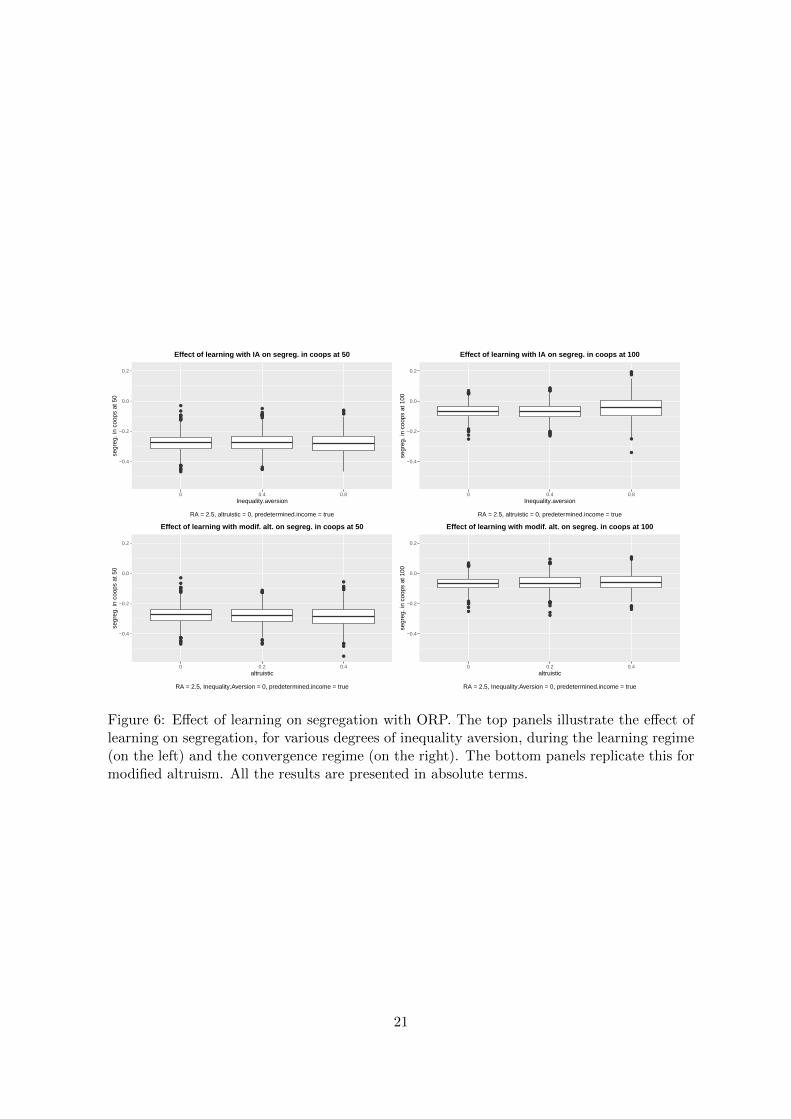
In absolute terms (Figure 6), the effect of learning does not depend on the level of ORP.This could be taken to imply the absence of interaction between ORP and learning. Howeveran analysis of the relative effects (see Figure 7) reveals (some) complementarity betweenORP and learning. It shows that large coefficients of ORP strengthen the negative effectof learning on segregation during the learning regime (left panels), mainly when there isinequality aversion (top panels). This complementary effect comes from the major role playedby inequality aversion in small cooperatives. Due to bad realizations of past income, somelow-risk agents will learn more slowly than others and stay longer in their cooperatives. Whenthey learn their type, they will realize that the cooperative results depend to a large extent onthem, and will be reluctant to leave because of inequality aversion. Incomplete informationon risk type thus decreases segregation, even more so when inequality aversion is high.
5 Conclusion
We study in this paper the motives that induce heterogeneous agents to share risk. In additionto the obvious impact of risk-aversion, we highlight the respective roles of other-regardingpreferences and of limited knowledge of risk exposure. To explore the simultaneous learningof own risk type and cooperative performance, we build an agent-based model. Based on
20
●●●
●
●
●
●
●●
●●
●
●●
●
●
● ●●
●
●●
●
●
●●
●●●
●●●●
−0.4
−0.2
0.0
0.2
0 0.4 0.8Inequality.aversion
RA = 2.5, altruistic = 0, predetermined.income = true
segr
eg. i
n co
ops
at 5
0
Effect of learning with IA on segreg. in coops at 50
●●
●
●●●●
●
●
●
●
●
●
●●
●
●
●
●
●
●
●●●
●
●●
●
●●
−0.4
−0.2
0.0
0.2
0 0.4 0.8Inequality.aversion
RA = 2.5, altruistic = 0, predetermined.income = true
segr
eg. i
n co
ops
at 1
00
Effect of learning with IA on segreg. in coops at 100
●●●
●
●
●
●
●●
●●
●
●●
●
●
●
●
●●
●
●●
●●●
●
●
●
●
●●
●
●
●
−0.4
−0.2
0.0
0.2
0 0.2 0.4altruistic
RA = 2.5, Inequality.Aversion = 0, predetermined.income = true
segr
eg. i
n co
ops
at 5
0
Effect of learning with modif. alt. on segreg. in coops at 50
●●
●
●●●●
●
●
●
●
●
●
●
●
●
●
●●
●●
●●●●
●
●●
●
●
●
●●
●
●
−0.4
−0.2
0.0
0.2
0 0.2 0.4altruistic
RA = 2.5, Inequality.Aversion = 0, predetermined.income = true
segr
eg. i
n co
ops
at 1
00
Effect of learning with modif. alt. on segreg. in coops at 100
Figure 6: Effect of learning on segregation with ORP. The top panels illustrate the effect oflearning on segregation, for various degrees of inequality aversion, during the learning regime(on the left) and the convergence regime (on the right). The bottom panels replicate this formodified altruism. All the results are presented in absolute terms.
21

●●
●
●
●
●●●
●
●
● ●
●
●
●●
●
●
●
●
●●●
●●●●
●
●●
●
●●
●−0.6
−0.4
−0.2
0.0
0.2
0.4
0 0.4 0.8Inequality.aversion
RA = 2.5, altruistic = 0, predetermined.income = true
perc
ent
Relative effect of learning with IA on segreg. in coops at 50
●●
●
●●●●
●
●
●
●●●
●●●●
●
●
●
●●
●
●●
●
●
●
●●●
●
●
●●
●
●●
−0.6
−0.4
−0.2
0.0
0.2
0.4
0 0.4 0.8Inequality.aversion
RA = 2.5, altruistic = 0, predetermined.income = true
perc
ent
Relative effect of learning with IA on segreg. in coops at 100
●●
●
●
●
●●●
●
●
●
●
●●
●
●
●
●
●●
●
●
●
●
●
●●
●
●
●●
−0.6
−0.4
−0.2
0.0
0.2
0.4
0 0.2 0.4altruistic
RA = 2.5, Inequality.Aversion = 0, predetermined.income = true
perc
ent
Relative effect of learning with modif. alt. on segreg. in coops at 50
●●
●
●●●●
●
●
●
●●● ●
●
●
●
●
●●
●
●●●●
●
●●
●
●
●●●
●
●
−0.6
−0.4
−0.2
0.0
0.2
0.4
0 0.2 0.4altruistic
RA = 2.5, Inequality.Aversion = 0, predetermined.income = true
perc
ent
Relative effect of learning with modif. alt. on segreg. in coops at 100
Figure 7: Relative effect of learning on segregation with ORP. The top panels illustrate theeffect of learning on segregation, for various degrees of inequality aversion, during the learningregime (on the left) and the convergence regime (on the right). The bottom panels replicatethis for modified altruism. All the results are presented in relative terms.
22

their beliefs and the risk-sharing offered in their cooperative, agents choose whether or notto leave it. This illustrates the evolving composition of risk-sharing cooperatives.
We show in this context that other-regarding preferences (inequality aversion and altru-ism) durably decrease segregation in cooperatives, i.e. they increase the willingness of low-riskagents to share risk with high-risk agents. Interestingly, this holds true even when agents arefully informed of their risk type. These other-regarding preferences, however, tend to lead tosmaller cooperatives, as agents have a greater effect on each other in smaller cooperatives.
This effect is reinforced by learning, which also leads to more mixed cooperatives. Learningmakes low-risk agents less sure about what they stand to gain in isolation, so that they staylonger in their cooperative. The two effects are moreover complementary: other-regardingpreferences induce the last low-risk agents remaining to continue sharing with high-risk agents.
Interestingly, with the use of ”normal” altruism (such that agents who disturb others bybenefiting from the cooperation can decide to leave to increase utility of others) the stabilityof cooperatives greatly reduces.
These results suggest that more research is needed, notably regarding the interactionbetween risk-aversion, other-regarding preferences and learning. One way to enrich our modelwould be by making the creation process more sophisticated. We assume here that at eachstep one new cooperative is created, without any choice by the agents. Modeling anotherprocess would however call for more assumptions, in particular on the identity of the agent(s)who choose(s) to create the new cooperative or not, and the information she (they) use.Another interesting avenue of research would be to explore sharing rules other than equalsharing.
A Robustness checks
A.1 The effect of risk-aversion
The effect of risk-aversion is summarized in Figure 8.
On segregation (left panels). During the learning regime, RA decreases segregation. Dur-ing the stabilized regime, the reverse effect is observed but is very small.
On the fraction in cooperatives (top right panel). RA increases the fraction of agentsin cooperatives during the stabilized regime.
On the size of cooperatives (bottom right panel). RA decreases cooperative size dur-ing the stabilized regime. The reverse effect is observed during the learning regime.
RA greatly improves the stability of cooperatives. This has consequences that vary de-pending on the regime we study. Results are very path-dependent for high RA coefficient,stabilizing a large variety of scenarios from low segregation to complete segregation. Theexpected effect of RA, to promote a mixed risk profile, is only observed during the learningregime. Then the effect changes, because of the dynamics of the model.
• When the coefficient of relative risk-aversion equals 1.5, cooperatives are unstable. Low-risk agents quickly leave and the performance of the remaining homogeneous cooper-atives is highly path-dependent (explaining high segregation and the small fraction ofagents in cooperatives). Cooperatives become larger during the stabilized regime. The
23

0.0
2.5
5.0
7.5
10.0
12.5
0.25 0.50 0.75 1.00segreg. in coops at 50
Know.her.Type = true, IA = 0, altruistic = 0
dens
ity
risk.aversion1.5
2.5
3.5
Effect of RA on segreg. in coops at 50
0
5
10
15
20
0.4 0.6 0.8 1.0fraction in coops at 250
Know.her.Type = true, IA = 0, altruistic = 0
dens
ityrisk.aversion
1.5
2.5
3.5
Effect of RA on fraction in coops at 250
0
5
10
0.25 0.50 0.75 1.00segreg. in coops at 250
Know.her.Type = true, IA = 0, altruistic = 0
dens
ity
risk.aversion1.5
2.5
3.5
Effect of RA on segreg. in coops at 250
0.0
0.2
0.4
0.6
10 15 20size of coops at 250
Know.her.Type = true, IA = 0, altruistic = 0
dens
ity
risk.aversion1.5
2.5
3.5
Effect of RA on size of coops at 250
Figure 8: The effect of risk-aversion (RA) without learning or ORP. The left panels representthe evolution during the learning and stabilized regimes of the impact of RA on segregation.the right panels represent the effect of RA at step 250 on the fraction of agents in cooperatives(top panel) and on the cooperative size (bottom panel).
24

size and the homogeneity of the stock of isolated agents tend to create large and stablecooperatives.
• With a higher relative risk-aversion coefficient (2.5), the first cooperatives are morestable. Low-risk agents leave less quickly, so the segregation index decreases duringthe learning regime. Nevertheless, high coefficients of RA also stabilize homogeneouscooperatives, which is why in the long run (during the stabilized regime) the segregationindex is higher for a coefficient of RA of 2.5.
• A coefficient of 3.5 is a special case, where the stabilized regime is highly path-dependent.RA can stabilize both situations in which every cooperative is completely segregatedand situations in which cooperatives are mixed.
A.2 The shape of the social network
In this subsection, we analyze the impact of the social network. We study three shapes ofnetwork: small world with a mean number of friends of 10 (as in the core of the paper),random, with the same mean number of friends and complete, where everybody is linkedto everybody. We focus on cases without ORP and with modified altruism. The shape ofthe network indeed impacts the choice both of those an agent can create a new cooperativewith and of those she is altruistic toward. We abstract from learning, assuming that agentsperfectly know their type from t = 0. Results are displayed in Figure 9.
On segregation (left panel). Segregation is maximal for the complete network. Withoutaltruism, small world and random networks are equivalent. With altruism, small worldnetworks lead to less segregated cooperatives.
On the size of cooperatives (right panel). Without altruism, the complete network gen-erates two completely segregated cooperatives. With altruism, the complete networkgenerates smaller cooperatives that are still a bit larger than with random networks. Inboth cases, the smallest cooperatives are generated by small world networks.
Results on the size of cooperatives are essentially driven by the size of the created coop-eratives. With the complete network, all agents are linked. Every isolated agent thereforecreates the largest possible cooperative at each round. With the small world network, friendsof friends are more likely to be friends, and the selected agent will reach less agents than inthe random network case, ending up with smaller cooperatives.
The results on segregation with modified altruism are driven by the stronger effect ofaltruism in smaller cooperatives. In the case of the complete network, everybody is altruistictowards everybody else, but cooperatives are too large for altruism to have an effect. Low-risk agents thus leave quickly and create large and completely segregated cooperatives. Inthe small world network, friends of friends are more likely to be friends and cooperatives aresmall. The effect of altruism on segregation is thus strongest in the small world network.
B Discussion
B.1 Modified Altruism
The following subsection describes results obtained with modified altruism and the mecha-nisms behind them, see Figure 5.
25

0
250
500
750
1000
0.7 0.8 0.9 1.0segreg. in coops at 250
RA = 2.5, IA = 0, altruistic = 0, KhT = true
coun
t
network.shape"small world"
"complete"
"random"
Effect of network, without ORP on segreg. in coops at 250
0
250
500
750
1000
0 25 50 75 100size of coops at 250
RA = 2.5, IA = 0, altruistic = 0, KhT = true
coun
t
network.shape"small world"
"complete"
"random"
Effect of network, without ORP on size of coops at 250
0
250
500
750
1000
0.7 0.8 0.9 1.0segreg. in coops at 250
RA = 2.5, IA = 0, altruistic = 0.4, KhT = true
coun
t
network.shape"small world"
"complete"
"random"
Effect of network, with modif. alt. (0.4) on segreg. in coops at 250
0
100
200
300
10 15size of coops at 250
RA = 2.5, IA = 0, altruistic = 0.4, KhT = true
coun
t
network.shape"small world"
"complete"
"random"
Effect of network, with modif. alt. (0.4) on size of coops at 250
Figure 9: The effect of network shape. Each panel represents the distribution – via a histogram– of an indicator at t = 250 (the use of a histogram rather than density is necessitated bythe homogeneity of results for the complete network). Left panels represent the effect onsegregation, without (top) and with (bottom) modified altruism. Top panels represent theeffect on the size of the cooperatives, without (top) and with (bottom) modified altruism.
26

On segregation (left panels). Modified altruism decreases segregation. The effect is how-ever lower than with normal altruism after the learning regime.
On the fraction in cooperatives (top right panel). Modified altruism has no effect onthe fraction of agents in cooperatives (contrary to normal altruism).
On cooperative size (bottom right panel). Modified altruism decreases the size of co-operatives, a little more than normal altruism.
Modified altruism creates more stable cooperatives but higher segregation than normalaltruism. The results on the fraction of agents in cooperatives are explained by the fact thatagents no longer leave a beneficial cooperative because of the negative effect they are havingon their friends. This however decreases the stability of the composition of the leaving flow.This instability, as in the baseline scenario, leads to higher segregation index.
C Acknowledgment
We wish to thank Hugo David-Mauduit and Simon Venturi (from Ecole Centrale Marseille) forvery useful research assistance. This work was supported by the Conseil Regional Provence-Alpes-Cote d’Azur (France) through a PhD program.
References
H. Alderman and C. H. Paxson. Do the poor insure? a synthesis of the literature on riskand consumption in developing countries. Policy Research Working Paper Series 1008, TheWorld Bank, October 1992.
I. Alger and J.W. Weibull. Family ties, incentives and development a model of coercedaltruism. In Kaushik Basu and Ravi Kanbur, editors, Arguments for a Better World:Essays in Honor of Amartya Sen. Oxford University Press, 2008.
I. Alger and J.W Weibull. Kinship, incentives, and evolution. American Economic Review,100:1727–1760, 2010.
K. Arrow. Aspects of the Theory of Risk-Bearing. Yrjo Jahnssonin Saatio, Helsinki, 1965.
K. Arrow. Optimal and voluntary income distribution. In Steven Roseelde, editor, EconomicWelfare and the Economics of Soviet Socialism: Essays in Honor of Abram Bergson, pages267–288. Cambridge University Press, 1981.
G. S. Becker. A theory of social interactions. Journal of Political Economy, 82(6):1063–1093,1974.
F. Bloch, G. Genicot, and D. Ray. Informal insurance in social networks. Journal of EconomicTheory, 143:36–58, 2008.
R. Bourles and D. Henriet. Risk-sharing contracts with asymmetric information. GenevaRisk and Insurance Review, 37:27–56, 2012.
27

R. Bourles, Y. Bramoulle, and E. Perez-Richet. Altruism in networks. Econometrica, forth-coming, 2017.
Y. Bramoulle and R. Kranton. Risk-sharing networks. Journal of Economic Behavior andOrganization, 64:275–294, 2007.
T. Brenner. Agent learning representation: advice on modelling economic learning. In L. Tes-fatsion and K. L. Judd, editors, Handbook of computational economics vol. 2: Agent-basedcomputational economics, Handbooks in Economics Series, chapter 18. Elsevier/North-Holland, 2006.
C. Camerer and T.-H. Ho. Experience-weighted attraction learning in normal form games.Econometrica, 67:827–874, 1999.
R. Chetty. A new method of estimating risk aversion. American Economic Review, 96(5):1821–1834, 2006.
P.A. Chiappori, K. Samphantharak, S. Schulhofer-Wohl, and R. M. Townsend. Heterogeneityand risk sharing in village economies. Quantitative Economics, 5:1–27, 03 2014.
J. DeWeerdt and M. Fafchamps. Social identity and the formation of health insurance net-works. Journal of Development Studies, 47(8):1152–1177, 2011.
P. Dubois, B. Jullien, and T. Magnac. formal and informal risk sharing in ldcs: Theory andempirical evidence. Econometrica, 76:679–725, 2008.
M. Fafchamps and F. Gubert. The formation of risk sharing networks. Journal of DevelopmentEconomics, 83(2):326–350, 2007.
M. Fafchamps and S. Lund. Risk-sharing networks in rural philippines. Journal of Develop-ment Economics, 71:261–287, 2003.
E. Fehr and K. Schmidt. A theory of fairness, competition, and cooperation. The QuarterlyJournal of Economics, 114(3):817–868, 1999.
A. D. Foster and M. R. Rosenzweig. Imperfect commitment, altruism, and the family: Ev-idence from transfer behavior in low-income rural areas. The Review of Economics andStatistics, 83(3):389–407, August 2001.
W.D. Hamilton. The genetical evolution of social behaviour. i. Journal of Theoretical Biology,7:116, 1964a.
W.D. Hamilton. The genetical evolution of social behaviour. ii. Journal of Theoretical Biology,7:1752, 1964b.
M.S. Kimball. Farmers’ cooperatives as behavior towards risk. The American EconomicReview, 78(1):224–232, 1988.
A. Kirman. Complex Economics: Individual and Collective Rationality. Routledge, 2010.
S. Lazco. Does risk sharing increase with risk aversion and risk when commitment is limited?Journal of Economic Dynamics and Control, 46:237–251, September 2014.
28

B Leloup. L incertitude de deuxieme ordre en economie : le compromis exploration vs.exploitation. PhD thesis, Ecole normale suprieure, Cachan, 2002.
E. Ligon, J.P. Thomas, and T. Worrall. Informal insurance arrangements with limited com-mitment: Theory and evidence from village economies. The Review of Economic Studies,69(1):209–244, 2002.
J. Mercier-Ythier. The economic theory of gift-giving: Perfect substituability of transfersand redistribution of wealth. In Serge-Christophe Kolm and Jean Mercier Ythier, editors,Handbook of the Economics of Giving, Altruism and Reciprocity, pages 228–369. NorthHolland, 2006.
D. Meyer and J. Meyer. Relative risk aversion: What do we know? The Journal of Risk andUncertainty, 31(3):243–262, 2005.
J. Morduch. Income smoothing and consumption smoothing. The Journal of EconomicPerspectives, 9(3):103–114, 1995.
S. Moulet and J. Rouchier. The influence of sellers’ beliefs and time constraint on a sequentialbargaining in an artificial perishable goods market. Journal of Economic Dynamics andControl, 32(7):2322–2348, 2008.
P. Roos and D. Nau. Risk preference and sequential choice in evolutionary games. Advancesin Complex Systems, 13(04):559–578, 2010.
A.E. Roth and I. Erev. Learning in extensive form games: Experimental data and simpledynamic models in the intermediate run. Games and Economic Behavior, 8:164–212, 1995.
J. Rouchier. Agent-based simulation as a useful tool for the study of markets. In BruceEdmonds and Ruth Meyer, editors, Simulating Social Complexity: A Handbook, pages 617–650. Springer Berlin Heidelberg, Berlin, Heidelberg, 2013.
H. Simon. A behavioral model of rational choice. The Quarterly Journal of Economics, 69(1):99–118, 1955.
R.M. Townsend. Risk and insurance in village india. Econometrica, 62(3):539–591, 1994.
N. Vriend. An illustration of the essential difference between individual and social learning,and its consequences for computational analyses. Journal of Economic Dynamics andControl, 24(1):1–19, 2000.
D.J. Watts and S.H. Strogat. Collective dynamics of ’small-world’ networks. Nature, 393:440–442, 1998.
29