informatics driven quality initiatives - using the...
TRANSCRIPT

1
©2011 MFMER | slide-1
William Pavlicek PhD
AAPM, Charlotte, NC
Aug 2, 2012 2:50PM
Informatics driven Quality Initiatives -Using the Tools of Six Sigma
©2011 MFMER | slide-2
Outline of Talk
• Six Sigma Concepts
• PET Patient Dose reduction
• CT Patient Dose reduction – positioning and Z axis coverage
• Fluoroscopy – Lowering Patient Skin Dose
• Questions
©2011 MFMER | slide-3
W. Edwards Deming
• Taught engineering, physics in the 1920s, finished PhD in 1928
• Met Walter Shewhart at Western Electric
• Long career in government statistics, USDA, Bureau of the Census
3
W. Edwards Deming, 1900 – 1993

2
©2011 MFMER | slide-4
W. Edwards Deming
• Deming was asked by Japan to lecture on statistical quality control to management
• Japanese adopted many aspects of Deming’s management philosophy
• Deming stressed “continual never-ending improvement”
• “If I had to reduce my message for management to just a few words, I’d say it all had to do with reducing variation”. (Deming, as quoted in The Deming Dimension, Henry R. Neave (SPC Press, 1990), p. 57)
• Deming lectured widely in North America during the 1980s
4
©2011 MFMER | slide-5
Deming energized “Statistical Thinking”
• Integral aspect of Six-Sigma (3.4 per million)
• Six Sigma is a ‘goal’ not often achieved!
• Fundamentally different from Statistical Methods
• The definition is broadened to include:
• Operations Research tools
• Discrete event “Simulation’
• Other elements of ‘lean process’
5*ASQ Statistics Division, http://www.asqstatdiv.org/stats-everywhere.htm
©2011 MFMER | slide-6
Defects Per Million Opportunities

3
©2011 MFMER | slide-7
* From Montgomery, D. C. (2009), Introduction to Statistical Quality Control 6th edition, Wiley, New York
How Variation Hurts …
7
©2011 MFMER | slide-8
The Motorola Six-Sigma Concept
• The Motorola Six-Sigma concept is to reduce the variability in the process so that the specification limits are six standard deviations from the mean, or only about 2 parts per billion defective (Fig 1-11a).
• When the Six-Sigma concept was initially developed, an assumption was made that when the process reached the Six-Sigma quality level, the process mean was still subject to disturbances that could cause it to shift by as much as 1.5 standard deviations off target (Fig 1-11b).
• There is an apparent inconsistency in this. Process performance isn’t predictable unless the process behavior is stable.
• No process or system is ever truly stable, and even in the best of situations, disturbances occur. The concept of a Six-Sigma process is one way to model this behavior. Like all models, it’s probably not exactly right, but it has proven to be a useful way to think about process performance, and has direct application to manufacturing.* 8* From Montgomery, D. C. (2009), Introduction to Statistical Quality Control 6th
edition, Wiley, New York. Figure 1-12.
©2011 MFMER | slide-9
The Generations of Six Sigma
• Generation I
• Focus on defect elimination
• Motorola, 1987-1993
• Generation II
• Focus on cost reduction
• GE, Allied Signal/Honeywell, 1994-1999
• Generation III
• Focus on value creation
• DuPont, 2000-present
9

4
©2011 MFMER | slide-10
Process Variation
• Variation is present in all processes and every aspect of the workplace
• Excess variation reduces process performance, decreases customer satisfaction, and has a negative impact on the bottom line
• Applies to all aspects of a business
• Statistical methods, an integral component of six sigma, are useful in shifting the process target to the desired level and reducing the variation around this target
10
©2011 MFMER | slide-11
As has been said, “the mean never happens,” — a heroic 4-day delivery time on one
order, with an awful 20-day delay on another, and no real consistency. The customers
in this chart feel nothing. Their life experience hasn’t changed; one bit. These
customers hear the sounds of celebration coming from within GE and ask, “What’s the
big event; what did we miss?” The customer only feels the variance that we have not yet removed. … Variation is evil in any customer-touching process. *
*Jack Welch, General Electric Company 1998 Annual Report11
©2011 MFMER | slide-12
Patients feel the variation!
• Too long Waiting for their exam
• Lack of proper prep means waiting, poss rescheduled exam
• Repeated exam due to xyz
• Multiple x-ray exams due to lack of available priors
• Poss need of follow up exam due to confidence – due to IQ?

5
©2011 MFMER | slide-13
• Patient goes for Out Patient Radiology exam: order, transport, waiting room, exam prep, tech/device performance, x-ray room availability, image quality, interpretation, communication to clinician.
• The patient experience has 10 components - is 99% okay?
Why “Quality Improvement” is Important:
©2011 MFMER | slide-14
Propagation of Error-repeatability of the exam-reproduced with diff techs/equipment/rads
©2011 MFMER | slide-15
Repeatability (i.e. back to back Ca Scores, bone density, kVp 4X, etc)

6
©2011 MFMER | slide-16
Reproducibility: Different techs, devices, patients…Different Quality?
©2011 MFMER | slide-17
CT fluoro biopsy dose, breast compression, fluoroscopy dose by physician, etc.
©2011 MFMER | slide-18
Focus of Six Sigma is on Process Improvement with an Emphasis on Achieving Significant Impact
• A process is an organized sequence of activities that produces an output that adds value to the organization
• All work is performed in (interconnected) processes
• Easy to see in some situations (manufacturing)
• Harder in others
• Any process can be improved
• An organized approach to improvement is necessary
• The process focus is essential to applying Six-Sigma methods
18

7
©2011 MFMER | slide-19
Organized Approach:
DMAIC (duy–may–ick)
©2011 MFMER | slide-2020
‘D’efine the Goal – What is important!(you are what you measure!)
� Project Charter – Admin Directive (like an internal contract with yourself)
� Problem Statement
� Goal Statement
� In/Out of Scope
� Team & Time Commitments
� Timeline / Milestone
� Estimate Financial Benefits
� Risks, Constraints & Compliance Issues Identified
©2011 MFMER | slide-21
The Primary Six Sigma Tools
• Process map
• Cause and effect analysis
• Measurement systems analysis*
• Capability study*
• Failure mode and effects analysis
• Observational study (regression)*
• Designed experiments*
• Control charts and out-of-control-action-plans*
* Statistical Tools 21

8
©2011 MFMER | slide-22
Use of Reference ValuesMeasure, Analyze and Improve!
©2011 MFMER | slide-23
General Comments
• One doesn’t really achieve Six Sigma
• Informatics with control charts are enormously helpful
• Shining a light by sharing data is very useful!
• Change can be difficult but fun!
• Leadership is key: drive out fear!
©2011 MFMER | slide-24

9
©2011 MFMER | slide-25
Joint Commission SE #47
©2011 MFMER | slide-26
How to determine if doses are ‘out of range’ (reproducible)?
©2011 MFMER | slide-27
Lots of Software
Solutions!

10
©2011 MFMER | slide-28
System Architecture
Knowledge Base
ExamInformation Database
Dosimetry Analyzer
Emails
WAN
Dose Tracking System
DICOM, HL7 Gateway
DICOM DICOM SR HL7
Texts
Reporting & Alerting Module
RIMS
©2011 MFMER | slide-29©2011 MFMER | slide-29
#1. PET-CT Six Sigma driven lower dose
©2011 MFMER | slide-30©2011 MFMER | slide-30
PET Scanner ‘Blocks’ BGO - PMT

11
©2011 MFMER | slide-31©2011 MFMER | slide-31
PET F-18
γγγγ
γγγγ
Coincidence ? Register EventYes
©2011 MFMER | slide-32©2011 MFMER | slide-32
Types of Coincident Events
True Scatter Randoms
Gamma ray (Singles)
Line of Response (LOR)
Prompts = True + Scatter + Randoms
©2011 MFMER | slide-33©2011 MFMER | slide-33
2D PET – SEPTA!All events used to reconstruct a slice
are detected within that slice.

12
©2011 MFMER | slide-34©2011 MFMER | slide-34
3D Volume AcquisitionEvents which cross several transaxial
slices are collected.
These events are used in the
reconstruction of each of the slices crossed.
©2011 MFMER | slide-35©2011 MFMER | slide-35
8050 60 704010 20 30
0
20000
40000
60000
80000
100000
2D
3D
NECR kCounts per second
kBq/cc
Practical Clinical Range for Oncology
10 20 30 40 50 60 70 80 mCi
©2011 MFMER | slide-36
Why wouldn’t one lower dose from 15-20 to 10 mCi (or lower) for 3D?
• What if patient is late?
• What if patient is early?
• What if patient has low uptake?
• What if patient is non-compliant?
Variation of time/dose has greater effect with smaller injected dose!

13
©2011 MFMER | slide-37
Solution: Bulk F-18 Infusion SystemNo patient to patient variability of dose!
©2011 MFMER | slide-38
Problem: Uptake Room � RestroomTech gets patient to scanner ‘on time’?
After 45min
©2011 MFMER | slide-39
Solution: Monitor Uptake � Restroom
After 45min

14
©2011 MFMER | slide-40
Automated Report Summary by Room/Day
©2011 MFMER | slide-41
Problem: Muscle uptake when walkingTool: Spaghetti Diagram
©2011 MFMER | slide-42
Solution: Minimum distance!

15
©2011 MFMER | slide-43
Six Sigma Results
• Variation in administered dose removed!
• Variation in ‘uptake time’ removed!
• Variation in transport uptake removed!
• These are ‘monitored’!
• Dose is LOWERED!
• Patients still provide unpredictable variation
©2011 MFMER | slide-44
Variability still present!PET Muscle uptake(variability of counts in lesions)
©2011 MFMER | slide-45
#2. CT Dose IndexReduction
Define
MeasureAnalyze
Improve
Control

16
©2011 MFMER | slide-46
Goal: AAPM Notification Values
©2011 MFMER | slide-47
©2011 MFMER | slide-48
DMAI “C”: Control Chart

17
©2011 MFMER | slide-49
Non-Size-Adjusted DLP vs #CT Exams for MCA Scanners
January 2011
(0018,1030) protocol name: 6300_AbdPel_uro_w_fur
(0008,103e) series description: 10m AbdPel a300
3
0 0
4
8
5 5
2
1
2 2
0 0 0 0 0 0
1
2
0
4
0
3 3
2
1 1
2
111
0
4
5
2
4
3
1 1 1
0 0 0 0 0 0
1
0 0
1
0
2
4
6
8
10
25
0-2
99
30
0-3
49
35
0-3
99
40
0-4
49
45
0-4
99
50
0-5
49
55
0-5
99
60
0-6
49
65
0-6
99
70
0-7
49
75
0-7
99
80
0-8
49
85
0-8
99
90
0-9
49
95
0-9
99
10
00
-10
49
10
50
-10
99
11
00
-11
49
11
50
-11
99
12
00
-12
49
12
50
-12
99
≥ 1
30
0
DLP w/o patient size adjustment(mGy-cm)
Mean - 2SD
288 mGy-cmMean + 2SD
1122 mGy-cm
Nu
mb
er
of
CT
Ex
am
s
Mean
705 mGy-cm
???????
Standardized:
Variation:
©2011 MFMER | slide-50
Analyze - Why Variation of DLP?
• Really Large Patient?
• Really Tall Patient?
• Elevated CTDIvol prescription?
• Other cause(s)?
©2011 MFMER | slide-51

18
©2011 MFMER | slide-52
Same patient 30 days apartCan you see the mAs/centering?
©2011 MFMER | slide-53
40 cm Projected SCOUT 36 cm Projected SCOUT
23 mSv 13 mSv
Not Centered Centered
©2011 MFMER | slide-54
Variation in DLP seen with variation in centering

19
©2011 MFMER | slide-55
ANALYZE: Variation due to Scout Order(180 mAs)
8.09 mGy 9.45 mGy 9.1 mGy 8.09 mGy
©2011 MFMER | slide-56
ANALYZE new example
CT of Abdomen/Pelvis 1/16/2011120kVp
180 ref. mAs
14.9mGy
CT of Abdomen/Pelvis 4/15/2011120kVp
180 ref. mAs
18.4mGy
23% increase in dose between these scans on the same patient.
©2011 MFMER | slide-57
CT Center FOV Positioning

20
©2011 MFMER | slide-58
% Dose Increase Due to Position
%mGy Increase Isocenter:Displaced
-9.0%
0.8% 0% -1.0%
2.5% 8.9% 4.5%
%mGy Increase Isocenter:Displaced
0%
Position changes mAs lookup table.
©2011 MFMER | slide-59
Same Patient
CT of Abdomen/Pelvis 1/16/2011120kVp
180 ref. mAs
14.9mGy
CT of Abdomen/Pelvis 4/15/2011120kVp
180 ref. mAs
18.4mGy
23% increase in dose between these scans on the same patient.
Dose Affecting Parameters:1. Sliderboard
2. X-Y Position 3. Body Width4. Z-Axis Attenuation
5. Metal Monitor
©2011 MFMER | slide-60
0%
10%
20%
30%
40%
50%
60%
Board Attenuation Patient Too Low Patient Wider Z Axis Coverage Different
Pareto Graph: Rank Change in CTDIvol

21
©2011 MFMER | slide-61
Variation: Z axis: Abdomen & Pelvis
©2011 MFMER | slide-62
New ‘standard’ Z axis coverage
©2011 MFMER | slide-63

22
©2011 MFMER | slide-64
Height/Weight with AP and Lateral Size
Use Random Forest Model estimates potentially ‘excessive’ Z axis coverage
©2011 MFMER | slide-65
Six Sigma Routine Abdomen-Pelvis
Top 10 Overscans
Superior (cm) Inferior (cm)
6.3 11
4.5 7.4
4.2 6.5
4.2 5.3
4.2 4.2
4.2 3.8
3.9 3.5
3.9 3.2
3.6 3.1
3.6 2.9
N= 300+ pts Overscan
superior 1 cm
inferior .4 cm
©2011 MFMER | slide-66
CT Colonography
Good scan coverage
OK to exclude lung bases, just include colon

23
©2011 MFMER | slide-67
CT Colonography Top 10 Overscans
Superior (cm)
Inferior (cm)
22.12 9.5
13.6 8
9.1 6.5
8.3 4.2
8.3 4.6
8 2.6
7.9 2.6
7.5 2
5.9 2
5.6 1
N= 20 pts Overscan
superior 6.4 cm
inferior 2.3 cm
©2011 MFMER | slide-68
Six Sigma Results
• Standardize Protocol Names
• Standardize CT’s Techniques
• Standardize CT Radiograph
• Standardize Patient Centering
• Standardize Z Axis coverage
• Control Charts
©2011 MFMER | slide-69
#3 Six Sigma DMAICwith Fluoroscopic Procedures

24
©2011 MFMER | slide-70
NEW NORMAL!
• New arterial and endoscopic procedures save open surgery!
• Patients are having multiple episodes of fluorsocopy
• 18% of currently scheduled patients have had more than 1 fluoroscopy!
• Patients are bigger
• Most fluoroscopy is outside of Radiology
©2011 MFMER | slide-71
Technical vs Behaviorial
©2011 MFMER | slide-72
5 ALARA Technical Tasksfor reproducibility
• Standardize Protocol Names!
• Standardize Fluoro/Acquistions!
• Default with Low(est) Fluoro pulse rate?
• Default with Low(est) DSA/Cine frame rate?
• Default with Low(est) dose per pulse?
• Always use Copper (0.1mm is 40%!)

25
©2011 MFMER | slide-73
(70-75 bpm, flat panel)(70-75 bpm, II)
7.5 FPS cine 15 FPS cineCurrent ½ Dose Old Dose
©2011 MFMER | slide-74
Use copper filter! vary thickness Lucite 15 cm to 35 cm
20% Iodine solution for CNR/mGy measures
©2011 MFMER | slide-75
~ 10% Lower Contrast to Noise for 0.1 mmCopper
CNR vs mm Cu Acquisition
0
20
40
60
80
100
120
140
160
0 0.2 0.4 0.6 0.8 1
mm Cu
CN
R
15cm Lucite
20cm Lucite
25cm Lucite
27.5cm Lucite
30cm Lucite
35cm Lucite
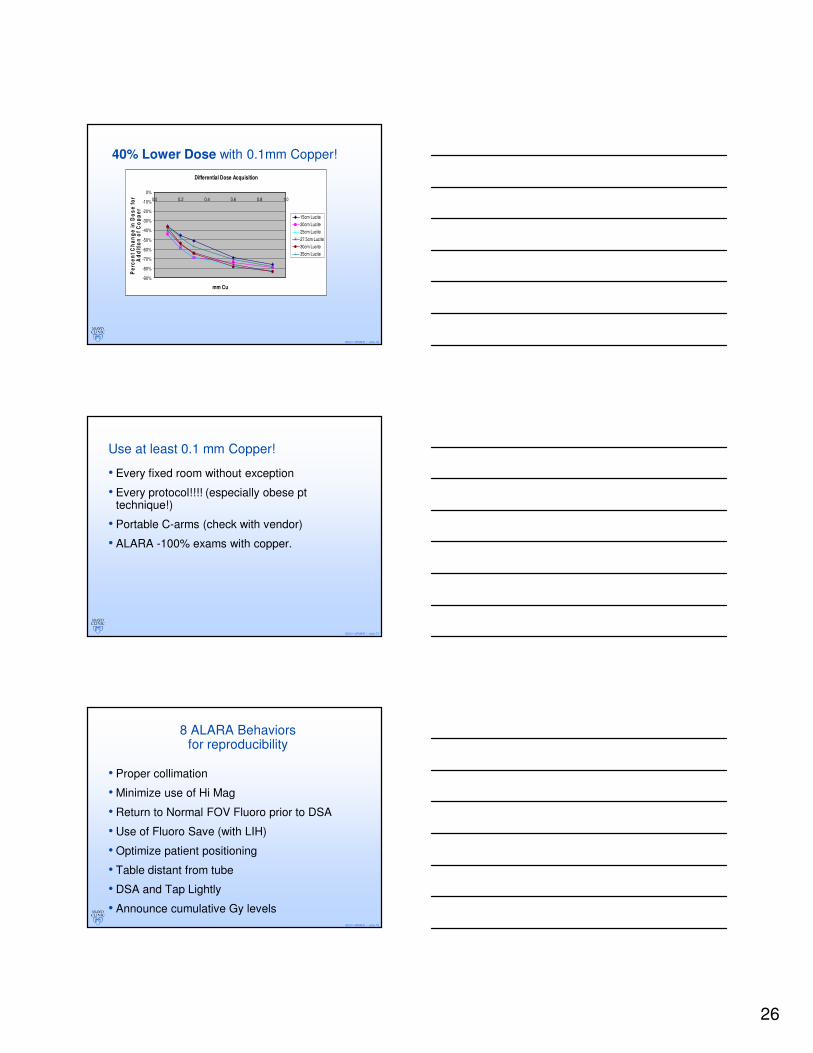
26
©2011 MFMER | slide-76
40% Lower Dose with 0.1mm Copper!
Differential Dose Acquisition
-90%
-80%
-70%
-60%
-50%
-40%
-30%
-20%
-10%
0%
0.0 0.2 0.4 0.6 0.8 1.0
mm Cu
Pe
rce
nt
Ch
an
ge
in
Do
se
fo
r A
dd
itio
n o
f C
op
pe
r
15cm Lucite
20cm Lucite
25cm Lucite
27.5cm Lucite
30cm Lucite
35cm Lucite
©2011 MFMER | slide-77
Use at least 0.1 mm Copper!
• Every fixed room without exception
• Every protocol!!!! (especially obese pt technique!)
• Portable C-arms (check with vendor)
• ALARA -100% exams with copper.
©2011 MFMER | slide-78
8 ALARA Behaviorsfor reproducibility
• Proper collimation
• Minimize use of Hi Mag
• Return to Normal FOV Fluoro prior to DSA
• Use of Fluoro Save (with LIH)
• Optimize patient positioning
• Table distant from tube
• DSA and Tap Lightly
• Announce cumulative Gy levels

27
©2011 MFMER | slide-79
Collimation Is Key: improves IQ, lowers PSD
79
< 1 Gy
1 -2 Gy
2 - 3 Gy
3 - 4 Gy
4 - 5 Gy
5 - 6 Gy
6- 7 Gy
7-8 Gy
8-9 Gy
9-10 Gy
©2011 MFMER | slide-80
0
1000
2000
3000
4000
5000
6000
19 17 13 10.5 8 7 6
Low
Normal
High
Behavior: choosing small FOV Result: High dose fluoro AND high DSA
Diagonal Size (in)
Sk
in D
ose
Ra
te (
mR
/min
)
©2011 MFMER | slide-81
8in Fluoroscopy 7in Fluoroscopy 6in Fluoroscopy
Single frame of II fluoro – fluoro save
0.7R/m 1.2 R/m 2 R/m

28
©2011 MFMER | slide-82
8in Single Shot 7in Single Shot 6in Single Shot
II Image Quality and small FOV Spot
Normal Normal Normal
©2011 MFMER | slide-83
Control: Are Fluoro Saved images in PACS?Informatic tools can monitorXA radiation events
©2011 MFMER | slide-84
29
©2011 MFMER | slide-85
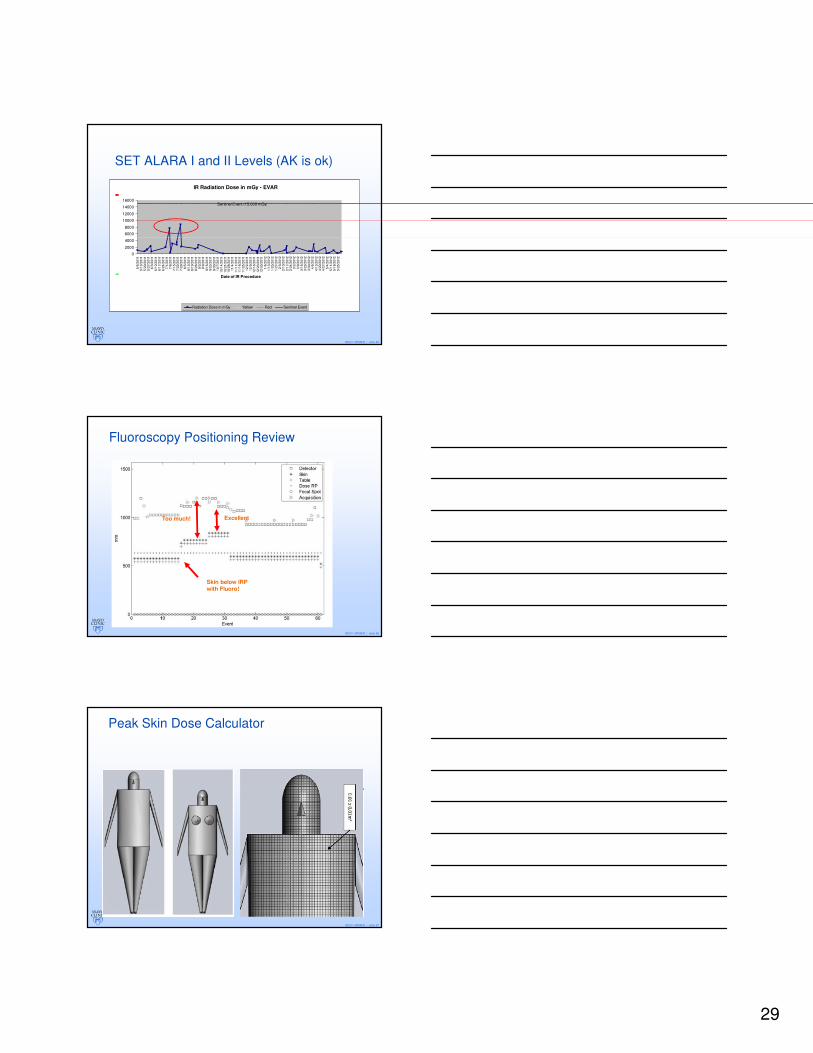
SET ALARA I and II Levels (AK is ok)
IR Radiation Dose in mGy - EVAR
0
2000
4000
6000
8000
10000
12000
14000
16000
5/6
/2011
5/1
3/2
011
5/2
0/2
011
5/2
7/2
011
6/3
/2011
6/1
0/2
011
6/1
7/2
011
6/2
4/2
011
7/1
/2011
7/8
/2011
7/1
5/2
011
7/2
2/2
011
7/2
9/2
011
8/5
/2011
8/1
2/2
011
8/1
9/2
011
8/2
6/2
011
9/2
/2011
9/9
/2011
9/1
6/2
011
9/2
3/2
011
9/3
0/2
011
10
/7/2
011
10/1
4/2
011
10/2
1/2
011
10/2
8/2
011
11
/4/2
011
11/1
1/2
011
11/1
8/2
011
11/2
5/2
011
12
/2/2
011
12
/9/2
011
12/1
6/2
011
12/2
3/2
011
12/3
0/2
011
1/6
/2012
1/1
3/2
012
1/2
0/2
012
1/2
7/2
012
2/3
/2012
2/1
0/2
012
2/1
7/2
012
2/2
4/2
012
3/2
/2012
3/9
/2012
3/1
6/2
012
3/2
3/2
012
3/3
0/2
012
4/6
/2012
4/1
3/2
012
4/2
0/2
012
4/2
7/2
012
5/4
/2012
5/1
1/2
012
5/1
8/2
012
5/2
5/2
012
Date of IR Procedure
Radiation Dose in mGy Yellow Red Sentinel Event
Sentinel Event (15,000 mGy)
+
-
©2011 MFMER | slide-86
Fluoroscopy Positioning Review
Skin below IRP with Fluoro!
ExcellentToo much!
©2011 MFMER | slide-87
Peak Skin Dose Calculator
30
©2011 MFMER | slide-88
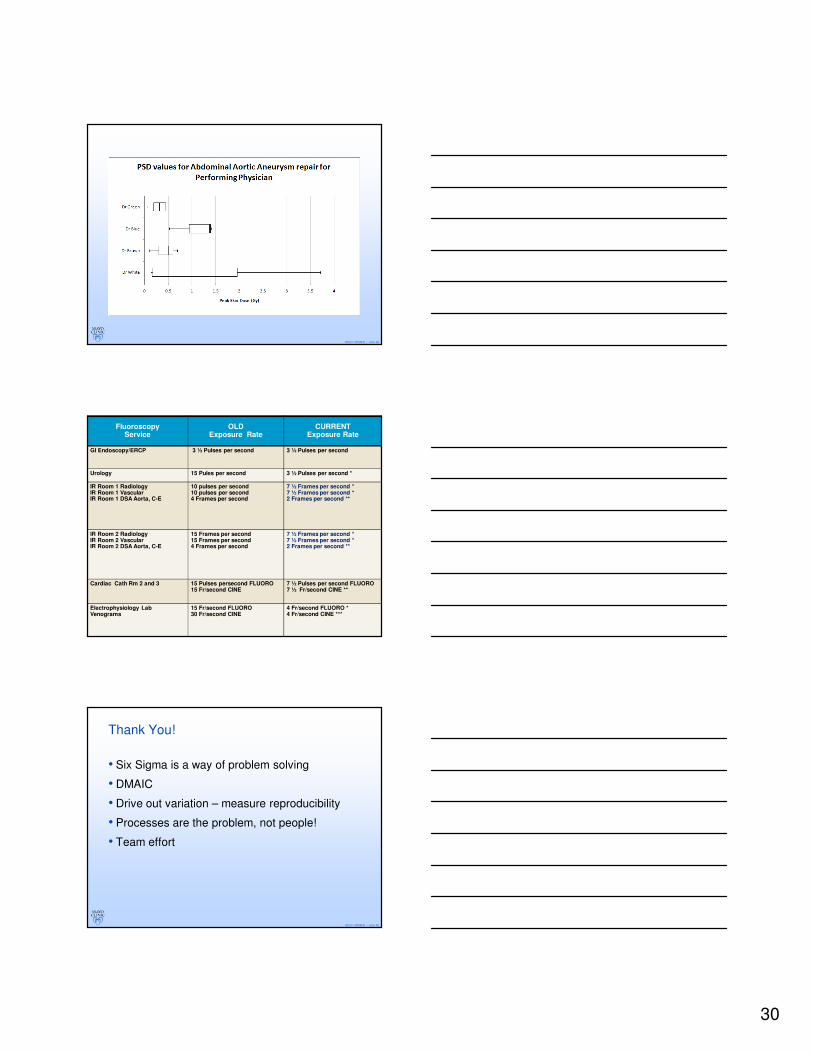
©2011 MFMER | slide-89
Fluoroscopy Service
OLDExposure Rate
CURRENTExposure Rate
GI Endoscopy/ERCP 3 ½ Pulses per second 3 ½ Pulses per second
Urology 15 Pules per second 3 ½ Pulses per second *
IR Room 1 RadiologyIR Room 1 VascularIR Room 1 DSA Aorta, C-E
10 pulses per second10 pulses per second4 Frames per second
7 ½ Frames per second *7 ½ Frames per second *2 Frames per second **
IR Room 2 RadiologyIR Room 2 VascularIR Room 2 DSA Aorta, C-E
15 Frames per second15 Frames per second4 Frames per second
7 ½ Frames per second *7 ½ Frames per second *2 Frames per second **
Cardiac Cath Rm 2 and 3 15 Pulses persecond FLUORO15 Fr/second CINE
7 ½ Pulses per second FLUORO7 ½ Fr/second CINE **
Electrophysiology LabVenograms
15 Fr/second FLUORO30 Fr/second CINE
4 Fr/second FLUORO *4 Fr/second CINE ***
©2011 MFMER | slide-90
Thank You!
• Six Sigma is a way of problem solving
• DMAIC
• Drive out variation – measure reproducibility
• Processes are the problem, not people!
• Team effort