information disclosure and demand elasticity of …documents.worldbank.org/curated/en/... ·...
TRANSCRIPT
Policy Research Working Paper 8210
Information Disclosure and Demand Elasticity of Financial Products
Evidence from a Multi-Country Study
Xavier GinéCristina Martínez Cuellar
Rafael Keenan Mazer
Development Research GroupFinance and Private Sector Development TeamOctober 2017
WPS8210P
ublic
Dis
clos
ure
Aut
horiz
edP
ublic
Dis
clos
ure
Aut
horiz
edP
ublic
Dis
clos
ure
Aut
horiz
edP
ublic
Dis
clos
ure
Aut
horiz
ed
Produced by the Research Support Team
Abstract
The Policy Research Working Paper Series disseminates the findings of work in progress to encourage the exchange of ideas about development issues. An objective of the series is to get the findings out quickly, even if the presentations are less than fully polished. The papers carry the names of the authors and should be cited accordingly. The findings, interpretations, and conclusions expressed in this paper are entirely those of the authors. They do not necessarily represent the views of the International Bank for Reconstruction and Development/World Bank and its affiliated organizations, or those of the Executive Directors of the World Bank or the governments they represent.
Policy Research Working Paper 8210
This paper is a product of the Finance and Private Sector Development Team, Development Research Group. It is part of a larger effort by the World Bank to provide open access to its research and make a contribution to development policy discussions around the world. Policy Research Working Papers are also posted on the Web at http://econ.worldbank.org. The authors may be contacted at [email protected].
This study tests the effectiveness of behavioral-based dis-closure formats. Around 1,700 individuals from Mexico and Peru chose among loans and savings accounts pre-sented in different formats, including a simplified key facts statement (KFS) and current marketing brochures. The study finds that the price elasticity of loans is −1.04
using brochures and −3.19 using the simplified KFS, with smaller effects for savings products. Finally, while financial literacy is correlated with better decision-making, the effect of the disclosure format for loans is about three times as large as that of financial literacy. More importantly, the KFS helps financially illiterate individuals relatively more.
Information Disclosure and Demand Elasticity of Financial Products: Evidence
from a Multi-Country Study∗
Xavier Giné
Development Economics Research Group, World Bank
Cristina Martínez Cuellar
Citibank
Rafael Keenan Mazer
CGAP, World Bank
Keywords: financial information, disclosure, lab experiment.
JEL codes: C91, D14, D83, G18, G21, O16.
Giné: [email protected]; Martínez: [email protected] Mazer: [email protected].
We thank Leyla Castillo and Marianna Camino from the World Bank, CONDUSEF in Mexico and the
Superintendencia de Banca, Seguros y AFP (SBS) in Peru and in particular, Luís Daniel Allain Cañote,
Daniel Bouroncle, Jesús Chavez Ugalde, Isis Marín, María Fernanda Saldivar Cortes, and Mariela Zaldivar
Chauca for their constant encouragement and support. We also thank the team at Berumen and IPA for data
collection and to Ildrim Valley and Bernardo Ribeiro for superb research assistance. In addition, Luís
Daniel Allain Cañote and Jesús Chavez Ugalde provided valuable help with the calculations of key terms.
We gratefully acknowledge financial support from SECO and KCP. The views expressed in this paper are
those of the authors and should not be attributed to the World Bank, its executive directors, or the countries
they represent.
2
1. Introduction
Many consumers in financial markets find out about the characteristics of products
exclusively from providers, even when their staff has better information about the cost of
the product and the incentives between customers and staff are misaligned. It is thus
important to ask whether firms are successful at providing information and ultimately,
whether consumers are well-informed.
Two crucial pieces of evidence, however, should give us pause. First, financial
markets are characterized by substantial price dispersion (see, for example, Hortaçsu and
Syverson, 2004, Stango and Zinman, 2016, Giné and Mazer, 2017 and Zinman, 2015 for
a review).1 While the variation in prices may be driven by riskiness or the transaction
costs involved in servicing different customers, Stango and Zinman (2016) and Giné and
Mazer (2017) find that the same individuals in the same months are offered credit cards
and credit or savings products, respectively, with substantially different interest rates.
Second, there is little comparison shopping, even when customers face substantial price
dispersion. Woodward and Hall (2012), for example, show that mortgage borrowers
overpay at least USD 1,000 by shopping from too few brokers.
In rational search models, consumers expand their choice set up to the point where
the benefit of doing so is equal to its cost. But even when choices are provided at no
additional cost, comparison frictions may still cause consumers to place more weight on
non-financial factors like brand loyalty or non-professional advice from friends and
family to the detriment of the cost of the product (Bertrand et al., 2010). In addition, the
decision of which product to contract may involve unfamiliar concepts especially to
individuals with limited financial capabilities (Lusardi and Mitchell, 2011, 2014) and as a
result, financial consumers may not necessarily choose the most cost-effective product or
the one most suitable to their needs (see for example, Gross and Souleles, 2002; Choi et
1 Table 1 in Giné and Mazer (2017) reports summary statistics for estimated costs and yields of credit
and savings products, respectively, offered by a sample of financial institutions in Mexico and Peru. The
total annual cost of credit including usage fees ranges from 22.1 percent in Peru to over 225 percent in
Mexico. The total annual yield of a transaction account also including usage fees ranges from -14.5 percent
in Mexico to 0.8 percent in Peru.
3
al., 2011; Duarte and Hastings, 2012; Hastings et al., 2013; Agarwal et al., 2013, 2015
and Campbell et al., 2011 and DellaVigna, 2007 for reviews).
Governments and academics have focused on financial education as a tool to improve
financial wellbeing, but the efficacy of these initiatives is mixed (for example, Cole and
Shastry, 2010; Cole, Sampson, and Zia, 2011; Bruhn, Ibarra, and McKenzie, 2014;
Lusardi and Mitchell, 2014, and Fernandes et al., 2014).
As an alternative to educating financial consumers, governments around the world
have tried to encourage comparison shopping by introducing legislation to improve
disclosure and transparency. An early example of mandated financial disclosure is the
Truth in Lending Act of 1968 which required that consumers in the U.S. be presented
with key financial terms for credit products, and standardized the calculation of certain
key product terms and disclosure formats. Peru and Mexico introduced similar disclosure
laws in 2005 and 2009, respectively.
As noted by Campbell et al. (2011) and Loewenstein et al. (2014), effective
information disclosure should mitigate asymmetric information, reduce search costs and
encourage competition. But if consumers do not understand the information, its
effectiveness will be limited as they may believe that it is not relevant to their decision
making, or do not know how to use it. In a speech given in 2007, then governor Krozner
stated that “effective disclosures give consumers information they notice, understand, and
can use.” From a political economy perspective, mandated disclosure laws are easy to
enact because they only require the provision of information leaving the actual products
unregulated (Sunstein, 1999).
The fact that large price dispersion still persists, however, indicates that these efforts
may not have been successful (see for example Weil et al., 2006 or Lowenstein et al.,
2014). While disclosure regulation dictates what terms should be disclosed and how they
should be calculated, the actual design of the forms is typically left to the financial
providers. Their interests, however, do not necessarily coincide with those of consumers
and thus, formats are difficult to understand and not easily comparable. Online Appendix
4
OA4 contains two examples of market-designed key facts statements in Peru.2 The APR,
for example, appears around the center in the 10th row for one institution but in the top
left corner for the other. Other terms also appear in different places, making the
comparison between both products difficult.
This study seeks to understand the role of disclosure formats in facilitating
comparison shopping for savings and credit products by low-income consumers in Peru
and Mexico. These countries were chosen because they both have similar levels of
financial access but have de jure regulations with different transparency requirements.
According to the market conduct index published by the Economist Intelligence Unit’s
2014 Global Microscope Index and Report, Peru is ranked second while Mexico is
ranked 25th (middle of the sample of countries).3
We implement a laboratory experiment in which low-income consumers were
assigned a profile and then incentivized to choose the product that best fit their needs
from among 5 or 10 products. In each round of decision-making, information about the
products was presented in a different format, including current marketing materials
gathered from financial institutions during sales visits by actual consumers and a
simplified key facts statement (KFS) designed using behavioral insights to facilitate
comparison shopping.
Our results show that the simplified KFS with its standardized format significantly
improves consumer decision-making compared to the marketing materials currently
provided by financial institutions. The effects are however much stronger for credit than
savings products. The probability of choosing the cheapest loan increases from 42
percent using the marketing materials to 65 percent using the simplified KFS but it only
increases from 32 percent to 34 percent for savings accounts. One reason is perhaps that
individuals may not care about the total yield of the savings account and focus instead on
other characteristics. After all, a consistent finding from the literature on savings is that
2 A product key facts statement (KFS) is a document that provides concise information of the key features
and risks of a financial product. 3 Market conduct includes indicators of the capacity to protect the financial consumer, the content of
disclosure rules, the disclosure of product terms, pricing information and non-discrimination in the
financial service provision.
5
the behavioral response to changes in the price of saving is not large (see Hastings et al.,
2013 for a review). Alternatively, subjects evaluating savings products may not have had
enough information as the lack of impact is concentrated in Mexico where the simplified
KFS did not contain the total yield earned by the savings account.
We also find that transparency increases price elasticity. The price elasticity of credit
products is -1.04 using brochures and -3.19 using the simplified KFS, that is, about three
times as large. For savings products, the price elasticity is 0.02 using brochures and 0.03
using the simplified KFS, and the difference is not statistically significant. In addition,
non-price factors such as the (random) order in which savings products are presented to
consumers matter more when brochures are used rather than simplified KFS, consistent
with the idea that transparency allows individuals to focus on the price. Finally, we show
that financial education is correlated with better financial decision-making, but for credit
products, the effect of the disclosure format is about three times as large as that of the
effect of financial literacy. More importantly, the simplified KFS is particularly useful to
financially illiterate individuals as financial literacy increases the price-elasticity of credit
products by 58 percent when using brochures but only by 7 percent when using the
simplified KFS.
These results, therefore have relevant implications for how government-mandated
information should be presented and its potential to influence choices and competition in
consumer finance markets.
This paper contributes to the literature in household finance and other fields that
study the impact of disclosure regulations in various consumer markets (see Ben-Shahar,
2011 and Dranove and Jin, 2010 for a review). The evidence on the effectiveness of
disclosure regulations is mixed, and because there may be factors other than the
disclosure regime that change at the same time, it is hard to attribute changes in behavior
to the disclosure regulation alone. In contrast, in our controlled setting the same subjects
make decisions using the same information presented with a different format, allowing us
to make causal statements about the effectiveness of the disclosure treatment.
Our evidence comes from the laboratory rather than the field. The advantage is that
subjects are rewarded to pay attention when making decisions. This increases our
6
statistical power considerably and may explain the magnitude of the price elasticities
found.4 The disadvantage is that the environment may be artificial as individuals typically
face competing demands on their time and attention when making decisions. In the field,
complexity can lead to inaction, as shown by Bettinger et al. (2012) in the context of
college financial aid applications, by Hastings and Weinstein (2008) that study school
choice and by Barghava and Manoli (2015) that study benefits of simplification in the
take-up of the Earned Income Tax Credit. More related to our context, in Adams et al.
(2016), for example, holders of low-yielding savings accounts were given information
about higher-rate paying products, a form that enabled simplified switching and a
reminder about their low rate. About 90 percent of study participants failed to take any
action when it was in their interest to do so. Perhaps more troubling, they did not even
recall receiving or reading such information. Similarly, Ponce et al. (2017) find muted
effects from information disclosures in the Mexican credit card market.
Another advantage of field experiments is that they allow researchers to observe not
only consumer responses, but also how firms respond to greater disclosure requirements.
Duarte and Hastings (2012) evaluate a change in government disclosure in Mexico’s
privatized social security system and find strong evidence that firms find ways to
undermine the effects of disclosure reform by altering their fee structures. Anagol and
Kim (2012) also find evidence that firms respond to disclosure policy by altering
products to maintain lack of clarity in pricing.5
The paper finally contributes to the literature documenting consumer financial
mistakes and the role of disclosures in preventing them. Hastings and Tejada (2008) show
that presenting the cost of a financial product in amounts instead of percentages allows
people to choose better products and to focus on other characteristics like fees. Thus,
echoing the findings here, minor changes on how information is presented can have
significant effects on decision-making. Related, Bertrand and Morse (2011) show that
4 Beshears et al. (2013) and Choi, Laibson, and Madrian (2010) also conduct laboratory experiments that
vary the presentation of investment fees while holding other fund characteristics constant to test whether
making fees less shrouded changes fund choice; both studies find however, little evidence to suggest that
changing the framing of fees has a large impact on investor decisions. 5 For evidence of responses to disclosure from another industry see Newell et al. (1999) for purchases of
appliances.
7
disclosing the cumulative costs of payday loans in amounts (rather than percentages)
significantly reduces the demand of such loans.
The remainder of the paper is organized as follows. Section 2 presents the
experimental design and the different treatments; Section 3 reports the empirical strategy,
Section 4 presents the results and Section 5 concludes.
2. Experimental Design
Individuals from around the capital city of Peru and Mexico were invited to
participate in the experiment to test different disclosure forms. During recruitment,
individuals were told that they would earn money making decisions but no details were
provided about the nature of the decisions. Experimental sessions were conducted in
2013 in Mexico and 2017 in Peru. They took place in a room set up in a way to ensure
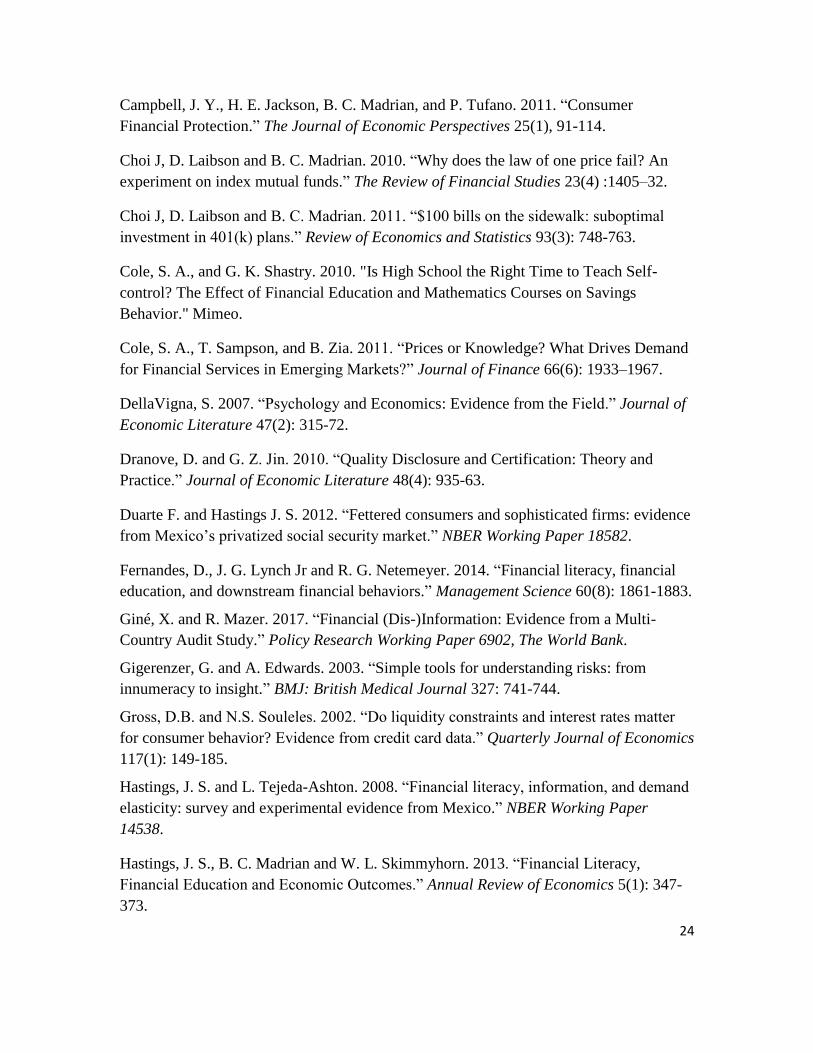
that communication between subjects was not possible. A total of 600 subjects in Peru
and 1,071 in Mexico participated in 57 sessions (10 sessions for each product in Peru and
20 and 17 for credit and savings, respectively, in Mexico), with around 30 subjects per
session (see Table 1 for details). Prior to the sessions, a subset of participants in Mexico
received SMS and live calls with tips about the terms that were important for financial
decision-making. In particular, prospective participants in credit sessions were told to
verify the total amount to be paid, including interest payments, commissions and
insurance premia. Participants of savings sessions were told to choose the accounts
offering the highest yield. Online Appendix OA2 contains the scripts to the live calls and
the text of the SMS. While there is an extensive literature on messages as reminders (see,
for example, Karlan et al., 2016) here we test messages as a way to disclose information.
Subjects only participated in one experimental session that lasted between 1.5 and 2
hours. Each session started with a 20-minute survey, then three rounds of decision-
making in Peru and 5 in Mexico where subjects were instructed to choose the product
that best fit their needs, followed by an end-of-session survey. The initial survey included
questions on demographic characteristics, knowledge and preferences of financial
institutions, factors that affect subjects’ financial decisions, and financial literacy.
8
Table 2 presents the characteristics of participants. Participants were stratified by
gender and they vary by education and occupation. Although Mexico is a richer country,
the Peruvian sample has a lower proportion of low-income participants (NSE C- or D).
For this reason, monthly household income is slightly higher in Peru (USD 641 in
Mexico compared to USD 783 in Peru) and participants seem on average more educated.
Participants in Peru are also more familiar with financial institutions and report higher
ownership of savings accounts and credit cards. In addition, less than one-third of
participants in Peru report comparing more than one product when they last contracted a
savings account or loan. When we correlate a dummy for comparing different products
against individual characteristics we find that richer individuals (as per their
socioeconomic status), those with internet at home and those that are familiar with banks
are more likely to engage in comparison shopping.6 While more than half tend to view
the staff and marketing materials as the primary source of information about financial
products, less than 15 percent of participants in either country is familiar with a key facts
statement. These individuals appear to be poorly equipped when deciding among
financial products (Lusardi and Mitchell, 2011) and thus are good candidates for the
focus of this study. We note that there is within country variation in the levels of
education and financial literacy, a feature that we will exploit later when comparing the
difference in the probability of choosing the right financial product for a given participant
facing different disclosures designs to that of participants with different levels of
financial literacy facing a given format. Online Appendix Table OA1 regresses our
preferred proxy for financial literacy, which takes value 1 if the participant answered a
question about interest rate correctly, against other individual characteristics.7 Not
surprisingly, for the pooled sample in column 3 financial literacy is correlated with
household income, education and usage of financial products. It is also correlated with
6 Data on product comparisons were only collected in Peru and therefore are not reported in Table 2. 7 The interest rate question used is a simplified version of the one from Lusardi and Mitchell (2011): “If you
deposit 100 pesos / soles in a bank account that charges you nothing and guarantees you a yield of 2% per
year, how much would there be in the account by the end of the year, if no deposits or withdrawals are
made?” Possible answers are: (a) Over 102. (b) Exactly 102. (c) Less than 102. (d) I don’t know. (e) I
prefer not to answer. Lusardi and Mitchell (2011) use the timeframe of 5 years instead of one year.
9
being a male, although it is not always him who makes financial decisions in the
household.
Following the survey, the experimenter explained the rules for decision-making to
all participants in Spanish. In each decision-making round, subjects were first provided
with a sheet to mark their decisions. They then were given 10 minutes to record the three
best products on the sheet.8 Sheets were then collected after each round by an assistant
and inputted into a computer to calculate payouts for the round. After the end-of-session
survey, subjects were paid a show-up fee of 200 pesos (USD 16) in Mexico and could
win 100 pesos (USD 8) more depending on the number of correct answers. In Peru, they
were paid similar amounts using a voucher for a family meal in a popular fast food
restaurant.
2.1 Task
In each round, subjects received information about 5 or 10 products, each offered
by a different institution. The terms of each product were simulated using the dispersion
of values in the market. No pair of participants received the same combination of
products. Participants were instructed to choose the best product in accordance to a
profile randomly assigned to them at the beginning of the session.9 Half of the
participants were randomized into one profile and the other half into the other. In credit
sessions, all participants were told that they were going to acquire a 12-month loan with
monthly installments of 10,000 pesos (USD 800) in Mexico and 1,500 Peruvian soles
(USD 450) in Peru. In Mexico there was only one profile that mentioned that every
monthly installment was made on time. In Peru, half of the participants were randomized
into another profile where all monthly installments but one were paid on time. Put
differently, there was one missed installment but paid in full in the next installment. In
savings sessions, participants were told that they had a fictional endowment to be
deposited into a savings account of 1,000 Peruvian soles (USD 300) in Peru and 5,000
8 We believe that 10 minutes was enough to make decisions without pressure. Typically, participants
completed the sheet with few minutes to spare. 9 For credit, the best product is the one that yields the least total cost; for savings, the product with the
highest net yield.
10
pesos (USD 400) in Mexico. Savings Profile 1 mentioned that each month participants
would make two deposits and two withdrawals of 100 Peruvian soles (USD 30) in Peru
and 250 pesos (USD 20) in Mexico each and two balance inquiries at a teller of the
financial institution. Savings Profile 2 in Mexico had no monthly activity, while in Peru it
was similar to Savings Profile 1 in that one transaction (withdrawals, deposits and
balance inquiries) would be made instead of two. The balance inquiry would be made at
an ATM instead of at a teller.
2. 2 Treatments
In recent years, both Mexico and Peru have developed a regulatory framework to
supervise and promote the use of financial services. Mexico enacted a law similar to the
U.S. Truth in Lending Act of 1968 in 2009 that also requires financial providers to
disclose the APR and APY. Peru enacted disclosure regulation in 2005 and in 2012,
which, similar to the regulatory financial transparency regime in Mexico, also defines the
criteria for the determination and definition of interest rates, fees, charges and yields –
including methods for calculating the total effective costs and rates for credit and savings
products. Current regulation requires financial institutions to disclose information to
consumers through brochures, key facts statements, webpages, ATMs, and verbally at the
branches.
While disclosure regulation of most countries dictates what terms should be disclosed
and how they should be calculated, the actual design of the forms is typically left to the
financial providers. The goal of the experiment is to test alternative disclosure formats to
the ones developed by the financial industry.
Each session in Peru had three rounds and in Mexico 5 rounds, each with a
different disclosure format. In Peru, the first disclosure treatment used marketing
materials such as brochures, amortization tables, and simulations that were offered to
11
prospective clients when shopping for financial products at the time of the experiment.10
These materials combined pictures with information about the terms, but each institution
had its own design, making comparisons across similar products difficult. The second
disclosure treatment used key facts statements (KFS) that institutions were required to
give customers after contracting a product. The SBS regulated the minimum number of
terms that had to be disclosed, but the design and whether to show the terms in fine print
was left to the financial institution. As a result, these market-designed KFS had different
layout of information, again making comparisons across products difficult. The third and
final disclosure format used a standardized key facts statement designed jointly by SBS
and us. This format presents the more relevant information in the top right corner using a
large font and because the information is standardized, a given term will always be in the
exact same place for every institution thus facilitating comparability. In Mexico, the first
disclosure treatment also used brochures. The second disclosure treatment used a
standardized key facts statement designed jointly by CONDUSEF and us that is similar to
the standardized KFS used in Peru. The remaining treatments used comparative tables
with either 5 or 10 products that varied the number of financial terms presented. The
complex treatment presented information for 5 products with 8 terms for credit and 12
terms for savings (Complex 5). The simple treatment also presented information for 5
products, but with 4 terms for credit and 3 terms for savings (Simple 5). Finally, the long,
simple treatment presented the same terms as the Simple 5 treatment just described but
provided information about 10 different products (Simple 10). Online Appendix OA4
contains examples of all the disclosure formats used in the experiment.
The order in which formats were presented to participants was randomized in
each session to avoid learning effects. Given the objective of comparing the performance
of different formats, all materials had to have key information about the APR / YPR and
user fees to make the informational content comparable across formats. This meant that
terms of the product had to be added to the materials if these were missing in the original
one, which was typically the case for brochures.
10 From all the marketing material collected by CONDUSEF and SBS, we chose the 5 materials with the highest
amount of information about the product.
12
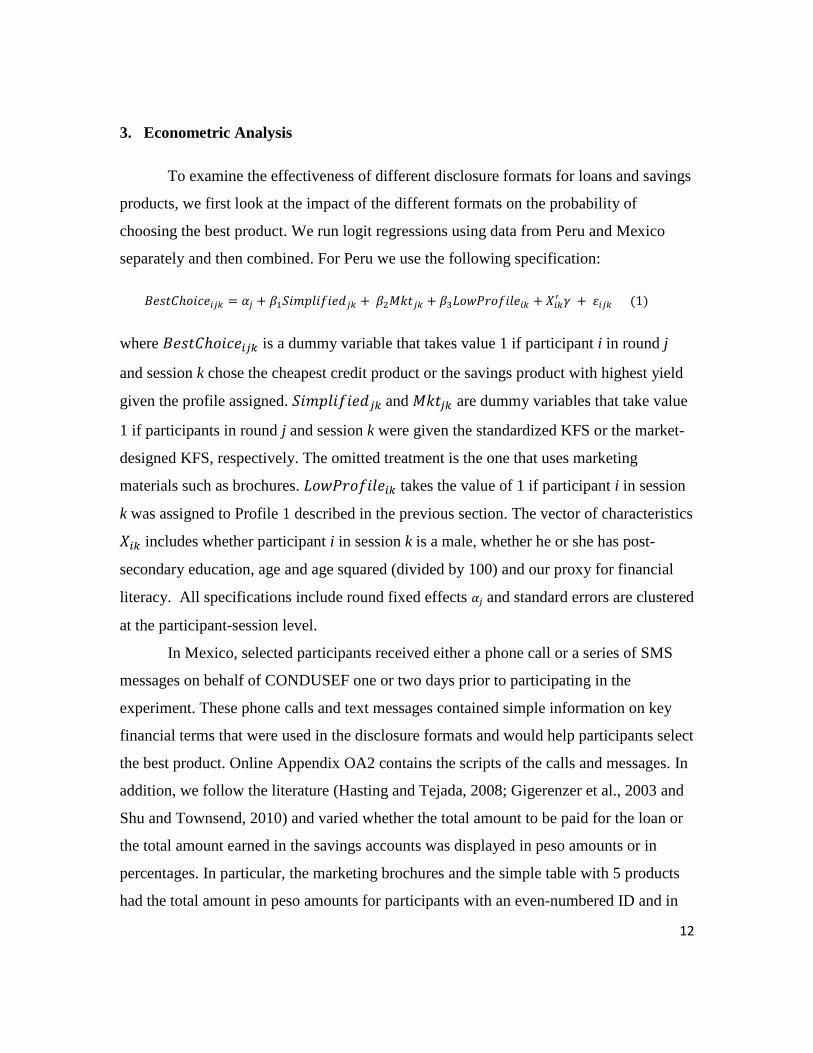
3. Econometric Analysis
To examine the effectiveness of different disclosure formats for loans and savings
products, we first look at the impact of the different formats on the probability of
choosing the best product. We run logit regressions using data from Peru and Mexico
separately and then combined. For Peru we use the following specification:
𝐵𝑒𝑠𝑡𝐶ℎ𝑜𝑖𝑐𝑒𝑖𝑗𝑘 = 𝛼𝑗 + 𝛽1𝑆𝑖𝑚𝑝𝑙𝑖𝑓𝑖𝑒𝑑𝑗𝑘 + 𝛽2𝑀𝑘𝑡𝑗𝑘 + 𝛽3𝐿𝑜𝑤𝑃𝑟𝑜𝑓𝑖𝑙𝑒𝑖𝑘 + 𝑋𝑖𝑘′ 𝛾 + 𝜀𝑖𝑗𝑘 (1)
where 𝐵𝑒𝑠𝑡𝐶ℎ𝑜𝑖𝑐𝑒𝑖𝑗𝑘 is a dummy variable that takes value 1 if participant i in round j
and session k chose the cheapest credit product or the savings product with highest yield
given the profile assigned. 𝑆𝑖𝑚𝑝𝑙𝑖𝑓𝑖𝑒𝑑𝑗𝑘 and 𝑀𝑘𝑡𝑗𝑘 are dummy variables that take value
1 if participants in round j and session k were given the standardized KFS or the market-
designed KFS, respectively. The omitted treatment is the one that uses marketing
materials such as brochures. 𝐿𝑜𝑤𝑃𝑟𝑜𝑓𝑖𝑙𝑒𝑖𝑘 takes the value of 1 if participant i in session
k was assigned to Profile 1 described in the previous section. The vector of characteristics
𝑋𝑖𝑘 includes whether participant i in session k is a male, whether he or she has post-
secondary education, age and age squared (divided by 100) and our proxy for financial
literacy. All specifications include round fixed effects 𝛼𝑗 and standard errors are clustered
at the participant-session level.
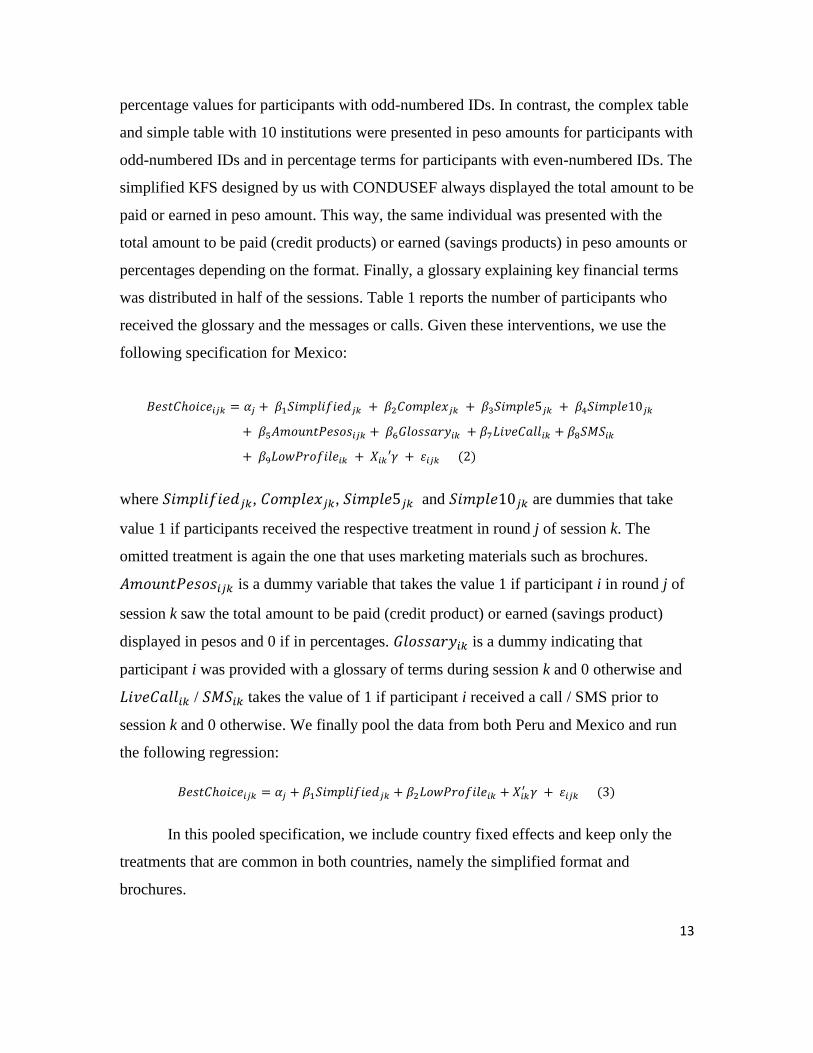
In Mexico, selected participants received either a phone call or a series of SMS
messages on behalf of CONDUSEF one or two days prior to participating in the
experiment. These phone calls and text messages contained simple information on key
financial terms that were used in the disclosure formats and would help participants select
the best product. Online Appendix OA2 contains the scripts of the calls and messages. In
addition, we follow the literature (Hasting and Tejada, 2008; Gigerenzer et al., 2003 and
Shu and Townsend, 2010) and varied whether the total amount to be paid for the loan or
the total amount earned in the savings accounts was displayed in peso amounts or in
percentages. In particular, the marketing brochures and the simple table with 5 products
had the total amount in peso amounts for participants with an even-numbered ID and in
13
percentage values for participants with odd-numbered IDs. In contrast, the complex table
and simple table with 10 institutions were presented in peso amounts for participants with
odd-numbered IDs and in percentage terms for participants with even-numbered IDs. The
simplified KFS designed by us with CONDUSEF always displayed the total amount to be
paid or earned in peso amount. This way, the same individual was presented with the
total amount to be paid (credit products) or earned (savings products) in peso amounts or
percentages depending on the format. Finally, a glossary explaining key financial terms
was distributed in half of the sessions. Table 1 reports the number of participants who
received the glossary and the messages or calls. Given these interventions, we use the
following specification for Mexico:
𝐵𝑒𝑠𝑡𝐶ℎ𝑜𝑖𝑐𝑒𝑖𝑗𝑘 = 𝛼𝑗 + 𝛽1𝑆𝑖𝑚𝑝𝑙𝑖𝑓𝑖𝑒𝑑𝑗𝑘 + 𝛽2𝐶𝑜𝑚𝑝𝑙𝑒𝑥𝑗𝑘 + 𝛽3𝑆𝑖𝑚𝑝𝑙𝑒5𝑗𝑘 + 𝛽4𝑆𝑖𝑚𝑝𝑙𝑒10𝑗𝑘
+ 𝛽5𝐴𝑚𝑜𝑢𝑛𝑡𝑃𝑒𝑠𝑜𝑠𝑖𝑗𝑘 + 𝛽6𝐺𝑙𝑜𝑠𝑠𝑎𝑟𝑦𝑖𝑘 + 𝛽7𝐿𝑖𝑣𝑒𝐶𝑎𝑙𝑙𝑖𝑘 + 𝛽8𝑆𝑀𝑆𝑖𝑘
+ 𝛽9𝐿𝑜𝑤𝑃𝑟𝑜𝑓𝑖𝑙𝑒𝑖𝑘 + 𝑋𝑖𝑘′𝛾 + 𝜀𝑖𝑗𝑘 (2)
where 𝑆𝑖𝑚𝑝𝑙𝑖𝑓𝑖𝑒𝑑𝑗𝑘, 𝐶𝑜𝑚𝑝𝑙𝑒𝑥𝑗𝑘, 𝑆𝑖𝑚𝑝𝑙𝑒5𝑗𝑘 and 𝑆𝑖𝑚𝑝𝑙𝑒10𝑗𝑘 are dummies that take
value 1 if participants received the respective treatment in round j of session k. The
omitted treatment is again the one that uses marketing materials such as brochures.
𝐴𝑚𝑜𝑢𝑛𝑡𝑃𝑒𝑠𝑜𝑠𝑖𝑗𝑘 is a dummy variable that takes the value 1 if participant i in round j of
session k saw the total amount to be paid (credit product) or earned (savings product)
displayed in pesos and 0 if in percentages. 𝐺𝑙𝑜𝑠𝑠𝑎𝑟𝑦𝑖𝑘 is a dummy indicating that
participant i was provided with a glossary of terms during session k and 0 otherwise and
𝐿𝑖𝑣𝑒𝐶𝑎𝑙𝑙𝑖𝑘 / 𝑆𝑀𝑆𝑖𝑘 takes the value of 1 if participant i received a call / SMS prior to
session k and 0 otherwise. We finally pool the data from both Peru and Mexico and run
the following regression:
𝐵𝑒𝑠𝑡𝐶ℎ𝑜𝑖𝑐𝑒𝑖𝑗𝑘 = 𝛼𝑗 + 𝛽1𝑆𝑖𝑚𝑝𝑙𝑖𝑓𝑖𝑒𝑑𝑗𝑘 + 𝛽2𝐿𝑜𝑤𝑃𝑟𝑜𝑓𝑖𝑙𝑒𝑖𝑘 + 𝑋𝑖𝑘′ 𝛾 + 𝜀𝑖𝑗𝑘 (3)
In this pooled specification, we include country fixed effects and keep only the
treatments that are common in both countries, namely the simplified format and
brochures.
14
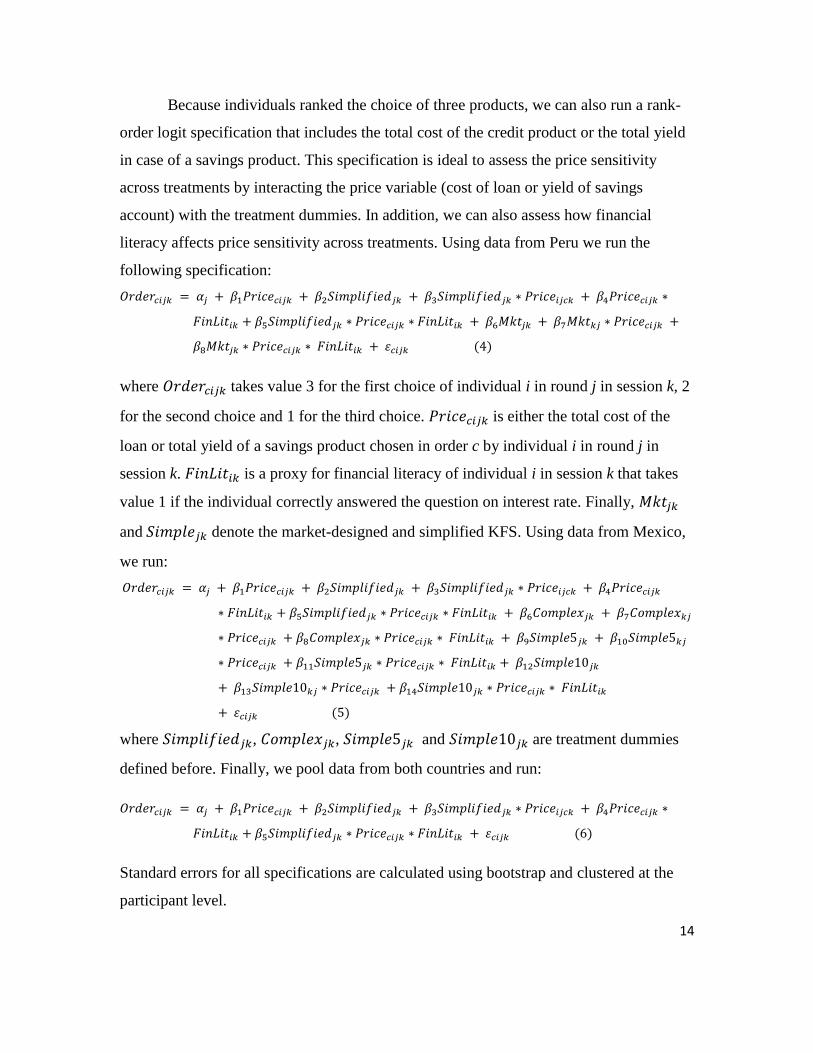
Because individuals ranked the choice of three products, we can also run a rank-
order logit specification that includes the total cost of the credit product or the total yield
in case of a savings product. This specification is ideal to assess the price sensitivity
across treatments by interacting the price variable (cost of loan or yield of savings
account) with the treatment dummies. In addition, we can also assess how financial
literacy affects price sensitivity across treatments. Using data from Peru we run the
following specification:
𝑂𝑟𝑑𝑒𝑟𝑐𝑖𝑗𝑘 = 𝛼𝑗 + 𝛽1𝑃𝑟𝑖𝑐𝑒𝑐𝑖𝑗𝑘 + 𝛽2𝑆𝑖𝑚𝑝𝑙𝑖𝑓𝑖𝑒𝑑𝑗𝑘 + 𝛽3𝑆𝑖𝑚𝑝𝑙𝑖𝑓𝑖𝑒𝑑𝑗𝑘 ∗ 𝑃𝑟𝑖𝑐𝑒𝑖𝑗𝑐𝑘 + 𝛽4𝑃𝑟𝑖𝑐𝑒𝑐𝑖𝑗𝑘 ∗
𝐹𝑖𝑛𝐿𝑖𝑡𝑖𝑘 + 𝛽5𝑆𝑖𝑚𝑝𝑙𝑖𝑓𝑖𝑒𝑑𝑗𝑘 ∗ 𝑃𝑟𝑖𝑐𝑒𝑐𝑖𝑗𝑘 ∗ 𝐹𝑖𝑛𝐿𝑖𝑡𝑖𝑘 + 𝛽6𝑀𝑘𝑡𝑗𝑘 + 𝛽7𝑀𝑘𝑡𝑘𝑗 ∗ 𝑃𝑟𝑖𝑐𝑒𝑐𝑖𝑗𝑘 +
𝛽8𝑀𝑘𝑡𝑗𝑘 ∗ 𝑃𝑟𝑖𝑐𝑒𝑐𝑖𝑗𝑘 ∗ 𝐹𝑖𝑛𝐿𝑖𝑡𝑖𝑘 + 𝜀𝑐𝑖𝑗𝑘 (4)
where 𝑂𝑟𝑑𝑒𝑟𝑐𝑖𝑗𝑘 takes value 3 for the first choice of individual i in round j in session k, 2
for the second choice and 1 for the third choice. 𝑃𝑟𝑖𝑐𝑒𝑐𝑖𝑗𝑘 is either the total cost of the
loan or total yield of a savings product chosen in order c by individual i in round j in
session k. 𝐹𝑖𝑛𝐿𝑖𝑡𝑖𝑘 is a proxy for financial literacy of individual i in session k that takes
value 1 if the individual correctly answered the question on interest rate. Finally, 𝑀𝑘𝑡𝑗𝑘
and 𝑆𝑖𝑚𝑝𝑙𝑒𝑗𝑘 denote the market-designed and simplified KFS. Using data from Mexico,
we run:
𝑂𝑟𝑑𝑒𝑟𝑐𝑖𝑗𝑘 = 𝛼𝑗 + 𝛽1𝑃𝑟𝑖𝑐𝑒𝑐𝑖𝑗𝑘 + 𝛽2𝑆𝑖𝑚𝑝𝑙𝑖𝑓𝑖𝑒𝑑𝑗𝑘 + 𝛽3𝑆𝑖𝑚𝑝𝑙𝑖𝑓𝑖𝑒𝑑𝑗𝑘 ∗ 𝑃𝑟𝑖𝑐𝑒𝑖𝑗𝑐𝑘 + 𝛽4𝑃𝑟𝑖𝑐𝑒𝑐𝑖𝑗𝑘
∗ 𝐹𝑖𝑛𝐿𝑖𝑡𝑖𝑘 + 𝛽5𝑆𝑖𝑚𝑝𝑙𝑖𝑓𝑖𝑒𝑑𝑗𝑘 ∗ 𝑃𝑟𝑖𝑐𝑒𝑐𝑖𝑗𝑘 ∗ 𝐹𝑖𝑛𝐿𝑖𝑡𝑖𝑘 + 𝛽6𝐶𝑜𝑚𝑝𝑙𝑒𝑥𝑗𝑘 + 𝛽7𝐶𝑜𝑚𝑝𝑙𝑒𝑥𝑘𝑗
∗ 𝑃𝑟𝑖𝑐𝑒𝑐𝑖𝑗𝑘 + 𝛽8𝐶𝑜𝑚𝑝𝑙𝑒𝑥𝑗𝑘 ∗ 𝑃𝑟𝑖𝑐𝑒𝑐𝑖𝑗𝑘 ∗ 𝐹𝑖𝑛𝐿𝑖𝑡𝑖𝑘 + 𝛽9𝑆𝑖𝑚𝑝𝑙𝑒5𝑗𝑘 + 𝛽10𝑆𝑖𝑚𝑝𝑙𝑒5𝑘𝑗
∗ 𝑃𝑟𝑖𝑐𝑒𝑐𝑖𝑗𝑘 + 𝛽11𝑆𝑖𝑚𝑝𝑙𝑒5𝑗𝑘 ∗ 𝑃𝑟𝑖𝑐𝑒𝑐𝑖𝑗𝑘 ∗ 𝐹𝑖𝑛𝐿𝑖𝑡𝑖𝑘 + 𝛽12𝑆𝑖𝑚𝑝𝑙𝑒10𝑗𝑘
+ 𝛽13𝑆𝑖𝑚𝑝𝑙𝑒10𝑘𝑗 ∗ 𝑃𝑟𝑖𝑐𝑒𝑐𝑖𝑗𝑘 + 𝛽14𝑆𝑖𝑚𝑝𝑙𝑒10𝑗𝑘 ∗ 𝑃𝑟𝑖𝑐𝑒𝑐𝑖𝑗𝑘 ∗ 𝐹𝑖𝑛𝐿𝑖𝑡𝑖𝑘
+ 𝜀𝑐𝑖𝑗𝑘 (5)
where 𝑆𝑖𝑚𝑝𝑙𝑖𝑓𝑖𝑒𝑑𝑗𝑘, 𝐶𝑜𝑚𝑝𝑙𝑒𝑥𝑗𝑘, 𝑆𝑖𝑚𝑝𝑙𝑒5𝑗𝑘 and 𝑆𝑖𝑚𝑝𝑙𝑒10𝑗𝑘 are treatment dummies
defined before. Finally, we pool data from both countries and run:
𝑂𝑟𝑑𝑒𝑟𝑐𝑖𝑗𝑘 = 𝛼𝑗 + 𝛽1𝑃𝑟𝑖𝑐𝑒𝑐𝑖𝑗𝑘 + 𝛽2𝑆𝑖𝑚𝑝𝑙𝑖𝑓𝑖𝑒𝑑𝑗𝑘 + 𝛽3𝑆𝑖𝑚𝑝𝑙𝑖𝑓𝑖𝑒𝑑𝑗𝑘 ∗ 𝑃𝑟𝑖𝑐𝑒𝑖𝑗𝑐𝑘 + 𝛽4𝑃𝑟𝑖𝑐𝑒𝑐𝑖𝑗𝑘 ∗
𝐹𝑖𝑛𝐿𝑖𝑡𝑖𝑘 + 𝛽5𝑆𝑖𝑚𝑝𝑙𝑖𝑓𝑖𝑒𝑑𝑗𝑘 ∗ 𝑃𝑟𝑖𝑐𝑒𝑐𝑖𝑗𝑘 ∗ 𝐹𝑖𝑛𝐿𝑖𝑡𝑖𝑘 + 𝜀𝑐𝑖𝑗𝑘 (6)
Standard errors for all specifications are calculated using bootstrap and clustered at the
participant level.
15
We can also use a ranked-order logit specification to investigate whether certain
treatments make individuals more likely to rely on non-financial factors like brand
loyalty or the (random) order in which products were received in detriment to the cost of
the product (Bertrand et al., 2010). We run the following specification using pooled data
𝑂𝑟𝑑𝑒𝑟𝑐𝑖𝑗𝑘 = 𝛼𝑗 + 𝛽1𝑇𝑜𝑝𝑇𝑎𝑏𝑙𝑒𝑐𝑖𝑗𝑘 + 𝛽2𝐹𝑎𝑚𝑖𝑙𝑖𝑎𝑟𝑖𝑡𝑦𝑐𝑖𝑗𝑘 + 𝛽3𝑆𝑖𝑚𝑝𝑙𝑖𝑓𝑖𝑒𝑑𝑗𝑘 + 𝛽4𝑆𝑖𝑚𝑝𝑙𝑖𝑓𝑖𝑒𝑑𝑗𝑘 ∗
𝑇𝑜𝑝𝑇𝑎𝑏𝑙𝑒𝑖𝑗𝑐𝑘 + 𝛽5𝑆𝑖𝑚𝑝𝑙𝑖𝑓𝑖𝑒𝑑𝑗𝑘 ∗ 𝐹𝑎𝑚𝑖𝑙𝑖𝑎𝑟𝑖𝑡𝑦𝑐𝑖𝑗𝑘 + 𝜀𝑐𝑖𝑗𝑘 (7)
where 𝑇𝑜𝑝𝑇𝑎𝑏𝑙𝑒𝑐𝑖𝑗𝑘 takes value 1 if product chosen in order c by participant i in round j
of session k was among the first half of the products given in a round or was shown in the
upper half of a comparative table in Mexico. 𝐹𝑎𝑚𝑖𝑙𝑖𝑎𝑟𝑖𝑡𝑦𝑐𝑖𝑗𝑘 is another dummy that
takes value 1 if the participant had or had ever had a financial product from the institution
of the product chosen in order c.
4. Results
Table 3 reports the coefficients from regressions in (1) (in columns 1 and 4) in (2)
(in columns 2 and 5) and in (3) in columns 3 and 6. The dependent variable is a dummy
that takes value 1 if the individual chose the best product. Columns 1 to 3 (4 to 6) report
the results for credit (savings) sessions. In all regressions, the first rows show the
coefficients associated with the disclosure treatments followed by the coefficient for the
profile dummy and the participant characteristics. The table also reports the mean of the
dependent variable for the omitted disclosure treatment (marketing materials) and the p-
value of a t-test that two different disclosure treatments are equal.
Column 1 of Table 3 shows the results for credit sessions in Peru. The simplified
KFS increases the probability that individuals chose the right loan product by 12.6
percentage points relative to the brochures (and other marketing materials) and it is
significant at the 1 percent level. In contrast, KFS designed by financial institutions do
not significantly improve decision-making relative to brochures. The p-value associated
with the t-test that the coefficients on both disclosure treatments are equal is 0. The
coefficient associated to the profile is also not significant, suggesting that individuals are
equally able to choose the best loan product regardless of whether they expect to make all
16
payments on time or with one missed payment. We note that for 80 percent of all
products (including loans and savings accounts), the best product according to Profile 1
would not be chosen under the other profile so that choosing according to the profile was
important. Finally, none of the participant characteristics in Peru affects financial
decision-making, including proxies for education and financial literacy.
Column 2 of Table 3 shows that in Mexico, the simplified KFS, the complex table
and simple table with 5 products were equally effective at increasing the probability of
choosing the best credit product by around 25 percentage points or by 64 percent (from a
base of 38.6 percentage points) relative to credit choices using brochures. Interestingly,
doubling the number of products from 5 to 10 eviscerates the positive impact on decision-
making as participants do no better with the 10-product comparative table than with
brochures. This result is consistent with the concept of choice overload coined by Toffler
(1970) and described in Iyengar and Lepper (2000) and Schwartz (2004).
We also find that showing the total cost of the credit in pesos (instead of in
percentages) increases the probability of choosing the cheapest credit product by 8
percentage points, confirming the findings of Hasting and Tejada (2008), Gigerenzer et
al. (2003) and Shu and Townsend (2010). In contrast, the live calls, SMS or the glossary
did not improve decision-making. About half of the participants had heard about
CONDUSEF, and indeed receiving an SMS prior to the experiment increased the odds of
knowing about CONDUSEF by 25 percent. Participants received an average of 2.4 SMS
from CONDUSEF in the 5 days prior (and they recalled receiving around 3 SMS per
day). They received about 1.2 live calls from CONDUSEF. Despite the number of SMS
and calls, the message did not register, as it did not improve the ability to choose the best
financial product. Perhaps since they were not facing a teachable moment at the time they
received the SMS or call, they ignored the content. The lack of impact of the glossary
may be explained by the fact that it was difficult to understand. Online Appendix OA3
reports the glossary that was handed out.
Among the participant characteristics, financial literacy is the only one that
contributed to better decision-making by 10 percentage points, but the impact of the
simplified KFS is 2.5 times larger than that of financial literacy. Column 3 of Table 3
17
presents the pooled regression comparing the simplified KFS to the brochures. These
were the disclosure treatments common to both countries. We find that the simplified
KFS improves the probability of choosing the best credit product by 23 percentage points
(p-value is 0). This result is remarkable because it indicates that the same individual can
improve his or her decision-making simply by using a different format. When we
compare individuals with and without financial literacy, we find that financially literate
individuals are 6.6 percentage points more likely to choose the right credit product. This
comparison is somewhat problematic because financially literate individuals may differ
in other characteristics to those that are financially illiterate and therefore differences in
decision-making cannot be solely attributed to financial literacy. By comparing the
coefficients, however, what is remarkable is that the simplified KFS is almost 3.5 times
more effective than financial literacy.
While the simplified format significantly improves decision-making for credit
products, columns 4 to 6 show that this is not the case for savings products. The
coefficient on simplified KFS is positive in columns 4 and 6 but negative in column 5 and
never statistically significant. In column 4, the market-designed KFS does not improve
the choice of savings products (relative to marketing materials) either. In column 5, the
simple table with 5 products and to a lesser extent the complex table and the simple table
with 10 products increase the probability of choosing the highest-yielding savings
account according to the profile assigned. The simple table increases the probability by
17.7 percent or by 51 percentage points (from a base of 34.2 percent among those offered
brochures). Similar to column 2, when the yield is presented in pesos rather than
percentage terms, the probability of choosing the right savings product increases by 4.1
percent. Among participant characteristics, being a male, having post-secondary
education and correctly answering the financial literacy question improve financial
decision-making. The impact of financial literacy is again about half that of using the
simple table with 5 products to compare across savings products.
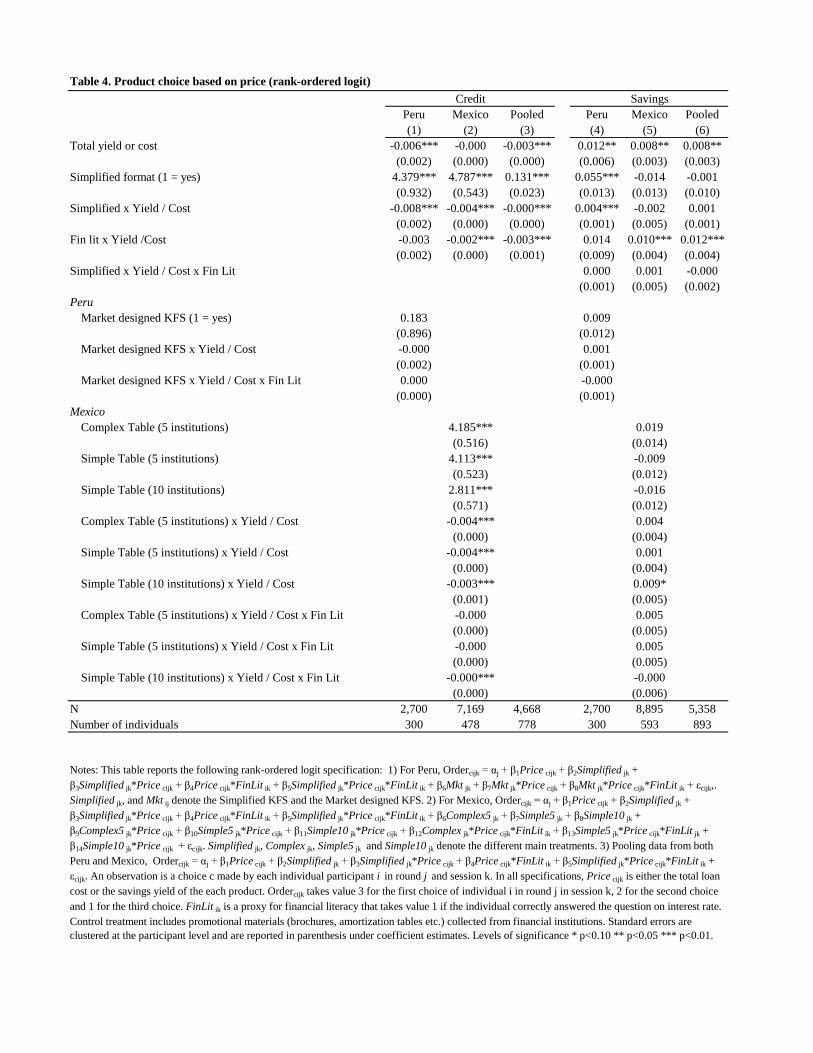
Table 4 presents the results of the rank-ordered logit. In Peru and in the pooled
regression (columns 1 and 3, respectively), the higher the cost of the loan, the lower the
probability that that loan will be selected as the first choice. This suggests that individuals
18
are price sensitive. More interestingly, in all of the credit-related specifications (columns
1 to 3), the interaction of the total cost with a dummy for the simplified format is also
negative and significant, suggesting that price sensitivity is enhanced by the simplified
KFS. Put differently, comparison shopping is enhanced with more transparent disclosure.
Related, financial literacy also increases price sensitivity in Mexico and using the
pooled sample (columns 2 and 3, respectively). Echoing the results of Table 3, the impact
of financial literacy is however more muted than that of the disclosure format.
Individuals also seem price sensitive when evaluating savings products (columns
4 to 6). In Peru, using the simplified KFS helps, but not in Mexico. Online Appendix
OA4 shows an example of the simplified KFS used in Peru (E) and in Mexico (H). While
the format in Peru includes the total yield earned in a month with two usage profiles, the
format in Mexico does not contain this information. This is perhaps the reason why the
simplified KFS is effective in Peru but not in Mexico. As a result, in the pooled
regression only financial literacy matters.
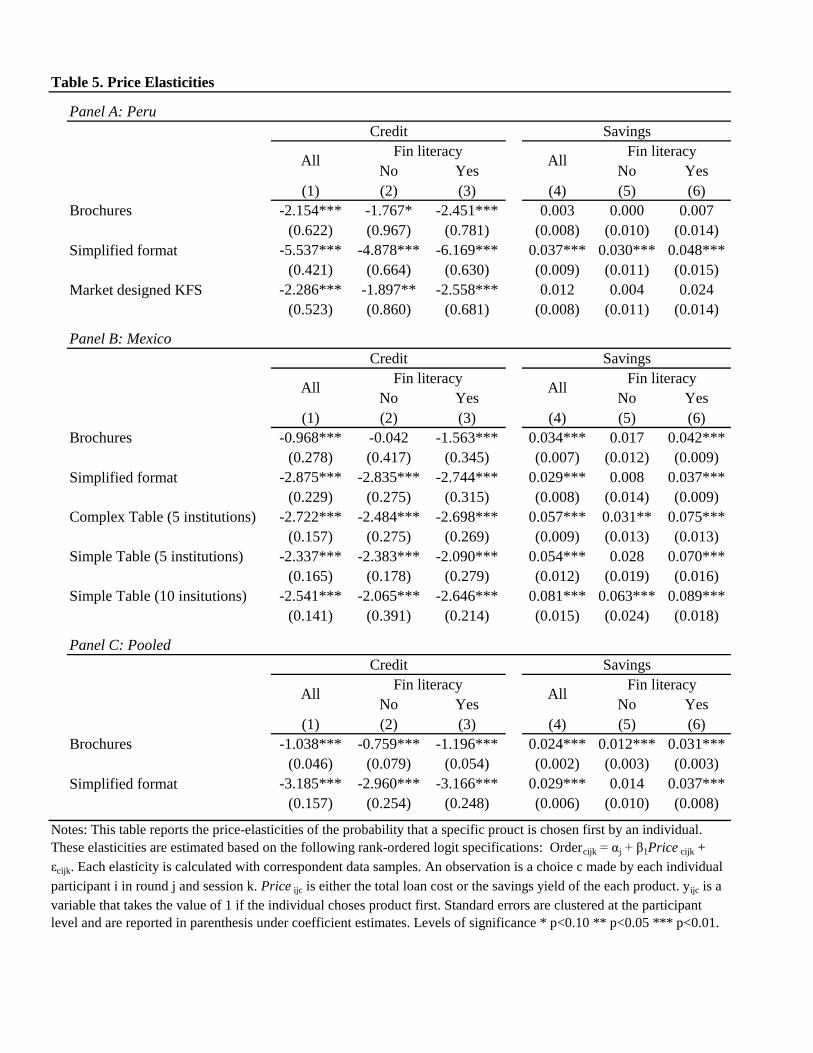
Table 5 computes the price-elasticity from the estimates of Table 4. In practice,
we use data from one disclosure treatment and run a simple rank-ordered logit without
interactions.11 Columns 1 and 4 use the sample of all respondents. In columns 2 and 5,
the sample is restricted to individuals that are not financially literate, that is, individuals
that did not answer the question on interest rate correctly (𝐹𝑖𝑛𝐿𝑖𝑡𝑖𝑘 = 0), while in
columns 3 and 5 only individuals who correctly answered that question are included
(𝐹𝑖𝑛𝐿𝑖𝑡𝑖𝑘 = 1).
Panel A of Table 5 contains data from Peru, Panel B from Mexico and Panel C
pools data from both Peru and Mexico. The price-elasticities reflect the results discussed
in Table 4. For example, according to the elasticities reported in column 1 of Panel C,
when individuals compare credit products using brochures, an increase of 1 percent in the
cost of the loan leads to a decline in the probability of that loan being chosen first of 1
percent (p-value is 0). In contrast, when individuals use the simplified KFS the decline in
11 In particular, we run the following specification: 𝑂𝑟𝑑𝑒𝑟𝑐𝑖𝑗𝑘 = 𝛼𝑗 + 𝑃𝑟𝑖𝑐𝑒𝑐𝑖𝑗𝑘 + 𝜀𝑐𝑖𝑗𝑘. See Online
Appendix 5 for details on how the elasticities were calculated.

19
the probability is roughly three times as large at 3.2 percent. When comparing columns 2
and 3, financial literacy leads, as previously discussed, to higher elasticities in magnitude.
When individuals use brochures to compare credit products, the probability that a loan
will be chosen first when its costs increases by 1 percent declines by 0.8 percent for a
financially illiterate individual to 1.2 percent for a financially literate one. Similarly,
when individuals use a simplified KFS the probability declines by 3 and by 3.2 percent,
respectively for a financially illiterate and literate individual. Also notably, the simplified
KFS is able to correct differences in financial literacy by not only increasing the
magnitude of everyone’s price elasticity but also by making the difference in price
elasticity between financially literate and illiterate individuals smaller, in percentage
terms. Related, Online Appendix Table OA2 reports individual perceptions about the
different formats and their knowledge of the interest rate for the chosen product. As
shown in column 3, financially illiterate individuals are 17 percent more likely to
perceive the simplified KFS as being clear compared to the marketing brochures.
Similarly, in column 6 these individuals are 13.2 percent more likely to correctly state the
interest rate of the loan chosen.
For savings products, the results are far more muted in magnitude and statistical
significance. In column 1 of Table 5, an increase in the yield of a savings account by 1
percent increases the probability of choosing that product first by 0.02 percent when
individuals use brochures to compare across savings products. When individuals use
simplified KFS, the probability of choosing the account first increases by 0.03 and the
difference in elasticities is not statistically significant. Columns 9 and 12 of Online
Appendix Table OA2 show neither differences in clarity nor correct recall of interest
rates between formats. Why are the results for savings so muted? There are a couple of
reasons. First, unlike Peru, the simplified KFS in Mexico did not contain the net yield
from the account to be earned in a year. Thus, while the simplified KFS in Peru is the
only disclosure format with a positive and significant elasticity, in Mexico the simplified
KFS is not at all effective. In fact, the price elasticity is lower than that of the brochures
and is not significant for financially illiterate individuals. Second, when choosing a
savings product, the net yield from the account may not be as relevant as other factors
20
such as convenience, speed, familiarity and trust of the institution offering the product,
etc.
In the context of our lab experiment we cannot explore convenience and speed of
service, but we can study other non-price factors such as the order in which products are
presented or appear in a comparative table in Mexico, and whether familiarity with the
institution offering the product, defined as a dummy that takes value 1 if the individual
has ever contracted a product from that institution. In the context of elections, Ho and
Imai (2008) use the naturally occurring variation in ballot order and find that being listed
first on the ballot increases the likelihood of being voted especially in primary elections.
Similarly, Luca and Smith (2013) study a change in the way universities were ranked in
the U.S. News and World Report and find that the ranking matters.
Columns 1 and 4 of Table 6 show that individuals using the market-designed KFS
in Peru are more likely to choose products that are presented among the first three of the
five or that come from institutions that are familiar to the individual. When using the
simplified KFS, individuals are less influenced by these factors. Thus, in Peru
transparency increases price elasticity while familiarity and the order in which products
are presented matter less. In Mexico, neither the order nor familiarity affects the
probability of choosing a credit or savings product in columns 2 and 5. As a result, the
pooled regression reflect, to some extent, the results in Peru. Individuals are more likely
to choose products presented first when using brochures than when using the simplified
KFS.
5. Conclusion
This study conducts a laboratory experiment to test the effectiveness of behavioral-
based financial disclosure by focusing on how comparability and the standardization of
formats can improve financial decision-making for low-to-middle income consumers in
Peru and Mexico.
We find that a standardized key facts statement significantly improves the ability of
consumers to make financial decisions and suggests that regulators should not only
21
mandate certain key terms but also the format in which these terms are presented to
encourage comparison shopping and improve financial wellbeing. It is encouraging that,
in recent years, some regulators have begun mandating standardized formats.12
Interestingly, the standardized format tested increased the probability that individuals
choose the best credit product by a factor of three, relative to the increase in probability
between financially literate and illiterate individuals. More importantly, the standardized
format seems to “democratize” financial decision-making as it is particularly effective for
individuals that are financially illiterate. The effects are however concentrated in credit
products rather than savings. The lack of impact in savings is concentrated in Mexico,
where the simplified format failed to disclose the total yield of the savings account in
pesos, which may indicate that total yield calculations can be a useful requirement for
disclosure rules to improve consumers’ ability to understand the cost or return of the
savings account.
The laboratory setting approach taken also suggests an effective mechanism to test
the design of financial disclosure initiatives. This approach is not new. For example, the
Consumer Financial Protection Bureau and the Federal Reserve of the U.S. constantly
survey and test financial consumers on how they understand information, which
information they think is useful, and finally how the information can be more effectively
conveyed (Kroszner, 2007). Interestingly, Online Appendix Table AO3 shows that
among individuals who showed up for a session in Mexico, those that participated in the
laboratory experiment (compared to those that were randomly turned away due to lack of
space) were more likely to report contracting the session’s financial product in the
following 6 months. Owning a business and being a male were also positively correlated
with the self-reported likelihood of contracting the financial product.
In addition, regulators in Mexico and elsewhere are requiring lenders to send detailed
product information in a machine-readable format so they can be downloaded by startups
like ComparaBien, ComparaGuru, and rocket.la which provide timely comparative
12 For an emerging market example of such mandatory formats, see Bank of Ghana mandatory disclosure
format for loan products: https://www.bog.gov.gh/supervision-a-regulation/consumer-information/pre-
agreement-truth-in-lending-disclosure-statement
22
information to individuals looking for financial products. These channels also have the
advantage of being fully digital, removing the time and travel burdens to shopping
around, and making it easier to review and compare competing key facts statements on
the same screen at the same time. In the U.S., a similar initiative called “Smart
Disclosure” was undertaken by the Obama Administration (Sunstein, 2013) to provide
sharable information so that intermediaries could help consumers make, for example,
better informed decisions about energy and health care.
A final important consideration for the effectiveness of KFS is the timing of the
provision of information. The KFS is most useful early on during the sales visit, so that
consumers can quickly receive competing offers and compare across products. However,
sales staff may be incentivized to only disclose the KFS late, after the product has been
contracted. This practice will undermine the effectiveness of disclosure and the
consumer’s propensity to shop around. Policy makers should therefore take care to
develop rules regarding the timing of disclosures and monitor compliance with timely
disclosure of KFS through mystery shopping (see Giné and Mazer, 2017) and other
market monitoring tools.
23
References
Adams, P., S. Hunt, C. Palmer and R. Zaliauskas. 2016. “Attention, Search and
Switching: Evidence on Mandated Disclosure from the Savings Market”. FCA
Occasional Paper 19.
Agarwal, S., J. Driscoll, X. Gabaix and D. Laibson. 2013. “Learning in the Credit Card
Market.” Mimeo. Available at http://dx.doi.org/10.2139/ssrn.1091623.
Agarwal, S., S. Chomsisengphet, N. Mahoney and J. Stroebel. 2015. “Regulating
Consumer Financial Products: Evidence from Credit Cards.” The Quarterly Journal of
Economics 130(1): 111-164.
Anagol, S. and H. H. Kim. 2012. "The Impact of Shrouded Fees: Evidence from a
Natural Experiment in the Indian Mutual Funds Market." American Economic Review
102(1): 576-93.
Bhargava, S. and D. Manoli. 2015. “Psychological Frictions and the Incomplete Take-Up
of Social Benefits: Evidence from an IRS Field Experiment.” American Economic
Review 105(11): 3489-3529”
Bertrand, M., D. Karlan, S. Mullainathan, E. Shafir and J. Zinman. 2010. “What's
Advertising Content Worth? Evidence from a Consumer Credit Marketing Field
Experiment.” The Quarterly Journal of Economics 125(1): 263–306.
Bertrand, M. and A. Morse. 2011. “Information disclosure, cognitive biases, and payday
borrowing.” The Journal of Finance 66(6), 1865-1893.
Ben-Shahar, O. and C. E. Schneider. 2011. "The Failure of Mandated Discourse."
University of Pennsylvania Law Review 159: 647-749.
Beshears J., J. J. Choi, D. Laibson and B. C. Madrian. 2013. “Simplification and saving.”
Journal of Economic Behavior & Organization 95:130–45
Bettinger E. P., B. T. Long, P. Oreopoulos and L. Sanbonmatsu. 2012. “The role of
application assistance and information in college decisions: results from the H&R Block
FAFSA experiment.” The Quarterly Journal of Economics 127(3): 1–38.
Bruhn, M., G. L. Ibarra and D. McKenzie. 2014. “The minimal impact of a large-scale
financial education program in Mexico City.” Journal of Development Economics 108:
184-189,
24
Campbell, J. Y., H. E. Jackson, B. C. Madrian, and P. Tufano. 2011. “Consumer
Financial Protection.” The Journal of Economic Perspectives 25(1), 91-114.
Choi J, D. Laibson and B. C. Madrian. 2010. “Why does the law of one price fail? An
experiment on index mutual funds.” The Review of Financial Studies 23(4) :1405–32.
Choi J, D. Laibson and B. C. Madrian. 2011. “$100 bills on the sidewalk: suboptimal
investment in 401(k) plans.” Review of Economics and Statistics 93(3): 748-763.
Cole, S. A., and G. K. Shastry. 2010. "Is High School the Right Time to Teach Self-
control? The Effect of Financial Education and Mathematics Courses on Savings
Behavior." Mimeo.
Cole, S. A., T. Sampson, and B. Zia. 2011. “Prices or Knowledge? What Drives Demand
for Financial Services in Emerging Markets?” Journal of Finance 66(6): 1933–1967.
DellaVigna, S. 2007. “Psychology and Economics: Evidence from the Field.” Journal of
Economic Literature 47(2): 315-72.
Dranove, D. and G. Z. Jin. 2010. “Quality Disclosure and Certification: Theory and
Practice.” Journal of Economic Literature 48(4): 935-63.
Duarte F. and Hastings J. S. 2012. “Fettered consumers and sophisticated firms: evidence
from Mexico’s privatized social security market.” NBER Working Paper 18582.
Fernandes, D., J. G. Lynch Jr and R. G. Netemeyer. 2014. “Financial literacy, financial
education, and downstream financial behaviors.” Management Science 60(8): 1861-1883.
Giné, X. and R. Mazer. 2017. “Financial (Dis-)Information: Evidence from a Multi-
Country Audit Study.” Policy Research Working Paper 6902, The World Bank.
Gigerenzer, G. and A. Edwards. 2003. “Simple tools for understanding risks: from
innumeracy to insight.” BMJ: British Medical Journal 327: 741-744.
Gross, D.B. and N.S. Souleles. 2002. “Do liquidity constraints and interest rates matter
for consumer behavior? Evidence from credit card data.” Quarterly Journal of Economics
117(1): 149-185.
Hastings, J. S. and L. Tejeda-Ashton. 2008. “Financial literacy, information, and demand
elasticity: survey and experimental evidence from Mexico.” NBER Working Paper
14538.
Hastings, J. S., B. C. Madrian and W. L. Skimmyhorn. 2013. “Financial Literacy,
Financial Education and Economic Outcomes.” Annual Review of Economics 5(1): 347-
373.
25
Hortaçsu, A. and C. Syverson. 2004. “Product Differentiation, Search Costs, and
Competition in the Mutual Fund Industry: A Case Study of S&P 500 Index Funds.” The
Quarterly Journal of Economics 119(2): 403-456.
Iyengar, S. and M. Lepper. 2000. “When Choice is Demotivating: Can One Desire Too
Much of a Good Thing?” Journal of Personality and Social Psychology 79(6): 995-1006.
Karlan, D., M. Morten and J. Zinman. 2016. “A Personal Touch in Text Messaging Can
Improve Loan Repayment.” Behavioral Science and Policy, 1(2): 25-31.
Krozner, R. 2007. Creating More Effective Consumer Disclosures. At the George
Washington University School of Business, Financial Services Research Program Policy
Forum, Washington, D.C.
Loewenstein, G., C. Sunstein and R. Golman. 2014. “Disclosure: Psychology Changes
Everything”. Annual Review of Economics 6: 391-419.
Luca, M. and J. Smith. 2013. “Salience in quality disclosure: evidence from the U.S.
News college rankings.” Journal of Economics and Management Strategy 22(1): 58–77.
Lusardi, A. and O. Mitchell. 2011. “Financial literacy and planning: implications for
retirement wellbeing.” in A. Lusardi and O. Mitchell (eds), “Financial Literacy.
Implications for Retirement Security and the Financial Marketplace,” Oxford University
Press, 2011, pp. 17-39.
Lusardi, A. and O. Mitchell. 2014. “The Economic Importance of Financial Literacy:
Theory and Evidence.” Journal of Economic Literature 52(1): 5–44.
Newell R. G., A. B. Jaffe and R. N. Stavins. 1999. “The induced innovation hypothesis
and energy-saving technological change.” Quarterly Journal of Economics 114(3): 941–
75.
Ponce, A., E. Seira and G. Zamarripa. 2017. "Borrowing on the Wrong Credit Card?
Evidence from Mexico." American Economic Review, 107(4): 1335-61.
Schwartz, B. 2004. The Paradox of Choice. New York: Harper Collins.
Shu, S. B. and C. Townsend. 2010. “When and How Aesthetics Influences Financial
Decisions.” Journal of Consumer Psychology 20(3): 452-458.
Stango, V. and J. Zinman. 2016. “Borrowing High vs. Borrowing Higher: Price
Dispersion and Shopping Behavior in the U.S. Credit Card Market.” Review of Financial
Studies 29(4): 979-1006.
26
Sunstein, C. R. 1999. “Informational regulation and informational standing: Akins and
beyond.” University of Pennsylvania Law Review. 147(3): 613–75.
Sunstein, C. R. 2013. Simpler: The future of government. Simon and Schuster.
Toffler, A. 1970. Future shock. New York, NY: Random House
Weil, D., Fung, A., Graham, M., and Fagotto, E. 2006. “The effectiveness of regulatory
disclosure policies.” Journal of Policy Analysis and Management 25(1):155-181.
Woodward, S. E. and R. E. Hall. 2012. “Diagnosing Consumer Confusion and Sub-
optimal Shopping Effort: Theory and Mortgage-Market Evidence.” American Economic
Review 102(7): 3249-76.
Zinman, J. 2015. “Household Debt: Facts, Puzzles, Theories, and Policies.” Annual
Review of Economics 7: 251-276.
Credit Savings Total Credit Savings Total
Number of Sessions 10 10 20 20 17 37
Number of Decisions 900 900 900 1,912 2,372 4,284
Number of participants 300 300 600 479 594 1,073
Number of participants that received a SMS - - - 74 164 238
Number of participants that received a call - - - 92 133 225
Number of participants that received neither a call nor an SMS - - - 312 296 608
Number of participants that received a glossary - - - 221 328 549
Table 1. Details of Laboratory Experiment
Peru Mexico
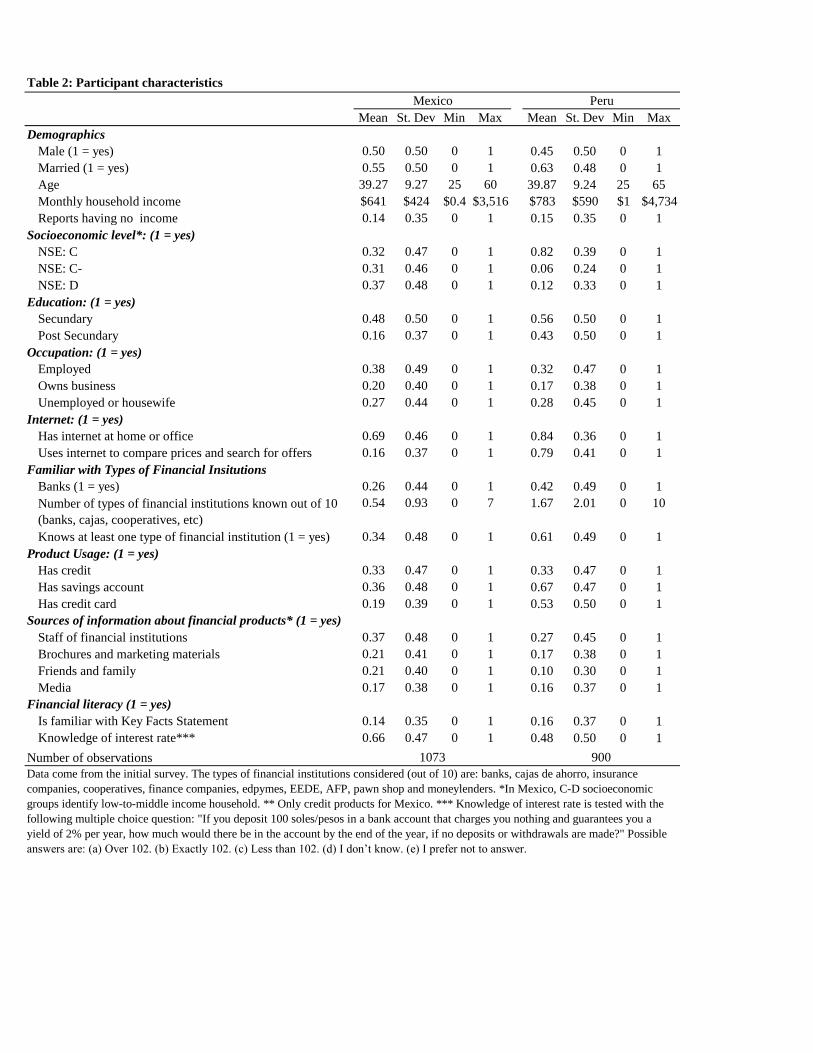
Table 2: Participant characteristics
Mean St. Dev Min Max Mean St. Dev Min Max
Demographics
Male (1 = yes) 0.50 0.50 0 1 0.45 0.50 0 1
Married (1 = yes) 0.55 0.50 0 1 0.63 0.48 0 1
Age 39.27 9.27 25 60 39.87 9.24 25 65
Monthly household income $641 $424 $0.4 $3,516 $783 $590 $1 $4,734
Reports having no income 0.14 0.35 0 1 0.15 0.35 0 1
Socioeconomic level*: (1 = yes)
NSE: C 0.32 0.47 0 1 0.82 0.39 0 1
NSE: C- 0.31 0.46 0 1 0.06 0.24 0 1
NSE: D 0.37 0.48 0 1 0.12 0.33 0 1
Education: (1 = yes)
Secundary 0.48 0.50 0 1 0.56 0.50 0 1
Post Secundary 0.16 0.37 0 1 0.43 0.50 0 1
Occupation: (1 = yes)
Employed 0.38 0.49 0 1 0.32 0.47 0 1
Owns business 0.20 0.40 0 1 0.17 0.38 0 1
Unemployed or housewife 0.27 0.44 0 1 0.28 0.45 0 1
Internet: (1 = yes)
Has internet at home or office 0.69 0.46 0 1 0.84 0.36 0 1
Uses internet to compare prices and search for offers 0.16 0.37 0 1 0.79 0.41 0 1
Familiar with Types of Financial Insitutions
Banks (1 = yes) 0.26 0.44 0 1 0.42 0.49 0 1
Number of types of financial institutions known out of 10
(banks, cajas, cooperatives, etc)
0.54 0.93 0 7 1.67 2.01 0 10
Knows at least one type of financial institution (1 = yes) 0.34 0.48 0 1 0.61 0.49 0 1
Product Usage: (1 = yes)
Has credit 0.33 0.47 0 1 0.33 0.47 0 1
Has savings account 0.36 0.48 0 1 0.67 0.47 0 1
Has credit card 0.19 0.39 0 1 0.53 0.50 0 1
Sources of information about financial products* (1 = yes)
Staff of financial institutions 0.37 0.48 0 1 0.27 0.45 0 1
Brochures and marketing materials 0.21 0.41 0 1 0.17 0.38 0 1
Friends and family 0.21 0.40 0 1 0.10 0.30 0 1
Media 0.17 0.38 0 1 0.16 0.37 0 1
Financial literacy (1 = yes)
Is familiar with Key Facts Statement 0.14 0.35 0 1 0.16 0.37 0 1
Knowledge of interest rate*** 0.66 0.47 0 1 0.48 0.50 0 1
Number of observations
Mexico Peru
Data come from the initial survey. The types of financial institutions considered (out of 10) are: banks, cajas de ahorro, insurance
companies, cooperatives, finance companies, edpymes, EEDE, AFP, pawn shop and moneylenders. *In Mexico, C-D socioeconomic
groups identify low-to-middle income household. ** Only credit products for Mexico. *** Knowledge of interest rate is tested with the
following multiple choice question: "If you deposit 100 soles/pesos in a bank account that charges you nothing and guarantees you a
yield of 2% per year, how much would there be in the account by the end of the year, if no deposits or withdrawals are made?" Possible
answers are: (a) Over 102. (b) Exactly 102. (c) Less than 102. (d) I don’t know. (e) I prefer not to answer.
1073 900
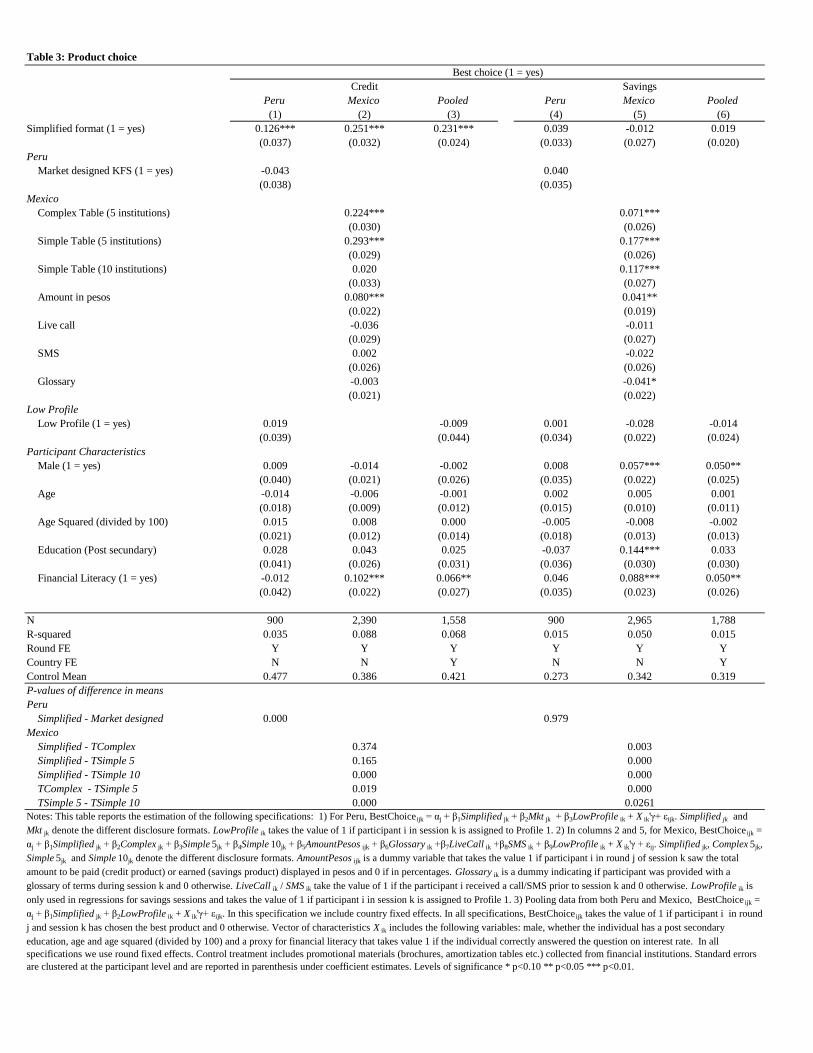
Table 3: Product choice
Peru Mexico Pooled Peru Mexico Pooled
(1) (2) (3) (4) (5) (6)
Simplified format (1 = yes) 0.126*** 0.251*** 0.231*** 0.039 -0.012 0.019
(0.037) (0.032) (0.024) (0.033) (0.027) (0.020)
Peru
Market designed KFS (1 = yes) -0.043 0.040
(0.038) (0.035)
Mexico
Complex Table (5 institutions) 0.224*** 0.071***
(0.030) (0.026)
Simple Table (5 institutions) 0.293*** 0.177***
(0.029) (0.026)
Simple Table (10 institutions) 0.020 0.117***
(0.033) (0.027)
Amount in pesos 0.080*** 0.041**
(0.022) (0.019)
Live call -0.036 -0.011
(0.029) (0.027)
SMS 0.002 -0.022
(0.026) (0.026)
Glossary -0.003 -0.041*
(0.021) (0.022)
Low Profile
Low Profile (1 = yes) 0.019 -0.009 0.001 -0.028 -0.014
(0.039) (0.044) (0.034) (0.022) (0.024)
Participant Characteristics
Male (1 = yes) 0.009 -0.014 -0.002 0.008 0.057*** 0.050**
(0.040) (0.021) (0.026) (0.035) (0.022) (0.025)
Age -0.014 -0.006 -0.001 0.002 0.005 0.001
(0.018) (0.009) (0.012) (0.015) (0.010) (0.011)
Age Squared (divided by 100) 0.015 0.008 0.000 -0.005 -0.008 -0.002
(0.021) (0.012) (0.014) (0.018) (0.013) (0.013)
Education (Post secundary) 0.028 0.043 0.025 -0.037 0.144*** 0.033
(0.041) (0.026) (0.031) (0.036) (0.030) (0.030)
Financial Literacy (1 = yes) -0.012 0.102*** 0.066** 0.046 0.088*** 0.050**
(0.042) (0.022) (0.027) (0.035) (0.023) (0.026)
N 900 2,390 1,558 900 2,965 1,788
R-squared 0.035 0.088 0.068 0.015 0.050 0.015
Round FE Y Y Y Y Y Y
Country FE N N Y N N Y
Control Mean 0.477 0.386 0.421 0.273 0.342 0.319
P-values of difference in means
Peru
Simplified - Market designed 0.000 0.979
Mexico
Simplified - TComplex 0.374 0.003
Simplified - TSimple 5 0.165 0.000
Simplified - TSimple 10 0.000 0.000
TComplex - TSimple 5 0.019 0.000
TSimple 5 - TSimple 10 0.000 0.0261
Best choice (1 = yes)
Notes: This table reports the estimation of the following specifications: 1) For Peru, BestChoiceijk = αj + β1Simplified jk + β2Mkt jk + β3LowProfile ik + X ik'γ+ εijk. Simplified jk and
Mkt jk denote the different disclosure formats. LowProfile ik takes the value of 1 if participant i in session k is assigned to Profile 1. 2) In columns 2 and 5, for Mexico, BestChoice ijk =
αj + β1Simplified jk + β2Complex jk + β3Simple 5jk + β4Simple 10jk + β5AmountPesos ijk + β6Glossary ik +β7LiveCall ik +β8SMS ik + β9LowProfile ik + X ik'γ + εij. Simplified jk, Complex 5jk,
Simple 5jk and Simple 10jk denote the different disclosure formats. AmountPesos ijk is a dummy variable that takes the value 1 if participant i in round j of session k saw the total
amount to be paid (credit product) or earned (savings product) displayed in pesos and 0 if in percentages. Glossary ik is a dummy indicating if participant was provided with a
glossary of terms during session k and 0 otherwise. LiveCall ik / SMS ik take the value of 1 if the participant i received a call/SMS prior to session k and 0 otherwise. LowProfile ik is
only used in regressions for savings sessions and takes the value of 1 if participant i in session k is assigned to Profile 1. 3) Pooling data from both Peru and Mexico, BestChoice ijk =
αj + β1Simplified jk + β2LowProfile ik + X ik'γ+ εijk. In this specification we include country fixed effects. In all specifications, BestChoiceijk takes the value of 1 if participant i in round
j and session k has chosen the best product and 0 otherwise. Vector of characteristics X ik includes the following variables: male, whether the individual has a post secondary
education, age and age squared (divided by 100) and a proxy for financial literacy that takes value 1 if the individual correctly answered the question on interest rate. In all
specifications we use round fixed effects. Control treatment includes promotional materials (brochures, amortization tables etc.) collected from financial institutions. Standard errors
are clustered at the participant level and are reported in parenthesis under coefficient estimates. Levels of significance * p<0.10 ** p<0.05 *** p<0.01.
Credit Savings
Peru Mexico Pooled Peru Mexico Pooled
(1) (2) (3) (4) (5) (6)
Total yield or cost -0.006*** -0.000 -0.003*** 0.012** 0.008** 0.008**
(0.002) (0.000) (0.000) (0.006) (0.003) (0.003)
Simplified format (1 = yes) 4.379*** 4.787*** 0.131*** 0.055*** -0.014 -0.001
(0.932) (0.543) (0.023) (0.013) (0.013) (0.010)
Simplified x Yield / Cost -0.008*** -0.004*** -0.000*** 0.004*** -0.002 0.001
(0.002) (0.000) (0.000) (0.001) (0.005) (0.001)
Fin lit x Yield /Cost -0.003 -0.002*** -0.003*** 0.014 0.010*** 0.012***
(0.002) (0.000) (0.001) (0.009) (0.004) (0.004)
Simplified x Yield / Cost x Fin Lit 0.000 0.001 -0.000
(0.001) (0.005) (0.002)
Peru
Market designed KFS (1 = yes) 0.183 0.009
(0.896) (0.012)
Market designed KFS x Yield / Cost -0.000 0.001
(0.002) (0.001)
Market designed KFS x Yield / Cost x Fin Lit 0.000 -0.000
(0.000) (0.001)
Mexico
Complex Table (5 institutions) 4.185*** 0.019
(0.516) (0.014)
Simple Table (5 institutions) 4.113*** -0.009
(0.523) (0.012)
Simple Table (10 institutions) 2.811*** -0.016
(0.571) (0.012)
Complex Table (5 institutions) x Yield / Cost -0.004*** 0.004
(0.000) (0.004)
Simple Table (5 institutions) x Yield / Cost -0.004*** 0.001
(0.000) (0.004)
Simple Table (10 institutions) x Yield / Cost -0.003*** 0.009*
(0.001) (0.005)
Complex Table (5 institutions) x Yield / Cost x Fin Lit -0.000 0.005
(0.000) (0.005)
Simple Table (5 institutions) x Yield / Cost x Fin Lit -0.000 0.005
(0.000) (0.005)
Simple Table (10 institutions) x Yield / Cost x Fin Lit -0.000*** -0.000
(0.000) (0.006)
N 2,700 7,169 4,668 2,700 8,895 5,358
Number of individuals 300 478 778 300 593 893
Notes: This table reports the following rank-ordered logit specification: 1) For Peru, Ordercijk = αj + β1Price cijk + β2Simplified jk +
β3Simplified jk*Price cijk + β4Price cijk*FinLit ik + β5Simplified jk*Price cijk*FinLit ik + β6Mkt jk + β7Mkt jk*Price cijk + β8Mkt jk*Price cijk*FinLit ik + εcijk,.
Simplified jk, and Mkt ij denote the Simplified KFS and the Market designed KFS. 2) For Mexico, Ordercijk = αj + β1Price cijk + β2Simplified jk +
β3Simplified jk*Price cijk + β4Price cijk*FinLit ik + β5Simplified jk*Price cijk*FinLit ik + β6Complex5 jk + β7Simple5 jk + β8Simple10 jk +
β9Complex5 jk*Price cijk + β10Simple5 jk*Price cijk + β11Simple10 jk*Price cijk + β12Complex jk*Price cijk*FinLit ik + β13Simple5 jk*Price cijk*FinLit jk +
β14Simple10 jk*Price cijk + εcijk. Simplified jk, Complex jk, Simple5 jk and Simple10 jk denote the different main treatments. 3) Pooling data from both
Peru and Mexico, Ordercijk = αj + β1Price cijk + β2Simplified jk + β3Simplified jk*Price cijk + β4Price cijk*FinLit ik + β5Simplified jk*Price cijk*FinLit ik +
εcijk. An observation is a choice c made by each individual participant i in round j and session k. In all specifications, Price cijk is either the total loan
cost or the savings yield of the each product. Ordercijk takes value 3 for the first choice of individual i in round j in session k, 2 for the second choice
and 1 for the third choice. FinLit ik is a proxy for financial literacy that takes value 1 if the individual correctly answered the question on interest rate.
Control treatment includes promotional materials (brochures, amortization tables etc.) collected from financial institutions. Standard errors are
clustered at the participant level and are reported in parenthesis under coefficient estimates. Levels of significance * p<0.10 ** p<0.05 *** p<0.01.
Table 4. Product choice based on price (rank-ordered logit)
Credit Savings
No Yes No Yes
(1) (2) (3) (4) (5) (6)
Brochures -2.154*** -1.767* -2.451*** 0.003 0.000 0.007
(0.622) (0.967) (0.781) (0.008) (0.010) (0.014)
Simplified format -5.537*** -4.878*** -6.169*** 0.037*** 0.030*** 0.048***
(0.421) (0.664) (0.630) (0.009) (0.011) (0.015)
Market designed KFS -2.286*** -1.897** -2.558*** 0.012 0.004 0.024
(0.523) (0.860) (0.681) (0.008) (0.011) (0.014)
No Yes No Yes
(1) (2) (3) (4) (5) (6)
Brochures -0.968*** -0.042 -1.563*** 0.034*** 0.017 0.042***
(0.278) (0.417) (0.345) (0.007) (0.012) (0.009)
Simplified format -2.875*** -2.835*** -2.744*** 0.029*** 0.008 0.037***
(0.229) (0.275) (0.315) (0.008) (0.014) (0.009)
Complex Table (5 institutions) -2.722*** -2.484*** -2.698*** 0.057*** 0.031** 0.075***
(0.157) (0.275) (0.269) (0.009) (0.013) (0.013)
Simple Table (5 institutions) -2.337*** -2.383*** -2.090*** 0.054*** 0.028 0.070***
(0.165) (0.178) (0.279) (0.012) (0.019) (0.016)
Simple Table (10 insitutions) -2.541*** -2.065*** -2.646*** 0.081*** 0.063*** 0.089***
(0.141) (0.391) (0.214) (0.015) (0.024) (0.018)
No Yes No Yes
(1) (2) (3) (4) (5) (6)
Brochures -1.038*** -0.759*** -1.196*** 0.024*** 0.012*** 0.031***
(0.046) (0.079) (0.054) (0.002) (0.003) (0.003)
Simplified format -3.185*** -2.960*** -3.166*** 0.029*** 0.014 0.037***
(0.157) (0.254) (0.248) (0.006) (0.010) (0.008)
Table 5. Price Elasticities
Fin literacy
Panel A: Peru
Panel B: Mexico
Notes: This table reports the price-elasticities of the probability that a specific prouct is chosen first by an individual.
These elasticities are estimated based on the following rank-ordered logit specifications: Ordercijk = αj + β1Price cijk +
εcijk. Each elasticity is calculated with correspondent data samples. An observation is a choice c made by each individual
participant i in round j and session k. Price ijc is either the total loan cost or the savings yield of the each product. yijc is a
variable that takes the value of 1 if the individual choses product first. Standard errors are clustered at the participant
level and are reported in parenthesis under coefficient estimates. Levels of significance * p<0.10 ** p<0.05 *** p<0.01.
Panel C: Pooled
Credit Savings
All
Credit Savings
Fin literacy Fin literacyAll All
Credit
All All
Savings
Fin literacyAll
Fin literacy
Fin literacy
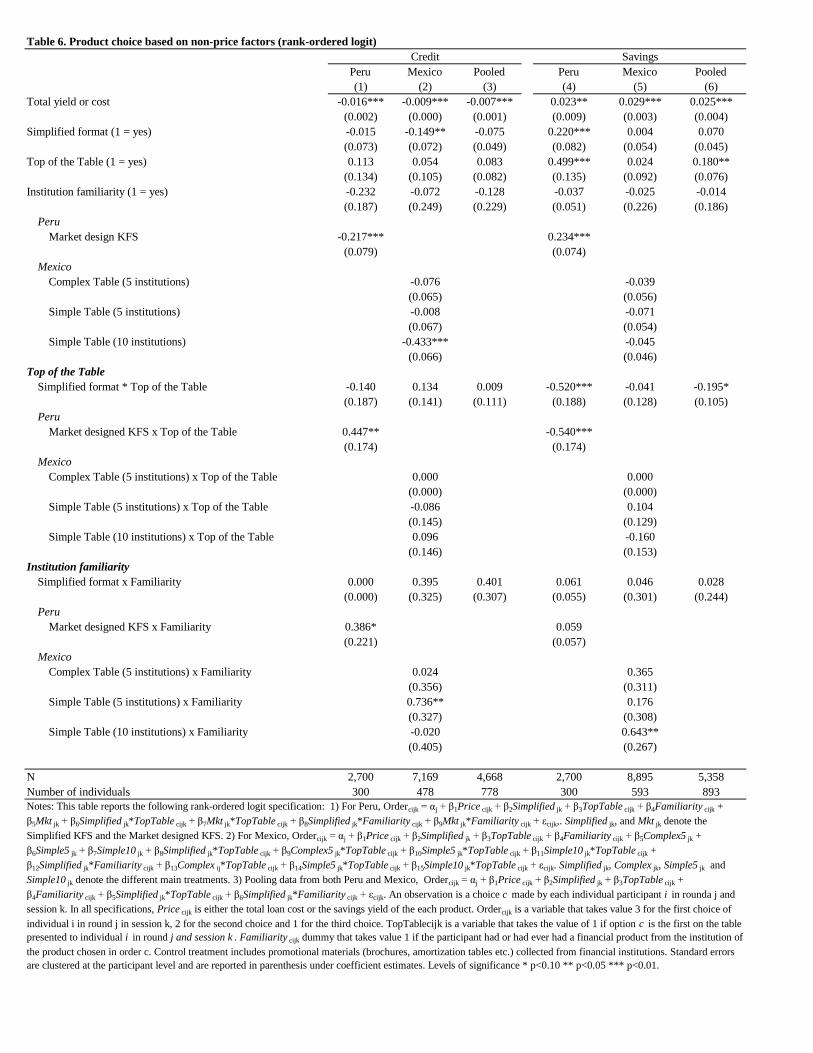
Table 6. Product choice based on non-price factors (rank-ordered logit)
Peru Mexico Pooled Peru Mexico Pooled
(1) (2) (3) (4) (5) (6)
Total yield or cost -0.016*** -0.009*** -0.007*** 0.023** 0.029*** 0.025***
(0.002) (0.000) (0.001) (0.009) (0.003) (0.004)
Simplified format (1 = yes) -0.015 -0.149** -0.075 0.220*** 0.004 0.070
(0.073) (0.072) (0.049) (0.082) (0.054) (0.045)
Top of the Table (1 = yes) 0.113 0.054 0.083 0.499*** 0.024 0.180**
(0.134) (0.105) (0.082) (0.135) (0.092) (0.076)
Institution familiarity (1 = yes) -0.232 -0.072 -0.128 -0.037 -0.025 -0.014
(0.187) (0.249) (0.229) (0.051) (0.226) (0.186)
Peru
Market design KFS -0.217*** 0.234***
(0.079) (0.074)
Mexico
Complex Table (5 institutions) -0.076 -0.039
(0.065) (0.056)
Simple Table (5 institutions) -0.008 -0.071
(0.067) (0.054)
Simple Table (10 institutions) -0.433*** -0.045
(0.066) (0.046)
Top of the Table
Simplified format * Top of the Table -0.140 0.134 0.009 -0.520*** -0.041 -0.195*
(0.187) (0.141) (0.111) (0.188) (0.128) (0.105)
Peru
Market designed KFS x Top of the Table 0.447** -0.540***
(0.174) (0.174)
Mexico
Complex Table (5 institutions) x Top of the Table 0.000 0.000
(0.000) (0.000)
Simple Table (5 institutions) x Top of the Table -0.086 0.104
(0.145) (0.129)
Simple Table (10 institutions) x Top of the Table 0.096 -0.160
(0.146) (0.153)
Institution familiarity
Simplified format x Familiarity 0.000 0.395 0.401 0.061 0.046 0.028
(0.000) (0.325) (0.307) (0.055) (0.301) (0.244)
Peru
Market designed KFS x Familiarity 0.386* 0.059
(0.221) (0.057)
Mexico
Complex Table (5 institutions) x Familiarity 0.024 0.365
(0.356) (0.311)
Simple Table (5 institutions) x Familiarity 0.736** 0.176
(0.327) (0.308)
Simple Table (10 institutions) x Familiarity -0.020 0.643**
(0.405) (0.267)
N 2,700 7,169 4,668 2,700 8,895 5,358
Number of individuals 300 478 778 300 593 893
Credit Savings
Notes: This table reports the following rank-ordered logit specification: 1) For Peru, Ordercijk = αj + β1Price cijk + β2Simplified jk + β3TopTable cijk + β4Familiarity cijk +
β5Mkt jk + β6Simplified jk*TopTable cijk + β7Mkt jk*TopTable cijk + β8Simplified jk*Familiarity cijk + β9Mkt jk*Familiarity cijk + εcijk,. Simplified jk, and Mkt jk denote the
Simplified KFS and the Market designed KFS. 2) For Mexico, Ordercijk = αj + β1Price cijk + β2Simplified jk + β3TopTable cijk + β4Familiarity cijk + β5Complex5 jk +
β6Simple5 jk + β7Simple10 jk + β8Simplified jk*TopTable cijk + β9Complex5 jk*TopTable cijk + β10Simple5 jk*TopTable cijk + β11Simple10 jk*TopTable cijk +
β12Simplified jk*Familiarity cijk + β13Complex ij*TopTable cijk + β14Simple5 jk*TopTable cijk + β15Simple10 jk*TopTable cijk + εcijk. Simplified jk, Complex jk, Simple5 jk and
Simple10 jk denote the different main treatments. 3) Pooling data from both Peru and Mexico, Ordercijk = αj + β1Price cijk + β2Simplified jk + β3TopTable cijk +
β4Familiarity cijk + β5Simplified jk*TopTable cijk + β6Simplified jk*Familiarity cijk + εcijk. An observation is a choice c made by each individual participant i in rounda j and
session k. In all specifications, Price cijk is either the total loan cost or the savings yield of the each product. Ordercijk is a variable that takes value 3 for the first choice of
individual i in round j in session k, 2 for the second choice and 1 for the third choice. TopTablecijk is a variable that takes the value of 1 if option c is the first on the table
presented to individual i in round j and session k . Familiarity cijk dummy that takes value 1 if the participant had or had ever had a financial product from the institution of
the product chosen in order c. Control treatment includes promotional materials (brochures, amortization tables etc.) collected from financial institutions. Standard errors
are clustered at the participant level and are reported in parenthesis under coefficient estimates. Levels of significance * p<0.10 ** p<0.05 *** p<0.01.
Online Appendix for
Information Disclosure and Demand Elasticity of financial products:
Evidence from a Multi-country Study
by Xavier Giné, Cristina Martínez and Rafael Mazer
NOT FOR PRINT PUBLICATION
Contents:
Page 1: OA1. Marketing materials
Page 5: OA2. Scripts for live calls and SMS in Mexico
Page 8: OA3. Glossary given to participants in Mexico
Page 6: OA4. Treatments
Page 23: OA5. Computation of price elasticities
Page 24: OA6. Tables
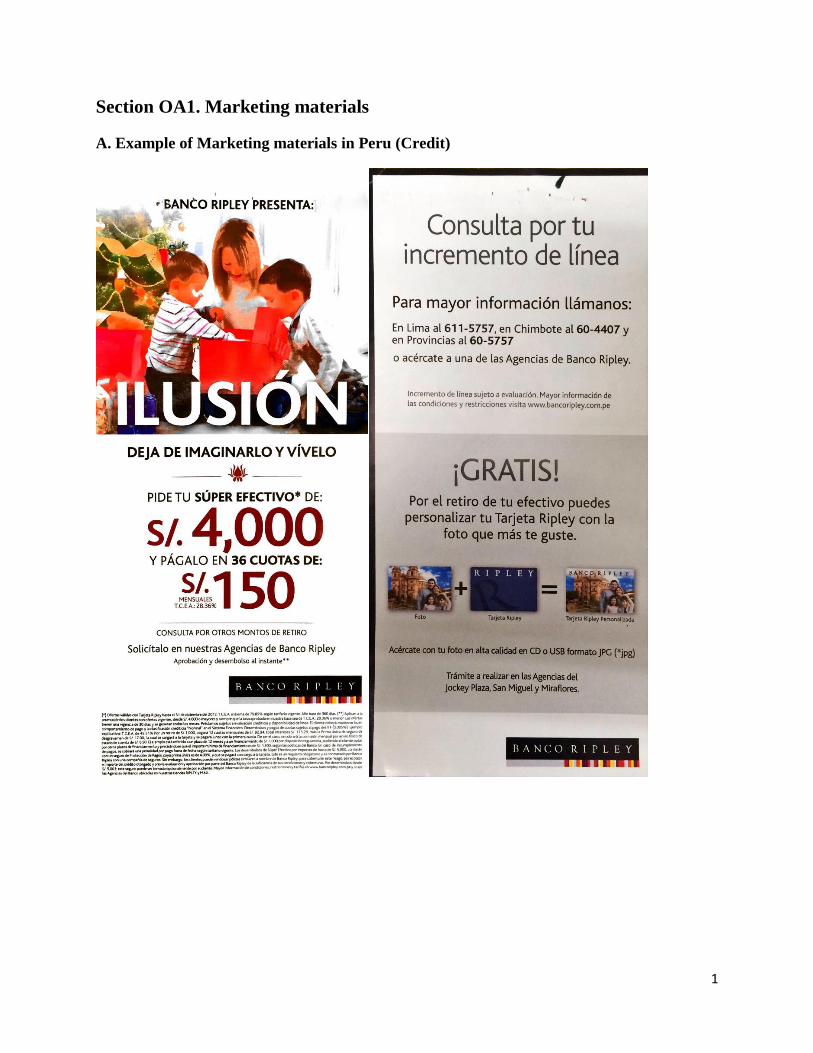
1
Section OA1. Marketing materials
A. Example of Marketing materials in Peru (Credit)
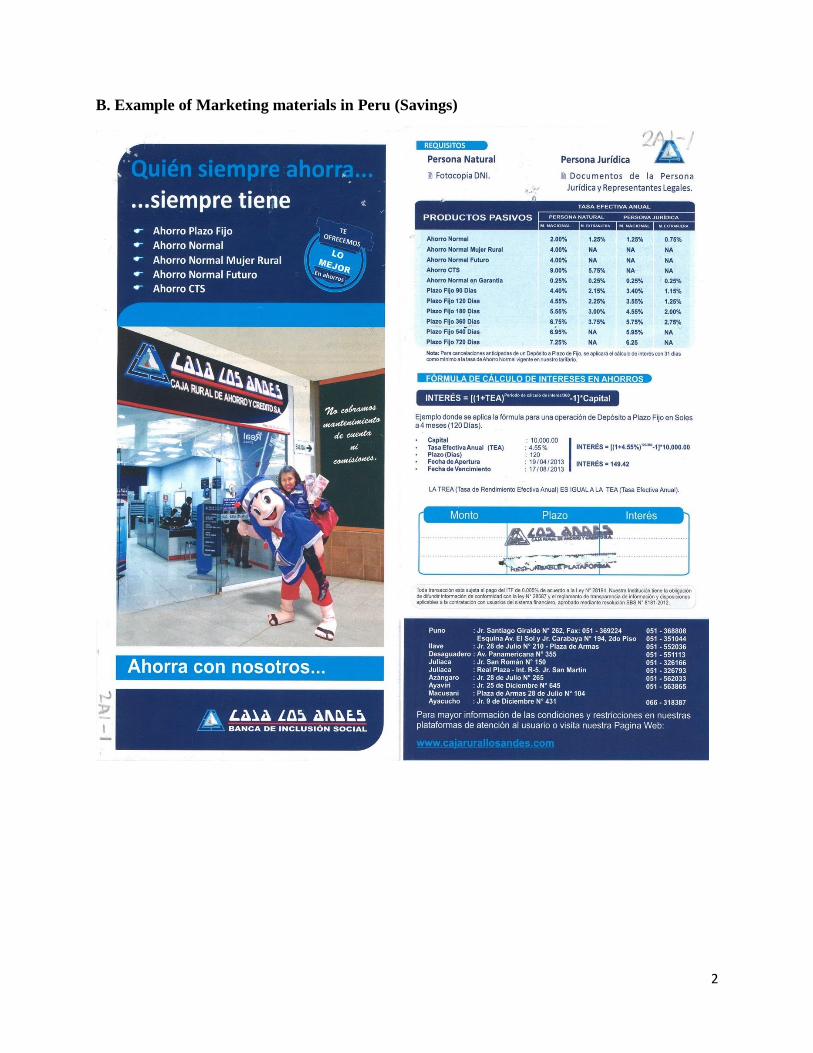
2
B. Example of Marketing materials in Peru (Savings)

3
C. Example of Marketing materials in Mexico (Credit)
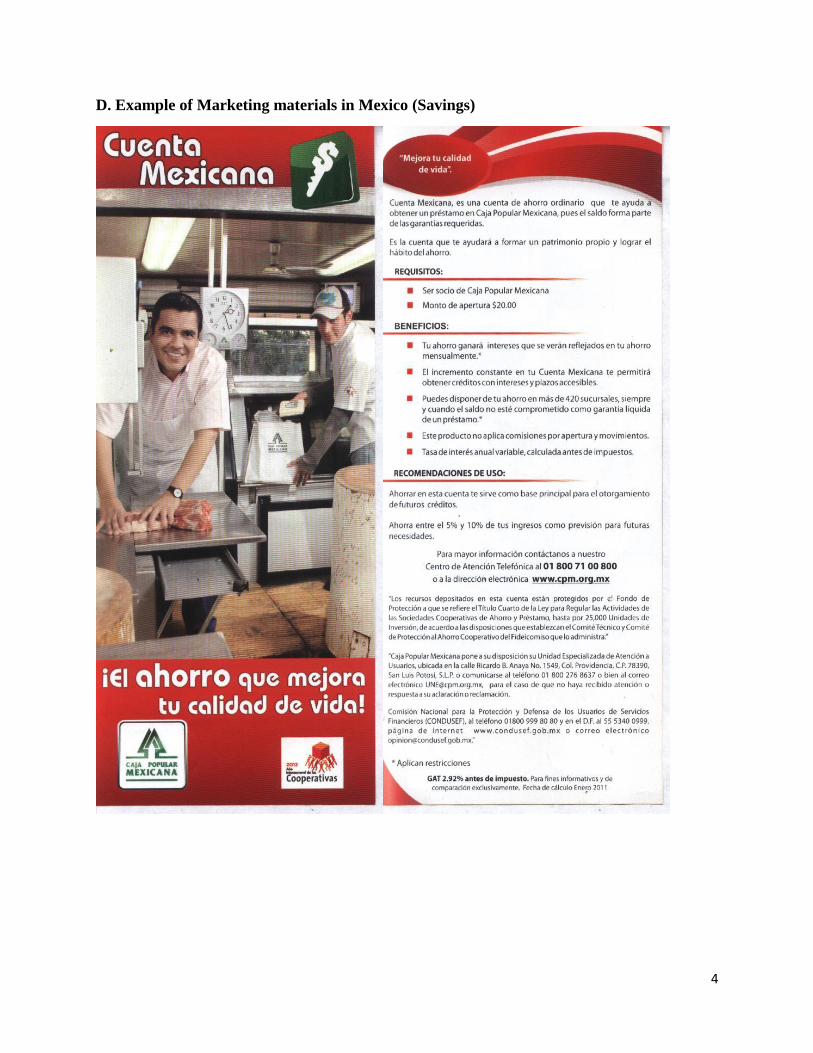
4
D. Example of Marketing materials in Mexico (Savings)
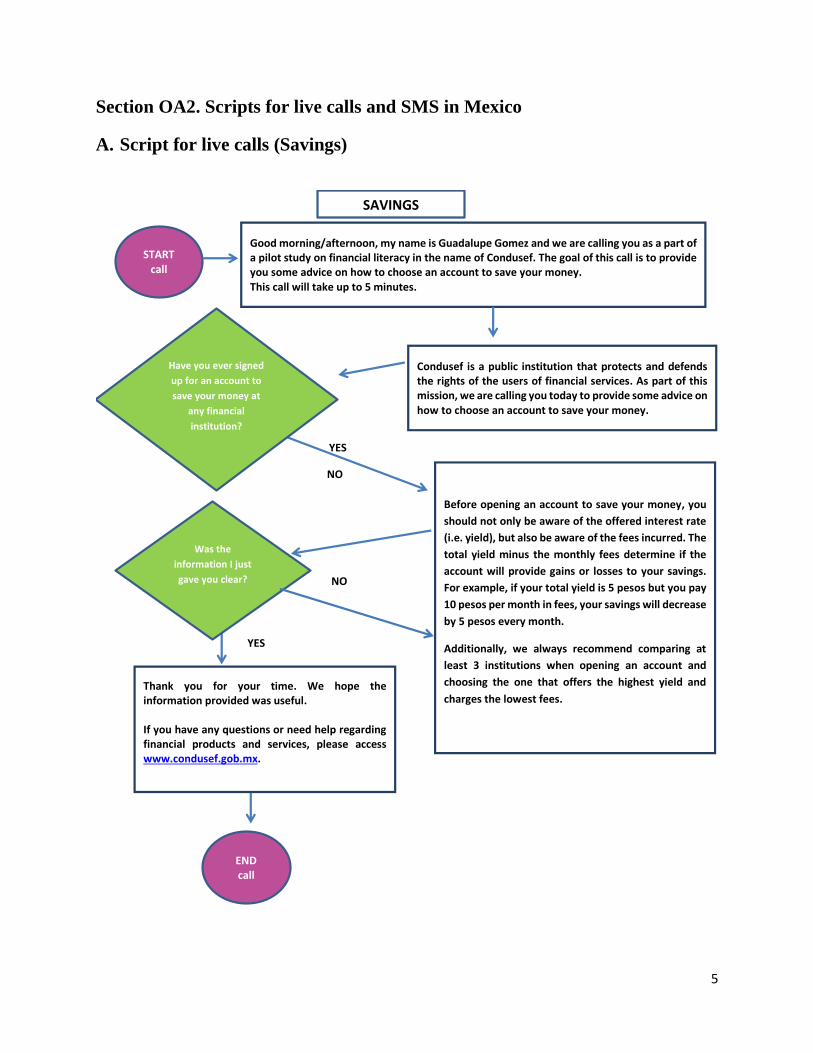
5
Section OA2. Scripts for live calls and SMS in Mexico
A. Script for live calls (Savings)
Good morning/afternoon, my name is Guadalupe Gomez and we are calling you as a part of a pilot study on financial literacy in the name of Condusef. The goal of this call is to provide you some advice on how to choose an account to save your money. This call will take up to 5 minutes.
START call
NO
YES
Condusef is a public institution that protects and defends the rights of the users of financial services. As part of this mission, we are calling you today to provide some advice on how to choose an account to save your money.
Have you ever signed
up for an account to
save your money at
any financial
institution?
Before opening an account to save your money, you
should not only be aware of the offered interest rate
(i.e. yield), but also be aware of the fees incurred. The
total yield minus the monthly fees determine if the
account will provide gains or losses to your savings.
For example, if your total yield is 5 pesos but you pay
10 pesos per month in fees, your savings will decrease
by 5 pesos every month.
Additionally, we always recommend comparing at
least 3 institutions when opening an account and
choosing the one that offers the highest yield and
charges the lowest fees.
SAVINGS
Was the
information I just
gave you clear?
Thank you for your time. We hope the information provided was useful. If you have any questions or need help regarding financial products and services, please access www.condusef.gob.mx.
END call
NO
YES
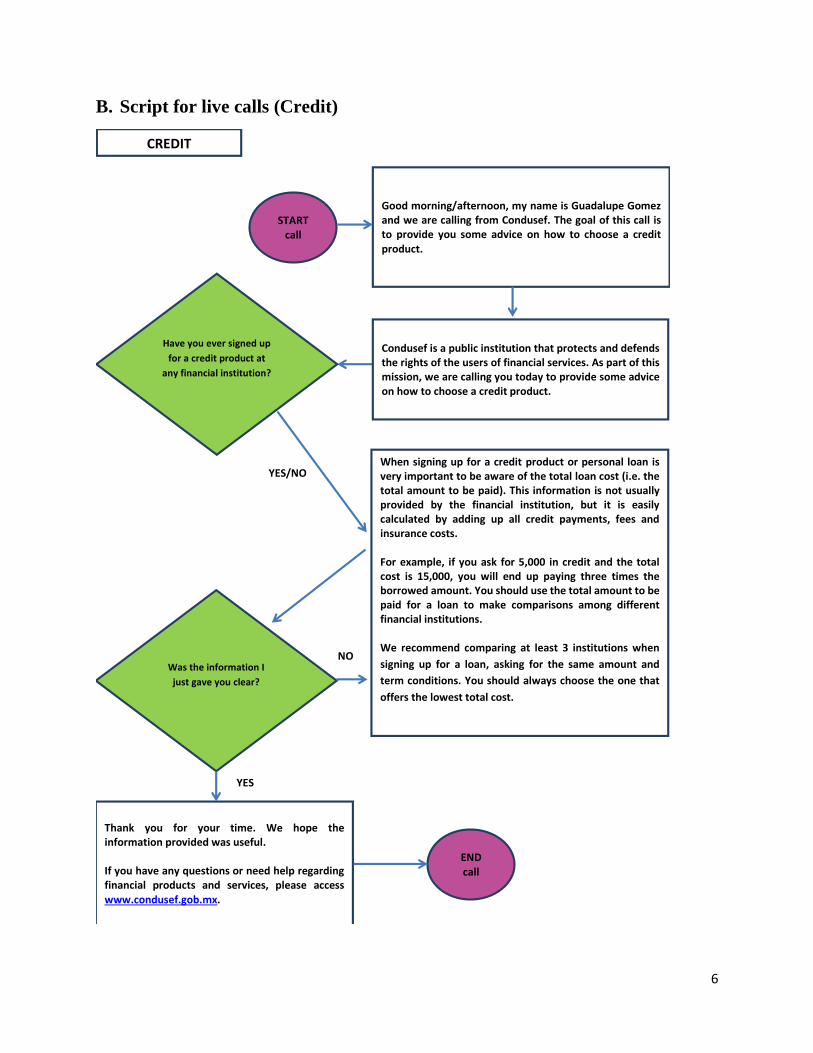
6
B. Script for live calls (Credit)
Good morning/afternoon, my name is Guadalupe Gomez and we are calling from Condusef. The goal of this call is to provide you some advice on how to choose a credit product.
START call
Condusef is a public institution that protects and defends the rights of the users of financial services. As part of this mission, we are calling you today to provide some advice on how to choose a credit product.
Have you ever signed up
for a credit product at
any financial institution?
When signing up for a credit product or personal loan is very important to be aware of the total loan cost (i.e. the total amount to be paid). This information is not usually provided by the financial institution, but it is easily calculated by adding up all credit payments, fees and insurance costs. For example, if you ask for 5,000 in credit and the total cost is 15,000, you will end up paying three times the borrowed amount. You should use the total amount to be paid for a loan to make comparisons among different financial institutions. We recommend comparing at least 3 institutions when
signing up for a loan, asking for the same amount and
term conditions. You should always choose the one that
offers the lowest total cost.
CREDIT
Was the information I
just gave you clear?
Thank you for your time. We hope the information provided was useful. If you have any questions or need help regarding financial products and services, please access www.condusef.gob.mx.
END call
YES/NO
YES
NO

7
C. SMS example (Savings)
“SMS from CONDUSEF: When opening a savings account, choose the one that
gives you the highest interest rate (yield) and charges you the lowest fees.”
D. SMS example (Credit)
“SMS from CONDUSEF: Before signing up for a loan, check the total amount
to be paid, adding up all payments, fees and insurance.”
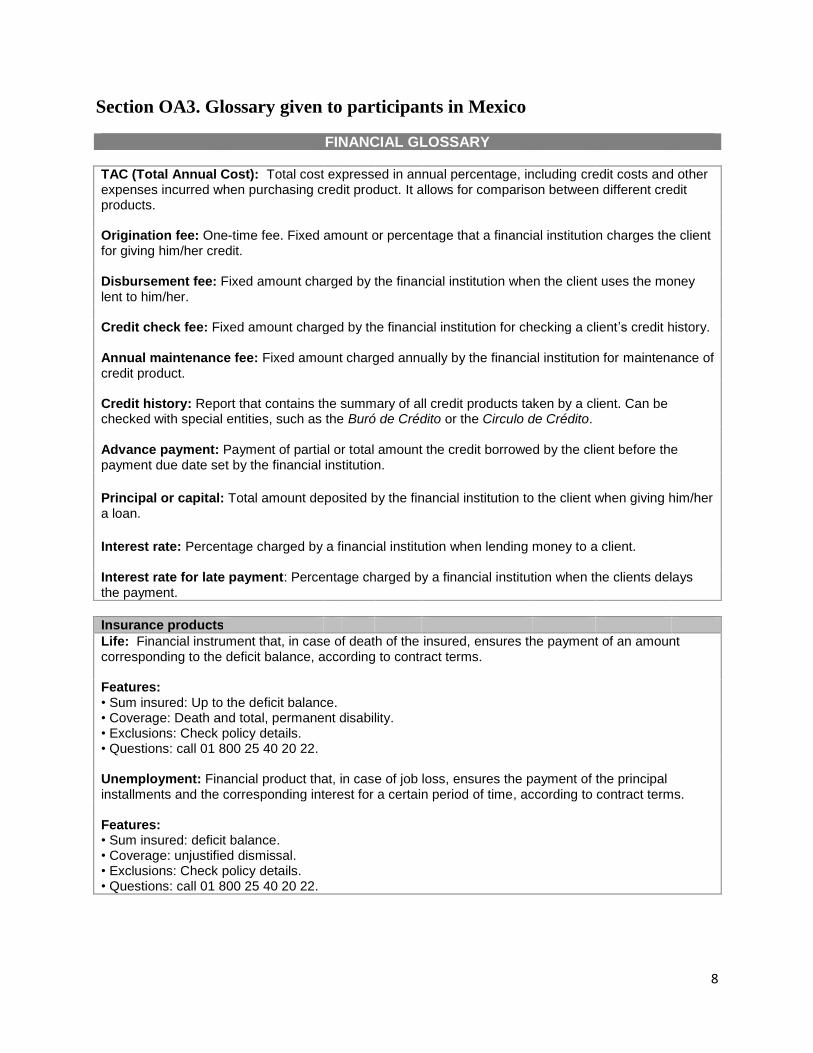
8
Section OA3. Glossary given to participants in Mexico
FINANCIAL GLOSSARY
TAC (Total Annual Cost): Total cost expressed in annual percentage, including credit costs and other expenses incurred when purchasing credit product. It allows for comparison between different credit products. Origination fee: One-time fee. Fixed amount or percentage that a financial institution charges the client for giving him/her credit. Disbursement fee: Fixed amount charged by the financial institution when the client uses the money lent to him/her. Credit check fee: Fixed amount charged by the financial institution for checking a client’s credit history.
Annual maintenance fee: Fixed amount charged annually by the financial institution for maintenance of credit product. Credit history: Report that contains the summary of all credit products taken by a client. Can be checked with special entities, such as the Buró de Crédito or the Circulo de Crédito. Advance payment: Payment of partial or total amount the credit borrowed by the client before the payment due date set by the financial institution.
Principal or capital: Total amount deposited by the financial institution to the client when giving him/her a loan.
Interest rate: Percentage charged by a financial institution when lending money to a client.
Interest rate for late payment: Percentage charged by a financial institution when the clients delays the payment.
Insurance products
Life: Financial instrument that, in case of death of the insured, ensures the payment of an amount corresponding to the deficit balance, according to contract terms. Features: • Sum insured: Up to the deficit balance. • Coverage: Death and total, permanent disability. • Exclusions: Check policy details. • Questions: call 01 800 25 40 20 22. Unemployment: Financial product that, in case of job loss, ensures the payment of the principal installments and the corresponding interest for a certain period of time, according to contract terms. Features: • Sum insured: deficit balance. • Coverage: unjustified dismissal. • Exclusions: Check policy details. • Questions: call 01 800 25 40 20 22.
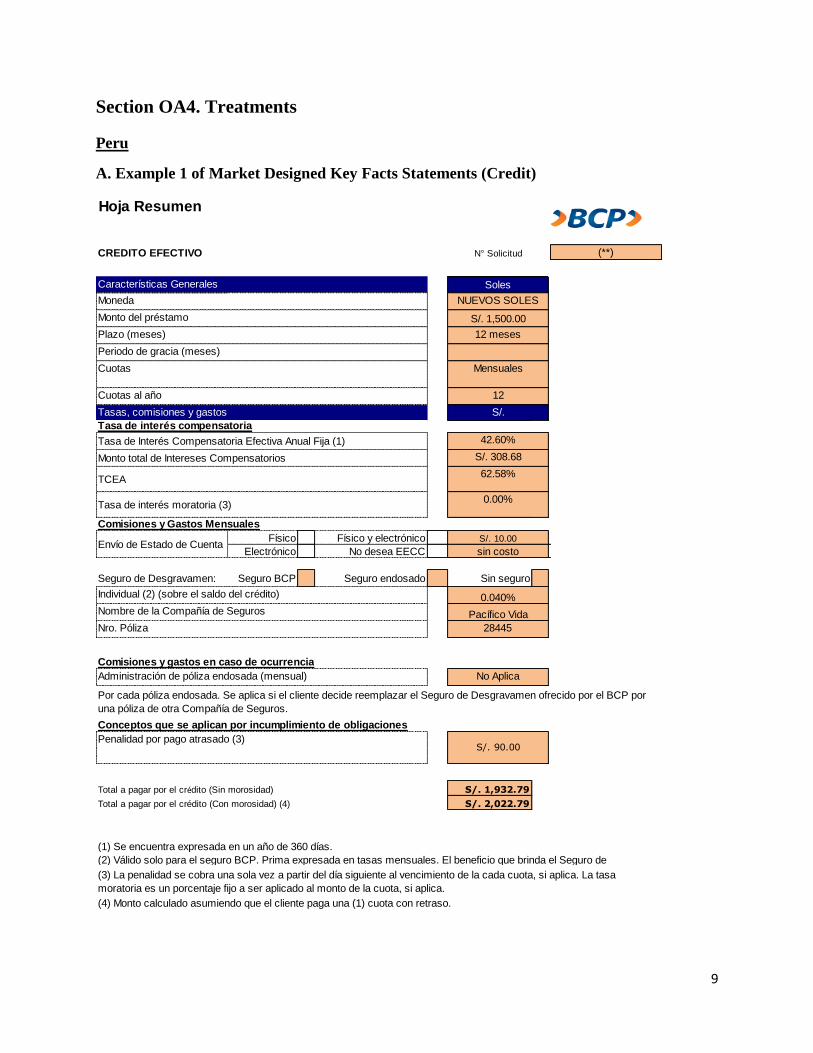
9
Section OA4. Treatments
Peru
A. Example 1 of Market Designed Key Facts Statements (Credit)
Hoja Resumen
CREDITO EFECTIVO
Características Generales
Moneda
Monto del préstamo
Plazo (meses)
Periodo de gracia (meses)
Cuotas
Cuotas al año
Tasa de interés compensatoria
Tasa de Interés Compensatoria Efectiva Anual Fija (1)
Monto total de Intereses Compensatorios
TCEA
Tasa de interés moratoria (3)
Comisiones y Gastos Mensuales
Físico Físico y electrónico
Electrónico No desea EECC
Seguro de Desgravamen: Seguro BCP Seguro endosado Sin seguro
Individual (2) (sobre el saldo del crédito)
Nro. Póliza
Comisiones y gastos en caso de ocurrencia
Administración de póliza endosada (mensual)
Conceptos que se aplican por incumplimiento de obligaciones
Total a pagar por el crédito (Sin morosidad) S/. 1,932.79
Total a pagar por el crédito (Con morosidad) (4) S/. 2,022.79
Nombre de la Compañía de Seguros Pacífico Vida
28445
sin costo
62.58%
0.00%
42.60%
S/. 308.68
S/. 1,500.00
12 meses
(4) Monto calculado asumiendo que el cliente paga una (1) cuota con retraso.
No Aplica
Por cada póliza endosada. Se aplica si el cliente decide reemplazar el Seguro de Desgravamen ofrecido por el BCP por
una póliza de otra Compañía de Seguros.
S/. 90.00
(1) Se encuentra expresada en un año de 360 días.
(2) Válido solo para el seguro BCP. Prima expresada en tasas mensuales. El beneficio que brinda el Seguro de
(3) La penalidad se cobra una sola vez a partir del día siguiente al vencimiento de la cada cuota, si aplica. La tasa
moratoria es un porcentaje fijo a ser aplicado al monto de la cuota, si aplica.
Penalidad por pago atrasado (3)
Envío de Estado de Cuenta S/. 10.00
Mensuales
12
Tasas, comisiones y gastos S/.
0.040%
N° Solicitud (**)
Soles
NUEVOS SOLES
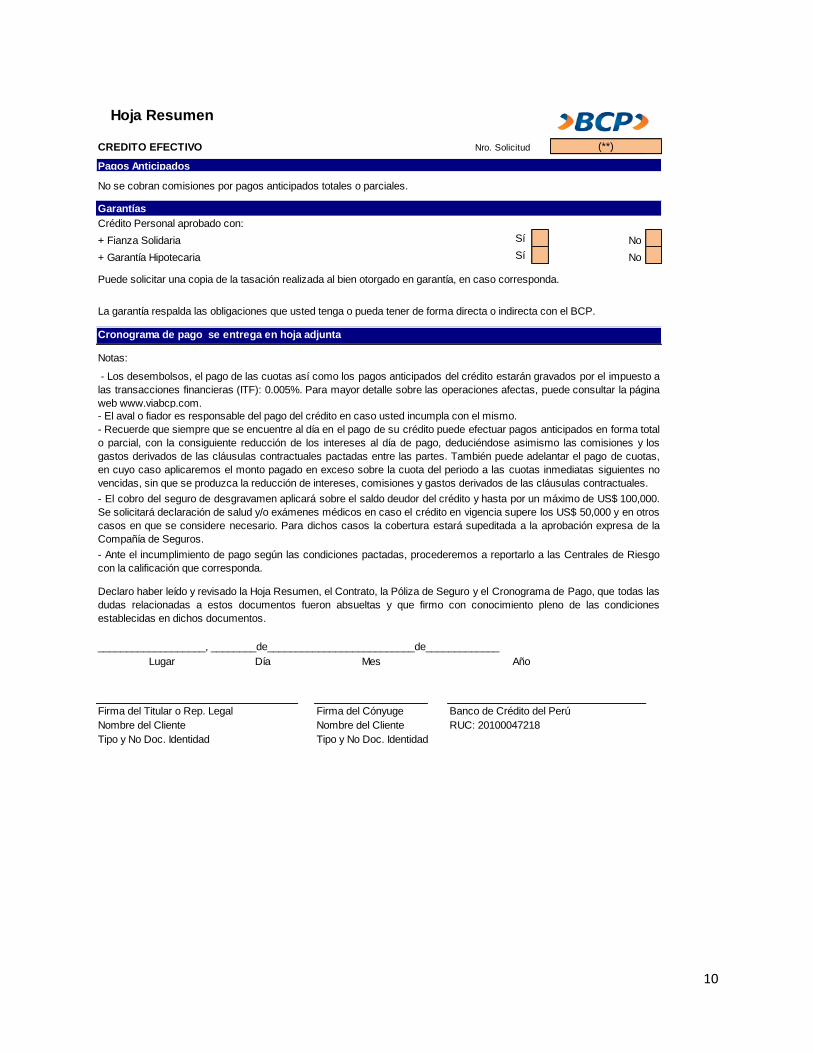
10
CREDITO EFECTIVO Nro. Solicitud
Pagos Anticipados
Crédito Personal aprobado con:
+ Fianza Solidaria Sí No
+ Garantía Hipotecaria Sí No
Cronograma de pago se entrega en hoja adjunta
Notas:
- El aval o fiador es responsable del pago del crédito en caso usted incumpla con el mismo.
___________________, ________de__________________________de_____________
Lugar Día Mes Año
Firma del Titular o Rep. Legal Firma del Cónyuge Banco de Crédito del Perú
Nombre del Cliente Nombre del Cliente RUC: 20100047218
Tipo y No Doc. Identidad Tipo y No Doc. Identidad
Declaro haber leído y revisado la Hoja Resumen, el Contrato, la Póliza de Seguro y el Cronograma de Pago, que todas las
dudas relacionadas a estos documentos fueron absueltas y que firmo con conocimiento pleno de las condiciones
establecidas en dichos documentos.
Hoja Resumen
(**)
No se cobran comisiones por pagos anticipados totales o parciales.
Garantías
Puede solicitar una copia de la tasación realizada al bien otorgado en garantía, en caso corresponda.
La garantía respalda las obligaciones que usted tenga o pueda tener de forma directa o indirecta con el BCP.
- Los desembolsos, el pago de las cuotas así como los pagos anticipados del crédito estarán gravados por el impuesto a
las transacciones financieras (ITF): 0.005%. Para mayor detalle sobre las operaciones afectas, puede consultar la página
web www.viabcp.com.
- Recuerde que siempre que se encuentre al día en el pago de su crédito puede efectuar pagos anticipados en forma total
o parcial, con la consiguiente reducción de los intereses al día de pago, deduciéndose asimismo las comisiones y los
gastos derivados de las cláusulas contractuales pactadas entre las partes. También puede adelantar el pago de cuotas,
en cuyo caso aplicaremos el monto pagado en exceso sobre la cuota del periodo a las cuotas inmediatas siguientes no
vencidas, sin que se produzca la reducción de intereses, comisiones y gastos derivados de las cláusulas contractuales.
- El cobro del seguro de desgravamen aplicará sobre el saldo deudor del crédito y hasta por un máximo de US$ 100,000.
Se solicitará declaración de salud y/o exámenes médicos en caso el crédito en vigencia supere los US$ 50,000 y en otros
casos en que se considere necesario. Para dichos casos la cobertura estará supeditada a la aprobación expresa de la
Compañía de Seguros.
- Ante el incumplimiento de pago según las condiciones pactadas, procederemos a reportarlo a las Centrales de Riesgo
con la calificación que corresponda.
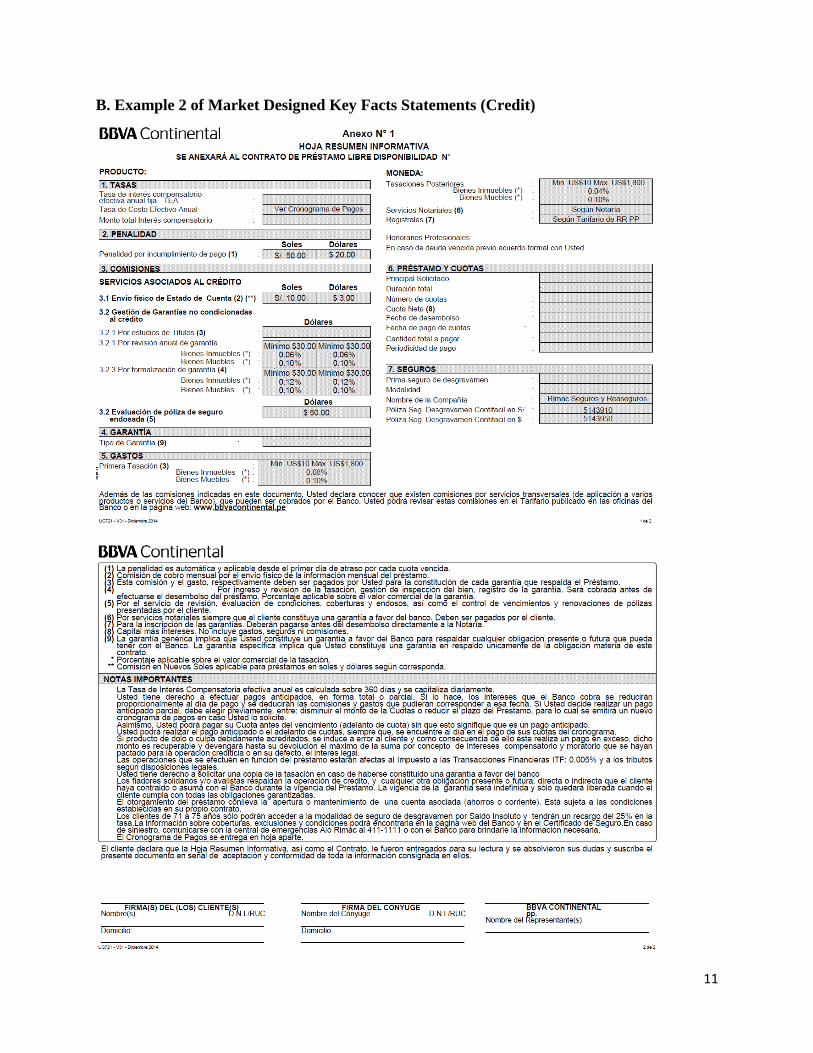
11
B. Example 2 of Market Designed Key Facts Statements (Credit)
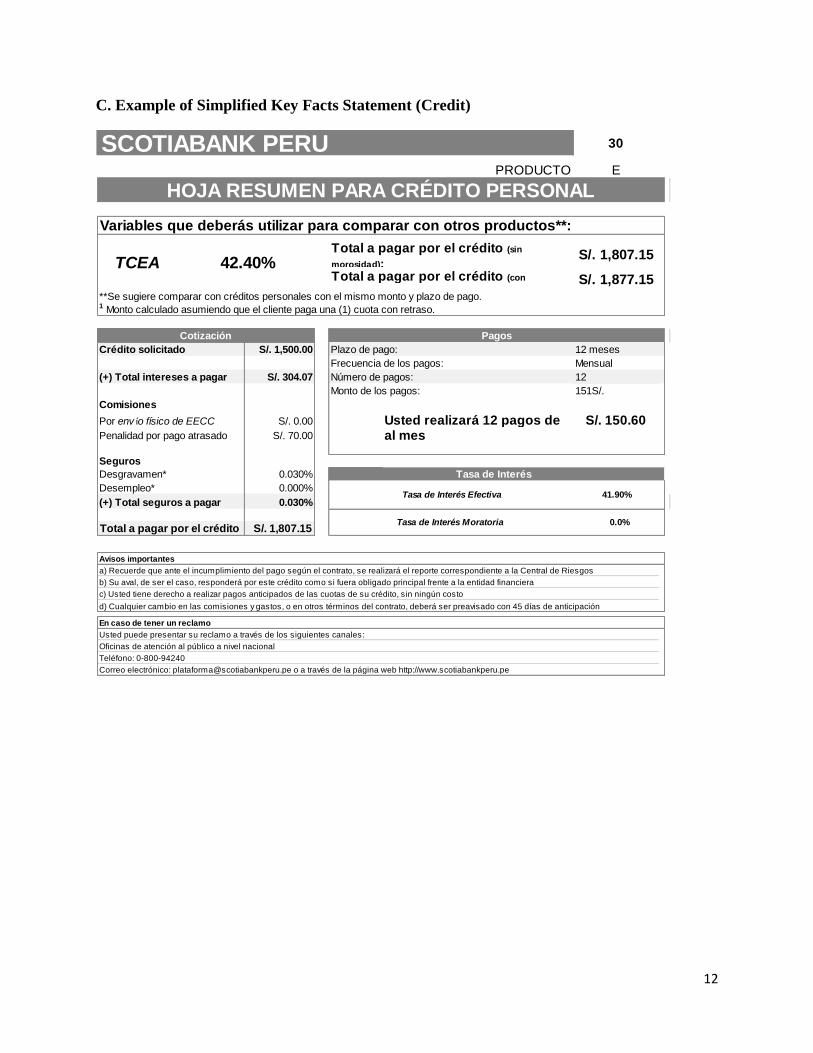
12
C. Example of Simplified Key Facts Statement (Credit)
PRODUCTO E
Crédito solicitado S/. 1,500.00 Plazo de pago: 12 meses
Frecuencia de los pagos: Mensual
(+) Total intereses a pagar S/. 304.07 12
Monto de los pagos: 151S/.
Comisiones
Por env ío físico de EECC S/. 0.00 S/. 150.60Penalidad por pago atrasado S/. 70.00 al mes
Seguros
Desgravamen* 0.030%
Desempleo* 0.000%
(+) Total seguros a pagar 0.030%
Total a pagar por el crédito S/. 1,807.15
En caso de tener un reclamo
Número de pagos:
Oficinas de atención al público a nivel nacional
Teléfono: 0-800-94240
Tasa de Interés Moratoria 0.0%
a) Recuerde que ante el incumplimiento del pago según el contrato, se realizará el reporte correspondiente a la Central de Riesgos
b) Su aval, de ser el caso, responderá por este crédito como si fuera obligado principal frente a la entidad financiera
c) Usted tiene derecho a realizar pagos anticipados de las cuotas de su crédito, sin ningún costo
d) Cualquier cambio en las comisiones y gastos, o en otros términos del contrato, deberá ser preavisado con 45 días de anticipación
SCOTIABANK PERU 30
Cotización
HOJA RESUMEN PARA CRÉDITO PERSONAL
Pagos
**Se sugiere comparar con créditos personales con el mismo monto y plazo de pago.
Variables que deberás utilizar para comparar con otros productos**:
Total a pagar por el crédito (sin
morosidad):
1 Monto calculado asumiendo que el cliente paga una (1) cuota con retraso.
TCEA 42.40%Total a pagar por el crédito (con
S/. 1,807.15
S/. 1,877.15
Usted realizará 12 pagos de
Tasa de Interés Efectiva
Tasa de Interés
41.90%
Avisos importantes
Correo electrónico: [email protected] o a través de la página web http://www.scotiabankperu.pe
Usted puede presentar su reclamo a través de los siguientes canales:
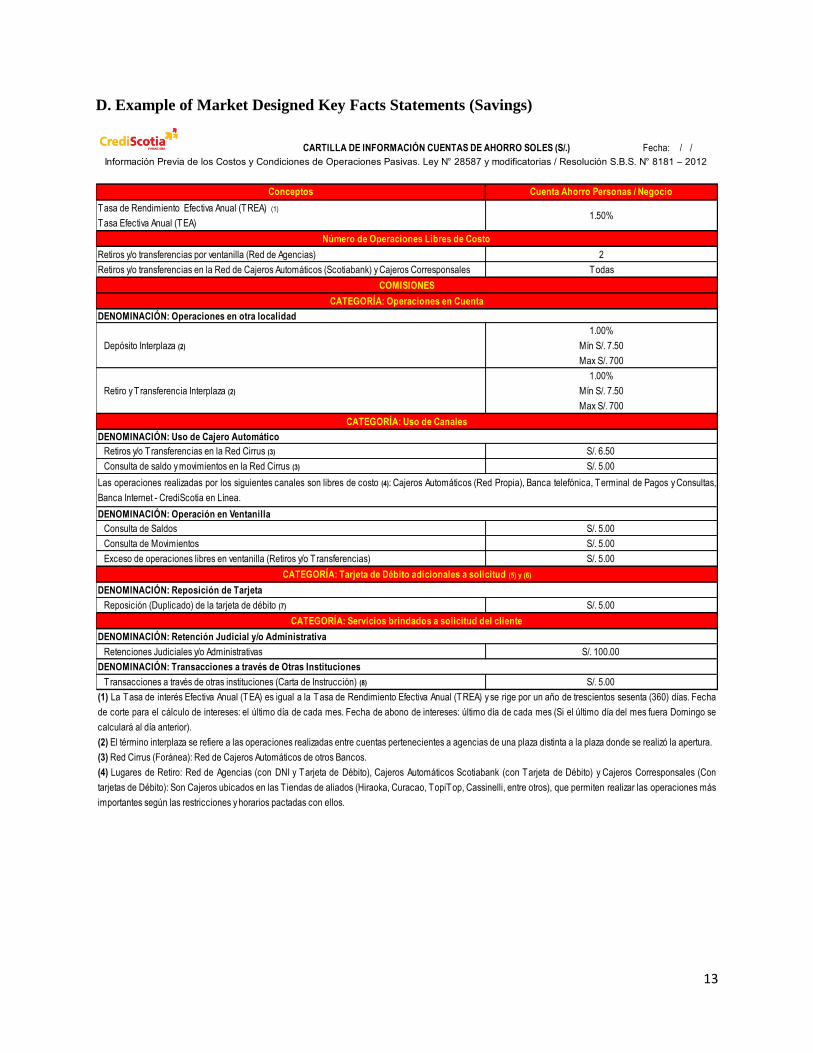
13
D. Example of Market Designed Key Facts Statements (Savings)
Conceptos Cuenta Ahorro Personas / Negocio
Tasa de Rendimiento Efectiva Anual (TREA) (1)
Tasa Efectiva Anual (TEA)1.50%
Retiros y/o transferencias por ventanilla (Red de Agencias) 2
Retiros y/o transferencias en la Red de Cajeros Automáticos (Scotiabank) y Cajeros Corresponsales Todas
Depósito Interplaza (2)
1.00%
Mín S/. 7.50
Max S/. 700
Retiro y Transferencia Interplaza (2)
1.00%
Mín S/. 7.50
Max S/. 700
Retiros y/o Transferencias en la Red Cirrus (3) S/. 6.50
Consulta de saldo y movimientos en la Red Cirrus (3) S/. 5.00
Consulta de Saldos S/. 5.00
Consulta de Movimientos S/. 5.00
Exceso de operaciones libres en ventanilla (Retiros y/o Transferencias) S/. 5.00
Reposición (Duplicado) de la tarjeta de débito (7) S/. 5.00
Retenciones Judiciales y/o Administrativas S/. 100.00
Transacciones a través de otras instituciones (Carta de Instrucción) (8) S/. 5.00
CARTILLA DE INFORMACIÓN CUENTAS DE AHORRO SOLES (S/.) Fecha: / /
Información Previa de los Costos y Condiciones de Operaciones Pasivas. Ley N° 28587 y modificatorias / Resolución S.B.S. N° 8181 – 2012
Número de Operaciones Libres de Costo
COMISIONES
CATEGORÍA: Operaciones en Cuenta
DENOMINACIÓN: Operaciones en otra localidad
CATEGORÍA: Uso de Canales
DENOMINACIÓN: Uso de Cajero Automático
Las operaciones realizadas por los siguientes canales son libres de costo (4): Cajeros Automáticos (Red Propia), Banca telefónica, Terminal de Pagos y Consultas,
Banca Internet - CrediScotia en Línea.
DENOMINACIÓN: Operación en Ventanilla
(1) La Tasa de interés Efectiva Anual (TEA) es igual a la Tasa de Rendimiento Efectiva Anual (TREA) y se rige por un año de trescientos sesenta (360) días. Fecha
de corte para el cálculo de intereses: el último día de cada mes. Fecha de abono de intereses: último día de cada mes (Si el último día del mes fuera Domingo se
calculará al día anterior).
(2) El término interplaza se refiere a las operaciones realizadas entre cuentas pertenecientes a agencias de una plaza distinta a la plaza donde se realizó la apertura.
(3) Red Cirrus (Foránea): Red de Cajeros Automáticos de otros Bancos.
(4) Lugares de Retiro: Red de Agencias (con DNI y Tarjeta de Débito), Cajeros Automáticos Scotiabank (con Tarjeta de Débito) y Cajeros Corresponsales (Con
tarjetas de Débito): Son Cajeros ubicados en las T iendas de aliados (Hiraoka, Curacao, TopiTop, Cassinelli, entre otros), que permiten realizar las operaciones más
importantes según las restricciones y horarios pactadas con ellos.
CATEGORÍA: Tarjeta de Débito adicionales a solicitud (5) y (6)
DENOMINACIÓN: Reposición de Tarjeta
CATEGORÍA: Servicios brindados a solicitud del cliente
DENOMINACIÓN: Retención Judicial y/o Administrativa
DENOMINACIÓN: Transacciones a través de Otras Instituciones
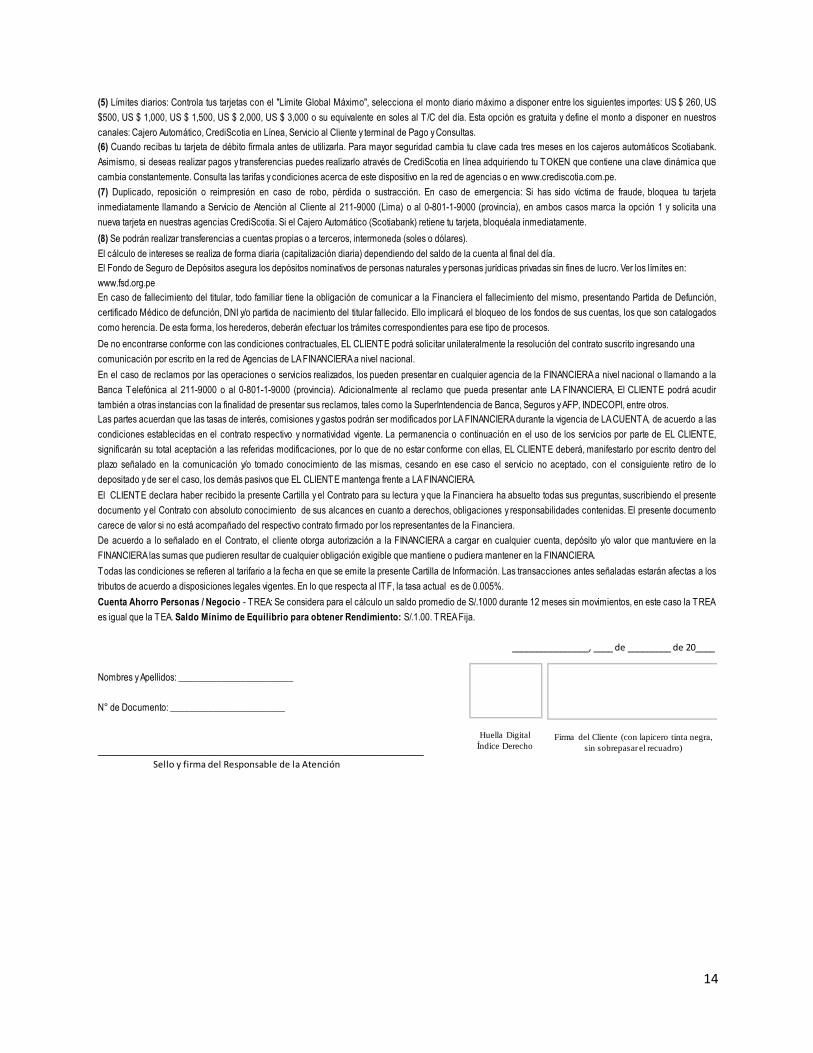
14
________________, ____ de _________ de 20____
Nombres y Apellidos: ________________________
N° de Documento: ________________________
____________________________________________________________________
Sello y firma del Responsable de la Atención
(5) Límites diarios: Controla tus tarjetas con el "Límite Global Máximo", selecciona el monto diario máximo a disponer entre los siguientes importes: US $ 260, US
$500, US $ 1,000, US $ 1,500, US $ 2,000, US $ 3,000 o su equivalente en soles al T /C del día. Esta opción es gratuita y define el monto a disponer en nuestros
canales: Cajero Automático, CrediScotia en Línea, Servicio al Cliente y terminal de Pago y Consultas.
(6) Cuando recibas tu tarjeta de débito fírmala antes de utilizarla. Para mayor seguridad cambia tu clave cada tres meses en los cajeros automáticos Scotiabank.
Asimismo, si deseas realizar pagos y transferencias puedes realizarlo através de CrediScotia en línea adquiriendo tu TOKEN que contiene una clave dinámica que
cambia constantemente. Consulta las tarifas y condiciones acerca de este dispositivo en la red de agencias o en www.crediscotia.com.pe.
(7) Duplicado, reposición o reimpresión en caso de robo, pérdida o sustracción. En caso de emergencia: Si has sido víctima de fraude, bloquea tu tarjeta
inmediatamente llamando a Servicio de Atención al Cliente al 211-9000 (Lima) o al 0-801-1-9000 (provincia), en ambos casos marca la opción 1 y solicita una
nueva tarjeta en nuestras agencias CrediScotia. Si el Cajero Automático (Scotiabank) retiene tu tarjeta, bloquéala inmediatamente.
El Fondo de Seguro de Depósitos asegura los depósitos nominativos de personas naturales y personas jurídicas privadas sin fines de lucro. Ver los límites en:
www.fsd.org.pe
Todas las condiciones se refieren al tarifario a la fecha en que se emite la presente Cartilla de Información. Las transacciones antes señaladas estarán afectas a los
tributos de acuerdo a disposiciones legales vigentes. En lo que respecta al ITF, la tasa actual es de 0.005%.
El cálculo de intereses se realiza de forma diaria (capitalización diaria) dependiendo del saldo de la cuenta al final del día.
(8) Se podrán realizar transferencias a cuentas propias o a terceros, intermoneda (soles o dólares).
Cuenta Ahorro Personas / Negocio - TREA: Se considera para el cálculo un saldo promedio de S/.1000 durante 12 meses sin movimientos, en este caso la TREA
es igual que la TEA. Saldo Mínimo de Equilibrio para obtener Rendimiento: S/.1.00. TREA Fija.
En caso de fallecimiento del titular, todo familiar tiene la obligación de comunicar a la Financiera el fallecimiento del mismo, presentando Partida de Defunción,
certificado Médico de defunción, DNI y/o partida de nacimiento del titular fallecido. Ello implicará el bloqueo de los fondos de sus cuentas, los que son catalogados
como herencia. De esta forma, los herederos, deberán efectuar los trámites correspondientes para ese tipo de procesos.
De no encontrarse conforme con las condiciones contractuales, EL CLIENTE podrá solicitar unilateralmente la resolución del contrato suscrito ingresando una
comunicación por escrito en la red de Agencias de LA FINANCIERA a nivel nacional.
En el caso de reclamos por las operaciones o servicios realizados, los pueden presentar en cualquier agencia de la FINANCIERA a nivel nacional o llamando a la
Banca Telefónica al 211-9000 o al 0-801-1-9000 (provincia). Adicionalmente al reclamo que pueda presentar ante LA FINANCIERA, El CLIENTE podrá acudir
también a otras instancias con la finalidad de presentar sus reclamos, tales como la SuperIntendencia de Banca, Seguros y AFP, INDECOPI, entre otros.
Las partes acuerdan que las tasas de interés, comisiones y gastos podrán ser modificados por LA FINANCIERA durante la vigencia de LA CUENTA, de acuerdo a las
condiciones establecidas en el contrato respectivo y normatividad vigente. La permanencia o continuación en el uso de los servicios por parte de EL CLIENTE,
significarán su total aceptación a las referidas modificaciones, por lo que de no estar conforme con ellas, EL CLIENTE deberá, manifestarlo por escrito dentro del
plazo señalado en la comunicación y/o tomado conocimiento de las mismas, cesando en ese caso el servicio no aceptado, con el consiguiente retiro de lo
depositado y de ser el caso, los demás pasivos que EL CLIENTE mantenga frente a LA FINANCIERA.
El CLIENTE declara haber recibido la presente Cartilla y el Contrato para su lectura y que la Financiera ha absuelto todas sus preguntas, suscribiendo el presente
documento y el Contrato con absoluto conocimiento de sus alcances en cuanto a derechos, obligaciones y responsabilidades contenidas. El presente documento
carece de valor si no está acompañado del respectivo contrato firmado por los representantes de la Financiera.
De acuerdo a lo señalado en el Contrato, el cliente otorga autorización a la FINANCIERA a cargar en cualquier cuenta, depósito y/o valor que mantuviere en la
FINANCIERA las sumas que pudieren resultar de cualquier obligación exigible que mantiene o pudiera mantener en la FINANCIERA.
Huella Digital
Índice DerechoFirma del Cliente (con lapicero tinta negra,
sin sobrepasar el recuadro)
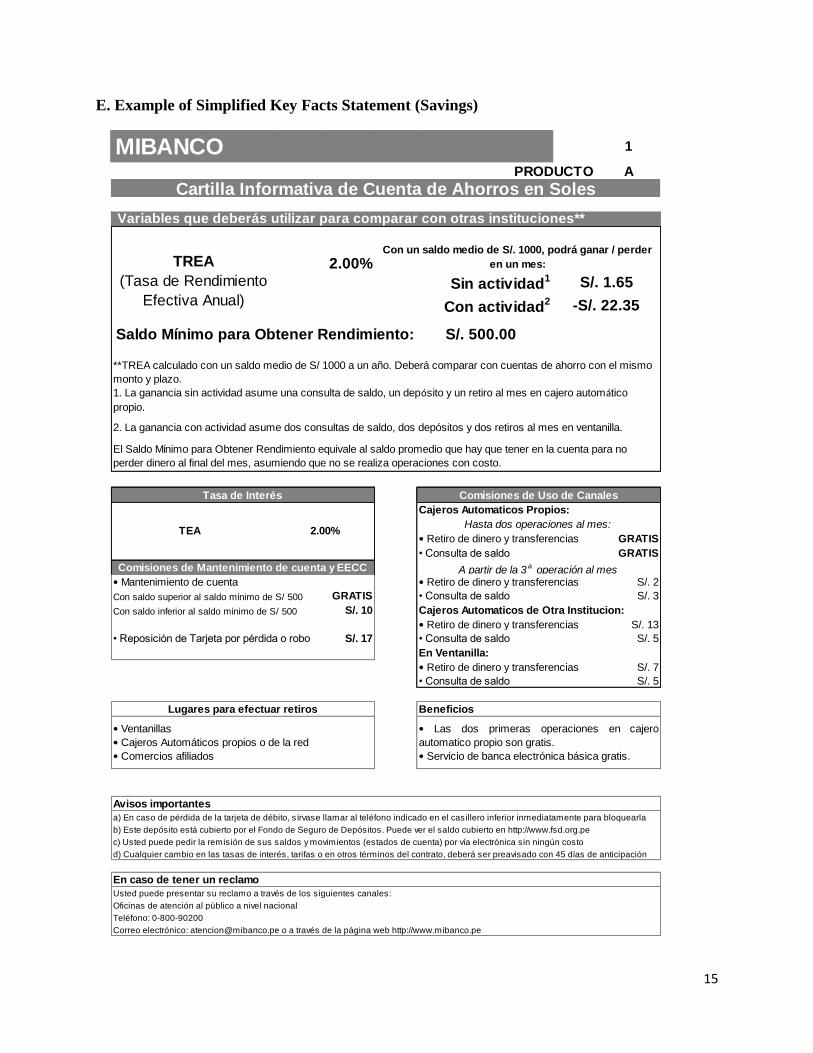
15
E. Example of Simplified Key Facts Statement (Savings)
PRODUCTO A
Sin actividad1
Con actividad2
GRATIS
GRATIS
S/. 2
GRATIS S/. 3
S/. 10
S/. 13
S/. 17 S/. 5
S/. 7
S/. 5
Beneficios
En caso de tener un reclamo
MIBANCO 1
Cartilla Informativa de Cuenta de Ahorros en Soles
Variables que deberás utilizar para comparar con otras instituciones**
TREA
(Tasa de Rendimiento
Efectiva Anual)
2.00%Con un saldo medio de S/. 1000, podrá ganar / perder
en un mes:
S/. 1.65
-S/. 22.35
• Consulta de saldo
Lugares para efectuar retiros
Comisiones de Mantenimiento de cuenta y EECC A partir de la 3a operación al mes
**TREA calculado con un saldo medio de S/ 1000 a un año. Deberá comparar con cuentas de ahorro con el mismo
monto y plazo.
1. La ganancia sin actividad asume una consulta de saldo, un depósito y un retiro al mes en cajero automático
propio.
El Saldo Mínimo para Obtener Rendimiento equivale al saldo promedio que hay que tener en la cuenta para no
perder dinero al final del mes, asumiendo que no se realiza operaciones con costo.
Tasa de Interés Comisiones de Uso de Canales
Cajeros Automaticos Propios:
TEA 2.00%Hasta dos operaciones al mes:
• Retiro de dinero y transferencias
• Consulta de saldo
• Reposición de Tarjeta por pérdida o robo
En Ventanilla:
• Retiro de dinero y transferencias
• Mantenimiento de cuenta • Retiro de dinero y transferencias
• Consulta de saldo
Cajeros Automaticos de Otra Institucion:
• Retiro de dinero y transferencias
Con saldo superior al saldo mínimo de S/ 500
Con saldo inferior al saldo mínimo de S/ 500
2. La ganancia con actividad asume dos consultas de saldo, dos depósitos y dos retiros al mes en ventanilla.
Saldo Mínimo para Obtener Rendimiento: S/. 500.00
Teléfono: 0-800-90200
Correo electrónico: [email protected] o a través de la página web http://www.mibanco.pe
b) Este depósito está cubierto por el Fondo de Seguro de Depósitos. Puede ver el saldo cubierto en http://www.fsd.org.pe
d) Cualquier cambio en las tasas de interés, tarifas o en otros términos del contrato, deberá ser preavisado con 45 días de anticipación
a) En caso de pérdida de la tarjeta de débito, sírvase llamar al teléfono indicado en el casillero inferior inmediatamente para bloquearla
c) Usted puede pedir la remisión de sus saldos y movimientos (estados de cuenta) por vía electrónica sin ningún costo
Avisos importantes
Usted puede presentar su reclamo a través de los siguientes canales:
Oficinas de atención al público a nivel nacional
• Ventanillas
• Cajeros Automáticos propios o de la red
• Comercios afiliados
• Las dos primeras operaciones en cajero
automatico propio son gratis.
• Servicio de banca electrónica básica gratis.
• Consulta de saldo
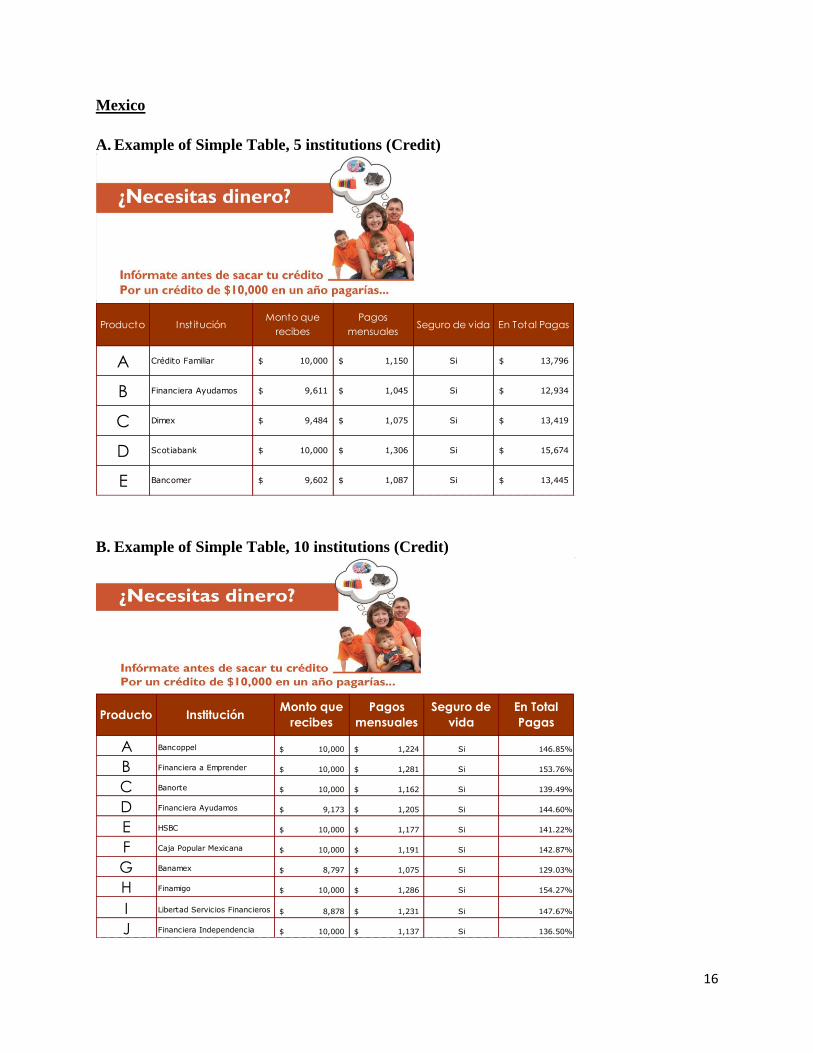
16
Mexico
A. Example of Simple Table, 5 institutions (Credit)
B. Example of Simple Table, 10 institutions (Credit)
A Crédito Familiar 10,000$ 1,150$ Si 13,796$
B Financiera Ayudamos 9,611$ 1,045$ Si 12,934$
C Dimex 9,484$ 1,075$ Si 13,419$
D Scotiabank 10,000$ 1,306$ Si 15,674$
E Bancomer 9,602$ 1,087$ Si 13,445$
Producto Inst ituciónMonto que
recibes
Pagos
mensualesSeguro de vida En Total Pagas
A Bancoppel 10,000$ 1,224$ Si 146.85%
B Financiera a Emprender 10,000$ 1,281$ Si 153.76%
C Banorte 10,000$ 1,162$ Si 139.49%
D Financiera Ayudamos 9,173$ 1,205$ Si 144.60%
E HSBC 10,000$ 1,177$ Si 141.22%
F Caja Popular Mexicana 10,000$ 1,191$ Si 142.87%
G Banamex 8,797$ 1,075$ Si 129.03%
H Finamigo 10,000$ 1,286$ Si 154.27%
I Libertad Servicios Financieros 8,878$ 1,231$ Si 147.67%
J Financiera Independencia 10,000$ 1,137$ Si 136.50%
En Total
PagasProducto Institución
Monto que
recibes
Pagos
mensuales
Seguro de
vida
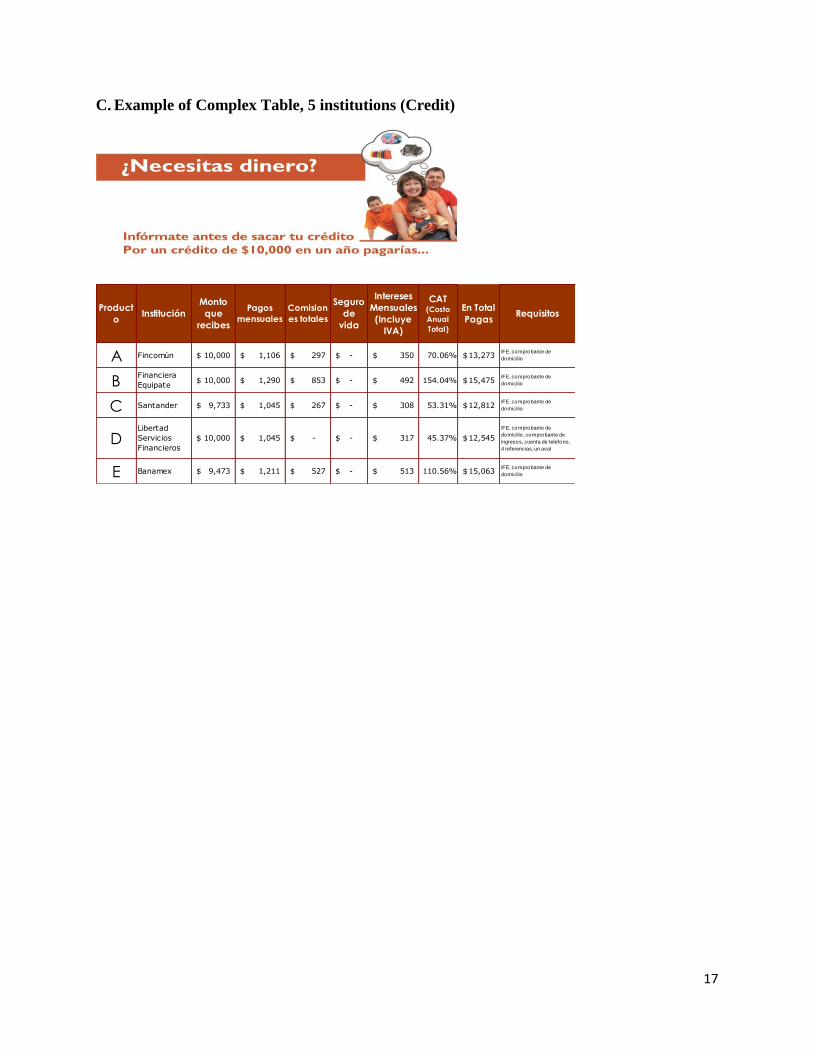
17
C. Example of Complex Table, 5 institutions (Credit)
3
A Fincomún 10,000$ 1,106$ 297$ -$ 350$ 70.06% 13,273$ IFE, comprobante de
domicilio8
BFinanciera
Equipate10,000$ 1,290$ 853$ -$ 492$ 154.04% 15,475$
IFE, comprobante de
domicilio9
C Santander 9,733$ 1,045$ 267$ -$ 308$ 53.31% 12,812$ IFE, comprobante de
domicilio10
DLibertad
Servicios
Financieros
10,000$ 1,045$ -$ -$ 317$ 45.37% 12,545$
IFE, comprobante de
domicilio , comprobante de
ingresos, cuenta de telefono,
4 referencias, un aval11
E Banamex 9,473$ 1,211$ 527$ -$ 513$ 110.56% 15,063$ IFE, comprobante de
domicilio12
Product
oInstitución
Monto
que
recibes
Pagos
mensuales
Comision
es totales
En Total
Pagas
Seguro
de
vida
Intereses
Mensuales
(Incluye
IVA)
CAT (Costo
Anual
Total)
Requisitos
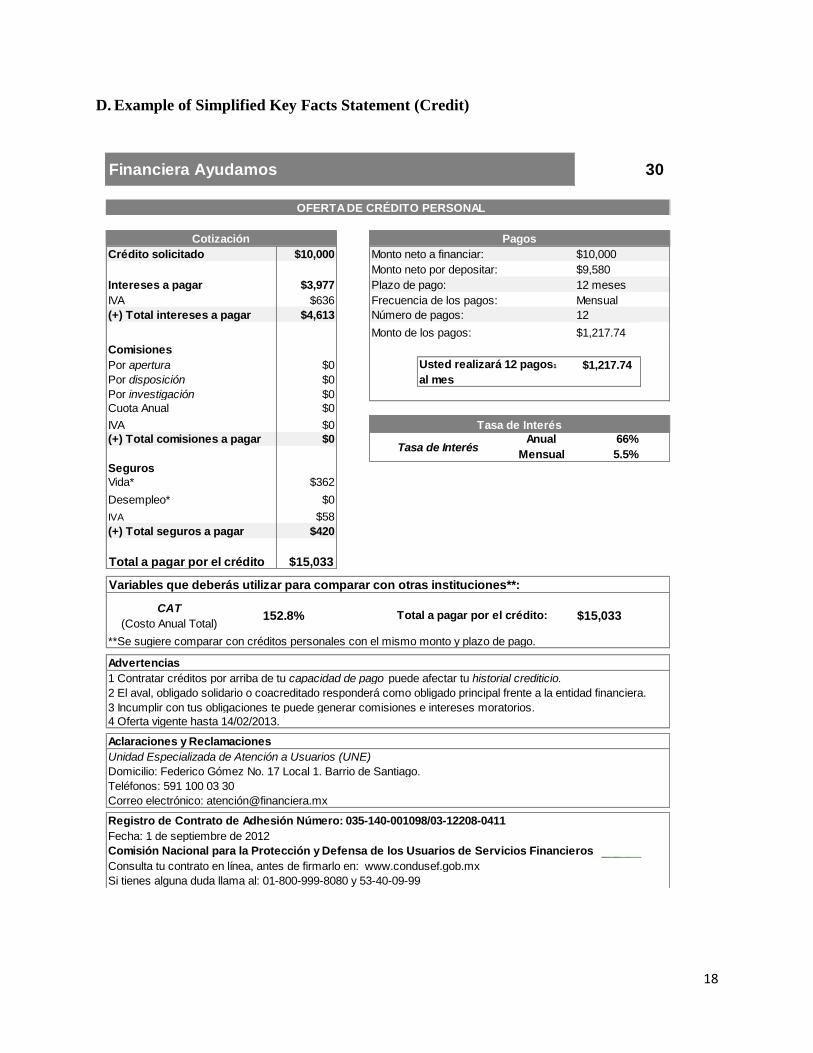
18
D. Example of Simplified Key Facts Statement (Credit)
Crédito solicitado $10,000 Monto neto a financiar: $10,000
Monto neto por depositar: $9,580
Intereses a pagar $3,977 Plazo de pago: 12 meses
IVA $636 Frecuencia de los pagos: Mensual
(+) Total intereses a pagar $4,613 12
Monto de los pagos: $1,217.74
Comisiones
Por apertura $0 $1,217.74
Por disposición $0 al mes
Por investigación $0
Cuota Anual $0
IVA $0
(+) Total comisiones a pagar $0 Anual 66%
Mensual 5.5%
Seguros
Vida* $362
Desempleo* $0
IVA $58
(+) Total seguros a pagar $420
Total a pagar por el crédito $15,033
Aclaraciones y Reclamaciones
Variables que deberás utilizar para comparar con otras instituciones**:
CAT
(Costo Anual Total)152.8% Total a pagar por el crédito: $15,033
Registro de Contrato de Adhesión Número: 035-140-001098/03-12208-0411
Fecha: 1 de septiembre de 2012
Comisión Nacional para la Protección y Defensa de los Usuarios de Servicios Financieros
Consulta tu contrato en línea, antes de firmarlo en: www.condusef.gob.mx
Si tienes alguna duda llama al: 01-800-999-8080 y 53-40-09-99
4 Oferta vigente hasta 14/02/2013.
Unidad Especializada de Atención a Usuarios (UNE)
Domicilio: Federico Gómez No. 17 Local 1. Barrio de Santiago.
Teléfonos: 591 100 03 30
Correo electrónico: atenció[email protected]
**Se sugiere comparar con créditos personales con el mismo monto y plazo de pago.
Advertencias
1 Contratar créditos por arriba de tu capacidad de pago puede afectar tu historial crediticio.
2 El aval, obligado solidario o coacreditado responderá como obligado principal frente a la entidad financiera.
3 Incumplir con tus obligaciones te puede generar comisiones e intereses moratorios.
Usted realizará 12 pagos1
Tasa de Interés
Tasa de Interés
Observaciones
30
OFERTA DE CRÉDITO PERSONAL
Cotización Pagos
Número de pagos:
Financiera Ayudamos
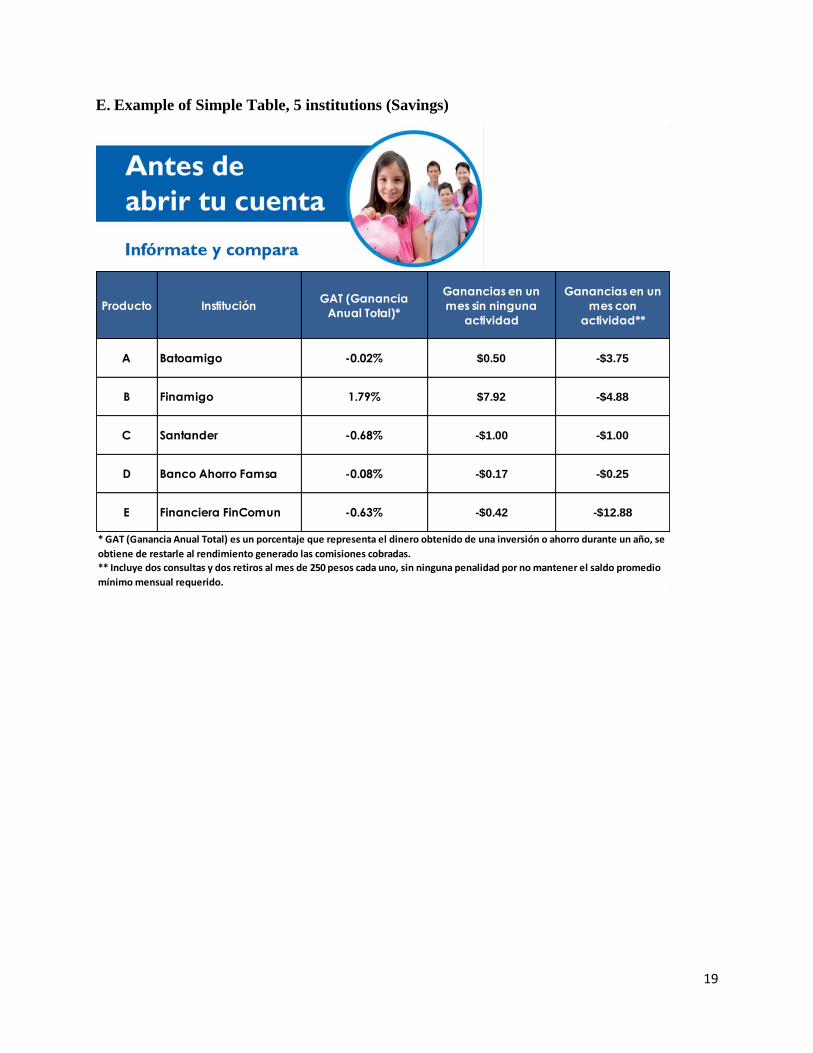
19
E. Example of Simple Table, 5 institutions (Savings)
Producto InstituciónGAT (Ganancia
Anual Total)*
Ganancias en un
mes sin ninguna
actividad
Ganancias en un
mes con
actividad**
A Batoamigo -0.02% $0.50 -$3.75
B Finamigo 1.79% $7.92 -$4.88
C Santander -0.68% -$1.00 -$1.00
D Banco Ahorro Famsa -0.08% -$0.17 -$0.25
E Financiera FinComun -0.63% -$0.42 -$12.88
** Incluye dos consultas y dos retiros al mes de 250 pesos cada uno, sin ninguna penalidad por no mantener el saldo promedio
mínimo mensual requerido.
* GAT (Ganancia Anual Total) es un porcentaje que representa el dinero obtenido de una inversión o ahorro durante un año, se
obtiene de restarle al rendimiento generado las comisiones cobradas.
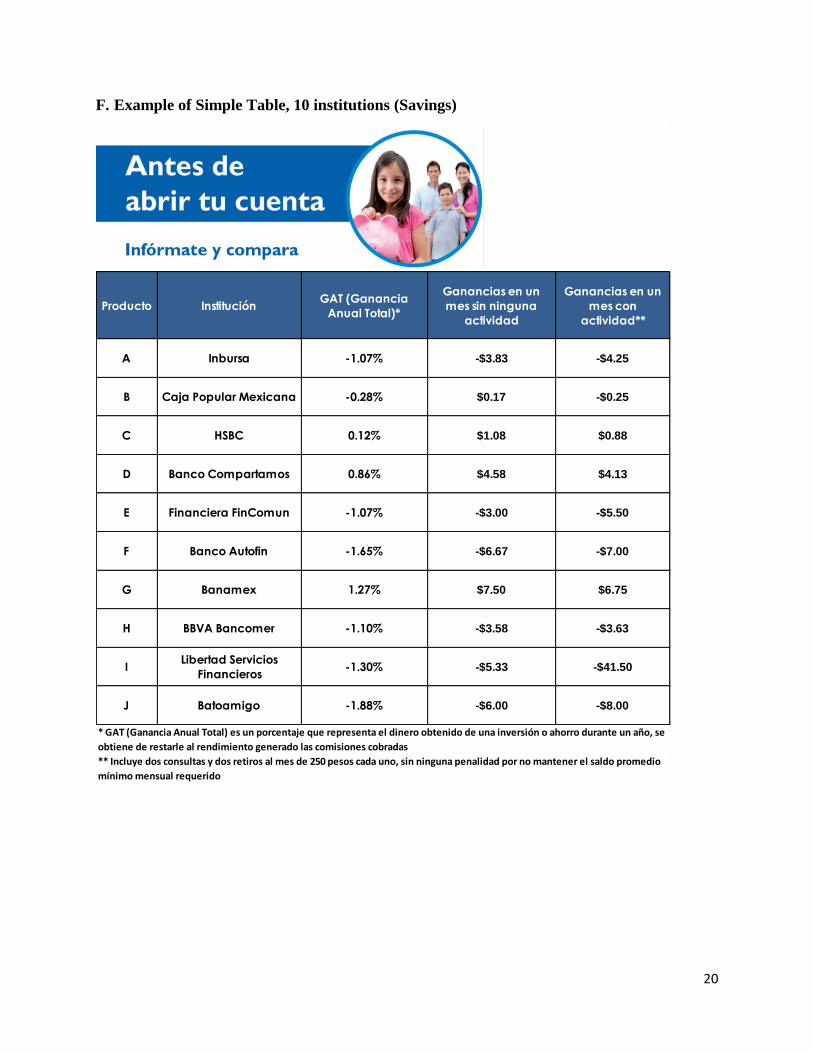
20
F. Example of Simple Table, 10 institutions (Savings)
Producto InstituciónGAT (Ganancia
Anual Total)*
Ganancias en un
mes sin ninguna
actividad
Ganancias en un
mes con
actividad**
A Inbursa -1.07% -$3.83 -$4.25
B Caja Popular Mexicana -0.28% $0.17 -$0.25
C HSBC 0.12% $1.08 $0.88
D Banco Compartamos 0.86% $4.58 $4.13
E Financiera FinComun -1.07% -$3.00 -$5.50
F Banco Autofin -1.65% -$6.67 -$7.00
G Banamex 1.27% $7.50 $6.75
H BBVA Bancomer -1.10% -$3.58 -$3.63
ILibertad Servicios
Financieros-1.30% -$5.33 -$41.50
J Batoamigo -1.88% -$6.00 -$8.00
* GAT (Ganancia Anual Total) es un porcentaje que representa el dinero obtenido de una inversión o ahorro durante un año, se
obtiene de restarle al rendimiento generado las comisiones cobradas
** Incluye dos consultas y dos retiros al mes de 250 pesos cada uno, sin ninguna penalidad por no mantener el saldo promedio
mínimo mensual requerido
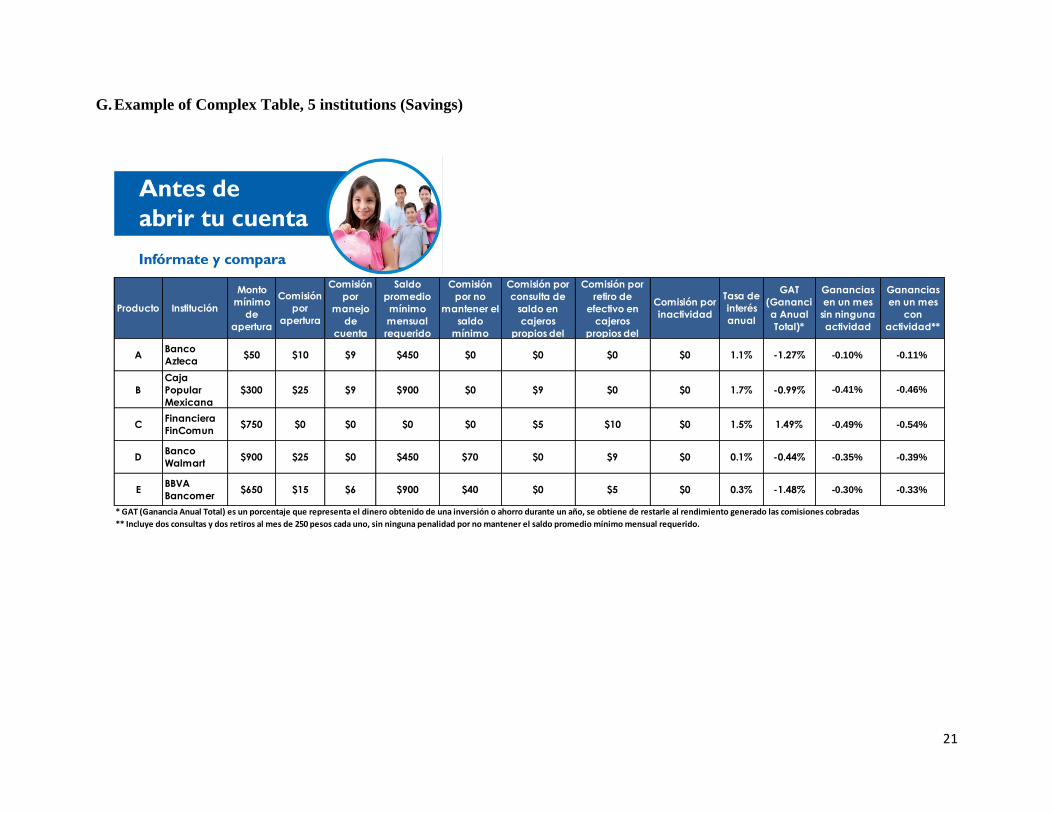
21
G. Example of Complex Table, 5 institutions (Savings)
Producto Institución
Monto
mínimo
de
apertura
Comisión
por
apertura
Comisión
por
manejo
de
cuenta
Saldo
promedio
mínimo
mensual
requerido
Comisión
por no
mantener el
saldo
mínimo
Comisión por
consulta de
saldo en
cajeros
propios del
Comisión por
retiro de
efectivo en
cajeros
propios del
Comisión por
inactividad
Tasa de
interés
anual
GAT
(Gananci
a Anual
Total)*
Ganancias
en un mes
sin ninguna
actividad
Ganancias
en un mes
con
actividad**
ABanco
Azteca$50 $10 $9 $450 $0 $0 $0 $0 1.1% -1.27% -0.10% -0.11%
B
Caja
Popular
Mexicana
$300 $25 $9 $900 $0 $9 $0 $0 1.7% -0.99% -0.41% -0.46%
CFinanciera
FinComun$750 $0 $0 $0 $0 $5 $10 $0 1.5% 1.49% -0.49% -0.54%
DBanco
Walmart$900 $25 $0 $450 $70 $0 $9 $0 0.1% -0.44% -0.35% -0.39%
EBBVA
Bancomer$650 $15 $6 $900 $40 $0 $5 $0 0.3% -1.48% -0.30% -0.33%
* GAT (Ganancia Anual Total) es un porcentaje que representa el dinero obtenido de una inversión o ahorro durante un año, se obtiene de restarle al rendimiento generado las comisiones cobradas
** Incluye dos consultas y dos retiros al mes de 250 pesos cada uno, sin ninguna penalidad por no mantener el saldo promedio mínimo mensual requerido.
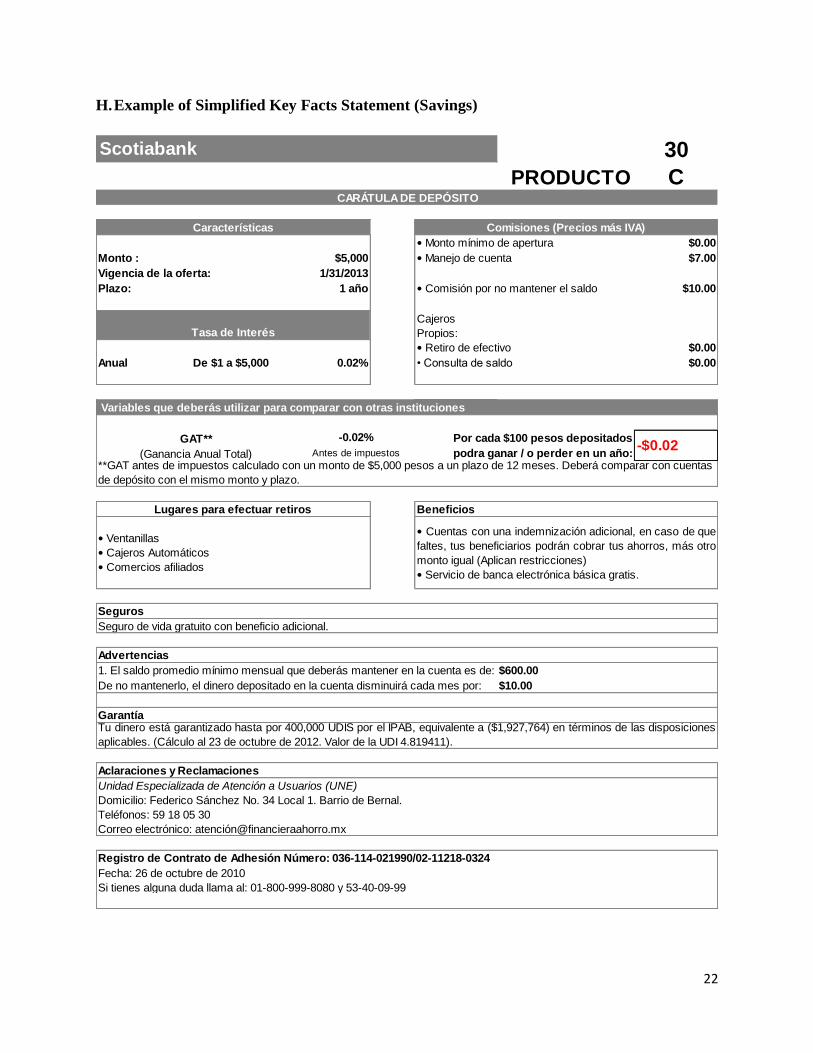
22
H. Example of Simplified Key Facts Statement (Savings)
PRODUCTO C
$0.00
Monto : $5,000 $7.00
Vigencia de la oferta: 1/31/2013
Plazo: 1 año $10.00
Cajeros
Propios:
$0.00
Anual De $1 a $5,000 0.02% $0.00
Beneficios
Seguro de vida gratuito con beneficio adicional.
$600.00
$10.00
Teléfonos: 59 18 05 30
Correo electrónico: atenció[email protected]
Registro de Contrato de Adhesión Número: 036-114-021990/02-11218-0324
Fecha: 26 de octubre de 2010
Si tienes alguna duda llama al: 01-800-999-8080 y 53-40-09-99
GarantíaTu dinero está garantizado hasta por 400,000 UDIS por el IPAB, equivalente a ($1,927,764) en términos de las disposiciones
aplicables. (Cálculo al 23 de octubre de 2012. Valor de la UDI 4.819411).
Aclaraciones y Reclamaciones
Unidad Especializada de Atención a Usuarios (UNE)
Domicilio: Federico Sánchez No. 34 Local 1. Barrio de Bernal.
Seguros
Advertencias
1. El saldo promedio mínimo mensual que deberás mantener en la cuenta es de:
De no mantenerlo, el dinero depositado en la cuenta disminuirá cada mes por:
Lugares para efectuar retiros
• Ventanillas
• Cajeros Automáticos
• Comercios afiliados
• Cuentas con una indemnización adicional, en caso de que
faltes, tus beneficiarios podrán cobrar tus ahorros, más otro
monto igual (Aplican restricciones)
• Servicio de banca electrónica básica gratis.
Variables que deberás utilizar para comparar con otras instituciones
GAT**
(Ganancia Anual Total)
-0.02% Por cada $100 pesos depositados -$0.02
Antes de impuestos podra ganar / o perder en un año:**GAT antes de impuestos calculado con un monto de $5,000 pesos a un plazo de 12 meses. Deberá comparar con cuentas
de depósito con el mismo monto y plazo.
Tasa de Interés
• Retiro de efectivo
• Consulta de saldo
Características Comisiones (Precios más IVA)
• Monto mínimo de apertura
• Manejo de cuenta
• Comisión por no mantener el saldo
Scotiabank 30
CARÁTULA DE DEPÓSITO
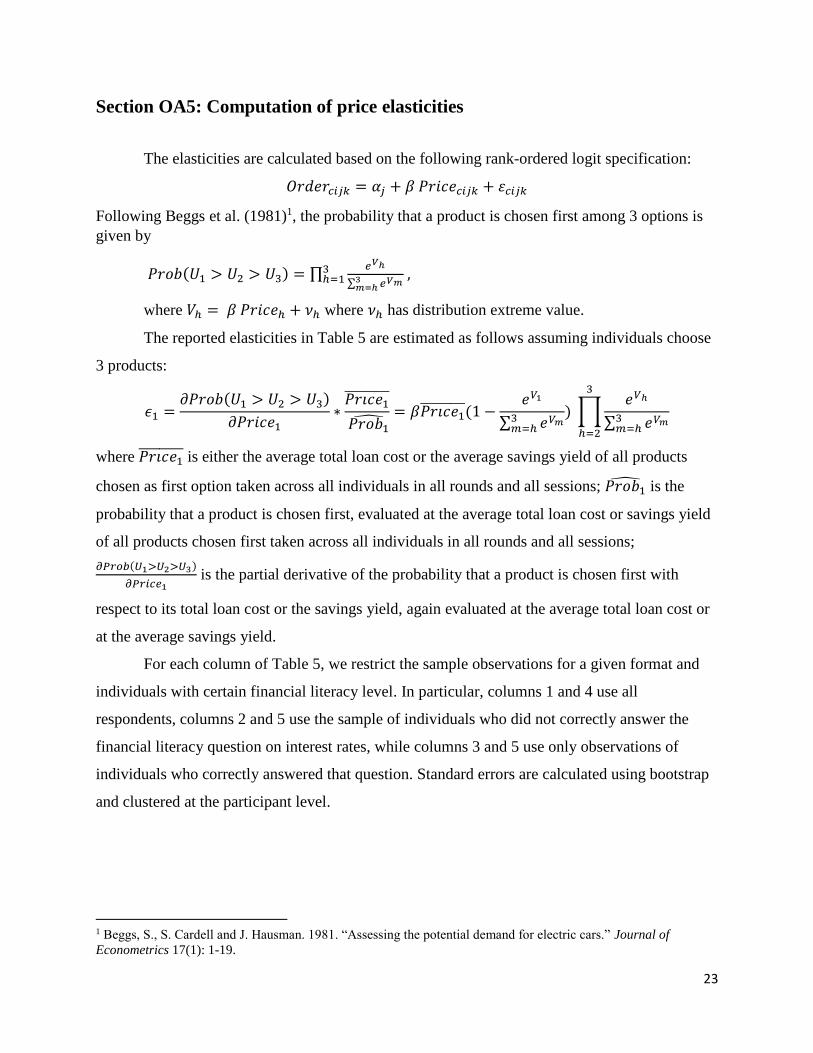
23
Section OA5: Computation of price elasticities
The elasticities are calculated based on the following rank-ordered logit specification:
𝑂𝑟𝑑𝑒𝑟𝑐𝑖𝑗𝑘 = 𝛼𝑗 + 𝛽 𝑃𝑟𝑖𝑐𝑒𝑐𝑖𝑗𝑘 + 𝜀𝑐𝑖𝑗𝑘
Following Beggs et al. (1981)1, the probability that a product is chosen first among 3 options is
given by
𝑃𝑟𝑜𝑏(𝑈1 > 𝑈2 > 𝑈3) = ∏𝑒𝑉ℎ
∑ 𝑒𝑉𝑚3𝑚=ℎ
3ℎ=1 ,
where 𝑉ℎ = 𝛽 𝑃𝑟𝑖𝑐𝑒ℎ + 𝜈ℎ where 𝜈ℎ has distribution extreme value.
The reported elasticities in Table 5 are estimated as follows assuming individuals choose
3 products:
𝜖1 =𝜕𝑃𝑟𝑜𝑏(𝑈1 > 𝑈2 > 𝑈3)
𝜕𝑃𝑟𝑖𝑐𝑒1∗
𝑃𝑟𝑖𝑐𝑒1̅̅ ̅̅ ̅̅ ̅̅ ̅
𝑃𝑟𝑜𝑏1̂
= 𝛽𝑃𝑟𝑖𝑐𝑒1̅̅ ̅̅ ̅̅ ̅̅ ̅(1 −
𝑒𝑉1
∑ 𝑒𝑉𝑚3𝑚=ℎ
) ∏𝑒𝑉ℎ
∑ 𝑒𝑉𝑚3𝑚=ℎ
3
ℎ=2
where 𝑃𝑟𝑖𝑐𝑒1̅̅ ̅̅ ̅̅ ̅̅ ̅ is either the average total loan cost or the average savings yield of all products
chosen as first option taken across all individuals in all rounds and all sessions; 𝑃𝑟𝑜𝑏1̂ is the
probability that a product is chosen first, evaluated at the average total loan cost or savings yield
of all products chosen first taken across all individuals in all rounds and all sessions;
𝜕𝑃𝑟𝑜𝑏(𝑈1>𝑈2>𝑈3)
𝜕𝑃𝑟𝑖𝑐𝑒1 is the partial derivative of the probability that a product is chosen first with
respect to its total loan cost or the savings yield, again evaluated at the average total loan cost or
at the average savings yield.
For each column of Table 5, we restrict the sample observations for a given format and
individuals with certain financial literacy level. In particular, columns 1 and 4 use all
respondents, columns 2 and 5 use the sample of individuals who did not correctly answer the
financial literacy question on interest rates, while columns 3 and 5 use only observations of
individuals who correctly answered that question. Standard errors are calculated using bootstrap
and clustered at the participant level.
1 Beggs, S., S. Cardell and J. Hausman. 1981. “Assessing the potential demand for electric cars.” Journal of
Econometrics 17(1): 1-19.
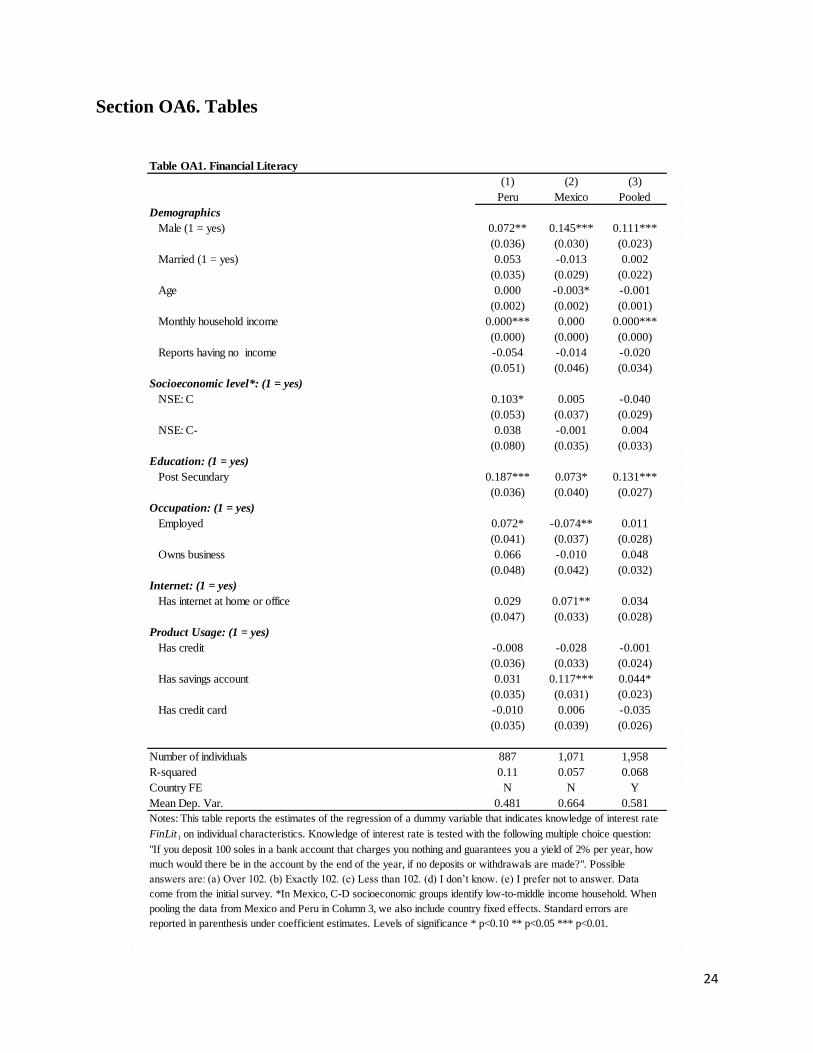
24
Section OA6. Tables
(1) (2) (3)
Peru Mexico Pooled
Demographics
Male (1 = yes) 0.072** 0.145*** 0.111***
(0.036) (0.030) (0.023)
Married (1 = yes) 0.053 -0.013 0.002
(0.035) (0.029) (0.022)
Age 0.000 -0.003* -0.001
(0.002) (0.002) (0.001)
Monthly household income 0.000*** 0.000 0.000***
(0.000) (0.000) (0.000)
Reports having no income -0.054 -0.014 -0.020
(0.051) (0.046) (0.034)
Socioeconomic level*: (1 = yes)
NSE: C 0.103* 0.005 -0.040
(0.053) (0.037) (0.029)
NSE: C- 0.038 -0.001 0.004
(0.080) (0.035) (0.033)
Education: (1 = yes)
Post Secundary 0.187*** 0.073* 0.131***
(0.036) (0.040) (0.027)
Occupation: (1 = yes)
Employed 0.072* -0.074** 0.011
(0.041) (0.037) (0.028)
Owns business 0.066 -0.010 0.048
(0.048) (0.042) (0.032)
Internet: (1 = yes)
Has internet at home or office 0.029 0.071** 0.034
(0.047) (0.033) (0.028)
Product Usage: (1 = yes)
Has credit -0.008 -0.028 -0.001
(0.036) (0.033) (0.024)
Has savings account 0.031 0.117*** 0.044*
(0.035) (0.031) (0.023)
Has credit card -0.010 0.006 -0.035
(0.035) (0.039) (0.026)
Number of individuals 887 1,071 1,958
R-squared 0.11 0.057 0.068
Country FE N N Y
Mean Dep. Var. 0.481 0.664 0.581
Table OA1. Financial Literacy
Notes: This table reports the estimates of the regression of a dummy variable that indicates knowledge of interest rate
FinLit i on individual characteristics. Knowledge of interest rate is tested with the following multiple choice question:
"If you deposit 100 soles in a bank account that charges you nothing and guarantees you a yield of 2% per year, how
much would there be in the account by the end of the year, if no deposits or withdrawals are made?". Possible
answers are: (a) Over 102. (b) Exactly 102. (c) Less than 102. (d) I don’t know. (e) I prefer not to answer. Data
come from the initial survey. *In Mexico, C-D socioeconomic groups identify low-to-middle income household. When
pooling the data from Mexico and Peru in Column 3, we also include country fixed effects. Standard errors are
reported in parenthesis under coefficient estimates. Levels of significance * p<0.10 ** p<0.05 *** p<0.01.
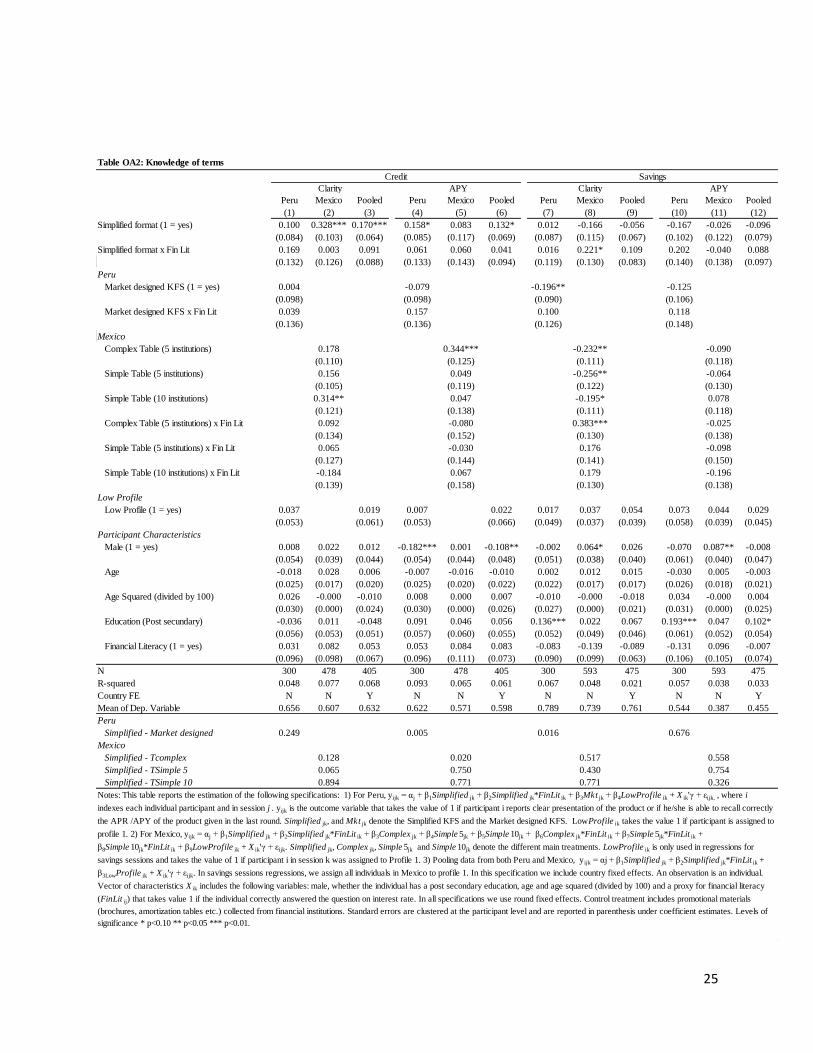
25
Peru Mexico Pooled Peru Mexico Pooled Peru Mexico Pooled Peru Mexico Pooled
(1) (2) (3) (4) (5) (6) (7) (8) (9) (10) (11) (12)
Simplified format (1 = yes) 0.100 0.328*** 0.170*** 0.158* 0.083 0.132* 0.012 -0.166 -0.056 -0.167 -0.026 -0.096
(0.084) (0.103) (0.064) (0.085) (0.117) (0.069) (0.087) (0.115) (0.067) (0.102) (0.122) (0.079)
Simplified format x Fin Lit 0.169 0.003 0.091 0.061 0.060 0.041 0.016 0.221* 0.109 0.202 -0.040 0.088
(0.132) (0.126) (0.088) (0.133) (0.143) (0.094) (0.119) (0.130) (0.083) (0.140) (0.138) (0.097)
Peru
Market designed KFS (1 = yes) 0.004 -0.079 -0.196** -0.125
(0.098) (0.098) (0.090) (0.106)
Market designed KFS x Fin Lit 0.039 0.157 0.100 0.118
(0.136) (0.136) (0.126) (0.148)
Mexico
Complex Table (5 institutions) 0.178 0.344*** -0.232** -0.090
(0.110) (0.125) (0.111) (0.118)
Simple Table (5 institutions) 0.156 0.049 -0.256** -0.064
(0.105) (0.119) (0.122) (0.130)
Simple Table (10 institutions) 0.314** 0.047 -0.195* 0.078
(0.121) (0.138) (0.111) (0.118)
Complex Table (5 institutions) x Fin Lit 0.092 -0.080 0.383*** -0.025
(0.134) (0.152) (0.130) (0.138)
Simple Table (5 institutions) x Fin Lit 0.065 -0.030 0.176 -0.098
(0.127) (0.144) (0.141) (0.150)
Simple Table (10 institutions) x Fin Lit -0.184 0.067 0.179 -0.196
(0.139) (0.158) (0.130) (0.138)
Low Profile
Low Profile (1 = yes) 0.037 0.019 0.007 0.022 0.017 0.037 0.054 0.073 0.044 0.029
(0.053) (0.061) (0.053) (0.066) (0.049) (0.037) (0.039) (0.058) (0.039) (0.045)
Participant Characteristics
Male (1 = yes) 0.008 0.022 0.012 -0.182*** 0.001 -0.108** -0.002 0.064* 0.026 -0.070 0.087** -0.008
(0.054) (0.039) (0.044) (0.054) (0.044) (0.048) (0.051) (0.038) (0.040) (0.061) (0.040) (0.047)
Age -0.018 0.028 0.006 -0.007 -0.016 -0.010 0.002 0.012 0.015 -0.030 0.005 -0.003
(0.025) (0.017) (0.020) (0.025) (0.020) (0.022) (0.022) (0.017) (0.017) (0.026) (0.018) (0.021)
Age Squared (divided by 100) 0.026 -0.000 -0.010 0.008 0.000 0.007 -0.010 -0.000 -0.018 0.034 -0.000 0.004
(0.030) (0.000) (0.024) (0.030) (0.000) (0.026) (0.027) (0.000) (0.021) (0.031) (0.000) (0.025)
Education (Post secundary) -0.036 0.011 -0.048 0.091 0.046 0.056 0.136*** 0.022 0.067 0.193*** 0.047 0.102*
(0.056) (0.053) (0.051) (0.057) (0.060) (0.055) (0.052) (0.049) (0.046) (0.061) (0.052) (0.054)
Financial Literacy (1 = yes) 0.031 0.082 0.053 0.053 0.084 0.083 -0.083 -0.139 -0.089 -0.131 0.096 -0.007
(0.096) (0.098) (0.067) (0.096) (0.111) (0.073) (0.090) (0.099) (0.063) (0.106) (0.105) (0.074)
N 300 478 405 300 478 405 300 593 475 300 593 475
R-squared 0.048 0.077 0.068 0.093 0.065 0.061 0.067 0.048 0.021 0.057 0.038 0.033
Country FE N N Y N N Y N N Y N N Y
Mean of Dep. Variable 0.656 0.607 0.632 0.622 0.571 0.598 0.789 0.739 0.761 0.544 0.387 0.455
Peru
Simplified - Market designed 0.249 0.005 0.016 0.676
Mexico
Simplified - Tcomplex 0.128 0.020 0.517 0.558
Simplified - TSimple 5 0.065 0.750 0.430 0.754
Simplified - TSimple 10 0.894 0.771 0.771 0.326
Savings
Table OA2: Knowledge of terms
APY APY
Notes: This table reports the estimation of the following specifications: 1) For Peru, yijk = αj + β1Simplified jk + β2Simplified jk*FinLit ik + β3Mkt jk + β4LowProfile ik + X ik'γ + εijk, , where i
indexes each individual participant and in session j . yijk is the outcome variable that takes the value of 1 if participant i reports clear presentation of the product or if he/she is able to recall correctly
the APR /APY of the product given in the last round. Simplified jk, and Mkt jk denote the Simplified KFS and the Market designed KFS. LowProfile ik takes the value 1 if participant is assigned to
profile 1. 2) For Mexico, yijk = αj + β1Simplified jk + β2Simplified jk*FinLit ik + β3Complex jk + β4Simple 5jk + β5Simple 10jk + β6Complex jk*FinLit ik + β7Simple 5jk*FinLit ik +
β8Simple 10jk*FinLit ik + β9LowProfile ik + X ik'γ + εijk. Simplified jk, Complex jk, Simple 5jk and Simple 10jk denote the different main treatments. LowProfile ik is only used in regressions for
savings sessions and takes the value of 1 if participant i in session k was assigned to Profile 1. 3) Pooling data from both Peru and Mexico, yijk = αj + β1Simplified jk + β2Simplified jk*FinLit ik +
β3LowProfile ik + X ik'γ + εijk. In savings sessions regressions, we assign all individuals in Mexico to profile 1. In this specification we include country fixed effects. An observation is an individual.
Vector of characteristics X ik includes the following variables: male, whether the individual has a post secondary education, age and age squared (divided by 100) and a proxy for financial literacy
(FinLit ij) that takes value 1 if the individual correctly answered the question on interest rate. In all specifications we use round fixed effects. Control treatment includes promotional materials
(brochures, amortization tables etc.) collected from financial institutions. Standard errors are clustered at the participant level and are reported in parenthesis under coefficient estimates. Levels of
significance * p<0.10 ** p<0.05 *** p<0.01.
Clarity
Credit
Clarity
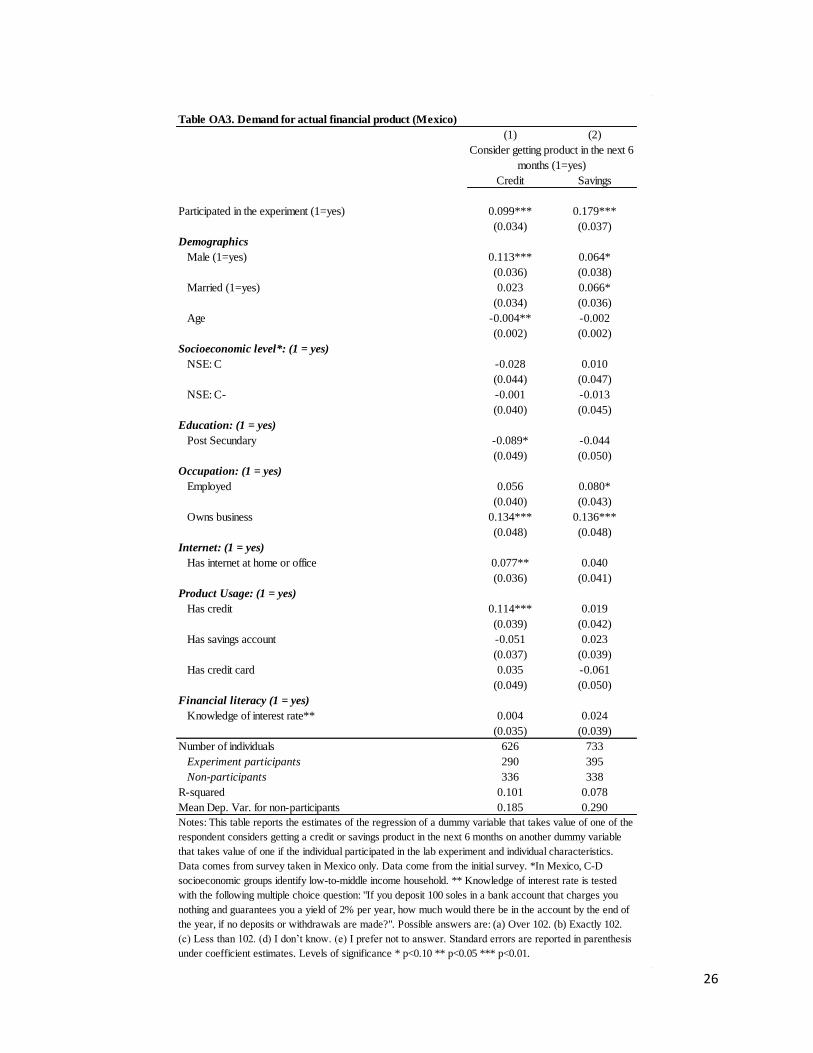
26
(1) (2)
Credit Savings
Participated in the experiment (1=yes) 0.099*** 0.179***
(0.034) (0.037)
Demographics
Male (1=yes) 0.113*** 0.064*
(0.036) (0.038)
Married (1=yes) 0.023 0.066*
(0.034) (0.036)
Age -0.004** -0.002
(0.002) (0.002)
Socioeconomic level*: (1 = yes)
NSE: C -0.028 0.010
(0.044) (0.047)
NSE: C- -0.001 -0.013
(0.040) (0.045)
Education: (1 = yes)
Post Secundary -0.089* -0.044
(0.049) (0.050)
Occupation: (1 = yes)
Employed 0.056 0.080*
(0.040) (0.043)
Owns business 0.134*** 0.136***
(0.048) (0.048)
Internet: (1 = yes)
Has internet at home or office 0.077** 0.040
(0.036) (0.041)
Product Usage: (1 = yes)
Has credit 0.114*** 0.019
(0.039) (0.042)
Has savings account -0.051 0.023
(0.037) (0.039)
Has credit card 0.035 -0.061
(0.049) (0.050)
Financial literacy (1 = yes)
Knowledge of interest rate** 0.004 0.024
(0.035) (0.039)
Number of individuals 626 733
Experiment participants 290 395
Non-participants 336 338
R-squared 0.101 0.078
Mean Dep. Var. for non-participants 0.185 0.290
Consider getting product in the next 6
months (1=yes)
Table OA3. Demand for actual financial product (Mexico)
Notes: This table reports the estimates of the regression of a dummy variable that takes value of one of the
respondent considers getting a credit or savings product in the next 6 months on another dummy variable
that takes value of one if the individual participated in the lab experiment and individual characteristics.
Data comes from survey taken in Mexico only. Data come from the initial survey. *In Mexico, C-D
socioeconomic groups identify low-to-middle income household. ** Knowledge of interest rate is tested
with the following multiple choice question: "If you deposit 100 soles in a bank account that charges you
nothing and guarantees you a yield of 2% per year, how much would there be in the account by the end of
the year, if no deposits or withdrawals are made?". Possible answers are: (a) Over 102. (b) Exactly 102.
(c) Less than 102. (d) I don’t know. (e) I prefer not to answer. Standard errors are reported in parenthesis
under coefficient estimates. Levels of significance * p<0.10 ** p<0.05 *** p<0.01.