information for sustainable natural resource … for srm in eecca_e… · information for...
TRANSCRIPT
INFORMATION FOR SUSTAINABLE NATURAL RESOURCE MANAGEMENT: KEY POINTS FOR REFORMERS IN EASTERN EUROPE, CAUCASUS AND CENTRAL ASIA

EAP Task Force
INFORMATION FOR SUSTAINABLE NATURAL RESOURCE MANAGEMENT:
Key points for reformers in Eastern Europe, Caucasus, and Central Asia

ORGANISATION FOR ECONOMIC CO-OPERATION
AND DEVELOPMENT
The OECD is a unique forum where governments work together to address the economic, social and
environmental challenges of globalisation. The OECD is also at the forefront of efforts to understand and to help
governments respond to new developments and concerns, such as corporate governance, the information economy
and the challenges of an ageing population. The Organisation provides a setting where governments can compare
policy experiences, seek answers to common problems, identify good practice and work to co-ordinate domestic
and international policies.
The OECD member countries are: Australia, Austria, Belgium, Canada, Chile, the Czech Republic, Denmark,
Estonia, Finland, France, Germany, Greece, Hungary, Iceland, Ireland, Israel, Italy, Japan, Korea, Luxembourg,
Mexico, the Netherlands, New Zealand, Norway, Poland, Portugal, the Slovak Republic, Slovenia, Spain, Sweden,
Switzerland, Turkey, the United Kingdom and the United States. The Commission of the European Communities
takes part in the work of the OECD.
EAP TASK FORCE
The Task Force for the Implementation of the Environmental Action Programme for Central and Eastern Europe
(EAP Task Force) was established in 1993 at the ―Environment for Europe‖ Ministerial Conference in Lucerne,
Switzerland. Its Secretariat was established at the OECD. Since its creation, the EAP Task Force has proven to be
a flexible and practical avenue for providing support to environmental policy reforms and institutional
strengthening in the countries of the region. More detailed information about Task Force activities can be found
on its website at: www.oecd.org/env/eap
This report is also available in Russian under the title:
ИНФОРМАЦИЯ ДЛЯ УСТОЙЧИВОГО УПРАВЛЕНИЯ ПРИРОДНЫМИ РЕСУРСАМИ:
КЛЮЧЕВЫЕ СООБРАЖЕНИЯ ДЛЯ РЕФОРМАТОРОВ В СТРАНАХ ВОСТОЧНОЙ
ЕВРОПЫ, КАВКАЗА И ЦЕНТРАЛЬНОЙ АЗИИ
© OECD (2011)
No reproduction, copy, transmission or translation of this publication may be made without written permission. Applications should be sent to OECD Publishing: [email protected] or by fax (+33-1) 45 24 13 91. Permission to photocopy a portion of
this work should be addressed to the Centre Français d’exploitation du droit de copie, 20 rue des Grands -Augustins, 75006 Paris,
France ([email protected]).
5
FOREWORD
The majority of countries in Eastern Europe, Caucasus and Central Asia (EECCA) possess
important natural capital, with revenues based on this capital’s use often playing a dominant role in
their economic growth. Wisely investing such revenues and preserving the natural capital is thus a key
condition for sustaining such growth. An appropriate mix of policies is necessary to this end, with
accurate, timely and transparent information being the foundation of evidence-based decisions aimed
at averting the deterioration of natural resources thus managing the risks to growth.
Within this context, the current document explains the importance of information as a key
element to support policy-making related to sustainable natural resources management. It provides
users with a menu of possible measures that can improve the design and performance of their
countries’ knowledge systems on natural resource management. The document also equips readers
with the understanding of key areas where policy dialogue and consensus-building is necessary.
Decision-makers in environmental, economic, and sector-specific ministries in EECCA are the main
target audience for this document. Being a capacity development tool by its nature, the document
responds, among other things, to the need of permanently re-investing in individual capacity building,
against a background of high staff turnover within public administration bodies in EECCA.
The paper is one of the outcomes of the OECD work to support the integration of environmental
and economic policies in the Eurasian transition economies, which is carried out under the umbrella of
the Task Force for the Implementation of the Environmental Action Programme (EAP Task Force).
The EAP Task Force was established at the Lucerne ―Environment for Europe‖ Ministerial
Conference in 1993 in order to assist the ―environmental reconstruction‖ of transition economies
based on sound economic, governance, and financing principles. OECD, with its significant
experience of policy integration, was considered well placed to provide such assistance. The main
mission of the EAP Task Force since its establishment has been: (i) promoting the integration of
environmental considerations into the processes of economic, social and political reform; and
(ii) upgrading institutional and human capacities for environmental management.
The paper was drafted by Alexios Antypas (Central European University, Budapest, Hungary)
with support from Robert Atkinson (Prospect C&S s.a., Belgium). Its development involved
consultations with staff members of the Georgian Ministry of Energy and Natural Resources, in
particular Dimitri Glonti, Nelly Korkotadze and Ellen Iacobidze. Andrei Terentiev from the High
School of Economics (Moscow, Russia) translated the paper into Russian. Angela Bularga from the
OECD secretariat managed this project and edited the final version of the paper, based on peer review
by Ziga Zarnic. Shukhrat Ziaviddinov and Irina Massovets provided administrative support.
Financing for this work was provided by the government of Norway, as part of their support to
governance and environmental reforms in Georgia. While developed for EECCA countries
specifically, this paper could be useful for other developing economies.

6
TABLE OF CONTENTS
KEY MESSAGES .................................................................................................................................... 8
WHY ECONOMIC DECISIONS NEED ROBUST DATA ON NATURAL ASSETS? ...................... 10
HOW TO SUPPORT THE DEVELOPMENT OF ―KNOWLEDGE SYSTEMS‖? ............................. 12
WHY AND HOW GOVERNMENTS SHOULD CLOSE THE SCIENCE-POLICY GAP? ............... 13
HOW TO DESIGN EFFECTIVE ENVIRONMENTAL INFORMATION SYSTEMS? ..................... 15
WHAT ROLE INDICATORS PLAY? .................................................................................................. 17
WHAT INDICATORS COULD BE USED FOR NATURAL RESOURCES MANAGEMENT? ...... 20
HOW TRADITIONAL MONITORING PROGRAMMES COULD BE ENHANCED? ..................... 22
HOW RESOURCE ACCOUNTS COULD BE USED? ........................................................................ 24
WHY ACCESS TO INFORMATION IS IMPORTANT? .................................................................... 27
SUMMING UP: A VAST REFORM AGENDA ................................................................................... 29
REFERENCES AND SELECTED BIBLIOGRAPHY.......................................................................... 31
ANNEX 1. MEASURING RENEWABLE NATURAL STOCKS: FRESHWATER RESOURCES ... 33
ANNEX 2. MEASURING RENEWABLE NATURAL STOCKS: FOREST RESOURCES .............. 35
ANNEX 3. MEASURING RENEWABLE NATURAL STOCKS: FISH RESOURCES..................... 36
ANNEX 4. MEASURING BIODIVERSITY AND ECOSYSTEMS: LAND RESOURCES............... 38
ANNEX 5. MEASURING BIODIVERSITY AND ECOSYSTEMS: WILDLIFE RESOURCES ....... 40
ANNEX 6: MEASURING MATERIAL PRODUCTIVITY ................................................................. 42
Tables
Table 1. Green growth indicator set: OECD-proposed indicators to monitor the natural asset
base ................................................................................................................................ 21 Table 2. Structure of the material resource accounts ............................................................ 25
Figures
Figure 1. The hierarchy of measures used to assess progress ................................................ 17

7
Boxes
Box 1. The role of adequate information in natural resource management: the example of
fisheries ....................................................................................................................................... 10 Box 2. The Science Consistency Review (SCR) of the United States Forest Service ................. 14 Box 3. Environmental indicators and decision-making tools and processes ............................... 18 Box 4. Criteria for selecting environmental indicators ................................................................ 20 Box 5. Five categories of monitoring programmes ..................................................................... 23 Box 6. OECD Work on Material Flow Accounting .................................................................... 26 Box 7. Aarhus convention: main requirements............................................................................ 28 Box 8. What are the key points for Policy Dialogue? .................................................................. 30
8
KEY MESSAGES
Robust and up-to-date information and mechanisms to bridge the science-policy gap are essential
for optimising the decision-making regarding the management of natural capital.
A good understanding of the key characteristics of natural assets and
their change over time is a pre-requisite for sound economic decision-
making. In order to ensure that gathered data are suitable for decision-
making, technical experts and policy analysts have to engage in
dialogue and find mechanisms and products that work best to
translate technical knowledge into information that can support
decision-making.
Governments have a central role in supporting the development of environmental information
systems, within the wider frame of knowledge systems.
The actors within the natural resource knowledge system are both the
producers and consumers of data and information. These include:
local, regional and national level governmental agencies, private
sector actors, universities and other academic organizations, citizens’
organizations, etc. In order to make such systems operational,
governments need to link various data and information producers to
each other by encouraging data sharing and integration. Among
others, this includes developing and updating national strategies and
action plans for information management, investments in software
and hardware, providing methodological support and designating
bodies responsible for coordinating data collection and management
across agencies.
Indicators, when properly designed and tailored to context and user groups, provide important
information about trends in the availability and quality of natural resources, and progress towards
policy objectives.
Indicator sets are important tools used to facilitate communication,
mutual understanding, cooperation and learning between actors
within a knowledge system. The need to tailor indicators to specific
contexts calls for key actors to participate in indicator development,
thus ensuring not only ―buy in‖ but a shared understanding of the
meaning of the indicators. From their inception, indicators should be
linked to management and decision-making purposes, and matched to
the geographic and temporal scales in which they are needed. Besides
policy relevance, indicators have to meet a set of criteria in terms of
measurability and analytical soundness, and be based on transparent
and high quality data obtained at reasonable cost. To the extent
possible, indicators should provide a basis for international
comparisons while being well adapted to different national contexts.
9
Material resource, or flow, accounts provide decision-makers with distilled and highly relevant
information to guide policy-making for sustainable natural resources management.
Material flow analysis and resource productivity indicators can be
important tools for decision-makers, allowing them to monitor what
resources a country possesses, how the resource base is changing over
time, and where resources are directed, either in domestic
consumption or for export. The knowledge base on material flows
equips decision-makers in the endeavour of managing resources in a
sustainable manner, providing for more realistic planning over longer
time span and helping to anticipate and control the consequences of
decisions. Governments need to take steps towards developing
material accounts, such as conducting feasibility studies and pilot
programmes.
Effective knowledge systems in support of natural resource management require a culture of
openness and transparency in which stakeholders and citizens can easily access information.
Governance of natural resources across the world has undergone great
changes in recent decades, transitioning from a domain where
decision-making was limited to technical experts and policy makers,
to the exclusion of other stakeholders. There is now greater
recognition that pluralism in decision-making ensures better policy
acceptances and implementation, and serves for managing risks,
including financial risks stemming from liability regimes. In support
to this approach, governments should ensure timely access to
information and promote a culture of openness, transparency and
collaboration in its agencies.
Data gathering within governmental monitoring systems can be strengthened through their
continuous modernization and enhancement due to development and use of community-based
monitoring.
Governments can strengthen monitoring systems based on such
measures as regular assessment of current capacity and identification
of capacity development needs, establishing partnerships between
scientific institutions and communities, facilitating the introduction of
appropriate technologies for collaborative monitoring, and
establishing mechanisms for assimilating monitoring data into
decision-making at local and higher territorial-administrative scales.
Collaborative (participatory) monitoring programmes are in
increasing use because they have the potential to lower costs, enhance
the quantity of information, make use of and develop local
knowledge, and, most importantly, link monitoring information more
closely to local decision-making.

10
WHY ECONOMIC DECISIONS NEED ROBUST DATA ON NATURAL ASSETS?
Natural resources are indispensable for economic activity and human welfare. Their stocks are
part of the natural capital; they provide raw materials, energy carriers, water, air, land and soil, and
support the provision of environmental and social services that are necessary for developing other
forms of capital. The extraction and consumption of resources affects the quality of life and well-being
of both current and future generations.
Three key ingredients are needed for sustainable management of natural capital: (i) knowledge –
people need to know what to do and how to do it; (ii) commitment – people must want to do it; and
(iii) capacity – people need to be able to do it (Campbell, 2006). Usable knowledge in particular must
be available and flow freely through the resource governance system like money flows throughout an
economy.
Decision-makers need information to both predict the consequences of their decisions and to
retrospectively understand the causal relationships between their decisions and environmental and
economic outcomes in anticipation of future decisions and actions. In many cases, however, the
imperfect information about natural resource stocks (see Box 1) and the sheer complexity of
environmental and economic interrelationships overwhelms the capacity to make informed decisions
in the absence of well designed data gathering and information management systems.
Box 1. The role of adequate information in natural resource management: the example of fisheries
Due to the nature of the resource, fisheries management takes place against a backdrop of imperfect information. The size of the stock, its growth rates, and its relationship with other stocks are not known with precision. And even if they were known with precision, regulation of the sector is imperfect, particularly in some areas (i.e. high-
seas fisheries). In the face of imperfect information and control, precaution should be exercised since if thresholds are breached a stock can be fished into commercial extinction. Uncertainty about the status and dynamics of fish stocks may be considerable. In the North Sea eco-region, for example, the status of 8 species items (out of 27 in total) is uncertain or only partially known. The status of a further 16 species items is reported as “unknown”. This uncertainty complicates the task of fishery biologists when providing scientific advice for the management of fisheries.
Source: OECD (2008a).
Mistakes in decision-making, stemming from insufficient or faulty information, and, sometimes,
collected but meaningless information, have caused significant intertwined economic-environmental
disruptions (such as crashes of fisheries, decreased agricultural output, desertification, changes in
water flows and availability, to name a few) and have been associated with important costs. The costs
of unsustainable use of natural resources can be considerable. As pointed out by OECD (2008), this
will primarily include the direct costs associated with the loss of the resource in question. For instance,
exploiting a fish stock to economic extinction will result in the loss of commercial yields forever. This
can also have important indirect impacts on local communities and the wider economy. Given the
importance of some natural resources (e.g. water) to economic development, significant public
expenditures will be incurred to mitigate the welfare impacts of unsustainable resource exploitation.
And finally, there are likely to be a wide variety of costs associated with impacts on non-use values,
11
such as impacts on ecosystems which are not reflected in terms of impacts such as lost resource
productivity. An adequate knowledge base about a country’s natural capital and its evolution is
therefore central for optimising decisions on economic development and avoiding the costs of resource
degradation or loss.
Data on natural assets and environmental information more generally will serve multiple
purposes, including, most importantly, the following ones:
Ensuring adequate supplies of renewable and non-renewable resources to support economic
activities and growth;
Describing the state of resources (e.g. the availability, quality and accessibility of stocks)
and assessing economic and environmental pressures that stem from changes in their state;
Anticipating (identifying and quantifying) the impacts of economic decisions and human
actions on natural resources;
Setting evidence-based policy priorities and taking operational decisions on the
management of natural capital;
Identifying the need and measures in support to non-commercial environmental services;
Making various policy objectives coherent and integrating measures on sustainable
management of natural capital into economic and sectoral policies;
Ensuring transparency and accountability of decision-making; and
Measuring progress in policy implementation, and compliance with national law and
international obligations.
Analytical evidence on the role of natural capital is a key element for ensuring the ―green‖
transformation of current models of development. Such information needs to resonate both with
environmental and non-environmental communities and be part of a wider ―knowledge system‖. It
has to be mentioned that analytical evidence will have legitimacy only in the absence of political
interference in the knowledge production and communication process, and if sound methodologies,
transparency and integrity in the data production and disclosure chain, as well as mutual trust between
information producers and information consumers is secured (based on McNie, 2007).
12
HOW TO SUPPORT THE DEVELOPMENT OF “KNOWLEDGE SYSTEMS”?
The term ―knowledge system‖ refers to the heterogeneous, networked aggregation of
organizations, institutions, and individuals in the public and private sphere who collectively produce,
manage and utilize knowledge needed for natural resource management. Knowledge is inherently
diverse, coming in different forms (from technical, scientific knowledge to indigenous or local
knowledge of resources and resource uses) and based upon different foundations (from formal training
to informal experience and skill development). The actors in natural resource knowledge system
differ from country-to-country, but generally include political and policy agents, private companies,
civil society organizations, bureaucratic organizations, scientific organizations, development agencies,
local people and resource users.
Commonly, various actors within the natural resource knowledge system are both the producers
and consumers of data and information. Therefore, the functionality of the knowledge system
depends not only on the integrity and usability of knowledge within each of actor-oriented domains,
but on the linkages between them, i.e. the quality of the information flows, and the capacity of actors
to translate information from one domain to another. One of the key steps that government can take in
promoting cohesion and effectiveness in the knowledge system is to link the various data and
information sources to each other. Web-based catalogues of data sources can be a first step in
bringing a recognizable structure to informal knowledge systems that have grown from the bottom up
(UNECE, 2003). Launching more comprehensive initiatives such as the European Union’s (EU)
Shared Environmental Information System is a step further in this direction. While being most often
sector-specific, knowledge systems see an increasing cross-sectoral integration. Competent authorities
can facilitate such integration by developing a natural resource management knowledge strategy that is
consistent with national strategies for agricultural, forestry and other related research.
Furthermore, countries need to invest in advisory (extension) services that bring technical
expertise of natural resources management to rural communities and private resource owners. Towards
this end, national extension strategies can be developed and aim towards:
Assessing the knowledge needs of under-served resource owners and users;
Training natural resource professionals in the application and dissemination of best practices
in resource management and use;
Establishing extension subunits for particular resources, e.g. forestry extension, fisheries
extension, etc.
Such advisory services can be well linked to advice in specific economic sectors, e.g. agriculture,
as done in the United States or Australia. Very often, universities but also NGOs can play the role
national-level of knowledge hubs. In EECCA, the Regional Environmental Centres are aiming to
develop into such hubs, at the local, national, and regional scale. Several international organisations
active in the EECCA region both help in the establishment of extension services and provide such
services themselves through a combination of tools, including web-based clearing houses. Examples
of such organisations include the World Bank Institute, the Food and Agriculture Organization
(focusing on the land and natural resource management interface), or the International Energy Agency.
13
WHY AND HOW GOVERNMENTS SHOULD CLOSE THE SCIENCE-POLICY GAP?
One of the greatest problems in decision-making in EECCA is a limited use of information for
policy analysis or as a management tool more generally (OECD, 2007). To address this problem, a
key measure is to translate the often overly-technical (scientific) information into terms that are useful
for policy makers and can be communicated to the public. Generally, the comparative value of
information depends in part upon its appropriateness to the context, such as scale, in which it is used.
For instance, local forest managers will not be helped by aggregate statistics showing the increment of
forest growth for a country, requiring instead information on the increment of forest growth for their
management unit. In addition to matching the scale of decision-making, information must be provided
in an appropriate time frame for policy makers (McNie, 2007). Ultimately, the fit between knowledge
producers and decision-makers, can be judged by whether or not available information improves
decision-making.
Many environmental and natural resource problems (and, implicitly, decision processes) have the
qualities of ―wicked problems‖ that are characterized by a high degree of scientific uncertainty,
competing and incompatible values, an inability to predict the cumulative impacts of decisions and
actions, and the participation in the governance process of heterogeneous and often conflicting actors
(Turnpenny et al., 2009). A variety of strategies exist for managing the science-policy interface in the
face of such problems:
A linear and traditional approach is for technical experts to quantify uncertainties to the
extent possible and deliver the results of their analysis to decision-makers, who will decide
what to do with it. Often this approach masks uncertainties, creating instead a façade of
certainty that can lead to unforeseen and adverse consequences. For instance, estimating the
available catch of ocean fisheries is notoriously difficult. The creation of false certainties in
fisheries science used for decision-making have led to poor decisions, such as the catch
quotas that resulted in the collapse of the North Atlantic cod fishery.
A second approach is to build scientific consensus through institutional mechanisms that
integrate scientific knowledge through multi-disciplinary teams and produce “best of our
knowledge” information. The Intergovernmental Panel on Climate Change may be the most
well known example of an attempt to produce scientific consensus in a policy context
through institutional means. The drawbacks of this approach include a tendency to reproduce
previous consensus positions, thereby obscuring the range of scientific points of view and
unnecessarily limiting the options of decision makers (Turnpenny et al., 2009).
A third option is to openly acknowledge uncertainty and ignorance and also to embrace
the diversity of viewpoints and values that come into play in contested environmental and
natural resource issues. This is a ―deliberative‖ model, in which competing values and
scientific interpretations are acknowledged.

14
The concept of ―post-normal science‖ has been developed to denote attempts to apply
evidence to decision processes in which stakes are high and the need for decisions is urgent,
and scientific uncertainty is also high, and values are contested (Functowicz and Ravetz,
1994). Post-normal science allows for the integration of a variety of actors in the knowledge
production process, calling for an ―extended peer community‖ that includes local knowledge
as well as political and policy knowledge that scientific experts do not possess. The extended
peer community thus becomes a context within which the quality of scientific knowledge is
held against real world constraints and integrated with informal knowledge. The Forest
Stewardship Council, which certifies sustainable forestry around the world, uses the
extended peer community approach on its heterogeneous expert advisory panels that set
technical standards (Eden and Bear, 2010).
Decision-makers must bear in mind that when dealing with complex systems such as ecosystems
that scientists rarely come to absolute consensus, and that scientific knowledge evolves and changes as
a normal part of the scientific process. Given the inadequate state of empirical evidence regarding the
impact of human activity on nature, technical experts rarely can provide policymakers with
unambiguous advice about trade-offs among competing long-term goals. The uncertainties inherent in
the production of scientific knowledge may present problems for decision-makers, who seek certainty,
often under conditions of urgency. To escape this conundrum, policymakers, technical experts, and the
public must all share both knowledge and responsibility. Mechanisms for regular communication
need to be established through which decision makers and scientists have regular opportunities to
interact and develop trust-based relationships.
Allowing scientists to make uncertainties explicit and opening scientific advisory processes to
scrutiny and debate by stakeholders can further strengthen the credibility and legitimacy of the
information itself. For instance, the United States Forest Service has introduced a practice called the
Science Consistency Review (SCR) in order ensure that the best quality science is considered in
analysis and decision processes and documents in a transparent fashion (Box 2).
Box 2. The Science Consistency Review (SCR) of the United States Forest Service
Easily reproducible in other contexts due to the fact that it entails drawing on capacities commonly found in countries that have basic technical resource management expertise, SCR seeks to provide quality assurance for the technical input that goes into analytical and decision documents, aiming to determine whether the document has incorporated the “best available science” (Guldin et al., 2003), a standard that includes a consideration of scientific uncertainty when appropriate. The SCR consists of a two-stage review of analysis and decision documents, first at the draft and then at the final stage, allowing scientists to revise the scientific input to the documents in line with the SCR recommendations.
The SCR process requires answering the following questions:
o Has applicable and available scientific information been considered?
o Is the scientific information interpreted reasonably and accurately?
o Are the uncertainties associated with the scientific information acknowledged and documented?
o Have the relevant management consequences, including risks and uncertainties, been identified and documented?
Possible participants in the SCR process include technical experts with or without advanced academic degrees, though all reviewers must have “scientific credibility” in the context of the issues under consideration in the document that SCR will review. Reviewers can include persons “with local or traditional knowledge” when this is appropriate, as well as scientists from the private sector, consultancies, and civil society organizations.
Source: Guldin (2003).

15
Technical experts are rarely trained to understand the constraints and values inherent in policy
systems, nor are they trained in communication and information dissemination skills that are familiar
to most decision makers. In order for productive cooperation can occur it must be preceded by
learning across the science-policy divide.
In order to ensure that they have the information that they need when they need it, policy makers
must take a strategic approach to developing and funding environmental information systems in
anticipation of future information needs. In the absence of a proactive approach, urgent decisions may
not be met with the necessary information, leaving decision-makers to make choices in the face of
ignorance.
HOW TO DESIGN EFFECTIVE ENVIRONMENTAL INFORMATION SYSTEMS?
Information relevant for environmental and sustainable natural resources management can take
many forms. The term environmental information generally is interpreted to mean scientific data and
statistics that quantitatively describe environmental conditions and natural resources. However,
qualitative socio-economic and political information can also be grouped under environmental
information if it refers to factors that have a bearing on the environment and environmental decision-
making. Generally speaking, all information that pertains to the state and changes to the environment
as well as to predicting or understanding consequences of decision making on the environment count
as environmental information. Moving from raw data to information useful for decision-making
entails distilling the wealth of data into meaningful information through aggregation, organization and
communication strategies.
Information pertaining specifically to natural resources is generally contained within the broader
environmental information system (EIS) of a country. According to Simpson (2003), typically, such
systems include the following key elements:
Environmental monitoring (e.g. of various resources and environmental media);
Data transmission (via internet, phone, etc.);
Data reception and storage (automated, reprocessed or manual);
Data verification and validation, analysis and handling (through GIS, data management
systems, etc.);
Information interpretation and report generation (reports, indicators, etc.);
Information disclosure and dissemination (via web portals, television, the media, reports,
etc.);
Information use in decision-making (by government, citizens, researchers, NGOs, the
private sector, etc.).

16
An EIS requires planning and continuous improvement as systems themselves and information
and communication technologies develop. This includes consideration of an EIS’s institutional
structure, legal framework, data collection and management systems, information dissemination
strategies and mechanisms for supporting the use of information in decision-making. While all
EECCA countries have some form of EIS, significant gaps and weaknesses in these systems often
lead, as mentioned, to an underutilization of environmental information in decision-making (OECD,
2007).
In order to improve the effectiveness of their EISs, countries, where applicable, should:
Work on better understanding the demand for, and use of, information in order to make
environmental information systems more demand-driven and user-relevant so that they can
meet policy and operational needs;
Develop and/or review and revise national strategies and action plans for environmental
information systems;
Carry out methodological work and ensure a better quality control of information;
Rebalance efforts from collecting data to disseminating environmental information
(including through environmental indicators);
Build capacity on the communication end of information management;
Invest in technologies as needed, making sure that technologies and software used by
various governmental agencies are compatible and allow for easy data sharing and
integration; and
Work towards building an integrated data management system and establish governmental
bodies that coordinate data collection and management and aggregate data and ensure that
environmental information is translated into forms useful for policy makers and decision-
making.
There is a strong drive for extending the EU’s Shared Environmental Information System
(SEIS) to the EECCA region. SEIS is a collaborative initiative of the European Commission and the
European Environment Agency (EEA) to establish an integrated and shared EU-wide environmental
information system. This system would tie in better all existing data gathering and information flows
related to EU environmental policies and legislation. It will be based on technologies such as the
internet and satellite systems. The underlying aim of SEIS is also to move away from paper-based
reporting to a system where information is managed as close as possible to its source and made
available to users in an open and transparent way. According to the SEIS concept, environmentally-
related data and information will be stored in electronic databases throughout the EU. These databases
would be interconnected virtually and be compatible with each other. The proposed SEIS is a
decentralised but integrated web-enabled information system based on a network of public information
providers sharing environmental data and information.
17
WHAT ROLE INDICATORS PLAY?
Indicators have come into wide use in the past decades in order to measure environmental
performance, monitor and report on progress towards sustainable development and sustainable use
of natural resources. Indicators are used in planning, and setting policy objectives and priorities by
measuring parameters that describe an environmental state or phenomenon, with a significance
extending beyond that directly associated with a parameter value. Indicators are usually aggregated
into indicator sets and may be integrated into indices.
Indicators may be particularly useful in integrating environmental and sectoral and general
economic policies, ensuring that environmental considerations are taken account of in other policy
domains (OECD, 2005). In the area of natural resources where sustainability issues are paramount, a
well-established and integrated indicator framework can help policy makers more accurately assess the
real short to long-term contributions that resources can make to economic development, as well as to
avoid policy blunders such as failing to account for resource depletion in economic and fiscal
planning.
Indicators represent the analysis, aggregation and organization of data, with indices as summary
indicators that distil highly complex realities. All indices, as well as indicators, have strengths and
weaknesses and are only as good as the data that go into them, including the timeliness of data. They
provide ―snapshots‖ of reality, allowing decision-makers to track trends and helping them set priorities
and estimate the consequences of decisions.
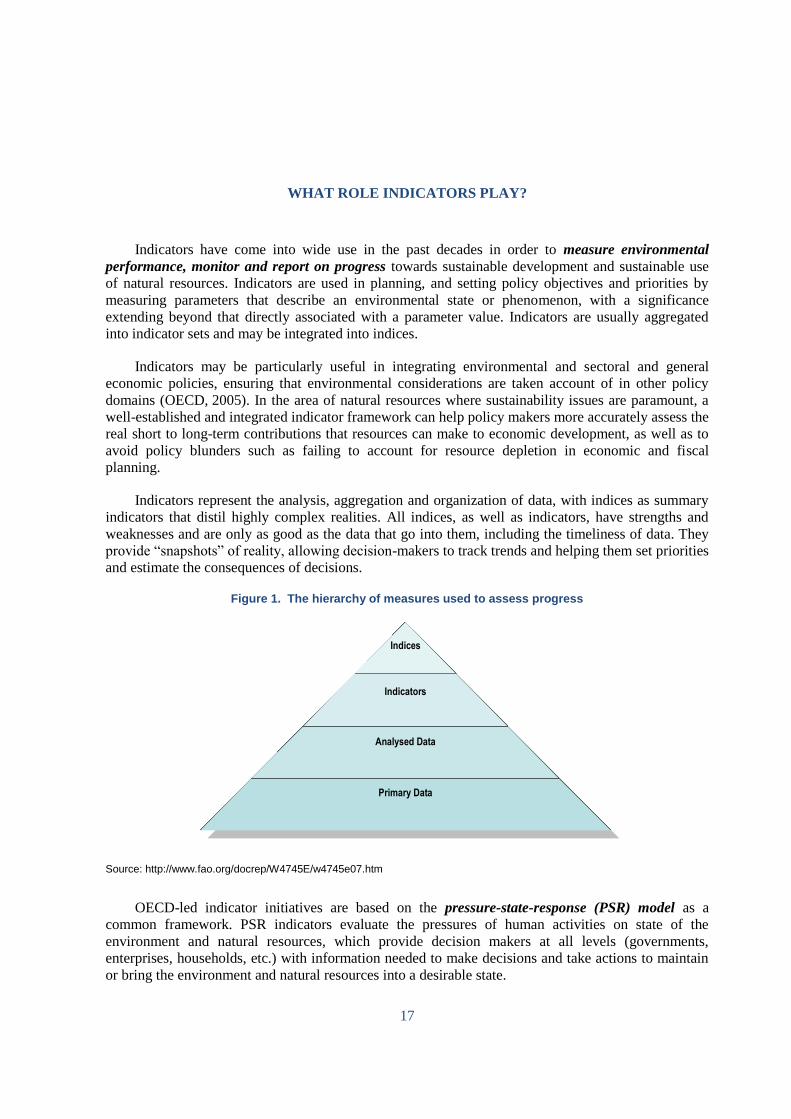
Figure 1. The hierarchy of measures used to assess progress
Source: http://www.fao.org/docrep/W4745E/w4745e07.htm
OECD-led indicator initiatives are based on the pressure-state-response (PSR) model as a
common framework. PSR indicators evaluate the pressures of human activities on state of the
environment and natural resources, which provide decision makers at all levels (governments,
enterprises, households, etc.) with information needed to make decisions and take actions to maintain
or bring the environment and natural resources into a desirable state.
Indices
Indicators
Analysed Data
Primary Data

18
Box 3. Environmental indicators and decision-making tools and processes
UNDERLYING DATA SETSUNDERLYING DATA SETS
•• Results / achievements
• Objectives
• Targets,
commitments
• Aims, goals
ENVIRONMENTALENVIRONMENTAL
PERFORMANCE INDICATORSPERFORMANCE INDICATORS
•• Core and key indicators
• Sectoral indicators
ENVIRONMENTAL INDICATORSENVIRONMENTAL INDICATORS
context
interpretation
MEASURING PERFORMANCE
ANALYSING POLICIES
EVALUATION TOOL
context
interpretationREPORTING TOOL
MONITORING TOOL
MEASURING PROGRESS
link to
Source : OECD (2004), Measuring What Matters. OECD, Paris.
When using environmental indicators in analysis and evaluation, the OECD and its Member
countries apply the following commonly agreed upon principles:
Only one tool: Indicators are not designed to provide a full picture of environmental issues,
but rather to help reveal trends and draw attention to phenomena or changes that require
further analyses and possible action. Indicators are thus only one tool for evaluation;
scientific and policy-oriented interpretation is required for them to acquire their full
meaning. They need to be supplemented by other qualitative and scientific information,
particularly in explaining driving forces behind indicator changes which form the basis for
an assessment. One should also note that some topics do not lend themselves to evaluation
by quantitative measures or indicators;
The appropriate context: Indicators’ relevance varies by country and by context. They must
be reported and interpreted in the appropriate context, taking into account countries’
different ecological, geographical, social, economic and institutional features;
Cross-country comparison and standardisation: Most OECD indicators focus on the
national level and are designed to be used in an international context. This implies not only
nationally aggregated indicators, but also an appropriate level of comparability among
countries. There is no single method of standardisation for the comparison of environmental
indicators across countries. The outcome of the assessment depends on the chosen
denominator (e.g. GDP, population, land area) as well as on national definitions and
measurement methods. It is therefore appropriate for different denominators to be used in
parallel to balance the message conveyed. In some cases absolute values may be the
appropriate measure, for example when international commitments are linked to absolute
values. Moreover, the choice of the initial level of an environmental pressure and of the time
period considered can affect the interpretation of the results, because countries do proceed
according to different timetables.
19
Level of aggregation: Within a country a greater level of detail or breakdown may be
needed, particularly when indicators are to support sub-national or sectoral decision making.
This is important, for example, when dealing with river basin or ecosystem management,
when using indicators describing drivers which are relevant at the local level, or when
national indicators hide major regional differences. The actual measurement of indicators at
these levels is encouraged and lies within the responsibility of individual countries. At these
levels, however, comparability problems may be further exacerbated;
Measurability and data quality: Measurability issues such as the quality of underlying data
are important in the use of environmental indicators, and must be taken into account to avoid
misinterpretation. Measurability and data quality vary greatly among individual indicators.
Some indicators are immediately measurable, others need additional efforts before they can
be published and used. For example, most indicators of societal responses have a shorter
history than indicators of environmental pressures and many indicators of environmental
conditions, and some are still in development both conceptually and in terms of data
availability.
Indicators can be a tool used to facilitate communication, mutual understanding and learning
between groups of organizations and people making up the natural resource knowledge system within
a given country. The need to tailor indicators to specific contexts allows the full range of policy actors
to participate in their development, thus ensuring not only ―buy in‖ but a shared understanding of the
meaning of the indicators that come into use for decision-making.
Indicator development processes can take various forms but should include some common
elements (adapted from Gutierrez-Espeleta, n.d.):
Identifying the users of indicators and the purposes to which indicators will be put;
Providing for the representation of the relevant stakeholders in the indicator development
process;
Developing a conceptual framework by identifying the aspects of the issue under
consideration from the perspectives of the various stakeholders;
Assessing the suitability of existing data, collecting additional data, and ensuring the
consistency of data to produce proposed indicators;
Ensuring the analytical soundness of the proposed indicators through expert review and the
policy relevance of the proposed indicators through review by the stakeholder group;
Revising the proposed indicators.
While indicators should be developed locally and with the participation of relevant stakeholders,
there are some generally agreed upon criteria for choosing environmental indicators in order to
ensure that they are ultimately usable and effective for the purposes for which they are intended. Three
basic criteria are used in OECD work: policy relevance and utility for users, analytical soundness, and
measurability (Box 3). The criteria presented in the box below describe the ―ideal‖ indicator; not all of
them will be met in practice.

20
Box 4. Criteria for selecting environmental indicators
POLICY RELEVANCE
AND
UTILITY FOR USERS
An environmental indicator should:
Provide a representative picture of environmental conditions, pressures on the environment
or society’s responses;
Be simple, easy to interpret and able to show trends over time;
Be responsive to changes in the environment and related human activities;
Provide a basis for international comparisons;
Be either national in scope or applicable to regional environmental issues of national
significance;
Have a threshold or reference value against which to compare it, so that users can assess
the significance of the values associated with it.
ANALYTICAL
SOUNDNESS
An environmental indicator should:
Be theoretically well founded in technical and scientific terms;
Be based on international standards and international consensus about its validity;
Lend itself to being linked to economic models, forecasting and information systems.
MEASURABILITY The data required to support the indicator should be:
Readily available or made available at a reasonable cost/benefit ratio;
Adequately documented and of known quality;
Updated at regular intervals in accordance with reliable procedures.
Source: OECD (1993).
WHAT INDICATORS COULD BE USED FOR NATURAL RESOURCES MANAGEMENT?
As part of its work on green growth indicators (OECD, 2011), OECD has proposed themes,
areas, and indicators to monitor the natural asset base (see Table 1 and Annexes 1-5). Other
international organisations, such as the European Environmental Agency, UNECE, or UNEP have
conducted similar work often in close cooperation with OECD. Indicators proposed in the framework
of intergovernmental dialogue can serve to countries as guideposts during the indicator development
processes. Within this process, indicators depicting renewable and non-renewable stocks of natural
resources need to be ―complemented with indicators on the sustainable use of biodiversity as a
resource, and on habitat alteration. They should be read in connection with information on the density
of population and human activities (OECD, 2005). For instance, resource productivity indicators (see
Annex 6) are a useful complement to indicators of the natural asset base, and the other way around.
21
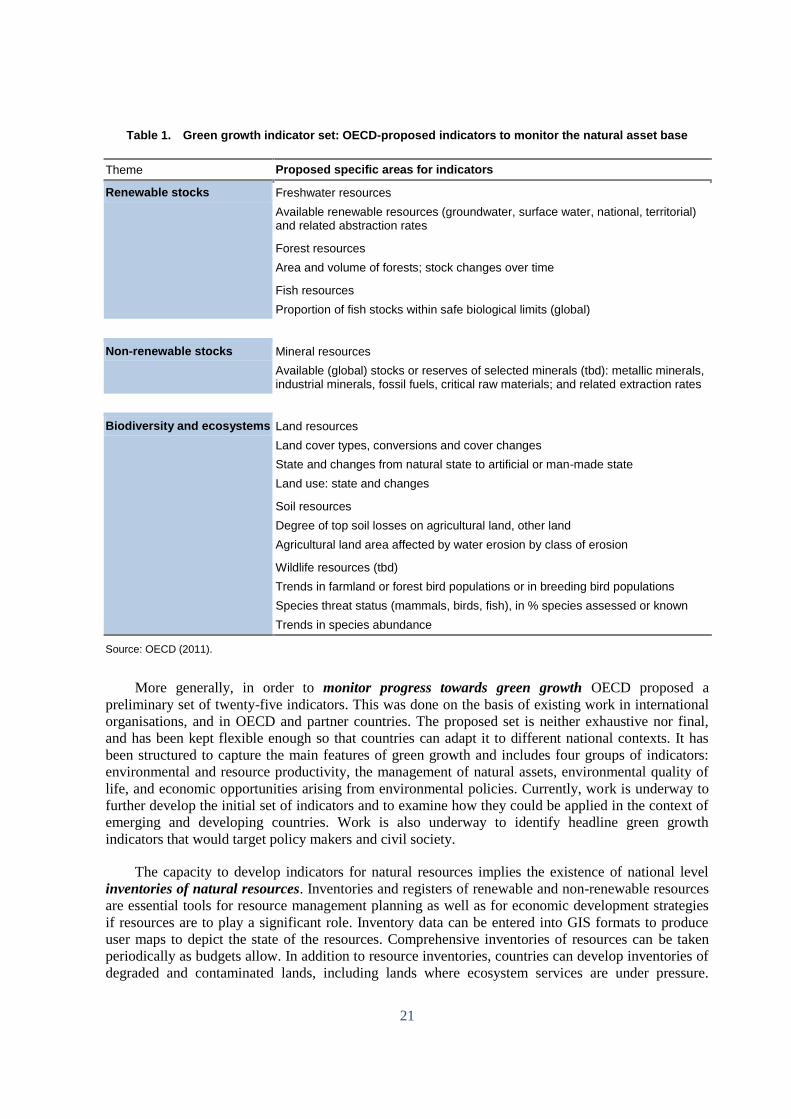
Table 1. Green growth indicator set: OECD-proposed indicators to monitor the natural asset base
Theme Proposed specific areas for indicators
Renewable stocks Freshwater resources
Available renewable resources (groundwater, surface water, national, territorial) and related abstraction rates
Forest resources
Area and volume of forests; stock changes over time
Fish resources
Proportion of fish stocks within safe biological limits (global)
Non-renewable stocks Mineral resources
Available (global) stocks or reserves of selected minerals (tbd): metallic minerals, industrial minerals, fossil fuels, critical raw materials; and related extraction rates
Biodiversity and ecosystems Land resources
Land cover types, conversions and cover changes
State and changes from natural state to artificial or man-made state
Land use: state and changes
Soil resources
Degree of top soil losses on agricultural land, other land
Agricultural land area affected by water erosion by class of erosion
Wildlife resources (tbd)
Trends in farmland or forest bird populations or in breeding bird populations
Species threat status (mammals, birds, fish), in % species assessed or known
Trends in species abundance
Source: OECD (2011).
More generally, in order to monitor progress towards green growth OECD proposed a
preliminary set of twenty-five indicators. This was done on the basis of existing work in international
organisations, and in OECD and partner countries. The proposed set is neither exhaustive nor final,
and has been kept flexible enough so that countries can adapt it to different national contexts. It has
been structured to capture the main features of green growth and includes four groups of indicators:
environmental and resource productivity, the management of natural assets, environmental quality of
life, and economic opportunities arising from environmental policies. Currently, work is underway to
further develop the initial set of indicators and to examine how they could be applied in the context of
emerging and developing countries. Work is also underway to identify headline green growth
indicators that would target policy makers and civil society.
The capacity to develop indicators for natural resources implies the existence of national level
inventories of natural resources. Inventories and registers of renewable and non-renewable resources
are essential tools for resource management planning as well as for economic development strategies
if resources are to play a significant role. Inventory data can be entered into GIS formats to produce
user maps to depict the state of the resources. Comprehensive inventories of resources can be taken
periodically as budgets allow. In addition to resource inventories, countries can develop inventories of
degraded and contaminated lands, including lands where ecosystem services are under pressure.
22
Again, GIS technology allows for user-friendly representation of the data. Inventories of both
resources and degraded lands should be made available to the public through web portals.
Data may abound without being put to optimal use in decision-making for many reasons, such as:
Indicators are not tied in advance to a management or decision-making purpose, but rather
are first developed and then go in search of utility;
Indicators are chosen and designed without the participation of users, resulting in a poor fit
between the indicators and the needs and capacities of users; and
Indicators are not matched to the temporal and special scale at which they are needed.
(McElfish and Varnell, 2006)
These pitfalls can be avoided by careful attention to the indicator design process, which should
involve decision-makers in management with scientists and other technical experts responsible for
data collection, organization and representation.
HOW TRADITIONAL MONITORING PROGRAMMES COULD BE ENHANCED?
Regular monitoring of changes in the status of natural resources is essential to producing policy
and management relevant information. Monitoring can be defined as ―gathering, assessing and
reporting environmental information obtained through continuous or periodic sampling, observation
and analysis of both natural variation or changes and anthropogenic pressures and their effects on
humans and the environment‖ (OECD, 1999). In other words, monitoring of resources is the
observation of changes in the quantity and quality of resources by making comparable observations of
the same resources and locations at different times.
Monitoring of resources provides managers and decision makers with the information they need
in order to ensure the sustainable use of resources and to design policy changes and management
interventions when the natural resource base deteriorates. However, monitoring programmes tend to
be expensive and challenging to coordinate and maintain over time. Typical monitoring programmes
rely on experts employed by governmental agencies with little connection to localities where resource
decisions are often made. In developed and increasingly also in developing countries, involving
citizens in monitoring programmes has become a common practice, lowering costs and establishing a
closer relationship between monitoring and local decision-making (Danielsen et al., 2007 and 2008).
Post-Soviet countries inherited often extensive, expert-dominated environmental monitoring
systems developed in the Soviet era that produced relatively reliable data and reports though for a
limited number of officials. Over the last two decades, several international partners (including EEA,
OECD, UNEP, and UNECE) have assisted EECCA countries in defining indicators and setting up
modern environmental information systems as a part of the transition process and in an effort to
encourage environmental awareness and public support for responsible decision-making in regards to
the environment. Despite such joint efforts, progress in environmental monitoring has been mixed. In
most cases, existing observation networks have not been reviewed since their creation decades ago and
do not meet the requirements of current national regulations. Current monitoring approaches need to
be enriched with more collaborative ones (see Box 4 below).

23
Collaborative, or participatory, monitoring programmes are increasingly applied because they
have the potential to lower costs, enhance the quantity of information, tap into local knowledge,
expand the capacity to obtain data and link monitoring information more closely to local decision-
making. Increasingly, GIS technologies are being used in ―participatory mapping‖ processes around
the world, providing a powerful tool for organizing local knowledge, integrating it with scientific
knowledge, and applied to development planning and natural resources management (Tripathi and
Bhattarya, 2004).
Box 5. Five categories of monitoring programmes
Monitoring programmes fall along a spectrum from entirely externally driven and expert executed to autonomous local monitoring done by local people (see Box 4). In between are a range of collaborative monitoring approaches.
o Category 1: Externally driven and professionally executed programmes in which scientists from governmental
agencies conduct large-scale monitoring such as forest inventories and remote sensing of forest land;
o Category 2: Externally driven programmes with local data collectors, in which technical experts design,
analyze and interpret results but local people or outside volunteers conduct most of all of the data collection, such as in bird censuses conducted in North America and monitoring of wildlife populations through hunter records;
o Category 3: Collaborative monitoring with external data interpretation in which citizens participate in data
collection and local management decision making, but in which the design of the monitoring programme and data analysis are undertaken by technical experts;
o Category 4: Collaborative monitoring with local data interpretation in which citizens collect and analyze data
and drive management decisions but external technical experts provide guidance and advice and may be called upon to conduct further analysis. This approach fits into community-based land and resource management schemes, which are increasingly popular in developed and developing countries;
o Category 5: Autonomous local monitoring in which citizens control the entire monitoring programme, from
design through to interpretation and application in local decision-making. This approach is usually a part of customary and traditional management practices of indigenous people and private landowners.
Source: Danielsen et al., (2008).
Collaborative monitoring schemes have proliferated in North America and some developing
countries and are now beginning to appear in Europe. The Biodiversity Information and Monitoring
Scheme for Northern Portugal (SIMBioN), for example engages all relevant stakeholders in a
biodiversity monitoring process that harmonizes the methodology of data collection, integrates data
management and access, provides for interoperability between organizations along horizontal and
vertical axes, and complies with international reporting requirements. Collaborative work between
stakeholders—including governmental agencies, companies, non-governmental organizations and
universities, research centres and other scientific organizations—seeks to harmonize monitoring
processes, create standardized data collection, management and dissemination protocols, and capacity
building within the monitoring structure (Guerra et al., 2010).
Governments can support monitoring capacity development by:
Assessing current monitoring capacity and needs;
Identifying low-cost opportunities for developing pilot collaborative monitoring projects;
24
Establishing partnerships between scientific institutions and communities;
Facilitating the introduction of appropriate technologies for collaborative and community-
based natural resource monitoring; and
Establishing mechanisms for assimilating monitoring data into decision-making.
HOW RESOURCE ACCOUNTS COULD BE USED?
Resource accounts provide decision-makers with information on the stocks and flows of
resources. Resource accounting is becoming increasingly sophisticated and common as governments
realize that that unanticipated declines in non-renewable resources and unsustainable exploitation of
renewable resources can produce economic dislocations, especially in resource rich nations.
A very good example is Norway where natural resource accounting was seen as an important
tool for the management of the country’s natural capital. Starting from 1978, Statistics Norway was
given the task of developing such accounts for the country. In the initial phase of resource accounting
in Norway, considerable efforts were made to establish resource accounts for a large number of natural
resources and environmental issues (Alfson and Greaker, 2007). Thus, accounts were developed for:
energy, minerals, sand and gravel, forests, fish, land use, fresh water, air pollution and waste. The
accounts were kept in physical units and regarding the material resources, consisted of three parts
covering 1) reserves or capital accounts, 2) extraction, conversion and trade accounts, and 3) end use
accounts of the resources. By "reserves" is meant discovered resources that are economically
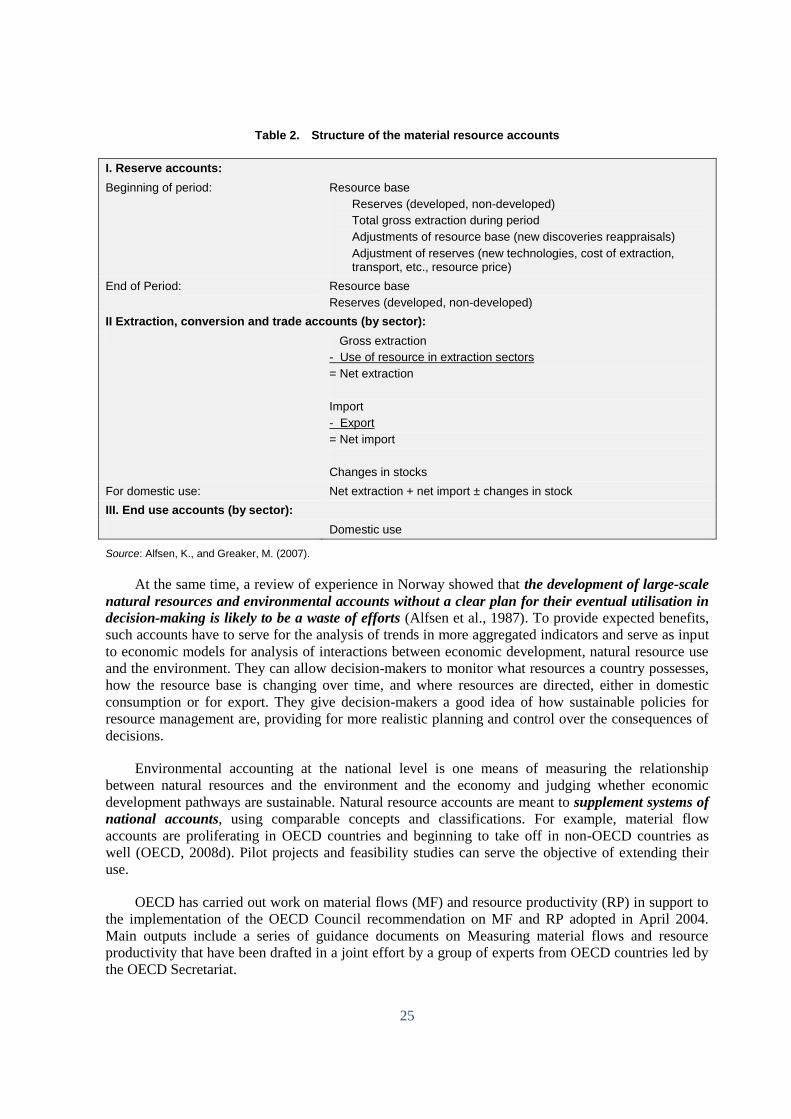
extractable with today's technology. Table 2 depicts the structure of those resource accounts. These
accounts have been held in both physical units as well as monetary ones, where possible. Most of the
natural resources and environmental accounts were established by utilizing already collected
information and existing statistics in Statistics Norway.
25
Table 2. Structure of the material resource accounts
I. Reserve accounts:
Beginning of period: Resource base
Reserves (developed, non-developed)
Total gross extraction during period
Adjustments of resource base (new discoveries reappraisals)
Adjustment of reserves (new technologies, cost of extraction, transport, etc., resource price)
End of Period: Resource base
Reserves (developed, non-developed)
II Extraction, conversion and trade accounts (by sector):
Gross extraction
- Use of resource in extraction sectors
= Net extraction
Import
- Export
= Net import
Changes in stocks
For domestic use: Net extraction + net import ± changes in stock
III. End use accounts (by sector):
Domestic use
Source: Alfsen, K., and Greaker, M. (2007).
At the same time, a review of experience in Norway showed that the development of large-scale
natural resources and environmental accounts without a clear plan for their eventual utilisation in
decision-making is likely to be a waste of efforts (Alfsen et al., 1987). To provide expected benefits,
such accounts have to serve for the analysis of trends in more aggregated indicators and serve as input
to economic models for analysis of interactions between economic development, natural resource use
and the environment. They can allow decision-makers to monitor what resources a country possesses,
how the resource base is changing over time, and where resources are directed, either in domestic
consumption or for export. They give decision-makers a good idea of how sustainable policies for
resource management are, providing for more realistic planning and control over the consequences of
decisions.
Environmental accounting at the national level is one means of measuring the relationship
between natural resources and the environment and the economy and judging whether economic
development pathways are sustainable. Natural resource accounts are meant to supplement systems of
national accounts, using comparable concepts and classifications. For example, material flow
accounts are proliferating in OECD countries and beginning to take off in non-OECD countries as
well (OECD, 2008d). Pilot projects and feasibility studies can serve the objective of extending their
use.
OECD has carried out work on material flows (MF) and resource productivity (RP) in support to
the implementation of the OECD Council recommendation on MF and RP adopted in April 2004.
Main outputs include a series of guidance documents on Measuring material flows and resource
productivity that have been drafted in a joint effort by a group of experts from OECD countries led by
the OECD Secretariat.
26
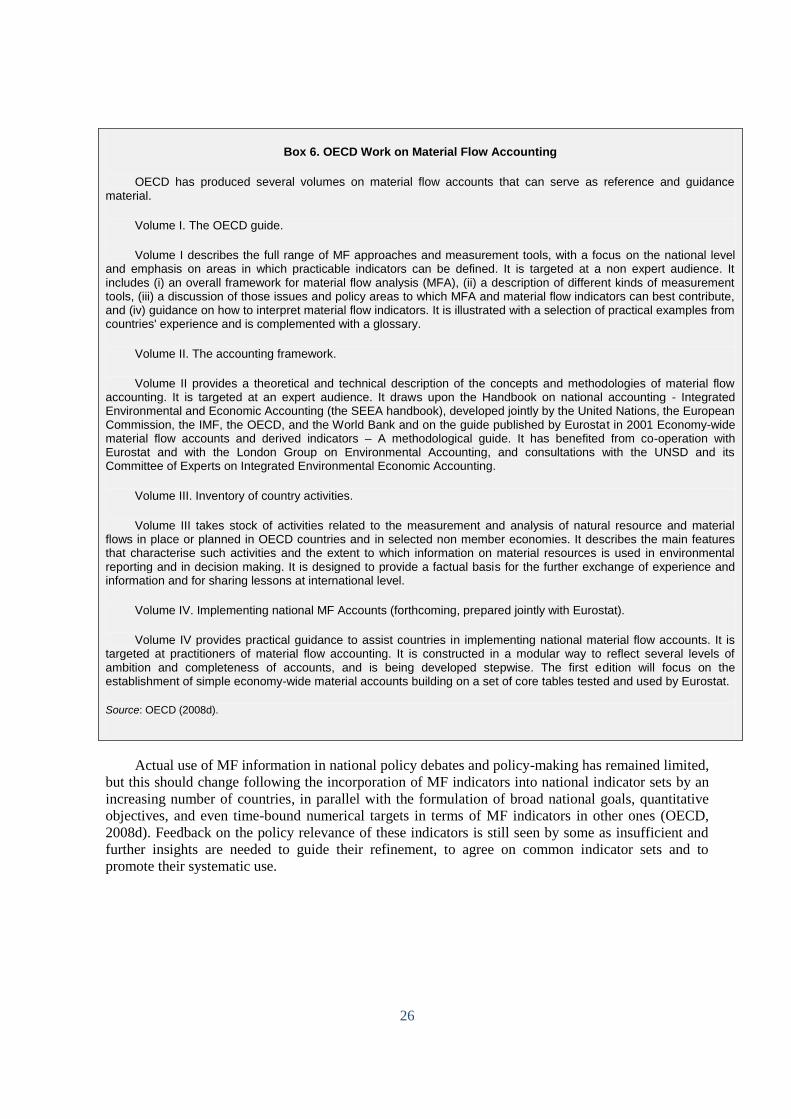
Box 6. OECD Work on Material Flow Accounting
OECD has produced several volumes on material flow accounts that can serve as reference and guidance material.
Volume I. The OECD guide.
Volume I describes the full range of MF approaches and measurement tools, with a focus on the national level and emphasis on areas in which practicable indicators can be defined. It is targeted at a non expert audience. It includes (i) an overall framework for material flow analysis (MFA), (ii) a description of different kinds of measurement tools, (iii) a discussion of those issues and policy areas to which MFA and material flow indicators can best contribute, and (iv) guidance on how to interpret material flow indicators. It is illustrated with a selection of practical examples from countries' experience and is complemented with a glossary.
Volume II. The accounting framework.
Volume II provides a theoretical and technical description of the concepts and methodologies of material flow accounting. It is targeted at an expert audience. It draws upon the Handbook on national accounting - Integrated Environmental and Economic Accounting (the SEEA handbook), developed jointly by the United Nations, the European Commission, the IMF, the OECD, and the World Bank and on the guide published by Eurostat in 2001 Economy-wide material flow accounts and derived indicators – A methodological guide. It has benefited from co-operation with Eurostat and with the London Group on Environmental Accounting, and consultations with the UNSD and its Committee of Experts on Integrated Environmental Economic Accounting.
Volume III. Inventory of country activities.
Volume III takes stock of activities related to the measurement and analysis of natural resource and material flows in place or planned in OECD countries and in selected non member economies. It describes the main features that characterise such activities and the extent to which information on material resources is used in environmental reporting and in decision making. It is designed to provide a factual basis for the further exchange of experience and information and for sharing lessons at international level.
Volume IV. Implementing national MF Accounts (forthcoming, prepared jointly with Eurostat).
Volume IV provides practical guidance to assist countries in implementing national material flow accounts. It is targeted at practitioners of material flow accounting. It is constructed in a modular way to reflect several levels of ambition and completeness of accounts, and is being developed stepwise. The first edition will focus on the establishment of simple economy-wide material accounts building on a set of core tables tested and used by Eurostat.
Source: OECD (2008d).
Actual use of MF information in national policy debates and policy-making has remained limited,
but this should change following the incorporation of MF indicators into national indicator sets by an
increasing number of countries, in parallel with the formulation of broad national goals, quantitative
objectives, and even time-bound numerical targets in terms of MF indicators in other ones (OECD,
2008d). Feedback on the policy relevance of these indicators is still seen by some as insufficient and
further insights are needed to guide their refinement, to agree on common indicator sets and to
promote their systematic use.

27
WHY ACCESS TO INFORMATION IS IMPORTANT?
Worldwide, governments’ increased attention to strengthening their relations with citizens is the
result of a changed context for policy-making (OECD, 2001). Important factors that drive demand are
the increasing globalization, with its positive and negative consequences, and the increasing
complexity of policy issues, with society and markets expecting that more and more areas be
addressed in greater detail. Many issues, natural resource management in particular, surpass
administrative frontiers. This requires cooperation across multiple levels of government. Furthermore,
government’s limited resources make it difficult to ensure policy-making and implementation on its
own. In the midst of this complexity, citizens perceive their influence through voting to be declining
and with it their trust in government.
Ongoing interaction among government and citizens can help to address the above mentioned
problems. To this end, governments need to (OECD, 2001):
Disclose information: This can be done pro-actively or upon citizens’ demand. In both
cases, information flows essentially in one direction, from the government to citizens.
Examples are access to public records, official gazettes, and government web sites;
Consult the public: This involves seeking and receiving citizens’ feedback that creates a
limited two-way relationship between government and citizens. Examples are comments on
draft legislation, and public opinion surveys;
Allow for active public participation: This means that citizens actively engage in decision-
making and policy-making, for instance by proposing policy options. Engaging citizens in
policy-making is an advanced two-way relation between government and citizens based on
the principle of partnership. Examples are open working groups and policy dialogue
processes.
All these tools provide governments with a better basis for policy-making and ensure risk
management (including financial risk management stemming from liability regimes), as well as a
more effective policy implementation, as citizens become less opposed to the decisions and policies
adopted with their involvement. By building trust in government and better public policies,
strengthening government-citizen relations enhances the legitimacy of government.
Similarly to other domains, governance of natural resources throughout the world has undergone
great changes in recent decades, transitioning from a domain with decision-making limited to technical
experts and policy makers to a contested arena of multiple values and stakeholders who expect both
access to information and participation in decision-making. Nothing represents this change more
clearly than the Aarhus Convention on Access to Information, Public Participation in Decision-
Making and Access to Justice in Environmental Matters (Box 6), which extends across the UNECE
region and includes most EECCA countries as signatories. The impetus for the Aarhus Convention lies
not only in the recognition that an informed public and informed stakeholder groups are essential for
good governance, but that public and stakeholder participation is needed to assure the quality of
decisions and contribute to the implementation of policies.

28
Box 7. Aarhus convention: main requirements
Designed to produce profound changes in how natural resources and the environment are governed in the UNECE region, the Aarhus Convention requires that parties to the Convention inform the public of environmental information held by government, and to make information continuously more accessible to the public through, for instance, electronic databases. Public authorities are required to supply environmental information to the public upon request as quickly as possible and at least within one month of the request unless the governmental body chooses to deny the request for information on the basis of various exemptions, such as to protect intellectual property or national security.
Currently there are some 30 Aarhus Centres throughout the EECCA region and Southeastern Europe as support institutions for the implementation of the Convention. Of these, only four are financed by ministries of the environment, while others are supported by the Organization for Security and Co-operation in Europe (OSCE) (Atkinson and Ni, 2009). Governments should consider including Aarhus Centres as budgetary items, thereby assuming more control over and responsibility for successful implementation of the Convention in their jurisdictions.
Source: www.unece.org
While all parties to the Aarhus Convention have made progress towards implementation,
concerns remain. In particular, cases brought before the Compliance Committee of the Convention
from the EECCA region often involve liberal interpretations of the exemptions to the obligation to
disclose information, resulting in unjustified refusals. In the case of some countries, the law does not
clearly define the concept of commercial or industrial secrets, thereby allowing governmental
authorities to make ad hoc decisions to deny access to information (Medarova and Antypas, 2006). In
other cases, authorities make blanket refusals where only parts of the information requested by the
public falls under relevant exemptions rather than separating the information and disclosing as much
as possible. Other challenges in implementing the Aarhus Convention include a lack of clarity of what
constitutes environmental information held by governmental bodies outside of Ministries of the
Environment. For instance, transportation projects often have profound impacts on natural resources
and the environment, but because they are managed by ministries other than environment ministries,
information regarding these projects may not be classified as environmental information and therefore
not disclosed to the public upon request (Antypas, 2003).
Some governments are moving to further open access to environmental information. For instance,
in March 2009, the Czech government amended its legal framework for access to environmental
information to make access to government held spatial information in the form of maps to the public,
with no need for an application or payment to browse (Epractice, 2010).
29
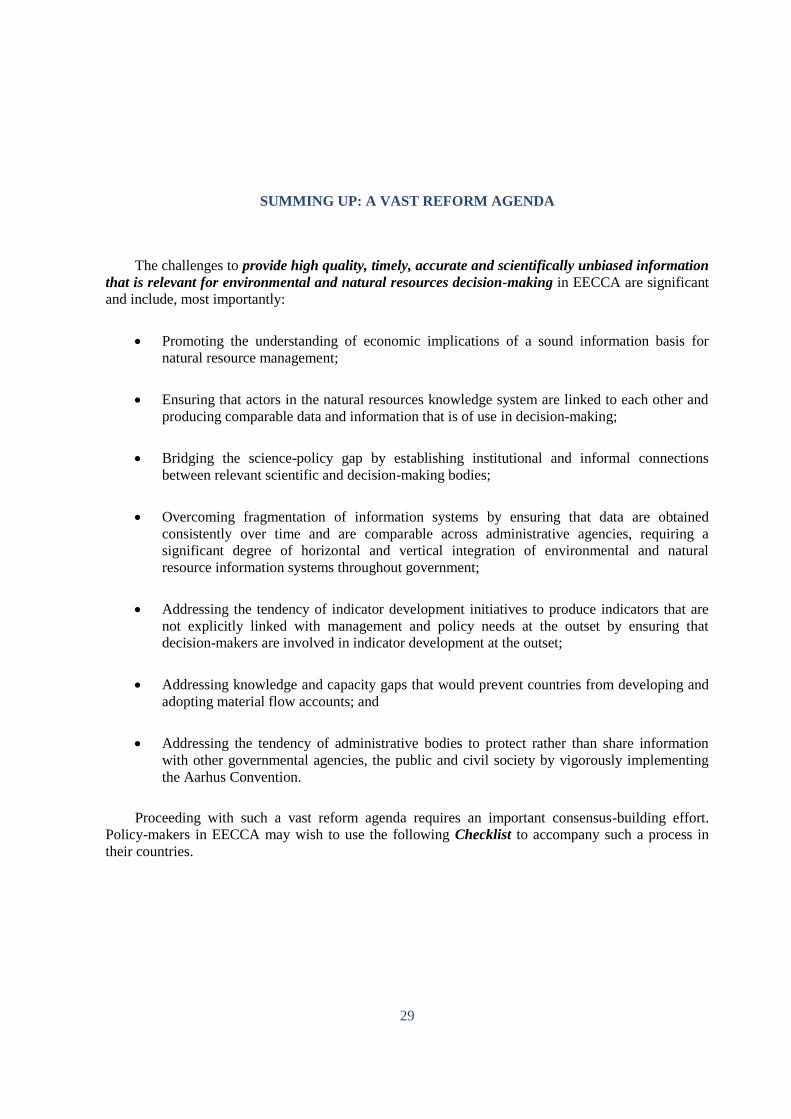
SUMMING UP: A VAST REFORM AGENDA
The challenges to provide high quality, timely, accurate and scientifically unbiased information
that is relevant for environmental and natural resources decision-making in EECCA are significant
and include, most importantly:
Promoting the understanding of economic implications of a sound information basis for
natural resource management;
Ensuring that actors in the natural resources knowledge system are linked to each other and
producing comparable data and information that is of use in decision-making;
Bridging the science-policy gap by establishing institutional and informal connections
between relevant scientific and decision-making bodies;
Overcoming fragmentation of information systems by ensuring that data are obtained
consistently over time and are comparable across administrative agencies, requiring a
significant degree of horizontal and vertical integration of environmental and natural
resource information systems throughout government;
Addressing the tendency of indicator development initiatives to produce indicators that are
not explicitly linked with management and policy needs at the outset by ensuring that
decision-makers are involved in indicator development at the outset;
Addressing knowledge and capacity gaps that would prevent countries from developing and
adopting material flow accounts; and
Addressing the tendency of administrative bodies to protect rather than share information
with other governmental agencies, the public and civil society by vigorously implementing
the Aarhus Convention.
Proceeding with such a vast reform agenda requires an important consensus-building effort.
Policy-makers in EECCA may wish to use the following Checklist to accompany such a process in
their countries.
30
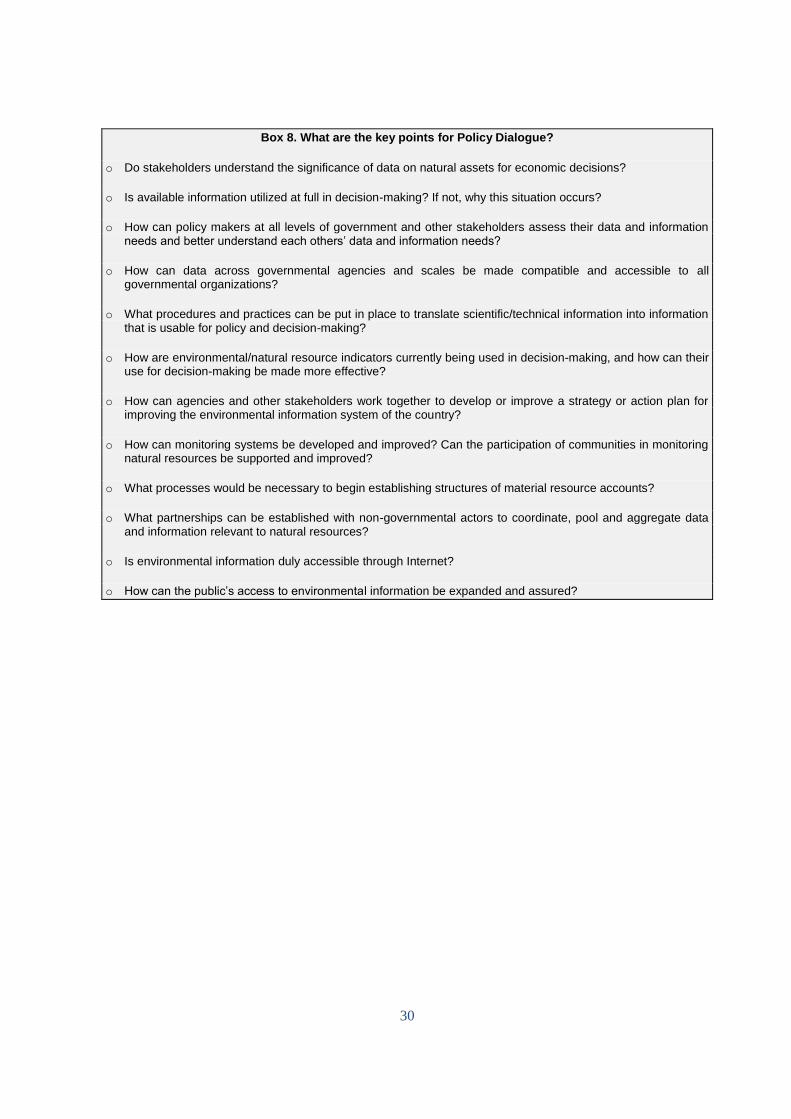
Box 8. What are the key points for Policy Dialogue?
o Do stakeholders understand the significance of data on natural assets for economic decisions?
o Is available information utilized at full in decision-making? If not, why this situation occurs?
o How can policy makers at all levels of government and other stakeholders assess their data and information needs and better understand each others’ data and information needs?
o How can data across governmental agencies and scales be made compatible and accessible to all governmental organizations?
o What procedures and practices can be put in place to translate scientific/technical information into information that is usable for policy and decision-making?
o How are environmental/natural resource indicators currently being used in decision-making, and how can their use for decision-making be made more effective?
o How can agencies and other stakeholders work together to develop or improve a strategy or action plan for improving the environmental information system of the country?
o How can monitoring systems be developed and improved? Can the participation of communities in monitoring natural resources be supported and improved?
o What processes would be necessary to begin establishing structures of material resource accounts?
o What partnerships can be established with non-governmental actors to coordinate, pool and aggregate data and information relevant to natural resources?
o Is environmental information duly accessible through Internet?
o How can the public’s access to environmental information be expanded and assured?

31
REFERENCES AND SELECTED BIBLIOGRAPHY
Antypas, A. (2003). A New Age for Environmental Democracy: The Aarhus Convention in Hungary.
Environmental Liability Vol. 11 (6).
Atkinson, R., and Ni, V. (2009). Aarhus Centres Guidelines. OSCE.
Campbell, A. (2006). The Australian Natural Resource Management Knowledge System. Canberra:
Land and Water Australia.
Danielsen, F. et al. (2007). Increasing Conservation Management Action by Involving Local People in
Natural Resource Monitoring. Ambio 36 (7).
Danielsen, F. et al., (2008). Local Participation in Natural Resources Monitoring: A Characterization
of Approaches. Conservation Biology 23 (1).
Epractice (2010). Czech government approves proposal to facilitate access to spatial information.
News release, available at http://www.epractice.eu/en/news/288085.
Guerra, C. (2010). The Rationale Behind the Biodiversity Information System for North Portugal: The
Path for a Strategic and Collaborative Biodiversity Information System. EarthZine, Available at
http://www.earthzine.org/2010/12/22/the-rationale-behind-the-biodiversity-information-system-
for-north-portugal-the-path-for-a-strategic-and-collaborative-biodiversity-information-system/.
Gutierrez-Espeleta, E. (n,d.). Designing Environmental Indicators for Decision Makers. Available at
http://www.odd.ucr.ac.cr/phocadownload/desining-environmental-indicators.pdf.
Eden, S., & Bear, C. (2010). Third Sector Global Environmental Governance, Space and Science:
Comparing Fishery and Forestry Certification. Journal of Environmental Policy and Planning
12 (1).
Functowicz S. and Ravetz, J. (1994). The Worth of a Songbird: Ecological Economics as a Post-
Normal Science. Ecological Economics 10.
Linster, M. (n.d.). OECD Work on Environmental Indicators. available at
http://www.oecd.org/dataoecd/11/56/34564152.pdf.
McElfish, J., and Varnell, L. (2006). Designing Environmental Indicator Systems for Public
Decisions. Columbia Journal of Environmental Law 101.
McNie, E. (2007). Reconciling the Supply of Scientific Information with User Demands: An Analysis
of the Problem and Review of the Literature. Environmental Science and Policy 10.
Medarova, K., and Antypas, A. (2006). Implementation of the Aarhus Convention in Bulgaria:
Limping Towards Effectiveness. Environmental Liability 14 (1).
OECD (1993), Environmental indicators for environmental performance reviews, OECD, Paris.
32
OECD (1999). OECD/China Seminar on Environmental Monitoring, Draft Proceedings. Beijing, 12-
14 April 1999. (CCNM/CHINA/EPOC/SE(99)1).
OECD (2001), Citizens as Partners. OECD Publishing, Paris.
OECD (2003), OECD Environmental Indicators: Development, Measurement, and Use, a Reference
Paper. OECD Publishing, Paris.
OECD (2005), OECD Environmental Indicators. OECD Publishing, Paris.
OECD (2007), Policies for a Better Environment. OECD Publishing, Paris.
OECD (2008a), Costs of Inaction on Key Environmental Challenges. OECD Publishing, Paris.
OECD (2008b), OECD Key Environmental Indicators. OECD Publishing, Paris.
OECD (2008c). Measuring Material Flows and Resource Productivity, A Synthesis Report. OECD
Publishing, Paris.
OECD (2008d). Measuring Material Flows and Resource Productivity, Volume II: Inventory of
Country Activities. OECD Publishing, Paris.
OECD (2009). Introduction to a Systemic Approach to Assess Capacity for Environmental
Management. OECD Publishing, Paris.
OECD (2011). Monitoring Progress Towards Green Growth: OECD Indicators. OECD Publishing,
Paris.
Schmoldt, D., Kangas, J., and Mendoza, G.A. (2001). Basic Principles of Decision Making in Natural
Resources and the Environment. The Analytic Hierarch Process in Natural Resource and
Environmental Decision Making. Kluwer: The Netherlands.
Simpson, J. (ed.), (2003). Snapshot of Environmental Information Systems in South Eastern Europe.
Szetendre, Hungary: The Regional Environmental Center for Central and Eastern Europe.
Tripathi, N., & Bhattarya, S. (2004). Indigenous Knowledge and GIS for Participatory Natural
Resource Management: State of the Practice. The Electronic Journal on Information Systems in
Developing Countries 17 (3).
Turnpenny, J., Lorenzoni, I., and Jones, M. (2009). Noisy and Definitely Not Normal: Responding to
Wicked Issues in the Environment, Energy and Health. Environmental Science and Policy 12.
Winograd, M., & Farrow, A. (2006). Sustainable Development Indicators for Decision Making:
Methods, Definition, and Use. In Dimensions of Sustainable Development, [Eds. Reinmar
Seidler, and Kamaljit S. Bawa], in Encyclopedia of Life Support Systems (EOLSS), Developed
under the Auspices of the UNESCO, Eolss Publishers, Oxford ,UK, [http://www.eolss.net].
United Nations Commission on Sustainable Development, 2001. Information for Decision-Making.
(DESA/DSD/2001/12). Commission on Sustainable Development, Ninth Session, 16-27 April,
2001.
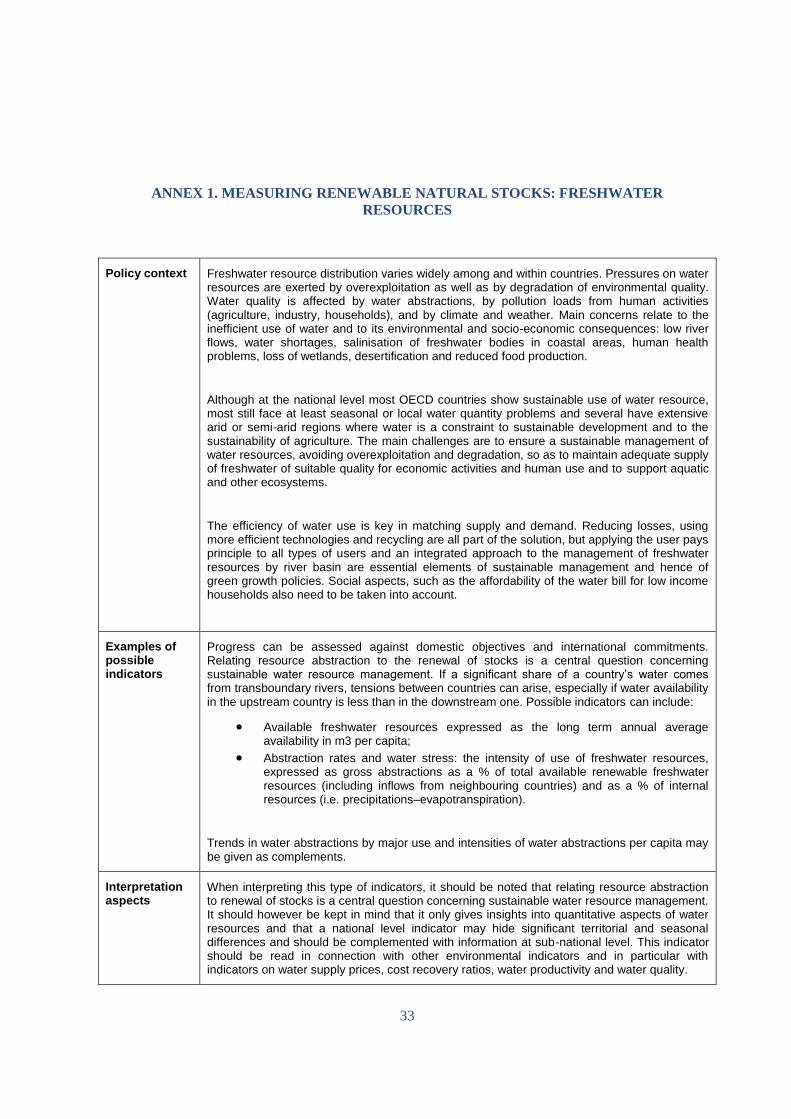
33
ANNEX 1. MEASURING RENEWABLE NATURAL STOCKS: FRESHWATER
RESOURCES
Policy context Freshwater resource distribution varies widely among and within countries. Pressures on water resources are exerted by overexploitation as well as by degradation of environmental quality. Water quality is affected by water abstractions, by pollution loads from human activities (agriculture, industry, households), and by climate and weather. Main concerns relate to the inefficient use of water and to its environmental and socio-economic consequences: low river flows, water shortages, salinisation of freshwater bodies in coastal areas, human health problems, loss of wetlands, desertification and reduced food production.
Although at the national level most OECD countries show sustainable use of water resource, most still face at least seasonal or local water quantity problems and several have extensive arid or semi-arid regions where water is a constraint to sustainable development and to the sustainability of agriculture. The main challenges are to ensure a sustainable management of water resources, avoiding overexploitation and degradation, so as to maintain adequate supply of freshwater of suitable quality for economic activities and human use and to support aquatic and other ecosystems.
The efficiency of water use is key in matching supply and demand. Reducing losses, using more efficient technologies and recycling are all part of the solution, but applying the user pays principle to all types of users and an integrated approach to the management of freshwater resources by river basin are essential elements of sustainable management and hence of green growth policies. Social aspects, such as the affordability of the water bill for low income households also need to be taken into account.
Examples of possible indicators
Progress can be assessed against domestic objectives and international commitments. Relating resource abstraction to the renewal of stocks is a central question concerning sustainable water resource management. If a significant share of a country’s water comes from transboundary rivers, tensions between countries can arise, especially if water availability in the upstream country is less than in the downstream one. Possible indicators can include:
Available freshwater resources expressed as the long term annual average availability in m3 per capita;
Abstraction rates and water stress: the intensity of use of freshwater resources, expressed as gross abstractions as a % of total available renewable freshwater resources (including inflows from neighbouring countries) and as a % of internal resources (i.e. precipitations–evapotranspiration).
Trends in water abstractions by major use and intensities of water abstractions per capita may be given as complements.
Interpretation aspects
When interpreting this type of indicators, it should be noted that relating resource abstraction to renewal of stocks is a central question concerning sustainable water resource management. It should however be kept in mind that it only gives insights into quantitative aspects of water resources and that a national level indicator may hide significant territorial and seasonal differences and should be complemented with information at sub-national level. This indicator should be read in connection with other environmental indicators and in particular with indicators on water supply prices, cost recovery ratios, water productivity and water quality.
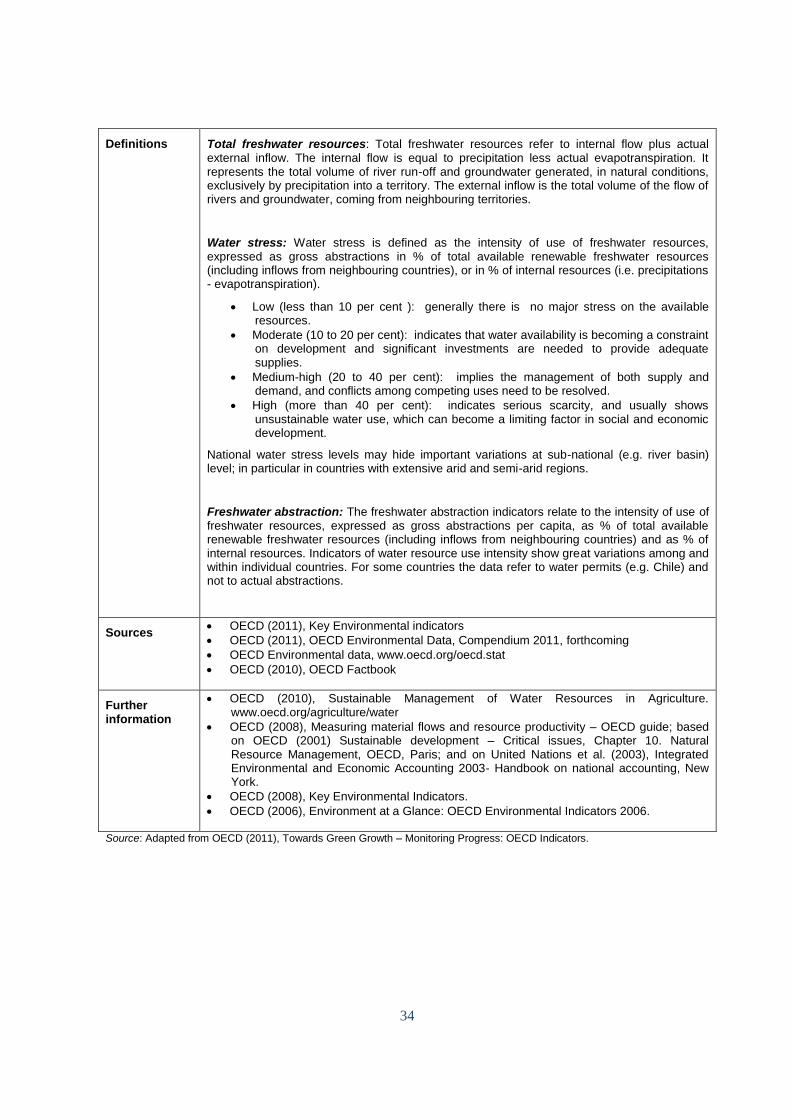
34
Definitions Total freshwater resources: Total freshwater resources refer to internal flow plus actual external inflow. The internal flow is equal to precipitation less actual evapotranspiration. It represents the total volume of river run-off and groundwater generated, in natural conditions, exclusively by precipitation into a territory. The external inflow is the total volume of the flow of rivers and groundwater, coming from neighbouring territories.
Water stress: Water stress is defined as the intensity of use of freshwater resources, expressed as gross abstractions in % of total available renewable freshwater resources (including inflows from neighbouring countries), or in % of internal resources (i.e. precipitations - evapotranspiration).
Low (less than 10 per cent ): generally there is no major stress on the available resources.
Moderate (10 to 20 per cent): indicates that water availability is becoming a constraint on development and significant investments are needed to provide adequate supplies.
Medium-high (20 to 40 per cent): implies the management of both supply and demand, and conflicts among competing uses need to be resolved.
High (more than 40 per cent): indicates serious scarcity, and usually shows unsustainable water use, which can become a limiting factor in social and economic development.
National water stress levels may hide important variations at sub-national (e.g. river basin) level; in particular in countries with extensive arid and semi-arid regions.
Freshwater abstraction: The freshwater abstraction indicators relate to the intensity of use of freshwater resources, expressed as gross abstractions per capita, as % of total available renewable freshwater resources (including inflows from neighbouring countries) and as % of internal resources. Indicators of water resource use intensity show great variations among and within individual countries. For some countries the data refer to water permits (e.g. Chile) and not to actual abstractions.
Sources OECD (2011), Key Environmental indicators
OECD (2011), OECD Environmental Data, Compendium 2011, forthcoming
OECD Environmental data, www.oecd.org/oecd.stat
OECD (2010), OECD Factbook
Further information
OECD (2010), Sustainable Management of Water Resources in Agriculture. www.oecd.org/agriculture/water
OECD (2008), Measuring material flows and resource productivity – OECD guide; based on OECD (2001) Sustainable development – Critical issues, Chapter 10. Natural Resource Management, OECD, Paris; and on United Nations et al. (2003), Integrated Environmental and Economic Accounting 2003- Handbook on national accounting, New York.
OECD (2008), Key Environmental Indicators.
OECD (2006), Environment at a Glance: OECD Environmental Indicators 2006.
Source: Adapted from OECD (2011), Towards Green Growth – Monitoring Progress: OECD Indicators.
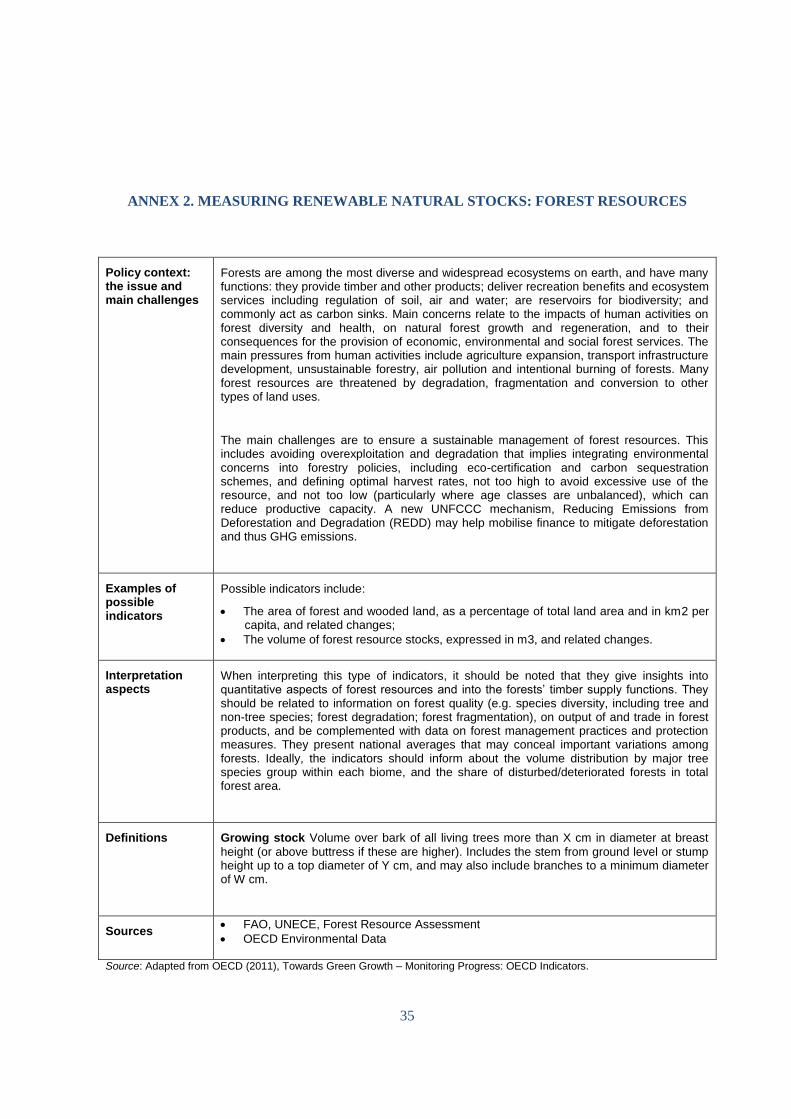
35
ANNEX 2. MEASURING RENEWABLE NATURAL STOCKS: FOREST RESOURCES
Policy context: the issue and main challenges
Forests are among the most diverse and widespread ecosystems on earth, and have many functions: they provide timber and other products; deliver recreation benefits and ecosystem services including regulation of soil, air and water; are reservoirs for biodiversity; and commonly act as carbon sinks. Main concerns relate to the impacts of human activities on forest diversity and health, on natural forest growth and regeneration, and to their consequences for the provision of economic, environmental and social forest services. The main pressures from human activities include agriculture expansion, transport infrastructure development, unsustainable forestry, air pollution and intentional burning of forests. Many forest resources are threatened by degradation, fragmentation and conversion to other types of land uses.
The main challenges are to ensure a sustainable management of forest resources. This includes avoiding overexploitation and degradation that implies integrating environmental concerns into forestry policies, including eco-certification and carbon sequestration schemes, and defining optimal harvest rates, not too high to avoid excessive use of the resource, and not too low (particularly where age classes are unbalanced), which can reduce productive capacity. A new UNFCCC mechanism, Reducing Emissions from Deforestation and Degradation (REDD) may help mobilise finance to mitigate deforestation and thus GHG emissions.
Examples of possible indicators
Possible indicators include:
The area of forest and wooded land, as a percentage of total land area and in km2 per capita, and related changes;
The volume of forest resource stocks, expressed in m3, and related changes.
Interpretation aspects
When interpreting this type of indicators, it should be noted that they give insights into quantitative aspects of forest resources and into the forests’ timber supply functions. They should be related to information on forest quality (e.g. species diversity, including tree and non-tree species; forest degradation; forest fragmentation), on output of and trade in forest products, and be complemented with data on forest management practices and protection measures. They present national averages that may conceal important variations among forests. Ideally, the indicators should inform about the volume distribution by major tree species group within each biome, and the share of disturbed/deteriorated forests in total forest area.
Definitions Growing stock Volume over bark of all living trees more than X cm in diameter at breast
height (or above buttress if these are higher). Includes the stem from ground level or stump height up to a top diameter of Y cm, and may also include branches to a minimum diameter of W cm.
Sources FAO, UNECE, Forest Resource Assessment
OECD Environmental Data
Source: Adapted from OECD (2011), Towards Green Growth – Monitoring Progress: OECD Indicators.
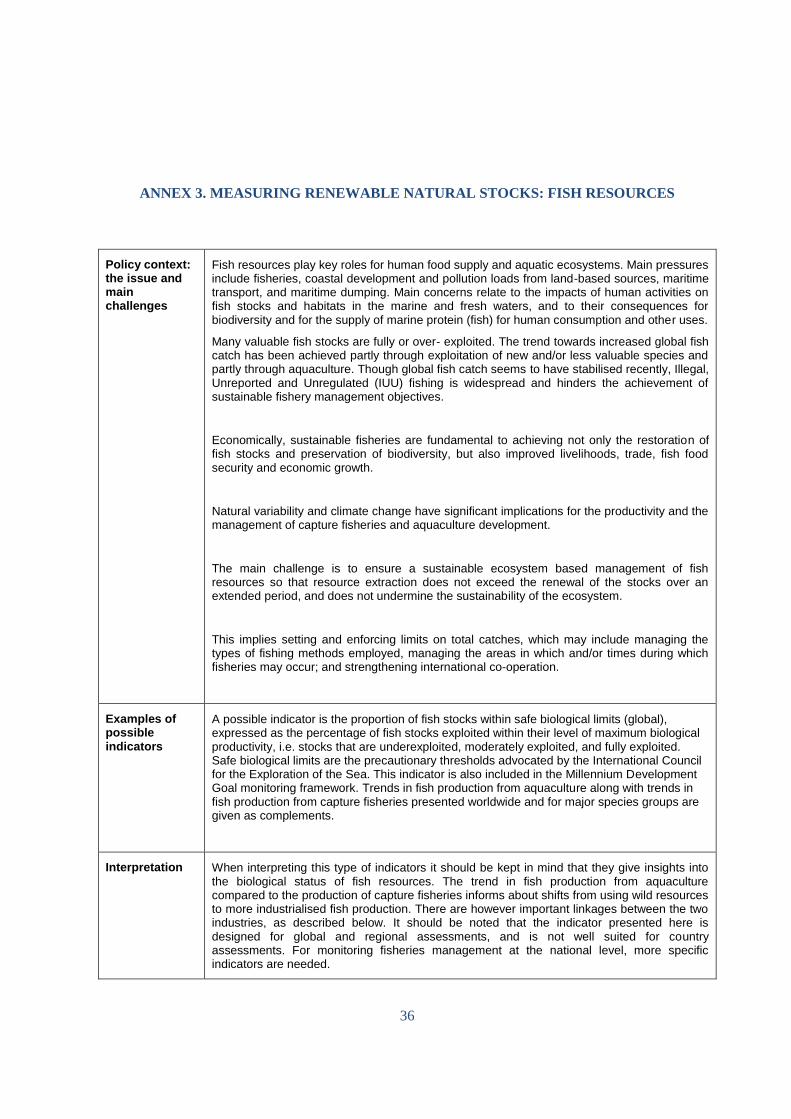
36
ANNEX 3. MEASURING RENEWABLE NATURAL STOCKS: FISH RESOURCES
Policy context: the issue and main challenges
Fish resources play key roles for human food supply and aquatic ecosystems. Main pressures include fisheries, coastal development and pollution loads from land-based sources, maritime transport, and maritime dumping. Main concerns relate to the impacts of human activities on fish stocks and habitats in the marine and fresh waters, and to their consequences for biodiversity and for the supply of marine protein (fish) for human consumption and other uses.
Many valuable fish stocks are fully or over- exploited. The trend towards increased global fish catch has been achieved partly through exploitation of new and/or less valuable species and partly through aquaculture. Though global fish catch seems to have stabilised recently, Illegal, Unreported and Unregulated (IUU) fishing is widespread and hinders the achievement of sustainable fishery management objectives.
Economically, sustainable fisheries are fundamental to achieving not only the restoration of fish stocks and preservation of biodiversity, but also improved livelihoods, trade, fish food security and economic growth.
Natural variability and climate change have significant implications for the productivity and the management of capture fisheries and aquaculture development.
The main challenge is to ensure a sustainable ecosystem based management of fish resources so that resource extraction does not exceed the renewal of the stocks over an extended period, and does not undermine the sustainability of the ecosystem.
This implies setting and enforcing limits on total catches, which may include managing the types of fishing methods employed, managing the areas in which and/or times during which fisheries may occur; and strengthening international co-operation.
Examples of possible indicators
A possible indicator is the proportion of fish stocks within safe biological limits (global), expressed as the percentage of fish stocks exploited within their level of maximum biological productivity, i.e. stocks that are underexploited, moderately exploited, and fully exploited. Safe biological limits are the precautionary thresholds advocated by the International Council for the Exploration of the Sea. This indicator is also included in the Millennium Development Goal monitoring framework. Trends in fish production from aquaculture along with trends in fish production from capture fisheries presented worldwide and for major species groups are given as complements.
Interpretation When interpreting this type of indicators it should be kept in mind that they give insights into the biological status of fish resources. The trend in fish production from aquaculture compared to the production of capture fisheries informs about shifts from using wild resources to more industrialised fish production. There are however important linkages between the two industries, as described below. It should be noted that the indicator presented here is designed for global and regional assessments, and is not well suited for country assessments. For monitoring fisheries management at the national level, more specific indicators are needed.
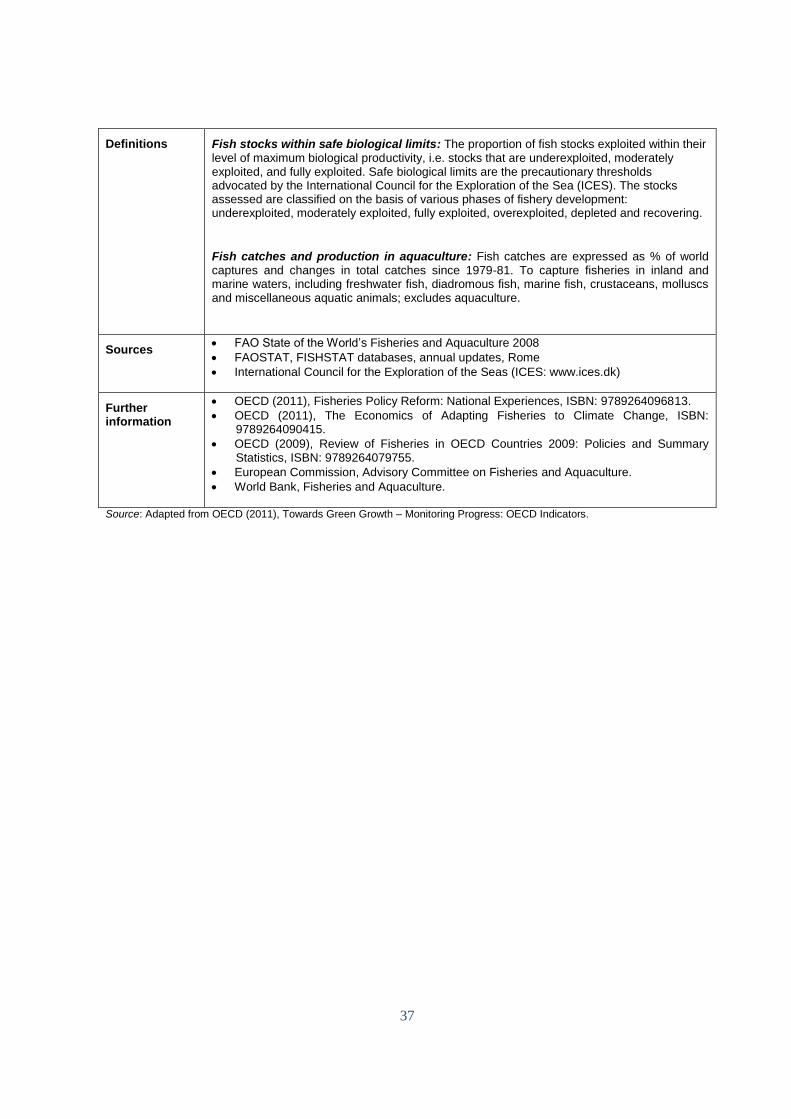
37
Definitions Fish stocks within safe biological limits: The proportion of fish stocks exploited within their level of maximum biological productivity, i.e. stocks that are underexploited, moderately exploited, and fully exploited. Safe biological limits are the precautionary thresholds advocated by the International Council for the Exploration of the Sea (ICES). The stocks assessed are classified on the basis of various phases of fishery development: underexploited, moderately exploited, fully exploited, overexploited, depleted and recovering.
Fish catches and production in aquaculture: Fish catches are expressed as % of world captures and changes in total catches since 1979-81. To capture fisheries in inland and marine waters, including freshwater fish, diadromous fish, marine fish, crustaceans, molluscs and miscellaneous aquatic animals; excludes aquaculture.
Sources FAO State of the World’s Fisheries and Aquaculture 2008
FAOSTAT, FISHSTAT databases, annual updates, Rome
International Council for the Exploration of the Seas (ICES: www.ices.dk)
Further information
OECD (2011), Fisheries Policy Reform: National Experiences, ISBN: 9789264096813.
OECD (2011), The Economics of Adapting Fisheries to Climate Change, ISBN: 9789264090415.
OECD (2009), Review of Fisheries in OECD Countries 2009: Policies and Summary Statistics, ISBN: 9789264079755.
European Commission, Advisory Committee on Fisheries and Aquaculture.
World Bank, Fisheries and Aquaculture.
Source: Adapted from OECD (2011), Towards Green Growth – Monitoring Progress: OECD Indicators.

38
ANNEX 4. MEASURING BIODIVERSITY AND ECOSYSTEMS: LAND RESOURCES
Policy context: the issue and main challenges
Land and soil resources are both a private property and a global common. They are essential components of the natural environment and of the natural asset base of the economy. They are critical for the production of food and other biomass, the preservation of biological diversity and the productivity of ecosystems. The way land is used and managed influences land cover and soil quality in terms of nutrient content and carbon storage; it affects water and air quality; determines erosion risks and plays a role in flood protection. It further affects emissions of greenhouse gases (carbon, methane, nitrous oxide). Its economic value derives from food and other biomass production (agriculture, forestry), mineral extraction and activities linked to the built environment. From a social point of view, land acquires value through ownership and through cultural and traditional heritage.
Land is a factor input into most economic activities; this leads to competing demands and conflicting uses that may become a constraint to both economic development and environmental protection. Competing demands for land and main drivers behind land use changes and conversions include:
agriculture and food production;
urbanisation and infrastructure development;
water and flood management;
forestry and biomass; and production of biofuels and non-food crops;
other renewable energy production (hydroelectricity; windmills);
mining and quarrying activities;
protection of biodiversity and cultural landscapes.
Land use is also increasingly influenced by global economic and environmental change (e.g. as a result of climate change mitigation and adaptation).
The main challenge is to ensure a sustainable management of land and soil resources so as to reconcile competing demands and conflicting interests (optimal mix of land use and multiple uses), and to preserve the land’s essential ecosystem functions. This requires integrated land use and territorial planning, coherence with sectoral policies (mining, agriculture, forestry manufacturing, transport, energy), appropriate governance and the use of a mix of policy instruments, including ownership rights, property and other taxes, protected area networks.
Examples of possible indicators
A possible key indicator refers to land use changes, e.g. since 1990: arable and permanent crop land; permanent pastures; forest land, and other land, including inland waters and built-up areas.
Examples of net conversion of agricultural to other land uses may be given as complements, as well as land cover changes for 2000-2006, and the share of land sealed by urban and infrastructure development in Europe.
Interpretation This type of indicators should be read in connection with information on wetlands; protected areas; land degradation through erosion and desertification; and soil pollution (acidification by acid precipitation, excessive use of fertilisers and pesticides, hazardous waste dumping, sludge spreading). Their interpretation should take into account the levels of economic development and the structure of countries’ economies related trade pattern. Geographic factors and population density also play a role.
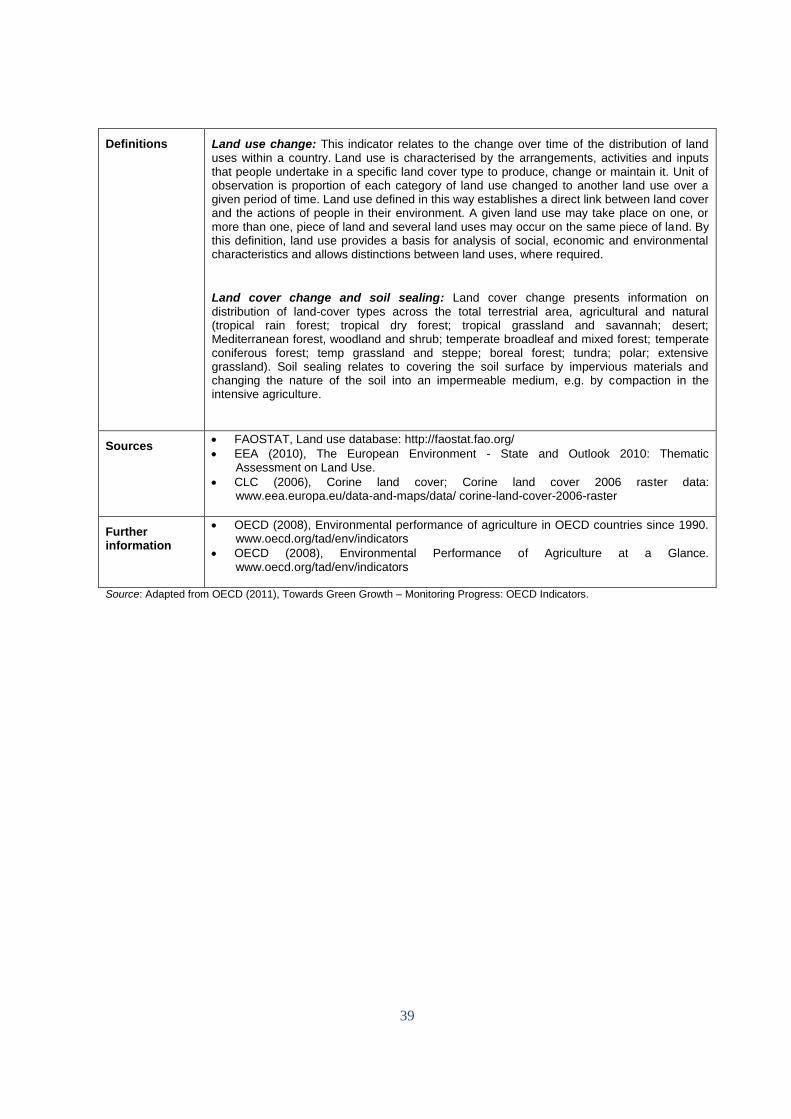
39
Definitions Land use change: This indicator relates to the change over time of the distribution of land uses within a country. Land use is characterised by the arrangements, activities and inputs that people undertake in a specific land cover type to produce, change or maintain it. Unit of observation is proportion of each category of land use changed to another land use over a given period of time. Land use defined in this way establishes a direct link between land cover and the actions of people in their environment. A given land use may take place on one, or more than one, piece of land and several land uses may occur on the same piece of land. By this definition, land use provides a basis for analysis of social, economic and environmental characteristics and allows distinctions between land uses, where required.
Land cover change and soil sealing: Land cover change presents information on distribution of land-cover types across the total terrestrial area, agricultural and natural (tropical rain forest; tropical dry forest; tropical grassland and savannah; desert; Mediterranean forest, woodland and shrub; temperate broadleaf and mixed forest; temperate coniferous forest; temp grassland and steppe; boreal forest; tundra; polar; extensive grassland). Soil sealing relates to covering the soil surface by impervious materials and changing the nature of the soil into an impermeable medium, e.g. by compaction in the intensive agriculture.
Sources FAOSTAT, Land use database: http://faostat.fao.org/
EEA (2010), The European Environment - State and Outlook 2010: Thematic Assessment on Land Use.
CLC (2006), Corine land cover; Corine land cover 2006 raster data: www.eea.europa.eu/data-and-maps/data/ corine-land-cover-2006-raster
Further information
OECD (2008), Environmental performance of agriculture in OECD countries since 1990. www.oecd.org/tad/env/indicators
OECD (2008), Environmental Performance of Agriculture at a Glance. www.oecd.org/tad/env/indicators
Source: Adapted from OECD (2011), Towards Green Growth – Monitoring Progress: OECD Indicators.

40
ANNEX 5. MEASURING BIODIVERSITY AND ECOSYSTEMS: WILDLIFE RESOURCES
Policy context: the issue and main challenges
Biological resources provide the raw materials of production and growth in many sectors of the economy. Biological diversity can be defined as the variety of and variability among living organisms; it covers both diversity at the ecosystem and species levels and genetic diversity within species.
Conservation of biodiversity is a key concern nationally and globally. Main concerns relate to the impacts of human activities on biodiversity. Pressures can be physical (habitat alteration and fragmentation through changes in land use and cover), chemical (toxic contamination, acidification, oil spills, other pollution) or biological (alteration of population dynamics and species structure through the release of exotic species or the commercial use of wildlife resources). Primary drivers are land use changes for conversion from natural state to agriculture and infrastructure, unsustainable use of natural resources, invasive alien species, climate change and pollution.
The main challenge is to maintain or restore the diversity and integrity of ecosystems, species and genetic material and to ensure a sustainable use of biodiversity. This implies strengthening the actual degree of protection of habitats and species, eliminating illegal exploitation and trade, integrating biodiversity concerns into economic and sectoral policies, and raising public awareness.
It requires using a mix of instruments that address both demand and supply, including economic and market-based instruments (pricing, removal of environmentally harmful subsidies, environmentally-related taxes, charges, fees; payments for ecosystem services, biodiversity offsets, tradable permits, e.g. fishing quotas), supported with regulations, voluntary approaches and information based instruments. Benefits are also expected from climate change mitigation and adaptation measures.
Examples of possible indicators
Possible indicators include:
The number of threatened species compared to the number of known or assessed species.
The state of farmland or forest birds. Birds are seen as good “indicator species” for the integrity of ecosystems and biological diversity. Being close to or at the top of the food chain, they reflect changes in ecosystems rather rapidly compared to other species.
Interpretation When interpreting this type of indicators, it should be kept in mind that they only provide a partial picture of the status of biodiversity and that they also reflect efforts made to monitor species. They should be read in connection with other indicators, in particular with indicators on the sustainable use of biodiversity as a resource (e.g. forest resources, fish resources) and on habitat alteration. It should further be complemented with information on the density of population and economic activities.

41
Definitions Threatened species: “Threatened” refers to the “endangered”, “critically endangered” and “vulnerable” species, i.e. species in danger of extinction and species soon likely to be in danger of extinction. Data cover mammals, birds, fish, reptiles, amphibians and vascular plants. Other major groups (e.g. invertebrates, fungi) are not covered at the present time.
Protected areas: Protected areas, i.e. areas under management categories I to VI of the
World Conservation Union (IUCN) classification that refer to different levels of protection, and protected areas without a specific IUCN category assignment. Categories I and II (wilderness areas, strict nature reserves and national parks) reflect the highest protection level.
Global wild bird index (under development): The global wild bird index (WBI) is an average trend in a group of species suited to track trends in the condition of habitats. A decrease in the WBI means that the balance of species’ population trends is negative, representing biodiversity loss. If it is constant, there is no overall change. An increase in the WBI means that the balance of species’ trends is positive, implying that biodiversity loss has halted. However, an increasing WBI may, or may not, always equate to an improving situation in the environment. It could in extreme cases be the result of expansion of some species at the cost of others, or reflect habitat degradation. In all cases, detailed analysis must be conducted to interpret accurately the indicator trends. The composite trend can hide important trend patterns for individual species.
Sources OECD (2011), Environmental data.
European Bird Census Council (EBCC): www.ebcc.info/
Global Wild Bird Index: http://www.bipindicators.net/wbi
North American Bird Conservation Committee (NABCC): http://www.nabci-us.org/
UNEP, World Conservation Monitoring Centre: www.unep-wcmc.org/
Further information
OECD (2011), Recent OECD work on biodiversity: http://www.oecd.org/dataoecd/63/39/46226558.pdf
OECD (2010), Paying for biodiversity: Enhancing the cost-effectiveness of payments for ecosystem services, ISBN: 9789264090262.
OECD (2010), Policy Statement on Integrating Biodiversity and Associated Ecosystem Services into Development and Co-operation
OECD (2009), Promoting Biodiversity Co-Benefits in REDD, ENV/WKP, 2009/6, OECD Environment Working Papers, No.11.
OECD (2008), Environmental performance of agriculture in OECD countries since 1990, www.oecd.org/tad/env/indicators.
OECD (2008), People and Biodiversity Policies: Impacts, Issues and Strategies for Policy Action,
OECD (2008), Report on Implementation of the 2004 Council Recommendation on the Use of Economic Instruments in Promoting the Conservation and Sustainable Use of Biodiversity, [ENV/EPOC/GSP/BIO(2008)1/FINAL].
OECD (2004), Council Recommendation on "The Use of Economic Instruments in Promoting the Conservation and Sustainable Use of Biodiversity", [C(2004)81].
European Commission, DG Environment, Nature and biodiversity
FAO, Biodiversity: http://www.fao.org/biodiversity/
Source: Adapted from OECD (2011), Towards Green Growth – Monitoring Progress: OECD Indicators.

42
ANNEX 6: MEASURING MATERIAL PRODUCTIVITY
Policy context: the issue and main challenges
Economic growth is generally accompanied by growing demand for raw materials, energy and other natural resources with consequences on market prices and on trade flows of these resources. Worldwide use of virtually every significant material has been rising over many years, causing recurrent concerns about shortages of natural resource stocks, the security of supply of energy and other materials, and the environmental effectiveness of their use. At the same time, the amount of waste generated by economic activity has been rising in line with growing global demand for raw materials. Despite achievements in waste recycling and some relative decoupling of waste generation from economic growth, many valuable materials contained in waste continue to be disposed of and are potentially lost for the economy. This affects both the efficiency of material use and environmental quality in terms of land use, water and air pollution, and greenhouse gas emissions.
The use of materials from natural resources and the attendant production and consumption processes have many economic, social and environmental consequences that often extend beyond the borders of single countries or regions. Ensuring that the flows of materials are managed in an effective and sound way through the economic system is thus critical, not only from an environmental perspective but also from an economic and trade perspective. From an economic perspective, the manner in which materials are used and managed affects (i) short-term costs and long-term economic sustainability; (ii) the supply of strategically important materials; and (iii) the productivity of economic activities and industrial sectors.
The main challenge is to improve resource productivity and ensure that materials are managed well and used efficiently at all stages of their life-cycle (extraction, transposition, transportation, consumption, and disposal) so as to avoid waste of resources, and reduce the associated negative environmental impacts. Resource productivity has an impact on the production process and on economic growth through impacts on capital stocks, and through impacts on costs, especially in resource-intensive industries. Improving resource productivity will also help reduce demand pressures on primary natural resource stocks and increase the long term availability (and quality) of resources for everyone.
Improving resource productivity and ensuring sustainable materials management requires integrated life-cycle based waste, materials and product policies, such as circular economy or 3R related initiatives, and the use of instruments aimed at stimulating technological change. It also implies internalising the costs of waste management into prices of consumer goods and of waste management services; and ensuring greater cost-effectiveness and full public involvement in designing measures.
Examples of possible indicators
Possible indicators include:
Material extraction, i.e. domestic extraction “used” (DEU), expressed in absolute terms, and related changes for individual material groups and for aggregates. The focus is on non-energy materials.
Material consumption, i.e. domestic material consumption (DMC), expressed in absolute terms, and related productivity ratios for individual material groups and for aggregates. Productivity is expressed as the amount of economic output generated for a unit of materials consumed.
43
Trends in municipal waste generated may be given as a complement. While municipal waste is only one part of total waste generated, its management and treatment represents more than one third of the public sector’s financial efforts to abate and control pollution.
Interpretation This type of indicators should be complemented with information on commodity prices, flows of secondary raw materials and recovery ratios, waste management practices and costs, and on consumption levels and patterns. Cross-country comparisons should take into account country’s endowments in natural resources and the structure of their economy.
When interpreting these indicators, it should also be kept in mind that material flows and waste generation intensities are first approximations of potential environmental pressure; more information is needed to describe the actual pressure.
Definitions Material extraction: The most commonly used material extraction indicator is domestic extraction used (DEU). DEU measures the flows of materials that originate from the environment and that physically enter the economic system for further processing or direct consumption (they are "used" by the economy). They are converted into or incorporated in products in one way or the other, and are usually of economic value.
Material consumption: Domestic material consumption measures the total amount of materials used in an economy and is calculated as domestic extraction (used materials) minus export plus imports. Internationally comparable data are not available for individual non-OECD economies, only estimated values for the world aggregate.
Municipal waste: Municipal waste is waste collected by or on behalf of municipalities. It includes waste originating from households, commercial activities, office buildings, institutions such as schools and government buildings, and small businesses that dispose of waste at the same facilities used for municipally collected household waste. Household waste is waste generated by the domestic activity of households. It includes mixed household waste, bulky waste and separately collected waste. National definitions may differ.
Sources OECD material flow database; OECD national accounts, economic outlook.
SERI material flow database
Further information OECD work on Sustainable materials management.
OECD (2008), Measuring material flows and resource productivity – OECD guide
OECD (2001) Sustainable development – Critical issues, Chapter 10. Natural Resource Management, OECD
UNEP (2010) Assessing the environmental impacts of consumption and production: Priority products and materials.
EEA (2010) The European Environment - Thematic Assessment on Material resources and waste.
Eurostat Material flow accounts http://epp.eurostat.ec.europa.eu/ statistics_explained/index.php/Material_flow_accounts
Source: Adapted from OECD (2011), Towards Green Growth – Monitoring Progress: OECD Indicators.
INFORMATION FOR SUSTAINABLE NATURAL RESOURCE MANAGEMENT: Key points for reformers in Eastern Europe, Caucasus, and Central Asia
A good understanding of the key characteristics of natural assets and their change over time is a pre-requisite for sound economic decision-making. In order to promote this message, the current document explains the importance of information as a key element to support policy-making related to sustainable natural resources management. It provides users with a menu of possible measures that can improve the design and performance of their countries’ knowledge systems on natural resource management. The document also equips readers with the understanding of key areas where policy dialogue and consensus-building is necessary. Decision-makers in environmental, economic, and sector-specific ministries in EECCA are the main target audience for this document. Financing for preparing this document was provided by the government of Norway, as part of their support to governance and environmental reforms in Georgia.
Environmental Performance and Information Division Environment Directorate, OECD E-mail: [email protected] www.oecd.org/env/eap