information seeking behaviour of faculty members in t he
TRANSCRIPT

[Information Seeking Behaviour of Faculty Members in the Business Management Educational
Institutions Information Knowledge Resource Centre’s in Chennai City: An Analytical Study the date]
IJNGLT , MAY 2017
VOLUME 3 ISSUE 2
ww.ijnglt.com International Journal of Next Generation Library and Technologies (ISSN 2395 – 5201) Page 1
Information Seeking Behaviour of Faculty
Members in the Business Management
Educational Institutions Information Knowledge
Resource Centre’s in Chennai City:
An Analytical Study 1. A. Kumar, Research Scholar 2. Dr. V. Kasirao, Research Guide
Bharathiar University, Coimbatore, Tamil Nadu
Abstract:
This entitled of paper Information seeking behavior of faculty members in the Business
managementeducational Institutions Knowledge Resource Centre in Chennai City. The recent year
advance the development of the digital information revolutionary, information is diffusion in the world
and, obviously to get open sources anywhere anybody very easy to retrieval each one. But some
technique to use, to collect information. Faculty members to search the information use of from
different idea of research, innovative methods, knowledge management, Awareness, various needs of
information, tools for information seeking etc... the researcher have been observed, treated and given
solution, this paper prepared the faculty members many of them to aware collect information, seeking
for information, information gathering activities, the faculty members to get sources in resource centre ,
to measure of spent on time, purpose of information seeking preference of printed material, electronic
and digital material, tools of information seeking, management database accessibility and finally the
user satisfaction. The researcher have been used the data analysis the SPSS software 20(Version)
Key words: Information seeking behaviour, resource centre resources, Information sources, the
management faculty members
Introduction
21st century in advancement development in the world kinds of economically, politically,
scientifically, information explosion, medically and business oriented etc. The human being to need and
very essentials for information because of new idea, innovation thinking, analytical thinking, empirical
thinking, and life oriented thinking moreover to every project to success of the back bone the
information. Hence the information is vital role in all, but now the information is shift to transfiguration
for paper document to digital formation, and virtual formation. Simultaneously to shift the human
endeavors the seeking knowledge behavior is very rapid and quickly to access the information.
[Information Seeking Behaviour of Faculty Members in the Business Management Educational
Institutions Information Knowledge Resource Centre’s in Chennai City: An Analytical Study the date]
IJNGLT , MAY 2017
VOLUME 3 ISSUE 2
ww.ijnglt.com International Journal of Next Generation Library and Technologies (ISSN 2395 – 5201) Page 2
Investigations of those who seek and use information have been an important aspect of
information science since its beginnings. Some reviewers of the literature point to studies as early as
1916, or even 1902, as the start of this genre. Whatever is the case, it is clear that the explosion of
scientific and technical literature during and immediately after World War II created a situation in which
attention to information seeking was inevitable.
The Shift to a Focus on People and Their Behaviors
A major shift in information behavior (IB) research occurred in the 1980s. While the early use
studies focused on a particular system or service and its users, the new generation of studies placed the
information seeker/user in the center and did not presume the use of a particular resource or set of
resources.
Information Behaviors as Dynamic Processes
As the attention of IB researchers focused on people and their many uses of information, rather
than on their use of particular sources and services, it became clear that an important aspect of
information behaviors is that they occur over time. An episode of information seeking may last just a
few seconds (for example, when someone is looking up the phone number of a new restaurant).
However, a complete sequence of information seeking and use may span months or even years as when
a doctoral student is preparing the literature review for his dissertation. Barbara M. Wildemuth and
Donald O.Case (2010)1
Information seeking behavior has been focus of research for facilitating quality and modified
library services to users. The analysis of information seeking behavior and preferences of users enables
the Library and Information Science Professionals (LISPs) to design and develop the library and
information services consequently. Knowledge of reasons and motivation why people seek information
and the types of information they search for an Impact "collection development, reference services,
programming, and budget allotment practices", Agosto et.al. (2005)2. Uttor, (1999)
3 defined information
as data value in planning, decision making and evaluation of any programme. He goes further to say that
it is a data that have been subjected to some processing functions capable of answering user’s query be it
recorded, summarized, or simply collected that would help decision making.
Information Seeking
Information-seeking behavior be different to the among user groups. Academic libraries must
understand the information needs of faculty and students in order to address those needs. The concept of
information seeking is basically the consequences of a felt information need by a user who may then

[Information Seeking Behaviour of Faculty Members in the Business Management Educational
Institutions Information Knowledge Resource Centre’s in Chennai City: An Analytical Study the date]
IJNGLT , MAY 2017
VOLUME 3 ISSUE 2
ww.ijnglt.com International Journal of Next Generation Library and Technologies (ISSN 2395 – 5201) Page 3
make demands upon formal and informal information sources or services in order to satisfy the needs
(Boadi&Letsolo, 2004)4. Information seeking means different things in different context that involves
the search, retrieval, recognition and application of meaningful content (Kingrey, 2002)5. According to
Backlund (2003)6 information seeking is a process in which participants can act as both receivers and
senders. It is defined as a purposive process, in which the individual attempts to find information
through information sources in order to satisfy his or her information needs (Byström, K, 1999)7.Uhegbu
(2007)8 describes information-seeking behavior as the way in which information users conduct
themselves when searching for information, describes the factors affecting choice of information,
particularly among students, which includes course of studies, level, age, and religion. Ajiboye and Tella
(2007)9 agree when they describe information-seeking behavior as the way and manner people gather
and sought for information for their personal use, knowledge updating and development. Ikoja-Odongo
and Ocholla (2004)10
described information seeking as a process that requires an information seekers, or
what might be called ‘’personal information structures’ ‘such as a person’s cognitive abilities, his or her
knowledge, skills in relation to the problem or task domain, knowledge and skills specific to a system
and knowledge and skills regarding information seeking.
Scope and Limitations of Study:
The scope of the study is limited to the libraries attached to Business management educational
intuitions in Chennai city only. Efforts are made to focus attention on assessing information knowledge
resource Centre infrastructure or Management libraries, Management faculty members to needs and
information seeking behaviour of management faculty members. The concentration of the study is to
analyses information seeking behavior of faculty members and status of business management
educational knowledge resource Centre. The researcher has covered only the management institutes
where only full time MBA courses are conducted and has excluded distance and open learning Centre’s
Literature
They have been number of literature published so-far emphasizing need of the information
seeking behavior of faculty members. In this chapter focused an attempt is need to review of literature in
the information seeking behavior of faculty members of management educational institutions
information knowledge resource Centre and libraries. In the current study primary and secondary
sources were referred to internet resources like LISA, LISTA, Journals, thesis technical report published
in library information science and management science, conference proceedings, books and reference

[Information Seeking Behaviour of Faculty Members in the Business Management Educational
Institutions Information Knowledge Resource Centre’s in Chennai City: An Analytical Study the date]
IJNGLT , MAY 2017
VOLUME 3 ISSUE 2
ww.ijnglt.com International Journal of Next Generation Library and Technologies (ISSN 2395 – 5201) Page 4
resources like wiki, encyclopedia, e-resource available on the website, Google scholar, some
management data base like Emerald insight, EBSCO, Science Direct, Research gate, Library inflation
science journals, library Trends, Library philosophy and practice, and thesis database like INFLIBNET
Shodganga etc.
In this chapter a detailed survey of recent studies on information needs and information seeking
behaviors and its interrelated aspects of the existing study.
In this chapter’s covers to the review of related studies on following topics
Information needs, User needs of information, Information Access Patterns, Information searching on
web, Information gathering habits and Information search process.
Purposes
The purposes of the present literature review are:
1) To appreciate the problem under study;
2) To digest the literature in a field;
3) To classify the research gaps and also to read between the lines new ways to interpret;
4) To avoid unintentional duplication of well-established definitions;
5) To define the limit of the study;
6) To make the objectives of the existing study more clear and abridged;
7) To studies relevant that work topic in use to understand the important work; and (ISB)
8) To recognize the latest improvements in the field of study so as to improvement in designing the
study.
Vimaladevi.P.N (2000), information needs and search patterns in humanities user studies.Wales
(2000) found that a greater proposition of respondents used the Internet for veterinary information than
used a veterinary college library. Shaheen Majid and GavaMugeraaKassim (2000), the purpose of
this study is to identify the information channels used by the International Islamic University Malaysia
(IIUM) law faculty members, information sources preferred by them, methods employed for getting the
needed information and their library use pattern.
Wilson T.D. (2000)information seeking is a term recitation the ways individuals seek, evaluate,
excellent and use information.Mahaptra& Panda (2001) Information seeking behavior at length

[Information Seeking Behaviour of Faculty Members in the Business Management Educational
Institutions Information Knowledge Resource Centre’s in Chennai City: An Analytical Study the date]
IJNGLT , MAY 2017
VOLUME 3 ISSUE 2
ww.ijnglt.com International Journal of Next Generation Library and Technologies (ISSN 2395 – 5201) Page 5
provides an insight into the many means of Information Seeking Behavior such as its concept, related
psychological characteristics, behavior selections and ecological guidance, impact of dissension
theory.Akinola Sarah (2009)the study of the investigate the information seeking patterns and types of
information sources used on the internet by lecturers in faculties of Education in ObafemiAwolowo
University and university of Ibadon.
Jogender Singh (2010),
It may also be inspired by a variety of needs, including personal
professional, entertainments etc. The collection should meet the needs and requirements. Users, it is
recommended that library staff focus on assisting users to develop a better image for the library.
SenthilVelmurugan and Amudha (2012) investigated usage patterns of OPAC among faculty
members in Indian colleges, the result is found the majority of users are daily visitors of the library out
of these who are coming to the library more than half of the respondents (58.75%) are using OPAC for
finding the documents in the library.
Krishna. B, Mahadeva.S and Rajesha.C (2014),user studies @ GSSS institute of engineering
and Technology for women: A survey. This study observed that the objectives of the user study to
identify the user’s purpose of visiting to the library, to examine knowledge about library services and
services of the users, to identify the information retrieval tools by the users, to determine user level of
satisfaction s with availed the library facilities and services, to identify the skills level for use of
information and services by the users.
Purnima and Vikas (2005) in their article to study the existing information needs of the college
and Universities faculties who plays a great role in shaping the future Generation in the emerging
information technology’s needs. Objective of the study is: To know the existing resources and service
provided at the Colleges and University of Manipur, to create intellectual capital, to appraise the attitude
and opinion of faculties in the use of ICT, to know the information needs of the faculties, access to
information of their choice and if not the problem faced thereby, and to know the networking
capabilities of the faculties.
Kaushik, Kiran, et al. (2011)revealed that objectives of ‘Information seeking behavior of users
of cyber Library. A case study of Tata Institute of social science. The objectives of this study are. To
[Information Seeking Behaviour of Faculty Members in the Business Management Educational
Institutions Information Knowledge Resource Centre’s in Chennai City: An Analytical Study the date]
IJNGLT , MAY 2017
VOLUME 3 ISSUE 2
ww.ijnglt.com International Journal of Next Generation Library and Technologies (ISSN 2395 – 5201) Page 6
study the gender wise and residency wise profile of users, to understand the preference for specific
online resources and Convenience of accessing e-resources compared to print resources.
Fereydoon, Azadeh and Shahrzad, Ghasemi (2016), this paper observed that information
seeking behavior of faculty members based on Wilson’s models, the author investigated payame Noor
University (PNU) in Mazandaran, Iran. Information seeking behavior inventory was employed to gather
information and research data. The author used Likert scale and collected the data, the analysis of data in
SPSS software used
Research Methodology
This study purposes at to find out the Information Seeking Behaviour of Faculty Members in the
Business Management Educational Institutions Information Knowledge Resource Centres in Chennai
City: An Analytical Study. Even though selecting the sample questionnaire methods was adopted. Total
number of 400 questionnaire was distributed and among them 475faculty members responded the
questionnaire.
Statement of the Problem
The present study examined the “Information Seeking Behaviour of Faculty Members in the
Business Management Educational Institutions Information Knowledge Resource Centres in Chennai
City: An Analytical Study “The focus of this study was on obtaining information on the nature of
academic information required by the faculty members, the sources consulted and the general pattern of
information seeking by them.
Descriptions of the Questionnaire
It consists of the questions relating to the back ground information of the faculty members. It also
consists of questions to know the extent of use of information knowledge resource Centre. The final
questionnaire consists of different segmentations which are listed below:-Perceptions
Demographic of the Faculty Members
Frequently visit the Information knowledge resource Centre
Time spent in resource Centre
Types of resources
Format of information sources
[Information Seeking Behaviour of Faculty Members in the Business Management Educational
Institutions Information Knowledge Resource Centre’s in Chennai City: An Analytical Study the date]
IJNGLT , MAY 2017
VOLUME 3 ISSUE 2
ww.ijnglt.com International Journal of Next Generation Library and Technologies (ISSN 2395 – 5201) Page 7
Purpose of Information seeking
E-journals online databases seeking
Availability of information sources
Frequently of use information sources
Accessibility of business relevant information sources
Preferred the search engine
Problems of search
Usefulness of e-resources
Library and resource Centre services
Level of satisfaction of resource Centre service
Opinion of information knowledge resource Centre resources and services
Update ICT developments.
The information seeking behavior of faculty members of in the business management educational
institutional of the knowledge resource Centre in Chennai city has been undertaken with the following
objectives.
1. To investigate the information needs and information seeking behavior of faculty members of
business educational intuitions in Chennai City
2. To assess the adequacy, availability and accessibility of information sources used by business
management faculties IKRC
3. To validate the perceptions of faculty members on the quality of information availability in IKRC
4. To find out the reason for information seeking from knowledge resource Centre
5. To analyze the information seeking barriers encountered by the faculty members
6. To know the level of satisfaction ICT, E-journals online database service providing by IKRC.
7. To suggest based on measures for enhancing quality of acquisitions and collection of services through
IKRC
Hypothesis
[Information Seeking Behaviour of Faculty Members in the Business Management Educational
Institutions Information Knowledge Resource Centre’s in Chennai City: An Analytical Study the date]
IJNGLT , MAY 2017
VOLUME 3 ISSUE 2
ww.ijnglt.com International Journal of Next Generation Library and Technologies (ISSN 2395 – 5201) Page 8
There would be significant difference between, Assistant Professor, Associate professor, and professor
using the information knowledge resource Centre, yet they are all bound with teaching activity.
The Succeeding hypothesis is outlined to test by Statistical tools in Chi-square.
1. Null Hypothesis: (Ho) in all the faculty members in business management educational institution are
exhausting same methods and sources for information seeking.
Alternative Hypothesis: (H1) in all the faculty members in business management educational institution
are exhausting same methods and sources for information seeking.
2. Null Hypothesis: (Ho) in all the faculty members in business management educational institution are
utilizing the information Knowledge resource Centre resources and services uniformly.
Alternative Hypothesis: (H1) in all the faculty members in business management educational institution
are utilizing the information Knowledge resource Centre resources and services uniformly.
3. Null Hypothesis: (Ho) in all the faculty members to know the level of satisfaction ICT, E-journals and
online database service providing by information Knowledge resource Centre.
Alternative Hypothesis: (H1) in all the faculty members to know the level of satisfaction ICT, E-journals
and online database service providing by information Knowledge resource Centre.
Research Method
The research question, ethics, budget and time are all major considerations in any design. This is before
looking at the statistics required, and studying the preferred methods for the individual scientific
discipline. Every experimental design must make compromises and generalizations, so the researcher
must try to minimize these, whilst remaining realistic.
Sample Selection
A total of 475 questionnaires with open and close-ended questionnaire on the information seeking
behavior of the faculty members were distributed randomly to respondents. Out of 475, 430 filled in
questionnaires were received by the user but 30 questionnaires were rejected due to incomplete
information. There were 400 correct filled questionnaire collected from the faculty members.
The population structure is as follows;

[Information Seeking Behaviour of Faculty Members in the Business Management Educational
Institutions Information Knowledge Resource Centre’s in Chennai City: An Analytical Study the date]
IJNGLT , MAY 2017
VOLUME 3 ISSUE 2
ww.ijnglt.com International Journal of Next Generation Library and Technologies (ISSN 2395 – 5201) Page 9
(i) Assistant professor 151; (ii) Associate professor 87;(iii) and Professor 162
Collection of Questionnaire and Interpretation
After collecting the data from the respondents, the data were checked and analyzed according to
objectives and hypothesis stated. Each data was recorded on Excel data sheets and computing the data
using SPSS software statistics 20. Further the study has also adopted the Reliability analysis.
Statistical Tools and Techniques
The data had been tested with the statistical tool of mean, median, standard deviation, and Means
score value, ANOVA, Regression, Correlation and Chi-square for this study.
Data analysis and interpretation
Demographic Details of Respondents table
Table 1 Gender VS Designation
Designation
Designation Asst.
professor
Associate
professor Professor Total
Gender
Male 97 56 117 270
64.20% 64.40% 72.20% 67.50%
Female
54 31 45 130
35.80% 35.60% 27.80% 32.50%
Total 151 87 162 400
100.00% 100.00% 100.00% 100.00%

[Information Seeking Behaviour of Faculty Members in the Business Management Educational
Institutions Information Knowledge Resource Centre’s in Chennai City: An Analytical Study the date]
IJNGLT , MAY 2017
VOLUME 3 ISSUE 2
ww.ijnglt.com International Journal of Next Generation Library and Technologies (ISSN 2395 – 5201) Page 10
The table shows that overall the majority of teaching faculty members in gender wise male
270(67.5) and remaining the teaching faculty members in 130 (32.5) Percent of Female. The designation
wise represent that 97(64.2), percent of ‘assistant professor in male’ 56 (64.4) percent of them ‘associate
professor’, 177(72.2) percent of ‘Professor’, and respectively the female designation wise the 54(35.8)
percent of ‘Assistant professor’, 31(35.6) percent of ‘Associate professor’, and respectively 45(27.8)
percent of ‘professor’.
Table No. 2 Age
Age Designation
Total Asst. professor Associate professor Professor
Below 30 47 6 4 57
31.10% 6.90% 2.50% 14.30%
30 to 40 33 37 41 111
21.90% 42.50% 25.30% 27.80%
40 to 50 27 42 91 160
17.90% 48.30% 56.20% 40.00%
50 and above 44 2 26 72
29.10% 2.30% 16.00% 18.00%
Total 151 87 162 400
100% 100% 100% 100%

[Information Seeking Behaviour of Faculty Members in the Business Management Educational
Institutions Information Knowledge Resource Centre’s in Chennai City: An Analytical Study the date]
IJNGLT , MAY 2017
VOLUME 3 ISSUE 2
ww.ijnglt.com International Journal of Next Generation Library and Technologies (ISSN 2395 – 5201) Page 11
Source: Primary Data
From the above table 2 the researcher infers that inclusive the mainstreamthe age group 160
(40.0) percent of the respondents are stated that 40 to 50 age; 111 (27.8) per cent of 30 to 40 respondent,
72 (18.0) percent of respondent 50 and above and remaining the age group of below 30 respondent 57
(14.3).
Table No. 2 .1 Age - Chi-Square Tests
Value df
Asymp. Sig. (2-
sided)
Pearson
Chi-Square
111.563a 6 .000
The Chi-square test has been employed to test the relationship between the personal characteristics,
particularly age, these propositions hold good in the same would have to tested through statistical
analysis. Null hypothesis H0. There is no association between result reveals that the calculated value
of socio economic characteristics in the age chi-square value is significant at 0.01 levels of its 6
degree of freedoms. So stated that hypothesis is rejected the table value 111.563.
Table No. 3 Educational Qualification
Educational Qualification
Designation
Total Asst. professor
Associate
professor Professor
Post graduate 57 10 10 77
37.70% 11.50% 6.20% 19.30%
M.Phil. 36 46 66 148
23.80% 52.90% 40.70% 37.00%
Ph.D. 58 31 86 175
38.40% 35.60% 53.10% 43.80%

[Information Seeking Behaviour of Faculty Members in the Business Management Educational
Institutions Information Knowledge Resource Centre’s in Chennai City: An Analytical Study the date]
IJNGLT , MAY 2017
VOLUME 3 ISSUE 2
ww.ijnglt.com International Journal of Next Generation Library and Technologies (ISSN 2395 – 5201) Page 12
Total 151 87 162 400
100.00% 100.00% 100.00% 100.00%
Source: Primary Data
From above the table 4 the researcher overall infers that educational qualification the faculty
members in a large majority of respondent175 (43.8) highest degree in Ph.D. holder, 148 (37.0)
percent of the education in M.Phil, qualification and respectively the post graduate respondent 77
(19.3).
Table No.3.1 Educational Qualification Chi-Square Tests
Value df Asymp. Sig. (2-sided)
Pearson Chi-Square 63.078a 4 000
The chi-square test was applied for the purpose of examining the significance of relationship
between levels of educational qualification towards impact of library user. Null hypothesis H0.
There is no association between result reveals that the calculated value of socio economic
characteristics in the educational qualification chi-square value is significant at 0.01 levels of its 4
degree of freedoms. So stated that hypothesis is rejected the table value 63.078. The association
described by the cross tabulation is a significant one, the result s of chi-square are typically
reported as follow, X2=63.078. df = 4, P<.001
Table 4 Total years of professional services
Professional
services
Designation Total
Asst.
professor
Associate
professor Professor
Below 5 years 56 5 7 68
37.10% 5.70% 4.30% 17.00%
5 to 10 years 19 41 34 94
12.60% 47.10% 21.00% 23.50%

[Information Seeking Behaviour of Faculty Members in the Business Management Educational
Institutions Information Knowledge Resource Centre’s in Chennai City: An Analytical Study the date]
IJNGLT , MAY 2017
VOLUME 3 ISSUE 2
ww.ijnglt.com International Journal of Next Generation Library and Technologies (ISSN 2395 – 5201) Page 13
10 to 15years 33 30 65 128
21.90% 34.50% 40.10% 32.00%
15 to 20years 16 5 33 54
10.60% 5.70% 20.40% 13.50%
above 20 Years 27 6 23 56
17.90% 6.90% 14.20% 14.00%
Total 151 87 162 400
100.00% 100.00% 100.00% 100.00%
Source: Primary Data
Whole this table the researcher infers that total year of professional services the faculty members
in a large majority of respondent 128 (32.0) percent of ‘10 to 15 years’, 94 (23.5) respondents 5 to 10,
68 (17.0) percent of ‘below 5 years’, 56 (14.0) percent of respondents in the above 20 years and
enduring (13.5) percent of ‘15 to 30 years’.
Table No. 4 .1Total Years of professional services Chi-Square Tests
Value df Asymp. Sig. (2-sided)
Pearson Chi-Square 110.006a 8 .000
Hence the chi-square test was applied for the purpose of examining the significance of
relationship between levels of total years of professional service towards impact of library user. Null
hypothesis H0, there is no association between results reveals that the calculated value of socio economic
characteristics in the total years of professional service chi-square value is significant at 0.01 levels of its
8 degree of freedoms. So stated that hypothesis is rejected the table value 110.006. The association
described by the crostabulation is a significant one, the result s of chi-square are typically reported as
follow, X2=110.006
a. df = 8, P<.001

[Information Seeking Behaviour of Faculty Members in the Business Management Educational
Institutions Information Knowledge Resource Centre’s in Chennai City: An Analytical Study the date]
IJNGLT , MAY 2017
VOLUME 3 ISSUE 2
ww.ijnglt.com International Journal of Next Generation Library and Technologies (ISSN 2395 – 5201) Page 14
Table No. 5 Frequency Visit Library
Frequency Visit
Library
Designation
Total Asst. professor
Associate
professor Professor
Occasionally 0 0 1 1
0.00% 0.00% 0.60% 0.30%
Once in a month 8 5 5 18
5.30% 5.70% 3.10% 4.50%
Three times in a week 17 14 30 61
11.30% 16.10% 18.50% 15.30%
Twice a week 23 9 20 52
15.20% 10.30% 12.30% 13.00%
Once in a week 30 23 40 93
19.90% 26.40% 24.70% 23.30%
Daily 73 36 66 175
48.30% 41.40% 40.70% 43.80%
Total 151 87 162 400
100.00% 100.00% 100.00% 100.00%
Source: Primary Data
Above this table describes that the such as frequently visit the library ‘Daily’, Once in a week’,
‘Twice a week’, ‘Three times in a week’, ‘Once in a month’ and ‘Occasionally’ founded on the
responses the statistical calculated. The faculty members state that the frequently visit the library the
researcher infer that the assistant professor 73(48.3) percent of ‘daily’ 30(19.9) percent of ‘Once in a
week’, 23(15.2) percent of ‘Twice a week’ 17(11.3) percent of ‘Three times in a week’, and respectively
8(5.3) percent of ‘Once in a month’.
The Associate professor 36(41.4) percent of ‘daily’ 23(26.4) percent of ‘Once in a week’,
09(10.3) percent of ‘Twice a week’ 14(16.1) percent of ‘Three times in a week’, and respectively 5(5.7)
percent of ‘Once in a month’.

[Information Seeking Behaviour of Faculty Members in the Business Management Educational
Institutions Information Knowledge Resource Centre’s in Chennai City: An Analytical Study the date]
IJNGLT , MAY 2017
VOLUME 3 ISSUE 2
ww.ijnglt.com International Journal of Next Generation Library and Technologies (ISSN 2395 – 5201) Page 15
Similarly assistant professor 66(40.7) percent of ‘daily’ 40(24.7) percent of ‘Once in a week’,
20(12.3) percent of ‘Twice a week’ 30(18.5) percent of ‘Three times in a week’, and respectively 5(3.1)
percent of ‘Once in a month’ and remaining 1(0.6) percent of ‘Occasionally’
Inclusive this table the researcher infer that the faculty members in the highly indicate point of
175(48.8) percent of ‘daily’ 93(23.3) percent of ‘Once in a week’, 2352(13.0) percent of ‘Twice a week’
61(15.3) percent of ‘Three times in a week’, 18(4.5) percent of ‘Once in a month’, and respectively
1(0.3) percent of ‘occasionally’
Table No. 6 Time spent
Time spent
Designation
Total Asst. professor
Associate
professor Professor
Below one hour 31 5 10 46
20.50% 5.70% 6.20% 11.50%
Two hours 46 26 26 98
30.50% 29.90% 16.00% 24.50%
Three hours 30 35 63 128
19.90% 40.20% 38.90% 32.00%
Above 5 hours 44 21 63 128
29.10% 24.10% 38.90% 32.00%
Total 151 87 162 400
100.00% 100.00% 100.00% 100.00%
Source: Primary Data
From the above table 6 the researcher infers that the majority of 128 (32.0) and 128 (32.0)
percent of ‘above 5 hours’ and ‘three hours’ the faculty members’ time spent in the library or resource
Centre. (24.5) percent of time spent in ‘two hours’ in faculty members and remaining the (11.5) percent
of time spent in ‘below one hour’. The researcher found in the table 7 some faculty members visit the
library a few hours utilizing, so the change the library environment digitally forms and new arrivals
increase or to create awareness.
[Information Seeking Behaviour of Faculty Members in the Business Management Educational
Institutions Information Knowledge Resource Centre’s in Chennai City: An Analytical Study the date]
IJNGLT , MAY 2017
VOLUME 3 ISSUE 2
ww.ijnglt.com International Journal of Next Generation Library and Technologies (ISSN 2395 – 5201) Page 16
Table No. 6.1 Time spent Chi-Square Tests
Value df
Asymp. Sig.
(2-sided)
Pearson Chi-Square 40.810a 6 .000
Null hypothesis H0. There is no association between result reveals that the calculated value of socio
economic characteristics in the time spentchi-square value is significant at 0.01 levels of its 6 degree of
freedoms. So stated that hypothesis is rejected the table value 40.810a.
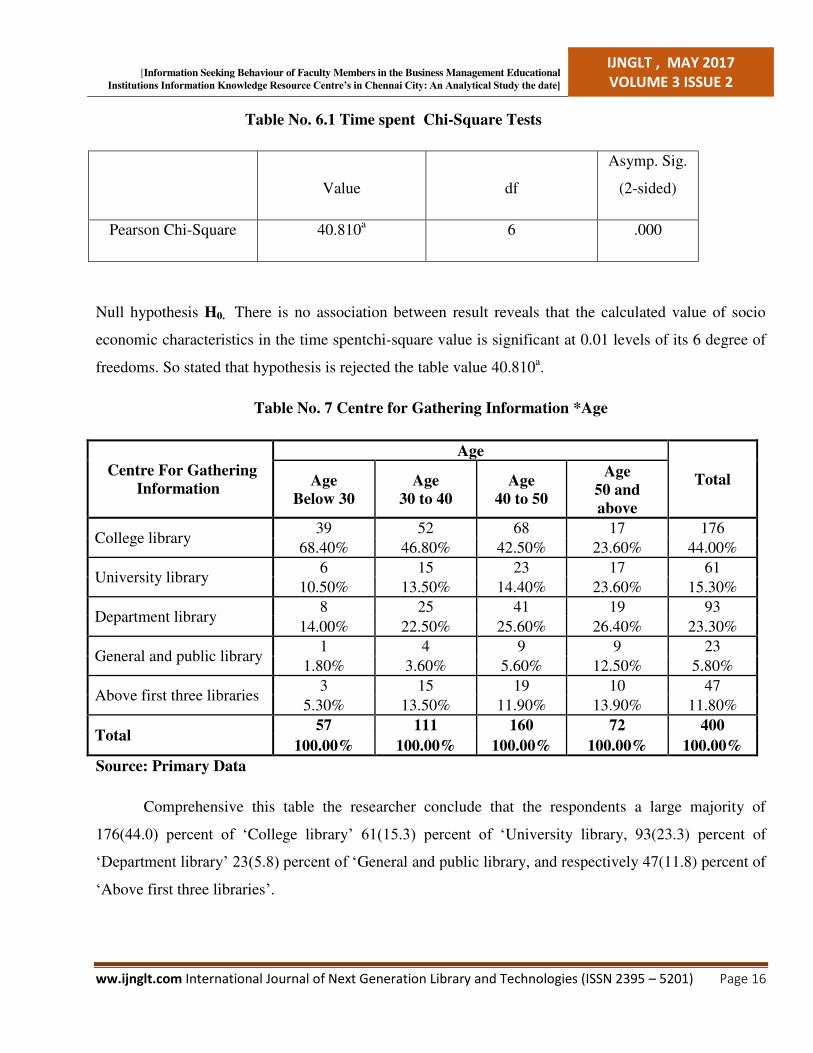
Table No. 7 Centre for Gathering Information *Age
Centre For Gathering
Information
Age
Total Age
Below 30
Age
30 to 40
Age
40 to 50
Age
50 and
above
College library 39 52 68 17 176
68.40% 46.80% 42.50% 23.60% 44.00%
University library 6 15 23 17 61
10.50% 13.50% 14.40% 23.60% 15.30%
Department library 8 25 41 19 93
14.00% 22.50% 25.60% 26.40% 23.30%
General and public library 1 4 9 9 23
1.80% 3.60% 5.60% 12.50% 5.80%
Above first three libraries 3 15 19 10 47
5.30% 13.50% 11.90% 13.90% 11.80%
Total 57 111 160 72 400
100.00% 100.00% 100.00% 100.00% 100.00%
Source: Primary Data
Comprehensive this table the researcher conclude that the respondents a large majority of
176(44.0) percent of ‘College library’ 61(15.3) percent of ‘University library, 93(23.3) percent of
‘Department library’ 23(5.8) percent of ‘General and public library, and respectively 47(11.8) percent of
‘Above first three libraries’.

[Information Seeking Behaviour of Faculty Members in the Business Management Educational
Institutions Information Knowledge Resource Centre’s in Chennai City: An Analytical Study the date]
IJNGLT , MAY 2017
VOLUME 3 ISSUE 2
ww.ijnglt.com International Journal of Next Generation Library and Technologies (ISSN 2395 – 5201) Page 17
Table No. 7.1 Centre for Gathering Information Chi-Square Tests
Value df Asymp. Sig. (2-sided)
Pearson Chi-Square 32.848a 12 .001
Null hypothesis H0. There is no association between result reveals that the calculated value of
socio economic characteristics in the age chi-square value is significant at 0.01 levels of its 12 degree of
freedoms. So stated that hypothesis is rejected the table value 32.848a. The association described by the
crostabulation is a significant one, the result s of chi-square are typically reported as follow, X2=32.848
a.
df = 12, P<.001
Table No. 8 ANOVA
Sum of
Squares df
Mean F Sig.
Square
Time spent Information
Gathering Activities
Between Groups 0.2 2 0.1 0.502 0.606
Within Groups 78.84 397 0.199
Total 79.04 399
Reason for seeking
Information-
Between Groups 1.333 2 0.666 2.534 0.081
Within Groups 104.4 397 0.263
Total 105.8 399
Purposes of online
information seeking
behavior
Between Groups 4.116 2 2.058 7.441 0.001
Within Groups 109.8 397 0.277
Total 113.9 399
Available of Resources
Between Groups 0.094 2 0.047 0.311 0.733
Within Groups 59.8 397 0.151
Total 59.89 399
Frequently Use of
Information Sources
Between Groups 3.19 2 1.595 5.432 0.005
Within Groups 116.6 397 0.294
Total 119.8 399
Formet of Document
Between Groups 2.431 2 1.215 2.878 0.057
Within Groups 167.7 397 0.422
Total 170.1 399
Accessibility Business
Information
Between Groups 1.816 2 0.908 4.499 0.012
Within Groups 80.14 397 0.202
Total 81.95 399
Search Engine
Between Groups 1.196 2 0.598 1.949 0.144
Within Groups 121.9 397 0.307
Total 123.1 399
Important of information
sources
Between Groups 4.664 2 2.332 7.375 0.001
Within Groups 125.5 397 0.316

[Information Seeking Behaviour of Faculty Members in the Business Management Educational
Institutions Information Knowledge Resource Centre’s in Chennai City: An Analytical Study the date]
IJNGLT , MAY 2017
VOLUME 3 ISSUE 2
ww.ijnglt.com International Journal of Next Generation Library and Technologies (ISSN 2395 – 5201) Page 18
Total 130.2 399
Important management
databases
Between Groups 4.151 2 2.075 7.338 0.001
Within Groups 112.3 397 0.283
Total 116.4 399
Satisfied information
services
Between Groups 1.673 2 0.836 3.803 0.023
Within Groups 87.31 397 0.22
Total 88.98 399
Satisfied ICT Products
and Services
Between Groups 5.056 2 2.528 8.664 0
Within Groups 115.8 397 0.292
Total 120.9 399
Satisfied E-Journals
Online Databases
Between Groups 2.031 2 1.015 4.371 0.013
Within Groups 92.24 397 0.232
Total 94.27 399
Opinion Library
Resources and Services
Between Groups 2.743 2 1.372 4.439 0.012
Within Groups 122.7 397 0.309
Total 125.4 399
Source: Primary Data
From the above results research has been summarized as per the hypothesis framed study. The
significance of the fourteen parameters of the study to evaluate as 1 percent and 5 percent level and
respondent opinion of library available of resources and services in management educational
institutional in Chennai city has been identified for the study.
All the hypothesis of above ANOVA table are rejected, remaining is accepted. Hence most of the
respondents are significantly not differed in their views on available of resources, format of document,
searching engine, time spent in gathering information activities, reason for information seeking, opinion
library resources and services.
Table No.9 Coefficientsa
Model
Unstandardized
Coefficients
Standardized
Coefficients
t Sig.
B Std.
Error Beta
(Constant) -1.722 .166 -10.363 .000

[Information Seeking Behaviour of Faculty Members in the Business Management Educational
Institutions Information Knowledge Resource Centre’s in Chennai City: An Analytical Study the date]
IJNGLT , MAY 2017
VOLUME 3 ISSUE 2
ww.ijnglt.com International Journal of Next Generation Library and Technologies (ISSN 2395 – 5201) Page 19
Time spent Information Gathering Activities .162 .036 .126 4.527 .000
Reason for seeking Information- .105 .027 .119 3.843 .000
Purposes of online information seeking behavior .099 .028 .114 3.522 .000
Available of Resources .067 .033 .063 2.046 .041
Frequently Use of Information Sources .109 .030 .113 3.672 .000
Format of Document .147 .037 .115 3.952 .000
Accessibility Business Information .126 .029 .130 4.379 .000
Search Engine .132 .026 .142 5.002 .000
Important of information sources .129 .029 .144 4.433 .000
Important management databases .141 .031 .152 4.565 .000
Satisfied information services .144 .031 .146 4.711 .000
Satisfied ICT Products and Services .155 .033 .142 4.666 .000
Satisfied E-Journals Online Databases .089 .030 .094 2.956 .003
Opinion Library Resources and Services .094 .028 .103 3.364 .001
a. Dependent Variable: R all
Source: Primary Data
Table above table determined that the ‘t’ value and ‘p’ values suggest the independent variable has
confident and significant impact on the dependent variable. The output of the regression analysis shows
that ‘information seeking behavior of business management faculty members in Chennai city libraries to
spent time gathering information activities have a significant (β = .162; t value = 4.527), respectively
format of document have a significant (β = .147; t value = 3.952), to create awareness of digital
documents. And satisfied ICT product and services have a significant (β = .155; t value = 4.666), Hence
the library resources impact of management faculty members in Chennai city is very significant to the
[Information Seeking Behaviour of Faculty Members in the Business Management Educational
Institutions Information Knowledge Resource Centre’s in Chennai City: An Analytical Study the date]
IJNGLT , MAY 2017
VOLUME 3 ISSUE 2
ww.ijnglt.com International Journal of Next Generation Library and Technologies (ISSN 2395 – 5201) Page 20
faculty seeking information there.
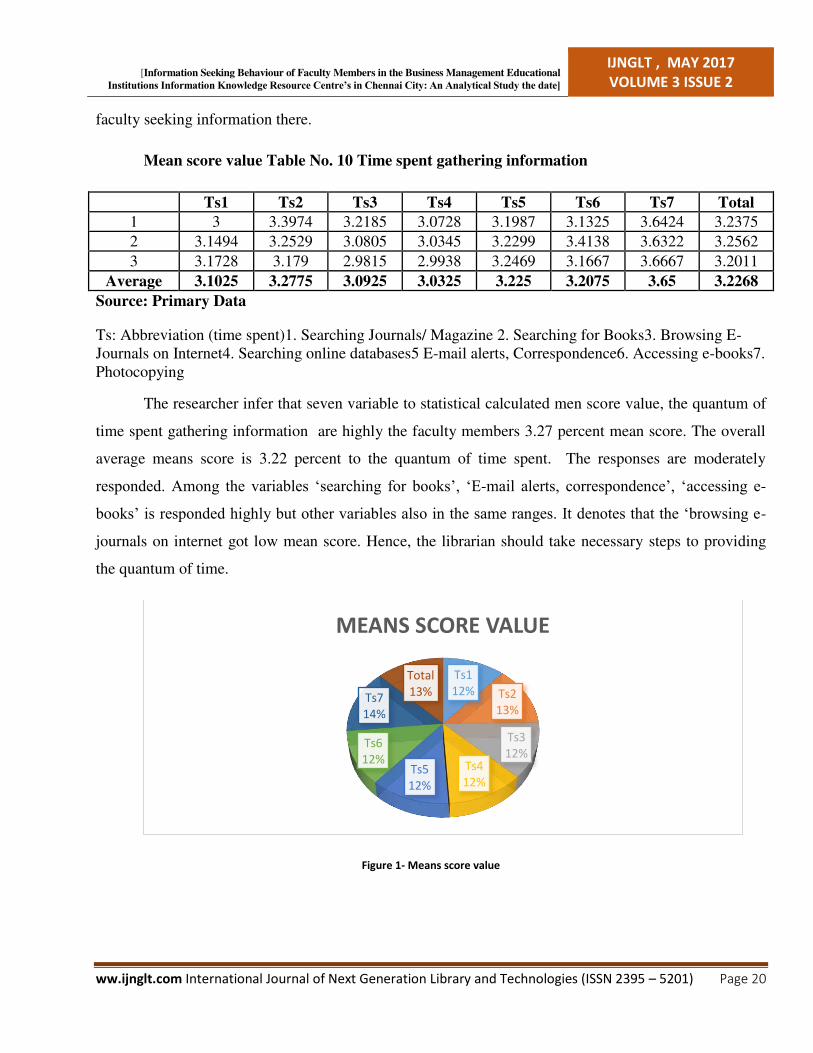
Mean score value Table No. 10 Time spent gathering information
Ts1 Ts2 Ts3 Ts4 Ts5 Ts6 Ts7 Total
1 3 3.3974 3.2185 3.0728 3.1987 3.1325 3.6424 3.2375
2 3.1494 3.2529 3.0805 3.0345 3.2299 3.4138 3.6322 3.2562
3 3.1728 3.179 2.9815 2.9938 3.2469 3.1667 3.6667 3.2011
Average 3.1025 3.2775 3.0925 3.0325 3.225 3.2075 3.65 3.2268
Source: Primary Data
Ts: Abbreviation (time spent)1. Searching Journals/ Magazine 2. Searching for Books3. Browsing E-
Journals on Internet4. Searching online databases5 E-mail alerts, Correspondence6. Accessing e-books7.
Photocopying
The researcher infer that seven variable to statistical calculated men score value, the quantum of
time spent gathering information are highly the faculty members 3.27 percent mean score. The overall
average means score is 3.22 percent to the quantum of time spent. The responses are moderately
responded. Among the variables ‘searching for books’, ‘E-mail alerts, correspondence’, ‘accessing e-
books’ is responded highly but other variables also in the same ranges. It denotes that the ‘browsing e-
journals on internet got low mean score. Hence, the librarian should take necessary steps to providing
the quantum of time.
Figure 1- Means score value
Ts1
12% Ts2
13%
Ts3
12% Ts4
12% Ts5
12%
Ts6
12%
Ts7
14%
Total
13%
MEANS SCORE VALUE

[Information Seeking Behaviour of Faculty Members in the Business Management Educational
Institutions Information Knowledge Resource Centre’s in Chennai City: An Analytical Study the date]
IJNGLT , MAY 2017
VOLUME 3 ISSUE 2
ww.ijnglt.com International Journal of Next Generation Library and Technologies (ISSN 2395 – 5201) Page 21
Table No. 11 Teaching / Guiding research/ students* Designation
Teaching / Guiding
research/ students
Designation
Total Asst.
professor
Associate
professor Professor
Not Important 0 0 0 0
0% 0% 0% 0%
Slightly Important 1 2 0 3
0.70% 2.30% 0.00% 0.80%
Moderately Important 7 10 22 39
4.60% 11.50% 13.60% 9.80%
Important 56 45 68 169
37.10% 51.70% 42.00% 42.30%
Very Important 87 30 72 189
57.60% 34.50% 44.40% 47.30%
Total 151 87 162 400
100.00% 100.00% 100.00% 100.00%
Above this table reason for information seeking behaviour of faculty members describes that the
Likert five point scale used. Overall this table the researcher infer that three cadre of respondents the
majority of 189(47.3) percent of ‘Very important’ 169 (42.3) percent of ‘Important’ 39 (9.8) percent of
‘Moderately important’ and respectively 3(0.8) percent of “slightly Important’.
Table No. 12Access of information Sources
Access of information
Sources
Designation
Total Asst.
professor
Associate
professor Professor
Circulation- Issue/ return 21 11 10 42
13.90% 12.60% 6.20% 10.50%
E-mail alerts 13 7 27 47
8.60% 8.00% 16.70% 11.80%
Multimedia (DVD,CD) 7 16 14 37
4.60% 18.40% 8.60% 9.30%
Internet 13 18 19 50
8.60% 20.70% 11.70% 12.50%

[Information Seeking Behaviour of Faculty Members in the Business Management Educational
Institutions Information Knowledge Resource Centre’s in Chennai City: An Analytical Study the date]
IJNGLT , MAY 2017
VOLUME 3 ISSUE 2
ww.ijnglt.com International Journal of Next Generation Library and Technologies (ISSN 2395 – 5201) Page 22
Newspaper Services 18 3 16 37
11.90% 3.40% 9.90% 9.30%
Photocopy (Reprography) 17 4 24 45
11.30% 4.60% 14.80% 11.30%
Library OPAC / Web OPAC 22 8 11 41
14.60% 9.20% 6.80% 10.30%
Online Database 12 4 10 26
7.90% 4.60% 6.20% 6.50%
Display of New Arrivals 17 2 15 34
11.30% 2.30% 9.30% 8.50%
Reference Service 11 14 16 41
7.30% 16.10% 9.90% 10.30%
Total 151 87 162 400
100.00% 100.00% 100.00% 100.00%
Overall this table the researcher infer that three cadre of respondents the access of information
42(10.5) percent of ‘Circulation- Issue/ return’, 47(11.8) percent of ‘E-mail alert’, 37(9.3) percent of
‘Multimedia (DVD,CD)’ 50(12.5) percent of ‘Internet’, 37(9.3) percent of ‘Newspaper’, 45(11.3)
percent of ‘Photocopy’, 41(10.3) percent of ‘Library OPAC/Web OPAC’, 26(6.5) percent of ‘Online
Database’, 34(8.5) percent of ‘Display of new arrivals’, and respectively 41(10.3) percent of ‘Reference
service’
Table No. 13 Access of information Sources Chi-Square
Value df Asymp. Sig. (2-sided)
Pearson Chi-Square 53.523a 18 .000
Hence the chi-square test was applied for the purpose of examining the significance of
relationship between levels of access of information sources towards impact of library user. Null
hypothesis H0 there is no association between results reveals that the calculated value of access of
[Information Seeking Behaviour of Faculty Members in the Business Management Educational
Institutions Information Knowledge Resource Centre’s in Chennai City: An Analytical Study the date]
IJNGLT , MAY 2017
VOLUME 3 ISSUE 2
ww.ijnglt.com International Journal of Next Generation Library and Technologies (ISSN 2395 – 5201) Page 23
information sources chi-square value is significant at 0.01 levels of its 18 degree of freedoms. So stated
that hypothesis is rejected the table value 53.523a
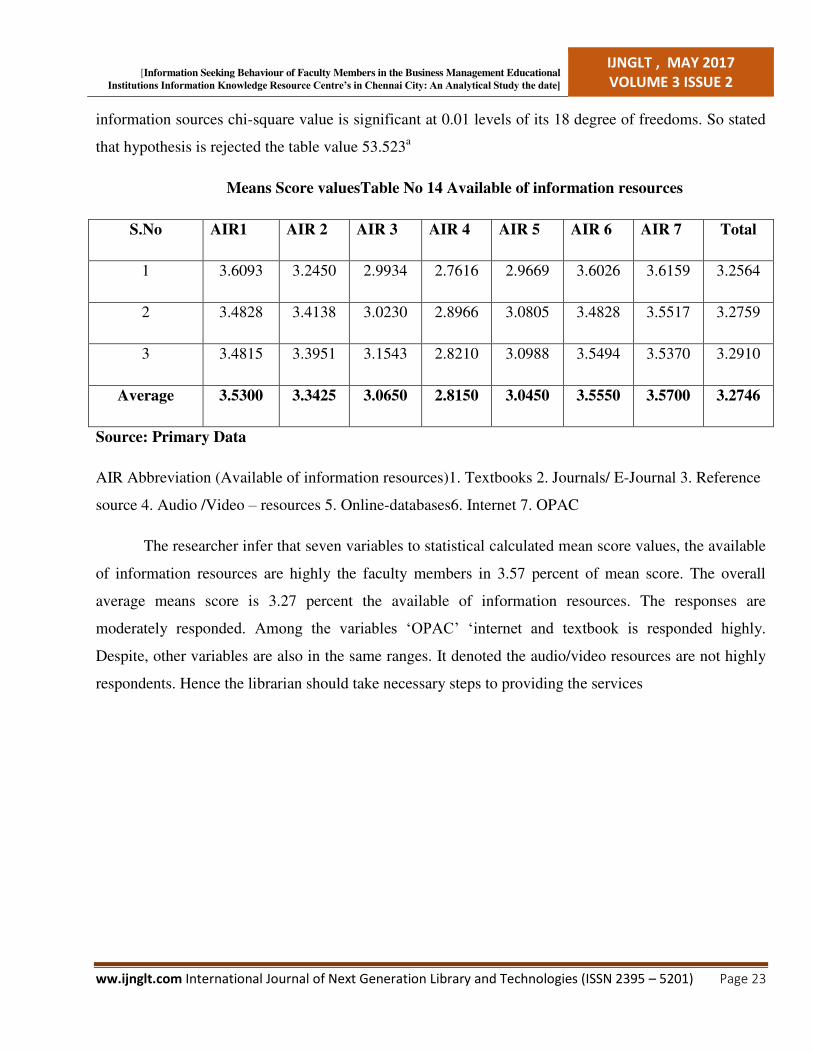
Means Score valuesTable No 14 Available of information resources
S.No AIR1 AIR 2 AIR 3 AIR 4 AIR 5 AIR 6 AIR 7 Total
1 3.6093 3.2450 2.9934 2.7616 2.9669 3.6026 3.6159 3.2564
2 3.4828 3.4138 3.0230 2.8966 3.0805 3.4828 3.5517 3.2759
3 3.4815 3.3951 3.1543 2.8210 3.0988 3.5494 3.5370 3.2910
Average 3.5300 3.3425 3.0650 2.8150 3.0450 3.5550 3.5700 3.2746
Source: Primary Data
AIR Abbreviation (Available of information resources)1. Textbooks 2. Journals/ E-Journal 3. Reference
source 4. Audio /Video – resources 5. Online-databases6. Internet 7. OPAC
The researcher infer that seven variables to statistical calculated mean score values, the available
of information resources are highly the faculty members in 3.57 percent of mean score. The overall
average means score is 3.27 percent the available of information resources. The responses are
moderately responded. Among the variables ‘OPAC’ ‘internet and textbook is responded highly.
Despite, other variables are also in the same ranges. It denoted the audio/video resources are not highly
respondents. Hence the librarian should take necessary steps to providing the services
[Information Seeking Behaviour of Faculty Members in the Business Management Educational
Institutions Information Knowledge Resource Centre’s in Chennai City: An Analytical Study the date]
IJNGLT , MAY 2017
VOLUME 3 ISSUE 2
ww.ijnglt.com International Journal of Next Generation Library and Technologies (ISSN 2395 – 5201) Page 24
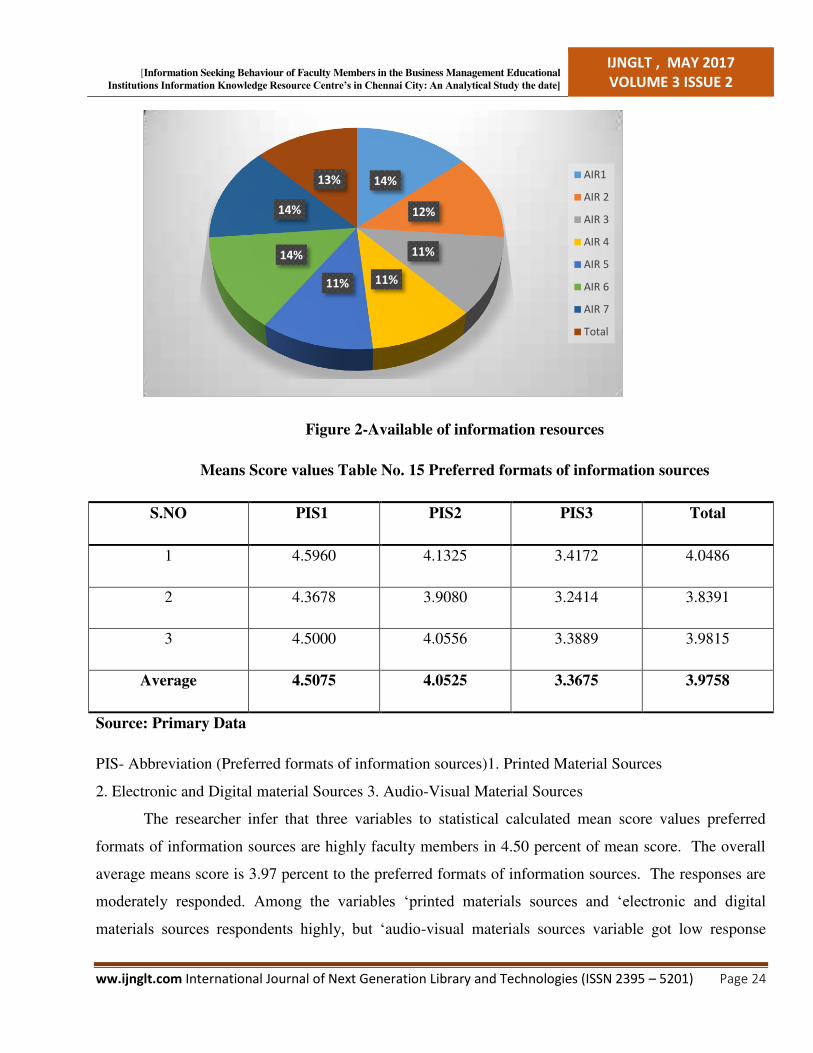
Figure 2-Available of information resources
Means Score values Table No. 15 Preferred formats of information sources
S.NO PIS1 PIS2 PIS3 Total
1 4.5960 4.1325 3.4172 4.0486
2 4.3678 3.9080 3.2414 3.8391
3 4.5000 4.0556 3.3889 3.9815
Average 4.5075 4.0525 3.3675 3.9758
Source: Primary Data
PIS- Abbreviation (Preferred formats of information sources)1. Printed Material Sources
2. Electronic and Digital material Sources 3. Audio-Visual Material Sources
The researcher infer that three variables to statistical calculated mean score values preferred
formats of information sources are highly faculty members in 4.50 percent of mean score. The overall
average means score is 3.97 percent to the preferred formats of information sources. The responses are
moderately responded. Among the variables ‘printed materials sources and ‘electronic and digital
materials sources respondents highly, but ‘audio-visual materials sources variable got low response
14%
12%
11%
11% 11%
14%
14%
13% AIR1
AIR 2
AIR 3
AIR 4
AIR 5
AIR 6
AIR 7
Total

[Information Seeking Behaviour of Faculty Members in the Business Management Educational
Institutions Information Knowledge Resource Centre’s in Chennai City: An Analytical Study the date]
IJNGLT , MAY 2017
VOLUME 3 ISSUE 2
ww.ijnglt.com International Journal of Next Generation Library and Technologies (ISSN 2395 – 5201) Page 25
among the variables. Hence, the librarian should take necessary steps to increase audio- visual materials
sources usage in this study area.
Table No.16 Problems faced in searching information * Designation
Problems faced in searching information
Designation
Total Asst.
professor
Associate
professor Professor
Unavailability Of Resources 23 12 7 42
15.20% 13.80% 4.30% 10.50%
Lack Of Awareness About The Library
Resources
13 8 32 53
8.60% 9.20% 19.80% 13.30%
Technical Difficulties Like Power Failure,
Internet Connection, Etc.
10 17 25 52
6.60% 19.50% 15.40% 13.00%
Not Taking Proper Assistance From The
Library Staffs
8 21 21 50
5.30% 24.10% 13.00% 12.50%
Do Not Know How To Use Online 23 6 18 47
15.20% 6.90% 11.10% 11.80%
Lack Of Facilities 15 7 28 50
9.90% 8.00% 17.30% 12.50%
Time Duration During The Search 15 10 9 34
9.90% 11.50% 5.60% 8.50%
Lack Of Knowledge In Using The Library
system
20 3 9 32
13.20% 3.40% 5.60% 8.00%
Some Information Materials Are Too Old 24 3 13 40
15.90% 3.40% 8.00% 10.00%
Total 151 87 162 400
100.00% 100.00% 100.00% 100.00%
Inclusive this table the researcher infer that the respondents problems faced in searching for
information 42(10.5) percent of ‘Unavailability Of Resources’, 53(13.3) percent of ‘Lack Of Awareness
About The Library Resources’, 52(13.0) percent of ‘Technical Difficulties Like Power Failure, Internet

[Information Seeking Behaviour of Faculty Members in the Business Management Educational
Institutions Information Knowledge Resource Centre’s in Chennai City: An Analytical Study the date]
IJNGLT , MAY 2017
VOLUME 3 ISSUE 2
ww.ijnglt.com International Journal of Next Generation Library and Technologies (ISSN 2395 – 5201) Page 26
Connection, Etc.’ 50(12.5) percent of ‘Not Taking Proper Assistance From The Library Staffs’, 47(11.8)
percent of ‘Do Not Know How To Use Online’, 50(12.5) percent of ‘Lack Of Facilities ‘, 34(8.5)
percent of ‘Time Duration During the Search’, and respectively 32(8.0) percent of ‘Lack Of Knowledge
In Using The Library system’, 40(10.0) percent of ‘Some Information Materials Are Too Old’.
Table No. 16.1 Problem faced in searching information Chi-Square Tests
Value df Asymp. Sig. (2-sided)
Pearson Chi-Square 72.461a 16 .000
Hence the chi-square test was applied for the purpose of examining the significance of
relationship between levels of problem faced in searching information towards impact of library user.
Null hypothesis H0, There is no association between results reveals that the calculated value of problem
faced in searching informationchi-square value is significant at .001 levels of its 16 degree of freedoms.
So stated that hypothesis is rejected the table value 72.461a
(Critical value 1 percent =32.000).
Means score valueTable No. 17Opinion Library Resources and Services
S.No O1 O2 O3 O4 O5 O6 Total
1 3.8411 3.2980 3.0132 3.0662 2.6291 2.3046 3.0254
2 3.6782 3.3793 3.2529 2.9770 2.8276 2.5057 3.1034
3 3.6173 3.3642 3.4074 3.3025 2.8210 2.7593 3.2119
Average 3.7150 3.3425 3.2250 3.1425 2.7500 2.5325 3.1179
Source: Primary Data
O- Abbreviation (Opinion)1. Library resources and services 2. Library website 3. Library computerized
online catalogue 4. News awareness / clipping / current articles 5. Notification of new arrival 6.
Provision of subscription of books/ journal/report
The average means of the opinion library resources and services of the respondents from
management faculty members is Chennai City. The researcher infer that six variables to statistical
[Information Seeking Behaviour of Faculty Members in the Business Management Educational
Institutions Information Knowledge Resource Centre’s in Chennai City: An Analytical Study the date]
IJNGLT , MAY 2017
VOLUME 3 ISSUE 2
ww.ijnglt.com International Journal of Next Generation Library and Technologies (ISSN 2395 – 5201) Page 27
calculated mean score vales the opinion library resources and services are highly the faculty members is
3.71 percent mean score. The overall average means score 3.11 percent to the opinion library resources
and services. The responses are moderately responded. Despite, other variables are also in the same
ranges. It denotes that all the services are not highly opinion library resources and services the
respondents. Hence, the librarian should take necessary steps to providing the services against
‘Notification of new arrival’ and Provision of subscription of books/ journal/report’.
Means Score values Table No. 74 E-Journals Online Databases
S,NO SEJ1 SEJ2 SEJ3 SEJ4 SEJ5 SEJ6 Total
1 4.4371 4.2185 4.0861 3.9536 3.5695 2.1523 3.7362
2 4.2989 4.2069 4.2529 4.0805 3.7701 2.4368 3.8410
3 4.0370 4.2593 4.2963 4.2469 4.0185 2.5185 3.8961
Average 4.2450 4.2325 4.2075 4.1000 3.7950 2.3625 3.8238
Source: Primary Data
SEJ-Abbreviation (Satisfied - E-Journals Online Databases)1. ISI Emerging Markets2. India Stat3.
EBSCO4. ProQuest ABI/INFORM5. Emerald Management6. Science Direct
The average mean of the Satisfied the - E-journals online databases of the respondents from
management faculty members in Chennai City, the researcher infer that six variables to statistical
calculated mean score values satisfied the - E-journals online databases are highly the faculty members
in 4.24 percent means score. The overall average means score is 3.82 percent to the satisfied the - E-
journals online databases. The responses are moderately responded. Despite, other variables are also in
the same ranges. It denotes that all the E-journals online databases the services are not highly satisfied
the respondents. Hence the librarian should take necessary steps to provide the services against ‘science
direct’.
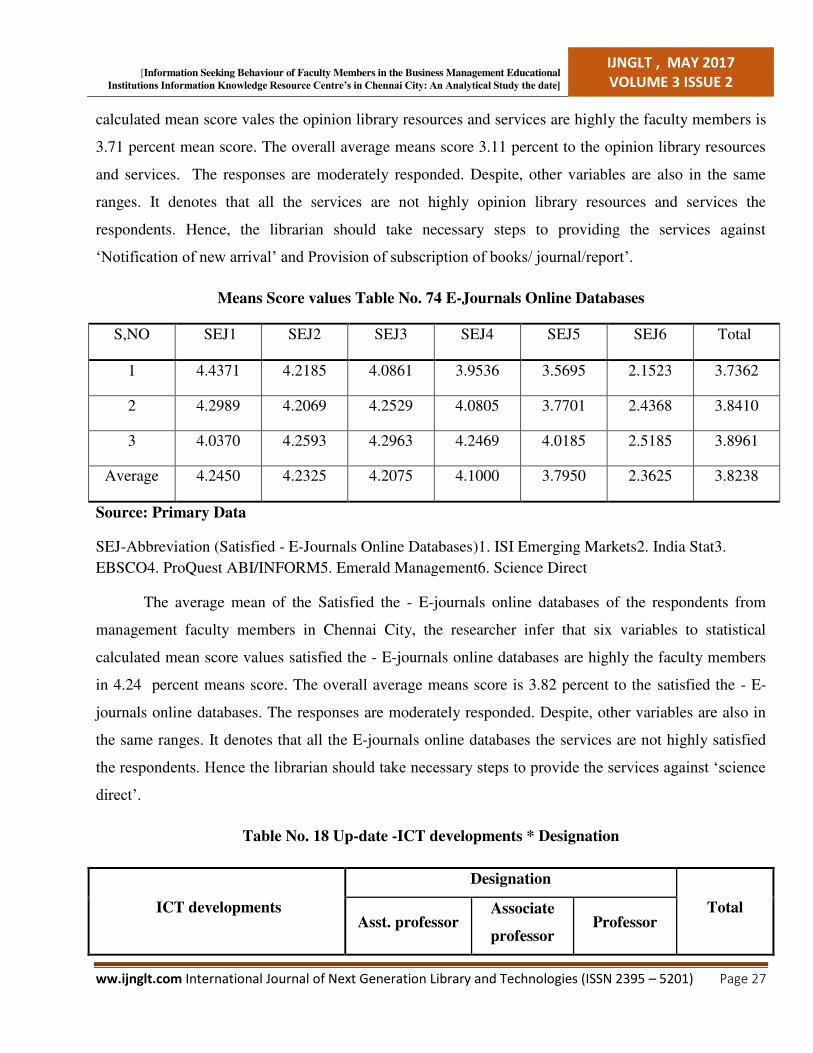
Table No. 18 Up-date -ICT developments * Designation
ICT developments
Designation
Total Asst. professor
Associate
professor Professor

[Information Seeking Behaviour of Faculty Members in the Business Management Educational
Institutions Information Knowledge Resource Centre’s in Chennai City: An Analytical Study the date]
IJNGLT , MAY 2017
VOLUME 3 ISSUE 2
ww.ijnglt.com International Journal of Next Generation Library and Technologies (ISSN 2395 – 5201) Page 28
Internet 25 17 39 81
16.60% 19.50% 24.10% 20.30%
E-Mail 16 14 30 60
10.60% 16.10% 18.50% 15.00%
Workshops, Seminars And
Conferences
28 12 12 52
18.50% 13.80% 7.40% 13.00%
Professional Books / Journals 24 15 7 46
15.90% 17.20% 4.30% 11.50%
News Letters 21 8 17 46
13.90% 9.20% 10.50% 11.50%
Research Journals 16 8 30 54
10.60% 9.20% 18.50% 13.50%
World Wide Web 21 13 27 61
13.90% 14.90% 16.70% 15.30%
Total 151 87 162 400
100.00% 100.00% 100.00% 100.00%
Source: Primary Data
Above this table up-date ICT developmentsin the faculty members,the researcher infer that the assistant
professor 25(16.6) percent of ‘Internet’, 16(10.6) percent of ‘E-mail’, 28(18.5)’, ‘Workshops, Seminars
and Conferences’, 24(15.9) percent of ‘Professional Books / Journals’ 21(13.9) percent of ‘ News
Letters’, 16(10.6) percent of ‘Research Journal’ 21(13.9) percent of ‘World wide web’.
Associate professor 17(19.5) percent of ‘Internet’,14(16.1) percent of ‘E-mail’, 12(13.8)’,
‘Workshops, Seminars and Conferences’, 15(17.2) percent of ‘Professional Books / Journals’ 8(9.2)
percent of ‘News Letters’, 8(9.2) both are same percent of ‘Research Journal’ 13(14.9) percent of
‘World wide web’.
Professor 39(24.1) percent of ‘Internet’, 30(18.5) percent of ‘E-mail’, 12(7.4)’, ‘Workshops,
Seminars and Conferences’,7(4.3) percent of ‘Professional Books / Journals’ 17(10.5) percent of ‘News
Letters’, 30(18.5) both are same percent of ‘Research Journal’ 27(16.7) percent of ‘World wide web’.

[Information Seeking Behaviour of Faculty Members in the Business Management Educational
Institutions Information Knowledge Resource Centre’s in Chennai City: An Analytical Study the date]
IJNGLT , MAY 2017
VOLUME 3 ISSUE 2
ww.ijnglt.com International Journal of Next Generation Library and Technologies (ISSN 2395 – 5201) Page 29
Overall this table the researcher infers that three cadre of respondents, 81(20.3) percent of ‘Internet’,
60(15.0) percent of E-mail’, 52(13.0)’, ‘Workshops, Seminars and Conferences’, 46(11.5) percent of
‘Professional Books / Journals’ 46(11.5) percent of ‘News Letters’, both are same percent and
respectively 54(13.5) percent of ‘Research Journal’ 61(15.3) percent of ‘World wide web’
Table No. 18.1 Up-date -ICT developments * Designation Chi-Square Tests
Value df Asymp. Sig. (2-sided)
Pearson Chi-Square 32.227a 12 .001
The Chi-square test has been employed to test the relationship between the personal
characteristics, particularly up-date -ICT developments; these propositions hold good in the same would
have to test through statistical analysis. Hence the chi-square test was applied for the purpose of
examining the significance of relationship between levels of up-date -ICT developments towards impact
of library user. Null hypothesis H0, there is no association between results reveals that the calculated
value of up-date -ICT developments chi-square value is significant at 0.01 levels of its 16 degree of
freedoms. So stated that hypothesis is rejected the table value 32.227a(Critical value 1 percent
=32.000). df =16 32.000)
Findings and conclusion
This chapter is the management faculty members to be used the library resources. Now a days
network era the management colleges to provide the better services, to connect the internet, Wi-Fi-
technology, online databases, open access e-resources, e-mail alerts, lending better systems, ICT
product (information communication technology), web OPAC, off-line access (CD/DVD), e-resources
kept in the digital repositories, current awareness services, content page, online database abstract
services, the 21st century every one behavior have been to adapted technology of network systems, also
the library and information science like open sources. Recently the back born the libraries the
management of electronic resources will be too much of demands the ICT electronic publication. The
academic library structure already changes to management educational institutions have connect using
inter net and Wi-Fi connecting to libraries, to develop the traditional sources into digital formats, the

[Information Seeking Behaviour of Faculty Members in the Business Management Educational
Institutions Information Knowledge Resource Centre’s in Chennai City: An Analytical Study the date]
IJNGLT , MAY 2017
VOLUME 3 ISSUE 2
ww.ijnglt.com International Journal of Next Generation Library and Technologies (ISSN 2395 – 5201) Page 30
faculty members to visit , the library portal and helps the IP address, the user to browsing the full text
articles, cases. The management college libraries to have the media room, seminar room, and discussion
room, webinar room to provide the facility, the faculty might take advantages of world’s valuable
literature update the faculty members.
The majority of teaching faculty members in gender wise male 270(67.5).
Inclusive the mainstream the age group 160 (40.0) percent of the respondents are stated that 40
to 50 age.
Null hypothesis H0. There is no association between result reveals that the calculated value of
socio economic characteristics in the age chi-square value is significant at 0.01 levels of its 6
degree of freedoms. So stated that hypothesis is rejected the table value 111.563.
The researcher overall infers that educational qualification the faculty members in a large
majority of respondent 175 (43.8) highest degree in Ph.D. holder,
The educational qualification chi-square value is significant at 0.01 levels of its 4 degree of
freedoms. So stated that hypothesis is rejected the table value 63.078. The association described
by the cross tabulation is a significant one, the result s of chi-square are typically reported as
follow, X2=63.078. df = 4, P<.001
A large majority of respondent 128 (32.0) percent of ‘10 to 15 years’, 94 (23.5) respondents 5 to
10 years.
The total years of professional service chi-square value is significant at 0.01 levels of its 8 degree
of freedoms. So stated that hypothesis is rejected the table value 110.006. The association
described by the crostabulation is a significant one, the result s of chi-square are typically
reported as follow, X2=110.006
a. df = 8, P<.001
Inclusive this table the researcher infer that the faculty members in the highly indicate point of
175(48.8) percent of ‘daily’ 93(23.3) percent of ‘Once in a week’, 2352(13.0) percent of ‘Twice
a week’ 61(15.3) percent of ‘Three times in a week’, 18(4.5) percent of ‘Once in a month’, and
respectively 1(0.3) percent of ‘occasionally’
The researcher infers that the majority of 128 (32.0) and 128 (32.0) percent of ‘above 5 hours’
and ‘three hours’ the faculty members’ time spent in the library or resource Centre.

[Information Seeking Behaviour of Faculty Members in the Business Management Educational
Institutions Information Knowledge Resource Centre’s in Chennai City: An Analytical Study the date]
IJNGLT , MAY 2017
VOLUME 3 ISSUE 2
ww.ijnglt.com International Journal of Next Generation Library and Technologies (ISSN 2395 – 5201) Page 31
Null hypothesis H0. There is no association between result reveals that the calculated value of
socio economic characteristics in the time spentchi-square value is significant at 0.01 levels of its
6 degree of freedoms. So stated that hypothesis is rejected the table value 40.810a.
Comprehensive this table the researcher conclude that the respondents a large majority of
176(44.0) percent of ‘College library’ 61(15.3) percent of ‘University library, 93(23.3) percent of
‘Department library’ 23(5.8) percent of ‘General and public library, and respectively 47(11.8)
percent of ‘Above first three libraries’,
The output of the regression analysis shows that ‘information seeking behavior of business
management faculty members in Chennai city libraries to spent time gathering information
activities have a significant (β = .162; t value = 4.527), respectively format of document have a
significant (β = .147; t value = 3.952), to create awareness of digital documents. And satisfied
ICT product and services have a significant (β = .155; t value = 4.666), Hence the library
resources impact of management faculty members in Chennai city is very significant to the
faculty seeking information there.
The quantum of time spent gathering information are highly the faculty members 3.27 percent
mean score. The overall average means score is 3.22 percent to the quantum of time spent.
Likert five point scale used. Overall this table the researcher infer that three cadre of respondents
the majority of 189(47.3) percent of ‘Very important’
The researcher infer that the respondents problems faced in searching for information 42(10.5)
percent of ‘Unavailability Of Resources’, 53(13.3) percent of ‘Lack Of Awareness About The
Library Resources’, 52(13.0) percent of ‘Technical Difficulties Like Power Failure, Internet
Connection, Etc.
Overall this table the researcher infers that three cadre of respondents, 81(20.3) percent of
‘Internet’, 60(15.0) percent of E-mail’, 52(13.0)’, ‘Workshops, Seminars and Conferences’,
46(11.5) percent of ‘Professional Books / Journals’ 46(11.5) percent of ‘News Letters’, both are
same percent and respectively 54(13.5) percent of ‘Research Journal’ 61(15.3) percent of
‘World wide web’
Null hypothesis H0, there is no association between results reveals that the calculated value of up-
date -ICT developments chi-square value is significant at 0.01 levels of its 16 degree of
freedoms. So stated that hypothesis is rejected the table value 32.227a(Critical value 1 percent
=32.000). df =16 32.000)

[Information Seeking Behaviour of Faculty Members in the Business Management Educational
Institutions Information Knowledge Resource Centre’s in Chennai City: An Analytical Study the date]
IJNGLT , MAY 2017
VOLUME 3 ISSUE 2
ww.ijnglt.com International Journal of Next Generation Library and Technologies (ISSN 2395 – 5201) Page 32
. The information seeking of faculties members or users are changes behavior. IT and Network
technology advanced development due to e-resources publishing and revolutionaries information
Centres. According to collection, services, and the dissemination of information.
Likewise the user needs is very essential, the libraries or information resources Centres have to
incorporate changed measures, for selecting of documents, collection of documents, acquiring with
organizing, now the documents various format along with outmoded format. The librarian have to use
effectively information technology knowledge.
To satisfy of library user community in moving atmosphere, the most important of librarian to
assessment their expectation, demands through user of information seeking behavior studies to create
them too much of satisfying concluding their task.

[Information Seeking Behaviour of Faculty Members in the Business Management Educational
Institutions Information Knowledge Resource Centre’s in Chennai City: An Analytical Study the date]
IJNGLT , MAY 2017
VOLUME 3 ISSUE 2
ww.ijnglt.com International Journal of Next Generation Library and Technologies (ISSN 2395 – 5201) Page 33
Reference;
1. Barbara M. Wildemuth and Donald O. Case (2010) Bulletin of American society for
information science and technology, February-March Vol.36, No.3 pp 35-38
2. Agosto, D.E. & Hughes-Hassell, S. (2005), “People, places, and questions: An investigation of
the everyday life information seeking behaviors of urban young adults”. Library & Information
Science Research, Vol. 27, pp.141–163.
3. Uttor, J. (1999), “The role of law libraries in a democratic culture”. A paper presented at the
1999 NLA National Conference and AGM.Aug.15th-20th.
4. Boadi, B. Y., and Letsolo, P. (2004), “Information Needs and Information Seeking Behavior of
Distance Learners at the Institute of Extra-Mural Studies in Lesotho”.
InformationDevelopment,Vol.20,pp.189199.http://idv.sagepub.com/cgi/content/abstract/20/3/18
9
5. Kingrey, Kelly Patricia, (2005), "Concepts of Information Seeking and Their Presence in the
Practical Library Literature," Library Philosophy and Practice (e-
journal).Paper36.Vol.4,No.2.(Spring2002)http://digitalcommons.unl.edu/libphilprac/36
6. Backlund, J. (2003), “How to claim knowledge: The use of information in the lifeworld of the
educational context. HERDSA2003 Conference Proceedings. Available at http; // surveys,
Canterbury, ac.nz/ herdssa03/pdfsref/ Y005.pdf.
7. Byström, K. (1999), “Task complexity, information types and information sources. Doctoral
Dissertation”. Tampere: University of Tampere. (Acta Universities Tamperensis 688).
8. Uhegbu, A.H. (2007), “The Information User: issues and themes”. OkigweWhytem Publishers,
2007.
9. Ajiboye.O and Tella.A,(2007), “University Undergraduate Students’ Information Seeking
Behavior: Implications for Quality in Higher Education In Africa”. The Turkish Online Journal
of Educational Technology – TOJET January 2007 ISSN: 1303-6521, Vol.6 No. 1 Article 4
10. Ikoja-Odogo, R &Ocholla, D.N. (2004),”Information-seeking behavior of the informal sector
entrepreneurs”: The Uganda Experience. Libri Vol. 54, pp.54-66.
11. Vimaladvi,PN. (2000), “Information needs and search patterns in humanities; users studies.
Indian journal of Information Library & Society Vol.13 No 3-4

[Information Seeking Behaviour of Faculty Members in the Business Management Educational
Institutions Information Knowledge Resource Centre’s in Chennai City: An Analytical Study the date]
IJNGLT , MAY 2017
VOLUME 3 ISSUE 2
ww.ijnglt.com International Journal of Next Generation Library and Technologies (ISSN 2395 – 5201) Page 34
12. Wales, T.(2000), Practice makes perfect? Vet’ information seeking behavior and ion formation
use explored”, Aslib Proceeding, Vol.52 NO.7 July, pp 235-46
13. Shaheen Majid and GavaMugeraaKassim (2000), Information-seeking behavior of international
islamic university malaysia law faculty members,Malaysian Journal of Library & Information
Science, Vol.5, No .2, December , 1-17
14. Wilson T.D. (2000) Human Information behavior, Information science, Vol 3 No.2 p.p.49-55
15. Mahapatra R.K. and Panda K.C. (2001), Information Seeking behavior: A conjectural approach.
SRELS Journal of information Management, No.38 No.2, p.p.121-138.
16. Akinolosarah (2009) Information seeking behavior of lecturer in faculties of education in
obafemiawolowa university of Ibadan; Samaru journal of Information studies Vol 9 No.2 pp.
23-32.
17. Singh Jogender (2010), Information Seeking Behavior of Academic in Government college in
changing scenario. ILA Bulletin ,Vol.46 No.3-4,P.P.232.
18. SenthilVelmurugan.V and Amutha.G (2012) Usage patterns of OPAC Amoung the faculty
members in Indian colleges; Mass communication: International Journal of communication
studies, Vol.6 No3 pp 37-40.
19. Krishna. B, Mahadeva.S and Rajesha.C (2014) User studies @ GSSS institute of engineering
and Technology for women: A survey. Proceeding of the national conference on Information
management in the knowledge Era-25th
October 2014, ISBN: 978-93-80686-71-4, pp76-80
20. Purnima Th. VikasDevichongtham (2005), Information Needs in Education: A Study of college
faculties in Manipur. LA Bulletin 41(2) p.p.16-19.
21. KaushikKiran ,VichareVishakha and PothareDevyani (2011).Information Seeking behavior of
users of cyber Library : A case study of Tata Institute Social science , Journal of Indian library
Association ; 47(1), P.17-25
22. FereydoonAzadeh and ShahrzadGhasemi (2016),Investigating Information-Seeking Behavior
of Faculty Members Based on Wilson’s Model: Case Study of PNU University, Mazandaran,
Iran , Global Journal of Health Science, 8(9); 2016