information technology - mississauga · • increasing network, infrastructure and public sector...
TRANSCRIPT
Information Technology 2015-2018 Business Plan and 2015 Budget
Agenda
2
• Existing Core Services • Vision and Mission • Service Delivery Model • Service Level Issues and Trends
• Service Area Information • Accomplishments and Awards • Benchmarking • Looking Ahead
• Proposed Budget • Balanced Scorecard • Summary
Existing Core Services
3
4
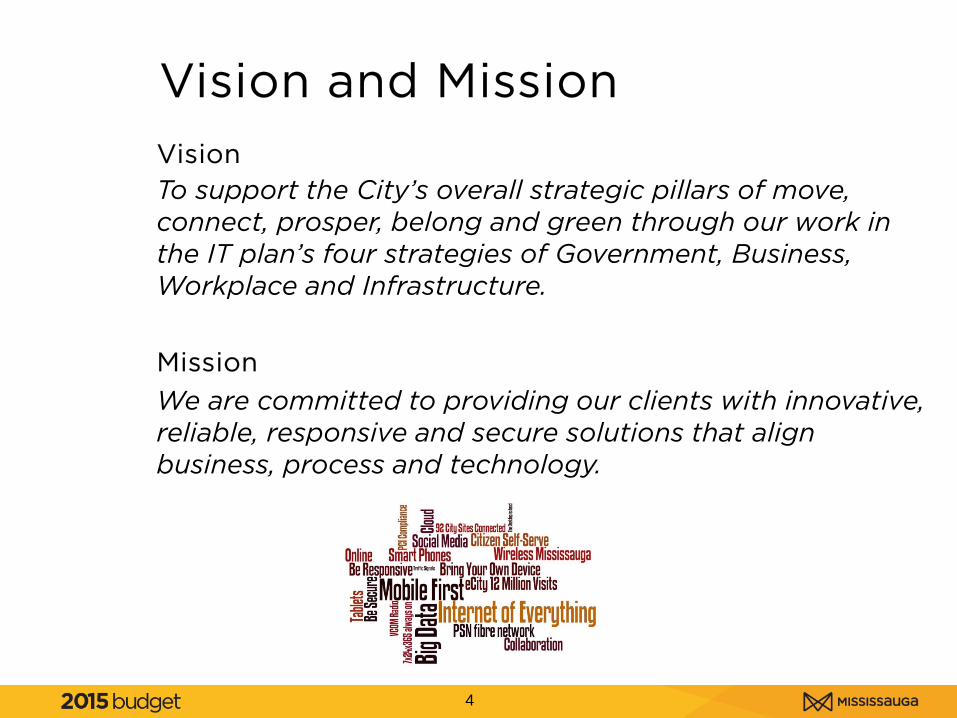
Vision To support the City’s overall strategic pillars of move, connect, prosper, belong and green through our work in the IT plan’s four strategies of Government, Business, Workplace and Infrastructure. Mission We are committed to providing our clients with innovative, reliable, responsive and secure solutions that align business, process and technology.
Vision and Mission
5
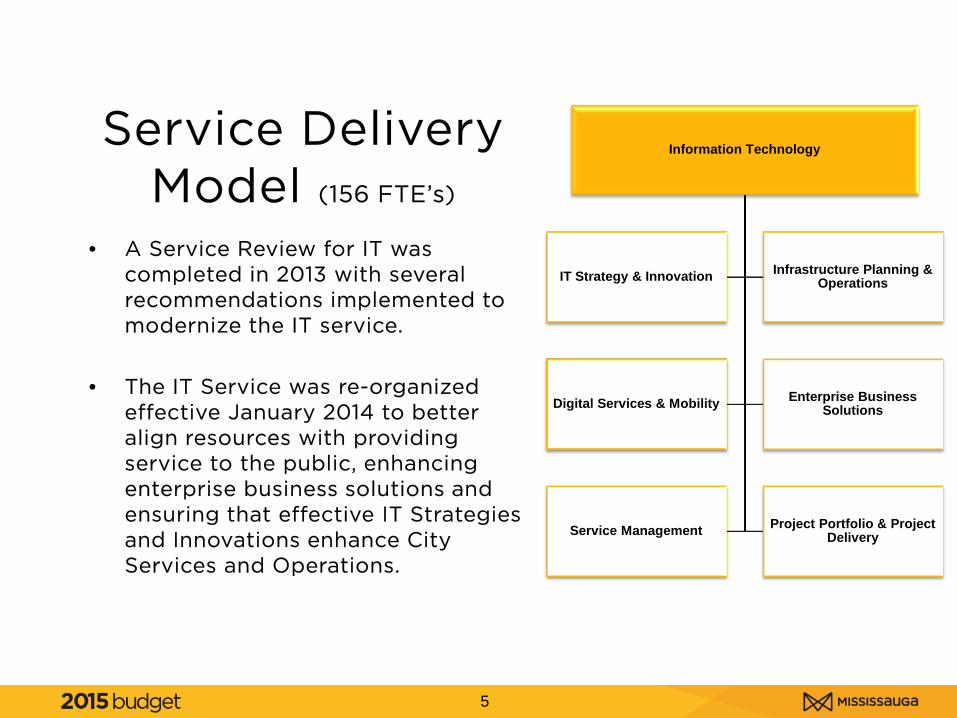
Service Delivery Model (156 FTE’s)
Information Technology
IT Strategy & Innovation Infrastructure Planning & Operations
Digital Services & Mobility Enterprise Business Solutions
Service Management Project Portfolio & Project Delivery
• A Service Review for IT was completed in 2013 with several recommendations implemented to modernize the IT service.
• The IT Service was re-organized effective January 2014 to better align resources with providing service to the public, enhancing enterprise business solutions and ensuring that effective IT Strategies and Innovations enhance City Services and Operations.

Current Service Levels • Citizen Access to Online Services (7*24)
– www.mississauga.ca provides information, online services and payment for services all the time anywhere with many new mobile enabled services going on line.
– 12.5 million customers accessed city services in 2013, a 15% increase
– $8 million in online transactions
6
• Mobility and Location Services (Everywhere) – In vehicle automation for all city buses, fire trucks, snow
plows, and other Works and Operations fleet – Mobile apps and responsive sites
• Digital and Video Streaming (Live!) – Live video production and video streaming of City
Council meetings, General Committee, Budget Committee and support for all other Council chamber public meetings or events
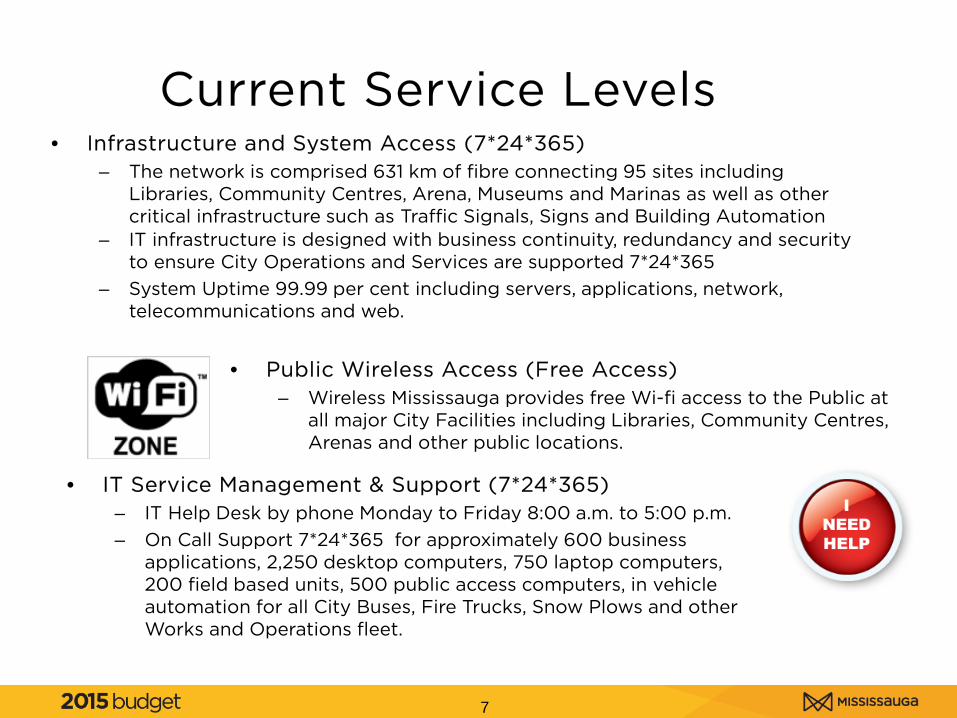
Current Service Levels • Infrastructure and System Access (7*24*365)
– The network is comprised 631 km of fibre connecting 95 sites including Libraries, Community Centres, Arena, Museums and Marinas as well as other critical infrastructure such as Traffic Signals, Signs and Building Automation
7
– IT infrastructure is designed with business continuity, redundancy and security to ensure City Operations and Services are supported 7*24*365
– System Uptime 99.99 per cent including servers, applications, network, telecommunications and web.
• IT Service Management & Support (7*24*365) – IT Help Desk by phone Monday to Friday 8:00 a.m. to 5:00 p.m. – On Call Support 7*24*365 for approximately 600 business
applications, 2,250 desktop computers, 750 laptop computers, 200 field based units, 500 public access computers, in vehicle automation for all City Buses, Fire Trucks, Snow Plows and other Works and Operations fleet.
• Public Wireless Access (Free Access) – Wireless Mississauga provides free Wi-fi access to the Public at
all major City Facilities including Libraries, Community Centres, Arenas and other public locations.
Service Level Issues & Trends
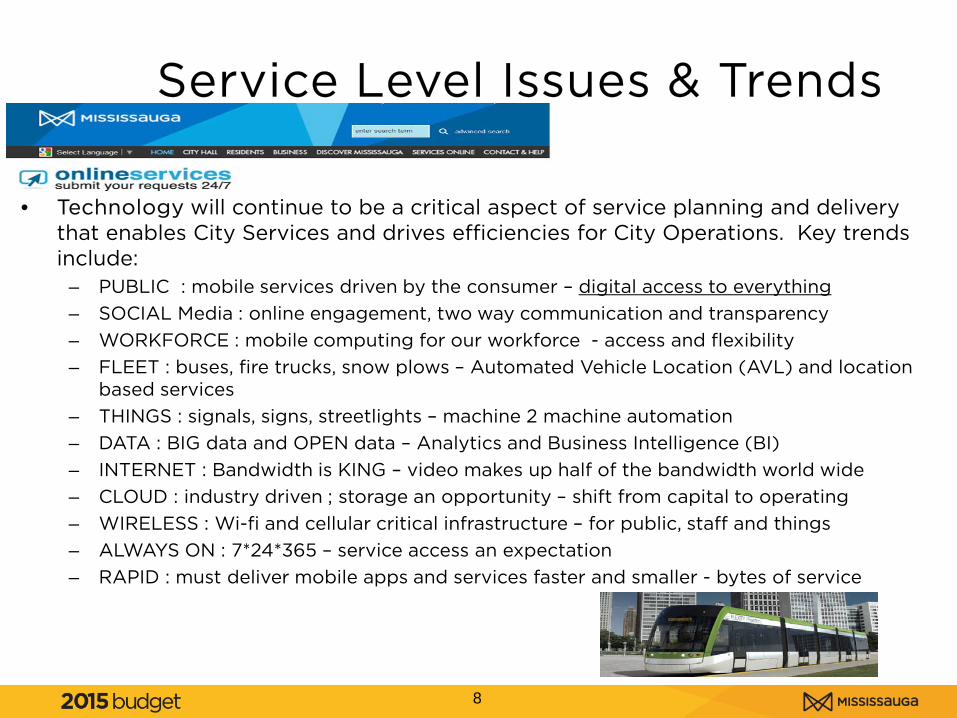
• Technology will continue to be a critical aspect of service planning and delivery that enables City Services and drives efficiencies for City Operations. Key trends include:
– PUBLIC : mobile services driven by the consumer – digital access to everything – SOCIAL Media : online engagement, two way communication and transparency – WORKFORCE : mobile computing for our workforce - access and flexibility – FLEET : buses, fire trucks, snow plows – Automated Vehicle Location (AVL) and location
based services – THINGS : signals, signs, streetlights – machine 2 machine automation – DATA : BIG data and OPEN data – Analytics and Business Intelligence (BI) – INTERNET : Bandwidth is KING – video makes up half of the bandwidth world wide – CLOUD : industry driven ; storage an opportunity – shift from capital to operating – WIRELESS : Wi-fi and cellular critical infrastructure – for public, staff and things – ALWAYS ON : 7*24*365 – service access an expectation – RAPID : must deliver mobile apps and services faster and smaller - bytes of service
8
Service Level Issues & Trends
9
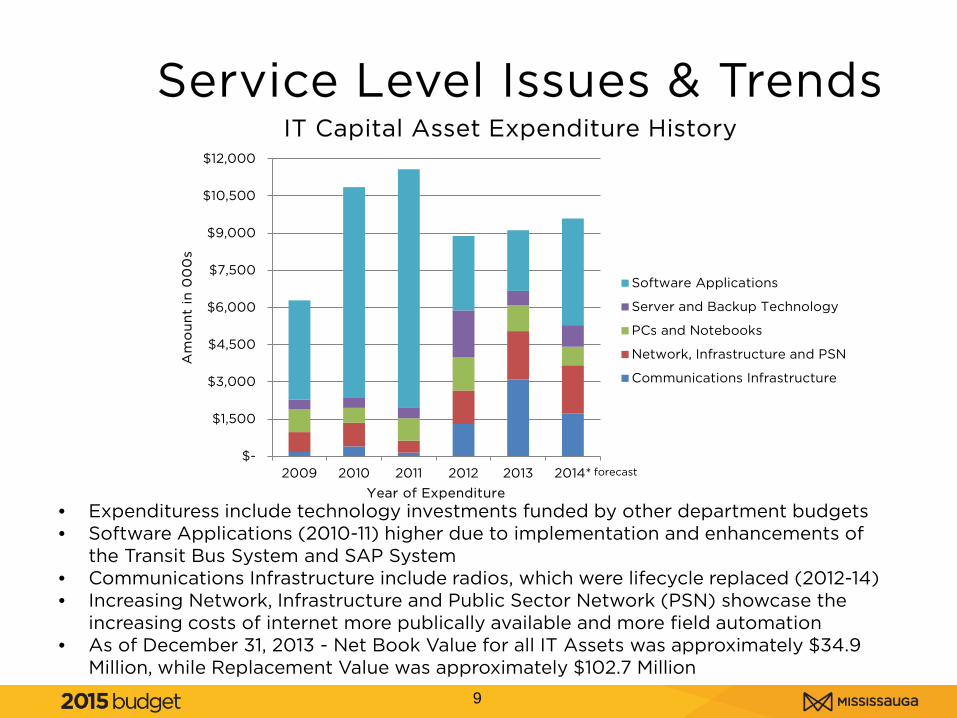
• Expendituress include technology investments funded by other department budgets • Software Applications (2010-11) higher due to implementation and enhancements of
the Transit Bus System and SAP System • Communications Infrastructure include radios, which were lifecycle replaced (2012-14) • Increasing Network, Infrastructure and Public Sector Network (PSN) showcase the
increasing costs of internet more publically available and more field automation • As of December 31, 2013 - Net Book Value for all IT Assets was approximately $34.9
Million, while Replacement Value was approximately $102.7 Million
$-
$1,500
$3,000
$4,500
$6,000
$7,500
$9,000
$10,500
$12,000
2009 2010 2011 2012 2013 2014*
Am
ou
nt
in 0
00
s
Year of Expenditure
IT Capital Asset Expenditure History
Software Applications
Server and Backup Technology
PCs and Notebooks
Network, Infrastructure and PSN
Communications Infrastructure
forecast

Service Area Information
10

11
• 311 Self-service portal for Citizen inquires and requests
• Citizen self-serve for Animal Licensing • Pubic video streaming of council, committees • Public Library system replaced • Provincial Offences Act (POA) ticket scanning
• Upgraded City phone system (VoIP & Call Centre)
• Marriage Licensing system enhancements
• Upgraded Freedom of Information (FOI) system
• Automation of Facility Request Forms
Accomplishments and Awards
12
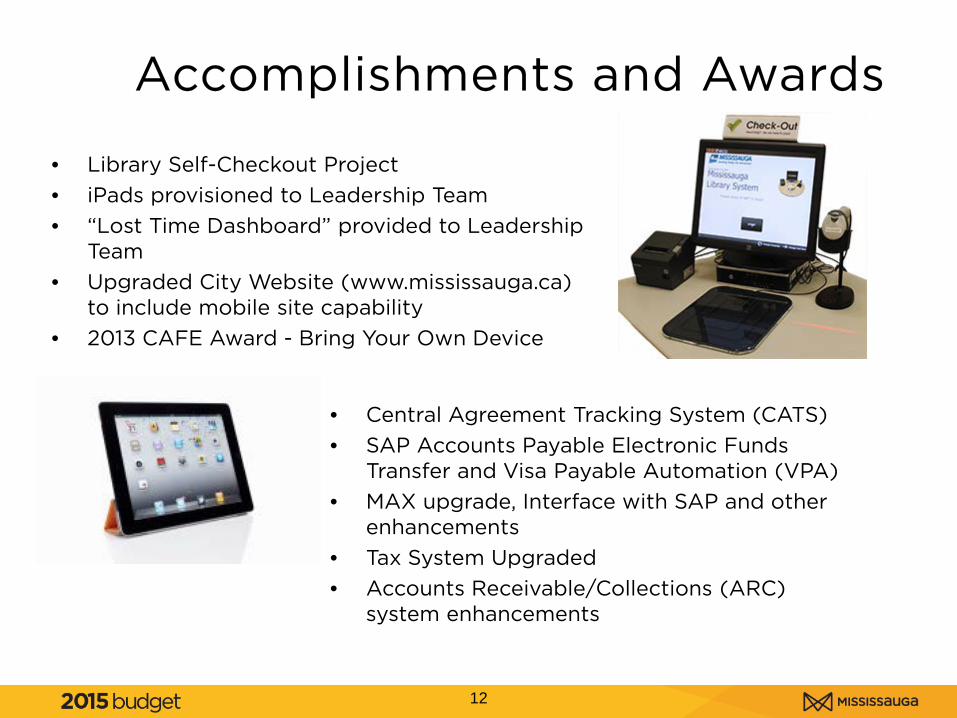
• Library Self-Checkout Project • iPads provisioned to Leadership Team • “Lost Time Dashboard” provided to Leadership
Team • Upgraded City Website (www.mississauga.ca)
to include mobile site capability • 2013 CAFE Award - Bring Your Own Device
• Central Agreement Tracking System (CATS) • SAP Accounts Payable Electronic Funds
Transfer and Visa Payable Automation (VPA) • MAX upgrade, Interface with SAP and other
enhancements • Tax System Upgraded • Accounts Receivable/Collections (ARC)
system enhancements
Accomplishments and Awards
13
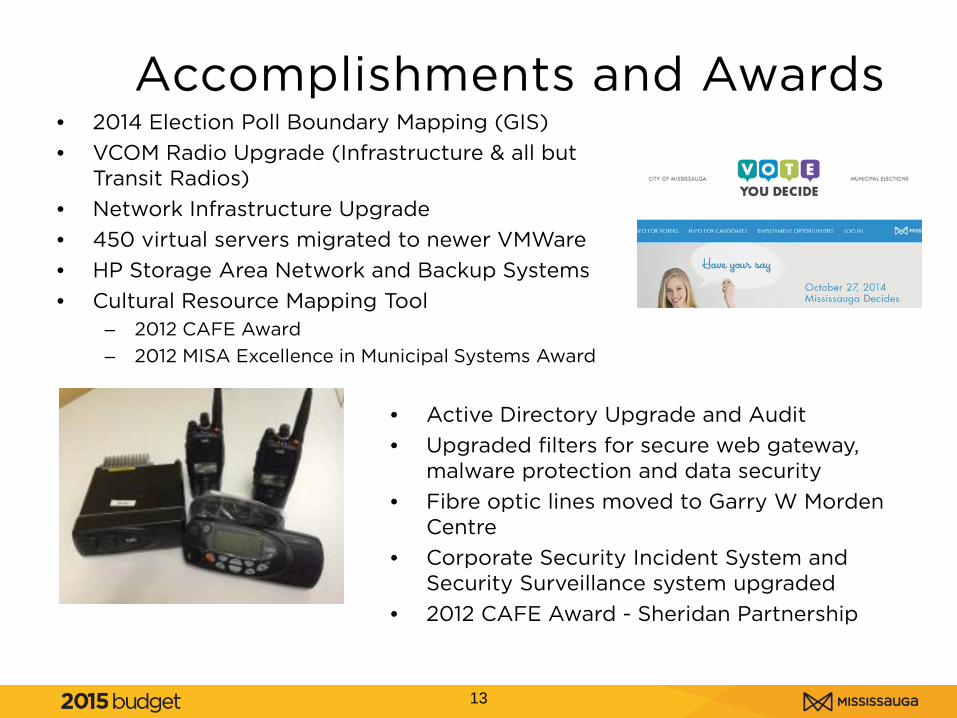
• 2014 Election Poll Boundary Mapping (GIS) • VCOM Radio Upgrade (Infrastructure & all but
Transit Radios) • Network Infrastructure Upgrade • 450 virtual servers migrated to newer VMWare • HP Storage Area Network and Backup Systems • Cultural Resource Mapping Tool
– 2012 CAFE Award – 2012 MISA Excellence in Municipal Systems Award
• Active Directory Upgrade and Audit
• Upgraded filters for secure web gateway, malware protection and data security
• Fibre optic lines moved to Garry W Morden Centre
• Corporate Security Incident System and Security Surveillance system upgraded
• 2012 CAFE Award - Sheridan Partnership
Accomplishments and Awards
14
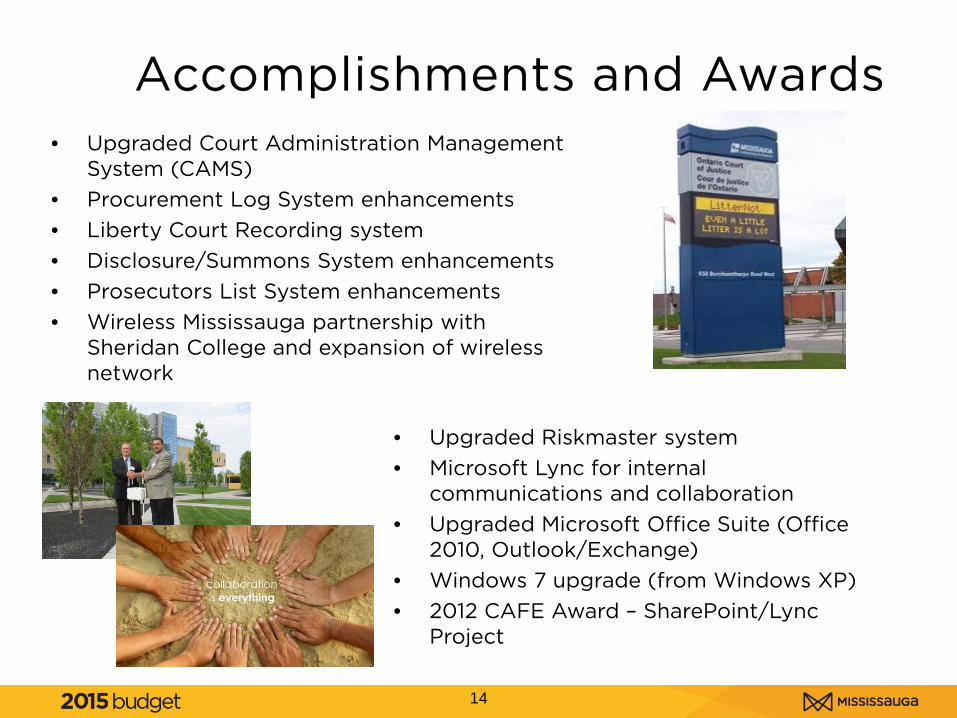
• Upgraded Court Administration Management System (CAMS)
• Procurement Log System enhancements • Liberty Court Recording system • Disclosure/Summons System enhancements • Prosecutors List System enhancements • Wireless Mississauga partnership with
Sheridan College and expansion of wireless network
• Upgraded Riskmaster system • Microsoft Lync for internal
communications and collaboration • Upgraded Microsoft Office Suite (Office
2010, Outlook/Exchange) • Windows 7 upgrade (from Windows XP) • 2012 CAFE Award – SharePoint/Lync
Project
Accomplishments and Awards
15
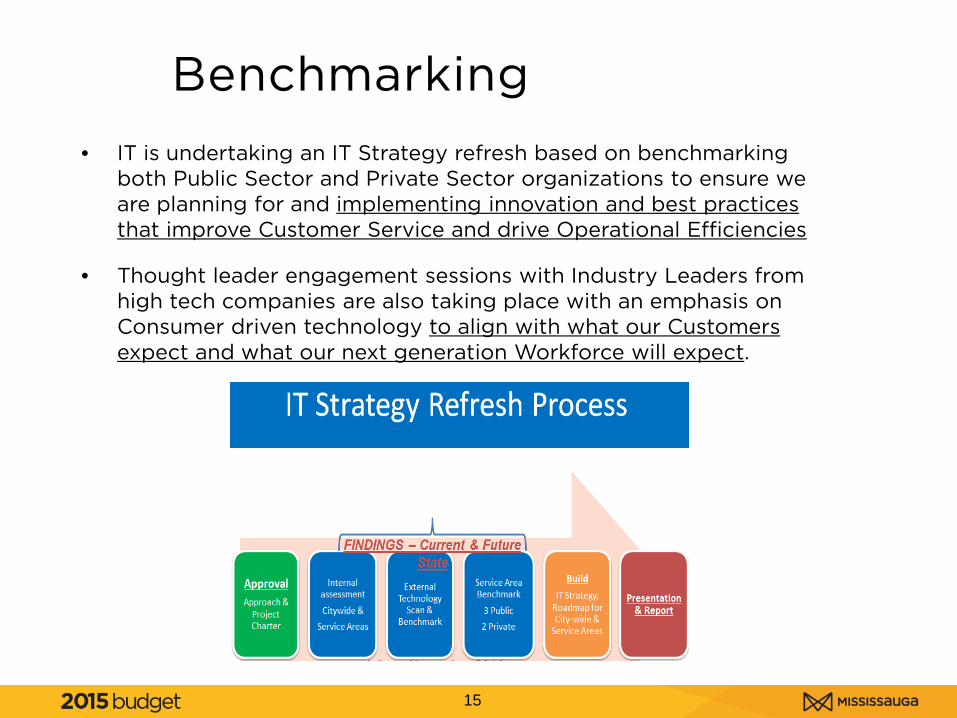
• IT is undertaking an IT Strategy refresh based on benchmarking both Public Sector and Private Sector organizations to ensure we are planning for and implementing innovation and best practices that improve Customer Service and drive Operational Efficiencies
• Thought leader engagement sessions with Industry Leaders from high tech companies are also taking place with an emphasis on Consumer driven technology to align with what our Customers expect and what our next generation Workforce will expect.
Benchmarking

16
• Service Area technology Road Maps will identify key areas of opportunity and prioritize technology investment.
Benchmarking
17
Information Technology Highlights
The IT Master Plan will be completed March 2015 with individual Service Area Technology Roadmaps being completed by September 2015. The IT Master Plan and Service Area Technology Roadmaps will inform the business planning process moving forward and ensure that Technology Innovation and Best Practices are integral to service improvements, growth and operational efficiencies.
Looking Ahead
18
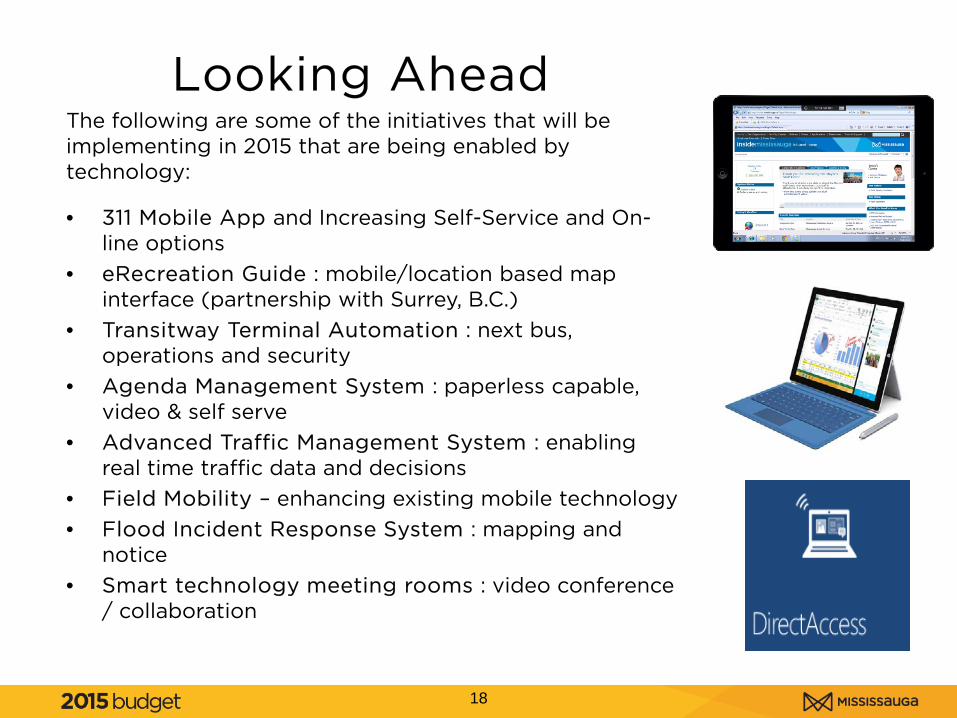
The following are some of the initiatives that will be implementing in 2015 that are being enabled by technology:
• 311 Mobile App and Increasing Self-Service and On-line options
• eRecreation Guide : mobile/location based map interface (partnership with Surrey, B.C.)
• Transitway Terminal Automation : next bus, operations and security
• Agenda Management System : paperless capable, video & self serve
• Advanced Traffic Management System : enabling real time traffic data and decisions
• Field Mobility – enhancing existing mobile technology • Flood Incident Response System : mapping and
notice • Smart technology meeting rooms : video conference
/ collaboration
Looking Ahead

Proposed Budget
19
2015 Budget Summary
20
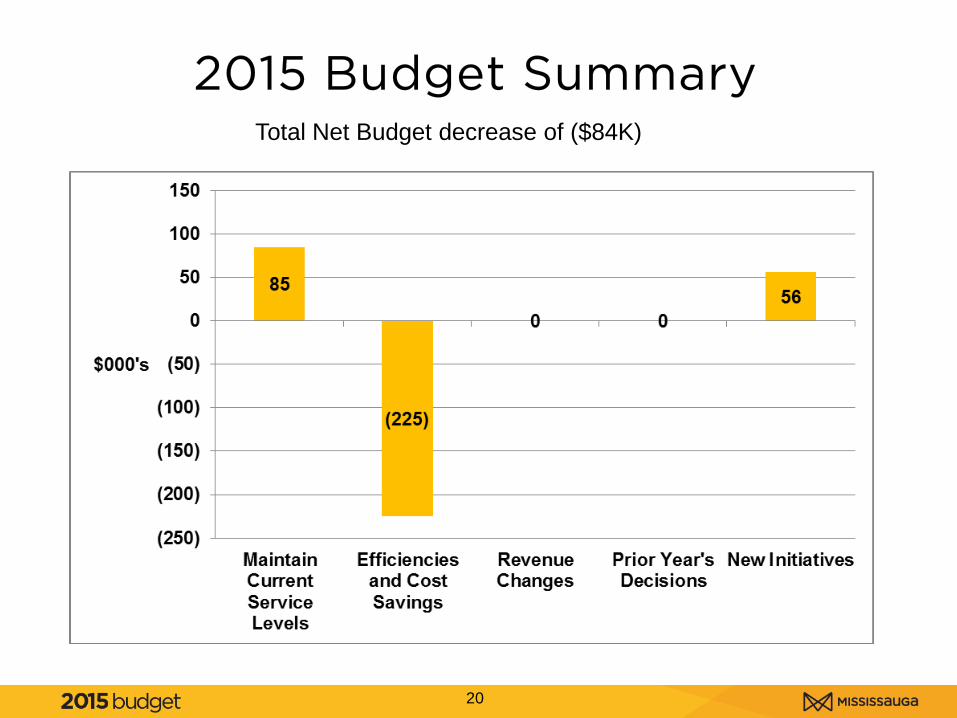
Total Net Budget decrease of ($84K)
21
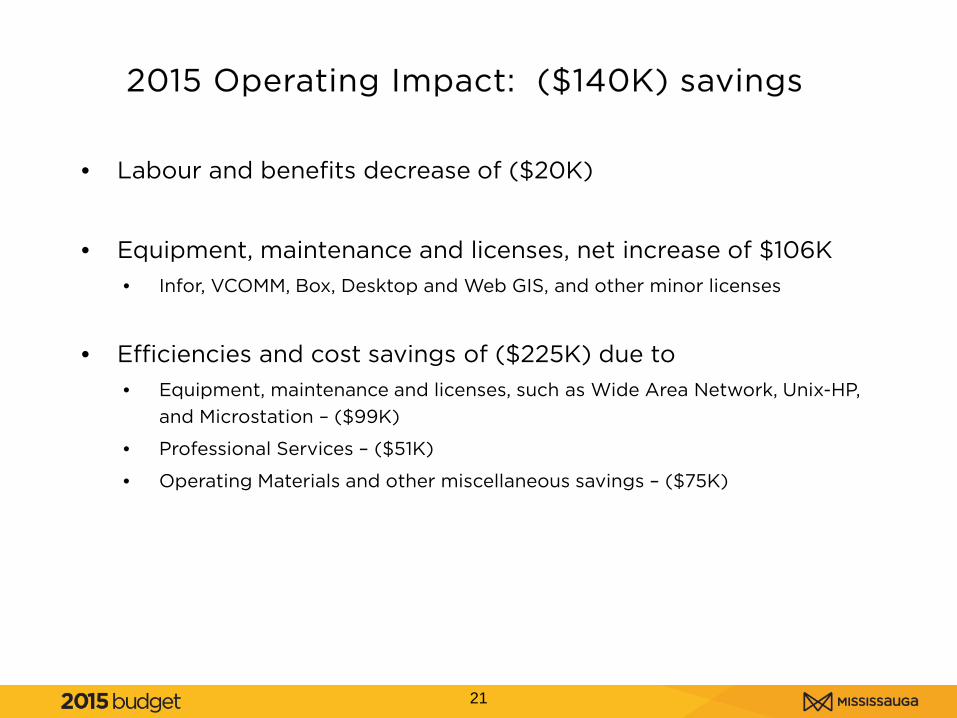
• Labour and benefits decrease of ($20K)
• Equipment, maintenance and licenses, net increase of $106K • Infor, VCOMM, Box, Desktop and Web GIS, and other minor licenses
• Efficiencies and cost savings of ($225K) due to • Equipment, maintenance and licenses, such as Wide Area Network, Unix-HP,
and Microstation – ($99K)
• Professional Services – ($51K)
• Operating Materials and other miscellaneous savings – ($75K)
2015 Operating Impact: ($140K) savings
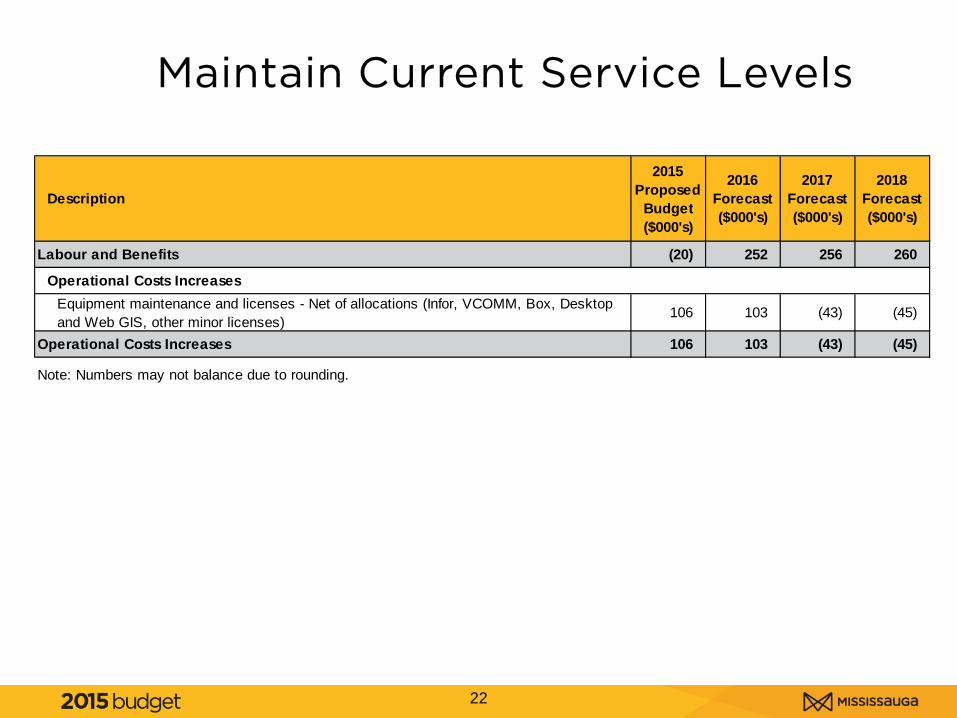
Maintain Current Service Levels
22
Description
2015 Proposed
Budget ($000's)
2016 Forecast ($000's)
2017Forecast ($000's)
2018Forecast ($000's)
Labour and Benefits (20) 252 256 260
Operational Costs IncreasesEquipment maintenance and licenses - Net of allocations (Infor, VCOMM, Box, Desktop and Web GIS, other minor licenses)
106 103 (43) (45)
Operational Costs Increases 106 103 (43) (45)
Note: Numbers may not balance due to rounding.

Efficiencies and Cost Savings
23
Description
2015 Proposed
Budget ($000's)
2016 Forecast ($000's)
2017Forecast ($000's)
2018Forecast ($000's)
Efficiencies and Cost Savings
Equipment maintenance and licenses (Wide Area Network, Unix-HP, Microstation) (99) (57) 0 0
Professional services (51) 0 0 0
Operating materials and office supplies (30) 0 0 0
Staff development and Overtime (30) 0 0 0
Mobile and phone devices (15) 0 0 0
Future reductions 0 (168) (225) (225)
Efficiencies and Cost Savings (225) (225) (225) (225)
Note: Numbers may not balance due to rounding.
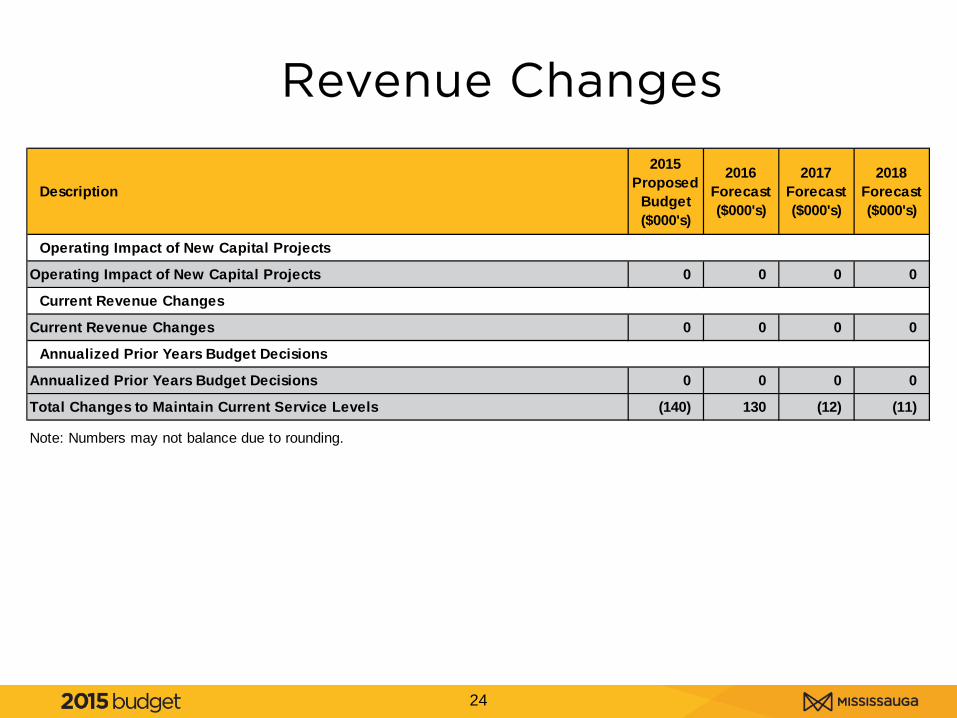
Revenue Changes
24
Description
2015 Proposed
Budget ($000's)
2016 Forecast ($000's)
2017Forecast ($000's)
2018Forecast ($000's)
Operating Impact of New Capital Projects
Operating Impact of New Capital Projects 0 0 0 0
Current Revenue Changes
Current Revenue Changes 0 0 0 0
Annualized Prior Years Budget Decisions
Annualized Prior Years Budget Decisions 0 0 0 0
Total Changes to Maintain Current Service Levels (140) 130 (12) (11)
Note: Numbers may not balance due to rounding.
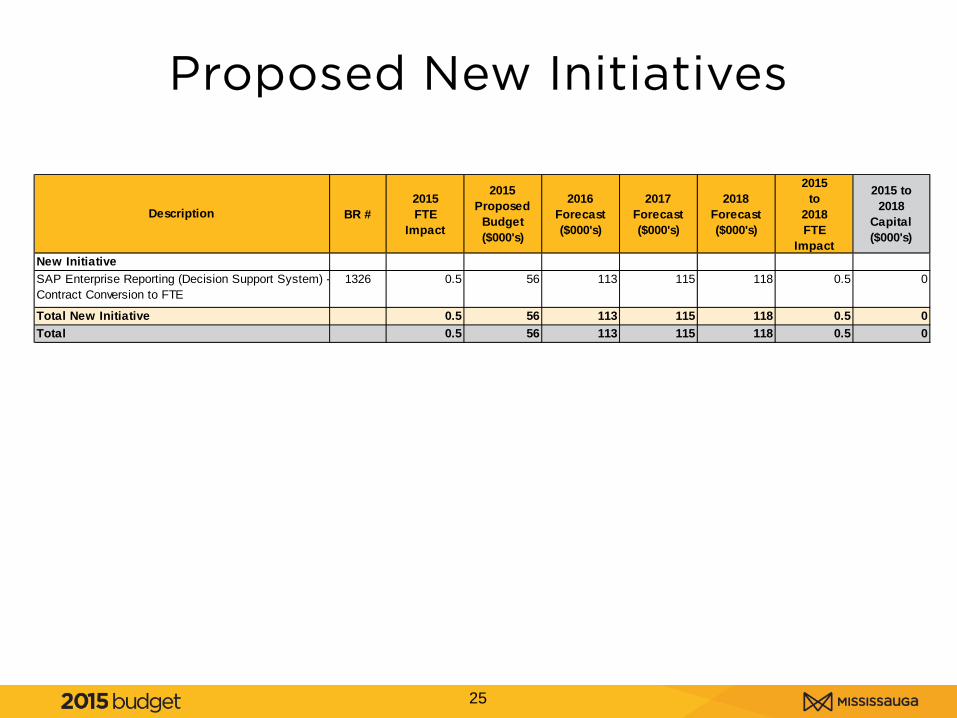
Proposed New Initiatives
25
BR #2015FTE
Impact
2015Proposed
Budget($000's)
2016Forecast($000's)
2017Forecast($000's)
2018Forecast($000's)
2015to
2018FTE
Impact
1326 0.5 56 113 115 118 0.5
0.5 56 113 115 118 0.50.5 56 113 115 118 0.5
SAP Enterprise Reporting (Decision Support System) - Contract Conversion to FTE
0
Total New Initiative 0Total 0
Description
2015 to2018
Capital($000's)
New Initiative
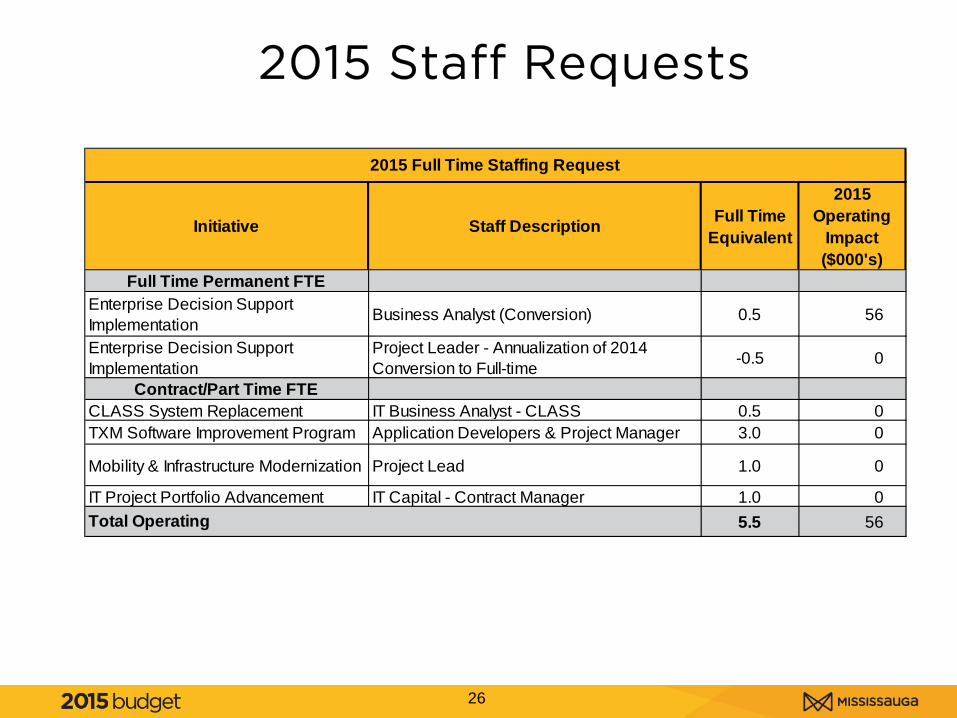
2015 Staff Requests
26
Initiative Staff Description Full Time Equivalent
2015 Operating
Impact ($000's)
Full Time Permanent FTEEnterprise Decision Support Implementation Business Analyst (Conversion) 0.5 56
Enterprise Decision Support Implementation
Project Leader - Annualization of 2014 Conversion to Full-time -0.5 0
Contract/Part Time FTECLASS System Replacement IT Business Analyst - CLASS 0.5 0 TXM Software Improvement Program Application Developers & Project Manager 3.0 0
Mobility & Infrastructure Modernization Project Lead 1.0 0
IT Project Portfolio Advancement IT Capital - Contract Manager 1.0 0 5.5 56
2015 Full Time Staffing Request
Total Operating
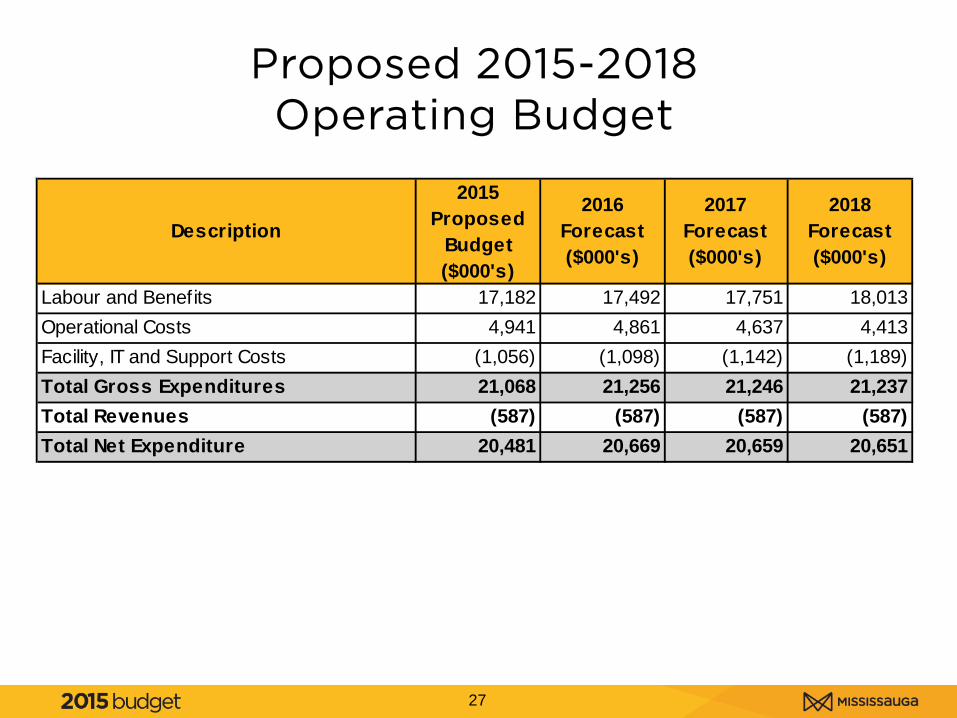
Proposed 2015-2018 Operating Budget
27
Description
2015 Proposed
Budget ($000's)
2016 Forecast ($000's)
2018 Forecast ($000's)
Labour and Benefits 17,182 17,492 18,013Operational Costs 4,941 4,861 4,413Facility, IT and Support Costs (1,056) (1,098) (1,189)Total Gross Expenditures 21,068 21,256 21,237Total Revenues (587) (587) (587)Total Net Expenditure 20,481 20,669 20,651
(1,142) 21,246
(587) 20,659
2017 Forecast ($000's)
17,751 4,637
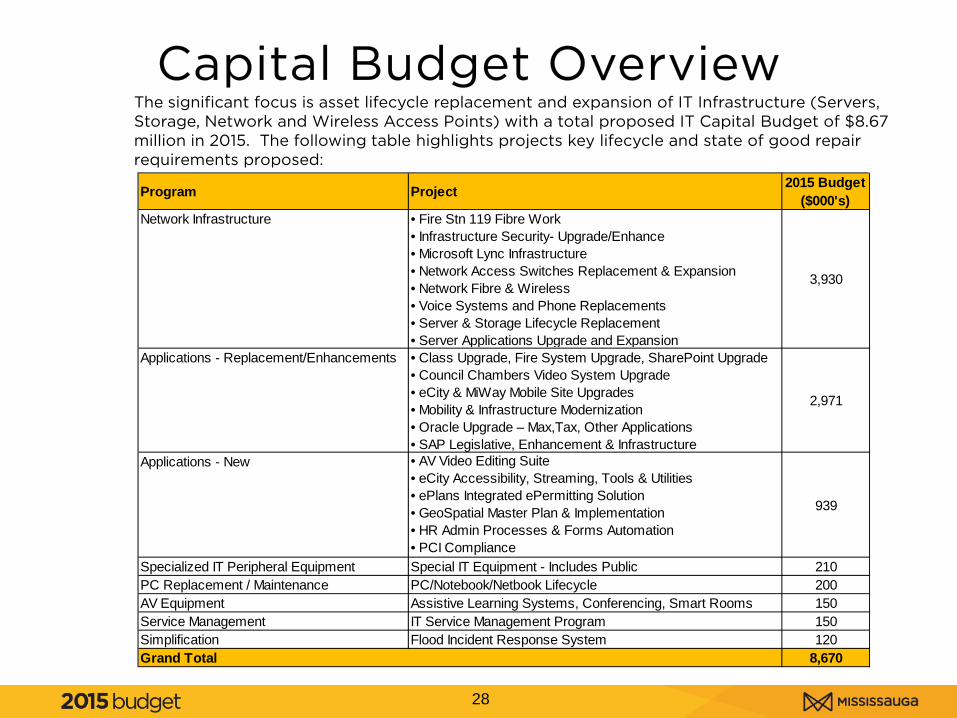
Capital Budget Overview
28
The significant focus is asset lifecycle replacement and expansion of IT Infrastructure (Servers, Storage, Network and Wireless Access Points) with a total proposed IT Capital Budget of $8.67 million in 2015. The following table highlights projects key lifecycle and state of good repair requirements proposed:
Program Project 2015 Budget($000's)
Network Infrastructure • Fire Stn 119 Fibre Work• Infrastructure Security- Upgrade/Enhance• Microsoft Lync Infrastructure• Network Access Switches Replacement & Expansion• Network Fibre & Wireless• Voice Systems and Phone Replacements• Server & Storage Lifecycle Replacement• Server Applications Upgrade and Expansion
3,930
Applications - Replacement/Enhancements • Class Upgrade, Fire System Upgrade, SharePoint Upgrade• Council Chambers Video System Upgrade• eCity & MiWay Mobile Site Upgrades• Mobility & Infrastructure Modernization• Oracle Upgrade – Max,Tax, Other Applications• SAP Legislative, Enhancement & Infrastructure
2,971
Applications - New • AV Video Editing Suite• eCity Accessibility, Streaming, Tools & Utilities• ePlans Integrated ePermitting Solution• GeoSpatial Master Plan & Implementation• HR Admin Processes & Forms Automation• PCI Compliance
939
Specialized IT Peripheral Equipment Special IT Equipment - Includes Public 210PC Replacement / Maintenance PC/Notebook/Netbook Lifecycle 200AV Equipment Assistive Learning Systems, Conferencing, Smart Rooms 150Service Management IT Service Management Program 150Simplification Flood Incident Response System 120
8,670Grand Total
29
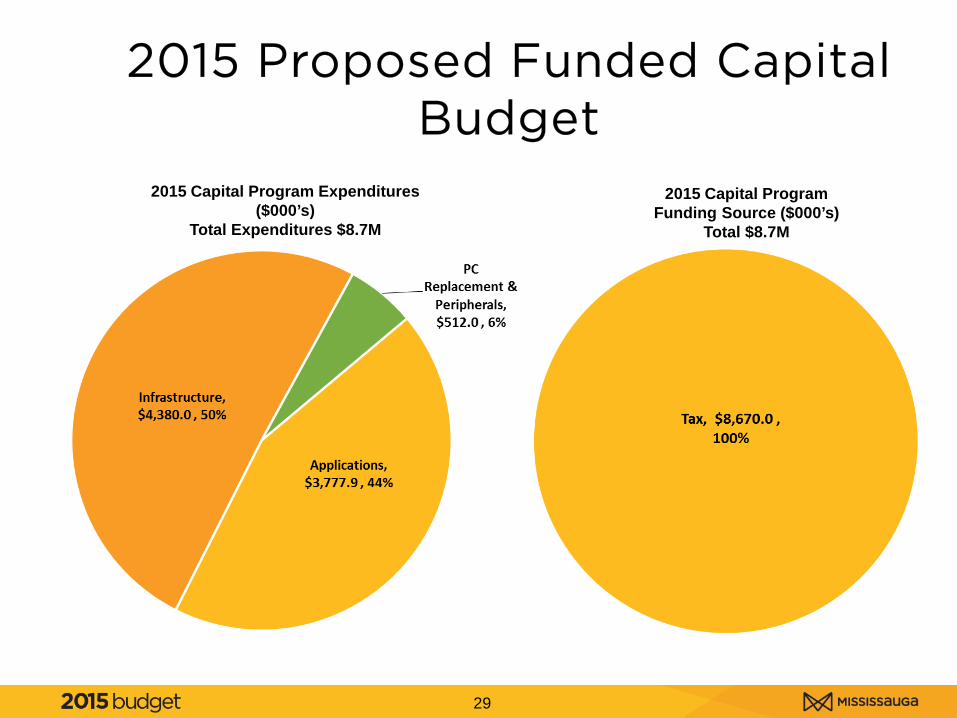
2015 Proposed Funded Capital Budget
2015 Capital Program Expenditures ($000’s)
Total Expenditures $8.7M
2015 Capital Program Funding Source ($000’s)
Total $8.7M
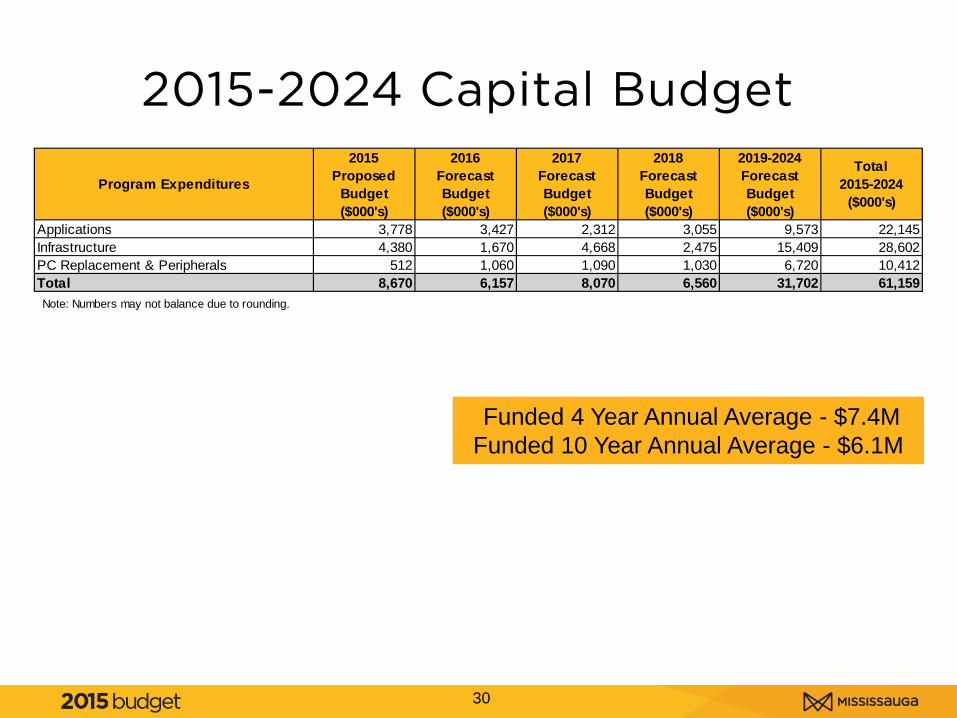
2015-2024 Capital Budget
30
Funded 4 Year Annual Average - $7.4M Funded 10 Year Annual Average - $6.1M
2015Proposed
Budget($000's)
2016ForecastBudget($000's)
2017ForecastBudget($000's)
2018ForecastBudget($000's)
2019-2024ForecastBudget($000's)
Total2015-2024
($000's)
3,778 3,427 2,312 3,055 9,573 22,1454,380 1,670 4,668 2,475 15,409 28,602
512 1,060 1,090 1,030 6,720 10,4128,670 6,157 8,070 6,560 31,702 61,159
Note: Numbers may not balance due to rounding.
Program Expenditures
ApplicationsInfrastructurePC Replacement & PeripheralsTotal
31
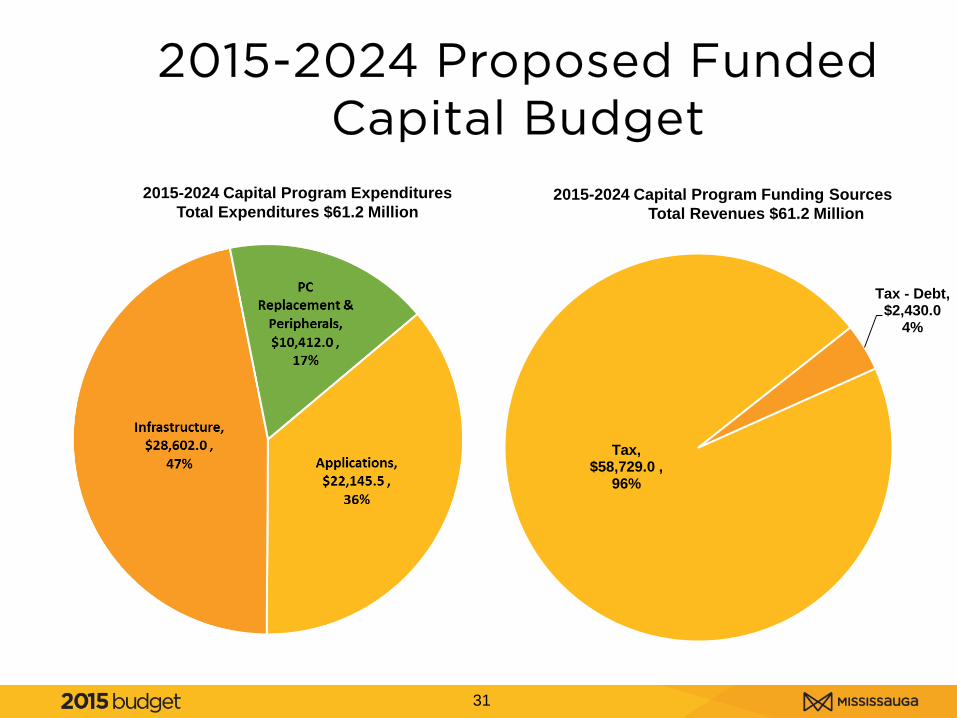
2015-2024 Proposed Funded Capital Budget
2015-2024 Capital Program Expenditures Total Expenditures $61.2 Million
2015-2024 Capital Program Funding Sources Total Revenues $61.2 Million
Tax, $58,729.0 ,
96%
Tax - Debt, $2,430.0
4%

2015-2024 Unfunded Capital Budget By Program
32
2015 Total Unfunded Capital Requests $0.2 Million
2015-2024 Total Unfunded Capital Requests $0.3 Million
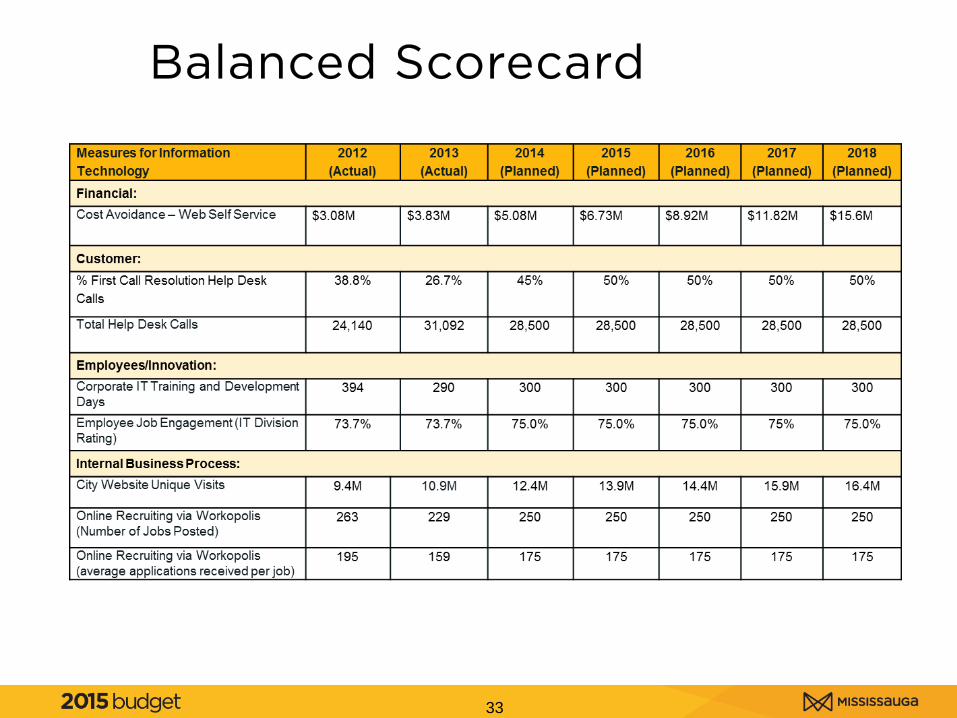
Balanced Scorecard
33
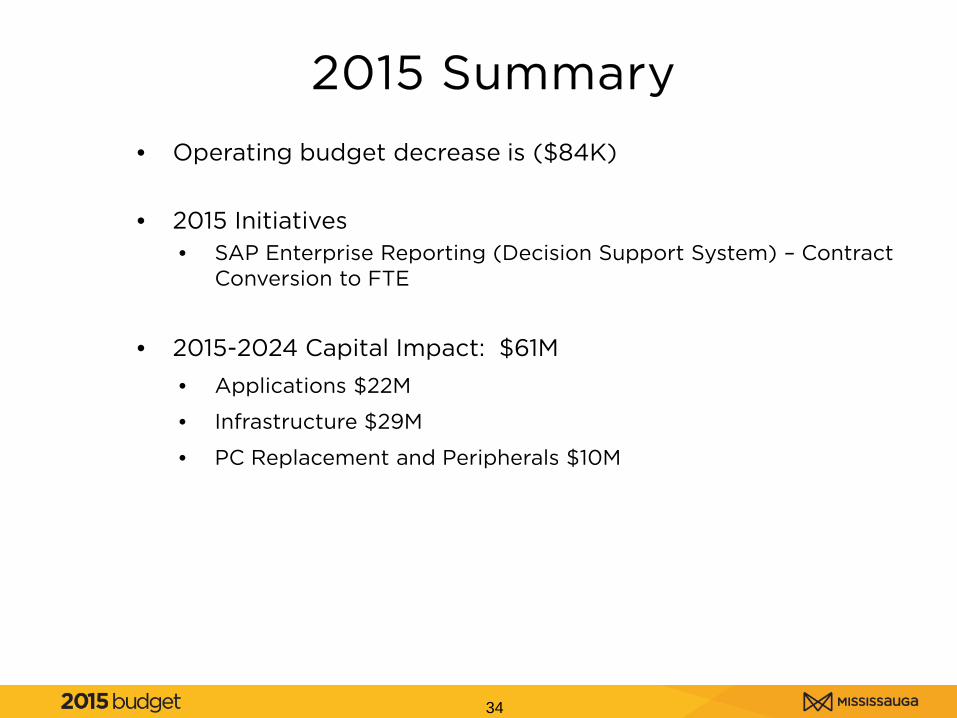
2015 Summary
34
• Operating budget decrease is ($84K) • 2015 Initiatives
• SAP Enterprise Reporting (Decision Support System) – Contract Conversion to FTE
• 2015-2024 Capital Impact: $61M
• Applications $22M
• Infrastructure $29M
• PC Replacement and Peripherals $10M