infrastructure as a catalyst for regional integration, growth
TRANSCRIPT

4.1 INTroDuCTIoN
Recent research at the Asian Development Bank (ADB) on Asian regional integration has highlighted the importance of structural barriers to trade (Brooks et al., 2005). Indeed, it now appears that overcoming geographic and institutional obstacles that increase trade and transport margins is a very important constraint to regional trade expansion and sustained growth. In their 2005 study of infrastructure requirements for Asia, Connecting East Asia: A New Framework for Infrastructure, ADB, the Japan Bank for International Cooperation, and the World Bank, present a comprehensive review of the region’s infrastructure needs. These needs are substantial and particularly so in relative terms, i.e., the need is relatively most acute in the poorest countries. In a region that enjoys unprecedented external and domestic savings reserves, and at a time when real interest rates are as low as they have been in generations, it is surely an auspicious time to consider how large-scale regional investment could help Asia more fully realize its vast economic potential. The goal of the present chapter is to link the two elements, using rigorous empirical methods to show how a more determined commitment to creating regional infrastructure can act as a catalyst for Asian integration, facilitating more sustained and comprehensive economic growth.
In a vast literature on trade facilitation, it is doubly unfortunate that investment in infrastructure has received only scant attention. Infrastructure is one of the oldest and most decisive determinants of trade patterns. Public infrastructure also confers some of the most desirable benefits of trade facilitation, including open market access and pro-poor growth and
4
Infrastructure as a Catalyst for regional Integration, Growth, and economic Convergence: scenario Analysis for Asia
David Roland-Holst
xx JA: Some figs / tables may have to come up (paras deleted); and delete page 127 later.

86 From Growth to Convergence: Asia’s Next Two Decades
income effects. By lowering costs of market participation in a relatively nondiscriminatory manner, improvements in infrastructure broaden the basis for growth and directly contribute to its sustainability. By reducing trade and transport margins, infrastructure promises a neat reconciliation of private interests, in the process increasing producer prices while reducing purchaser prices.
In the Asian context, the parallel emergence of the People’s Republic of China (PRC) and India portend dramatic change in the economic landscape. Because of geographic realities, however, the full growth potential of these large economies, both for the region and the global economy, will depend critically on infrastructure. Although they share borders in some areas, the Himalayan plateau is unlikely to sustain more than a small fraction of their bilateral trade in the foreseeable future. A much more attractive bridge between the emerging giants is Southeast Asia, already a robust trading environment and one that could capture many of the indirect benefits of intensified trade linkages between the PRC and India. For these reasons, the entire Asian region has an important stake in an expanded Southeast Asian trade infrastructure. This is particularly true of many of the region’s poorest economies, which would be directly in the path of many new transport axes under consideration. Cambodia, Lao People’s Democratic Republic (Lao PDR), Myanmar, and (to a lesser extent) Viet Nam have long been at the margins of the more dynamic East and South Asian growth experience, yet they could become central pillars of any comprehensive bridging infrastructure between the PRC and India.
The research reported in this chapter is based on applications of a multicountry dynamic model that captures detailed trade and domestic market interactions within Asia and between Asia and the rest of the world. This kind of computable general equilibrium (CGE) modeling has already established itself as the preferred tool for empirical research on trade policy, and is ideally suited in the present context for demonstrating how infrastructure changes neoclassical fundamentals (market access costs) to amplify gains from trade and accelerate growth. There are relatively few examples of economywide simulation modeling being used for infrastructure assessment. This is an unfortunate, missed opportunity because this approach is well suited to capturing the kinds of neoclassical cost-price effects and extensive indirect linkages that make up infrastructure’s main contribution to economic activity.1
This chapter studies one of the world’s most dynamic multilateral trading regions, which presents an ideal application of the Global Trade Analysis Project dataset. Preliminary results indicate that determined commitment to infrastructure investment can sharply expand economic participation, and leverage the superior growth rates of Asia’s largest countries for the benefit of

Infrastructure as a Catalyst for Regional Integration, Growth, and Economic Convergence 87
the entire region, with large, proportionate, gains for the poorest countries. In this way, integration will accelerate as regional supply chains are consolidated, and growth externalities can be substantial for all participants. In the absence of more determined infrastructure commitment, trade will simply be intensified along established channels and its benefits diverted over more distant trade routes to traditional markets.
4.2 MoTIvATIoN AND BACkGrouND
In economics, both the theoretical and policy literature recognize the importance of infrastructure. In this section, the issue is reviewed from both perspectives. The next subsection provides a conceptual framework for understanding infrastructure’s primary economic effects. This is followed by an overview of the available empirical literature on estimating the real impacts of infrastructure investments. In both contexts, macro- and microeconomic analyses are included.
4.2.1 Conceptual FrameworkThere is broad agreement on what constitutes infrastructure, yet its economic agency is quite diverse. A convenient way to understand infrastructure’s role is by decomposition into three functional economic categories:
Keynesian. This refers to the pure expenditure component of infrastructure, as reflected in national, regional, and local aggregate demand and employment stimulus.
Ricardian. This relates to infrastructure’s effect on the cost of transport and distribution. Reducing trade margins can have a potent effect on prices and competitiveness, intensifying comparative advantage and increasing both domestic and international trade flows.
Neoclassical. Modern economic theory recognizes infrastructure’s contribution to increasing productivity, as technology embodied in transport, communications, and distribution systems increases the efficiency of search, transactions, and shipments. These are generally termed endogenous growth benefits, and are considered among the most important economic contributions of modern infrastructure investments.
Keynesian Stimulus The direct macroeconomic benefits of public investment have long been recognized, and infrastructure spending itself is a popular means of direct medium-term or transitory employment stimulus. In many economies, programs such as the Worker Protection Act in the United States (US), work relief in the PRC, and the heavy countercyclical and recurrent fiscal

88 From Growth to Convergence: Asia’s Next Two Decades
commitments to public works in Japan, often have employment as their primary goal and downstream benefits as a secondary one.
Because of its generality, this kind of spending can be targeted across a wide spectrum of regions and socioeconomic groups and can be conducted at national, regional, or local level, timed to coincide with cyclical economic events. In the case of real public goods infrastructure, multiplier effects from both direct employment and downstream use can be substantial. Obviously, the latter benefits will be greater if more investment can be focused on real public goods and on widely used infrastructure capacity. In this chapter, targeted increases in investment in trade and transport infrastructure for those Asian economies considered to have the greatest unmet needs are examined.
ADB/JBIC/World Bank (2005) identified several countries that needed to maintain higher long-term infrastructure investments if they were to catch up with faster-growing or higher-income countries in the region. As Figure 4.1 indicates, Asia will need $106 billion in new infrastructure between 2006 and 2010.
To accomplish these infrastructure development goals, it is estimated that low-income countries must sustain infrastructure investment levels at 6.3% of gross domestic product (GDP) over this period and beyond. At the moment, many of these countries have rates below 3% because of low domestic savings, weak fiscal institutions, or both. In the analysis presented below, the detailed growth and structural implications of achieving these investment objectives are examined.
0
1
2
3
4
5
6
7
8
Middle IncomeLow IncomePRC
% of GDP
6.9
3.6
6.3
Figure 4.1 ADB/JBIC/World Bank Estimates of Asia’s Infrastructure Needs
0
50
100
150
200
By SectorBy CountryBy EconomicClassi�cation
Investment Electricity
PRC
Maintenance
All,excludingPRC Telecoms
Roads
Water andSanitation Rail
$ Billion
Source: Yepes (2004).

Infrastructure as a Catalyst for Regional Integration, Growth, and Economic Convergence 89
Ricardian StimulusAt the microeconomic level, the role of infrastructure in reducing distribution margins is widely acknowledged in the policy and theoretical literature, but explicit treatments are relatively few and not easy to synthesize into a general approach. Policy-oriented discussion emphasizes the obvious advantages of increased market participation, as infrastructure commitments reduce distribution margins, expanding the profitable horizon of market-oriented investments, whether private or public. This is particularly the case in emerging economic environments, where distribution costs are an important source of price distortions that significantly limit market access and reduce economic efficiency. Such access barriers are particularly important in countries with poor, rural majorities, or those between economic “zones” (e.g., South Asia and East Asia) that are separated by more remote subsistence areas. Not only does infrastructure facilitate integration between active zones, it also confers growth externalities across the networks so established. In this way, for example, the parallel emergence of the PRC and India has the potential to confer substantial growth externalities across Southeast Asia, especially among the latter’s poorest countries. Cambodia, Lao PDR, and Myanmar are among the areas ideally suited to become pillars of a “growth bridge” between Asia’s two emerging giants.
Empirical evidence of the significance of distribution margins is more plentiful and also quite diverse. It can generally be divided into four categories. The first deals with traditional and modern issues related to physical geography. In the second, a large volume of work relates to direct transport costs, including means as well as distance. Third, institutional economics has examined trade margins arising from administrative, regulatory, and political conditions governing transboundary and international commerce. Fourth, there is a special component of international finance that deals with exchange rate and purchasing power parity (PPP) distortions and their influence on underlying commerce.
Infrastructure reduces trade margins. This in turn has three important structural effects on the economy.
Intensification of Comparative Advantage. Classical trade theory states that price differences create incentives for international and interregional exchange of goods and specialization, which increases aggregate efficiency. Distribution margins serve to undermine these price differences, and thus the basis for trade and more efficient specialization. To see this, consider two prices PH and PF for comparable goods from two different sources (home and foreign), although they could simply be from different regions or even cities in the same country. Given that a trade margin (M) is generally symmetric, the ratio of these two prices, with margins taken into account, is given by the

90 From Growth to Convergence: Asia’s Next Two Decades
following expression, evaluated as M rises without limit. Evidently, the higher the margin, the less the degree of comparative advantage for either good across these markets.
1→∞→
+
+
MMF
P
MH
P
Improved International Terms of Trade. A second advantage of falling margins is improving international terms of trade. Consider now the domestic producer price of exports PE = PWE – M, where PWE denotes the international price of an export good and M the margin that must be debited against the exporter’s net revenue (producer) price. Symmetrically, the domestic purchaser price of imports takes the form PM = PWM + M, where PWM is the corresponding international price of an imported good and the margin M must be added to the purchaser price. It can be observed that falling margins induce an increase in terms of trade PE/PM. Once again, the double virtue of falling margins and increasing producer prices alongside falling purchaser prices sharpens the incentive for trade.
+−=>DD
PMPWMand
PMPWEM> >>
Improved Agricultural Terms of Trade. Finally, margins are inversely related to the rural terms of trade, and thus investments that reduce distribution margins are pro-poor in most developing countries. Consider the rural terms of trade defined as follows:
MP
MP
P
P
D
DR
U
RR
+
−==ρ
where rural prices of rural products (or rural household producer prices) must be debited for distribution to the domestic market (at prices PD) and rural prices of urban products (or rural household purchaser prices) must include shipping costs from domestic urban markets. Differentiating this ratio of rural producer prices to rural consumer prices,
2)(2
MP
P
MD
D
+−=
∂
∂ ρ

Infrastructure as a Catalyst for Regional Integration, Growth, and Economic Convergence 91
reveals that falling margins increase the rural terms of trade. Note also that, because this relationship is quadratic in margins, high initial barriers make it difficult to animate market incentives.
Neoclassical StimulusModern economic theory recognizes many “endogenous growth factors,” i.e., economic conditions that facilitate readiness for growth and can accelerate growth when they are present in an economic setting. Many of these are facilitated by infrastructure, including productivity enhancement, technology diffusion, information diffusion, supply chain articulation and other network externalities, and human capital development (including the effects of migration).
Many of these factors are among the most sought-after rewards of direct investment, whether domestic or foreign in origin. They are often embodied in new investment, particularly that which is technology oriented, and are thought to contribute strongly to economic and institutional modernization, so accelerating growth, increasing labor productivity and real wage potential, and ultimately contributing to higher sustainable living standards. While these characteristics are widely acknowledged and increasingly understood, many of them are notoriously difficult to measure. This chapter uses counterfactual experiments to appraise their general significance.
4.2.2 empirical Findings on economic returns to Investment in Infrastructure It is widely agreed that infrastructure makes an essential economic contribution to economic growth, but calibrating this for benefit-cost assessment is extremely difficult. As with many public goods, even directly targeted willingness-to-pay surveys are difficult because individuals cannot or will not accurately measure infrastructure’s contribution to their individual balance sheets. The basic issues are summarized in Box 4.1. Much of the empirical research is confined to Organisation for Economic Co-operation and Development (OECD) countries, where growth rates are low, and infrastructure stocks, public and private investment levels, and incomes are relatively high. These characteristics may limit the relevance of these results, discussed in the rest of this section, for emerging Asian economies, particularly the poorest countries.
Results for OECD CountriesPrivate returns to public infrastructure investment can be decomposed into two generic categories: top-down and bottom-up approaches, which look at the

92 From Growth to Convergence: Asia’s Next Two Decades
role of economic returns to public investments in infrastructure. The former usually begin with macro or large-scale public investments and attempt to identify sector- or even firm-level welfare benefits; the latter generally begin with sectoral or even agent-level profit, efficiency, or some other welfare proxy, then try to associate changes in this with specific or generic public goods or infrastructure investment. Both approaches have strengths and weaknesses, and neither of them offers definitive estimates of the private value of these public investments.
Most of these studies suggest limits to the supply of projects with high economic returns, and there are serious limits to growth-rate benefits from increases in infrastructure investment, if any. Moreover, some studies recognize a crowding-out effect, where public dollars yield less than a dollar of net investment because some portion would probably have been undertaken in any case by private parties or by regional or local governments. Because these levels of government can often see what central government initiatives are in the pipeline, and so avoid spending their own resources, central government investment might even discourage other investment and reduce reliance on local knowledge for project selection. This could undermine project selection quality, reduce the incentive benefits of local ownership, and undermine the long-term sustainability of services from these public goods.
Evidence from Non-OECD CountriesDespite sparse evidence, those studies that have been carried out are positive in their findings. First, they make consistent, positive links between well-targeted infrastructure and aggregate growth, productivity improvements, and poverty reduction. Second, a range of countries presents clear evidence that basic infrastructure has the highest rates of social and private return. Finally, it is apparent from some work that returns to public investment diminish monotonically with respect to aggregate income, a result that means that weak effects observed for OECD economies do not imply low returns in low-income countries.
One study of the PRC (Fan et al., 2002) for example, finds high GDP multipliers for public investment in road systems. More strikingly, it finds that the multiples are several times higher for low-quality roads than for high-quality ones. This strongly supports the idea that the earlier the stage of development, the higher the private return to public investment in infrastructure. In contrast, Lin and Song (2002) focused on the urban sector. Using data for 189 PRC cities from 1991 to 1998, they found that an increase in paved roads is positively and significantly related to growth in per capita GDP in urban areas. Benziger (1996) provides interesting evidence on the linkages between urban and rural sectors, testing whether greater access to urban
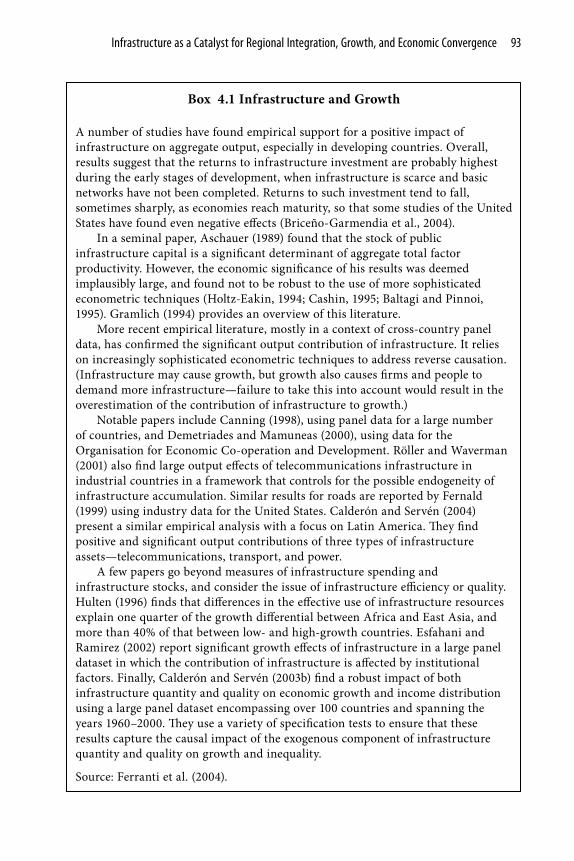
Infrastructure as a Catalyst for Regional Integration, Growth, and Economic Convergence 93
Box 4.1 Infrastructure and Growth
A number of studies have found empirical support for a positive impact of infrastructure on aggregate output, especially in developing countries. Overall, results suggest that the returns to infrastructure investment are probably highest during the early stages of development, when infrastructure is scarce and basic networks have not been completed. Returns to such investment tend to fall, sometimes sharply, as economies reach maturity, so that some studies of the United States have found even negative effects (Briceño-Garmendia et al., 2004).
In a seminal paper, Aschauer (1989) found that the stock of public infrastructure capital is a significant determinant of aggregate total factor productivity. However, the economic significance of his results was deemed implausibly large, and found not to be robust to the use of more sophisticated econometric techniques (Holtz-Eakin, 1994; Cashin, 1995; Baltagi and Pinnoi, 1995). Gramlich (1994) provides an overview of this literature.
More recent empirical literature, mostly in a context of cross-country panel data, has confirmed the significant output contribution of infrastructure. It relies on increasingly sophisticated econometric techniques to address reverse causation. (Infrastructure may cause growth, but growth also causes firms and people to demand more infrastructure—failure to take this into account would result in the overestimation of the contribution of infrastructure to growth.)
Notable papers include Canning (1998), using panel data for a large number of countries, and Demetriades and Mamuneas (2000), using data for the Organisation for Economic Co-operation and Development. Röller and Waverman (2001) also find large output effects of telecommunications infrastructure in industrial countries in a framework that controls for the possible endogeneity of infrastructure accumulation. Similar results for roads are reported by Fernald (1999) using industry data for the United States. Calderón and Servén (2004) present a similar empirical analysis with a focus on Latin America. They find positive and significant output contributions of three types of infrastructure assets—telecommunications, transport, and power.
A few papers go beyond measures of infrastructure spending and infrastructure stocks, and consider the issue of infrastructure efficiency or quality. Hulten (1996) finds that differences in the effective use of infrastructure resources explain one quarter of the growth differential between Africa and East Asia, and more than 40% of that between low- and high-growth countries. Esfahani and Ramirez (2002) report significant growth effects of infrastructure in a large panel dataset in which the contribution of infrastructure is affected by institutional factors. Finally, Calderón and Servén (2003b) find a robust impact of both infrastructure quantity and quality on economic growth and income distribution using a large panel dataset encompassing over 100 countries and spanning the years 1960–2000. They use a variety of specification tests to ensure that these results capture the causal impact of the exogenous component of infrastructure quantity and quality on growth and inequality.
Source: Ferranti et al. (2004).

94 From Growth to Convergence: Asia’s Next Two Decades
markets increases the intensity of input use and productivity in the rural sector in the province of Hebei, PRC. His econometric results show that road density and distance to the nearest city are positively correlated with the use of fertilizer per unit of land, machinery utilization per worker, and average land and labor productivity.
Many focused studies in developing countries reach similar conclusions. In the case of road investments, for example, positive links to output and productivity are reported by Ahmed and Hossain (1990) for Bangladesh; Khandker et al. (1994) for Morocco; Songco (2002) for Viet Nam; Jacoby (2000) for Nepal; and Riverson et al. (1991), who reviewed 127 World Bank–supported road projects and showed that the majority stimulated income and productivity growth. Having said this, although the effects on poverty may generally be positive, inequality is often found to increase because of road development.
International comparison studies, mostly in a cross-country panel data context, have confirmed the significant output contribution of infrastructure. For example, Canning (1998) used panel data for a large number of countries, and Demetriades and Mamuneas (2000) used OECD data. Röller and Waverman (2001) also find large output effects of telecommunications infrastructure in industrial countries in a framework that controls for the possible endogeneity of infrastructure accumulation.
Among the most comprehensive recent studies is research in the Latin American context by Calderón and Servén (2005). These authors produce generalized method of moments estimates of a hypothetical Cobb-Douglas production technology obtained from a very large (121-country) panel dataset, finding positive and significant output contributions by three types of infrastructure assets: telecommunications, transport, and power. The estimated marginal productivity of these assets significantly exceeds that of noninfrastructure capital. On the basis of those estimates, Calderón and Servén infer that a major portion of the per capita output gap that opened between Latin America and East Asia in the 1980s and 1990s can be traced to the slowdown in Latin America’s infrastructure accumulation during that period.
In contrast with the relatively large literature on the output effects of infrastructure, studies of the impact of infrastructure on long-term developing-country growth are not numerous. In a study of the growth impact of government spending, Easterly and Rebelo (1993) find that public expenditure on transport and communications significantly raises growth. Also, Sanchez-Robles (1998) presents evidence that summary measures of physical infrastructure are positively and significantly correlated with growth in per capita GDP. Easterly (2001) reports that a measure of telephone density

Infrastructure as a Catalyst for Regional Integration, Growth, and Economic Convergence 95
contributed significantly to growth performance of developing countries over the previous two decades, but the strict interpretation of this result is one of correlation rather than causality.
A subset of this literature extends the basic analysis of infrastructure stocks and investment to consider quality or efficiency of infrastructure. Prominent among these is Hulten (1996), who finds that differences in the effective use of infrastructure resources explain one quarter of the growth differential between African and East Asian economies, and more than 40% of that between low- and high-growth countries. In a more generic correlation exercise, Esfahani and Ramirez (2002) find significant growth links arising from infrastructure across a large panel dataset where explicit account is taken of institutional factors affecting infrastructure’s growth performance.
4.3 overvIeW oF The CGe MoDel
The complexities of today’s global economy make it very unlikely that policy makers relying on intuition or rules of thumb will achieve anything approaching optimality in either the domestic or international arenas. Market interactions are so pervasive in determining economic outcomes that more sophisticated empirical research tools are needed to improve visibility for both public and private sector decision makers. The preferred tool for detailed empirical analysis of economic policy is now the CGE model. It is well suited to trade analysis because it can detail structural adjustments within national economies and elucidate their interactions in international markets. The model is based on a prototype global trade model developed by the World Bank and is fully documented elsewhere, but a few general comments will facilitate interpretation of the scenario results that follow.2
Technically, a CGE model is a system of simultaneous equations that simulate price-directed interactions between firms and households in commodity and factor markets. The roles of government, capital markets, and other trading partners are also specified, with varying degrees of detail and passivity, to close the model and account for economywide resource allocation, production, and income determination.
The role of markets is to mediate exchange, usually with a flexible system of prices (the most important endogenous variables in a typical CGE model). As in a real market economy, commodity and factor price changes induce changes in the level and composition of supply and demand, production and income, and the remaining endogenous variables in the system. In CGE models, an equation system is solved for prices that correspond to equilibrium in markets and satisfy the accounting identities governing economic behavior. If such a system is precisely specified, equilibrium always exists and such a

96 From Growth to Convergence: Asia’s Next Two Decades
consistent model can be calibrated to a base period dataset. The resulting CGE model is then used to simulate the economywide (and regional) effects of alternative policies or external events.
The distinguishing feature of a general equilibrium model, applied or theoretical, is its closed-form specification of all activities in the economic system under study. This can be contrasted with more traditional partial equilibrium analysis, where linkages to other domestic markets and agents are deliberately excluded from consideration. A large and growing body of evidence suggests that indirect effects (e.g., upstream and downstream production linkages) arising from policy changes are not only substantial, but may in some cases even outweigh direct effects. Only a model that consistently specifies economywide interactions can fully assess the implications of economic policies or business strategies. In a multicountry model such as the one used for this chapter, indirect effects include the trade linkages between countries and regions, which themselves can have policy implications.
4.4 overvIeW oF INITIAl CoNDITIoNs
Infrastructure conditions across Asia are highly varied, even between neighboring countries. As the following figures indicate, Asian infrastructure expansion trends have been dramatic, but only in a few locations. This diversity is addressed in detail in ADB/JBIC/World Bank (2005); the next section examines growth consequences in some detail. Before presenting these results, however, it is useful to examine initial infrastructure conditions for the region.3
Figures 4.2 and 4.3 present trends in installed, improved roadway over the last 45 years, expressed in two ways. The first, road length per unit of domestic national land area, gives an indication of national road density. This is a trend that should certainly rise for all countries striving for modernization, and indeed those with the fastest rising trends are among the most affluent (Japan and Singapore).
A few comments about these two figures, as well as Figures 4.4 and 4.5, are in order. First, general increases are seen over time, although at very different rates. The variance stems from three factors. The first is initial conditions and early period data availability. Some countries do not report until 1970, and even then reporting is incomplete. Second, these measures do not take into account population density on a national basis. Some countries, like the PRC, have vast unpopulated areas, and their infrastructure is allocated accordingly. In the case of roads for example, the PRC has made enormous commitments to expanding its infrastructure, but on a national land-area basis, the road surface remains small compared with, for example, metropolitan Hong Kong, China

Infrastructure as a Catalyst for Regional Integration, Growth, and Economic Convergence 97
or Singapore, and with more densely populated, larger economies. Third, some per capita measures are difficult to compare between countries with dominant urban or rural populations.
It is another matter, however, to compare this indicator across countries. For example, the PRC has been building roads faster (in length terms) for the last 10 years than the US did during its “golden age” of transport infrastructure development in the 1950s. In spite of this, vast tracts of the PRC are—and will likely remain—desolate of people, markets, and transport services. For this reason, the PRC is very difficult to discern in Figure 4.2 (or would be if it had the same scale as, say, the Republic of Korea), even though its annual growth over the last two decades has been nearly double that of the Republic of Korea, a much smaller country with advanced road networks
Figure 4.2 Paved Road Systems and Land Area
0
1
2
3
4
5
SingaporeKorea, Rep. of
JapanHong Kong, China
20001990198019701960
Japan and NIEs
Pave
d Ro
ad L
engt
h/La
nd A
rea
South Asia
Pave
d Ro
ad L
engt
h/La
nd A
rea
0.00
0.03
0.06
0.09
0.12
0.15
0.0
0.1
0.2
0.3
0.4
0.5
PakistanNepal India (right scale)Bangladesh
20001990198019701960
Pave
d Ro
ad L
engt
h/La
nd A
rea
Source: Fay and Yepes (2003).
Southeast Asia
0.00
0.05
0.10
0.15
0.20
�ailandPhilippinesMalaysia
Lao PDRIndonesia
20001990198019701960
Pave
d Ro
ad L
engt
h/La
nd A
rea
East Asia
Pave
d Ro
ad L
engt
h/La
nd A
rea
Pave
d Ro
ad L
engt
h/La
nd A
rea
0.0000
0.0002
0.0004
0.0006
0.0008
0.0010
0.0012
0.000
0.007
0.014
0.021
0.028
0.035
China, People's Rep. of (right scale)Mongolia
20001990198019701960

98 From Growth to Convergence: Asia’s Next Two Decades
and much higher per capita income. For purposes of country comparison, the stage of infrastructure development is probably more accurately reflected in a service measure, such as total road length per capita (Figure 4.3). Here Japan and Malaysia take the lead in the region, even as public transit resources are not taken into full account, with which both Hong Kong, China and Singapore are well endowed.
Another popular measure of modernization infrastructure is electricity capacity per capita. This is depicted in Figure 4.4 and the cross-country disparities are very much in line with earlier discussion about the regional growth hierarchy. Electrification is an essential component of modernization, sustainable urban development, and higher productivity around the world,
Figure 4.3 Paved Road Systems and Population
Pave
d Ro
ad L
engt
h Pe
r Cap
ita
Pave
d Ro
ad L
engt
h Pe
r Cap
ita0.0
0.2
0.4
0.6
0.8
1.0
1.2
1.4
1.6
0
1
2
3
4
5
6
7
8
20001990198019701960
Japan and NIEs
SingaporeKorea, Rep. of Japan (right scale)Hong Kong, China
Pave
d Ro
ad L
engt
h Pe
r Cap
ita
Pave
d Ro
ad L
engt
h Pe
r Cap
ita
South Asia
PakistanNepal India (right scale)Bangladesh
0.0
0.1
0.2
0.3
0.4
0.5
0.6
0.7
0.8
0.0
0.2
0.4
0.6
0.8
1.0
1.2
1.4
1.6
20001990198019701960
Source: Fay and Yepes (2003).
Pave
d Ro
ad L
engt
h Pe
r Cap
ita
Pave
d Ro
ad L
engt
h Pe
r Cap
ita
Southeast Asia
PhilippinesLao PDR �ailandIndonesia
0.0
0.2
0.4
0.6
0.8
1.0
1.2
0.0
0.5
1.0
1.5
2.0
2.5
3.0
20001990198019701960Malaysia(right scale)
Pave
d Ro
ad L
engt
h Pe
r Cap
ita
East Asia
MongoliaChina, People’s Rep. of
0.0
0.1
0.2
0.3
0.4
0.5
0.6
0.7
20001990198019701960

Infrastructure as a Catalyst for Regional Integration, Growth, and Economic Convergence 99
and this will clearly be a focal point for Asian infrastructure investment, particularly in countries that are later starters.
Another popular index of modernizing infrastructure is the scope of mobile telecommunications adoption, depicted for the Asian region in Figure 4.5 in per capita subscriber terms. Close examination and comparison of these trends reveal that this is indeed a good proxy for economic modernization, and the hierarchy of per capita income in Asia is almost perfectly reflected in these data. Urban density creates a slight bias for the metropolitan areas, but otherwise mobile saturation is a near-perfect proxy for per capita income. However, different kinds of infrastructure are more appropriate to facilitate growth at different stages of development. In countries
Figure 4.4 Electrification
Japan and NIEs
Elec
tric
ity C
apac
ity P
er C
apita
SingaporeKorea, Rep. of
JapanHong Kong, China
0.0
0.5
1.0
1.5
2.0
20001990198019701960
South Asia
NepalIndia PakistanBangladesh
Elec
tric
ity C
apac
ity P
er C
apita
0.00
0.02
0.04
0.06
0.08
0.10
0.12
20001990198019701960
Source: Fay and Yepes (2003).
Elec
tric
ity C
apac
ity P
er C
apita
Elec
tric
ity C
apac
ity P
er C
apita
Southeast Asia
PhilippinesLao PDR �ailandIndonesia Malaysia
(right scale)
0.0
0.1
0.1
0.2
0.2
0.3
0.3
0.4
0
1
2
3
4
5
6
7
20001990198019701960
East Asia
MongoliaChina, People's Rep. of
Elec
tric
ity C
apac
ity P
er C
apita
0.0
0.1
0.2
0.3
0.4
0.5
20001990198019701960

100 From Growth to Convergence: Asia’s Next Two Decades
with large rural poor populations, for example, improved roads and other transport facilities are much more growth friendly and pro-poor than large investments in modern telecommunications systems.
Figure 4.6 makes clear how domestic income and savings constrain infrastructure development. Lower-income Asian countries are caught in a low-investment trap, where both domestic private and public resources are insufficient to support rapid emergence from their less-developed status. These countries might be considered fortunate in one respect, however. The developing countries are members of the Asian region, which currently enjoys the world’s highest average savings rates and unprecedented stocks and inflows of external savings. ADB/JBIC/World Bank (2005) emphasizes that external partnership can play an essential role in overcoming these constraints.
Figure 4.5 Mobile Telephony
Japan and NIEs
Mob
ile U
sers
Per
1,0
00 P
opul
atio
n
SingaporeKorea, Rep. of
JapanHong Kong, China
0
200
400
600
800
1,000
200019981996199419921990
Mob
ile U
sers
Per
1,0
00 P
opul
atio
n
South Asia
PakistanNepalSri Lanka(right scale)
Bangladesh
0
1
2
3
4
5
0
5
10
15
20
25
200019981996199419921990India
Mob
ile U
sers
Per
1,0
00 P
opul
atio
n
Source: Fay and Yepes (2003).
Mob
ile U
sers
Per
1,0
00 P
opul
atio
n
Southeast Asia
PhilippinesLao PDR �ailandIndonesia Malaysia
(right scale)
0
20
40
60
80
100
0
50
100
150
200
250
200019981996199419921990M
obile
Use
rs P
er 1
,000
Pop
ulat
ion
East Asia
MongoliaChina, People's Rep. of
Mob
ile U
sers
Per
1,0
00 P
opul
atio
n
0
10
20
30
40
50
60
70
200019981996199419921990

Infrastructure as a Catalyst for Regional Integration, Growth, and Economic Convergence 101
Table 4.1. and Figure 4.7 show clearly why this makes sense. Table 4.1 presents data on incomes, and aid levels for selected Asian and Pacific economies, while Figure 4.7 shows trends in private (investment) and public (aid) foreign capital inflows to Asian countries. The table and figure support a single conclusion, namely that people live in a world of complementarity where equitable growth is concerned, and therefore domestic and external partnerships as well as public-private partnerships are necessary, yet neither set of partnerships is likely to be sufficient, if the comprehensive growth needs for effective Asian economic integration are to be met.
4.5 sCeNArIo ANAlysIs
As indicated in the discussion in Section 4.2 above, the basic approach is to examine the effects of infrastructure investments from three different economic perspectives: macroeconomic (Keynesian), margins/prices (Ricardian), and productivity (neoclassical). Each approach uses different estimation strategies, and sheds light on the different contributions that infrastructure can make to Asian economies. The general assumptions underlying the following scenarios are summarized in Box 4.2.
4.5.1 Macroeconomic experiments (keynesian) This category of effects focuses on fiscal commitments and aggregation demand and employment linkages. At the national level, a standard macroeconomic model can capture much of this process, but for the entire
Figure 4.6 Income and Infrastructure
00.10.20.30.40.50.60.70.80.9
1
0 10,000 20,000 30,000 40,000 50,000
Pavement/Area Electricity Capacity Per Capita Mobile Users Per 1,000 Population
Nor
mal
ized
to M
axim
um
Per Capita Income
Source: Fay and Yepes (2003).

102 From Growth to Convergence: Asia’s Next Two Decades
region, a multicountry framework and a general equilibrium model that more fully captures the myriad spillover benefits that follow from general investment projects, such as infrastructure, are needed.
To assess the potential contribution from this kind of aggregate demand stimulus, the starting point is the position set forth in ADB/JBIC/World Bank (2005): that less-developed Asian economies need to attain higher annual rates of infrastructure investment over the long term. In particular, that
Figure 4.7 Asian Inbound Aid and FDI
0
20
40
60
80
100
120
140
160
FDIAid200219981994199019861982197819741970
$ bi
llion
Sources: OECD aid statistics (available: www.oecd.org) and UNCTAD FDI statistics (available: http://stats.unctad.org).
Table 4.1 Aid Dependency in East Asia and the Pacific, Selected Low- and Middle-Income Countries, 2004
Income per Capita ($)
Aid per Capita ($)
Aid as % of:National Income
Gross Investment
Malaysia 4,520 11.6 0.3 1.1Thailand 2,490 0.0 0.0 0.0China, People’s Rep. of 1,500 1.3 0.1 0.2Philippines 1,200 5.7 0.5 3.0Indonesia 1,130 0.4 0.0 0.1Mongolia 600 104.1 16.4 44.3Papua New Guinea 550 46.1 7.6 -Viet Nam 540 22.3 4.1 11.4Lao PDR 400 46.5 11.3 62.3Cambodia 350 34.7 10.3 38.0
East Asia and Pacific Ave. 1,417 3.7 0.3 0.7- = data not available. Source: World Development Indicators online database.

Infrastructure as a Catalyst for Regional Integration, Growth, and Economic Convergence 103
work suggests that a useful focal point for this investment level over the next decade would be 6.3% of GDP. Many economies in the region are below this
level, and some significantly so, and it can be expected that stepping up their commitments will accelerate growth domestically.
Estimating Asia’s unmet and prospective infrastructure needs was undertaken for ADB/JBIC/World Bank (2005) and this effort is also the subject of an extensive, diverse, and interesting research and policy literature. For this chapter, individual national needs for countries that are significantly below their infrastructure needs in terms of baseline investment and forgone growth potential are identified. From this perspective, the path-breaking work of Calderón and Servén (2003a and b) provides important guidance and data. Although their main contribution was an appraisal of Latin American infrastructure needs, they assembled a global database and estimated historical national indexes for infrastructure quantity and quality. These data include many Asian economies, and this subset is used to infer national infrastructure needs and the investment requirements to meet them.
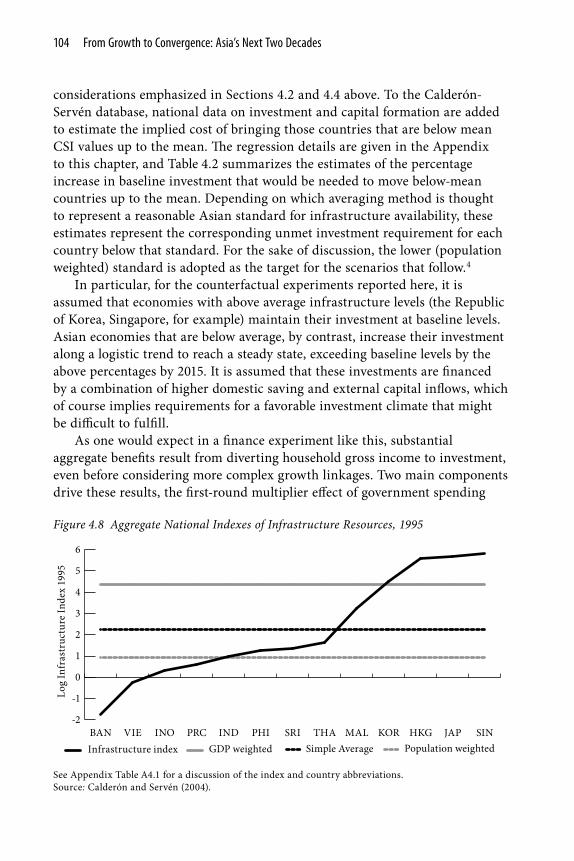
More specifically, Calderón and Servén (2003a and b) construct a synthetic index of infrastructure from the capital stocks in essential transport, distribution, and communications sectors. Figure 4.8 describes the Calderón-Servén index (CSI) for 13 Asian economies in the last year of their sample, 1995. Also included are mean values computed with weights for GDP, population, and as a simple average.
Clearly, there are wide disparities across the region, reflecting the same
Box 4.2 scenario summary
Keynesian Experiments• Asian economies with below average baseline infrastructure accelerate investment• New investment needs are met by a combination of higher domestic saving and external capital inflows
Ricardian Experiments• Productivity growth in the trade and distribution sectors is assumed to occur as a result of the accelerated Keynesian investment prescribed above• A variety of different elasticities of sectoral total factor productivity growth with respect of investment are considered (0, 0.5, 1.0, 2.0, 4.0)
Neoclassical Experiments• Productivity growth in all sectors is assumed to occur as a result of the accelerated investment prescribed above
104 From Growth to Convergence: Asia’s Next Two Decades
considerations emphasized in Sections 4.2 and 4.4 above. To the Calderón-Servén database, national data on investment and capital formation are added to estimate the implied cost of bringing those countries that are below mean CSI values up to the mean. The regression details are given in the Appendix to this chapter, and Table 4.2 summarizes the estimates of the percentage increase in baseline investment that would be needed to move below-mean countries up to the mean. Depending on which averaging method is thought to represent a reasonable Asian standard for infrastructure availability, these estimates represent the corresponding unmet investment requirement for each country below that standard. For the sake of discussion, the lower (population weighted) standard is adopted as the target for the scenarios that follow.4
In particular, for the counterfactual experiments reported here, it is assumed that economies with above average infrastructure levels (the Republic of Korea, Singapore, for example) maintain their investment at baseline levels. Asian economies that are below average, by contrast, increase their investment along a logistic trend to reach a steady state, exceeding baseline levels by the above percentages by 2015. It is assumed that these investments are financed by a combination of higher domestic saving and external capital inflows, which of course implies requirements for a favorable investment climate that might be difficult to fulfill.
As one would expect in a finance experiment like this, substantial aggregate benefits result from diverting household gross income to investment, even before considering more complex growth linkages. Two main components drive these results, the first-round multiplier effect of government spending
Figure 4.8 Aggregate National Indexes of Infrastructure Resources, 1995
Log
Infr
astr
uctu
re In
dex
1995
-2
-1
0
1
2
3
4
5
6
Population weightedSimple AverageGDP weightedInfrastructure indexSINJAPHKGKORMALTHASRIPHIINDPRCINOVIEBAN
See Appendix Table A4.1 for a discussion of the index and country abbreviations. Source: Calderón and Servén (2004).

Infrastructure as a Catalyst for Regional Integration, Growth, and Economic Convergence 105
(particularly with high average savings rates in Asia), and the macro benefits of domestic and external capital accumulation (incremental capital output ratio and average wage effects).
For lower-income countries, and particularly for economies where capital is tightly constrained with respect to labor (Bangladesh and Viet Nam), the effects are substantial, and lift real GDP significantly. In Viet Nam, for example, cumulative GDP over the 20-year period is 40% higher, rising steadily to 65%
higher in the terminal year. During the 5-year intervals considered, growth accelerates over the investment stimulus interval and then stabilizes above baseline rates (Tables 4.3 and 4.4). In Bangladesh, for example, accelerated Keynesian infrastructure stimulus adds an average of 3 percentage points to baseline annual GDP growth.
Differences in aggregate growth dividends depend on the relative commitments to accelerated infrastructure investment, and this in turn depends on initial conditions. Bangladesh was furthest behind in this sense (Figure 4.8 above), thus it experiences both the biggest percentage investment stimulus and highest Keynesian growth dividend. Viet Nam is second in this sequence, followed by Indonesia and the PRC. With more up-to-date data, the PRC might not even be in the infrastructure-deficient group by the population-weighted standard, having already enjoyed much of the estimated Keynesian stimulus from voluntary acceleration of domestic investment over the period 1995–2005.
These macroeconomic results clearly bear out the importance of the Asian infrastructure initiative (ADB/JBIC/World Bank, 2005) advanced jointly by ADB, Japan Bank for International Cooperation, and the World Bank. While higher-income countries in the region have the means to meet their own infrastructure requirements, the overall regional gains from further integration will depend for all economies on the capacity of less-
Table 4.2 Estimated Changes in Baseline Aggregate Investment, by Type of Target Mean (%)
Economy GDP-Weighted
Simple Average
Population-Weighted
Bangladesh 613 397 267Viet Nam 464 249 118Indonesia 407 191 60China, People’s
Rep. of378 162 31
India 341 125 Philippines 312 96 Sri Lanka 302 87 Thailand 276 60 Malaysia 114 Korea, Rep. of Hong Kong,
China
Japan Singapore Source: Author’s estimates.

106 From Growth to Convergence: Asia’s Next Two Decades
developed Asian economies to facilitate trade and domestic commerce. The dual challenge of more sustainable and inclusive regional growth can be significantly advanced by accelerated infrastructure investment in these less-developed economies.
4.5.2 Margin/Price experiments (ricardian)In what this chapter has termed the Ricardian context, infrastructure is seen as reducing transport, trade, and other distribution margins to facilitate broader market participation. As already emphasized, this aspect of public investment is particularly appealing because it facilitates individual private agency and promotes self-directed poverty reduction. Given the remoteness of marginalized communities in some parts of Asia, such indirect commitments can be much more cost effective than targeted transfer schemes or more direct interventions for poverty reduction.
If one were to assess such policies without a CGE framework, however, many indirect effects could be omitted because of the complex behavioral and structural linkages between reducing trade costs and growth. A survey of the economic literature indicates three main ways in which these effects are propagated. First, by reducing commercial margins, infrastructure can narrow the gap between producer and purchaser prices in the domestic economy. The direct effect of this is to benefit domestic agents, particularly those in proximity to improved infrastructure. Indirect effects extend well beyond this however, as narrower margins between producer and purchaser prices increase
Table 4.3 Macroeconomic Results: Annual and Cumulative Real GDP, 2005–2025 (% changes from baseline)
2010 2015 2020 2025 Cumulative
Bangladesh 5 26 53 74 47China, People’s Rep. of 1 6 11 15 10Indonesia 2 15 32 46 28Viet Nam 3 21 44 65 40Source: Author’s estimates.
Table 4.4 Annualized Growth Rate of Real GDP (percentage point premium over baseline)
2010 2015 2020 2025 Average
Bangladesh 1.0 4.0 4.1 2.9 3.0China, People’s Rep. of 0.3 1.0 1.0 0.7 0.7Indonesia 0.5 2.5 2.9 2.1 2.0Viet Nam 0.6 3.5 3.9 2.8 2.7Source: Author’s estimates.

Infrastructure as a Catalyst for Regional Integration, Growth, and Economic Convergence 107
the scope of profitable commerce and investment, enlarging the domestic market.
A second category of indirect benefits relates to international trade. Border prices coming closer to import purchaser prices and to export producer prices implies net price reductions for the former and increases for the latter. In both cases, terms of trade improve and trade is facilitated, expanding both domestic absorption and supply to export markets.
Finally, a third effect of falling margins relates to domestic returns to scale. Trade and transport margins are an important component of marginal cost, and reducing these will shift the minimum efficient scale of production to higher output levels, allowing firms to increase supply and domestic employment while realizing greater scale economies.
The CGE experiments conducted here are designed to model margin reduction by increasing total factor productivity (TFP) in the sectors that provide distribution services, i.e., trade, transport, and communications. Productivity growth in these sectors, which arises from infrastructure improvements, will translate directly into reduced costs for the services provided by these sectors, thereby making market access less expensive for all. In this set of experiments, the spirit (if not the letter) of an extensive literature is followed, linking infrastructure and productivity of distribution services (e.g., in Aschauer, 1989). Aschauer found with US data that an additional dollar invested in public capital yields a much higher economic payoff than another dollar of private capital. Significantly, the main driver of his conclusion was a high temporal correlation between productivity and the stock of public infrastructure. As discussed in Box 4.1, his results were controversial and propagated an extensive literature.
For this chapter’s purposes, in the absence of any independent evidence estimating the direct infrastructure-margin cost effect, general inferences from productivity studies are used. All those surveys acknowledge the agency of infrastructure on margins, and all studies agree on the underlying productivity relationship, i.e., that the infrastructure-GDP linkage is positive, but in elasticity terms this effect varies across the literature by two orders of magnitude (from about 10% to 0.1%). However, the vast majority of these studies rely on data for OECD economies, and those estimates that exist for developing countries are higher and more uniform, suggesting a natural diminishing-returns relationship. For the present study, the important thing is to use a calibrated simulation model to estimate the economic potential of reduced distribution margins. Individual infrastructure investments and local conditions affecting them will vary, but policy makers need to know how the economy as a whole can respond to improved market access.
For this reason, the following experiments are based on indicative

108 From Growth to Convergence: Asia’s Next Two Decades
productivity gains that can be seen to span a set of reasonable expectations. This countrerfactual exercise is coupled to the last, with the same logistic profile of accelerated infrastructure investment. In addition, it is assumed that productivity in the distribution sectors increases with four alternative elasticity values—ε=(0.5, 1.0, 2.0, 4.0)—with respect to changes in sectoral investment. Thus a 1% increase in infrastructure investment would increase distribution service productivity by ε%. Note that the first data column in these results
Table 4.5 Margin/Price Results: Cumulative Real GDP, 2006–2025 (% changes from baseline)
ε0.0 0.5 1.0 2.0 4.0
Bangladesh 47 52 56 65 94China, People’s Rep. of 10 11 12 14 20Hong Kong, China 0 2 3 6 14India 0 1 3 5 12Indonesia 28 29 29 31 35Japan 0 1 1 2 5Korea, Rep. of 0 1 1 3 6Malaysia 0 2 3 5 14Philippines -1 0 0 1 3Singapore 1 2 2 4 8Sri Lanka 0 2 4 8 26Taipei,China 0 1 2 4 9Thailand 0 1 1 3 6Viet Nam 40 41 42 43 48Source: Author’s estimates.
Table 4.6 Margin/Price Results: Annualized Growth Rate of Real GDP (percentage point premium over baseline)
ε
0.0 0.5 1.0 2.0 4.0
Bangladesh 3.0 3.2 3.4 3.7 4.9China, People’s Rep. of 0.7 0.8 0.9 1.0 1.2Hong Kong, China 0.0 0.1 0.2 0.3 0.8India 0.0 0.1 0.2 0.3 0.8Indonesia 2.0 2.0 2.1 2.1 2.3Japan 0.0 0.0 0.1 0.1 0.3Korea, Rep. of 0.0 0.1 0.1 0.2 0.4Malaysia 0.0 0.1 0.2 0.4 0.9Philippines -0.1 0.0 0.0 0.0 0.2Singapore 0.1 0.1 0.2 0.3 0.5Sri Lanka 0.0 0.1 0.3 0.6 1.7Taipei,China 0.0 0.1 0.2 0.3 0.6Thailand 0.0 0.1 0.1 0.2 0.4Viet Nam 2.7 2.7 2.8 2.8 3.0Source: Author’s estimates.

Infrastructure as a Catalyst for Regional Integration, Growth, and Economic Convergence 109
(Tables 4.5 and 4.6, and Figure 4.9), for ε=0, corresponds to the Keynesian experiment of the previous subsection.
Aggregate results in Table 4.5 clearly demonstrate the potential of reduced market-access costs to stimulate economic growth and development. To the extent that infrastructure can lower these costs for all market participants, the benefits will be greater, the larger the investment relative to the initial stock of infrastructure. For this reason, the poorer countries, with lower levels of initial stocks and concomitantly high internal trade margins, are the greatest relative beneficiaries in the base case (ε=0) and all others. These are precisely the economies identified for accelerated investment by ADB/JBIC/World Bank (2005), and include Bangladesh, Indonesia, Sri Lanka, and Viet Nam. Had the Philippines also been targeted for accelerated investment, it would probably have been in the same category. Note that in this set of experiments, however, the gains are not restricted to these economies alone. This is because it is assumed that trade and transport productivity effects occur in all countries experiencing new investment, not just those with accelerating investment. There is no productivity growth in the baseline. Taking account of that, even relatively mature economies such as Japan can increase cumulative GDP (for 2005–2025) by up to 5%.
4.5.3 endogenous Growth effects (Neoclassical)One of the most important insights to emerge from neoclassical studies of trade and development is the notion of endogenous growth effects. As explained above, they refer to a wide array of economic factors that have the
Figure 4.9 Margin/Price Results: Cumulative Real GDP, 2006–2025
% C
hang
e fr
om B
asel
ine
Tren
d
0
10
20
30
40
50
60
70
80
90
100
Viet NamIndiaChina, People’s Rep. ofBangladesh
43210є
Source: Model simulations.

110 From Growth to Convergence: Asia’s Next Two Decades
potential to accelerate growth, are endemic to the economic environment, and are activated by individual incentives arising from either markets or policy interventions. They include, for example, such things as human capital formation (the individual pursuit of education/training), technology transfer from foreign direct investment or direct external assistance, interindustry or intra-industry spillovers, and positive network externalities.
Obviously, the diversity of these growth effects and the complexity of their economic agency make them difficult to study empirically. However, they are believed to be among the most potent stimuli for economic growth and modernization, and as such cannot be ignored. On the contrary, endogenous growth factors like technology transfer and high-skill job creation are among the most sought-after elements in multilateral trade and investment negotiations, both public and private. Infrastructure investment is considered one of the most important enabling policies to promote endogenous growth processes. For all these reasons, the links between infrastructure and growth through this channel need to be better understood.
As in the previous experiments, productivity is used as a proxy variable for endogenous growth factors. This is appropriate in the present context since productivity (individually and for all factors) is one of the most common metrics for assessing an economy’s capacity for accelerating growth by internal (endogenous) means. To get a tangible sense of how these factors can contribute to growth in the context of Asian regional integration, an extension of the previous two scenarios is considered. In particular, infrastructure trends are assumed to follow those of the first two experiments, but productivity dividends from infrastructure are assumed to be more widely distributed across the economy. This extensive productivity view is universally supported in the empirical literature, although its exact magnitude is still a subject of empirical study.
More specifically, in the work discussed at the beginning of this section, Calderón and Servén (2005) construct a synthetic index of infrastructure from the capital stocks in essential transport, distribution, and communications sectors. After extensive econometric specification testing, they obtain results showing that the productivity impact of infrastructure stock on growth is positive and significant, and varies inversely with the prior level of the stock. In other words, economies with smaller initial stocks are more growth sensitive to the same absolute and relative quantity of new infrastructure investment. In particular, these authors find that investments that achieve 5-year movements of two standard deviations in the initial sample distribution of infrastructure stocks would add 1.7–3.1% to the growth rate of bottom quartile economies.
The present experiments proxy a low-end 2.0% growth dividend with TFP
Infrastructure as a Catalyst for Regional Integration, Growth, and Economic Convergence 111
growth of the same amount in all sectors, assuming that this arises from the patterns of investment acceleration used in the last two scenarios. In other words, the growth dividend is not uniform, but depends on the movement of each economy with respect to the initial distribution of infrastructure. Lower-income countries that catch up with higher rates of investment will enjoy higher dividends (up to a maximum of 2 percentage points higher real GDP growth). Of course, compounding TFP growth can make average or cumulative growth rates much higher.
Therefore in this context, infrastructure improvements not only lower transaction costs, but also increase individual and total factor productivity. For example, a worker who can drive to work on an improved road saves money and time, increasing both purchasing power and productivity.
The experiment reported next assumes the same scenario as the previous sections, but applies infrastructure-induced productivity growth to all sectors in each economy. As earlier, the main empirical guidance for this experiment is the exhaustive Latin American survey by Calderón and Servén (2003a and b; 2005), who explicitly estimate the composite growth and implied TFP effects of infrastructure across an extensive and diverse panel dataset. This work established a nearly definitive standard for econometric estimation in this area, and the results are extended to the Asian context in the absence of anything approaching this statistical quality for Asia.
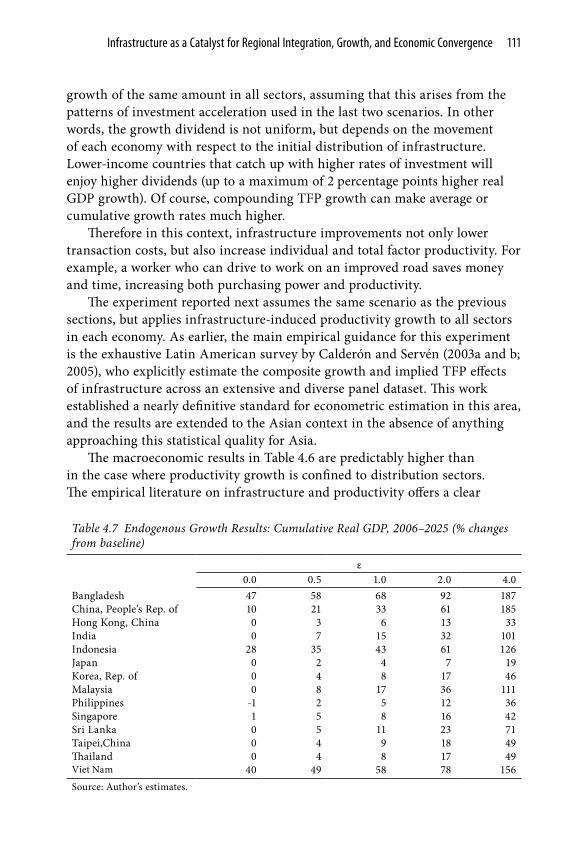
The macroeconomic results in Table 4.6 are predictably higher than in the case where productivity growth is confined to distribution sectors. The empirical literature on infrastructure and productivity offers a clear
Table 4.7 Endogenous Growth Results: Cumulative Real GDP, 2006–2025 (% changes from baseline)
ε0.0 0.5 1.0 2.0 4.0
Bangladesh 47 58 68 92 187China, People’s Rep. of 10 21 33 61 185Hong Kong, China 0 3 6 13 33India 0 7 15 32 101Indonesia 28 35 43 61 126Japan 0 2 4 7 19Korea, Rep. of 0 4 8 17 46Malaysia 0 8 17 36 111Philippines -1 2 5 12 36Singapore 1 5 8 16 42Sri Lanka 0 5 11 23 71Taipei,China 0 4 9 18 49Thailand 0 4 8 17 49Viet Nam 40 49 58 78 156Source: Author’s estimates.

112 From Growth to Convergence: Asia’s Next Two Decades
consensus that productivity gains from extensive public goods infrastructure are widely dispersed across economic activities. The extent of this dispersal is an empirical question, but a spectrum of productivity (aggregate investment) elasticities is examined as in the previous experiments. Even in this case, a doubling of GDP growth rates (Tables 4.7 and 4.8, and Figure 4.10) is possible for the economies with lowest prior infrastructure stocks. Other economies in the region are assumed to experience the same productivity benefits from their baseline investment commitments, and their growth premiums are a reminder of the importance of capital accumulation in the dynamic Asian development story.
Among the accelerated investment countries, an interesting case is provided by the PRC’s “overtaking” of Bangladesh at higher elasticity levels. The reason for this lies in the PRC’s high baseline investment levels. In addition to assuming investment acceleration to close the infrastructure gap, these scenarios assume that productivity benefits accrue from baseline investment trends. Because of its very high baseline savings-investment rate, the PRC’s growth accelerates rapidly when productivity benefits accompany this investment acceleration. Indeed, the PRC is placed high in the Asian “league table” of growth economies.
These endogenous growth results are not at all hypothetical in qualitative terms, as can be made apparent with an important example of Asian regional development, namely, supply networks. One of the more dramatic modern manifestations of reduced trade costs and productivity growth is the regional and global decomposition of supply chains. Foreign direct investment and
Table 4.8 Endogenous Growth Results: Annualized Growth Rate of Real GDP (percentage point premium over baseline)
ε
0.0 0.5 1.0 2.0 4.0
Bangladesh 3.0 3.4 3.9 4.7 7.3China, People’s Rep. of 0.7 1.4 2.0 3.2 6.9Hong Kong, China 0.0 0.2 0.4 0.8 1.8India 0.0 0.5 1.0 1.9 4.7Indonesia 2.0 2.4 2.8 3.5 5.8Japan 0.0 0.1 0.3 0.5 1.3Korea, Rep. of 0.0 0.3 0.5 1.1 2.6Malaysia 0.0 0.6 1.1 2.1 5.1Philippines -0.1 0.1 0.3 0.7 2.0Singapore 0.1 0.3 0.6 1.0 2.3Sri Lanka 0.0 0.3 0.7 1.4 3.6Taipei,China 0.0 0.3 0.6 1.1 2.7Thailand 0.0 0.3 0.6 1.1 2.8Viet Nam 2.7 3.0 3.4 4.1 6.4Source: Author’s estimates.

Infrastructure as a Catalyst for Regional Integration, Growth, and Economic Convergence 113
contractual linkages are distributing production tasks, employment, and income around the world for myriad reasons. These include factor price differences, local and regional market access, and simple diversification strategies, but in all cases, the result is an ever-growing web of regional trade linkages.
This trend has been greatly facilitated in the Asian region by infrastructure investment, which reduces network management and integration costs and sharpens the differentials between costs and prices in different locales. As this process evolves, the emergence of mature industries is seen, where once was only a primary product or component producer. Each time this happens, the individual locality migrates up the value-added ladder and local resources command higher premiums in the global marketplace. In this way, supply chain decomposition and the infrastructure that makes it possible contribute to ever-wider networks of value creation, and to more stable and widely dispersed regional growth.
In East Asia, this process has advanced very quickly and pervasively, facilitated by both industrial-country foreign direct investment and a “stepladder effect” where more advanced Asian economies reallocate production to less advanced ones. In the process of distributing supply chains, foreign investors in the region create new nodes of production in different localities, and another indirect phenomenon emerges. In this process, fully autonomous enterprises and markets sprout from the nodes of a “root system” of global intermediate supply. This process is long established in the newly industrialized economies and can be seen to emerge now in the PRC and other
Figure 4.10 Endogenous Growth Results: Cumulative Real GDP, 2006–2025
% C
hang
e fr
om B
asel
ine
Tren
d
Viet NamIndiaChina, People’s Rep. ofBangladesh
0
20
40
60
80
100
120
140
160
180
200
43210ε
Source: Model simulations.

114 From Growth to Convergence: Asia’s Next Two Decades
emerging Asian economies. The result is replication of industries and markets at an exponential rate. Infrastructure, whether publicly or privately financed, is a prerequisite for effective participation in this regional production sharing.
4.6 INFrAsTruCTure DeveloPMeNT GoAls
One of the most important contributions infrastructure can make to economic progress is improving the living standards of the poor. Improved living standards can take many forms, from increased market access to better quality of and access to essential public goods. As part of its broad-based commitment to advancing infrastructure’s contribution to Asian regional integration and growth, ADB has placed high priority on poverty reduction. In this chapter, the many facets of infrastructure’s contribution to economic growth have been discussed. This section proposes a concrete set of development goals that explicitly recognize these contributions (compare, e.g., Canning, 1998). Formally, these objectives are called the infrastructure development goals to evoke their close relationship with the United Nations’ more general Millennium Development Goals (MDGs) that assess progress in global living standards. While the infrastructure development goals are of independent interest, their conformity with the MDGs recognizes the usefulness of the latter in the international development dialogue, and is also intended to emphasize the integral contribution of infrastructure to improving the livelihoods of the majority of the world’s poor.
The 2005 publication of ADB/JBIC/World Bank emphasized the importance of infrastructure’s contribution to the MDGs. Here that linkage is made more explicit by setting forth eight infrastructure development goals that can be used to measure the performance and progress of public and private development participation in poor countries. The goals cover direct economic contributions from infrastructure, but also include a variety of other welfare criteria associated with economic activity, education, health, environment, and sustainability. Establishing specific, transparent standards and metrics to measure infrastructure’s contribution to improved standards of living, as well as a policy dialogue to support this process, can support more effective development strategies for development and emerging economy growth policy.
Box 4.3 proposes eight infrastructure development goals for use in publicly and privately financed evaluation.

Infrastructure as a Catalyst for Regional Integration, Growth, and Economic Convergence 115
Box 4.3 Infrastructure Development Goals
Goal 1: Eradicate Infrastructure Poverty. Halve, between 1990 and 2015, the proportion of people who lack access to basic infrastructure services.
Goal 2: Achieve Universal Access to Primary Education. Ensure that, by 2015, children everywhere, boys and girls alike, have local access to full-time primary educational resources.
Goal 3: Improve Access to Information and Communication technology. Reduce by three quarters, by 2015, the number of households without local and affordable access to telecommunication and digital information services.
Goal 4: Improve Electrification. Reduce by two thirds the number of households without access to in-home electricity.
Goal 5: Improve Market Access. Promote investment in transport infrastructure that can reduce average domestic seller and worker travel times by two thirds, preferably by 2015.
Goal 6: Improve Public Health Access. Promote more extensive investment in public health resources, increasing local access for urban and rural populations generally and for the poor in particular. Reduce by three quarters, preferably by 2015, the average combined travel and queuing time for access to licensed health care services.
Goal 7: Promote Environmental Sustainability. Integrate the principles of sustainable development into infrastructure policies and programs, and reverse the losses of environmental resources.
Reduce by three quarters, by 2015, the proportion of people without sustainable access to safe drinking water.
Reduce by three quarters, by 2015, the proportion of people without sustainable access to sanitation services.
Goal 8: Develop a Global Partnership for Infrastructure. Establish the institutional framework needed to facilitate coherent multilateral approaches to infrastructure development, including regional policy coordination, financial market integration, and standards and technology sharing.

116 From Growth to Convergence: Asia’s Next Two Decades
4.7 CoNCluDING reMArks
Infrastructure can play a significant role in promoting regional integration and with it more rapid and sustained growth in Asia. Using a global CGE model, it is found that infrastructure can be a potent catalyst for wider economic participation, both within and between Asian economies, and that it can promote private, individual agency as a means of poverty reduction and more rapid growth among the poorest regional economies. The basic approach elucidates the role of infrastructure as a demand stimulus, a means of reducing trade costs, and as an agent of productivity growth. In the first case, significant economywide multiplier effects accelerate growth, particularly in less developed regional economies whose initial conditions require faster investment rates to upgrade their infrastructure.
A series of simulations focusing on trade cost reduction indicate that infrastructure investment can facilitate domestic market access and regional integration, sharply increasing economic growth, but its effects vary significantly between economies. Two types of countries are most likely to gain: those with very high prior domestic margins, and those with high prior levels of external trade dependence. Investment in domestic infrastructure is especially important for less open low-income countries. In these cases, external partnerships could be an important source of investment leverage to overcome domestic savings constraints, and the results indicate these initiatives would be rewarded with superior regional growth rates and improvements in regional equity via economic convergence. Multilateral strategies of this kind are indeed essential to make regional growth and integration opportunities more inclusive. The estimates reinforce the importance of infrastructure to overcoming bottlenecks to growth, particularly in terms of broader regional market participation. These general conclusions could be refined with more intensive local empirical work, but they are unlikely to be contradicted.
Finally, appealing to an extensive theoretical literature on endogenous growth effects, but a fairly narrow basis of prior empirical work, indicative results are given about how infrastructure-induced productivity growth can stimulate regional integration and convergence. These results need refinement with more localized data on the infrastructure–growth–productivity nexus. Despite this caveat, however, the results can faithfully illustrate infrastructure’s potential as a catalyst for growth and regional poverty reduction, and it is believed that qualitative results obtained here will also prove robust to more localized calibration.
Extensions of the present work could shed much new light on the more detailed effects of infrastructure commitments at every stage, including

Infrastructure as a Catalyst for Regional Integration, Growth, and Economic Convergence 117
financial/fiscal sourcing; domestic, bilateral, and multilateral project implementation; and myriad downstream assessments including economic facilitation (as studied here), productivity spillovers and other growth externalities, income growth, and distributional outcomes. Given the importance of these issues to development in general and ADB’s mission in particular, and in recognition of the capacity of general equilibrium models to account for these complex effects, the present approach can support a broad agenda of policy research with more detailed empirical study.
As a final observation, it is worth noting that the current experiments have not addressed trade policy directly. To clearly identify the role of infrastructure in domestic economic growth, the experiments are not compounded with scenarios, for example, for regional or global trade liberalization. This would be a natural extension of the present work, and would in all likelihood demonstrate strong complementarity between Asian regional policy agendas for economic integration, trade, and investment.
eNDNoTes
1 One exception is Agénor et al. (2005) who apply a different but related approach.
2 See van der Mensbrugghe (2005) for complete model documentation.3 For more extensive discussion of infrastructure assessment and proxies for
quality and performance criteria, see for example, Estache and Goicoechea (2005).
4 For reference, the population-weighted standard yields additional investment needs of $157 billion per year, compared with the ADB/JBIC/World Bank (2005) estimate of $200 billion for Asia’s unmet growth needs. For the simple average and GDP-weighted standards, the shortfalls are $816 billion and $2 trillion, respectively.
reFereNCes
Agénor, P-R., N. Bayraktar, and K. E. Aynaoui. 2005. “Roads out of Poverty? Assessing the Links between Aid, Public Investment, Growth, and Poverty Reduction.” World Bank Policy Research Working Paper 3490, Washington, DC.
Ahmed, R., and M. Hossain. 1990. “Developmental Impact of Rural Infrastructure in Bangladesh.” IFPRI Research Report 83, International Food Policy Research Institute, Washington, DC.

118 From Growth to Convergence: Asia’s Next Two Decades
Aschauer, D. A. 1989. “Is Public Expenditure Productive?” Journal of Monetary Economics 23:177–200.
ADB/JBIC/World Bank. 2005. Connecting East Asia: A New Framework for Infrastructure. Asian Development Bank, Japan Bank for International Cooperation, and World Bank. Manila.
Baltagi, H. and N. Pinnoi 1995. ”Public Capital Stock and State Productivity Growth: Further Evidence from an Error Components Model.” Empirical Economics 20:351–9.
Benziger, V. 1996. “Urban Access and Rural Productivity Growth in Post-Mao China.” Economic Development and Cultural Change 44:539–70.
Boarnet, M. G. 1997. “Highways and Economic Productivity: Interpreting Recent Evidence.” Journal of Planning Literature 11(4):476–86.
Briceño-Garmendia, C., A. Estache, and N. Shafik. 2004. “Infrastructure Services in Developing Countries: Access, Quality, Costs, and Policy Reform.” World Bank Policy Research Working Paper 3468, Washington, DC.
Brooks, D., D. Roland-Holst, and F. Zhai. 2005. “Asia’s Long Term Growth and Integration: Reaching Beyond Policy Barriers.” ERD Policy Brief 38, Asian Development Bank, Manila.
Calderón, C. and L. Servén. 2003a. “Macroeconomic Dimensions of Infrastructure in Latin America.” Paper presented at the Fourth Annual Stanford Conference on Latin American Economic Development, 13–15 November, Stanford Center for International Development, Stanford University, Palo Alto.
——— . 2003b. “The Output Cost of Latin America’s Infrastructure Gap.” In W. Easterly and L. Servén (eds.), The Limits of Stabilization: Infrastructure, Public Deficits, and Growth in Latin America. Palo Alto: Stanford University Press and the World Bank.
——— . 2004. “The Effects of Infrastructure Development on Growth and Income Distribution.” World Bank Policy Research Working Paper 3400. Washington, DC.
Canning, D. 1998. “The Contribution of Infrastructure to Aggregate Output.” The World Bank Policy Research Working Paper 2246, Washington, DC.
Cashin, P. 1995. Government Spending, Taxes, and Economic Growth. IMF Staff Papers 42(2):237–69.
Demetriades, P., and T. Mamuneas. 2000. “Intertemporal Output and Employment Effects of Public Infrastructure Capital: Evidence from 12 OECD Economies.” The Economic Journal 110:687–712.
Easterly, W. 2001. “The Lost Decade: Developing Countries’ Stagnation in Spite of Policy Reform.” World Bank, Washington, DC. Unpublished manuscript.
Easterly, W. and S. Rebelo. 1993. “Fiscal Policy and Economic Growth: An Empirical Investigation.” Journal of Monetary Economics 32:417–58.
Esfahani, H. and M. T. Ramirez. 2002. “Institutions, Infrastructure and Economic Growth.” Journal of Development Economics 70:443–77.

Infrastructure as a Catalyst for Regional Integration, Growth, and Economic Convergence 119
Estache, A. and A. Goicoechea. 2005. A “Research” Database on Infrastructure Economic Performance. World Bank Policy Research Working Paper 3643, Washington, DC.
Fan, S., L. Zhang, and X. Zhang. 2002. “Growth, Inequality, and Poverty in Rural China: The Role of Public Investments.” IFPRI Research Report 125, International Food Policy Research Institute, Washington, DC.
Fay, Marianne and Tito Yepes. 2003. “Investing in Infrastructure: What is needed from 2000 to 2010?,” World Bank Policy Research Working Paper 3102, Washingon, DC.
Ferranti, D. de, G. E. Perry, F. Ferreira, and M. Walton (eds.). 2004. Inequality in Latin America and the Caribbean: Breaking with History? World Bank, Washington, DC.
Fernald, J. G. 1999. “Roads to Prosperity? Assessing the Link Between Public Capital and Productivity.” The American Economic Review 89:619–38.
Florio, M. 1997. “The Economic Rate of Return of Infrastructures and Regional Policy in the European Union.” Annals of Public and Cooperative Economics 68(1):39–64.
Fisher, R. C. 1997. “The Effects of State and Local Public Services on Economic Development.” New England Economic Review March/April:53–67.
Garcia-Mila, T., T. J. McGuire, and R. H. Porter. 1996. “The Effect of Public Capital in State-Level Production Functions Reconsidered.” Review of Economics and Statistics 88(1):177–80.
Gramlich, E. M. 1994. “Infrastructure Investment: A Review Essay.” Journal of Economic Literature 32(September):1176–96.
Hines, J. R., Jr. and R. H. Thaler. 1995. “Anomalies: The Flypaper Effect.” Journal of Economic Perspectives 9(4):217–26.
Holtz-Eakin, D. 1994. “Public Sector Capital and the Productivity Puzzle.” The Review of Economics and Statistics 76(1):12–21.
Holtz-Eakin, D., and A. E. Schwartz. 1994. “Spatial Productivity Spillovers from Public Infrastructure: Evidence from State Highways.” International and Public Finance 2(3):459–68.
Hulten, C. 1996. “Infrastructure Capital and Economic Growth: How Well You Use It May Be More Important than How Much You Have.” NBER Working Paper 5847, National Bureau of Economic Research, Massachusetts.
Jacoby, H. 2000. “Access to Rural Markets and the Benefits of Rural Roads.” The Economic Journal 110:713– 37.
Khandker, S., V. Lavy, and D. Filmer. 1994. “Schooling and Cognitive Achievements of Children in Morocco.” World Bank Discussion Paper 264, Washington, DC.
Lin, S., and S. Song. 2002. “Urban Economic Growth in China: Theory and evidence.” Urban Studies 39(12):2251–66.
Morrison, C. J., and A. E. Schwartz. 1996. “State Infrastructure and Productive Performance.” American Economic Review 86(5):1095–111.

120 From Growth to Convergence: Asia’s Next Two Decades
Munnell, A. H. 1992. “Infrastructure Investment and Economic Growth.” Journal of Economic Perspectives 6(4):189–98.
Nadiri, M. I., and T. P. Mamuneas. 1996. “Contribution of Highway Capital to Industry and National Productivity Growth.” Report submitted by Apogee Research, Inc., Bethesda, Md., to the Federal Highway Administration, Office of Policy Development, September. Available: http://www.fhwa.dot.gov/pubstats.html.
OECD. 2006. International Development Statistics. Development Assistance Committee, Organisation for Economic Co-operation and Development, Paris.
Riverson, J., J. Gaviria, and S. Thriscutt. 1991. “Rural Roads in Sub-Saharan Africa—Lessons from World Bank Experience.” World Bank Technical Paper 141, Africa Technical Department Series, Washington, DC.
Röller, L-H., and L. Waverman. 2001. “Telecommunications Infrastructure and Economic Development: A Simultaneous Approach.” American Economic Review 91:909–23.
Sanchez-Robles, B. 1998. “Infrastructure Investment and Growth: Some Empirical Evidence.” Contemporary Economic Policy 16:98–108.
Songco, J. A. 2002. “Do Rural Infrastructure Investments Benefit the Poor? Evaluating Linkages: A Global View, A Focus on Vietnam.” World Bank Policy Research Working Paper 2796, Washington, DC.
Sturm, J. E., and J. de Haan. 1995. “Is Public Expenditure Really Productive? New Evidence for the USA and the Netherlands.” Economic Modeling 12(1):60–72.
Tatom, J. A. 1993. “Paved with Good Intentions: The Mythical National Infrastructure Crisis.” Policy Analysis 196, Cato Institute, Washington, DC.
UNCTAD. 2006. “FDI from Developing and Transition Economies: Implications for Development.” In World Investment Report. United Nations Conference on Trade and Development, Geneva.
van der Mensbrugghe, D. 2005. “LINKAGE Technical Reference Document.” Development Prospects Group, World Bank, Washington, DC. Processed.
Winston, C., and B. Bosworth. 1992. “Public Infrastructure.” In H. J. Aaron and C. L. Schultze (eds.), Setting Domestic Priorities: What Can Government Do? Brookings Institution, Washington, DC.
World Bank. 1994. World Development Report. Washington, DC.Yepes, T. 2004. “Expenditure on Infrastructure in East Asia Region, 2006–2010.”
Background paper prepared for the ADB/JBIC/World Bank Report on Asia’s Infrastructure Needs. Asian Development Bank, Manila.

Infrastructure as a Catalyst for Regional Integration, Growth, and Economic Convergence 121
APPeNDIx
regression results for Asian Infrastructure Needs Calderón and Servén (2005) report estimates for an index of infrastructure availability obtained for a global database of over 100 countries covering the period 1960–1995. The index was constructed to measure availability of three categories of infrastructure: telecommunications, electric power, and road/rail networks. (See Calderón and Servén (2005) for details about the dataset, indicator definitions, and their own extensive estimation of infrastructure productivity effects.)
The three variables are stocks measured with respect to population (L) or total national surface area (A) as follows:
A
Z3
L
Z2
L
Z1CSIit ++it
(= ln5015.0ln6075.0ln6159.0it
(it
( )) )This variable is depicted in Figure 4.8 in the chapter proper and provided
the basis for the regression estimates of unmet investment needs shown in Appendix Table A4.1.
The results are based on a 13 country Asian subsample of the Calderón and Servén database, consisting of 85 observations pooled in 5-year intervals from 1960 to 1995. Some countries were not reporting until the 1970s and the last decade has been very important to infrastructure development in the PRC and a few other rapidly emerging economies. Nonetheless, the results are very robust in terms of overall goodness of fit and individual significance of the main explanatory variable (CSI) and the country dummies (defined in Appendix Table A4.1). Japan is the omitted country, so levels of infrastructure density are defined with respect to this economy (i.e., Hong Kong, China and Singapore above and the rest below the Japanese intercept; see Figure 4.8).
These results indicate that infrastructure development in Asia is highly correlated with overall investment; indeed in the 5-year intervals, an elasticity of just over unity between aggregate capital formation and the Calderón-Servén index is seen. The strength of this relationship will vary between countries, but it indicates that high rates of domestic capital formation in Asia contribute strongly to the national commons of productive infrastructure.

122 From Growth to Convergence: Asia’s Next Two Decades
Appendix Table A4.1 Regression Results for Infrastructure Investment RequirementsSource SS df MS Number of obs = 85
F(13,72) = 183.93Model 740.238122 13 56.941394 Prob>F = 0.0000Residual 22.2897486 72 .309579841 R-squared = 0.9708Total 762.527871 85 8.97091612 AdjR-squared = 0.9655
Root MSE .5564
linv Coef. Std. Err. t P>|t| [95% Conf. Interval]CSI 1.125155 .0349089 32.23 0.000 1.055566 1.194745BAN 3.928857 .2292571 17.14 0.000 3.471841 4.385873PRC 6.404122 .2345318 27.31 0.000 5.936592 6.871653HKG -2.797971 .3680138 -7.60 0.000 -3.531593 -2.064349IND 4.160417 .2115945 19.66 0.000 3.738611 4.582223INO 4.349985 .2208816 19.69 0.000 3.909665 4.790304KOR .2854137 .2238050 1.28 0.206 -.1607334 .7315608MAL .0844627 .2142628 0.39 0.695 -.3426624 .5115878PAK 2.726337 .2288788 11.91 0.000 2.270075 3.182598PHI 1.839141 .2104679 8.74 0.000 1.419581 2.258701SIN -3.870027 .2649475 -14.61 0.000 -4.398190 -3.341864SRI .2580208 .2104293 1.23 0.224 -.1614623 .677504THA 2.838656 .2114507 13.42 0.000 2.417137 3.260175Variable Definitions:Dependent variable: linv = Logarithm of aggregate domestic investment.Independent variable: CSI = Calderón-Servén index of infrastructure availability.Country-specific fixed-effect variables: BAN = Bangladesh; PRC = People’s Republic of China; HKG = Hong Kong, China; IND = India; INO = Indonesia; KOR = Republic of Korea; MAL= Malaysia; PAK = Pakistan; PHI = Philippines; SIN = Singapore; SRI = Sri Lanka; THA = Thailand.