infrastructure changes and cost to increase consumption of
TRANSCRIPT

Infrastructure Changes and Cost to Increase Consumption of E85 and E15 in 2017
Prepared for
Growth Energy
By
Stillwater Associates LLC Irvine, California, USA
July 11, 2016
Stillwater Associates
3 Rainstar Irvine, CA 92614 – Tel (949) 653 5899 – Fax (949) 786 4395 – stillwaterassociates.com
Infrastructure Changes and Cost to Increase RFS Ethanol Volumes through Increased E15 and E85 Sales in 2017
i
Disclaimer Stillwater Associates LLC prepared this report for the sole benefit of Growth Energy. Stillwater Associates LLC conducted the analysis and prepared this report using reasonable care and skill in applying methods of analysis consistent with normal industry practice. All results are based on information available at the time of presentation. Changes in factors upon which the report is based could affect the results. Forecasts are inherently uncertain because of events that cannot be foreseen, including the actions of governments, individuals, third parties and competitors. NO IMPLIED WARRANTY OF MERCHANTABILITY SHALL APPLY.

Infrastructure Changes and Cost to Increase RFS Ethanol Volumes through Increased E15 and E85 Sales in 2017
ii
Table of Contents Executive Summary .......................................................................................................................... 1 1 The Objective of the Study ....................................................................................................... 2 2 E85 Analysis ............................................................................................................................. 2
2.1 Case 1: Incremental Ethanol Consumption Through Existing E85 Infrastructure ............ 2 2.2 Case 2: Expanding Infrastructure to Deliver E85 in 2017 ................................................. 4 2.3 Transporting Additional E85 .............................................................................................. 6
3 Economics of E85 Infrastructure Changes ............................................................................... 7 3.1 Single Station Single Dispenser Economics ..................................................................... 7
4 How to Increase Sales at Existing E85 Stations ...................................................................... 9 4.1 Customer Segmentation ................................................................................................... 9 4.2 Gross Margins ................................................................................................................. 12 4.3 What RIN Price is Needed for Short Term Volume Growth ............................................ 16 4.4 Impact of Different Demand Curves on Optimum Gross Margin .................................... 18
5 E15 Analysis ........................................................................................................................... 19 5.1 Expanding Infrastructure to Deliver E15 in 2017 ............................................................ 19 5.2 The Time since the Last Dispenser Replacement is Important ...................................... 19 5.3 Station Costs to Upgrade to E15 .................................................................................... 20 5.4 Costs for the Blender Pump Option ................................................................................ 22 5.5 The Phase-In for 2017 .................................................................................................... 22
5.5.1 E15 dispenser economics ........................................................................................ 22 5.6 The Upgrade Cost Until E15 is Available at the Terminal ............................................... 24
List of Tables
Table 3.1 - Single Dispenser Economics for addition of second E85 Dispenser at Existing E85 station on replacement cycle ........................................................................................................... 7 Table 3.2 - Single Dispenser Economics for addition of a second E85 Dispenser at Existing E85 station off replacement cycle ........................................................................................................... 7 Table 3.3 - Single Dispenser Economics for addition of a new E85 Dispenser at Existing E10 station off replacement cycle ........................................................................................................... 8 Table 3.4 - Single Dispenser Economics under scenario 3 where the new E85 dispenser added at the previously E10-only station has 50% dispenser utilization ........................................................ 8 Table 3.5 Single Dispenser Economics for addition of a new E85 Dispenser at Existing E10 station (off replacement cycle) with 10% dispenser utilization ........................................................ 9 Table 4.1 – Estimates of Customer Breakdown ............................................................................ 10 Table 5.1 - Station Costs to Upgrade to E15 – Two Gasoline Tank Station ................................. 21 Table 5.2 - Station Costs to Upgrade to E15 – Three Gasoline Tank Station .............................. 21 Table 5.3 - Station Costs to Upgrade to E15 – Two Gasoline Tank Station ................................. 23 Table 5.4 – Rate of Return on Investment .................................................................................... 23 Table 5.5 - Station Costs to Upgrade to E15 – Three or More Gasoline Tank Station ................. 23 Table 5.6 – Rate of Return on Investment .................................................................................... 24
Table of Figures
Figure 4.1 – E85 Site Volume, One Dispenser ............................................................................. 11 Figure 4.2 Comparing Stillwater and Brattle Demand Curves ...................................................... 12 Figure 4.3 – E85 Gross Margin Estimates .................................................................................... 13 Figure 4.4 – Calculated Combined Supplier/Dealer E85 Gross Margin ........................................ 14 Figure 4.5 – Optimum E85 Price Point vs. RINs Price .................................................................. 15 Figure 4.6 – RINS Price that Causes E85 to be Priced at 30% Discount to E10 (Ethanol Price) . 16 Figure 4.7 – RINS Price that Causes E85 to be Priced at 30% Discount to E10 (RBOB Price) ... 16 Figure 4.8 – RINs Price Required to Increase E85 Sales by a Factor of 5 ................................... 17

Infrastructure Changes and Cost to Increase RFS Ethanol Volumes through Increased E15 and E85 Sales in 2017
iii
Figure 4.9 – Comparison of Stillwater and Brattle Log-Log Curves .............................................. 18

Infrastructure Changes and Cost to Increase RFS Ethanol Volumes through Increased E15 and E85 Sales in 2017
1
Executive Summary
Congress legislated both the 2005 Renewable Fuel Standard (RFS) and the updated 2007 Standard (RFS2) as a mechanism to mandate the phasing in of renewable biofuels into U.S. transportation fuels. On an annual basis, the administering agency, the U.S. Environmental Protection Agency (EPA), is expected to propose and finalize new volume obligations for the four RFS categories of cellulosic biofuels; advanced biofuels, biomass-based diesel and total renewable biofuels. Ethanol has become the predominant biofuel used to meet three of the four RFS2 categories. Ethanol can be used in transportation fuel when it is blended with gasoline at various levels. The most popular of these has been E10, which is 10 percent ethanol and 90 percent petroleum blendstocks. Ethanol can also legally be blended as E15, a blend of up to 15 percent ethanol, or as E85. E85 can contain 51 to 83 percent ethanol blended with petroleum blendstocks or natural gasoline. E85 can only be used in Flexible Fueled Vehicles (FFVs). FFVs comprise about eight percent of the nation’s transportation vehicle fleet. As the RFS2 mandates for ethanol have risen, the nation has begun to approach the so-called E10 blendwall, that point at which nearly all of the nation’s gasoline has been blended at the 10 percent ethanol level. To get around the E10 blendwall, it is necessary to find pathways to blend more than 10 percent ethanol into ever larger portions into the nation’s gasoline pool. E15 and E85 are the primary pathways to increase ethanol consumption beyond 10%. In its latest RFS2 proposal for 2017, EPA has proposed standards that result in modest increases in ethanol usage but has discounted the additional contribution from E85 and E15. Growth Energy has requested that Stillwater Associates examine the distribution infrastructure for pathways to potentially increase the supply of E15 and E85 at the retail station level. Stillwater has considerable experience in the transportation fuels distribution space. Stillwater evaluated the current state of fuels distribution, from the supply source though the pipeline and terminal network to the service station and to the consumer. For E85, Stillwater found that there are enough E85 stations and E85 dispensers in the U.S. to substantially increase the volumes of ethanol used in transportation fuels. The simplest case where E85 throughput is increased in the roughly 3,100 existing E85 stations with no new hardware required can increase E85 sales by 1.674 billion gallons per year (bgy) and increase ethanol usage by 1.108 bgy if EPA would only provide sufficient economic incentives to current FFV owners using E10. This is very low hanging fruit in terms of increasing renewable fuels usage. Stillwater analyzed the reasons for the current low consumption of E85 and found that E85 needs to sell below its energy parity value compared to E10 in order to increase sales to price conscious E10 consumers. Stillwater found that EPA’s recently established and currently proposed RFS renewable standards fall short of providing a sufficient driving force to increase D6 RIN value to the point where E85 prices can be set far enough below energy parity with E10 to establish a tipping point where larger E85 sales volumes enable even lower E85 prices to the consumer. Stillwater also found that ethanol volumes can be increased significantly through the use of E15 or E85 by making relatively modest investments to expand the infrastructure for delivering E85 or E15.

Infrastructure Changes and Cost to Increase RFS Ethanol Volumes through Increased E15 and E85 Sales in 2017
2
1 The Objective of the Study On May 31, 2016, the EPA issued a notice of proposed rulemaking on the 2017 Renewable Fuel Standards and the biomass-based diesel standard for 2018. For 2017, EPA is proposing standards based on an assumption that the maximum reasonably achievable volume of ethanol usage is approximately 0.2 bgy above the E10 blendwall most of which is E85. Growth Energy has requested that Stillwater Associates evaluate whether more volumes of incremental ethanol are reasonably achievable through E85 and E15 if EPA were to require additional ethanol above the E10 blendwall through implementation of the RFS.
In this report, Stillwater assesses the ability of the fuel system to deliver greater volumes of E85 right now. We then analyze the potential pathways for expanding infrastructure for selling E85 or E15. Stillwater prioritizes low-cost solutions for expansion. Stillwater also analyzes the financial dynamics of the market to determine what kind of incentives are needed to spur the necessary investment in upgraded infrastructure, and develops a market segmentation model that illuminates what is needed from RFS volume requirements and the RIN market to create those incentives.
Stillwater did NOT examine the actual production capacity of ethanol manufacturing facilities but will assume that sufficient domestic production is available to fulfill the incremental supply. Additionally, Stillwater did assume that model year 2001 and later U.S. automobile and truck fleets are capable of using E15 and that original equipment manufacturer warranty issues will not impede renewable fuel consumption. Support, or lack thereof, from the oil industry is assumed to be out of scope for the purposes of this report.
2 E85 Analysis In the E85 portion of this analysis, Stillwater first identifies the potential increases in E85 sales volumes through existing stations. We then assess the cost of expanding E85 distribution capacity by additional E85 dispensers at existing E85 stations and at E10-only stations, and estimate the magnitude of the possible expansion. Next Stillwater analyzes the investment costs in terms of rates of return and the need for increased margins from the point of adding a single new dispenser. The margins required to achieve desirable rates of return are minimal if the new dispenser is fully utilized but they increase if the dispenser has low E85 throughput, suggesting a strong incentive for high RIN prices and high corresponding E85 discounts. Then Stillwater models the behavior of several segments of E85 customers and discovers that E85 has seldom been priced sufficiently below energy parity with E10 to attract price-sensitive E10 customers, which constitute by far the largest segment of the market. It appears that there is a tipping point in E85 price below which E85 sales volumes can increase rapidly. Finally, Stillwater discusses the ethanol-E85 supply chain and how RINs and ethanol price reductions move through the supply chain. 2.1 Case 1: Incremental Ethanol Consumption Through Existing E85 Infrastructure Existing infrastructure is capable of delivering volumes of E85 far beyond what EPA has proposed. The ability to deliver E85 is a function of three factors:
1. The number of E85 stations; 2. Dispenser throughput; and 3. The location of stations relative to vehicles that can use the fuel, i.e., flex-fuel vehicles
(“FFVs”). We address each in turn.

Infrastructure Changes and Cost to Increase RFS Ethanol Volumes through Increased E15 and E85 Sales in 2017
3
Stations. According to EPA, there were 3,126 E85 stations in the United States as of March 2016.1 By the time 2017 begins, that figure will certainly be higher as a result of additional upgrades and various programs targeted to increase the availability of E85, such as BIP (USDA’s Biofuel Infrastructure Partnership) and the “Prime the Pump” program. EPA notes that BIP is expected to have added 1,486 E85 stations by the end of 2016. Therefore, we can assume that there will be at least 4,612 E85 stations at the start of 2017. But to make our analysis extremely conservative, we will assume that there are 3,100 E85 stations at the start of 2017. Further, that figure will undoubtedly increase over the course of 2017. We address the potential for infrastructure expansion in 2017 later; for now, and again to develop the most conservative analysis, we will assume for present purposes that the number of E85 stations does not increase during 2017 but rather remains at 3,100 for the entire year. Dispenser throughput. In an influential study entitled “Feasibility and Cost of Increasing U.S. Ethanol Consumption Beyond E10,” leading researchers Bruce Babcock and Sebastien Pouliot examined an E85 service station in Minnesota and found that it sold almost 50,000 gallons in one month.2 Accordingly, they assume that the average E85 station can deliver 45,000 gallons of E85 per month. That assumption accords with a rule of thumb in gasoline marketing that the average station will sell two million gallons of fuel per year with four dispensers (2 hoses each). That standard converts to just about 42,000 gallons per month per dispenser. More careful analysis confirms Babcock and Pouliot’s finding and the rule of thumb, but further shows that they are very conservative and reflect a model in which there is minimal customer wait time at the pump. We assume for purposes of this discussion that the average E85 station has one E85 dispenser, located on a fueling island allowing two vehicles access at the same time with one fueling hose on each side of the island. For safety reasons, the EPA has established a rule that limits the rate at which gasoline or methanol is pumped into motor vehicles—the “flow rate”—to 10 gallons per minute.3 While every dispenser has its own self-contained pumping mechanism, it is designed to be shared by both attached hoses, allowing one dispenser to fuel two vehicles simultaneously. While flow rates vary service station to station, and then by dispenser, we assume conservatively for purposes of this discussion a flow rate of just three gallons per minute, assuming two vehicles are using the dispenser at the same time. The average volume of gasoline purchased per transaction (which may or may not completely fill the vehicle gasoline tank) is approximately 12 gallons, which at a flow rate of three gallons per minute would result in the average fueling not exceeding four minutes. We then assume conservatively that it takes four minutes for the just-fueled vehicle to leave the fueling island and the next vehicle to situate at the dispenser after a modest time gap (though we think it could reasonably take as little as two minutes), yielding an eight-minute fueling cycle per vehicle. At that rate, each hose on the fuel dispenser could service 7.5 vehicles per hour, for a total of 15 vehicles per hour per dispenser. While a typical service station is open 24 hours per day (usually set by contractual terms), approximately 75 of its fuel sales take place over a 12-hour peak period with very little taking place during the late evening or early morning hours. Therefore, we assume that drivers fill up at the maximum rate during the 12 peak hours, and that that defines 75% of the daily throughput for the dispenser. Specifically, using the typical fueling volume of 12 gallons per transaction, a single E85 fueling dispenser with two hoses would dispense 180 gallons of fuel during each of the peak hours of operations per day, which works out to 2,160 gallons during the entire peak window, 2,873 gallons total per day, and 86,184 gallons total per month, assuming that daily sales are ratable through a 30-day month (i.e., that the same volume is sold daily—an assumption that likely has only marginal effect on the results). This analysis shows that the average station with a single E85 dispenser could deliver approximately twice the volume of E85 that Babcock and Pouliot assumed and that the rule of thumb suggests.
1 EPA’s count is likely too low. According to e85prices.com, there are about 3,450 E85 stations today. 2 Babcock, Bruce A., Pouliot, Sebastien. Feasibility and Cost of Increasing U.S. Ethanol Consumption Beyond E10. Iowa State University Center for Agricultural and Rural Development - CARD Policy Briefs. January 2014. http://www.card.iastate.edu/publications/dbs/pdffiles/14pb17.pdf 3 EPA. Transportation and Air Quality. http://www.epa.gov/oms

Infrastructure Changes and Cost to Increase RFS Ethanol Volumes through Increased E15 and E85 Sales in 2017
4
For purposes of the rest of this report, we will therefore assume (consistent with Babcock and Pouliot’s finding) a very conservative throughput of 45,000 gallons per dispenser per month. FFVs. According to the U.S. Department of Energy’s (DOE) Alternative Fuels and Advanced Vehicles Data Center (AFDC), there are more than 17.4 million FFVs on U.S. roadways today. In fact, that figure is likely higher—almost 21 million, according to a recent report by Air Improvement Resource, Inc. Total incremental consumption capacity. Finally, we consider how much ethanol can be consumed through this system as E85 above the amount of ethanol that can be consumed as E10, i.e., the existing system’s capacity to deliver and consume incremental ethanol as E85. For purposes of this discussion, we assume, as EPA does, that E85 contains 74% ethanol but adds the equivalent of 66.2% ethanol over the gallon of E10 that the E85 displaces (specifically, EPA states every gallon of ethanol use in excess of E10 requires 1.51 gallons of E85). Assuming 3,100 E85 stations each with a single E85 dispenser distributing 45,000 gallons of E85 per month, this system can distribute about 139.5 million gallons of E85 per month, or 1.674 billion gallons of E85 per year. That is far higher than the 200-300 million gallons of E85 that EPA assumed for 2017. And it equates to about 1.108 billion gallons of incremental ethanol per year. There is no reason to find that the fleet would be unable to consume that entire capacity of E85. The recent report by Air Improvement Resource finds that the existing FFV fleet of 21 million can consume about 17.13 billion gallons of E85 per year.4 Even if AFDC’s smaller fleet size is used, it could still amply consume all the E85 that could be delivered by the existing infrastructure. The only remaining question with respect to the capacity of the existing system to deliver and consume E85 is whether the FFVs are proximate to E85 stations. To assess this, we return to the Babcock and Pouliot paper. Prior to that paper, studies and papers by other authors had simply attempted to extrapolate potential E85 sales using linear models based upon E10 consumption rates. Such analysis is off target, since FFVs are the only vehicles that can use E85 fuel. Babcock and Pouliot used detailed data extracts for the geographical distribution of FFVs across the U.S. down to the zip code level, and the corresponding data of existing E85 service stations with infrastructure already in place. Assuming that station throughput (as noted) was 45,000 gallons of E85 per month, that there were 14.6 million FFVs on the road, that there were 3,000 E85 stations nationwide, and that FFVs would buy E85 from stations within a 10-mile radius, Babcock and Pouliot determined that 1.2-1.3 billion gallons of E85, containing one billion gallons of ethanol, could be consumed in a year. Their result of 1.2-1.3 billion gallons of E85 is of course less than the 1.674 billion gallons of E85 computed above. But since they conducted their study in 2013, the number of E85 stations and the number of FFVs have increased, thus increasing the likelihood that an FFV is within 10 miles of an E85 station, and so it is likely that if the Babcock and Pouliot analysis were re-run using today’s figures, the result would be much higher and closer to the full 1.674 billion gallons of E85 of throughput capacity. In other words, the Babcock and Pouliot results reflect a very conservative estimate of the volume of E85 and incremental ethanol that could be reasonably consumed in 2017. In sum, there is no doubt that much more than one billion gallons of E85 could be consumed nationally in 2017 using existing E85 infrastructure. 2.2 Case 2: Expanding Infrastructure to Deliver E85 in 2017 In this section, we examine low-cost ways to expand infrastructure for delivering E85 to consumers in 2017.
4 Air Improvement Resource, Inc. Analysis of Ethanol-Compatible Fleet for Calendar Year 2017. July 11, 2016.

Infrastructure Changes and Cost to Increase RFS Ethanol Volumes through Increased E15 and E85 Sales in 2017
5
Cost to add an E85 dispenser at an existing E10-only station. There are two principal pieces of infrastructure needed to deliver E85: the dispenser and the underground storage tank. There are two basic kinds of dispensers: blender pumps, which cost about $20,000; and E85 pumps, which cost about $15,000. According to a report by the National Renewable Energy Laboratory (NREL) called “E85 Retail Business Case,”5 there are three methods for an existing service station to obtain the necessary tank to introduce an E85 dispenser:
1. Mid-grade conversion - The retailer cleans an existing (E10) tank and replaces or retrofits associated non-compatible piping and other equipment. This applies to cases where stations have a third tank for mid-grade that can be replaced by a blending valve (for regular and premium to make mid-grade), cases where stations have an extra regular grade tank, or cases where diesel is replaced because the sales are deemed negligible.
2. New tank - The retailer installs a new underground storage tank and retrofits or replaces associated non-compatible piping and other equipment. In this case, the retailer retains the sales of regular and premium fuel.
3. Premium conversion - The retailer fills the premium-grade tank with E85 after cleaning it and replacing associated non-compatible piping and other equipment. This case applies to stations that blend their mid-grade rather than draw it from a designated mid-grade tank, so the retailer can no longer offer either mid-grade or premium-grade gasoline once the tank is converted.6
With the movement to E10, most E10 stations have tanks that are capable of holding E85. As set forth in more detail in an NREL report, all steel tank manufacturers have issued signed letters indicating compatibility with E100, as have fiberglass tanks manufactured in the last ten years.7 The only potential issue would be older fiberglass tanks, where compatibility and manufacturer approval for use depends on age, manufacturer, and whether the tank is single- or double-walled.8 Particularly since EPA promulgated its recent underground storage tank rule, EPA has increased efforts to ensure stations have documentation to show that the tank is approved. This may be a concern for older stations. However, in the past two years, tank and equipment manufacturers have made strides toward updating their records for older equipment design and the types of materials used and supplying this information to the station owners. In fact, EPA’s rule has created a cottage industry of consultants willing to help the station owner meet the documentation requirements for EPA, fire marshal, and insurance purposes. While this service comes with a cost, it is generally cheaper than replacing the equipment and Stillwater’s cost estimates should cover these expenses.
5 Johnson, C. and Melendez, M. E85 Retail Business Case: When and Why to Sell E85. NREL. December 2007. http://www.afdc.energy.gov/pdfs/41590.pdf 6 DOE EERE. Clean Cities – Building Partnerships to Reduce Petroleum Use in Transportation. http://www1.eere.energy.gov/cleancities/ 7 Moriarty, K., Yanowitz, J., E15 and Infrastructure, NREL. May 2015. http://www.afdc.energy.gov/uploads/publication/e15_infrastructure.pdf 8 There is no specific limit on how long a tank can last until it must be replaced. Tanks now have leak detection and corrosion monitoring, so they can be monitored and replaced before failure. Under the right conditions many tanks last 30 years or longer, but there are some locations where a tank is unlikely to last for 20 years.
Infrastructure Changes and Cost to Increase RFS Ethanol Volumes through Increased E15 and E85 Sales in 2017
6
Method 1 is the lowest-cost path and the one we focus on. NREL has estimated the cost of the underground work associated with Method 1 as $15,000, and thus $30,000 to complete the conversion, i.e., including the new E85 dispenser.9
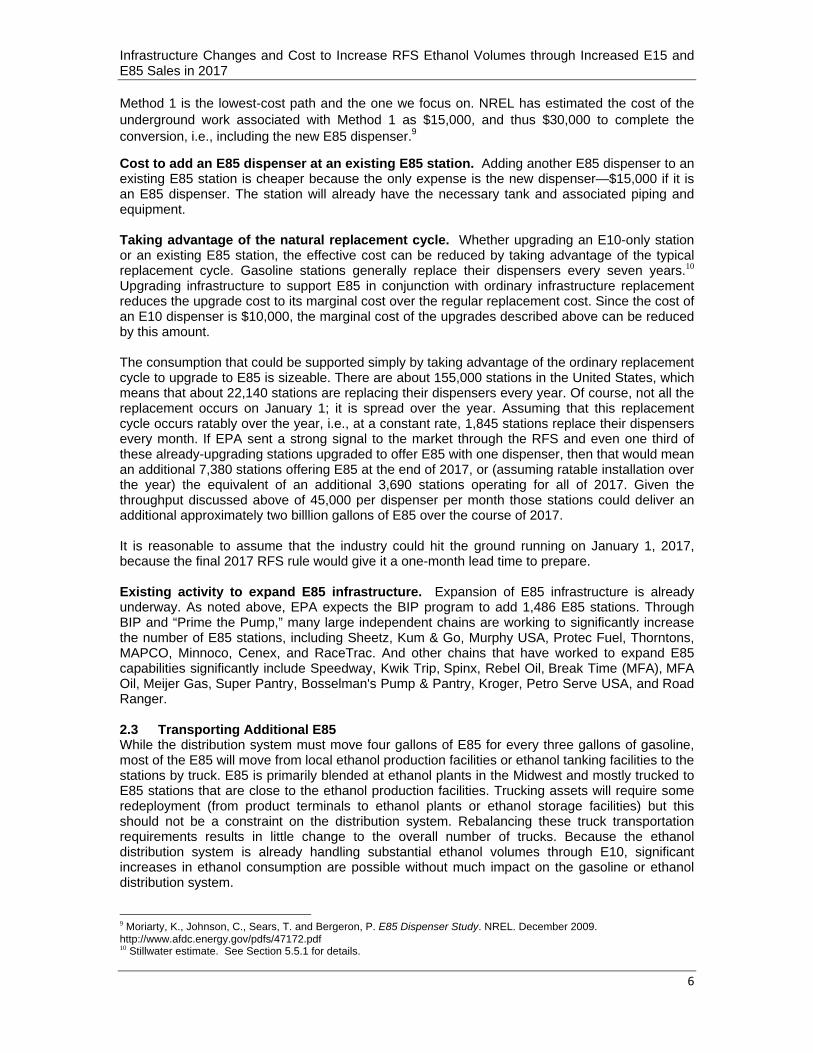
Cost to add an E85 dispenser at an existing E85 station. Adding another E85 dispenser to an existing E85 station is cheaper because the only expense is the new dispenser—$15,000 if it is an E85 dispenser. The station will already have the necessary tank and associated piping and equipment. Taking advantage of the natural replacement cycle. Whether upgrading an E10-only station or an existing E85 station, the effective cost can be reduced by taking advantage of the typical replacement cycle. Gasoline stations generally replace their dispensers every seven years.10 Upgrading infrastructure to support E85 in conjunction with ordinary infrastructure replacement reduces the upgrade cost to its marginal cost over the regular replacement cost. Since the cost of an E10 dispenser is $10,000, the marginal cost of the upgrades described above can be reduced by this amount. The consumption that could be supported simply by taking advantage of the ordinary replacement cycle to upgrade to E85 is sizeable. There are about 155,000 stations in the United States, which means that about 22,140 stations are replacing their dispensers every year. Of course, not all the replacement occurs on January 1; it is spread over the year. Assuming that this replacement cycle occurs ratably over the year, i.e., at a constant rate, 1,845 stations replace their dispensers every month. If EPA sent a strong signal to the market through the RFS and even one third of these already-upgrading stations upgraded to offer E85 with one dispenser, then that would mean an additional 7,380 stations offering E85 at the end of 2017, or (assuming ratable installation over the year) the equivalent of an additional 3,690 stations operating for all of 2017. Given the throughput discussed above of 45,000 per dispenser per month those stations could deliver an additional approximately two billlion gallons of E85 over the course of 2017. It is reasonable to assume that the industry could hit the ground running on January 1, 2017, because the final 2017 RFS rule would give it a one-month lead time to prepare. Existing activity to expand E85 infrastructure. Expansion of E85 infrastructure is already underway. As noted above, EPA expects the BIP program to add 1,486 E85 stations. Through BIP and “Prime the Pump,” many large independent chains are working to significantly increase the number of E85 stations, including Sheetz, Kum & Go, Murphy USA, Protec Fuel, Thorntons, MAPCO, Minnoco, Cenex, and RaceTrac. And other chains that have worked to expand E85 capabilities significantly include Speedway, Kwik Trip, Spinx, Rebel Oil, Break Time (MFA), MFA Oil, Meijer Gas, Super Pantry, Bosselman's Pump & Pantry, Kroger, Petro Serve USA, and Road Ranger. 2.3 Transporting Additional E85 While the distribution system must move four gallons of E85 for every three gallons of gasoline, most of the E85 will move from local ethanol production facilities or ethanol tanking facilities to the stations by truck. E85 is primarily blended at ethanol plants in the Midwest and mostly trucked to E85 stations that are close to the ethanol production facilities. Trucking assets will require some redeployment (from product terminals to ethanol plants or ethanol storage facilities) but this should not be a constraint on the distribution system. Rebalancing these truck transportation requirements results in little change to the overall number of trucks. Because the ethanol distribution system is already handling substantial ethanol volumes through E10, significant increases in ethanol consumption are possible without much impact on the gasoline or ethanol distribution system. 9 Moriarty, K., Johnson, C., Sears, T. and Bergeron, P. E85 Dispenser Study. NREL. December 2009. http://www.afdc.energy.gov/pdfs/47172.pdf 10 Stillwater estimate. See Section 5.5.1 for details.

Infrastructure Changes and Cost to Increase RFS Ethanol Volumes through Increased E15 and E85 Sales in 2017
7
The station tankage for E85 should also not be a concern. Even for small stations, the station’s largest tank is sized to move about 85 percent of the volume (regular gasoline) through the two dispensers in a day. If this becomes tight, the station will simply move to twice a day deliveries of E85. E85 is primarily blended at ethanol plants in the Midwest and mostly trucked to E85 stations that are close to the ethanol production facilities. Because the ethanol distribution system is already handling substantial ethanol volumes through E10, significant increases in ethanol consumption are possible without much impact on the gasoline or ethanol distribution system.
3 Economics of E85 Infrastructure Changes 3.1 Single Station Single Dispenser Economics The best way to examine the economics of E85 is through the eyes of a single station adding an E85 dispenser. This analysis will be for a station that already has three or more gasoline tanks. By adding E85 none of the current grades are lost, so the current station economics continue with the added margins from the new E85 to offset the added required investments.
Since dispensers are replaced about every seven years, we assume a project with a seven-year life. We examined three scenarios, described above:
1. Adding an E85 dispenser to an existing E85 station on the replacement cycle, which has an initial investment of $5,000;
2. Adding an E85 dispenser to an existing E85 station off the replacement cycle, which has an initial investment of $15,000;
3. Adding an E85 dispenser to an E10-only station off the replacement cycle, which has an initial cost of $30,000.
Using our assumption that a dispenser will move 45,000 gallons per month, we further assume that the new E85 dispenser will move 540,000 million gallons per year and 3.78 million gallons over the seven-year investment period. We examine the economics with two rates of return: 10%, which is a reasonable target for independent stations; and 15%, which is a reasonable target for a large corporation. In Table 3.1, a simple breakeven analysis of Scenario 1 reveals that the station needs to make 0.13 cents per gallon additional margin to recover the initial investment, an additional margin of 0.33 cents per gallon to earn a 10% return, and 0.38 cents per gallon to earn a 15% return. Given that these required margins are far less than one cent per gallon, the station owner should have little hesitation making this investment in E85, assuming that he believes there will be reasonable demand to fully utilize his E85 dispenser. We explain in more detail below the reasons to believe that this throughput can be achieved in light of demand patterns and the stations’ optimal gross margin analysis.
Table 3.1 - Single Dispenser Economics for addition of second E85 Dispenser at Existing E85 station on replacement cycle
Table 3.2 - Single Dispenser Economics for addition of a second E85 Dispenser at Existing E85 station off replacement cycle
FULLY UTILIZED E85 DISPENSER
INVESTMENT LIFE THROUGHPUT RATE OF RETURN BREAKEVEN
YR GALLONS CENTS PER GALLON
5,000$ 7 3,780,000 0.13
5,000$ 7 3,780,000 10% 0.33
5,000$ 7 3,780,000 15% 0.38
Infrastructure Changes and Cost to Increase RFS Ethanol Volumes through Increased E15 and E85 Sales in 2017
8
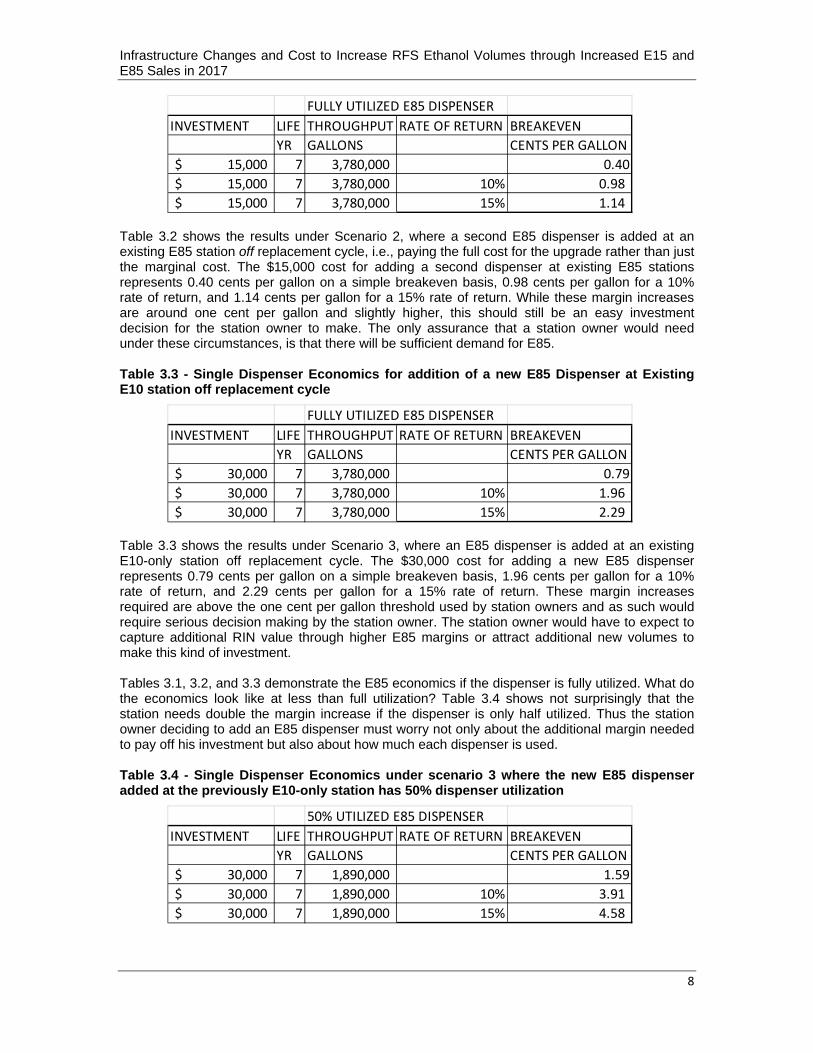
Table 3.2 shows the results under Scenario 2, where a second E85 dispenser is added at an existing E85 station off replacement cycle, i.e., paying the full cost for the upgrade rather than just the marginal cost. The $15,000 cost for adding a second dispenser at existing E85 stations represents 0.40 cents per gallon on a simple breakeven basis, 0.98 cents per gallon for a 10% rate of return, and 1.14 cents per gallon for a 15% rate of return. While these margin increases are around one cent per gallon and slightly higher, this should still be an easy investment decision for the station owner to make. The only assurance that a station owner would need under these circumstances, is that there will be sufficient demand for E85.
Table 3.3 - Single Dispenser Economics for addition of a new E85 Dispenser at Existing E10 station off replacement cycle
Table 3.3 shows the results under Scenario 3, where an E85 dispenser is added at an existing E10-only station off replacement cycle. The $30,000 cost for adding a new E85 dispenser represents 0.79 cents per gallon on a simple breakeven basis, 1.96 cents per gallon for a 10% rate of return, and 2.29 cents per gallon for a 15% rate of return. These margin increases required are above the one cent per gallon threshold used by station owners and as such would require serious decision making by the station owner. The station owner would have to expect to capture additional RIN value through higher E85 margins or attract additional new volumes to make this kind of investment.
Tables 3.1, 3.2, and 3.3 demonstrate the E85 economics if the dispenser is fully utilized. What do the economics look like at less than full utilization? Table 3.4 shows not surprisingly that the station needs double the margin increase if the dispenser is only half utilized. Thus the station owner deciding to add an E85 dispenser must worry not only about the additional margin needed to pay off his investment but also about how much each dispenser is used.
Table 3.4 - Single Dispenser Economics under scenario 3 where the new E85 dispenser added at the previously E10-only station has 50% dispenser utilization
FULLY UTILIZED E85 DISPENSER
INVESTMENT LIFE THROUGHPUT RATE OF RETURN BREAKEVEN
YR GALLONS CENTS PER GALLON
15,000$ 7 3,780,000 0.40
15,000$ 7 3,780,000 10% 0.98
15,000$ 7 3,780,000 15% 1.14
FULLY UTILIZED E85 DISPENSER
INVESTMENT LIFE THROUGHPUT RATE OF RETURN BREAKEVEN
YR GALLONS CENTS PER GALLON
30,000$ 7 3,780,000 0.79
30,000$ 7 3,780,000 10% 1.96
30,000$ 7 3,780,000 15% 2.29
50% UTILIZED E85 DISPENSER
INVESTMENT LIFE THROUGHPUT RATE OF RETURN BREAKEVEN
YR GALLONS CENTS PER GALLON
30,000$ 7 1,890,000 1.59
30,000$ 7 1,890,000 10% 3.91
30,000$ 7 1,890,000 15% 4.58

Infrastructure Changes and Cost to Increase RFS Ethanol Volumes through Increased E15 and E85 Sales in 2017
9
Table 3.5 below reveals some insights about existing E85 stations. Again using Scenario 3, this table shows that at low throughputs the margin required to pay off investments is in the $0.20 per gallon range. It could be said that station owners are not gouging the E85 customer or failing to pass on enough of the RIN value but are simply holding on to the high E85 margin because it is needed to pay off their investment due to the very low E85 throughput per station.
Table 3.5 Single Dispenser Economics for addition of a new E85 Dispenser at Existing E10 station (off replacement cycle) with 10% dispenser utilization
4 How to Increase Sales at Existing E85 Stations Past characterizations of E85 consumers have assumed they are a single group that follow standard economic rules. Here, we explore a logical segmentation of E85 customers to better explain observed demand patterns versus price, then extend this model by estimating gross margin in the supplier-retailer chain to explain observed retail pricing behavior. In the current pricing situation between gasoline, ethanol, and RIN prices, dealers and retailers are pricing E85 higher than energy parity with E10 because this price level generates the largest gross margin. A combination of higher RIN price and lower ethanol-relative-to-gasoline price can change this optimum price point to increase E85 sales volume dramatically from current levels. The RIN price required to increase sales volume in the short to mid-term by changing pricing behavior and over the long term by providing incentives to build E85 fueling infrastructure is calculated below. EPA can create the environment for this E85 growth by setting 2017+ obligations for ethanol high enough to sustain these necessary RIN values. 4.1 Customer Segmentation The different sloped lines obtained by Korotney in “Correlating E85 Consumption Volumes with E85 Price” are in part due to different geographies, but are also likely to be due to different types of potential customers who react differently to price. For example, demand in California appears to have no response at all to price. This is inconsistent with behavior of the typical price-seeking consumer. Also, all other states show a small but steady increase in demand for E85 when prices are higher than energy parity with E10. (See Appendix.) A purely price-seeking consumer who is aware of this would not purchase E85 until it was priced at or below energy parity. In fact, there are a number of reasons to believe that such a price-seeking consumer would only start to increase E85 consumption when the price is somewhat below parity due to the inconveniences of refueling more often and traveling farther to find E85, which is currently only sold at about 2% of retail sites. Variations in E85 energy content (since ethanol content varies from 51% to 81%) also complicates the decision, so the consumer may also require a bit more of a discount. To account for these issues, we have developed a working hypothesis based on our extensive experience with the retail gasoline market on how to segment E85 customers in a way to better account for the observed buying behavior. Our estimates of the customer breakdown can be summarized as in the following table:
10% UTILIZED E85 DISPENSER
INVESTMENT LIFE THROUGHPUT RATE OF RETURN BREAKEVEN
YR GALLONS CENTS PER GALLON
30,000$ 7 378,000 7.94
30,000$ 7 378,000 10% 19.56
30,000$ 7 378,000 15% 22.89

Infrastructure Changes and Cost to Increase RFS Ethanol Volumes through Increased E15 and E85 Sales in 2017
10
Table 4.1 – Estimates of Customer Breakdown
Segment Description % of FFV Owners
% of Current E85 Demand
Total US Vol. Demand Available, (mgy)
Vol. Per site per mo.
Price Point
Notes
Committed Either Brand or contractually obligated to consume.
0.5% 30%
50 1,400 Doesn’t matter
Includes federal, state and municipal fleets or businesses who have committed to E85.
Believers Believe it’s the right thing to do. Will consume if price approaches energy parity.
3% 60% 300 8,400 Sliding scale that increases from 5 to 25% discount from E10
Supporters of renewable fuel, some farmers or other corn proponents. Also could be car renters who fill up before returning FFVs.
Mass Consumers
Price takers will consume when economical, including price, convenience and risk.
93.5% 10% 93500 262,000 Sliding Scale from 25% to 50% discount from E10
Most consumers try to buy the best fuel for the money, but are influenced by other issues too.
Disbelievers Will not consume, regardless of price.
3% 0% 0 0 Begins only at steep discounts of 40% or more
No need to consider this group.
Some corroboration of this model is provided by EIA data which show that federal and state fleets consumed nearly 44 million gallons of E85 in 2014, which is about 27% of estimated total consumption11,12. It is important to realize that there are many ways to segment fuel customers along completely different dimensions. Also note that the distribution will vary by geography, and the number of consumers in each segment can only be roughly estimated. However, despite these limitations, this structure accounts for many observations of demand response to price, and enables additional investigation of phenomena at the dealer-customer interface.
11 EIA. Federal Fleet Fuel Consumption Data. http://federalfleets.energy.gov/performance_data#waivers 12 EIA. State Fleet and Fuel Data. http://www.eia.gov/renewable/afv/users.cfm?fs=a&ufueltype=e85

Infrastructure Changes and Cost to Increase RFS Ethanol Volumes through Increased E15 and E85 Sales in 2017
11
This model leads to a volume curve for a one-dispenser E85 site which has a customer base representing the U.S. as a whole to look something like this: Figure 4.1 – E85 Site Volume, One Dispenser
To test how reasonable these results are, consider how the left half of this curve looks like the regression analyses for each of the five states analyzed in Korotney’s analysis.13 California looks like the very far left part of the curve only because so much of the demand there is by consumers committed to its use. The other four states look very much like the part of the curve shown for the Believers with small positive slopes. The overall slope of this part of the curve is consistent with Korotney’s results. Consider the demand response we attribute to Mass Consumers on the right hand side of the curve. If E85 were discounted by 35% to E10, only 15% of the owners of FFVs (or 16% of those we are calling Mass Consumers) would be needed to create demand ten times larger than today’s typical demand of less than 5,000 gallons per month. Based on the work by Babcock and Pouliot in 2013 (with lower station counts and a small FFV fleet than exist today), more than 30% of FFVs are located within five miles of an E85 station, so attracting half of these local FFVs with E85 discounted to only 65% of E10 price seems very reasonable if not conservative. Drawing from our experience in the industry, we also believe that the right-hand side of the curve is reasonable, assuming that the discounts shown persisted in a sustained pricing environment (e.g., as would occur if EPA meaningfully changed how it implemented the RFS). In our experience, customers are very price-sensitive. For example, we have seen evidence of significant customer movement when different retailers engage in price wars over gasoline. Similarly here, once the inconvenience of E85 is compensated for below energy parity, we would expect retailers to market the price savings and for FFV owners to take advantage of them. Indeed, if E85 were discounted by 35% to E10, only 15% of the owners of FFVs (or 16% of those we are calling Mass Consumers) would be needed to create demand ten times larger than today’s typical demand of less than 5,000 gallons per month. As stated above, based on the work by Babcock and Pouliot, more than 30% of FFVs are located within five miles of an E85 station (and 55% of FFVs are located within ten miles).
13 "Memo to docket on Correlating E85 consumption volumes with E85 price," memorandum from David Korotney to EPA Air Docket EPA-HQ-OAR-2015-0111.

Infrastructure Changes and Cost to Increase RFS Ethanol Volumes through Increased E15 and E85 Sales in 2017
12
The graph below contrasts Brattle’s14 log-log curve with Stillwater’s assessment: Figure 4.2 Comparing Stillwater and Brattle Demand Curves
Note how similar the curves are in the range below the point of E85 energy parity which occurs at an E85 discount of about 22% to E10. These should agree at this point because there are ample observations of consumer behavior to correlate it with price. The area where the two demand curves diverge is where there is not enough data to discern price behavior. Accordingly, the Brattle demand curve is a reasonable extrapolation of the existing data that show the beginning of change near energy parity. However, Stillwater’s customer segmentation analysis predicts that there should be a distinct change in demand response to price as the price discount to E10 increases below energy parity because price seeking customers begin to see better value, and we believe these are the vast majority of FFV owners. There is another difference between these curves that is important to realize. To achieve strong demand at E85 discounts of 30% or more to E10 there are two key requirements. First, local FFV owners will need to know where to find the E85 site. Second, FFV owners will need to know that E85 will be consistently priced at levels that make it attractive relative to E10. We believe this level is 25-30% below E10, but in reality it is related to other factors including general price level, local competition for E85 sales, and local concentration of FFVs. Consumers will not drive around looking for the single local E85 site if it is often more expensive to use than E10. Next, we examine the incentives that fuel suppliers and retailers have for pricing E85 by looking into the gross margin available to them. We’ll first consider the situation with recent prices with the Stillwater demand curve and later generalize the predictions for a range of prices with the use of Brattle’s log-log price curve. 4.2 Gross Margins If dealers will not discount E85 by more than 25% relative to E10, how does this matter? To explore this issue, we have created a simple model of retail pricing to estimate gross margins in
14 Peeking Over the Blendwall An Analysis of the Proposed 2017 Renewable Volume Obligations The Brattle Group July 11,2016

Infrastructure Changes and Cost to Increase RFS Ethanol Volumes through Increased E15 and E85 Sales in 2017
13
the supply chain with the following assumptions (using 2016 average prices in Los Angeles through June as a proxy):
Ethanol Price = $1.62/gallon Gasoline (BOB) Price = $1.41/gallon Ethanol RIN Price = 74 cents Supplier E10 Margin to Retailer = 5 cents per gallon (cpg) Retailer E10 Margin = 10 cpg E85 volumes according to the above curve Gross margin calculated across fuel supplier and retailer Fuels tax = 40 cpg*15
Using these assumptions, we calculate E85 gross margins for two cases shown on the left priced at 14% and 35% discounts to E10. On the right we do the same calculations but with the RIN price increased from 74 to 124 cents. Figure 4.3 – E85 Gross Margin Estimates
15 (Fuels taxes vary dramatically by state, and in many states are lower for E85 than for E10.15 Here we assume a moderate volumetric tax of 40 cents on every gallon of fuel. This penalizes E85 relative to E10 since the 22% higher volume of E85 needs to be purchased results in 22% higher taxes per mile driven. If the fuels tax is implemented as a sales tax based on a percent of sales price and E85 is priced below energy parity to E10, then it actually favors E85 slightly.) The following link: http://www.ncsl.org/research/transportation/taxation‐of‐alternative‐fuels.aspx#one for the National Council of State Legislatures lists much of the data on state taxes.

Infrastructure Changes and Cost to Increase RFS Ethanol Volumes through Increased E15 and E85 Sales in 2017
14
The first case shows a gross margin (“GM”) of $1,000/month for pricing above energy parity at a 14% discount to E10 price. It also shows a negative margin at a much steeper discount of 35% relative to E10 because the dealer would have to price below cost in order to attract the price seeking consumers. Clearly, E85 cannot be economically priced below energy parity with these price assumptions. In the second case, all of the assumptions are identical except that RINs are priced much higher at 124 cents. In this case, the gross margin increases 170% with the deeper discount because the increased volume more than overcomes the decreased margin per gallon sold. Note that the optimum E85 sales price with higher RIN prices (and constant RBOB prices) is significantly lower. With only a change in RIN price, the dealer can profitably increase gross margin by selling more E85 at a much lower price. Also note that this increase in E85 sales can occur without increases in retail infrastructure. Last, note that this also results in more competitive E85 pricing without more E85 competition. This happens because E85 becomes price competitive with E10 so that consumers with FFVs will choose to fill with E85 because it less expensive for them. While the E85 dealer may lose some of his E10 business to E85, because only 2% of retail sites have E85 it is more likely that he will increase overall site volume and profitability by attracting FFVs that were being filled at competitors’ sites. It may be pointed out that this is the gross margin across the fuel supplier and retailer, so that the retailer may not be able to set his price at the joint optimum. However, both supplier and marketer have incentives to find this price point even if the margin is not shared equally. The additional benefit to the retailer from increased site traffic further increases the chances of finding a price point that results in increased sales volumes. We repeated calculations like those above to estimate GM as a function of price point and the impact of RIN prices in the 2016 price environment, as shown in the following figure: Figure 4.4 – Calculated Combined Supplier/Dealer E85 Gross Margin
The yellow line is the volume curve derived from the customer segmentation analysis. The blue line shows the GM curve that an E85 retailer would expect in the assumed pricing environment. The 2016 environment, with ethanol priced above gasoline, is difficult for E85 marketing. Margins

Infrastructure Changes and Cost to Increase RFS Ethanol Volumes through Increased E15 and E85 Sales in 2017
15
tend to be low and with RINs priced at 74 cents, the E85 price point that optimizes gross margin is very close to the 14% below E10 observed recently. This indicates that E85 marketers are pricing to maximize gross margin as we would expect, and gives another validation for the structure of this model. This figure also shows that GM increases with RIN price and that optimum GM increases even more with higher RIN prices when the sales price is discounted more heavily. Increasing the RIN price from 74 to 100 cents results in a doubling of GM with five times the sales volume. Increasing the RIN price further to 126 cents results in nine times both the gross margin and sales volume with reduced E85 sales prices. The trend is shown in the graph below: Figure 4.5 – Optimum E85 Price Point vs. RINs Price
This analysis demonstrates that high RIN prices increase E85 gross margins, providing incentives to build E85 infrastructure. They also (interestingly) provide incentives to price more competitively and sell substantially more volume in the short term. So E85 sales volumes can increase substantially in both the short term and the long term if RIN prices can be maintained at a specific level that is a function of the RIN price, and the relative price of ethanol to RBOB, and fuels tax rate. The RIN price needed to provide the right incentives for increased E85 sales varies with gasoline and ethanol prices as shown in the next section. One last note on value pricing is that it has at times been very successful in the fuels market. ARCO was very successful for decades at pricing below other majors. At one point in time, a 5 cpg discount in street price was enough to enable an average volume per site that was double the industry as a whole. This enabled dealers to amortize fixed costs over twice the volume of competitors and resulted in increased site traffic that improved the profitability of AM/PM brand convenience stores located on ARCO sites. Today, an example of a successful value priced retail site is Costco, which has an average volume many times that of an average gasoline station. Value has been, and continues to be (along with quality, convenience, and others), one of the dimensions of differentiation in the retail fuel space. While these examples do not indicate what the price response to E85 will be, they do demonstrate that there are many consumers who are price conscious.

Infrastructure Changes and Cost to Increase RFS Ethanol Volumes through Increased E15 and E85 Sales in 2017
16
4.3 What RIN Price is Needed for Short Term Volume Growth All of the calculations so far have been with a narrow range of fuel taxes, gasoline, ethanol, and RIN prices. In this section a wide range of these parameters will be used to show specifically what RIN price is needed so that the optimum retail price point is discounted by 30% relative to E10. With the Stillwater demand curve, this results in a site sales-volume increase of five times current average site volume when priced at a 14% discount to E10. Below are two graphs that show ethanol RIN price levels required using this simple model (the S curve from Figure 4.5) to increase E85 sales volumes by a factor of five from 4,800 gallons per month to 24,000 gallons per month. Figure 4.6 – RINS Price that Causes E85 to be Priced at 30% Discount to E10 (Ethanol Price)
Figure 4.7 – RINS Price that Causes E85 to be Priced at 30% Discount to E10 (RBOB Price)

Infrastructure Changes and Cost to Increase RFS Ethanol Volumes through Increased E15 and E85 Sales in 2017
17
The graph below shows the impact of Fuels Tax level on RIN price required to increase E85 sales by a factor of five:
Figure 4.8 – RINs Price Required to Increase E85 Sales by a Factor of 5
From these analyses, we can make the following generalizations for what is needed to provide incentives to increase E85 sales by five times at existing infrastructure from current levels while holding the other parameters constant:

Infrastructure Changes and Cost to Increase RFS Ethanol Volumes through Increased E15 and E85 Sales in 2017
18
A 50 CPG increase in gasoline price reduces RIN price needed by 25 cents. A 50 CPG increase in ethanol price increases RIN price needed by 50 cents. A 50 CPG increase in fuels tax increases RINS price needed by 25 cents.
The last key point here is that the RIN values needed to effect this type of behavior are in the range of $1.00 to $1.50. If gasoline prices return to their historical higher levels than ethanol, the price range is even lower.
These results are dependent on the demand curve used in the analysis. The next section briefly shows the impact of using a curve with lower demand response to price discounts
4.4 Impact of Different Demand Curves on Optimum Gross Margin We repeated the analysis described in Section 4.2 using the Brattle log-log demand curve and summarize some of the key results in these two tables:
Figure 4.9 – Comparison of Stillwater and Brattle Log-Log Curves
(Note that the 108% pass-through when RIN prices are $1.00 reflects the fact that it became optimal for the dealer to discount E85 so much that it partially cut into the standard assumed retail margin.) The first table shows results that were previously described. Notice how increasing RIN prices above 125 cents does not change the optimum site volume and cause RIN pass-through to decline. This is because the Stillwater price curve assumes that the station is approaching capacity so that the additional volume obtained by further discounting is not sufficient to offset the lower sales price. In other words, due to capacity constraints the demand curve is too shallow to provide sufficient incentive to lower price.
The second table using the Brattle demand curve shows RIN pass-through to decline with increased RIN price because of the same lack of demand response that would be observed when approaching site capacity. It is not until RINs are priced above 130 cents that GM increases enough to cause discounting, resulting is a large increase in RINs pass-through. The volume continues to increase with higher RIN prices because the demand curve gets continuously steeper, even if they continue to be much smaller than when using the Stillwater demand curve.
The lessons from this section are: gross margin optimization can effect higher E85 volumes for a range of demand responses; and the range of RIN prices needed to cause higher volumes is not much higher than those seen in the past.
RIN
price,
cents
Optimal
Discount
to E10, %
Volume
per site,
gal/mo
Passthrough,
%
75 15% 4,800 89%
100 30% 24,000 108%
125 35% 42,000 98%
135 35% 42,000 92%
155 35% 42,000 81%
175 35% 42,000 73%
Stillwater Curve Log‐Log Curve
RIN
price,
cents
Optimal
Discount
to E10, %
Volume
per site,
gal/mo
Passthrough,
%
75 5% 2,900 55%
125 5% 2,900 38%
135 25% 5,800 73%
145 30% 7,300 77%
155 35% 9,300 81%
175 45% 16,300 87%
Brattle Log‐Log Curve

Infrastructure Changes and Cost to Increase RFS Ethanol Volumes through Increased E15 and E85 Sales in 2017
19
5 E15 Analysis In the E15 portion of this analysis, Stillwater describes the paths to expanding E15 infrastructure and assesses the cost of doing so. Next Stillwater analyzes the investment costs in terms of rates of return and the need for increased margins from the point of adding a single new dispenser. Finally, Stillwater discusses the present need to expand E15 much like E85 given that E15 is not currently available at the product terminal. 5.1 Expanding Infrastructure to Deliver E15 in 2017 Like E85, infrastructure for E15 could also be expanded in 2017 to support much higher volumes. We here examine the cost of adding E15 pumps, much as we did with E85 above. Key issues are, again, having compatible pumps, having compatible tanks, and taking advantage of the regular 7-year replacement cycle. Although the conversion process for E15 might be more complicated than for E85, station consultants are now appearing who will help stations get the required documentation and certifications for E15. The costs for these consultants is typically less than the cost for replacing the hardware and equipment, so Stillwater replacement cost estimates below would still be conservative relative to the cost of converting with the help of a station consultant. 5.2 The Time since the Last Dispenser Replacement is Important Before 2010, E10 was limited to mainly the Midwest and most stations did not have to worry about ethanol compatibility. Even back then nearly all of the tanks were compatible with ethanol. However, many of the pipefittings and other systems were not ethanol compatible. Since that time E10 has become ubiquitous throughout the nation and most stations have become E10 compatible. For the most part E10 compatible equipment is also E15 compatible but many of the manufacturers have not taken all the steps to have their equipment completely certified or approved for E15, since it is not a commonly used fuel. Upgrade kits from the two dispenser manufacturers provide U/L certification for the dispenser and all the parts that are above the ground. Moreover, both dispenser manufacturers have stated that their dispensers are E15-compatible: Wayne has stated that all of their dispensers in the field are warranted for E15%; and Gilbarco has stated that all their dispensers since 2008 are compatible with E15%. For the past two years, these manufacturers are now saying that they have determined that their E10 equipment is also E15 compatible or that some small gaskets, seals, hoses, etc. are all that have to be changed to become E15 compatible. There are still exceptions but they are diminishing and most of them can be fixed with upgrade kits (just like the dispensers) instead of having to replace the entire system. Key items that should be replaced with U/L E15 certified items or certified upgrade kits are the submersible turbine pump, the ball valve and the shear valve. Stillwater has found that about every seven years, stations replace dispensers and upgrade any of the other supporting tank and piping systems if required. This means that stations that went through this upgrading within the last six years have already completed a majority of the steps to be E15 compatible. The dispensers in these stations will need to be upgraded to be E15 compatible and some of the tank support systems and the piping systems will need to be upgraded or replaced. Stations that have not replaced their dispensers in the past six years are at risk of having older tank support systems and older piping systems and will have higher costs to upgrade or replace this hardware. Stations that have not replaced their dispensers in seven years should be replacing their dispensers in 2017 and, since E15 dispensers cost no more than E10 dispensers, these stations should have no additional dispenser costs. For these stations, the tank support systems and older piping systems will have the same costs as stations that have not replaced their dispensers in six years.

Infrastructure Changes and Cost to Increase RFS Ethanol Volumes through Increased E15 and E85 Sales in 2017
20
5.3 Station Costs to Upgrade to E15 Stations with two gasoline tanks that have been upgraded in the past six years or less and that are only converting from E10 to E15 would have to upgrade their two dispensers and would incur $1,000 in cost to modify any of the various tank systems. The total cost for these stations would be $5,000. Stations with two gasoline tanks that were upgraded seven years ago would have to make more modifications to the various tank systems and upgrade two dispensers for an additional $7,000. Total cost $11,000. Note that some of these stations may have already changed their tank systems and would only have a cost of $1,000. Table 5.1 shows the cost itemization for stations with two gasoline tanks.

Infrastructure Changes and Cost to Increase RFS Ethanol Volumes through Increased E15 and E85 Sales in 2017
21
Table 5.1 - Station Costs to Upgrade to E15 – Two Gasoline Tank Station
Stations with three or more gasoline tanks that have been upgraded in the past six years or less and that are only converting from E10 to E15 would have a $8,000 cost to upgrade their four dispensers and a $1,500 cost to modify the various tank systems. Total cost would be $9,500. Stations with three or more gasoline tanks that were upgraded six years ago would have to make more modifications to the various tank systems for an additional $8,000 plus the $8,000 cost to upgrade all four dispensers. Total cost $16,000. Note that some of these stations may have already changed their tank systems and would only have a cost of $1,500. Stations that were upgraded seven years ago would be replacing the dispenser and upgrading again in 2017 anyway. Since a new E15 dispenser has the same cost as an E10 dispenser, these stations have no dispenser costs to upgrade to E15. Their only costs are for piping and tank system changes, which is estimated at $8,000. Table 5.2 shows the costs for stations with three or more gasoline tanks. Table 5.2 - Station Costs to Upgrade to E15 – Three Gasoline Tank Station
Two Gasoline tank station
E15 Upgrade Costs6 years or less since last upgrade
2 E15 Upgrade kits+install 4,000$
Piping & Tank system Changes 1,000$
Total 5,000$
More than 6 years since last upgrade
2 E15 Upgrade kits+install 4,000$
Piping & Tank system Changes 7,000$
Total 11,000$
Would have upgraded in 2017
Piping & Tank system Changes 7,000$
Total 7,000$
Three or more Gasoline tank station
E15 Upgrade Costs6 years or less since last upgrade
4 E15 Upgrade kits+install 8,000$
Piping & Tank system Changes 1,500$
Total 9,500$
More than 6 years since last upgrade
4 E15 Upgrade kits+install 8,000$
Piping & Tank system Changes 8,000$
Total 16,000$
Would have upgraded in 2017
Piping & Tank system Changes 8,000$
Total 8,000$
Infrastructure Changes and Cost to Increase RFS Ethanol Volumes through Increased E15 and E85 Sales in 2017
22
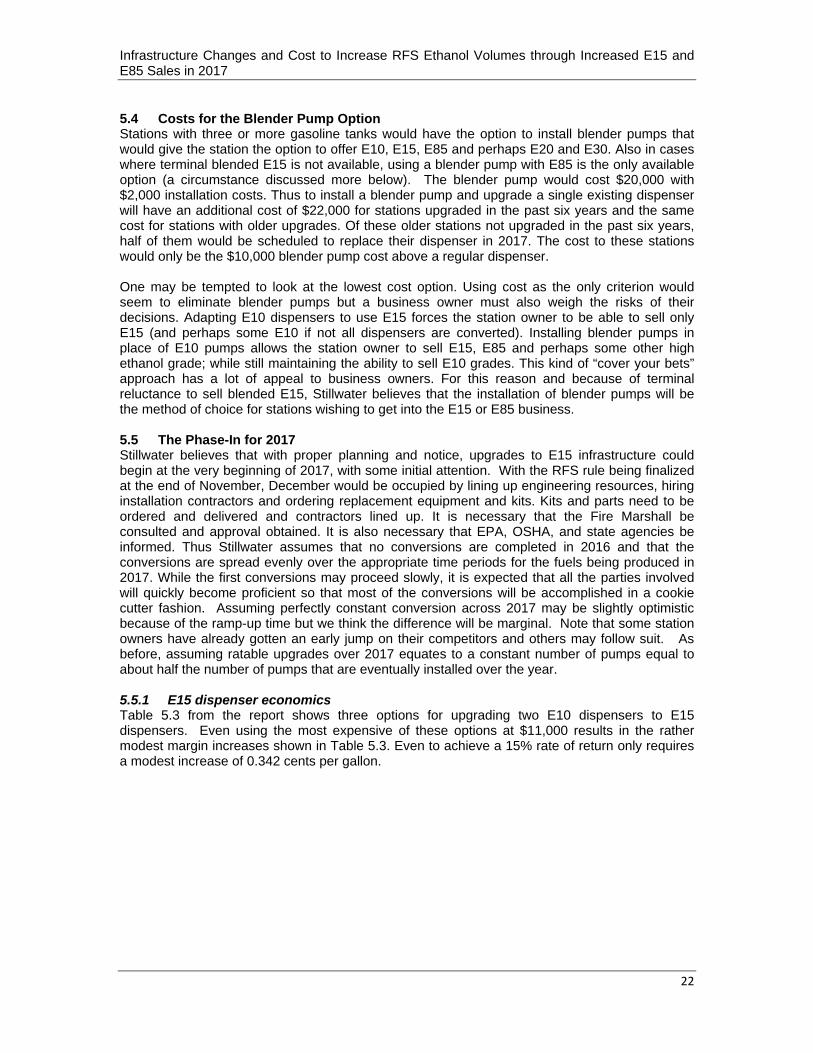
5.4 Costs for the Blender Pump Option Stations with three or more gasoline tanks would have the option to install blender pumps that would give the station the option to offer E10, E15, E85 and perhaps E20 and E30. Also in cases where terminal blended E15 is not available, using a blender pump with E85 is the only available option (a circumstance discussed more below). The blender pump would cost $20,000 with $2,000 installation costs. Thus to install a blender pump and upgrade a single existing dispenser will have an additional cost of $22,000 for stations upgraded in the past six years and the same cost for stations with older upgrades. Of these older stations not upgraded in the past six years, half of them would be scheduled to replace their dispenser in 2017. The cost to these stations would only be the $10,000 blender pump cost above a regular dispenser. One may be tempted to look at the lowest cost option. Using cost as the only criterion would seem to eliminate blender pumps but a business owner must also weigh the risks of their decisions. Adapting E10 dispensers to use E15 forces the station owner to be able to sell only E15 (and perhaps some E10 if not all dispensers are converted). Installing blender pumps in place of E10 pumps allows the station owner to sell E15, E85 and perhaps some other high ethanol grade; while still maintaining the ability to sell E10 grades. This kind of “cover your bets” approach has a lot of appeal to business owners. For this reason and because of terminal reluctance to sell blended E15, Stillwater believes that the installation of blender pumps will be the method of choice for stations wishing to get into the E15 or E85 business. 5.5 The Phase-In for 2017 Stillwater believes that with proper planning and notice, upgrades to E15 infrastructure could begin at the very beginning of 2017, with some initial attention. With the RFS rule being finalized at the end of November, December would be occupied by lining up engineering resources, hiring installation contractors and ordering replacement equipment and kits. Kits and parts need to be ordered and delivered and contractors lined up. It is necessary that the Fire Marshall be consulted and approval obtained. It is also necessary that EPA, OSHA, and state agencies be informed. Thus Stillwater assumes that no conversions are completed in 2016 and that the conversions are spread evenly over the appropriate time periods for the fuels being produced in 2017. While the first conversions may proceed slowly, it is expected that all the parties involved will quickly become proficient so that most of the conversions will be accomplished in a cookie cutter fashion. Assuming perfectly constant conversion across 2017 may be slightly optimistic because of the ramp-up time but we think the difference will be marginal. Note that some station owners have already gotten an early jump on their competitors and others may follow suit. As before, assuming ratable upgrades over 2017 equates to a constant number of pumps equal to about half the number of pumps that are eventually installed over the year. 5.5.1 E15 dispenser economics Table 5.3 from the report shows three options for upgrading two E10 dispensers to E15 dispensers. Even using the most expensive of these options at $11,000 results in the rather modest margin increases shown in Table 5.3. Even to achieve a 15% rate of return only requires a modest increase of 0.342 cents per gallon.

Infrastructure Changes and Cost to Increase RFS Ethanol Volumes through Increased E15 and E85 Sales in 2017
23
Table 5.3 - Station Costs to Upgrade to E15 – Two Gasoline Tank Station
Table 5.4 – Rate of Return on Investment
Table 5.5 - Station Costs to Upgrade to E15 – Three or More Gasoline Tank Station
Table 5.5 shows three options for upgrading four E10 dispensers to E15 dispensers. Even using the most expensive of these options at $16,000 results in the rather modest margin increases
Two Gasoline tank station
E15 Upgrade Costs6 years or less since last upgrade
2 E15 Upgrade kits+install 4,000$
Piping & Tank system Changes 1,000$
Total 5,000$
More than 6 years since last upgrade
2 E15 Upgrade kits+install 4,000$
Piping & Tank system Changes 7,000$
Total 11,000$
Would have upgraded in 2017
Piping & Tank system Changes 7,000$
Total 7,000$
INVESTMENT LIFE THROUGHPUT RATE OF RETURN BREAKEVEN
YR GALLONS CENTS PER GALLON
11,000$ 7 7,560,000 0.15
11,000$ 7 7,560,000 10% 0.36
11,000$ 7 7,560,000 15% 0.42
Three or more Gasoline tank station
E15 Upgrade Costs6 years or less since last upgrade
4 E15 Upgrade kits+install 8,000$
Piping & Tank system Changes 1,500$
Total 9,500$
More than 6 years since last upgrade
4 E15 Upgrade kits+install 8,000$
Piping & Tank system Changes 8,000$
Total 16,000$
Would have upgraded in 2017
Piping & Tank system Changes 8,000$
Total 8,000$

Infrastructure Changes and Cost to Increase RFS Ethanol Volumes through Increased E15 and E85 Sales in 2017
24
shown in Table 5.6. Even to achieve a 15% rate of return only requires a modest increase of 0.31 cents per gallon. Table 5.6 – Rate of Return on Investment
5.6 The Upgrade Cost Until E15 is Available at the Terminal The above discussion assumes that E15 is available at the product terminal. For now, that may not be the case. Terminals blend BOB’s (RBOB, CBOB or any other BOB) according to the certification instructions received with the batch as part of the Bill of Lading. When a terminal receives a batch of BOB that is certified for E10 blending, it is illegal for the terminal to blend 15% ethanol with the BOB without recertifying the final blend as meeting all the relevant federal, state and local fuel specifications. Terminals simply don’t have the laboratory equipment to do this kind of recertification. As a result, until refineries begin testing and certifying batches of BOB for meeting all gasoline specifications with 15% ethanol, terminals will remain extremely resistant to blending 15% ethanol. The exception to this may be RFG. EPA deems all pertinent EPA RFG requirements to be met when 15% ethanol is blended into an RBOB certified for 10% ethanol. However, without lab testing at the terminal or refinery certification for 155, the terminal has no mechanism to assure that all relevant gasoline specifications are being met. The proposed ASTM ballot dealing with E15 specifications may make this less of a problem for the terminals, if and when it gets final approval. Instead, most E15 today is blended from E85 at the station level and thus expansion of E15 is largely captured by the simpler process described above for E85. The only difference is that a blender pump rather than an E85 pump would need to be installed. The typical blender pump costs $5,000 more than an E85 pump, and therefore all the cost scenarios described above for E85 expansion would be increased by $10,000 for two tank stations and $20,000 for three tank stations to support the installation of E15 infrastructure. 2.4 E15 Misfueling In connection with on the 2014, 2015, 2016 final RFS rulemaking, EPA raised concerns that E15 station owners might be concerned about their potential liability for E15 misfueling. This is particularly ironic since EPA previously issued E15 rules defining specific steps for the station owner to take to mitigate misfueling concerns. In the intervening four years, the vehicle fleet has aged and now only 9% of the fleet is older than model year 2001 and more and more non-road engines are E15 compatible. In addition, over the past four years there have been many efforts by various sides of the E15 process to educate all types and ages of engine owners on the advantages of E15. If EPA’s E15 misfueling mitigation procedures provided adequate protection in 2012, they should provide considerably more protection now that there are many fewer engines that are incompatible with E15 and there is a more knowledgeable public. Also, with each additional year that passes the number of engines that are of concern is significantly reduced.
INVESTMENT LIFE THROUGHPUT RATE OF RETURN BREAKEVEN
YR GALLONS CENTS PER GALLON
16,000$ 7 15,120,000 0.11
16,000$ 7 15,120,000 10% 0.26
16,000$ 7 15,120,000 15% 0.31
Infrastructure Changes and Cost to Increase RFS Ethanol Volumes through Increased E15 and E85 Sales in 2017
25
Appendix A
1 Ethanol and Gasoline Overview Ethanol-gasoline blends are governed by a myriad of federal regulations, state regulations, local regulations, product quality restrictions, ethanol distribution systems, product transportation systems, product storage systems, product delivery systems, retail delivery equipment, the physical properties of ethanol, and materials compatibility with ethanol. All of these factors will be addressed in this paper. The supply of ethanol and vehicle compatibility of ethanol-gasoline blends are factors that will not be covered in this paper. Across the nation, the gasoline that is sold to consumers varies with the regulations and climate governing the area of sale. These regulations may be environmental, commercial or product quality based. Generally, gasolines fall into two major classifications, reformulated and conventional. Reformulated gasolines have rather strict compositional restrictions set by regulations while conventional grades do not have such restrictions although product quality standards apply. In addition to these major classifications, gasoline has volatility classes that limit potential vapor lock tendencies and/or regulatory restrictions to limit the vapor emissions. The American Society for Testing and Materials (ASTM) standards govern general gasoline volatility and assign geographical areas a volatility class based on season and location. ASTM volatility standards are not adopted by all states. Regarding ethanol, there are four types of gasolines sold in the U.S.:
Neat gasoline –Gasoline not containing ethanol. Neat gasoline sales volumes are small and limited to consumers that do not desire an ethanol blended gasoline. Alaska falls outside the RFS so gasoline in that state is neat.
E10 – The predominant gasoline sold in the U.S. E10 contains approximately 10 volume percent of ethanol. It is produced by blending 10 percent ethanol with conventional gasoline where the Reid Vapor Pressure (RVP) waiver is effective, blending with a Blendstock for Oxygenate Blending (BOB) which is an unfinished gasoline that when blended with 10 percent ethanol will meet the applicable gasoline specifications, or blending with sub-octane gasoline which is a low octane unfinished gasoline that when blended with 10 percent ethanol will meet the required octane specifications.
E15 – A gasoline containing 15 volume percent of ethanol. Starting in 2017 vehicles sold in the U.S. will as a practical matter be required to be compatible with this fuel, in light of EPA’s new Tier 3 vehicle rule.
E85 – A fuel that is 51 to 83 volume percent ethanol. The balance of the fuel is hydrocarbon. This fuel can be used in Flexible Fuel Vehicles (FFVs). Sales of E85 have been limited by availability and price. Because ethanol contains two-thirds of the energy of hydrocarbon gasoline, the price of E15 and E85 must be lower than E10 gasoline for the consumer to achieve the equivalent cost per mile.
This paper will describe and examine the various factors governing the use of ethanol in gasoline, and describe the potential and the changes required to increase use of E15 and E85 by the vehicle fleet. 1.2 Overview of Gasoline Distribution System – from the Refinery to the Terminal The gasoline distribution system, for the purpose of this study, begins at the refinery. The refinery produces finished gasoline or a BOB, depending on the destination requirements for the product. BOB is blended downstream to make E10.
Infrastructure Changes and Cost to Increase RFS Ethanol Volumes through Increased E15 and E85 Sales in 2017
26
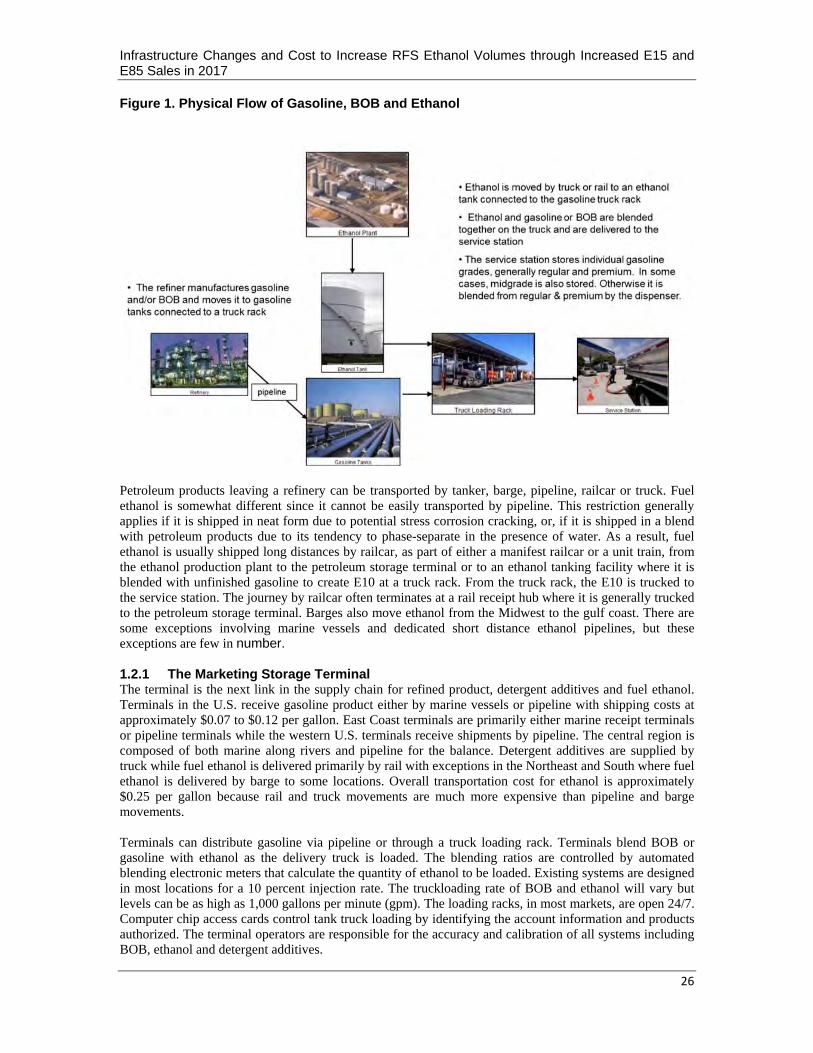
Figure 1. Physical Flow of Gasoline, BOB and Ethanol
Petroleum products leaving a refinery can be transported by tanker, barge, pipeline, railcar or truck. Fuel ethanol is somewhat different since it cannot be easily transported by pipeline. This restriction generally applies if it is shipped in neat form due to potential stress corrosion cracking, or, if it is shipped in a blend with petroleum products due to its tendency to phase-separate in the presence of water. As a result, fuel ethanol is usually shipped long distances by railcar, as part of either a manifest railcar or a unit train, from the ethanol production plant to the petroleum storage terminal or to an ethanol tanking facility where it is blended with unfinished gasoline to create E10 at a truck rack. From the truck rack, the E10 is trucked to the service station. The journey by railcar often terminates at a rail receipt hub where it is generally trucked to the petroleum storage terminal. Barges also move ethanol from the Midwest to the gulf coast. There are some exceptions involving marine vessels and dedicated short distance ethanol pipelines, but these exceptions are few in number. 1.2.1 The Marketing Storage Terminal The terminal is the next link in the supply chain for refined product, detergent additives and fuel ethanol. Terminals in the U.S. receive gasoline product either by marine vessels or pipeline with shipping costs at approximately $0.07 to $0.12 per gallon. East Coast terminals are primarily either marine receipt terminals or pipeline terminals while the western U.S. terminals receive shipments by pipeline. The central region is composed of both marine along rivers and pipeline for the balance. Detergent additives are supplied by truck while fuel ethanol is delivered primarily by rail with exceptions in the Northeast and South where fuel ethanol is delivered by barge to some locations. Overall transportation cost for ethanol is approximately $0.25 per gallon because rail and truck movements are much more expensive than pipeline and barge movements. Terminals can distribute gasoline via pipeline or through a truck loading rack. Terminals blend BOB or gasoline with ethanol as the delivery truck is loaded. The blending ratios are controlled by automated blending electronic meters that calculate the quantity of ethanol to be loaded. Existing systems are designed in most locations for a 10 percent injection rate. The truckloading rate of BOB and ethanol will vary but levels can be as high as 1,000 gallons per minute (gpm). The loading racks, in most markets, are open 24/7. Computer chip access cards control tank truck loading by identifying the account information and products authorized. The terminal operators are responsible for the accuracy and calibration of all systems including BOB, ethanol and detergent additives.
Infrastructure Changes and Cost to Increase RFS Ethanol Volumes through Increased E15 and E85 Sales in 2017
27
Terminals generally have multiple storage tanks and configure each tank service based on estimated market volumes and pipeline or marine delivery rates into the terminals. Loading rack plumbing and metering is designed for current volume and ratios. Once the product is loaded on the truck, the truck operator assumes responsibility for custody, quality and safety of the product. It is the duty of the truck operator to ensure that a tank truck is properly loaded with correct ratios of ethanol and detergent additives. Product custody is transferred to the retail or commercial site once the delivery to the designated storage tank is completed. The U.S. Department of Transportation (DOT) and EPA require bills of lading (BOL) to follow product to the final destination. Tank truck maximum volumes vary by state because some states like New York and Michigan grant overweight permits that allow trucks to deliver as much as 14,000 gallons, while other states like Massachusetts and Rhode Island grant waivers for lesser volumes. The Federal Highway Administration (FHWA) permits an 80,000 lbs. gross vehicle weight that equates to approximately 9,100 gallons depending on the design of the truck. 1.2.2 Retail Service Station The service station retail site is the last link in the distribution system. There are approximately 153,000 service stations in the U.S.16 Service stations vary in size but most will have at least two dispensers per island, specifically two cabinets with fueling nozzles on each side. Current data on underground storage tanks (USTs) is fragmented and inaccessible as a practical matter. It is captured by the states under multiple processes, using an assortment of data storage formats and reporting systems. In 1985 EPA did conduct a nationwide survey, The National Underground Storage Tank Survey, which specifically reported on tanks at service stations.17 Although it is dated, because summary statistics from that report closely align with comparable summary measures from 2011 and 2012 U.S. and State Energy Act Reports, it was felt that the service station tank distributions reported in the older report would still have validity. The mean number of underground tanks at service stations was 3.5 to 3.6. EPA reported confidence intervals around those means that permitted a distribution to be estimated and portrayed as an integer distribution as shown in Figure 2.
16 API. Oil and Natural Gas Overview – Service Station FAQs. February 28, 2014. http://www.api.org/oil-and-natural-gas-overview/consumer-information/service-station-faqs 17 EPA. Underground Motor Fuel Storage Tanks: A National Survey. May 1986. http://www.epa.gov/oust/pubs/USTsurvey.htm

Infrastructure Changes and Cost to Increase RFS Ethanol Volumes through Increased E15 and E85 Sales in 2017
28
Figure 2. Distribution of Service Station Underground Storage Tanks
With respect to the incidence of three and four storage tanks per facility, the calculated distribution is roughly consistent with the results from a sample 203 stations separately surveyed by Stillwater in 2012. Approximately 34 percent of existing service stations have three USTs and 34 percent have four USTs. At about half of U.S. stations diesel is stored in one tank. Locations with two gasoline tanks generally have one tank in the higher octane gasoline while the other tank contains lower octane gasoline which can be blended. Sites with three gasoline tanks usually have the higher volume selling grade assigned to two of the tanks or it has a tank in each Regular, Mid-Grade and Premium. Some stations may have diesel in the fourth tank. There are around 3,100 stations that offer E85. A number of states in the Midwest have a small number of stations that have more ethanol grades available. The USTs at these E85 stations are typically double walled fiberglass, and come with an Underwriters Laboratories, Inc. (UL) rating and are monitored by State and Federal environmental protection agencies. The tanks contain submersible pumps that draw down as low as two inches from the bottom. Service station tanks range in size from 8,000 gallons to 12,000 gallons. In many cases, tanks are piped together. Tanks also have tank support systems, which provide leak detection, outage prevention and water level monitoring. Product is drawn from the tanks when the consumer activates the dispenser by selecting the desired grade. The dispenser, the cabinet that is mounted on the individual island, also contains blender equipment that signals to the pumps the volume necessary for the grade to be blended. The blender equipment, pumps, and associated equipment all have to meet UL standards to operate at posted blend levels (i.e. E10, E15, E85). This equipment is inspected and approved by local Weights and Measures agencies. Figure 3 shows a typical dispenser, underground storage tank and piping systems.
Discrete # Tanks 2 3 4 5
16% 34% 34% 16%
<2.5 >4.5
16% 34% 34% 16%
<2.5 >4.5
0 1 2 3 4 5 6 7

Infrastructure Changes and Cost to Increase RFS Ethanol Volumes through Increased E15 and E85 Sales in 2017
29
Figure 3. Typical Fuel Dispenser and Underground Storage Piping18
State and Local Government Regulations for Dispensing Equipment and USTs State and local governments also play a role in regulating the safety of dispensing equipment and in implementing EPA’s requirements for USTs. For example: The Occupational Safety and Health Act (OSHA) allows states to develop and operate their
own job safety and health programs. OSHA approves and monitors state programs and plans, which must adopt and enforce standards that are at least as effective as comparable federal standards. According to OSHA officials, there are currently 21 states with approved plans covering the private sector that enforce health and safety standards over the dispensing of gasoline within their respective states. Four additional states operate approved state plans that are limited in coverage to the public sector.
Various state and local fire-safety codes—which aim to protect against fires—also govern the dispensing of fuel at retail fueling outlets. While state fire marshals or state legislatures are usually responsible for developing the fire code for their respective states, some states allow local Municipalities to develop their own fire codes. Fire codes normally reference or incorporate standards developed by recognized standards development organizations, such as the National Fire Protection Association and the International Code Council.19 State, county, and local fire marshals are responsible for enforcing the applicable fire code within their respective jurisdictions. Local officials, such as fire marshals, typically inspect dispensing equipment for compliance with both state and local fire codes.
States are largely responsible for implementing EPA’s requirements under the UST program. EPA has approved 36 states, plus the District of Columbia and Puerto Rico, to operate programs in lieu of the federal program. The remaining states have agreements with EPA to be the primary implementing agency for their programs. Typically, states rely on Underwriters Laboratories (UL) certification as the primary method for determining the compatibility of UST systems with EPA requirements. Some states also allow compatibility to be demonstrated in
18 DOE Energy Efficiency & Renewable Energy. Handbook for Handling, Storing, and Dispensing E85 and Other Ethanol-Gasoline Blends. September 2013. http://www.afdc.energy.gov/uploads/publication/ethanol_handbook.pdf 19 The mission of the international nonprofit National Fire Protection Association is to reduce the worldwide burden of fire and other hazards on the quality of life by providing and advocating consensus codes and standards, research, training, and education. The International Code Council is a membership association dedicated to building safety and fire prevention. The council develops the codes and standards used to construct residential and commercial buildings, including homes and schools.

Infrastructure Changes and Cost to Increase RFS Ethanol Volumes through Increased E15 and E85 Sales in 2017
30
other ways, including through the manufacturer’s approval or a professional engineering certification20.
On July 15, 2015 EPA issued a final rule revising underground storage regulations. These changes establish Federal requirements that are similar to key portions of the Energy Policy Act of 2005 (EPAct); they also update the 1988 UST and state program approval (SPA) regulations. Changes to the regulations include:
Adding secondary containment requirements for new and replaced tanks and piping; Adding operator training requirements; Adding periodic operation and maintenance requirements for UST systems; Addressing UST systems deferred in the 1988 UST regulation; Adding new release prevention and detection technologies; Updating codes of practice; making editorial corrections and technical amendments; and Updating state program approval requirements to incorporate these new changes.
1.2.3 Converting stations to E15 and E85 Fueling Equipment - E85 stations require at least one storage tank and one dispenser devoted to selling the E85 fuel. Both have minimum requirements to handle E85.21 Tanks - The vast majority of USTs being used for petroleum-based fuels can also be used for E85 after proper conversion and documentation verification. Analysis has shown that converting a midgrade tank is the most cost effective; however, many types of tanks have been converted including premium, diesel, kerosene, and redundant regular gasoline tanks. Dispensers - Gasoline dispensers need to be converted or replaced to serve E85. The local authority having jurisdiction (AHJ), typically a fire marshal, must approve the dispenser system. The AHJ dictates what components need to be replaced for proper conversion or whether a new dispenser is needed. The AHJs typically require UL-certified components, but the lack of listed equipment has resulted in AHJs approving E85 dispensers through other methods. However, OSHA regulations require that retailers use equipment listed by a “nationally recognized testing laboratory” (i.e., UL) and retailers are required to comply with all applicable laws and regulations to be in compliance with tank insurance policies, state fund requirements, bank loan covenants, and to be considered not-liable under negligence theory for any accidents that occur with the tank. Therefore, AHJs will likely require UL-certified dispensers once they are available. The two primary manufacturers of the dispenser technology and blending equipment are Gilbarco of Greensboro, North Carolina, and Dresser-Wayne located in Austin, Texas.
20U.S. Government Accountability Office. Biofuels: Challenges to the Transportation, Sale, and Use of Intermediate Ethanol Blends. Jun 3, 2011. Publicly Released: Jul 8, 2011. http://www.gao.gov/products/GAO-11-513 21 NREL. Cost of Adding E85 Fueling Capability to Existing Gasoline Stations: NREL Survey and Literature Search. March 2008. http://www.afdc.energy.gov/pdfs/42390.pdf