infrastructure software taxonomy
TRANSCRIPT

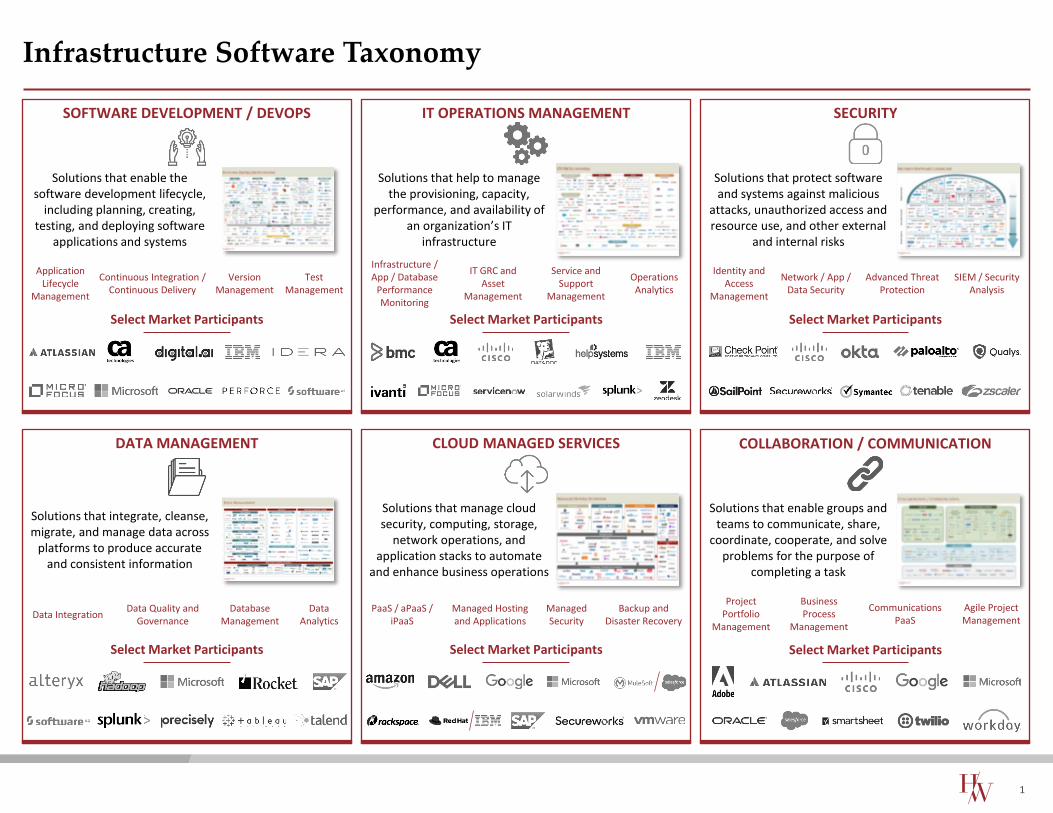
Infrastructure Software Taxonomy
Select Market Participants
DATA MANAGEMENT
Solutions that integrate, cleanse, migrate, and manage data across
platforms to produce accurate and consistent information
Data IntegrationData Quality and
GovernanceDatabase
ManagementData
Analytics
Select Market Participants
SECURITY
Solutions that protect software and systems against malicious
attacks, unauthorized access and resource use, and other external
and internal risks
Identity and Access
Management
SIEM / Security Analysis
Network / App / Data Security
Advanced Threat Protection
Select Market Participants
COLLABORATION / COMMUNICATION
Solutions that enable groups and teams to communicate, share,
coordinate, cooperate, and solve problems for the purpose of
completing a task
Project Portfolio
Management
Agile Project Management
Business Process
Management
Communications PaaS
Select Market Participants
CLOUD MANAGED SERVICES
Solutions that manage cloud security, computing, storage,
network operations, and application stacks to automate
and enhance business operations
PaaS / aPaaS / iPaaS
Managed Hosting and Applications
Managed Security
Backup and Disaster Recovery
Select Market Participants
SOFTWARE DEVELOPMENT / DEVOPS
Solutions that enable the software development lifecycle,
including planning, creating, testing, and deploying software
applications and systems
Application Lifecycle
Management
Continuous Integration / Continuous Delivery
Version Management
Test Management
Select Market Participants
IT OPERATIONS MANAGEMENT
Solutions that help to manage the provisioning, capacity,
performance, and availability of an organization’s IT
infrastructure
Infrastructure / App / Database
Performance Monitoring
IT GRC and Asset
Management
Service and Support
Management
Operations Analytics
1
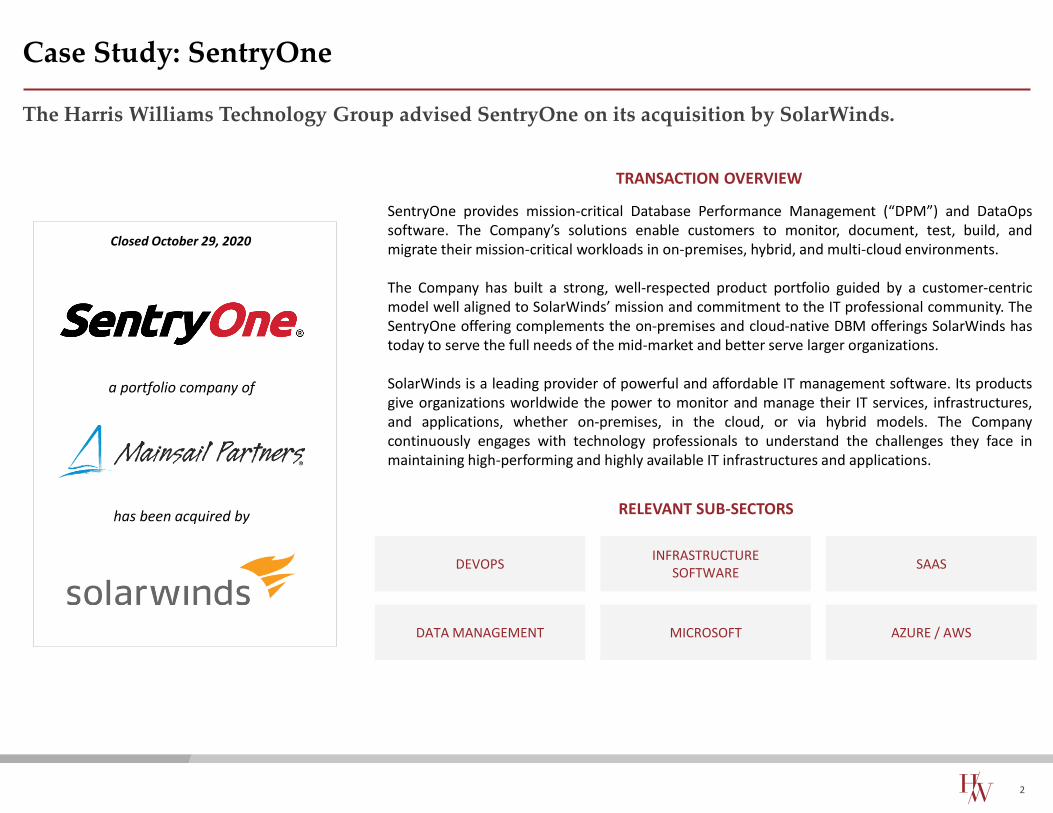
Case Study: SentryOne
The Harris Williams Technology Group advised SentryOne on its acquisition by SolarWinds.
DEVOPSINFRASTRUCTURE
SOFTWARESAAS
SentryOne provides mission-critical Database Performance Management (“DPM”) and DataOpssoftware. The Company’s solutions enable customers to monitor, document, test, build, andmigrate their mission-critical workloads in on-premises, hybrid, and multi-cloud environments.
The Company has built a strong, well-respected product portfolio guided by a customer-centricmodel well aligned to SolarWinds’ mission and commitment to the IT professional community. TheSentryOne offering complements the on-premises and cloud-native DBM offerings SolarWinds hastoday to serve the full needs of the mid-market and better serve larger organizations.
SolarWinds is a leading provider of powerful and affordable IT management software. Its productsgive organizations worldwide the power to monitor and manage their IT services, infrastructures,and applications, whether on-premises, in the cloud, or via hybrid models. The Companycontinuously engages with technology professionals to understand the challenges they face inmaintaining high-performing and highly available IT infrastructures and applications.
TRANSACTION OVERVIEW
RELEVANT SUB-SECTORS
2
has been acquired by
a portfolio company of
Closed October 29, 2020
DATA MANAGEMENT MICROSOFT AZURE / AWS
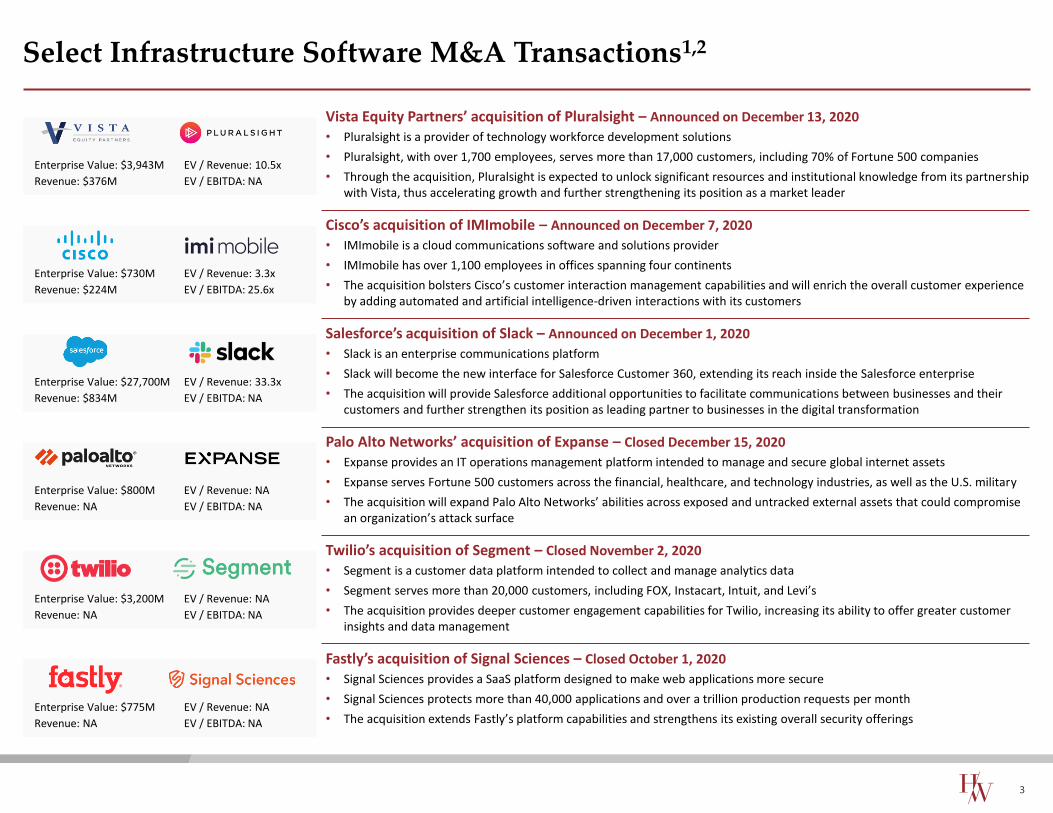
Select Infrastructure Software M&A Transactions1,2
3
Vista Equity Partners’ acquisition of Pluralsight – Announced on December 13, 2020
• Pluralsight is a provider of technology workforce development solutions
• Pluralsight, with over 1,700 employees, serves more than 17,000 customers, including 70% of Fortune 500 companies
• Through the acquisition, Pluralsight is expected to unlock significant resources and institutional knowledge from its partnership with Vista, thus accelerating growth and further strengthening its position as a market leader
Enterprise Value: $3,943M
Revenue: $376M EV / EBITDA: NA
EV / Revenue: 10.5x
Cisco’s acquisition of IMImobile – Announced on December 7, 2020
• IMImobile is a cloud communications software and solutions provider
• IMImobile has over 1,100 employees in offices spanning four continents
• The acquisition bolsters Cisco’s customer interaction management capabilities and will enrich the overall customer experienceby adding automated and artificial intelligence-driven interactions with its customers
Enterprise Value: $730M
Revenue: $224M EV / EBITDA: 25.6x
EV / Revenue: 3.3x
Salesforce’s acquisition of Slack – Announced on December 1, 2020
• Slack is an enterprise communications platform
• Slack will become the new interface for Salesforce Customer 360, extending its reach inside the Salesforce enterprise
• The acquisition will provide Salesforce additional opportunities to facilitate communications between businesses and their customers and further strengthen its position as leading partner to businesses in the digital transformation
Enterprise Value: $27,700M
Revenue: $834M EV / EBITDA: NA
EV / Revenue: 33.3x
Palo Alto Networks’ acquisition of Expanse – Closed December 15, 2020
• Expanse provides an IT operations management platform intended to manage and secure global internet assets
• Expanse serves Fortune 500 customers across the financial, healthcare, and technology industries, as well as the U.S. military
• The acquisition will expand Palo Alto Networks’ abilities across exposed and untracked external assets that could compromise an organization’s attack surface
Enterprise Value: $800M
Revenue: NA EV / EBITDA: NA
EV / Revenue: NA
Twilio’s acquisition of Segment – Closed November 2, 2020
• Segment is a customer data platform intended to collect and manage analytics data
• Segment serves more than 20,000 customers, including FOX, Instacart, Intuit, and Levi’s
• The acquisition provides deeper customer engagement capabilities for Twilio, increasing its ability to offer greater customerinsights and data management
Enterprise Value: $3,200M
Revenue: NA EV / EBITDA: NA
EV / Revenue: NA
Fastly’s acquisition of Signal Sciences – Closed October 1, 2020
• Signal Sciences provides a SaaS platform designed to make web applications more secure
• Signal Sciences protects more than 40,000 applications and over a trillion production requests per month
• The acquisition extends Fastly’s platform capabilities and strengthens its existing overall security offerings Enterprise Value: $775M
Revenue: NA EV / EBITDA: NA
EV / Revenue: NA
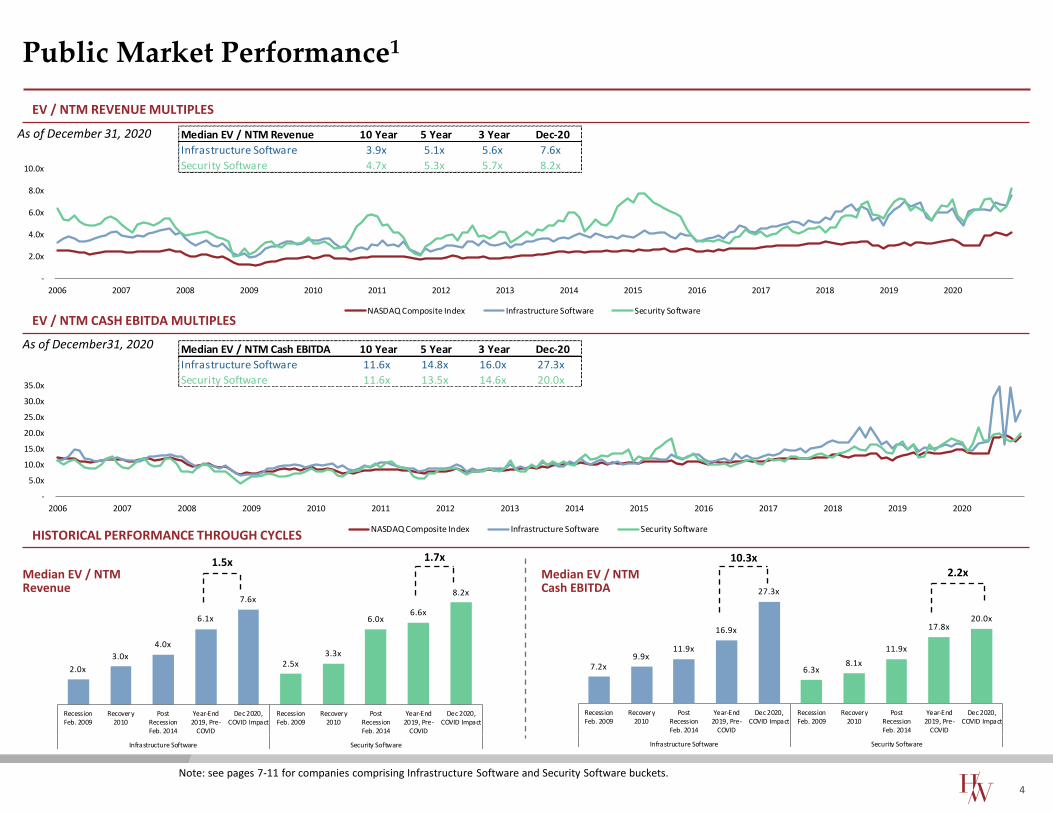
Public Market Performance1
4
Note: see pages 7-11 for companies comprising Infrastructure Software and Security Software buckets.
EV / NTM REVENUE MULTIPLES
EV / NTM CASH EBITDA MULTIPLES
As of December 31, 2020
As of December31, 2020
HISTORICAL PERFORMANCE THROUGH CYCLES
Median EV / NTM Revenue
Median EV / NTM Cash EBITDA
1.5x 1.7x 10.3x2.2x
Median EV / NTM Revenue 10 Year 5 Year 3 Year Dec-20
Infrastructure Software 3.9x 5.1x 5.6x 7.6x
Security Software 4.7x 5.3x 5.7x 8.2x
Median EV / NTM Cash EBITDA 10 Year 5 Year 3 Year Dec-20
Infrastructure Software 11.6x 14.8x 16.0x 27.3x
Security Software 11.6x 13.5x 14.6x 20.0x
-
2.0x
4.0x
6.0x
8.0x
10.0x
2006 2007 2008 2009 2010 2011 2012 2013 2014 2015 2016 2017 2018 2019 2020
NASDAQ Composite Index Infrastructure Software Security Software
-
5.0x
10.0x
15.0x
20.0x
25.0x
30.0x
35.0x
2006 2007 2008 2009 2010 2011 2012 2013 2014 2015 2016 2017 2018 2019 2020
NASDAQ Composite Index Infrastructure Software Security Software
2.0x
3.0x
4.0x
6.1x
7.6x
2.5x 3.3x
6.0x 6.6x
8.2x
RecessionFeb. 2009
Recovery2010
PostRecessionFeb. 2014
Year-End2019, Pre-
COVID
Dec 2020,COVID Impact
RecessionFeb. 2009
Recovery2010
PostRecessionFeb. 2014
Year-End2019, Pre-
COVID
Dec 2020,COVID Impact
Infrastructure Software Security Software
7.2x 9.9x
11.9x
16.9x
27.3x
6.3x 8.1x
11.9x
17.8x 20.0x
RecessionFeb. 2009
Recovery2010
PostRecessionFeb. 2014
Year-End2019, Pre-
COVID
Dec 2020,COVID Impact
RecessionFeb. 2009
Recovery2010
PostRecessionFeb. 2014
Year-End2019, Pre-
COVID
Dec 2020,COVID Impact
Infrastructure Software Security Software

Key Performance Metrics for Recent Infrastructure and Security Software IPOs1
5
IPO DATE
OFFER PRICE PER SHARE
OFFERING SIZE ($M)
OFFER TO CURRENT
MARKET CAP AT OFFER ($M)
% R
eve
nu
e G
row
thSt
ock
Pe
rfo
rman
ce (O
ffe
r to
Cu
rre
nt)
Circle Size Denotes Revenue ($)
48.0%
151.5%
14.4%
74.0%
163.9%
24.6%
101.2%
59.8% 75.1%
316.6%
3.5%
67.9%
136.1%
30.6% 12.7%
79.8%
(100.0%)
0.0%
100.0%
200.0%
300.0%
(50.0%)
0.0%
50.0%
100.0%
150.0%
200.0%
250.0%
300.0%
350.0%
400.0%
450.0%
500.0%
550.0%
73.8%
523.0%
170.4%
406.6%
264.6%
90.9%
42.8% 15.1%
29.9%
134.5%
(9.2%)
340.2%
N/A
0.0%
(16.6%)
230.4%
4/10/19 6/11/19 7/31/19 9/13/19 9/18/19 9/19/19 9/16/20 7/21/20 9/16/20 9/15/20 8/4/20 9/30/20 9/30/20 10/20/20 10/21/20 12/8/20
$24.00 $34.00 $16.00 $15.00 $27.00 $15.00 $44.00 $26.00 $22.00 $120.00 $21.00 $5.35 $9.50 $27.00 $20.00 $42.00
$1,799.3 $703.8 $4,486.6 $1,299.2 $745.2 $1,192.7 $3,901.7 $3,095.6 $2,220.0 $4,849.0 $4,180.2 $16,400.0 $3,990.0 $4,342.9 $3,308.8 $3,976.3
$217.7 $612.0 $569.8 $525.0 $648.0 $187.5 $509.0 $468.0 $325.6 $3,360.0 $703.5 $0.0 $0.0 $594.0 $740.0 $651.0
73.8% 523.0% 170.4% 406.6% 264.6% 90.9% 42.8% 15.1% 29.9% 134.5% (9.2%) 340.2% 211.1% 0.0% (16.6%) 230.4%

Summary of 2020 Infrastructure and Security Software IPOs1
6
There was a significant influx of software IPOs in the second half of 2020, despite the COVID-19 pandemic, as investors buoyed public markets with a focus on technology.
COMPANY SECTOR INVESTORS (CURRENT ROUND) DESCRIPTIONPRIVATE
VAL. YEAR
Application Lifecycle
Management$427M 2019
Battery Ventures; Insight Partners; Meritech Capital Partners; Sapphire Ventures;
VMware; Technologies Capital
JFrog is a provider of an end-to-end, hybrid, universal DevOps platform that bridges
the gap between software development and deployment. The Company serves
organizations in the technology, financial services, retail, healthcare, and
telecommunication industries.
Mobile Device
Management$734M 2017 Vista Equity Partners
Jamf is a provider of a cloud software platform that helps manage Apple's
infrastructure and security platform. The Company's SaaS solutions primarily focus
on the enterprise IT management lifecycle.
IT Operations
Management, SIEM$1,190M 2019
Accel Partners; Battery Ventures; DFJ Growth; Franklin Templeton; Greylock Partners;
Sequoia Capital; Sutter Hill Ventures; Tiger Global; Workday Ventures
Sumo Logic is a SaaS platform focused on helping businesses overcome the
challenges presented by digital transformation. The Company's solution focus on
operational intelligence, security intelligence, business intelligence, and global
intelligence.
Digital / Cloud / Agile
Services, Data
Management
$12,400M 2020Capital One Growth Ventures; Capital One Ventures; Coatue Management; Hillhouse
Capital Management; ICONIQ Capital; Salesforce Ventures; Sutter Hill Ventures
Snowflake is a provider of a cloud-based data platform. The Company's solution
empowers its customers to consolidate data into a single source of truth and derive
meaningful business insights.
Digital / Cloud / Agile
Services$4,300M 2016 ABRY Partners; Apollo Global Management; Searchlight Capital Partners
Rackspace is a provider of end-to-end multicloud technology services. The Company
serves a variety of industries, including automotive, education, financial services,
healthcare, media and entertainment, and public sectors.
Data Management,
Data SecurityNA 2020 Founders Fund; G Squared; Glynn Capital Management; In-Q-Tel; Tiger Global
Palantir is a provider of software solutions for the intelligence community. The
Company's solutions assist government operatives in identifying patterns within
large datasets and planning and executing real-world responses.
Connectivity /
Collaboration$1,500M 2018 Andreessen Horowitz; Benchmark; Founders Fund; G Squared; Tiger Global
Asana is a provider of a work management platform. The Company's solutions
assist individuals and teams in getting work completed more efficiently while
increasing overall employee engagement.
Data Management NA 2017 Vista Equity Partners
Datto is a provider of cloud-based software and technology solutions. The
Company's solutions are delivered through the managed service provider (MSP)
channel focused on small and medium-sized businesses.
Endpoint Protection /
Anti-Virus$4,157M 2017 Intel; Fisher Lynch Capital; Thoma Bravo; TPG
McAfee is a provider of device-to-cloud cybersecurity solutions. The Company's
solutions are used across consumers, small and medium-sized business, large
enterprises, and the public sector.
Rapid Application
Development$3,300M 2019 Baker Hughes; Primera Capital; Sutter Hill Ventures; TPG Growth
C3.ai is a provider of enterprise artificial intelligence solutions. The Company's SaaS
solutions are used to develop, deploy, and operate large-scale enterprise AI
applications.
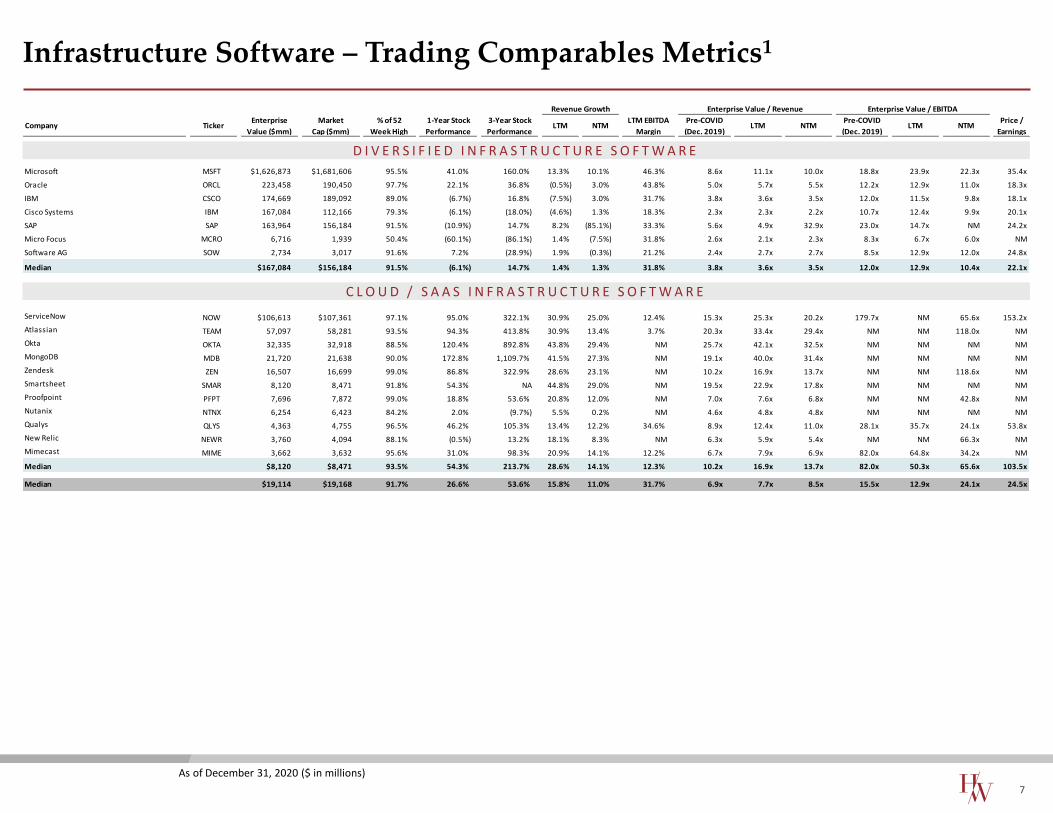
Infrastructure Software – Trading Comparables Metrics1
7
As of December 31, 2020 ($ in millions)
Revenue Growth Enterprise Value / Revenue Enterprise Value / EBITDA
Company TickerEnterprise
Value ($mm)
Market
Cap ($mm)
% of 52
Week High
1-Year Stock
Performance
3-Year Stock
PerformanceLTM NTM
LTM EBITDA
Margin
Pre-COVID
(Dec. 2019)LTM NTM
Pre-COVID
(Dec. 2019)LTM NTM
Price /
Earnings
D I V E R S I F I E D I N F R A S T R U C T U R E S O F T W A R E
C L O U D / S A A S I N F R A S T R U C T U R E S O F T W A R E
Microsoft MSFT $1,626,873 $1,681,606 95.5% 41.0% 160.0% 13.3% 10.1% 46.3% 8.6x 11.1x 10.0x 18.8x 23.9x 22.3x 35.4x
Oracle ORCL 223,458 190,450 97.7% 22.1% 36.8% (0.5%) 3.0% 43.8% 5.0x 5.7x 5.5x 12.2x 12.9x 11.0x 18.3x
IBM CSCO 174,669 189,092 89.0% (6.7%) 16.8% (7.5%) 3.0% 31.7% 3.8x 3.6x 3.5x 12.0x 11.5x 9.8x 18.1x
Cisco Systems IBM 167,084 112,166 79.3% (6.1%) (18.0%) (4.6%) 1.3% 18.3% 2.3x 2.3x 2.2x 10.7x 12.4x 9.9x 20.1x
SAP SAP 163,964 156,184 91.5% (10.9%) 14.7% 8.2% (85.1%) 33.3% 5.6x 4.9x 32.9x 23.0x 14.7x NM 24.2x
Micro Focus MCRO 6,716 1,939 50.4% (60.1%) (86.1%) 1.4% (7.5%) 31.8% 2.6x 2.1x 2.3x 8.3x 6.7x 6.0x NM
Software AG SOW 2,734 3,017 91.6% 7.2% (28.9%) 1.9% (0.3%) 21.2% 2.4x 2.7x 2.7x 8.5x 12.9x 12.0x 24.8x
Median $167,084 $156,184 91.5% (6.1%) 14.7% 1.4% 1.3% 31.8% 3.8x 3.6x 3.5x 12.0x 12.9x 10.4x 22.1x
ServiceNow NOW $106,613 $107,361 97.1% 95.0% 322.1% 30.9% 25.0% 12.4% 15.3x 25.3x 20.2x 179.7x NM 65.6x 153.2x
Atlassian TEAM 57,097 58,281 93.5% 94.3% 413.8% 30.9% 13.4% 3.7% 20.3x 33.4x 29.4x NM NM 118.0x NM
Okta OKTA 32,335 32,918 88.5% 120.4% 892.8% 43.8% 29.4% NM 25.7x 42.1x 32.5x NM NM NM NM
MongoDB MDB 21,720 21,638 90.0% 172.8% 1,109.7% 41.5% 27.3% NM 19.1x 40.0x 31.4x NM NM NM NM
Zendesk ZEN 16,507 16,699 99.0% 86.8% 322.9% 28.6% 23.1% NM 10.2x 16.9x 13.7x NM NM 118.6x NM
Smartsheet SMAR 8,120 8,471 91.8% 54.3% NA 44.8% 29.0% NM 19.5x 22.9x 17.8x NM NM NM NM
Proofpoint PFPT 7,696 7,872 99.0% 18.8% 53.6% 20.8% 12.0% NM 7.0x 7.6x 6.8x NM NM 42.8x NM
Nutanix NTNX 6,254 6,423 84.2% 2.0% (9.7%) 5.5% 0.2% NM 4.6x 4.8x 4.8x NM NM NM NM
Qualys QLYS 4,363 4,755 96.5% 46.2% 105.3% 13.4% 12.2% 34.6% 8.9x 12.4x 11.0x 28.1x 35.7x 24.1x 53.8x
New Relic NEWR 3,760 4,094 88.1% (0.5%) 13.2% 18.1% 8.3% NM 6.3x 5.9x 5.4x NM NM 66.3x NM
Mimecast MIME 3,662 3,632 95.6% 31.0% 98.3% 20.9% 14.1% 12.2% 6.7x 7.9x 6.9x 82.0x 64.8x 34.2x NM
Median $8,120 $8,471 93.5% 54.3% 213.7% 28.6% 14.1% 12.3% 10.2x 16.9x 13.7x 82.0x 50.3x 65.6x 103.5x
Median $19,114 $19,168 91.7% 26.6% 53.6% 15.8% 11.0% 31.7% 6.9x 7.7x 8.5x 15.5x 12.9x 24.1x 24.5x
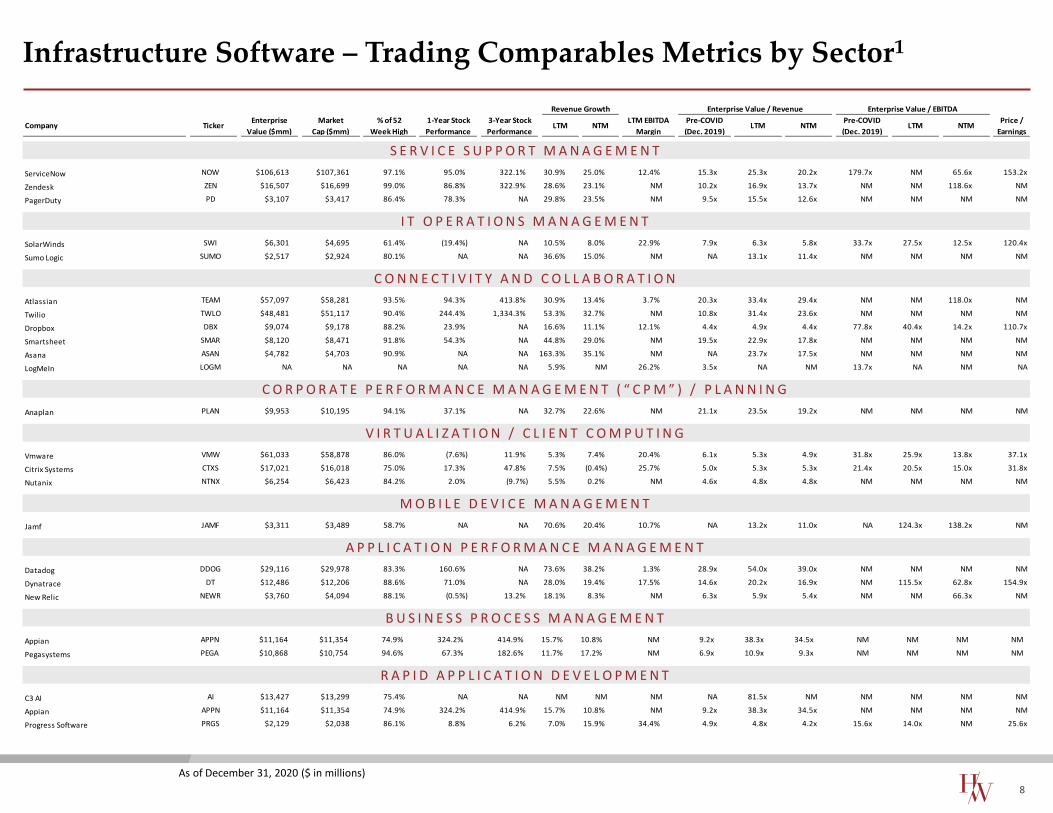
Infrastructure Software – Trading Comparables Metrics by Sector1
8
As of December 31, 2020 ($ in millions)
S E R V I C E S U P P O R T M A N A G E M E N T
C O N N E C T I V I T Y A N D C O L L A B O R A T I O N
V I R T U A L I Z A T I O N / C L I E N T C O M P U T I N G
M O B I L E D E V I C E M A N A G E M E N T
A P P L I C A T I O N P E R F O R M A N C E M A N A G E M E N T
B U S I N E S S P R O C E S S M A N A G E M E N T
R A P I D A P P L I C A T I O N D E V E L O P M E N T
I T O P E R A T I O N S M A N A G E M E N T
C O R P O R A T E P E R F O R M A N C E M A N A G E M E N T ( “ C P M ” ) / P L A N N I N G
ServiceNow NOW $106,613 $107,361 97.1% 95.0% 322.1% 30.9% 25.0% 12.4% 15.3x 25.3x 20.2x 179.7x NM 65.6x 153.2x
Zendesk ZEN $16,507 $16,699 99.0% 86.8% 322.9% 28.6% 23.1% NM 10.2x 16.9x 13.7x NM NM 118.6x NM
PagerDuty PD $3,107 $3,417 86.4% 78.3% NA 29.8% 23.5% NM 9.5x 15.5x 12.6x NM NM NM NM
SolarWinds SWI $6,301 $4,695 61.4% (19.4%) NA 10.5% 8.0% 22.9% 7.9x 6.3x 5.8x 33.7x 27.5x 12.5x 120.4x
Sumo Logic SUMO $2,517 $2,924 80.1% NA NA 36.6% 15.0% NM NA 13.1x 11.4x NM NM NM NM
Atlassian TEAM $57,097 $58,281 93.5% 94.3% 413.8% 30.9% 13.4% 3.7% 20.3x 33.4x 29.4x NM NM 118.0x NM
Twilio TWLO $48,481 $51,117 90.4% 244.4% 1,334.3% 53.3% 32.7% NM 10.8x 31.4x 23.6x NM NM NM NM
Dropbox DBX $9,074 $9,178 88.2% 23.9% NA 16.6% 11.1% 12.1% 4.4x 4.9x 4.4x 77.8x 40.4x 14.2x 110.7x
Smartsheet SMAR $8,120 $8,471 91.8% 54.3% NA 44.8% 29.0% NM 19.5x 22.9x 17.8x NM NM NM NM
Asana ASAN $4,782 $4,703 90.9% NA NA 163.3% 35.1% NM NA 23.7x 17.5x NM NM NM NM
LogMeIn LOGM NA NA NA NA NA 5.9% NM 26.2% 3.5x NA NM 13.7x NA NM NA
Anaplan PLAN $9,953 $10,195 94.1% 37.1% NA 32.7% 22.6% NM 21.1x 23.5x 19.2x NM NM NM NM
Vmware VMW $61,033 $58,878 86.0% (7.6%) 11.9% 5.3% 7.4% 20.4% 6.1x 5.3x 4.9x 31.8x 25.9x 13.8x 37.1x
Citrix Systems CTXS $17,021 $16,018 75.0% 17.3% 47.8% 7.5% (0.4%) 25.7% 5.0x 5.3x 5.3x 21.4x 20.5x 15.0x 31.8x
Nutanix NTNX $6,254 $6,423 84.2% 2.0% (9.7%) 5.5% 0.2% NM 4.6x 4.8x 4.8x NM NM NM NM
Jamf JAMF $3,311 $3,489 58.7% NA NA 70.6% 20.4% 10.7% NA 13.2x 11.0x NA 124.3x 138.2x NM
Datadog DDOG $29,116 $29,978 83.3% 160.6% NA 73.6% 38.2% 1.3% 28.9x 54.0x 39.0x NM NM NM NM
Dynatrace DT $12,486 $12,206 88.6% 71.0% NA 28.0% 19.4% 17.5% 14.6x 20.2x 16.9x NM 115.5x 62.8x 154.9x
New Relic NEWR $3,760 $4,094 88.1% (0.5%) 13.2% 18.1% 8.3% NM 6.3x 5.9x 5.4x NM NM 66.3x NM
Appian APPN $11,164 $11,354 74.9% 324.2% 414.9% 15.7% 10.8% NM 9.2x 38.3x 34.5x NM NM NM NM
Pegasystems PEGA $10,868 $10,754 94.6% 67.3% 182.6% 11.7% 17.2% NM 6.9x 10.9x 9.3x NM NM NM NM
C3 AI AI $13,427 $13,299 75.4% NA NA NM NM NM NA 81.5x NM NM NM NM NM
Appian APPN $11,164 $11,354 74.9% 324.2% 414.9% 15.7% 10.8% NM 9.2x 38.3x 34.5x NM NM NM NM
Progress Software PRGS $2,129 $2,038 86.1% 8.8% 6.2% 7.0% 15.9% 34.4% 4.9x 4.8x 4.2x 15.6x 14.0x NM 25.6x
Revenue Growth Enterprise Value / Revenue Enterprise Value / EBITDA
Company TickerEnterprise
Value ($mm)
Market
Cap ($mm)
% of 52
Week High
1-Year Stock
Performance
3-Year Stock
PerformanceLTM NTM
LTM EBITDA
Margin
Pre-COVID
(Dec. 2019)LTM NTM
Pre-COVID
(Dec. 2019)LTM NTM
Price /
Earnings

Infrastructure Software – Trading Comparables Metrics by Sector1
9
As of December 31, 2020 ($ in millions)
H A D O O P
D A T A B A S E S Y S T E M
A P P L I C A T I O N L I F E C Y C L E M A N A G E M E N T / C O L L A B O R A T I O N
P A A S
I A A S
D A T A M A N A G E M E N T
I T T R A I N I N G
D I G I T A L / C L O U D / A G I L E S E R V I C E S
E N T E R P R I S E D A T A S E A R C H
E D G E C O M P U T I N G / W E B P E R F O R M A N C E
Snowflake SNOW $75,116 $79,664 65.6% NA NA 406.2% 92.2% NM NA 153.5x 79.9x NM NM NM NM
Palantir PLTR $39,423 $41,025 70.3% NA NA 67.9% 31.6% NM NA 39.4x 30.0x NM NM 157.1x NM
Splunk SPLK $28,160 $27,475 75.2% 13.4% 105.1% 3.9% 7.6% NM 10.7x 12.4x 11.5x NM NM NM NM
Alteryx AYX $8,166 $8,109 65.6% 21.7% 382.0% 40.1% 9.0% 4.8% 15.2x 16.6x 15.3x 137.2x NM 108.3x NM
Datto MSP $4,819 $4,336 80.7% NA NA 30.6% 9.7% 22.9% NA 9.5x 8.7x NA 41.5x 32.3x NM
Cloudera CLDR $3,992 $4,350 89.7% 19.6% (15.8%) 17.5% 7.8% NM 4.2x 4.7x 4.3x NM NM 22.1x NM
Domo DOMO $1,931 $1,910 88.5% 193.6% NA 19.7% 15.4% NM 3.5x 9.7x 8.4x NM NM NM NM
Talend TLND $1,235 $1,218 81.9% (2.0%) 2.3% 16.2% 13.0% NM 4.8x 4.5x 4.0x NM NM NM NM
Elastic ESTC $12,454 $12,772 91.4% 127.3% NA 49.2% 23.8% NM 14.4x 24.4x 19.7x NM NM NM NM
Cloudera CLDR $3,992 $4,350 89.7% 19.6% (15.8%) 17.5% 7.8% NM 4.2x 4.7x 4.3x NM NM 22.1x NM
MongoDB MDB $21,720 $21,638 90.0% 172.8% 1,109.7% 41.5% 27.3% NM 19.1x 40.0x 31.4x NM NM NM NM
Atlassian TEAM $57,097 $58,281 93.5% 94.3% 413.8% 30.9% 13.4% 3.7% 20.3x 33.4x 29.4x NM NM 118.0x NM
JFrog FROG $5,152 $5,730 66.0% NA NA 118.6% 31.9% NM NA 37.1x 28.1x NM NM NM NM
Salesforce.com CRM $200,445 $203,714 78.2% 36.8% 117.7% 28.0% 18.8% 10.0% 9.1x 9.9x 8.3x 59.2x 99.1x 29.3x 57.3x
Amazon AMZN $1,662,580 $1,634,168 91.7% 76.3% 178.5% 31.1% 23.4% 12.6% 3.4x 4.8x 3.9x 26.2x 38.0x 26.0x 94.0x
Pluralsight PS $2,714 $2,507 92.4% 21.8% NA 27.2% 14.2% NM 5.9x 7.2x 6.3x NM NM NM NM
EPAM Systems EPAM $19,113 $20,064 99.3% 68.9% 233.6% 18.6% 17.9% 16.0% 4.8x 7.4x 6.3x 31.7x 46.5x 32.1x 63.5x
Globant GLOB $8,365 $8,609 97.5% 105.2% 368.4% 24.5% 24.5% 14.9% 6.0x 10.9x 8.8x 34.0x 73.2x 45.0x 175.8x
Rackspace RXT $7,722 $3,818 83.8% NA NA 6.7% 9.7% 21.9% NA 2.9x 2.7x NA 13.5x 9.7x NM
Endava DAVA $4,150 $4,173 98.5% 64.7% NA 25.8% 28.7% 8.9% 5.7x 8.8x 6.9x 61.8x 99.7x 30.0x NM
Cloudflare NET $22,718 $23,352 85.6% 345.4% NA 50.5% 35.6% NM 15.6x 58.4x 43.1x NM NM NM NM
Akamai AKAM $17,246 $17,092 87.5% 21.5% 61.4% 10.2% 6.6% 31.6% 4.8x 5.5x 5.2x 16.4x 17.5x 11.9x 30.4x
Revenue Growth Enterprise Value / Revenue Enterprise Value / EBITDA
Company TickerEnterprise
Value ($mm)
Market
Cap ($mm)
% of 52
Week High
1-Year Stock
Performance
3-Year Stock
PerformanceLTM NTM
LTM EBITDA
Margin
Pre-COVID
(Dec. 2019)LTM NTM
Pre-COVID
(Dec. 2019)LTM NTM
Price /
Earnings
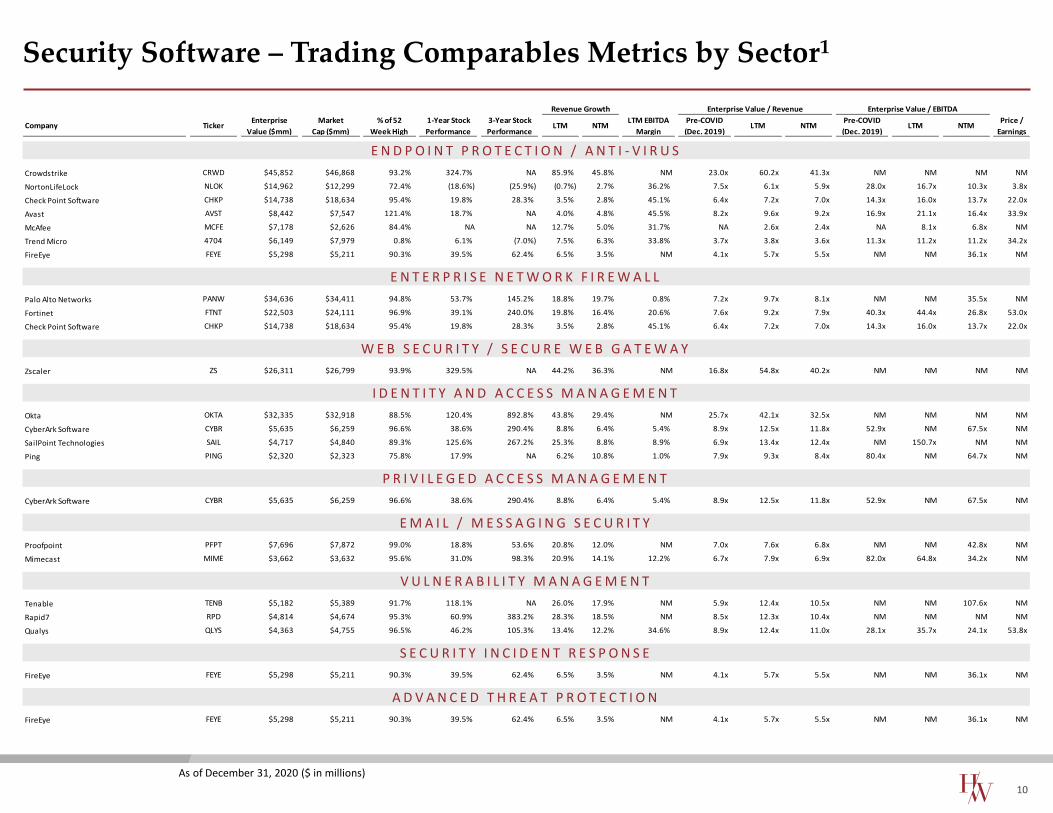
Security Software – Trading Comparables Metrics by Sector1
10
As of December 31, 2020 ($ in millions)
Revenue Growth Enterprise Value / Revenue Enterprise Value / EBITDA
Company TickerEnterprise
Value ($mm)
Market
Cap ($mm)
% of 52
Week High
1-Year Stock
Performance
3-Year Stock
PerformanceLTM NTM
LTM EBITDA
Margin
Pre-COVID
(Dec. 2019)LTM NTM
Pre-COVID
(Dec. 2019)LTM NTM
Price /
Earnings
E N D P O I N T P R O T E C T I O N / A N T I - V I R U S
E N T E R P R I S E N E T W O R K F I R E W A L L
W E B S E C U R I T Y / S E C U R E W E B G A T E W A Y
I D E N T I T Y A N D A C C E S S M A N A G E M E N T
P R I V I L E G E D A C C E S S M A N A G E M E N T
E M A I L / M E S S A G I N G S E C U R I T Y
V U L N E R A B I L I T Y M A N A G E M E N T
S E C U R I T Y I N C I D E N T R E S P O N S E
A D V A N C E D T H R E A T P R O T E C T I O N
Palo Alto Networks PANW $34,636 $34,411 94.8% 53.7% 145.2% 18.8% 19.7% 0.8% 7.2x 9.7x 8.1x NM NM 35.5x NM
Fortinet FTNT $22,503 $24,111 96.9% 39.1% 240.0% 19.8% 16.4% 20.6% 7.6x 9.2x 7.9x 40.3x 44.4x 26.8x 53.0x
Check Point Software CHKP $14,738 $18,634 95.4% 19.8% 28.3% 3.5% 2.8% 45.1% 6.4x 7.2x 7.0x 14.3x 16.0x 13.7x 22.0x
Zscaler ZS $26,311 $26,799 93.9% 329.5% NA 44.2% 36.3% NM 16.8x 54.8x 40.2x NM NM NM NM
Okta OKTA $32,335 $32,918 88.5% 120.4% 892.8% 43.8% 29.4% NM 25.7x 42.1x 32.5x NM NM NM NM
CyberArk Software CYBR $5,635 $6,259 96.6% 38.6% 290.4% 8.8% 6.4% 5.4% 8.9x 12.5x 11.8x 52.9x NM 67.5x NM
SailPoint Technologies SAIL $4,717 $4,840 89.3% 125.6% 267.2% 25.3% 8.8% 8.9% 6.9x 13.4x 12.4x NM 150.7x NM NM
Ping PING $2,320 $2,323 75.8% 17.9% NA 6.2% 10.8% 1.0% 7.9x 9.3x 8.4x 80.4x NM 64.7x NM
CyberArk Software CYBR $5,635 $6,259 96.6% 38.6% 290.4% 8.8% 6.4% 5.4% 8.9x 12.5x 11.8x 52.9x NM 67.5x NM
Proofpoint PFPT $7,696 $7,872 99.0% 18.8% 53.6% 20.8% 12.0% NM 7.0x 7.6x 6.8x NM NM 42.8x NM
Mimecast MIME $3,662 $3,632 95.6% 31.0% 98.3% 20.9% 14.1% 12.2% 6.7x 7.9x 6.9x 82.0x 64.8x 34.2x NM
Tenable TENB $5,182 $5,389 91.7% 118.1% NA 26.0% 17.9% NM 5.9x 12.4x 10.5x NM NM 107.6x NM
Rapid7 RPD $4,814 $4,674 95.3% 60.9% 383.2% 28.3% 18.5% NM 8.5x 12.3x 10.4x NM NM NM NM
Qualys QLYS $4,363 $4,755 96.5% 46.2% 105.3% 13.4% 12.2% 34.6% 8.9x 12.4x 11.0x 28.1x 35.7x 24.1x 53.8x
FireEye FEYE $5,298 $5,211 90.3% 39.5% 62.4% 6.5% 3.5% NM 4.1x 5.7x 5.5x NM NM 36.1x NM
FireEye FEYE $5,298 $5,211 90.3% 39.5% 62.4% 6.5% 3.5% NM 4.1x 5.7x 5.5x NM NM 36.1x NM
Crowdstrike CRWD $45,852 $46,868 93.2% 324.7% NA 85.9% 45.8% NM 23.0x 60.2x 41.3x NM NM NM NM
NortonLifeLock NLOK $14,962 $12,299 72.4% (18.6%) (25.9%) (0.7%) 2.7% 36.2% 7.5x 6.1x 5.9x 28.0x 16.7x 10.3x 3.8x
Check Point Software CHKP $14,738 $18,634 95.4% 19.8% 28.3% 3.5% 2.8% 45.1% 6.4x 7.2x 7.0x 14.3x 16.0x 13.7x 22.0x
Avast AVST $8,442 $7,547 121.4% 18.7% NA 4.0% 4.8% 45.5% 8.2x 9.6x 9.2x 16.9x 21.1x 16.4x 33.9x
McAfee MCFE $7,178 $2,626 84.4% NA NA 12.7% 5.0% 31.7% NA 2.6x 2.4x NA 8.1x 6.8x NM
Trend Micro 4704 $6,149 $7,979 0.8% 6.1% (7.0%) 7.5% 6.3% 33.8% 3.7x 3.8x 3.6x 11.3x 11.2x 11.2x 34.2x
FireEye FEYE $5,298 $5,211 90.3% 39.5% 62.4% 6.5% 3.5% NM 4.1x 5.7x 5.5x NM NM 36.1x NM
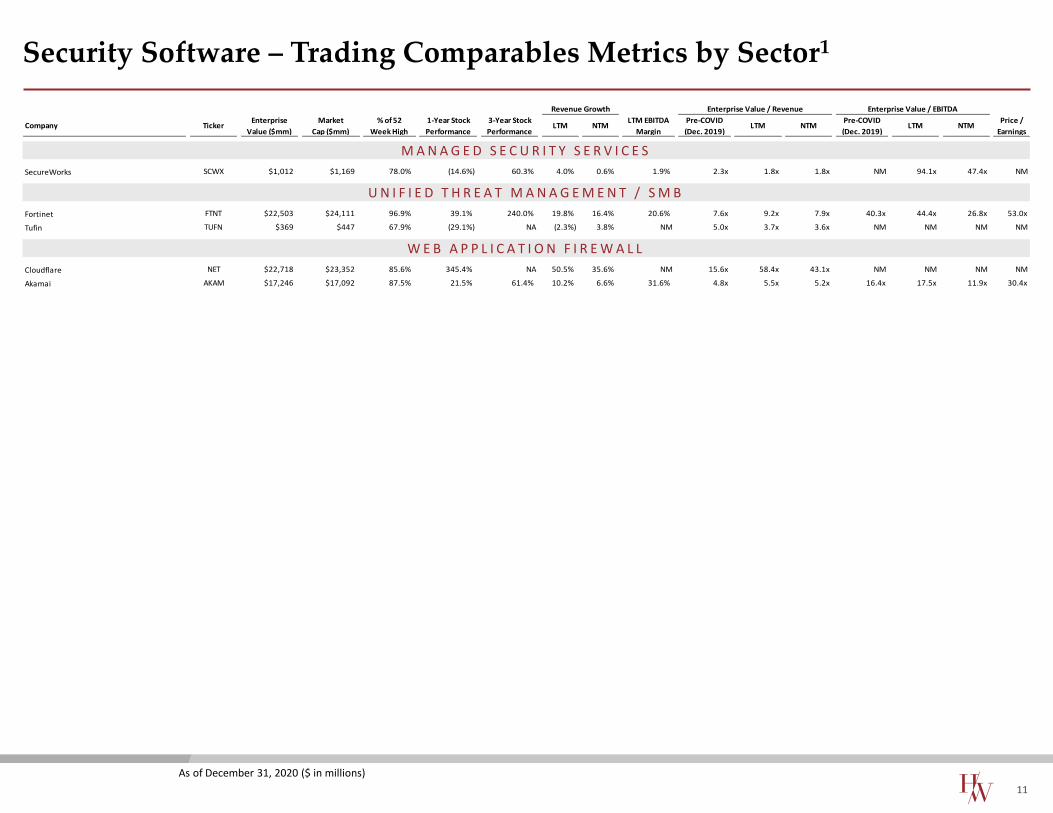
Security Software – Trading Comparables Metrics by Sector1
11
As of December 31, 2020 ($ in millions)
Revenue Growth Enterprise Value / Revenue Enterprise Value / EBITDA
Company TickerEnterprise
Value ($mm)
Market
Cap ($mm)
% of 52
Week High
1-Year Stock
Performance
3-Year Stock
PerformanceLTM NTM
LTM EBITDA
Margin
Pre-COVID
(Dec. 2019)LTM NTM
Pre-COVID
(Dec. 2019)LTM NTM
Price /
Earnings
U N I F I E D T H R E A T M A N A G E M E N T / S M B
W E B A P P L I C A T I O N F I R E W A L L
M A N A G E D S E C U R I T Y S E R V I C E S
SecureWorks SCWX $1,012 $1,169 78.0% (14.6%) 60.3% 4.0% 0.6% 1.9% 2.3x 1.8x 1.8x NM 94.1x 47.4x NM
Fortinet FTNT $22,503 $24,111 96.9% 39.1% 240.0% 19.8% 16.4% 20.6% 7.6x 9.2x 7.9x 40.3x 44.4x 26.8x 53.0x
Tufin TUFN $369 $447 67.9% (29.1%) NA (2.3%) 3.8% NM 5.0x 3.7x 3.6x NM NM NM NM
Cloudflare NET $22,718 $23,352 85.6% 345.4% NA 50.5% 35.6% NM 15.6x 58.4x 43.1x NM NM NM NM
Akamai AKAM $17,246 $17,092 87.5% 21.5% 61.4% 10.2% 6.6% 31.6% 4.8x 5.5x 5.2x 16.4x 17.5x 11.9x 30.4x
Closed Date Target Buyer(s) Description
Enterprise
Value USDm
Implied EV /
Revenue
Implied EV /
EBITDA
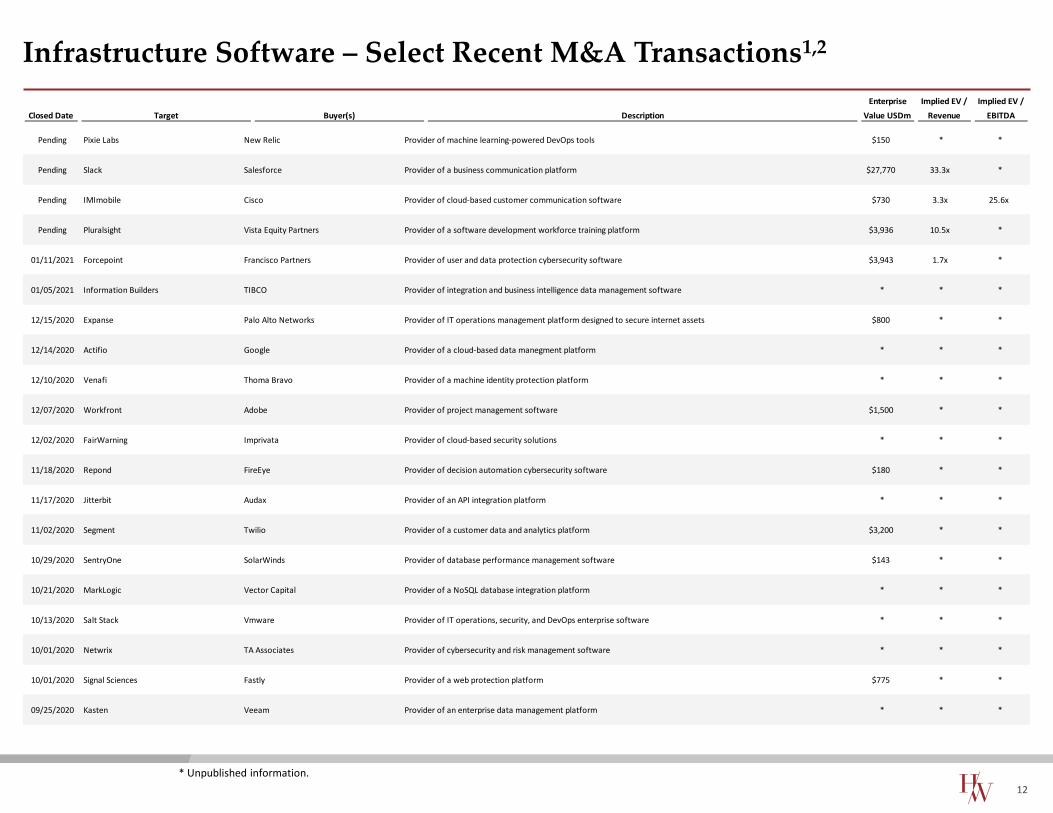
Infrastructure Software – Select Recent M&A Transactions1,2
12
* Unpublished information.
Pending Pixie Labs New Relic Provider of machine learning-powered DevOps tools $150 * *
Pending Slack Salesforce Provider of a business communication platform $27,770 33.3x *
Pending IMImobile Cisco Provider of cloud-based customer communication software $730 3.3x 25.6x
Pending Pluralsight Vista Equity Partners Provider of a software development workforce training platform $3,936 10.5x *
01/11/2021 Forcepoint Francisco Partners Provider of user and data protection cybersecurity software $3,943 1.7x *
01/05/2021 Information Builders TIBCO Provider of integration and business intelligence data management software * * *
12/15/2020 Expanse Palo Alto Networks Provider of IT operations management platform designed to secure internet assets $800 * *
12/14/2020 Actifio Google Provider of a cloud-based data manegment platform * * *
12/10/2020 Venafi Thoma Bravo Provider of a machine identity protection platform * * *
12/07/2020 Workfront Adobe Provider of project management software $1,500 * *
12/02/2020 FairWarning Imprivata Provider of cloud-based security solutions * * *
11/18/2020 Repond FireEye Provider of decision automation cybersecurity software $180 * *
11/17/2020 Jitterbit Audax Provider of an API integration platform * * *
11/02/2020 Segment Twilio Provider of a customer data and analytics platform $3,200 * *
10/29/2020 SentryOne SolarWinds Provider of database performance management software $143 * *
10/21/2020 MarkLogic Vector Capital Provider of a NoSQL database integration platform * * *
10/13/2020 Salt Stack Vmware Provider of IT operations, security, and DevOps enterprise software * * *
10/01/2020 Netwrix TA Associates Provider of cybersecurity and risk management software * * *
10/01/2020 Signal Sciences Fastly Provider of a web protection platform $775 * *
09/25/2020 Kasten Veeam Provider of an enterprise data management platform * * *
minority investment from acquired by acquired bymajority investment from acquired by strategic investment fromacquired by merged with acquired byacquired by acquired by acquired by acquired byacquired by
Select HW Technology Transactions
13
acquired by
recapitalized by acquired byacquired by acquired by acquired byacquired by acquired by acquired a majority stake inacquired byacquired byacquired byacquired by acquired by
B2C
acquired byacquired by
acquired by acquired bymajority investment from majority investment from acquiredacquired byrecapitalized byacquired bygrowth Investment frommajority investment fromacquiredacquired by acquired by acquired byinvestment from
acquired by acquired byacquiredacquired byacquired byinvestment frommerged withacquired byacquiredinvestment fromacquired by
&
acquired byacquired by acquired bymajority investment from
acquired by acquired byacquired by invested in
&
a wholly-owned affiliate of
acquired byacquiredacquired byacquired
acquired by
&
acquired byacquiredacquired acquired by acquired byacquired
acquired acquired acquired bystrategic investment fromacquiredacquired byhas received a controlling
investment fromacquired byacquired by
significant growth investment from
acquired byacquired byacquired bysignificant growth investment
fromrecapitalized by
acquired acquired by acquired byacquired by
investment from
strategic investment inacquired byacquired by acquiredacquisition ofacquired by acquired byacquired by
A Fortune 25 Company
acquired by
Pending
has made a strategic investment in
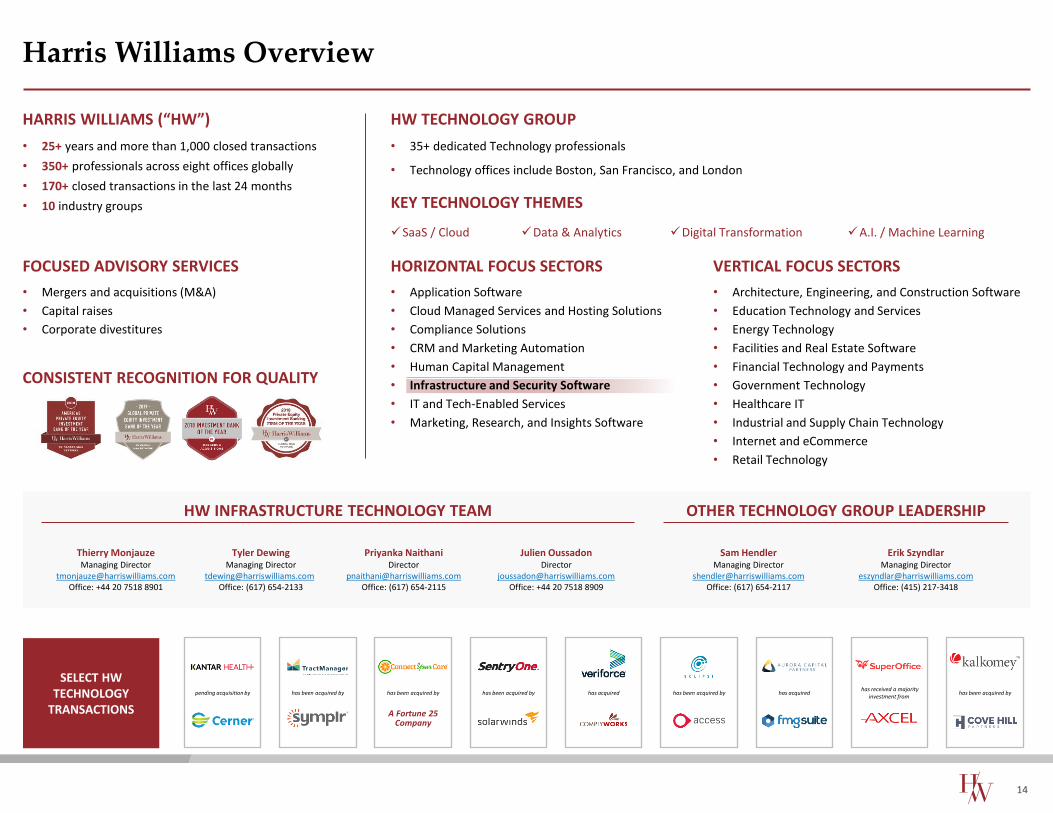
Harris Williams Overview
SELECT HW TECHNOLOGY
TRANSACTIONS
has been acquired byhas received a majority
investment from has acquiredhas been acquired by
Tyler DewingManaging Director
[email protected]: (617) 654-2133
HW INFRASTRUCTURE TECHNOLOGY TEAM OTHER TECHNOLOGY GROUP LEADERSHIP
Erik SzyndlarManaging Director
[email protected]: (415) 217-3418
Thierry MonjauzeManaging Director
[email protected]: +44 20 7518 8901
Sam HendlerManaging Director
[email protected]: (617) 654-2117
HW TECHNOLOGY GROUPHARRIS WILLIAMS (“HW”)
• 25+ years and more than 1,000 closed transactions
• 350+ professionals across eight offices globally
• 170+ closed transactions in the last 24 months
• 10 industry groups
• 35+ dedicated Technology professionals
• Technology offices include Boston, San Francisco, and London
FOCUSED ADVISORY SERVICES
• Mergers and acquisitions (M&A)
• Capital raises
• Corporate divestitures
VERTICAL FOCUS SECTORS
• Architecture, Engineering, and Construction Software
• Education Technology and Services
• Energy Technology
• Facilities and Real Estate Software
• Financial Technology and Payments
• Government Technology
• Healthcare IT
• Industrial and Supply Chain Technology
• Internet and eCommerce
• Retail Technology
HORIZONTAL FOCUS SECTORS
• Application Software
• Cloud Managed Services and Hosting Solutions
• Compliance Solutions
• CRM and Marketing Automation
• Human Capital Management
• Infrastructure and Security Software
• IT and Tech-Enabled Services
• Marketing, Research, and Insights Software
KEY TECHNOLOGY THEMES
✓SaaS / Cloud ✓Data & Analytics ✓Digital Transformation ✓A.I. / Machine Learning
CONSISTENT RECOGNITION FOR QUALITY
Priyanka NaithaniDirector
[email protected]: (617) 654-2115
Julien OussadonDirector
[email protected]: +44 20 7518 8909
has acquiredhas been acquired by has been acquired byhas been acquired by
A Fortune 25 Company
pending acquisition by
14

Our Firm
Harris Williams has a broad range of industry expertise, which creates powerful opportunities. Our clients benefit from our deep sector experience, integrated industry intelligence and collaboration across the firm, and our commitment to learning what makes them unique. For more information, visit our website at www.harriswilliams.com/industries.
15
TechnologyHealthcare & Life Sciences
Energy, Power & Infrastructure
IndustrialsAerospace, Defense & Government Services
Building Products & Materials
Business Services
Consumer Specialty Distribution
Transportation & Logistics
UNITED STATES EUROPE
BostonOne International PlaceSuite 2620Boston, Massachusetts 02110Phone: +1 (617) 482-7501
Cleveland1900 East 9th Street25th FloorCleveland, Ohio 44114Phone: +1 (216) 689-2400
Minneapolis222 South 9th StreetSuite 3350Minneapolis, Minnesota 55402Phone: +1 (612) 359-2700
Richmond (Headquarters) 1001 Haxall Point9th FloorRichmond, Virginia 23219 Phone: +1 (804) 648-0072
San FranciscoOne Market Plaza11th FloorSan Francisco, California 94105 Phone: +1 (415) 288-4260
Washington, D.C. 800 17th St. NW2nd FloorWashington, D.C. 20006 Phone: +1 (202) 207-2300
FrankfurtBockenheimer Landstrasse 33-3560325 FrankfurtGermanyPhone: +49 069 3650638 00
London25 Savile Row4th FloorLondon W1S 2ER, EnglandPhone: +44 (0) 20 7518 8900
Harris Williams Office Locations

Sources & Disclosures
Investment banking services are provided by Harris Williams LLC (“Harris Williams”). Harris Williams is a registered broker-dealer and member of FINRA and SIPC. Harris Williams & Co. Ltd is aprivate limited company incorporated under English law with its registered office at 8th Floor, 20 Farringdon Street, London EC4A 4AB, UK, registered with the Registrar of Companies for Englandand Wales, registration number 07078852. Harris Williams & Co. Ltd is authorized and regulated by the Financial Conduct Authority. Harris Williams & Co. Corporate Finance Advisors GmbH isregistered in the commercial register of the local court of Frankfurt am Main, Germany, under HRB 107540. The registered address is Bockenheimer Landstrasse 33-35, 60325 Frankfurt am Main,Germany (email address: [email protected]). Geschäftsführers/Directors: Jeffery H. Perkins, Paul Poggi, VAT No. DE321666994. Harris Williams is a trade name under which HarrisWilliams LLC, Harris Williams & Co. Ltd and Harris Williams & Co. Corporate Finance Advisors GmbH conduct business.
The information and views contained in this content have been prepared in part by Harris Williams. This content does not purport to be comprehensive or to contain all the information that arecipient may need in order to evaluate any investment or potential transaction. This content is not a research report, as such term is defined by applicable law and regulations, and is provided forinformational purposes only. Any and all information, including estimates, projections and other forward-looking statements, presented in this document may involve various assumptions andsignificant elements of subjective judgment and analysis that may or may not be correct. Harris Williams has not independently verified, and neither Harris Williams nor any other person willindependently verify, any of the information, estimates, projections or forward-looking statements contained herein or the assumptions on which they are based. The information contained in thisdocument is made as of the date hereof unless stated otherwise. Harris Williams does not expect to update or otherwise revise this document nor provide any additional information, nor correctany inaccuracies herein which may become apparent.
This content is intended for institutional use only and should not be relied upon by retail investors or members of the general public. The information contained herein is believed by Harris Williamsto be reliable but Harris Williams makes no representation or warranty as to the accuracy or completeness of such information, and information contained herein that is based on material preparedby others may involve significant elements of subjective judgment and analysis which may or may not be correct. Opinions, estimates and projections contained herein constitute Harris Williams’judgment and are subject to change without notice.
This content is not to be construed as investment advice an offer to buy or sell or a solicitation of an offer to buy or sell any financial instruments or to participate in any particular transaction, norshall this content form the basis of any contract. It does not constitute and should not be construed as an endorsement or recommendation of any entities’ products or services.
No part of this material may be copied or duplicated in any form or by any means, or redistributed, without Harris Williams’ prior written consent.
1. S&P Capital IQ.
2. PitchBook.
16
Sources
Disclosures and Disclaimers