ingevity · on high-growth end-use applications 125 projected market growth and share by product...
TRANSCRIPT

Ingevity
CJS 19th Annual New Ideas for the New Year Investor Converence
January 9, 2018
1

Disclaimer
2
This presentation contains “forward-looking statements” within the meaning of the Private Securities Litigation Reform Act of 1995. Such forward looking statements generally include the words “may,” “could,” “should,” “believes,” “plans,” “intends,” “targets,” “will,” “expects,” “suggests,” “anticipates,” “outlook,” “continues,” “forecast,” “prospect,” “potential” or similar expressions. Forward-looking statements may include, without limitation, expected financial positions, results of operations and cash flows; financing plans; business strategies and expectations; operating plans; synergies and the potential benefits of the acquisition of Perstorp Holding AB’s (“Perstorp”) Capa™ caprolactone business (the “acquisition”); the anticipated timing of the closing of the acquisition; capital and other expenditures; competitive positions; growth opportunities for existing products; benefits from new technology and cost-reduction initiatives, plans and objectives; and markets for securities. Like other businesses, Ingevity is subject to risks and uncertainties that could cause its actual results to differ materially from its expectations or that could cause other forward-looking statements to prove incorrect. Factors that could cause actual results to materially differ from those contained in the forward-looking statements, or that could cause other forward-looking statements to prove incorrect, include, without limitation, risks related to the satisfaction of the conditions to closing the acquisition (including the failure to obtain necessary regulatory approvals) in the anticipated timeframe or at all; risks that the expected benefits from the proposed acquisition will not be realized or will not be realized within the expected time period; the risk that the businesses will not be integrated successfully; significant transaction costs; unknown or understated liabilities; general economic and financial conditions; international sales and operations; currency exchange rates and currency devaluation; compliance with U.S. and foreign regulations; attracting and retaining key personnel; conditions in the automotive market or adoption of alternative technologies; worldwide air quality standards; government infrastructure spending; declining volumes in the printing inks market; the limited supply of crude tall oil (“CTO”); lack of access to sufficient CTO; access to and pricing of raw materials; competition from producers of substitute products and new technologies; and new or emerging technologies; a prolonged period of low energy prices; the provision of services by third parties at several facilities; natural disasters, such as hurricanes, winter or tropical storms, earthquakes, floods, fires; other unanticipated problems such as labor difficulties including renewal of collective bargaining agreements, equipment failure or unscheduled maintenance and repair; protection of intellectual property and proprietary information; information technology security risks; government policies and regulations, including, but not limited to, those affecting the environment, climate change, tax policies and the chemicals industry; and lawsuits arising out of environmental damage or personal injuries associated with chemical or other manufacturing processes. These and other important factors that could cause actual results or events to differ materially from those expressed in forward-looking statements that may have been made in this document are and will be more particularly described in our filings with the U.S. Securities and Exchange Commission, including our Form 10-K for the year ended December 31, 2017 and our other periodic filings. Readers are cautioned not to place undue reliance on Ingevity’s projections and forward-looking statements, which speak only as the date thereof. Ingevity undertakes no obligation to publicly release any revision to the projections and forward-looking statements contained in this presentation, or to update them to reflect events or circumstances occurring after the date of this presentation. The financial results for Perstorp’s Capa™ caprolactone business in this presentation have been derived from unaudited financial records prepared by Perstorp, without adjustment to conform to the accounting policies and methodologies used by Ingevity. Neither Perstorp’s, nor Ingevity’s auditors, have audited, reviewed, compiled or performed any procedures with respect to the financial results of Perstorp’s Capa™ caprolactone business . The accounting policies and methodologies used by Perstorp’s Capa™ caprolactone business differ in certain respects from those used by Ingevity. The audited financial statements of Perstorp’s Capa™ caprolactone business will be delivered to Ingevity prior to closing. The actual audited results of Perstorp’s Capa™ caprolactone business therefore may differ from those provided herein due to the completion of the financial closing and auditing procedures under U.S. GAAP, application of financial adjustments, and other developments.
Non-GAAP Financial Measures
This presentation includes certain non‐GAAP financial measures intended to supplement, not substitute for, comparable GAAP measures.
Reconciliations of non‐GAAP financial measures to GAAP financial measures are provided within the Appendix to this presentation. Investors are
urged to consider carefully the comparable GAAP measures and the reconciliations to those measures provided.
Ingevity Announces
Agreement to Acquire
Perstorp’s CapaTM
Caprolactone
Division
Announced December 10, 2018

Transaction Overview
Transaction
Value
Cash purchase price of €590 million (~$675 million1)
~11x 2018E adjusted EBITDA2
Assumes no synergies or tax benefits
Expected EPS accretive in year one
To be financed under existing credit facilities and cash
Pro forma 2018E net leverage: ~3.5x
Expected to deleverage to below 3.0x by end of 2019
Ingevity has reached an agreement to acquire the CapaTM
caprolactone division of Perstorp Holding AB
Anticipated closing late in the first quarter of 2019, subject to
regulatory approvals and other customary conditions
To be integrated into Performance Chemicals segment as
“Engineered Polymers”
Financing
Summary
(1) EUR / USD exchange rate: 1.15; purchase price subject to customary closing adjustments
(2) Earnings before interest, taxes, depreciation and amortization.
4

CapaTM Caprolactone Business Overview
5
Capa holds the #1 market position in caprolactone technologies, with only two other major competitors worldwide
Caprolactone is a critical input to many high-growth end-use applications
Note: Caprolactone is not caprolactam
Highly profitable and scalable business
Expected 2018 sales of ~$175 million (1)
Adj. EBITDA of ~$60 million Adj. EBITDA margins of mid-30s percent
Single plant operation in Warrington, U.K.
Experienced management team with approximately 90 employees globally
Revenue by Product and Geography (2018E)
Source: Company information
Polyols
47%
Thermoplastics
25%
HDO
3%
Caprolactone
25% Americas
31%
EMEA
44%
APAC
25%
(1) EUR / USD exchange rate: 1.15

Market Use Benefits End-Products
Coatings Capa Polycaprolactonesfor High-Performance Polyurethane Coatings
• High gloss• Weathering resistance• Flexibility• Toughness• Self-healing
• Aerospace coatings• Automotive coatings• Specialty flooring
coatings• Windmill coatings
Resins Capa-based Polyurethane dispersions and UV-curable resins
• Wear resistance• Anti-weathering• Cracking resistance
• Automotive and aerospace coatings
• Wood flooring coatings• Leather coatings
Elastomers Capa Polyols for thermoplastic polyurethane or cast elastomers
• Durability• Resistance to wear and
tear• Thermal stability• Ease of processing
• Tires for forklifts• Skateboard wheels• Roller coaster wheels• Running shoe soles• Gaskets and O-rings
Adhesives Capa Thermoplastics for hot melt adhesives and Capa Polyols for liquid polyurethane adhesives
• Strong adhesion and bonding
• Various substrates• Durability and heat
resistance• Flexibility
• Food packaging• Textiles• Laminates• Tapes• Shoes and consumer
products
Bioplastics Capa-based biodegradable thermoplastics
• Durability• Tear resistance• Printability
• Biopolymer bags and films
• Food packaging• Plasticware• Paper coatings
CapaTM Caprolactone End-Uses and Benefits
6
Source: Company information

Value-creating Acquisition Consistent with Our Strategy
Strategic Rationale Strong, market-leading business focused
on high-growth end-use applications
Complementary fit with Ingevity business model and capabilities
– Technology-focused relationships drive customer intimacy
– Similar manufacturing process and approach
Provides new avenues for strategic growth and value creation
Top-tier financial profile, immediately accretive
7
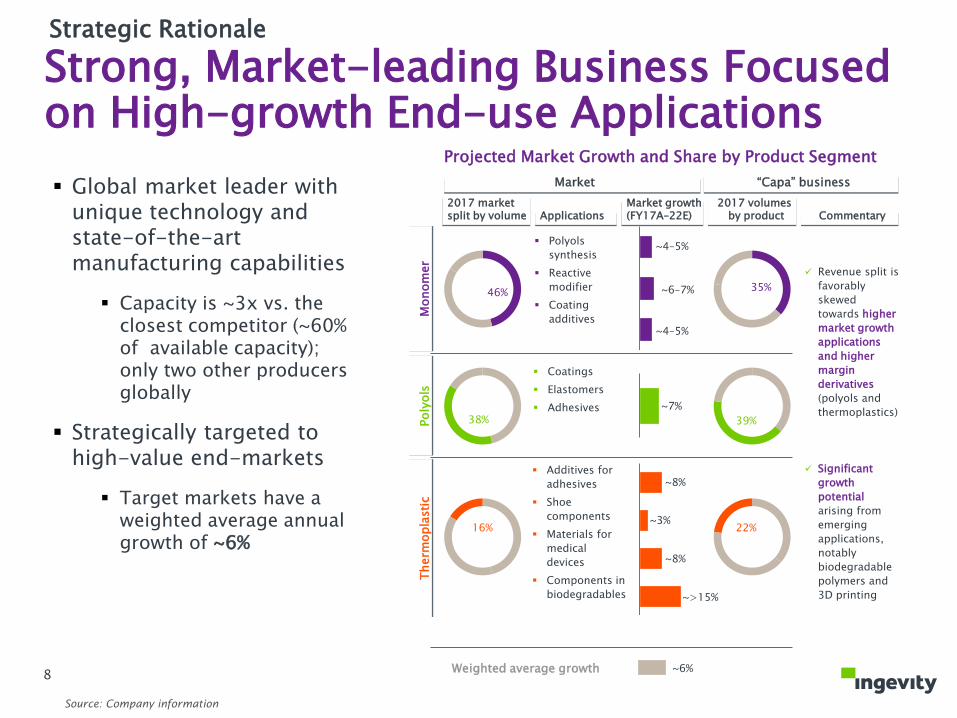
Strong, Market-leading Business Focused on High-growth End-use Applications
125
Projected Market Growth and Share by Product Segment
Monom
er
Poly
ols
Th
erm
opla
sti
c
46%
Polyols
synthesis
Reactive
modifier
Coating
additives
~4–5%
~6–7%
~4–5%
38%
Coatings
Elastomers
Adhesives ~7%
Additives for
adhesives
Shoe
components
Materials for
medical
devices
Components in
biodegradables
~8%
16%~3%
~8%
~>15%
Weighted average growth ~6%
35%
39%
22%
Revenue split is
favorably
skewed
towards higher
market growth
applications
and higher
margin
derivatives
(polyols and
thermoplastics)
Significant
growth
potential
arising from
emerging
applications,
notably
biodegradable
polymers and
3D printing
2017 market split by volume Applications
Market growth (FY17A–22E)
Market
2017 volumesby product
“Capa” business
Commentary
Global market leader with unique technology and state-of-the-art manufacturing capabilities
Capacity is ~3x vs. the closest competitor (~60% of available capacity); only two other producers globally
Strategically targeted to high-value end-markets
Target markets have a weighted average annual growth of ~6%
Source: Company information
8
Strategic Rationale

Technology-focused Relationships Drive Customer Intimacy
9
Resins & Coatings
31%
Adhesives
8%Elastomers
27%
Bioplastics
5%
Caprolactone
and Other
29%
Ingevity
overlap
Revenue by End-use Applications (2018E)
Source: Company information
Deep customer knowledge backed by 40 years of technical expertise and process know-how
Long-standing, loyal customer base with no customer representing more than 10% of sales
Proven expertise to develop tailored applications and technology solutions depending on customer needs
Potential for channel synergies over time in end-use applications where Ingevity participates, particularly coatings and adhesives
Leverage Ingevity corporate and functional resources
Strategic Rationale

Similar Manufacturing Process and Approach“Capa”
Cyclohexanone
Caprolactone
Thermoplastics
Adhesives
Bioplastics
Shoe Counters
Medical Devices
Caprolactone
Polyols
Adhesives
Coatings
Elastomers
Hydrogen
Peroxide
Hexanediol
(HDO)
Caprolactone
Lactides
Coatings
Elastomers
Compounds
3D printing
Black Liquor
SoapSulfuric acid
Rosin Fatty Acid
Rosin Esters
Adhesives
Inks
Paper size
Rubber
emulsifiers
Dimers &
Diacids
Lubricants
Intermediates
Coatings
Raw material Intermediate
Derivatives Co-product
Bio Fractions
Crude Tall Oil
(CTO)
Specialty
Formulations
Pavement
preservation
Evotherm
Oil well
service
additives
Oil
production
chemicals
Caprolactone
Monomer
Source: Company information
BasicProducts
High-Value Derivatives
10
Ingevity Performance Chemicals
Strategic Rationale
Raw Materials

Provides New Avenues for Strategic Growth and Value Creation
11
Continued growth supported by end-market macro trends in core and emerging applications
Biodegradable polymers, medical devices, 3D printing, etc.
Untapped potential for caprolactone to increase penetration via technology substitution within existing key market segments
Strong track record of innovation and new business development
Platform for further bolt on M&A opportunities in strategically-targeted, value-added thermoplastics, resins and bioplastics
Strategic Rationale

Top-tier Financial Profile, Immediately Accretive
12
2013A 2018E
Revenue Growth (2013A – 2018E)
Compelling financial profile: Strong historical growth Sustainable adj. EBITDA
margins in mid-30%s Modest capital intensity
Improves Performance Chemical segment adj. EBITDA margins by ~300bps on 2018 pro forma basis
Accretive to Ingevity overall adj. EBITDA margins by ~100 bps on 2018 pro forma basis
Expands product diversity, global reach and growth platform of Performance Chemicals segment
Expected EPS accretive in year one
Pro forma impact to PC segment revenue mix (1)
Engineered Polymers
19%Industrial Specialties
50%
Oilfield Tech. 12%
PavementTech. 19%
APAC13%
North America
64%
EMEA21%
(1) Last Twelve Month (“LTM”) from Sept. 30, 2018; standalone Ingevity product mix: 61% Industrial Specialties; 15% Oilfield Tech, 24%
Pavement Tech; Standalone Ingevity geographic mix: 73% North America, 15% EMEA; 2% South America; 10% APAC. LTM revenue of Capa
has been derived from unaudited financial records prepared by Capa, without adjustment to conform to the accounting policies and
methodologies used by Ingevity. Refer to the Disclaimer on Slide 2 of this presentation for further information regarding these financial
measures.
Strategic Rationale
South America
2%

Value-creating Acquisition Consistent with Our Strategy Furthers our purpose of purifying, protecting and
enhancing the world around us
Provides a complementary, growth platform in new and existing end-use applications
Business aligned with Ingevity strengths:
• Technology-based customer partnerships
• Reaction / purification process and derivativeproduct approach
Top-tier financial metrics and pro forma impacts translate into compelling value creation opportunity
Financed under existing facilities at comfortable leverage levels; rapid deleveraging given excellent cash generation profile of combined business
Ingevity welcomes the Capa organization and looks forward to building an even stronger Ingevity together!
13

Ingevity Overview

Performance Materials
Performance Chemicals
2017 Sales $349 million $163 million $78 million $382 million
2017 Segment EBITDA (1) $142 million $101 million
Market Position
#1 in automotive #1 or #2#1 or #2 in oil-based
muds#1 or #2
Applications Automotive
Process purification
Pavement preservation
Recycling
Evotherm® technologies
Well Service Additives
Production and Downstream
Adhesives
Agrochemicals
Lubricants
Inks
Intermediates
Select Competitors
Select Customers
Carbon TechnologiesPavement
TechnologiesOilfield Technologies
Where We Compete
(1) Please see appendices included at the end of this presentation for Ingevity's use of non-GAAP financial measures, definitions of those financial
measures as well as the reconciliation to the nearest GAAP financial measure.
Industrial Specialties
15

Revised 2018 Outlook and Guidance
($M)
Item
Current FY18
Guidance
Issued 10/25/2018
Revenue $1,100 to $1,130
Adjusted EBITDA (1)
$306 to $314
Adjusted tax rate (1)
22 - 24%
Capital
expenditures$90 to $95
Free Cash Flow (2)
$120 to $130
Net Debt Ratio (3)
~2.0x
16
PERFORMANCE CHEMICALS:
Continuing recovery in oilfield
Seasonality of pavement technologies
Favorable outlook for industrial specialties, especially in high
margin niches applications
Partial success with tall oil rosin (TOR) price increases
Price improvement in tall oil fatty acid (TOFA)
G-P pine chemicals acquisition synergy acceleration
Higher 4Q outage costs
Modest inflationary cost pressures
Full-year double-digit EBITDA growth
PERFORMANCE MATERIALS:
Continued moderation of revenue growth due to U.S. and
Canada automotive regulatory timing
China early adoption has begun
EU Euro 6d has also started
Significant 4Q outage costs
Modest inflationary cost pressures
Full-year double-digit EBITDA growth
(1) A reconciliation of Net Income to Adjusted EBITDA or Adjusted tax rate as projected for 2018 is not provided because we do not forecast Net Income as we
cannot, without unreasonable effort, estimate or predict with certainty various components of Net Income. These components, net of tax, include additional
separation costs associated with the separation from WestRock; further restructuring and other income (charges), net; additional acquisition and other related
costs associated with the acquisition of Georgia-Pacific’s pine chemical business; and revisions due to future guidance and assessment of U.S. Tax Reform.
Additionally, discrete tax items could drive variability in our projected effective tax rate. All of these components could significantly impact such financial
measures. Further, in the future other items with similar characteristics to those currently included in Adjusted EBITDA, that have a similar impact on
comparability of periods, and which are not known at this time, may exist and impact Adjusted EBITDA.
(2) Non-GAAP measure which represents Cash from Operations expected to range from $210M to $225M for FY2018 less Capital Expenditures.
(3) Defined as total debt including capital lease obligation excluding deferred financing fees less cash and cash equivalents and restricted investment divided by
annual adjusted EBITDA.
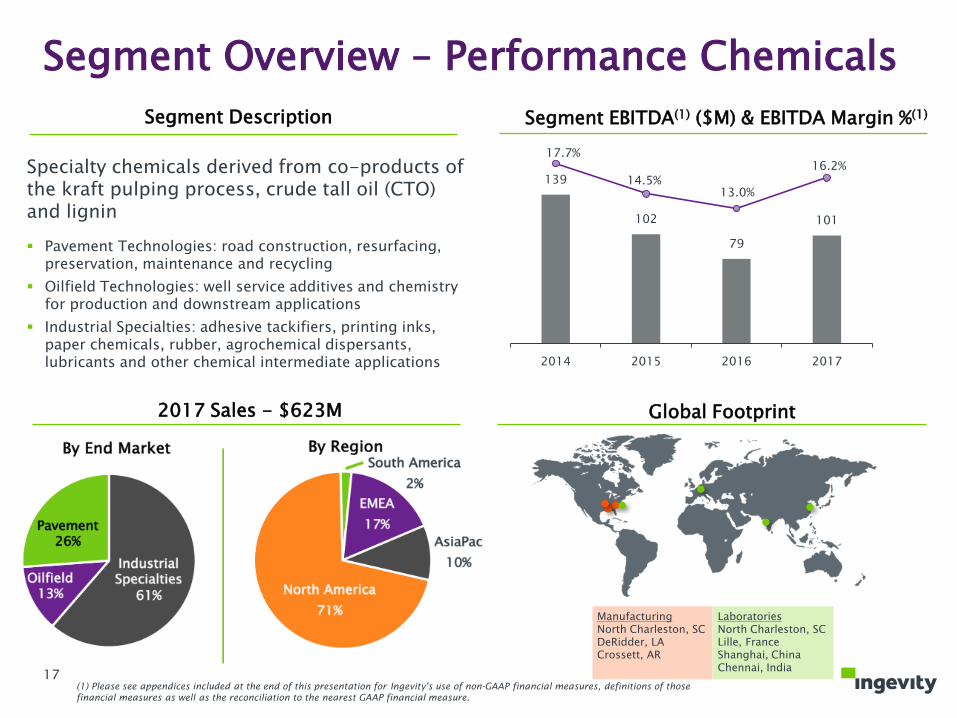
North America
71%
South America
2%
EMEA
17%
AsiaPac
10%Industrial Specialties
61%
Oilfield13%
Pavement26%
Segment Overview – Performance Chemicals
2017 Sales - $623M
By End Market By Region
Segment Description Segment EBITDA(1) ($M) & EBITDA Margin %(1)
ManufacturingNorth Charleston, SCDeRidder, LACrossett, AR
LaboratoriesNorth Charleston, SCLille, FranceShanghai, ChinaChennai, India
Global Footprint
139
102
79
101
17.7%
14.5% 13.0%
16.2%
(1.0%)
4.0%
9.0%
14.0%
19.0%
2014 2015 2016 2017
0
20
40
60
80
100
120
140
160
180
Specialty chemicals derived from co-products of the kraft pulping process, crude tall oil (CTO) and lignin
Pavement Technologies: road construction, resurfacing, preservation, maintenance and recycling
Oilfield Technologies: well service additives and chemistry for production and downstream applications
Industrial Specialties: adhesive tackifiers, printing inks, paper chemicals, rubber, agrochemical dispersants, lubricants and other chemical intermediate applications
17(1) Please see appendices included at the end of this presentation for Ingevity's use of non-GAAP financial measures, definitions of those
financial measures as well as the reconciliation to the nearest GAAP financial measure.

Biorefinery
DerivativeProducts
Pavement preservation
Evotherm (warm mix asphalt)
Asphalt recycling
Oil well service additives
Oil production & downstream chemicals
Rubber emulsifiers
Lubricants
Intermediates
Adhesives
Inks
Paper size
Rubber emulsifiers
Renewable Forests Tall Oil Fatty Acid
IntermediateProducts
Distilled Tall Oil
Tall Oil Rosin
CTO
Pine Chemicals Value ChainEnhanced value from intermediates and derivative products
18

Business Overview – Pavement Technologies
2017 Sales - $163M
By End Application By Region
Business Description Business Unit Sales
Specialty Additives for Global Asphalt Paving(1)
Construction37%
Preservation63%
132
148 149
163
100
110
120
130
140
150
160
170
2014 2015 2016 2017
Asphalt additives derived from tall oil fatty acid, lignin, amines, surfactants and polymers
Pavement Preservation: emulsifiers for specialty ultra-thin maintenance layers
Evotherm Technologies: additives for road construction in the fast growing category of warm mix asphalt
2022~$600M
2016$400M
Emulsifiers, engineered modifiers, adhesion promoters, warm mix additives, specialty polymers
3 yr CAGR +7.3%
North America
79%
EMEA8%
AsiaPac8%
South America5%
19(1) Management Estimates

North America
86%
EMEA9%
AsiaPac3%
South America2%
Drilling69%
Production31%
Business Overview - Oilfield Technologies
2017 Sales - $78M
By End Application By Region
Business Description Business Unit Sales
2016 Specialty Chemicals for Global Oilfield(1) ($M)
127
78
59
78
0
20
40
60
80
100
120
140
2014 2015 2016 2017
Specialty intermediates and TOFA used in Drilling, Production and Transportation of Crude Oil
Emulsifiers for manufacture of oil-based muds Rheology modifiers and wetting agents for used muds Imidazolines and specialty derivatives for corrosion
inhibition TOFA as raw material by integrated production service
companies TOFA and dimers part of lubricant packages in water-
based muds
(38.5%) +32.8%
(25.0%)
Emulsifiers, rheology modifiers, corrosion inhibitors, cementing agents
Drilling$500
Production$2,300
Cementing &
Stimulation$2,500
20(1) Management Estimates

TOFA & Derivative
23%
Rosin & Derivative
53%
Biofractions, Dispersants,
Other24%
Business Overview – Industrial Specialties
2017 Sales - $382M
By Material By Region
Business Description Business Unit Sales
Global Rosin & Fatty Acids(1)
Industrial chemicals based on tall oil fatty acid, tall oil rosin, and lignin for the following applications:
Tall Oil Rosin Ink resins Adhesives tackifiers Paper sizing Rubber emulsifiers
527 476
400 382
0
100
200
300
400
500
600
2014 2015 2016 2017
Industrial Specialties
(9.7%)
(4.4%)(16.0%)
North America
65%
EMEA22%
AsiaPac11%
South America
2%
Gum Rosin Resin 38%
TOR Resin16%
Terpene Resin 3%
Hydrocarbon Resin 43%
Global Resins – 2,400KT
TOFA<1%
Tallow 4%
Sunflower10%
Canola17%
Soybean29%
Palm40%
Select Fatty Acids –175KT
Tall Oil Fatty Acid Lubricants Coatings Cleaners
Biofractions Pharma phytosterols Renewable energy Roofing
Lignin Agchem dispersants Dyes dispersants
21(1) Management Estimates

Automotive
89%
Process
Purification
11% AsiaPac23%
EMEA13%
South America1%
North America63%
Segment Overview – Performance Materials
2017 Sales
By End Market By Region
Segment Description Segment EBITDA(1) ($M) & EBITDA Margin %(1)
Global Footprint
97 88
123
142 38.8%
34.4%
41.0% 40.6%
17.0%
22.0%
27.0%
32.0%
37.0%
42.0%
2014 2015 2016 2017
0
20
40
60
80
100
120
140
160
180Specialty wood-based, chemically activated carbons engineered to have the optimal porosity for gasoline evaporative emissions control:
Canisters - High capacity and superior durability granular and pellet activated carbons
“Near Zero” Canister Solutions - Activated carbon honeycombs and bulk media to control diffusion emissions
Air Intake Systems - Activated carbon sheets and honeycombs to control engine diffusion emissions
Powdered activated carbons used in purification processes for water treatment, food & beverage and chemical & pharmaceutical applications
ActivationCovington, VAWickliffe, KYZhuhai, China
Pellet ExtrusionCovington, VAWujiang, ChinaZhuhai, China
HoneycombWaynesboro, GA (JV)
Labs/Testing:North Charleston, SCZhuhai, China
(1) Please see appendices included at the end of this presentation for Ingevity's use of non-GAAP financial measures, definitions of those
financial measures as well as the reconciliation to the nearest GAAP financial measure.
22

25-35 grams/day
1970–80s technology / 0.5-1.0LOne Day Parking
1990s technology / 2.0-3.0L• Multi-day parking & running loss• Plus refueling control
Modern technology“Near Zero”2.0-3.0L + scrubber
India - China - Europe Japan - Brazil - S. Korea
US & Canada (current)China (July 2020)
U.S. & Canada (phase in 2017-2022)
Control TechnologyEmission Sources and Impact
Products That Enable Regulatory Compliance75%(1) of the world’s gasoline vehicles are currently using 70s-80s technology
Parking
13 grams/
hour driving
Running loss
75 ml / refueling
Refueling
(1) IHS
Globally, 8M gallons per day “back in the tank”
+
+
=

19%
Vehicle Sales Distribution and China 6 Adoption MapEstimated Percentages of 2019 China 6
Light Vehicle (LV) Sales
Based on Published Announcements
Yangtze
River
Delta
Pearl River
Delta
Fenwei
Plain
Chengdu-
Chongqing
Area
Henan7.0%
6.5%
Hainan0.7%
7.1%
4.1%3.0%
20.7%
Tianjin1.1%
5.9%Guangzhou
2.5%Shenzhen1.8%
Data Source: IHS, China Car Insurance Data, Ingevity estimate
Methodology: 2018 H1 sales percentages
http://www.gov.cn/xinwen/2018-07/03/content_5303212.htm
http://www.gov.cn/zhengce/content/2018-07/03/content_5303158.htm
As of Jan 1, 2019, ~8% of new LVs
sold will be expected to be China 6 compliant
As of July 1, 2019, ~63% of new LVs sold will be
expected to be China 6 compliant
Beijing1.9%
~8% ~8%
~44%
~11%
January-June2019
July-December2019
2019 LV Sales Forecast = ~26.5 million
Estimated Early China 6 Implementation
Hebei
In addition to the January 1, 2019 announced regions/cities, the China State Council has directed many major cities and areas to adopt China 6 by July 1, 2019
Effective Jan 1, 2019 (Hainan,Tianjin,Guangzhou, Shenzhen, Shandong 7 cities)
Effective July 1, 2019 (entire region)
Effective July 1, 2019 (State Council selected provinces and/or cities)
No later than July 1, 2020
Effective Jan 1, 2020 (Beijing,Tianjin)
Shandong 7 cities3.0%
https://www.henan.gov.cn/2018/09-21/692225.html
http://zfgb.tj.gov.cn/2018/system/2018/08/30/010002405.shtml
http://hebei.hebnews.cn/2018-08/28/content_7007692.htm
http://www.dtdjzx.gov.cn/staticPage/zcfg/sdzcwj/20180808/2458231.html

Adsorbed Natural Gas (ANG)Market drivers provide tremendous growth potential and deliver value across a range of vehicle users
Per-vehicle carbon content for
ANG is 100x an automotive
emissions control canister
Ingevity’s carbon adsorbents enable safe, low-pressure storage of natural gas
A hybrid, bi-fuel vehicle can service 75% of daily usage miles with natural gasoline
“At home” refueling leverages the infrastructure network already available in nearly 60 million U.S. homes and over 5 million businesses
Fuel savings for natural gas users range from $1.00 to $1.50 per gasoline gallon equivalent (GGE) compared to conventional gasoline1
Safety
Range
Convenience
Value
Auto Canister: 2 pounds ANG Monolith: 200 pounds
Value delivered to key stakeholders
Natural Gas Utility Infrastructure utilization
Natural Gas Producer Increased gas demand
Automotive OEMa) Alternative fuel option where
EVs are challengedb) Bi-fuel with a single powertrain
Vehicle Owner Sustainable fuel savings for individual and fleet operations
ANG has 2x NG volume at 900 psi
1Assumes $2.50/gal average gasoline price and $1.00/GGE natural gas cost (US Energy Information Administration)
25

Appendix
26

Non-GAAP Financial MeasuresIngevity has presented certain financial measures, defined below, which have not been prepared in accordance with U.S.
generally accepted accounting principles (“GAAP”) and has provided a reconciliation to the most directly comparable financial
measure calculated in accordance with GAAP. These financial measures are not meant to be considered in isolation or as a
substitute for the most directly comparable financial measure calculated in accordance with GAAP. The company believes
these non-GAAP measures provide investors, potential investors, securities analysts and others with useful information to
evaluate the performance of the business, because such measures, when viewed together with our financial results computed
in accordance with GAAP, provide a more complete understanding of the factors and trends affecting our historical financial
performance and projected future results.
Ingevity uses the following non-GAAP measures:
Adjusted EBITDA is defined as net income (loss) plus provision for income taxes, interest expense, depreciation and
amortization, separation costs and restructuring and other (income) charges.
Adjusted EBITDA Margin is defined as Adjusted EBITDA divided by Net Sales
Segment EBITDA is defined as segment operating profit plus depreciation and amortization.
Segment EBITDA Margin is defined as Segment EBITDA divided by Net Sales.
The Company also uses the above financial measures as the primary measures of profitability used by managers of the
business and its segments. In addition, the Company believes Adjusted EBITDA, Adjusted EBITDA Margin, Segment EBITDA
and Segment EBITDA Margin are useful measures because they exclude the effects of financing and investment activities as
well as non-operating activities. These non-GAAP financial measures are not intended to replace the presentation of financial
results in accordance with GAAP and investors should consider the limitations associated with these non-GAAP measures,
including the potential lack of comparability of these measures from one company to another. Reconciliations of these non-
GAAP financial measures are set forth within the following pages.
27
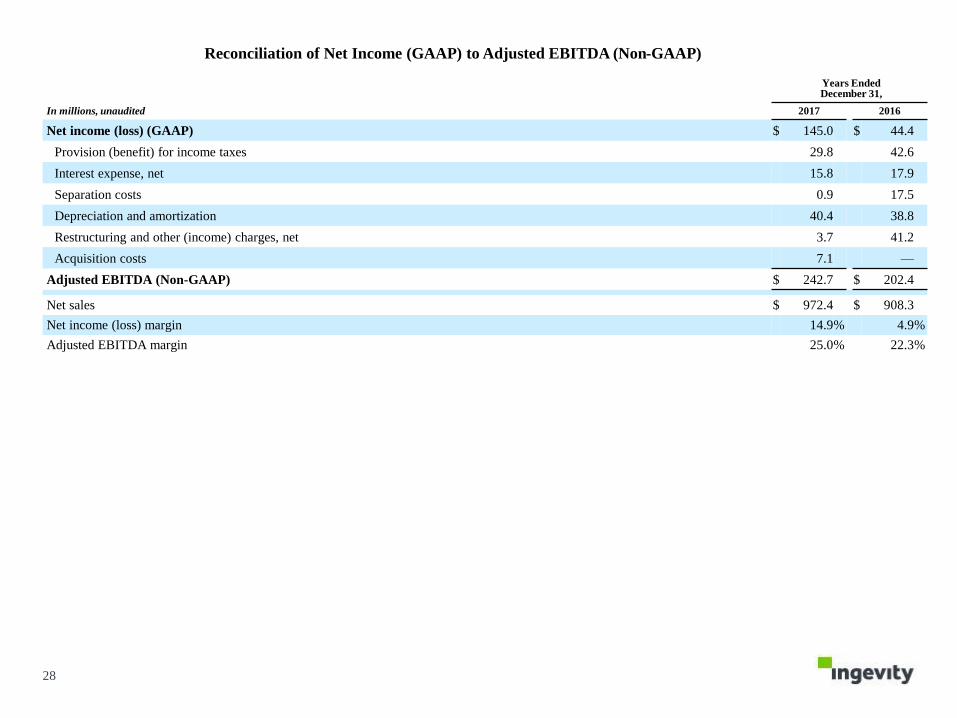
Reconciliation of Net Income (GAAP) to Adjusted EBITDA (Non-GAAP)
28
Years EndedDecember 31,
In millions, unaudited 2017 2016
Net income (loss) (GAAP) $ 145.0 $ 44.4
Provision (benefit) for income taxes 29.8 42.6
Interest expense, net 15.8 17.9
Separation costs 0.9 17.5
Depreciation and amortization 40.4 38.8
Restructuring and other (income) charges, net 3.7 41.2
Acquisition costs 7.1 —
Adjusted EBITDA (Non-GAAP) $ 242.7 $ 202.4
Net sales $ 972.4 $ 908.3
Net income (loss) margin 14.9% 4.9%
Adjusted EBITDA margin 25.0% 22.3%

Reconciliation of Segment Operating Profit (GAAP) to Segment EBITDA (Non-GAAP)
29
In millions (unaudited)Years EndedDecember 31,
Performance Materials 2017 2016
Segment operating profit (GAAP) $ 122.0 $ 106.9
Depreciation and amortization 19.8 16.4
Segment EBITDA (Non-GAAP) $ 141.8 $ 123.3
Net sales $ 349.3 $ 301.0
Segment operating margin 34.9% 35.5%
Segment EBITDA margin 40.6% 41.0%
Performance Chemicals
Segment operating profit (GAAP) $ 80.3 $ 56.7
Depreciation and amortization 20.6 22.4
Segment EBITDA (Non-GAAP) $ 100.9 $ 79.1
Net sales $ 623.1 $ 607.3
Segment operating margin 12.9% 9.3%
Segment EBITDA margin 16.2% 13.0%

Unaudited Pro Forma Segment EBITDA
30
Performance Materials
In millionsPro Forma
AdjustmentsUnaudited
Pro Forma
Segment operating profit (GAAP) $ 79.7 $ (2.7) (A) $ 77.0
Depreciation and amortization 11.1 11.1
Segment EBITDA (Non-GAAP) $ 90.8 $ 88.1
Performance Chemicals
In millionsPro Forma
AdjustmentsUnaudited
Pro Forma
Segment operating profit (GAAP) $ 86.6 $ (7.9) (A) $ 78.7
Depreciation and amortization 23.5 23.5
Segment EBITDA (Non-GAAP) $ 110.1 $ 102.2
Adjusted EBITDA (Non-GAAP) (B) $ 200.9 $ 190.3
The following unaudited pro forma measures are derived from the historical financial statements of Ingevity, prepared in accordance with U.S. generally
accepted accounting principles. These unaudited pro forma measures include adjustments required by SEC Staff Accounting Bulletin Topic 1:B-3 and Article
11 of SEC Regulation S-X. For more information regarding the Ingevity’s unaudited pro forma combined statements of operations for the year ended
December 31, 2015, see “unaudited pro forma combined financial statements” in the Ingevity’s registration statement on Form 10 and amendments thereto
(the “Form 10”), copies of which may be obtained by visiting the web site of the Securities and Exchange Commission, or the SEC, at www.sec.gov. Pro
forma adjustments give effect as if the adjustments had occurred on January 1, the first day of each respective fiscal year.
Reconciliation of Segment Operating Profit (GAAP) to Pro Forma Segment EBITDA (Non-GAAP)Year Ended December 31, 2015
(A) We have entered into agreements to obtain audit and certain compliance functions as a stand-alone public company as well as compensation agreements with certain members of our executive
team. Prior to the completion of the separation, we will also enter into agreements to obtain insurance coverage according to quotations we have received based on our individual loss history, credit
profile and selected insurance coverage. These expenses will represent recurring costs in excess of the amounts historically allocated to Ingevity.
(B) Adjusted EBITDA is the sum of Performance Materials and Performance Chemicals Segment EBITDA

Unaudited Pro Forma Segment EBITDA
31
Performance Materials
In millionsPro Forma
AdjustmentsUnaudited
Pro Forma
Segment operating profit (GAAP) $ 89.5 $ (2.6) (A) $ 86.9
Depreciation and amortization 9.9 9.9
Segment EBITDA (Non-GAAP) $ 99.4 $ 96.8
Performance Chemicals
In millionsPro Forma
AdjustmentsUnaudited
Pro Forma
Segment operating profit (GAAP) $ 123.8 $ (7.2) (A) $ 116.6
Depreciation and amortization 22.4 22.4
Segment EBITDA (Non-GAAP) $ 146.2 $ 139.0
Adjusted EBITDA (Non-GAAP) (B) $ 245.6 $ 235.8
Reconciliation of Segment Operating Profit (GAAP) to Pro Forma Segment EBITDA (Non-GAAP)Year Ended December 31, 2014
(A) We have entered into agreements to obtain audit and certain compliance functions as a stand-alone public company as well as compensation agreements with certain members of our executive
team. Prior to the completion of the separation, we will also enter into agreements to obtain insurance coverage according to quotations we have received based on our individual loss history, credit
profile and selected insurance coverage. These expenses will represent recurring costs in excess of the amounts historically allocated to Ingevity.
(B) Adjusted EBITDA is the sum of Performance Materials and Performance Chemicals Segment EBITDA