inglewood usd - myiusd.net · sarc la tijera k-8 academy of excellence charter school 2...
TRANSCRIPT

SARC2015-16
School Accountability Report Card
Published in 2016-17
Para español, visita: http://iusd.net
Inglewood USDDr. Vincent Matthews, Superintendent • [email protected] • Phone: (310) 419-2700
Inglewood Unified School District • 401 South Inglewood Avenue Inglewood, CA 90301 • http://iusd.net
La Tijera K-8 Academy of
Excellence Charter School
Ugema Hosea-James Principal
1415 North La Tijera Boulevard Inglewood, CA 90302
Grades: K-8 Phone: (310) 680-5260
www.latijera.iusd.net
CDS Code: 19-64634-6014518

La Tijera K-8 Academy of Excellence Charter SchoolSARC 2
Principal’s MessageLa Tijera K-8 Academy of Excellence Charter School is dedicated to building a safe, compassionate com-munity of lifelong learners who are inspired to become respectful, responsible, cooperative, innovative and productive citizens. We envision a structured 21st century community of learners who are caring and respect-ful, hardworking and responsible, collaborative and cooperative, and actively participating in their education. Our school and district share a common focus for the quality education we provide for every student and will be continuing our work with the Common Core State Standards as the framework for this focus. La Tijera has high expectations for all students and will provide quality instruction while assisting every student in reaching his or her full potential.
La Tijera offers many opportunities for the whole child. We have had very successful years in both boys’ and girls’ basketball and girls’ volleyball. Our school has multiple productions throughout the year, including a Holiday Performance, the Black History Month Performance and an annual school play. La Tijera students participate in character-building clubs, such as Debutantes and Gents and Peer Mediation, and our ever-growing music program teaches the recorder and the keyboard. Addressing the whole student has helped La Tijera become a successful and important member of the community.
School Accountability Report Card
In accordance with state and federal requirements, the School Accountability
Report Card (SARC) is put forth annually by all public schools as a tool for parents and interested parties to stay informed of
the school’s progress, test scores and achievements.
Parental InvolvementWe have many ways for parents to participate in the life of our school, and we depend on parents to keep our programs running smoothly. Parents may join our School Site Council (SSC), which works with administration and staff to help make financial decisions. Parents of English learners are a part of the English Language Advisory Council (ELAC). Parent volunteers help with special projects in the classroom and chaperone on field trips. All parent volunteers are invited to a parent field trip at the end of the year. We ask all parents to attend and participate in all school activities such as Career Day, Read Across America, back-to-school night in the fall, open house in the spring and parent-teacher conferences in November.
For more information on how to become involved, please contact Mrs. Subrina Miller, community liaison, at (310) 680-5260 and [email protected], or Mrs. Stephanie Fortunato, ELAC and SSC coordinator, at [email protected].
School SafetySecurity and staff monitor the school during school hours and before and after school. Teachers regularly review the rules for safe, responsible behavior in school and on the playground. We have a closed campus that is fully fenced in. Visitors must stop by the main office to sign in and receive a badge to wear throughout their stay.
We revise our school safety plan annually. The plan includes procedures for natural catastrophes, emergencies and exit routes. The plan also includes inventories of emergency supplies and is available in the office for all stakeholders to review. The plan is shared with all staff during a schoolwide meeting. Fire drills are held monthly and earthquake drills quarterly. The school safety plan was most recently reviewed and updated in January 2017.
Vision StatementThe vision of the Inglewood Unified
School District is to provide a learning environment that empowers all students to acquire the academic and social skills
needed to become productive citizens and lifelong learners in a global economy.
Mission StatementThe mission of the Inglewood Unified School District is to ensure that all our
students are taught rigorous standards-based curriculum supported by highly
qualified staff in an exemplary educational system characterized by high student
achievement, social development, safe schools and effective partnerships with all
segments of the community.
“Working at La Tijera K-8 Academy of Excellence has been a pleasure. Students show their school pride in the way they participate in school
activities and participate in all instructional environments. Parents support the school activities and programs while helping maintain our high standards. Finally, the staff at La Tijera K-8 Academy of Excellence
understands how their roles are an integral part of each child’s education, and they strive to provide the highest quality experience for all students.”
Public Internet AccessInternet access is available at public libraries and other locations that are publicly accessible (e.g., the Califor-nia State Library). Access to the internet at libraries and public locations is generally provided on a first-come, first-served basis. Other use restrictions include the hours of operation, the length of time that a workstation may be used (depending on availability), the types of software programs available at a workstation, and the ability to print documents.
La Tijera K-8 Academy of Excellence Charter SchoolSARC 3
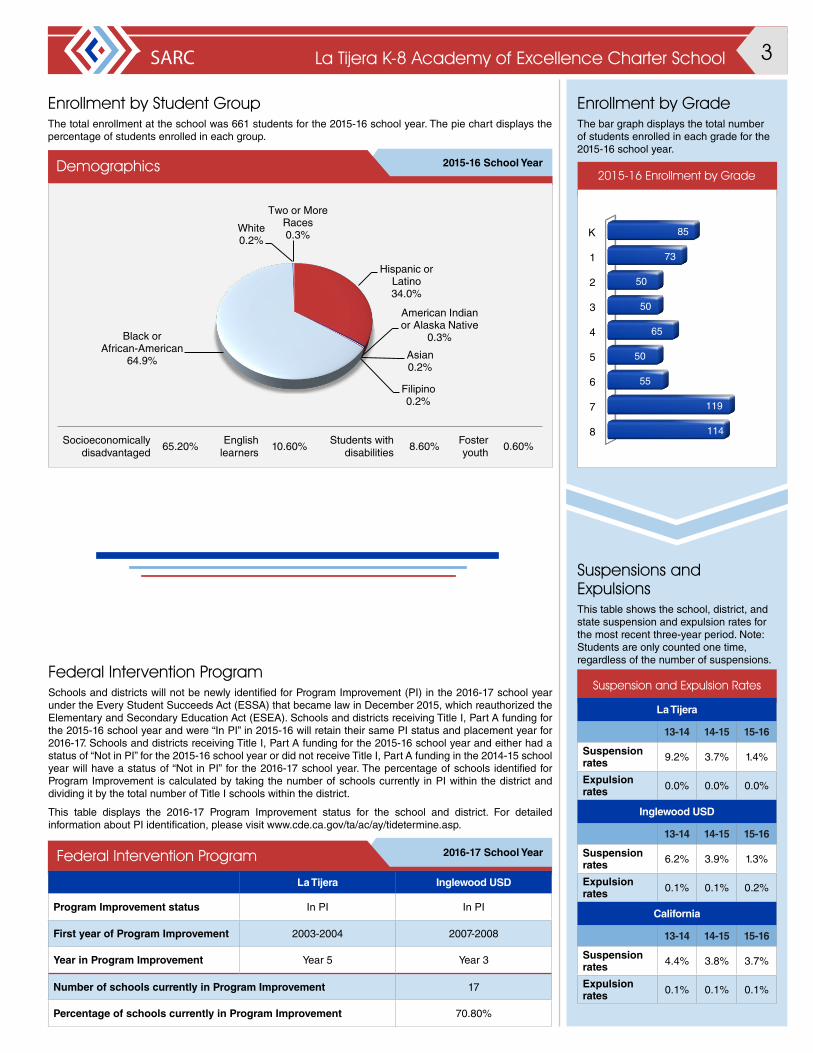
Suspensions and ExpulsionsThis table shows the school, district, and state suspension and expulsion rates for the most recent three-year period. Note: Students are only counted one time, regardless of the number of suspensions.
Suspension and Expulsion Rates
La Tijera
13-14 14-15 15-16
Suspension rates 9.2% 3.7% 1.4%
Expulsion rates 0.0% 0.0% 0.0%
Inglewood USD
13-14 14-15 15-16
Suspension rates 6.2% 3.9% 1.3%
Expulsion rates 0.1% 0.1% 0.2%
California
13-14 14-15 15-16
Suspension rates 4.4% 3.8% 3.7%
Expulsion rates 0.1% 0.1% 0.1%
Enrollment by Student GroupThe total enrollment at the school was 661 students for the 2015-16 school year. The pie chart displays the percentage of students enrolled in each group.
2015-16 School YearDemographics
Socioeconomically disadvantaged
65.20%English
learners10.60%
Students with disabilities
8.60%Foster youth
0.60%
Hispanic or Latino34.0%
American Indian or Alaska Native
0.3%
Asian0.2%
Filipino0.2%
Black or African-American
64.9%
White0.2%
Two or More Races0.3%
Enrollment by GradeThe bar graph displays the total number of students enrolled in each grade for the 2015-16 school year.
2015-16 Enrollment by Grade
K
1
2
3
4
5
6
7
8
85
73
50
50
65
50
55
119
114
La Tijera Inglewood USD
Program Improvement status In PI In PI
First year of Program Improvement 2003-2004 2007-2008
Year in Program Improvement Year 5 Year 3
Number of schools currently in Program Improvement 17
Percentage of schools currently in Program Improvement 70.80%
2016-17 School YearFederal Intervention Program
Federal Intervention ProgramSchools and districts will not be newly identified for Program Improvement (PI) in the 2016-17 school year under the Every Student Succeeds Act (ESSA) that became law in December 2015, which reauthorized the Elementary and Secondary Education Act (ESEA). Schools and districts receiving Title I, Part A funding for the 2015-16 school year and were “In PI” in 2015-16 will retain their same PI status and placement year for 2016-17. Schools and districts receiving Title I, Part A funding for the 2015-16 school year and either had a status of “Not in PI” for the 2015-16 school year or did not receive Title I, Part A funding in the 2014-15 school year will have a status of “Not in PI” for the 2016-17 school year. The percentage of schools identified for Program Improvement is calculated by taking the number of schools currently in PI within the district and dividing it by the total number of Title I schools within the district.
This table displays the 2016-17 Program Improvement status for the school and district. For detailed information about PI identification, please visit www.cde.ca.gov/ta/ac/ay/tidetermine.asp.
La Tijera K-8 Academy of Excellence Charter SchoolSARC 4
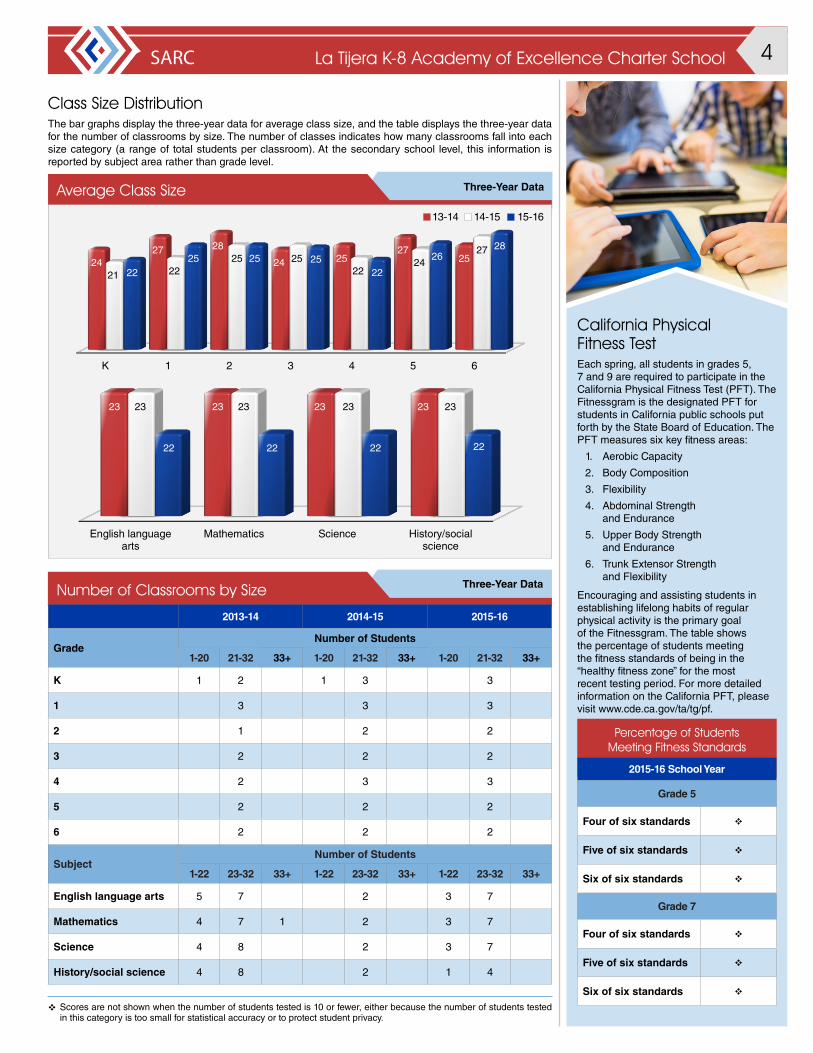
California Physical Fitness TestEach spring, all students in grades 5, 7 and 9 are required to participate in the California Physical Fitness Test (PFT). The Fitnessgram is the designated PFT for students in California public schools put forth by the State Board of Education. The PFT measures six key fitness areas:
1. Aerobic Capacity
2. Body Composition
3. Flexibility
4. Abdominal Strength and Endurance
5. Upper Body Strength and Endurance
6. Trunk Extensor Strength and Flexibility
Encouraging and assisting students in establishing lifelong habits of regular physical activity is the primary goal of the Fitnessgram. The table shows the percentage of students meeting the fitness standards of being in the “healthy fitness zone” for the most recent testing period. For more detailed information on the California PFT, please visit www.cde.ca.gov/ta/tg/pf.
Percentage of Students Meeting Fitness Standards
2015-16 School Year
Grade 5
Four of six standards v
Five of six standards v
Six of six standards v
Grade 7
Four of six standards v
Five of six standards v
Six of six standards v
Class Size DistributionThe bar graphs display the three-year data for average class size, and the table displays the three-year data for the number of classrooms by size. The number of classes indicates how many classrooms fall into each size category (a range of total students per classroom). At the secondary school level, this information is reported by subject area rather than grade level.
14-1513-14 15-16
Three-Year DataAverage Class Size
Three-Year DataNumber of Classrooms by Size
2013-14 2014-15 2015-16
GradeNumber of Students
1-20 21-32 33+ 1-20 21-32 33+ 1-20 21-32 33+
K 1 2 1 3 3
1 3 3 3
2 1 2 2
3 2 2 2
4 2 3 3
5 2 2 2
6 2 2 2
SubjectNumber of Students
1-22 23-32 33+ 1-22 23-32 33+ 1-22 23-32 33+
English language arts 5 7 2 3 7
Mathematics 4 7 1 2 3 7
Science 4 8 2 3 7
History/social science 4 8 2 1 4
v Scores are not shown when the number of students tested is 10 or fewer, either because the number of students tested in this category is too small for statistical accuracy or to protect student privacy.
K 1 2 3 4 5 6
2427 28
24 2527
25
21 2225 25
2224
27
2225 25 25
22
2628
English languagearts
Mathematics Science History/socialscience
23 23 23 2323 23 23 23
22 22 22 22

La Tijera K-8 Academy of Excellence Charter SchoolSARC 5
v Scores are not shown when the number of students tested is 10 or fewer, either because the number of students tested in this category is too small for statistical accuracy or to protect student privacy.
California Assessment of Student Performance and Progress (CAASPP)For the 2015-16 school year, the CAASSP consists of several key components, including:
California Alternate Assessment (CAA) test includes both ELA/literacy and mathematics in grades 3-8 and 11. The CAA is given to those students with significant cognitive disabilities which prevent them from taking the Smarter Balanced Assessments with universal tools, designated supports or accommodations.
Smarter Balanced Assessments include ELA/literacy in grades 3-8 and 11. Smarter Balanced Assessments are designed to measure student progress toward college and career readiness.
The assessments under CAASPP show how well students are doing in relation to the state-adopted content standards. On each of these assessments, student aggregate scores are reported as achievement standards. For more information on the CAASPP assessments, please visit www.cde.ca.gov/ta/tg/ca.
CAASPP Test Results for All Students: English Language Arts/Literacy and Mathematics (grades 3-8 and 11)The table below shows the percentage of students meeting or exceeding the state standards in English language arts (ELA) and literacy and mathematics.
Two-Year DataPercentage of Students Meeting or Exceeding State Standards
La Tijera Inglewood USD California
Subject 14-15 15-16 14-15 15-16 14-15 15-16
English language arts/literacy 38% 47% 28% 33% 44% 48%
Mathematics 17% 20% 17% 19% 33% 36%
CAASPP by Student Group: English Language Arts/Literacy and MathematicsThe tables on the following pages display the percentage of students that met or exceeded state standards in English language arts and mathematics for the school by student groups for grades 3-8.
The “percentage met or exceeded” is calculated by taking the total number of students who met or exceeded the standard on the Smarter Balanced Summative Assessment plus the total number of students who met the standard on the CAAs divided by the total number of students who participated in both assessments.
Note: The number of students tested includes all students who participated in the test whether they received a score or not. However, the number of students tested is not the number that was used to calculate the achievement level percentages. The achievement level percentages are calculated using only students who received scores.
CAASPP Test Results by Student Group: Science (grades 5, 8 and 10)Science test results include CSTs, CMA, and CAPA in grades 5, 8, and 10. The “Proficient or Advanced” is calculated by taking the total number of students who scored proficient or Advanced on the science assess-ment divided by the total number of students with valid scores.
2015-16 School YearPercentage of Students Scoring at Proficient or Advanced
Group Total Enrollment
Number of Students with Valid Scores
Percentage of Students with Valid Scores
Percentage Proficient or Advanced
All students 171 168 98.25% 44.05%
Male 83 83 100.00% 46.99%
Female 88 85 96.59% 41.18%
Black or African-American 103 100 97.09% 41.00%
American Indian or Alaska Native v v v v
Asian v v v v
Filipino v v v v
Hispanic or Latino 68 68 100.00% 48.53%
Native Hawaiian or Pacific Islander v v v v
White v v v v
Two or more races v v v v
Socioeconomically disadvantaged 129 129 100.00% 45.74%
English learners 18 18 100.00% 27.78%
Students with disabilities 16 15 93.75% 40.00%
Students receiving Migrant Education services v v v v
Foster youth v v v v
CAASPP Test Results for All Students: Science (grades 5, 8 and 10)Science test results include California Standards Tests (CSTs), California Modified Assessment (CMA) and California Alternate Performance Assessment (CAPA) in grades 5, 8 and 10. The tables show the percentage of students scoring at proficient or advanced.
Three-Year DataPercentage of Students Scoring at Proficient or Advanced
La Tijera Inglewood USD California
Subject 13-14 14-15 15-16 13-14 14-15 15-16 13-14 14-15 15-16
Science 32% 45% 44% 37% 34% 39% 60% 56% 54%

La Tijera K-8 Academy of Excellence Charter SchoolSARC 6
CAASPP Results by Student Group: English Language Arts and Mathematics - Grade 3
Percentage of Students Meeting or Exceeding State Standards 2015-16 School Year
English Language Arts: Grade 3
Group Total Enrollment Number Tested Percentage Tested Percentage Met or Exceeded
All students 50 49 98.00% 54.20%
Male 20 20 100.00% 40.00%
Female 30 29 96.70% 64.30%
Black or African-American 38 37 97.40% 59.50%
American Indian or Alaska Native v v v v
Asian v v v v
Filipino v v v v
Hispanic or Latino 11 11 100.00% 40.00%
Native Hawaiian or Pacific Islander v v v v
White v v v v
Two or more races v v v v
Socioeconomically disadvantaged 40 40 100.00% 48.70%
English learners v v v v
Students with disabilities v v v v
Students receiving Migrant Education services v v v v
Foster youth v v v v
Mathematics: Grade 3
Group Total Enrollment Number Tested Percentage Tested Percentage Met or Exceeded
All students 50 49 98.00% 39.60%
Male 20 20 100.00% 30.00%
Female 30 29 96.70% 46.40%
Black or African-American 38 37 97.40% 46.00%
American Indian or Alaska Native v v v v
Asian v v v v
Filipino v v v v
Hispanic or Latino 11 11 100.00% 20.00%
Native Hawaiian or Pacific Islander v v v v
White v v v v
Two or more races v v v v
Socioeconomically disadvantaged 40 40 100.00% 38.50%
English learners v v v v
Students with disabilities v v v v
Students receiving Migrant Education services v v v v
Foster youth v v v v
v Scores are not shown when the number of students tested is 10 or fewer, either because the number of students tested in this category is too small for statistical accuracy or to protect student privacy.

La Tijera K-8 Academy of Excellence Charter SchoolSARC 7
CAASPP Results by Student Group: English Language Arts and Mathematics - Grade 4
Percentage of Students Meeting or Exceeding State Standards 2015-16 School Year
English Language Arts: Grade 4
Group Total Enrollment Number Tested Percentage Tested Percentage Met or Exceeded
All students 67 65 97.00% 43.10%
Male 42 41 97.60% 34.20%
Female 25 24 96.00% 58.30%
Black or African-American 51 50 98.00% 42.00%
American Indian or Alaska Native v v v v
Asian v v v v
Filipino v v v v
Hispanic or Latino 15 15 100.00% 46.70%
Native Hawaiian or Pacific Islander v v v v
White v v v v
Two or more races v v v v
Socioeconomically disadvantaged 41 41 100.00% 46.30%
English learners v v v v
Students with disabilities v v v v
Students receiving Migrant Education services v v v v
Foster youth v v v v
Mathematics: Grade 4
Group Total Enrollment Number Tested Percentage Tested Percentage Met or Exceeded
All students 67 65 97.00% 30.80%
Male 42 41 97.60% 26.80%
Female 25 24 96.00% 37.50%
Black or African-American 51 50 98.00% 26.00%
American Indian or Alaska Native v v v v
Asian v v v v
Filipino v v v v
Hispanic or Latino 15 15 100.00% 46.70%
Native Hawaiian or Pacific Islander v v v v
White v v v v
Two or more races v v v v
Socioeconomically disadvantaged 41 41 100.00% 29.30%
English learners v v v v
Students with disabilities v v v v
Students receiving Migrant Education services v v v v
Foster youth v v v v
v Scores are not shown when the number of students tested is 10 or fewer, either because the number of students tested in this category is too small for statistical accuracy or to protect student privacy.
La Tijera K-8 Academy of Excellence Charter SchoolSARC 8
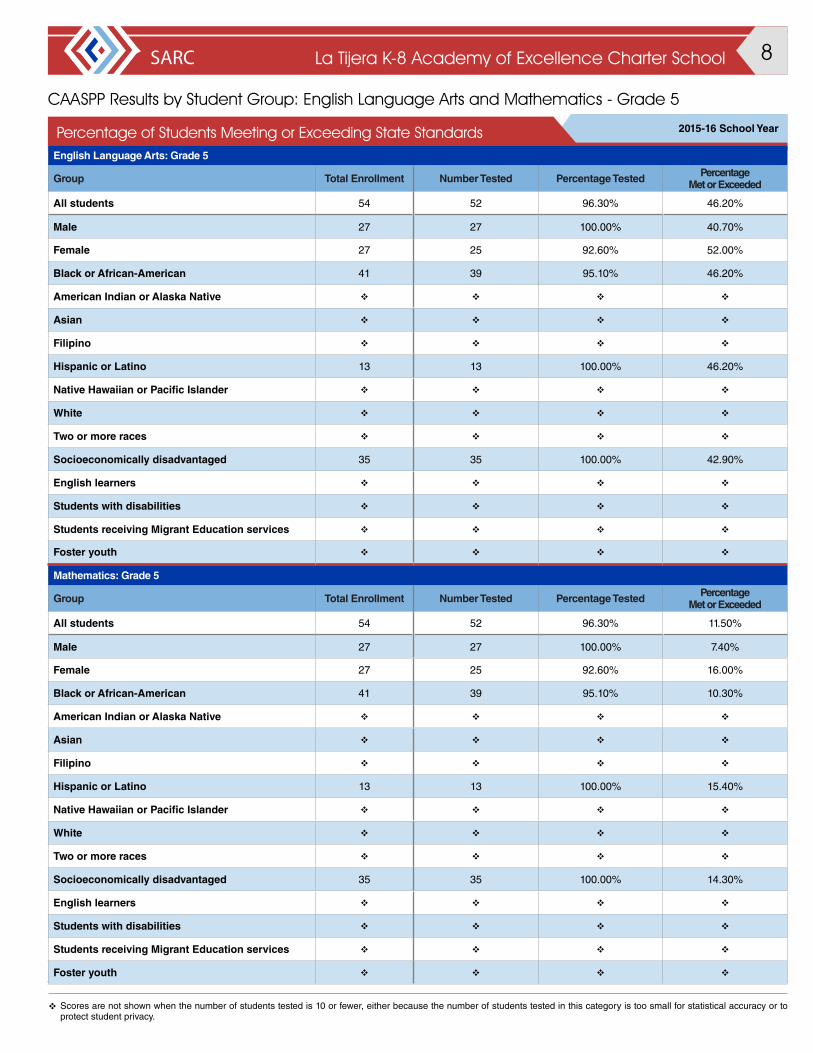
CAASPP Results by Student Group: English Language Arts and Mathematics - Grade 5
Percentage of Students Meeting or Exceeding State Standards 2015-16 School Year
English Language Arts: Grade 5
Group Total Enrollment Number Tested Percentage Tested Percentage Met or Exceeded
All students 54 52 96.30% 46.20%
Male 27 27 100.00% 40.70%
Female 27 25 92.60% 52.00%
Black or African-American 41 39 95.10% 46.20%
American Indian or Alaska Native v v v v
Asian v v v v
Filipino v v v v
Hispanic or Latino 13 13 100.00% 46.20%
Native Hawaiian or Pacific Islander v v v v
White v v v v
Two or more races v v v v
Socioeconomically disadvantaged 35 35 100.00% 42.90%
English learners v v v v
Students with disabilities v v v v
Students receiving Migrant Education services v v v v
Foster youth v v v v
Mathematics: Grade 5
Group Total Enrollment Number Tested Percentage Tested Percentage Met or Exceeded
All students 54 52 96.30% 11.50%
Male 27 27 100.00% 7.40%
Female 27 25 92.60% 16.00%
Black or African-American 41 39 95.10% 10.30%
American Indian or Alaska Native v v v v
Asian v v v v
Filipino v v v v
Hispanic or Latino 13 13 100.00% 15.40%
Native Hawaiian or Pacific Islander v v v v
White v v v v
Two or more races v v v v
Socioeconomically disadvantaged 35 35 100.00% 14.30%
English learners v v v v
Students with disabilities v v v v
Students receiving Migrant Education services v v v v
Foster youth v v v v
v Scores are not shown when the number of students tested is 10 or fewer, either because the number of students tested in this category is too small for statistical accuracy or to protect student privacy.

La Tijera K-8 Academy of Excellence Charter SchoolSARC 9
CAASPP Results by Student Group: English Language Arts and Mathematics - Grade 6
Percentage of Students Meeting or Exceeding State Standards 2015-16 School Year
English Language Arts: Grade 6
Group Total Enrollment Number Tested Percentage Tested Percentage Met or Exceeded
All students 55 54 98.20% 53.70%
Male 27 27 100.00% 51.85%
Female 28 27 96.40% 55.56%
Black or African-American 42 42 100.00% 54.76%
American Indian or Alaska Native v v v v
Asian v v v v
Filipino v v v v
Hispanic or Latino 12 11 91.70% 54.55%
Native Hawaiian or Pacific Islander v v v v
White v v v v
Two or more races v v v v
Socioeconomically disadvantaged 40 39 97.50% 51.28%
English learners v v v v
Students with disabilities v v v v
Students receiving Migrant Education services v v v v
Foster youth v v v v
Mathematics: Grade 6
Group Total Enrollment Number Tested Percentage Tested Percentage Met or Exceeded
All students 55 55 100.00% 16.36%
Male 27 27 100.00% 14.81%
Female 28 28 100.00% 17.86%
Black or African-American 42 42 100.00% 19.05%
American Indian or Alaska Native v v v v
Asian v v v v
Filipino v v v v
Hispanic or Latino 12 12 100.00% 8.33%
Native Hawaiian or Pacific Islander v v v v
White v v v v
Two or more races v v v v
Socioeconomically disadvantaged 40 40 100.00% 20.00%
English learners v v v v
Students with disabilities v v v v
Students receiving Migrant Education services v v v v
Foster youth v v v v
v Scores are not shown when the number of students tested is 10 or fewer, either because the number of students tested in this category is too small for statistical accuracy or to protect student privacy.

La Tijera K-8 Academy of Excellence Charter SchoolSARC 10
CAASPP Results by Student Group: English Language Arts and Mathematics - Grade 7
Percentage of Students Meeting or Exceeding State Standards 2015-16 School Year
English Language Arts: Grade 7
Group Total Enrollment Number Tested Percentage Tested Percentage Met or Exceeded
All students 118 115 97.50% 45.22%
Male 53 52 98.10% 30.77%
Female 65 63 96.90% 57.14%
Black or African-American 70 69 98.60% 53.62%
American Indian or Alaska Native v v v v
Asian v v v v
Filipino v v v v
Hispanic or Latino 47 45 95.70% 33.33%
Native Hawaiian or Pacific Islander v v v v
White v v v v
Two or more races v v v v
Socioeconomically disadvantaged 79 78 98.70% 44.87%
English learners 16 15 93.80% 6.67%
Students with disabilities 15 15 100.00% 13.33%
Students receiving Migrant Education services v v v v
Foster youth v v v v
Mathematics: Grade 7
Group Total Enrollment Number Tested Percentage Tested Percentage Met or Exceeded
All students 118 116 98.30% 19.83%
Male 53 52 98.10% 21.15%
Female 65 64 98.50% 18.75%
Black or African-American 70 69 98.60% 17.39%
American Indian or Alaska Native v v v v
Asian v v v v
Filipino v v v v
Hispanic or Latino 47 46 97.90% 23.91%
Native Hawaiian or Pacific Islander v v v v
White v v v v
Two or more races v v v v
Socioeconomically disadvantaged 79 79 100.00% 26.58%
English learners 16 16 100.00% 12.50%
Students with disabilities 15 15 100.00% 13.33%
Students receiving Migrant Education services v v v v
Foster youth v v v v
v Scores are not shown when the number of students tested is 10 or fewer, either because the number of students tested in this category is too small for statistical accuracy or to protect student privacy.
La Tijera K-8 Academy of Excellence Charter SchoolSARC 11
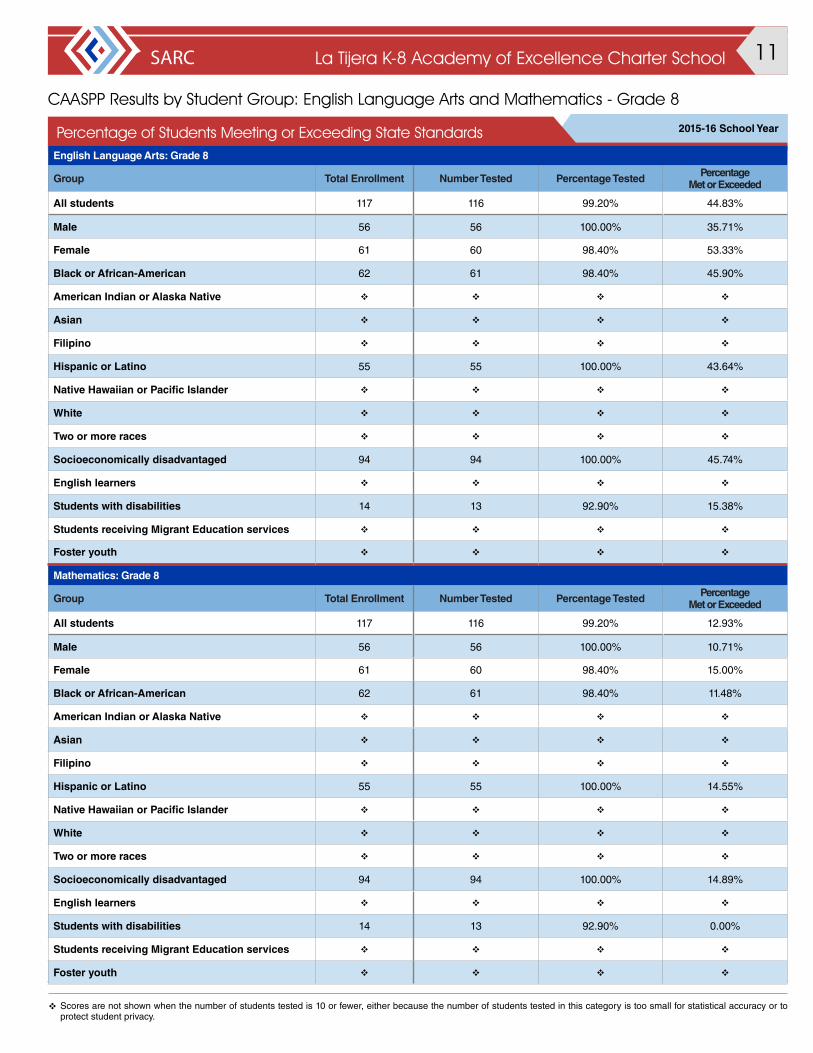
CAASPP Results by Student Group: English Language Arts and Mathematics - Grade 8
Percentage of Students Meeting or Exceeding State Standards 2015-16 School Year
English Language Arts: Grade 8
Group Total Enrollment Number Tested Percentage Tested Percentage Met or Exceeded
All students 117 116 99.20% 44.83%
Male 56 56 100.00% 35.71%
Female 61 60 98.40% 53.33%
Black or African-American 62 61 98.40% 45.90%
American Indian or Alaska Native v v v v
Asian v v v v
Filipino v v v v
Hispanic or Latino 55 55 100.00% 43.64%
Native Hawaiian or Pacific Islander v v v v
White v v v v
Two or more races v v v v
Socioeconomically disadvantaged 94 94 100.00% 45.74%
English learners v v v v
Students with disabilities 14 13 92.90% 15.38%
Students receiving Migrant Education services v v v v
Foster youth v v v v
Mathematics: Grade 8
Group Total Enrollment Number Tested Percentage Tested Percentage Met or Exceeded
All students 117 116 99.20% 12.93%
Male 56 56 100.00% 10.71%
Female 61 60 98.40% 15.00%
Black or African-American 62 61 98.40% 11.48%
American Indian or Alaska Native v v v v
Asian v v v v
Filipino v v v v
Hispanic or Latino 55 55 100.00% 14.55%
Native Hawaiian or Pacific Islander v v v v
White v v v v
Two or more races v v v v
Socioeconomically disadvantaged 94 94 100.00% 14.89%
English learners v v v v
Students with disabilities 14 13 92.90% 0.00%
Students receiving Migrant Education services v v v v
Foster youth v v v v
v Scores are not shown when the number of students tested is 10 or fewer, either because the number of students tested in this category is too small for statistical accuracy or to protect student privacy.
La Tijera K-8 Academy of Excellence Charter SchoolSARC 12
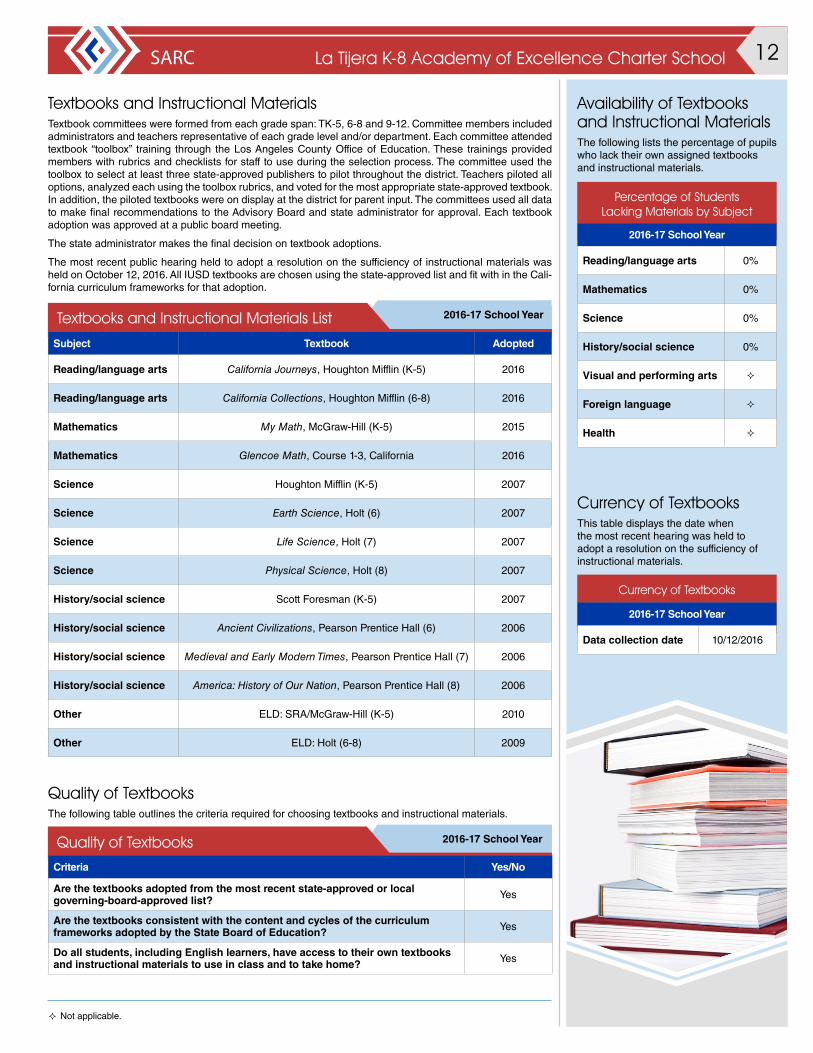
Textbooks and Instructional MaterialsTextbook committees were formed from each grade span: TK-5, 6-8 and 9-12. Committee members included administrators and teachers representative of each grade level and/or department. Each committee attended textbook “toolbox” training through the Los Angeles County Office of Education. These trainings provided members with rubrics and checklists for staff to use during the selection process. The committee used the toolbox to select at least three state-approved publishers to pilot throughout the district. Teachers piloted all options, analyzed each using the toolbox rubrics, and voted for the most appropriate state-approved textbook. In addition, the piloted textbooks were on display at the district for parent input. The committees used all data to make final recommendations to the Advisory Board and state administrator for approval. Each textbook adoption was approved at a public board meeting.
The state administrator makes the final decision on textbook adoptions.
The most recent public hearing held to adopt a resolution on the sufficiency of instructional materials was held on October 12, 2016. All IUSD textbooks are chosen using the state-approved list and fit with in the Cali-fornia curriculum frameworks for that adoption.
Availability of Textbooks and Instructional MaterialsThe following lists the percentage of pupils who lack their own assigned textbooks and instructional materials.
2016-17 School YearTextbooks and Instructional Materials List
Subject Textbook Adopted
Reading/language arts California Journeys, Houghton Mifflin (K-5) 2016
Reading/language arts California Collections, Houghton Mifflin (6-8) 2016
Mathematics My Math, McGraw-Hill (K-5) 2015
Mathematics Glencoe Math, Course 1-3, California 2016
Science Houghton Mifflin (K-5) 2007
Science Earth Science, Holt (6) 2007
Science Life Science, Holt (7) 2007
Science Physical Science, Holt (8) 2007
History/social science Scott Foresman (K-5) 2007
History/social science Ancient Civilizations, Pearson Prentice Hall (6) 2006
History/social science Medieval and Early Modern Times, Pearson Prentice Hall (7) 2006
History/social science America: History of Our Nation, Pearson Prentice Hall (8) 2006
Other ELD: SRA/McGraw-Hill (K-5) 2010
Other ELD: Holt (6-8) 2009
Quality of TextbooksThe following table outlines the criteria required for choosing textbooks and instructional materials.
2016-17 School YearQuality of TextbooksCriteria Yes/No
Are the textbooks adopted from the most recent state-approved or local governing-board-approved list? Yes
Are the textbooks consistent with the content and cycles of the curriculum frameworks adopted by the State Board of Education? Yes
Do all students, including English learners, have access to their own textbooks and instructional materials to use in class and to take home? Yes
Percentage of Students Lacking Materials by Subject
2016-17 School Year
Reading/language arts 0%
Mathematics 0%
Science 0%
History/social science 0%
Visual and performing arts ²
Foreign language ²
Health ²
Currency of TextbooksThis table displays the date when the most recent hearing was held to adopt a resolution on the sufficiency of instructional materials.
Currency of Textbooks
2016-17 School Year
Data collection date 10/12/2016
² Not applicable.

La Tijera K-8 Academy of Excellence Charter SchoolSARC 13
• Systems: Gas systems and pipes, sewer, mechanical systems (heating, ventilation and air-conditioning)
• Interior: Interior surfaces (floors, ceilings, walls and window casings)
• Cleanliness: Pest/vermin control, overall cleanliness (school grounds, buildings, rooms and common areas)
• Electrical: Electrical systems (interior and exterior)
• Restrooms/fountains: Restrooms, sinks and drinking fountains (interior and exterior)
• Safety: Fire-safety equipment, emergency systems, hazardous materials (interior and exterior)
• Structural: Structural condition, roofs
• External: Windows/doors/gates/fences, playgrounds/school grounds
School Facility Items Inspected The tables show the results of the school’s most recent inspection using the Facility Inspection Tool (FIT) or equivalent school form. The following is a list of items inspected.
School FacilitiesThe La Tijera campus is four years old with state-of-the-art technology through-out. A surveillance system helps monitor student safety.
Our school has 31 classrooms, one computer lab and a school library. The playground has basketball courts, painted sections for four square and tetherball, and a field for soccer and football. Our gymnasium is used daily for a number of purposes, including a basketball league and physical education.
La Tijera has a security guard who patrols the campus throughout the day to ensure student safety and accountability of all visitors.
The new campus is equipped with 32 hardwired-to-the-internet classrooms, ceiling-mounted wireless modems, a 46 inch flat-screen LCD TV, cable service and a 90 inch interactive whiteboard. Our cam-pus also has four fully functioning science laboratories, a fully stocked library, state-of-the-art Media Center with 32 student-use multimedia desktop computers, nine COWs (computers on wheels and iPad carts), a state-of-the-art gymnasium with a built-in electronic scoreboard, and an upscale fitness room for student and fac-ulty use. There is also a large grass field for outdoor sports and activities.
The district participates in the State School Deferred Maintenance Program, which provides state matching funds on a dollar-for-dollar basis, to assist school districts with expenditures for major repair or replacement of existing school building components. Typically, this includes roof-ing, plumbing, heating, air-conditioning, electrical systems, interior or exterior painting, and floor systems. For the 2015-16 school year, the district budgeted zero dollars for the deferred maintenance program. This represents zero percent of the district’s general fund budget.
Deficiencies and RepairsThe table lists the repairs required for all deficiencies found during the site inspection. Regardless of each item’s repair status, all deficiencies are listed.
2016-17 School YearDeficiencies and Repairs
Items Inspected Deficiencies and Action Taken or Planned Date of Action
Electrical HVAC and bell system need repaired. All items have been repaired.
11/18/2016
School Facility Good Repair Status This inspection determines the school facility’s good repair status using ratings of good condition, fair condition or poor condition. The overall summary of facility conditions uses ratings of exemplary, good, fair or poor.
School Facility Good Repair Status 2016-17 School Year
Items Inspected Repair Status Items Inspected Repair Status
Systems Good Restrooms/fountains Good
Interior Good Safety Good
Cleanliness Good Structural Good
Electrical Fair External Good
Overall summary of facility conditions Good
Date of the most recent school site inspection 11/29/2016
Date of the most recent completion of the inspection form 11/29/2016
Types of Services FundedSpecial education services (special day class and [SDC] and Resource Special-ist Program [RSP]), Gifted and Talented Education (GATE), Title I, Limited English Proficient (LEP).
Professional DevelopmentOur teachers attend several training workshops that are designed to increase student engagement and achievement. Teachers also participated in classroom walk-throughs in order to collect data and have discus-sions about best practices to use in their classrooms to help their students learn.
We hold a regular staff meeting every Tuesday from 2:30 p.m. to 3:30 p.m. in which teachers are involved in professional development, grade-level meetings and subject-content meetings. We also encourage teachers to attend outside professional development and conferences. All elementary teachers have been trained in Journeys. During the year, we provided staff with opportunities to attend conferences and workshops related to professional learning communities, improving math achievement and Thinking Maps (visual tools for learn-ing). During the summer, teachers attend Advancement Via Individual Determination (AVID) trainings, which they implement in classrooms from grades 3-8.
Three-Year DataProfessional Development Days
2014-15 2015-16 2016-17
La Tijera 2 days 2 days 2 days

La Tijera K-8 Academy of Excellence Charter SchoolSARC 14
Teacher QualificationsThis table shows information about teacher credentials and teacher qualifications. Teachers without a full credential include teachers with district and university internships, pre-internships, emergency or other permits, and waivers. For more information on teacher credentials, visit www.ctc.ca.gov.
Three-Year Data
Inglewood USD La Tijera
Teachers 16-17 14-15 15-16 16-17
With a full credential 451 34 34 33
Without a full credential 4 0 0 0
Teaching outside subject area of competence (with full credential) 0 0 0 0
Teacher Credential Information
Academic Counselors and School Support StaffThis table displays information about aca-demic counselors and support staff at the school and their full-time equivalent (FTE).
Academic Counselors and School Support Staff Data
2015-16 School Year
Academic Counselors
FTE of academic counselors 1.0
Average number of students per academic counselor 234
Support Staff FTE
Social/behavioral or career development counselors 0.0
Library media teacher (librarian) 1.0
Library media services staff (paraprofessional) 0.0
Psychologist 0.4
Social worker 0.0
Nurse 0.2
Speech/language/hearing specialist 0.4
Resource specialist (nonteaching) 1.0
Other FTE
Intervention teacher 1.0
The intervention teacher pulls students regularly to work on basic skills necessary to access the core curriculum.
Teacher Misassignments and Vacant Teacher PositionsThis table displays the number of teacher misassignments (positions filled by teachers who lack legal authorization to teach that grade level, subject area, student group, etc.) and the number of vacant teacher positions (not filled by a single designated teacher assigned to teach the entire course at the beginning of the school year or semester). Please note that total teacher misassignments includes the number of teacher misassignments of English learners.
Three-Year DataTeacher Misassignments and Vacant Teacher Positions
La Tijera
Teachers 14-15 15-16 16-17
Teacher misassignments of English learners 0 0 0
Total teacher misassignments 0 0 0
Vacant teacher positions 0 0 0
Core Academic Classes Taught by Highly Qualified TeachersHigh-poverty schools are defined as those schools with student eligibility of approximately 40 percent or more in the free and reduced-priced meals program. Low-poverty schools are those with student eligibility of approximately 39 percent or less in the free and reduced-priced meals program. For more information about ESEA teacher requirements, visit www.cde.ca.gov/nclb/sr/tq.
2015-16 School YearHighly Qualified Teachers
Percentage of Classes in Core Academic Subjects
Taught by Highly Qualified Teachers
Not Taught by Highly Qualified Teachers
La Tijera 100.00% 0.00%
All schools in district 97.72% 2.28%
High-poverty schools in district 97.62% 2.38%
Low-poverty schools in district 100.00% 0.00%

2013-14 School Accountability Report CardLa Tijera K-8 Academy of Excellence Charter SchoolSARC 15
Data for this year’s SARC was provided by the California Department of Education and school and district offices. For additional information on California schools and districts and comparisons of the school to the district, the county and the state, please visit DataQuest at http://data1.cde.ca.gov/dataquest. DataQuest is an online resource that provides reports for accountability, test data, enrollment, graduates, dropouts, course enrollments, staffing and data regarding English learners. Per Education Code Section 35256, each school district shall make hard copies of its annually updated report card available, upon request each year, on or before February 1.
All data accurate as of January 2017.
School Accountability Report Card
Published by:
www.sia-us.com | 800.487.9234
District Financial DataThis table displays district teacher and administrative salary information and compares the figures to the state averages for districts of the same type and size based on the salary schedule. Note: The district salary data does not include benefits.
2014-15 Fiscal YearDistrict Salary Data
Inglewood USD Similar Sized District
Beginning teacher salary $39,450 $43,821
Midrange teacher salary $66,700 $69,131
Highest teacher salary $77,840 $89,259
Average elementary school principal salary $83,389 $108,566
Average middle school principal salary $94,255 $115,375
Average high school principal salary $113,234 $125,650
Superintendent salary $180,000 $198,772
Teacher salaries: percentage of budget 30% 37%
Administrative salaries: percentage of budget 4% 6%
Financial Data ComparisonThis table displays the school’s per-pupil expenditures from unrestricted sources and the school’s average teacher salary and compares it to the district and state data.
2014-15 Fiscal YearFinancial Data ComparisonExpenditures
Per Pupil From Unrestricted Sources
Annual Average Teacher Salary
La Tijera $5,587 $58,300
Inglewood USD $5,243 $61,086
California $5,677 $71,517
School and district: percentage difference +6.6% -4.6%
School and California: percentage difference -1.6% -18.5%
School Financial DataThe following table displays the school’s average teacher salary and a breakdown of the school’s expenditures per pupil from unrestricted and restricted sources.
School Financial Data
2014-15 Fiscal Year
Total expenditures per pupil $5,892
Expenditures per pupil from restricted sources $305
Expenditures per pupil from unrestricted sources $5,587
Annual average teacher salary $58,300
Expenditures Per PupilSupplemental/restricted expenditures come from money whose use is controlled by law or by a donor. Money that is designated for specific purposes by the district or governing board is not considered restricted. Basic/unrestricted expenditures are from money whose use, except for general guidelines, is not controlled by law or by a donor.
Financial Data The financial data displayed in this SARC is from the 2014-15 fiscal year. The most current fiscal information available provided by the state is always two years behind the current school year and one year behind most other data included in this report. For detailed information on school expenditures for all districts in California, see the California Department of Education (CDE) Current Expense of Education & Per-pupil Spending web page at www.cde.ca.gov/ds/fd/ec. For information on teacher salaries for all districts in California, see the CDE Certificated Salaries & Benefits web page at www.cde.ca.gov/ds/fd/cs. To look up expenditures and salaries for a specific school district, see the Ed-Data website at www.ed-data.org.