ingredients for success - cyan limited€¦ · 74 ratio analysis 76 ... allied bank limited bank al...
TRANSCRIPT

annual report 2016
SUCCESSI N G R E D I E N T S F O R

There is no clear-cut success formula for succeeding in business. If there were one, we would never hear stories of business failure. But if we take a peek into the history of all successful business organizations, we will find close similarities in their methods of operation in the formative years.
There are certain steps that all these organizations have followed. These initial methods played a crucial role in their success. Here are few ingredients that we learned from many successful entrepreneurs.
We share these ingredients as the theme of our annual report this year.
SUCCESSI N G R E D I E N T S F O R

04 Vision & Mission 05 Company Information 06 Geographical Presence 07 Our Values 10 Strategic Objectives 11 Code of Conduct 14 Cyan Seven 18 Potential in Selected Sectors 34 Notice of the 57th Annual General Meeting 40 Directors’ Report54 CEO’s Message 56 Corporate Social Responsibility
Stakeholders’ Information62 Calendar of Major Events 63 Risk & Opportunity Report 64 Shareholders’ Information 68 Key Financial Highlights 74 Ratio Analysis 76 Share Price Sensitivity Analysis 77 Statement of Value Addition
Corporate Governance92 Board of Directors 96 Management Team 98 Organizational Structure 99 Board Committees 104 Criteria to Evaluate Board’s Performance 105 CEO’s Performance Review 106 Attendance of Board & Committee
Meetings 108 Whistle Blowing Policy 109 Report of the Audit Committee 111 Statement of Compliance with the Code of
Corporate Governance 113 Review Report to the Members on the
Statement of Compliance Financial Statements115 Auditors’ Report to the Members 116 Statement of Financial Position 117 Profit and Loss Account 118 Statement of Comprehensive Income 119 Statement of Changes in Equity 120 Statement of Cash Flows 121 Notes to the Financial Statements 153 Pattern of Shareholding 156 Glossary Proxy Form
CONTENTS

TOGETHERWE BELIEVE IN TEAMWORKAND ACHIEVING


MISSIONVISION &
TAKING ENTREPRENEURSHIP TO SCALE

Board of DirectorsShahzada Dawood (Chairman) Non-Executive DirectorKulsum Dawood Non-Executive DirectorGhias Uddin Khan* Non-Executive DirectorHasan Reza-ur Rahim Non-Executive DirectorKamran Nishat Independent DirectorShafiq Ahmed Non-Executive DirectorSulaiman S. Mehdi (Chief Executive) Executive Director
Board Audit CommitteeKamran Nishat (Chairman)Shafiq Ahmed Hasan Reza-ur RahimGhias Uddin Khan* Board HR & Remuneration CommitteeGhias Uddin Khan* (Chairman)Kamran NishatHasan Reza-ur Rahim
Board Investment CommitteeHasan Reza-ur Rahim (Chairman)Kulsum DawoodShahzada DawoodShafiq Ahmed
CFO & Company SecretaryFaisal Nadeem Mangroria
Head of Internal AuditAyman Anwer
Executives**Sulaiman S. Mehdi (CEO)Faisal Nadeem Mangroria (CFO & CS)Muhammad Anas Karimi (Senior Manager Finance)Wahaj Ghulam Hussain (Manager Compliance & Risk Management)Ayman Anwer (Head of Internal Audit)Narender Lakhwani (Investment Associate)Ali Akber Zafar (Investment Associate)
*Board of Directors accepted the resignation of Mr. Ghias Uddin Khan and appointed Mr. Inam Ur Rahman with effect from March 29, 2017**As determined by the Board of Directors
AuditorsA.F. Ferguson & Co.(Chartered Accountants)State Life Building 1-C,I.I. Chundrigar Road, Karachi.Website: www.pwc.com/pk
Tax ConsultantsA.F. Ferguson & Co.(Chartered Accountants)State Life Building 1-A,I.I. Chundrigar Road, Karachi.Website: www.pwc.com/pk
Share Registrar/Transfer AgentTechnology Trade (Pvt.) Ltd.Dagia House,241-C,Block-2,P.E.C.H.S. Off: Shahrah-e- Quaideen, Karachi.Tel: (92-21) 34391316-7 ,19 & 34387960-1Fax: (92-21) 34391318
Legal AdvisorsMohsin Tayebally & Co.1st Floor, Dime Centre,BC-4, Block 9, Khekashan,Clifton, Karachi
Rating AgencyJCR – VIS Credit Rating AgencyVIS House, 128/C,25th Lane Off Khayaban-e-Ittehad,Phase VII, DHA, Karachi
BankersConventional Allied Bank LimitedBank Al Habib LimitedBank Al Falah LimitedHabib Bank LimitedSummit Bank LimitedIslamicBankIslami Pakistan Limited
Registered OfficeDawood Centre, M.T. Khan RoadKarachi-75530Website: www.cyanlimited.com
INFORMATIONCOMPANY
5Annual Report 2016

KARACHIGEOGRAPHICAL PRESENCE ONLY IN
6 Cyan Limited
COMMITMENT TO PAKISTAN
OPENNESS AND TRANSPARENCY
TEAMWORK AND PARTNERSHIP
STRONG WORK ETHICS
INTEGRITY
VALUESOUR
7Annual Report 2016

PASSIONWE ARE PROUD OF OUR CONTRIBUTION TO MAKE A DIFFERENCE WITH


At Cyan Limited, our aim is to solicit our strategic objectives in such a manner that our approach and endeavor to create a positive impact, remains intact.
Focus: Generate attractive returns on Equity PortfolioOur success is a result of achieving growth through in-depth analysis and management of risk while taking into account the ever changing investment environment. As we move ahead, our focus remains steadfast and impeccable. We committed to generate attractive returns on the Equity Portfolio which is evident from the fact that this year again, due to our expertise and experience we managed generate 38.66% returns.
Aim: Maximize Shareholders’ WealthOur aim is to maximize shareholders’ wealth as we believe that our growth projectiles and their success are all connected with the trust and confidence that we get from our valued shareholders. Our strong business strategies only work with superior execution, so we endeavor that our strategic planning is aligned with the increase in wealth of our stakeholders.
Pursue: Private TransactionsCyan Limited believes in committing its employees, capital and ideas to help entrepreneurs and high potential companies to thrive in Pakistan. We further believe that by taking private companies to PSX can help better growth prospects for the target companies.
OBJECTIVESSTRATEGIC
10 Cyan Limited
FOR EMPLOYEES:This code is developed and adopted with a view to develop and promote the highest standards of ethical behavior, professionalism, integrity and commitment amongst the employees of the company. It is adopted with the end view of promoting good corporate governance.
The company makes it mandatory for all its employees to perform their duties and responsibilities in accordance with this code.
The company is guided by the following principles in all activities for attainment of the organizational objectives:
1. ABIDANCE OF LAWS / RULESa. All employees shall conform to and abide
by the company policies, applicable laws, regulations and directives which may from time to time be in force.
b. The employees shall not take part in, subscribe in aid of, or assist in any way, any political movement that is in disinterest of Cyan.
2. INTEGRITYa. Conduct themselves with the highest
standards of ethics, professional integrity and dignity in all dealings with the public, clients, investors and employees, and not engage in acts discreditable to Cyan and the profession. If they become aware of any irregularity that might affect the interests of Cyan, they shall inform the senior management immediately.
b. Maintain all books, data, information and records with scrupulous integrity, reporting in an accurate and timely manner all transactions/reports.
c. Avoid all such circumstance in which there is personal interest conflict, or may appear to be in conflict, with the interests of Cyan or its clients.
d. Not use their employment status to seek personal gain from those doing business or seeking to do business with Cyan, nor accept such gain, gift, favor, entertainment or other benefits, if offered.
3. CONFIDENTIALITY Maintain the privacy and confidentiality of all
the information acquired during the course of professional activities and refrain from disclosing the same unless otherwise required by statutory authorities/law. All such information will remain as a trust and will only be used for the purpose for which it is intended and will not be used for the personal benefits of any individual(s). Inside information about Cyan’s clients/affairs shall not be used for their own gain, or for that of others either directly or indirectly.
4. PROFESSIONALISM Serve Cyan honestly and faithfully and strictly
serve Cyan’s affairs and the affairs of its constituents. Disclose and assign to Cyan all interest in any invention, improvement, discovery or work of authorship that they may make or conceive and which may arise out of their employment with Cyan. If their employment is terminated, all rights to property and information generated or obtained as part of their employment relationship will remain the exclusive property of Cyan.
5. BUSINESS/WORK ETHICSa. Respect fellow colleagues and work as a
team. They shall at all times be courteous and not let any personal differences affect their work.
b. Ensure good attendance and punctuality and demonstrate a consistently good record in this area.
c. Maintain a standard of personal hygiene and dress appropriately for attendance at work.
d. As a personal responsibility, safeguard both the tangible and intangible assets of Cyan that are under their personal control and shall not use Cyan assets for their personal benefits except where permitted by Cyan.
e. Not indulge in any kind of harassment including sexual harassment or intimidation whether committed by or against any senior/junior, co-worker, customer, vendor or visitor. They shall not use language, written or spoken in intra office communication(s) or communication(s)
CONDUCTCODE OF
11Annual Report 2016

with individual(s) outside the office that may contain any statement or material that is offensive to others.
f. Employees shall also not indulge in any of the following activities except with the prior permission of the competent authority:
i. Borrow money from or in any way place themselves under pecuniary obligation to broker or money lender or any employee of Cyan or any firm or person having dealings with Cyan;
ii. Buy or sell stock, share or securities of any description without funds to meet the full cost in the case of purchase or scrip’s for delivery in the case of sale. However, they can make a bona fide investment of their own funds in such stock, shares and securities in line with the employees trading policy;
iii. Lend money in their private capacity to a constituent of Cyan or have personal dealings with a constituent in the purchase or sale of bills of exchange, Government paper or any other securities;
iv. Guarantee in their private capacity the pecuniary obligation of another person or agree to indemnify in such capacity any person from loss;
v. Act as agent for an insurance company otherwise than as agent for on behalf of Cyan;
vi. Be connected with the formation or management of a joint stock company;
vii. Engage in any other commercial business or pursuit either on their own account or as agent for another or others;
viii. Accept or seek any outside employment or office whether stipendiary or honorary; and
ix. Undertake part time work for a private or public body or private person, or accept fee thereof.
FOR DIRECTORS:The Code is developed and adopted with a view to focus the Board and each Director on areas of
ethical risk; provide guidance to directors to help them recognize and deal with ethical issues; provide mechanisms to report unethical conduct; and help foster a culture of honesty and accountability.
1. CONFLICT OF INTERESTDirectors including the Chairman must avoid any conflicts of interest between the director and the Company. Any situation that involves, or may reasonably be expected to involve, a conflict of interest with the Company, should be disclosed promptly to the the Board of Directors. A “conflict of interest” can occur when:
a. A director’s personal interest is adverse to – or may appear to be adverse to – the interests of the Company as a whole;
b. A director, or a member of his or her immediate family, receives improper personal benefits as a result of his or her position as a director of the Company;
Some of the more common conflicts which directors should avoid are listed below:
c. Relationship of Company with third-parties Directors may not receive a personal benefit
from a person or firm which is seeking to do business or to retain business with Cyan. A director shall recuse him or herself from any Company Board decision involving another firm or Company with which the director is affiliated;
d. Compensation from non-Company sources Directors may not accept compensation
(in any form) for services performed for the Company from any source other than the Company;
e. Gifts Directors may not offer, give or receive gifts
from persons or entities who deal with Cyan in those cases where any such gift is being made in order to influence the directors’ actions as members of the Board, or where acceptance of the gifts could create the appearance of a conflict of interest; and
f. Personal use of Company assets Directors may not use Company assets,
labor or information for personal use unless
12 Cyan Limited

approved by the Chairman of the Board or as part of a compensation or expense reimbursement program available to all directors.
2. CORPORATE OPPORTUNITIES Directors are prohibited from:
a. Taking for themselves or their companies opportunities that are discovered through the use of Company property, Company information or position as a director;
b. Using the Company’s property or information for personal gain; or
c. Competing with the Company for business opportunities. However, if the Company is disinterested and the directors determine that the Company will not pursue an opportunity that relates to the Company’s business, a director may then do so.
3. CONFIDENTIALITY Directors must maintain the confidentiality of
information entrusted to them by the Company and any other confidential information about the Company that comes to them, from whatever source, in their capacity as a director, except when disclosure is authorized or legally mandated. For purposes of this Code, “confidential information” includes all non-public information relating to the Company.
4. COMPLIANCE WITH LAWS, RULES AND REGULATIONS; FAIR DEALING
Directors must comply, and oversee compliance by employees, officers and other directors, with laws, rules and regulations applicable to the Company, including insider trading laws. Directors must deal fairly, and must oversee fair dealing by employees and officers, with the Company’s customers, suppliers, competitors and employees.
5. ENCOURAGING THE REPORTING OF ANY ILLEGAL OR UNETHICAL BEHAVIOR
Directors should promote ethical behavior and take steps to ensure that the Company:
a. Encourages employees to talk to supervisors, managers and other appropriate personnel when in doubt about the best course of action in a particular situation; and
b. Encourages employees to report violations of laws, rules, regulations or the Company’s Code of Conduct to appropriate personnel.
6. COMPLIANCE STANDARDS Directors should communicate any suspected
violations of this Code promptly to the Chairman of the Audit Committee. Violations will be investigated by the Board or by persons designated by the Board, and appropriate action(s) will be taken in the event of any violations of the Code.
13Annual Report 2016

SEVENCYAN
Committed Management TeamCompany has a strong management team with demonstrated commitment to ethical values and a proven track record.
Sizeable Market ShareCompany has a sizebale market share or a clearly defined road-map to achieve one.
Scalable Business ModelCompany has a proven and scalable business model with an operational record of at least three years.
Target RevenueCompany has revenues of at least PKR 500 million or a tangible growth plan to achieve this target in the short term.
Target MarginCompany has an EBITDA of at least PKR 200 million and has remained positive for the past three years.
Minimum Investment SizeThe Company is seeking to raise at least PKR 100 million.
Exit PotentialThe ability of an exit for Cyan i.e. to sell its stake in 1-3 years via trade sale, IPO, share buy back/ redemption, etc.
14 Cyan Limited

1Capital market expertise of $50mn public equities portfolio managed over the last 3 years and a team that has combined 50 years’ experience in public equities.
2Knowledge base of various industries (Agribusiness, Power, Consumers etc.) and Operations (Governance, Board Level Involvement) due to the DH group platform.
3Combining the two, Cyan can help to formalize and grow companies and then list them on the PSX to increase representation of certain sectors on the stock exchange.
EXPERTISECYAN’S
15Annual Report 2016


INNOVATEWE KEEP
EXPERIMENTING AND FINDING NEW SOLUTIONS TO

PROTEINANIMAL
18 Cyan Limited

Did you know?• Livestock population growth rate of 2.8% is higher than
human population growth rate of 1.9%.
• Animal blood is also sold as a byproduct in powder form.
• As income level goes up, people prefer chicken and mutton over beef in Pakistan which is contradictory to what is observed globally.
Market Size:
According to Cyan’s estimate, the size of the meat industry in Pakistan is around PKR 1,464 billion (USD 13.9 billion). As per the Economic Survey of Pakistan, beef is the largest meat produced in Pakistan with a 52% share, followed by poultry with 30% share and mutton with 18% share.
Industry Profile:
Livestock makes up 12% of Pakistan’s GDP (USD 284 billion) and contributes 59% to the agriculture sector. It is nation’s source of animal protein in the form of various types of meat.
Recent trends in consumer spending show sign of willingness to pay a premium for a higher quality product. Per capita consumption of meat is gradually increasing and currently stands at 19.8 kg in FY16 from 16.8 kg in FY11. The export market for packaged meat remains very attractive and has shown promising growth in the past few years.
0
300
600
900
1200
1500
FY16FY15FY14FY13FY12FY11
Meat Market (PKR Billion)
738
894 1
,010 1
,141
1,2
91
1,4
64
CAGR = 15%
0
5
10
15
20
FY16FY15FY14FY13FY12FY11
Local Consumption Per Capita (kg)
16.8
18.3
18.7 19.1 19
.6
19.8
15%CAGR
(last 5 years)
19Annual Report 2016

PHARMACEUTICAL
20 Cyan Limited

Did you know?• WHO estimates that between 30-40% of all drugs and
medicines in Pakistan are counterfeit.
• Malaria is the second most prevalent communicable disease in the country.
Market Size:
The pharmaceutical industry in Pakistan is valued at around PKR 274 billion (USD 2.6 billion). Pakistan’s per capita pharmaceutical sale is USD 13.5 which is lower than the regional average of USD 30.4 signifying growth potential in the sector.
Industry Profile:
The Pharmaceutical industry contributes 0.9% to Pakistan’s GDP. The industry has been growing at a five year CAGR of 10% on the back of rising demand in the country led by population growth rate of 1.9% YoY in FY16. The industry is highly regulated and has been impacted by halt in increase in drug prices of various drugs in past resulting in low profit margins for some companies. The growth is attributed to volumetric growth largely and product portfolio diversification. However, the Drug Regulatory Authority of Pakistan (DRAP), approved the policy last year suggesting linking drug prices with Consumer Price Index (CPI) which shall increase the profitability of the companies going forward.
Although the industry still remains highly regulated, the policy is expected to improve the local Active Pharma Ingredient (API) manufacturing facilities, which is still in nascent stage.
0
10
20
30
40
50
60
70
Mala
ysia
Philip
pine
s
Sri L
anka
Indo
nesia
Bang
lades
h
Pakis
tan
Indi
a
Pharmaceutical Sales (USD per capita)
68.1
31.9
29.7
24.6
14.9
13.5
13.4
Regional Average = 30.4
0
50
100
150
200
250
300
201620152014201320122011
Pharmaceutical Sales (PKR Billion)
172 18
9 209 23
1
252
274
CAGR = 10%
10%CAGR
(last 5 years)
21Annual Report 2016

HEALTHCARE
22 Cyan Limited

Did you know?• Infant mortality rate in Pakistan is 66 per one thousand births.
• Pakistan, Nigeria and Afghanistan are the only three countries in the world where polio remains endemic.
Market Size:
The size of the healthcare service industry is cumulatively valued at PKR 810 billion (USD 7.7 billion) in 2016, constituting 2.7% of Pakistan’s GDP. Using data from World Bank, Pakistan spends USD 37.0 per capita on health which is lower than the WHO’s prescribed level of per capita USD 44.0, a minimum spending package required for essential health services. The demand for healthcare services in Pakistan has increased steadily due to rising income levels, high population growth, increase in lifestyle diseases such as diabetes and cardiac and increasing accessibility within rural areas.
Industry Profile:
Quality of healthcare is a fundamental metric to assess the developmental stage of a country. As per the estimates, total hospitals in Pakistan are 1,215 including both public and private having 105,721 hospital beds, 184,711 registered doctors, and 94,766 nurses. Population per doctor is 1,055, per hospital bed is 1,844 and per nurse is 2,058 which clearly indicate inadequacies compared to burgeoning population in the country. A positive development for the healthcare industry is the newly launched ‘PM Health Insurance Scheme 2016’ under which about 1.2 million eligible families will get free health insurance up to PKR 0.3 million in health facilities each year.
08%CAGR
Health Care Expenditure (PKR Billion)
0
180
360
540
720
900
2011 2012 2013 2014 2015 2016
549
554 61
9 685
758 81
0
CAGR = 8%
0
100
200
300
400
500
Mala
ysia
Philip
pine
s
Indo
nesia
Sri L
anka
Indi
a
Pakis
tan
Bang
lades
h
Health Spending (USD per capita)
431.
5
147.
3
105.
3
98.4
85.2
37.0
36.0
Regional Average = 150.6
(last 5 years)
23Annual Report 2016

EDUCATION
24 Cyan Limited

Did you know?• Free education is a constitutional right of every Pakistani.
• Pakistan is home to 24 million children who are out of school, a figure that is second only to Nigeria.
Market Size:
The education industry (public) in Pakistan is valued at PKR 592* billion (USD 5.6 billion), contributing 2.0% to Pakistan’s GDP compared to average regional expenditure of 4.1% of GDP. However, in absolute terms, expenditure on education is growing at a CAGR of 13% since FY11. The sector is divided between public and private institutions, along with a number of non-government organizations running charitable education foundations. The Government of Pakistan is determined to enhance the resources available to education sector by ensuring proper and timely utilization of funds in order to achieve the target of Education sector to be 4% of GDP by 2018.
* 2HFY16 data is assumed to be same as 2HFY15.
Industry Profile:
According to the latest Pakistan Social and Living Standards Measurement (PSLM) Survey 2015, the literacy rate of the population (10 years and above) is 60% thus, clearly indicating lack of penetration of education in the country. On province wise data, Punjab leads with 63% followed by Sindh with 60%, K.P. at 53% and Baluchistan with 44%.
0
1
2
3
4
5
6
Bhut
an
Mald
ives
Afgh
anist
an
Indi
a
Iran
Bang
lades
h
Pakis
tan
Public Expenditure as % of GDP
6.0%
5.2%
4.6%
3.8%
3.1%
2.0%
2.0%
Regional Average = 4.1%
0
100
200
300
400
500
600
FY11 FY12 FY13 FY14 FY15 FY16
Public Expenditure (PKR Billion)
323
394
480
538
598
592CAGR = 13%
13%CAGR
(last 5 years)
25Annual Report 2016

LOGISTICS
26 Cyan Limited

Did you know?• Due to inefficiencies, fuel consumption per ton in Pakistan is
higher as compared to the world average.
• Majority of Pakistan’s trucking fleet is of Bedford make; the company closed its operations in Pakistan in 1986.
Market Size:
According to Cyan’s estimates the market size of the industry is around PKR 1,819 billion (USD 17.3 billion). Road transport services comprise 77% of the total market followed by sea transportation comprising 19%, while air transport, rail transport and warehousing forming the rest of the industry. The sector has overdependence on road transportation due to weak rail infrastructure. Furthermore, in-case of strict enforcement of prescribed load limit, the number of trucks being used for transportation across country needs to be doubled.
Industry Profile:
The size of Logistics industry is around 6.1% of Pakistan’s GDP with 90% of the sector outside the formal economy. The sector is marred with fragmentation, unorganized businesses and poor infrastructure. With the advent of CPEC and resulting upgradation of infrastructure, the sector is expected to grow at a very fast pace. Secondly, the sector might experience increased share of formal industry as a result of increasing infrastructure activity. The total length of new road network under the economic corridor is estimated at 966 km along with expansion and reconstruction of 1736km rail network.
0
500
1000
1500
2000
Logisitics Sector (PKR Billion)
1,2
08 1,3
67
1,5
44
1,6
02
1,7
08 1,8
19
2011 2012 2013 2014 2015 2016
CAGR = 9%
09%CAGR
(last 5 years)
27Annual Report 2016

TECHNOLOGY SECTOR
28 Cyan Limited

Did you know?• People within the age bracket of 25-34 are most inclined to use
technology for shopping.
• Gender demographics show that men account for 70% of online activity pertaining to e-commerce but the conversion rate is 50-50% for both the genders.
Market Size:
According to Cyan’s estimates, the IT Exports and E-Commerce market size is PKR 272 billion (USD 2.6 billion), forming 0.91% of the GDP, with major contribution coming from IT Exports which is estimated to be USD 2.2 billion. The domestic revenue of IT sector is estimated at USD 0.4 billion and it is expected to grow rapidly as major initiatives are being taken at the government level for digitization of public sector entities. Overall, the IT sector has a significant potential going forward.
Industry Profile: In the Global Information Technology report released by the World Economic Forum (WEF) for the year 2016, Pakistan has been given a ranking of 110 in proliferation of technology out of 139 countries as against 112 in 2015. The improved ranking reflects on the growing trend of technology awareness in the country. Pakistan has the 27th largest internet using population in the world which shows enormous potential that the sector has.
The sector can be further divided into IT Solutions and E-Commerce. In the arena of E-commerce the country has witnessed a number of successful start-ups funded by local and international PE/VC funds. These companies are expected to grow exponentially in the years to come as the market dynamics support the use of technology as evident from the high mobile penetration rate along with advent of 3G and 4G technology in the local market.
25%CAGR
(last 5 years)
0
50
100
150
200
250
300
IT Exports & Ecommerce (PKR Billion)
90
114
144
166
234
272
2011 2012 2013 2014 2015 2016
CAGR = 25%
29Annual Report 2016

RETAIL
30 Cyan Limited

Did you know?• Pakistan is considered to be amongst ten ‘hidden heroes’ of the
next generation of retail markets according to Deloitte and Planet Retail.
Market Size:
The retail sector is valued at PKR 5,204 billion (USD 49.6 billion). The major sectors include food and beverages, apparel, footwear, health and beauty, electronics and home furnishings.
Industry Profile:
Retail sector contributes 17.4% in GDP and is also the largest subsector of the services having share of 30.9% in the services sector (59.2% of GDP). Retail sector grew by 4.6% in FY16 compared to 3.3% in FY15 signifying booming consumerism and services growth.
Rising digitization in the country has been the fundamental reason behind growing ecommerce activities in the country. This is supported by the fact that mobile internet users are increasing which has increased mobile internet penetration to 19.4%. Few ecommerce players in the country conduct virtual sale events like “Black Friday”, “Independence Day”, “Mother’s Day” etc. which has received significant interest from the masses. Overall share of employment has increased from 33.9% in FY13 to 35.1% in FY15, providing jobs which are diverse in nature.
08%CAGR
(last 5 years)
0
1000
2000
3000
4000
5000
Retail Sector Spending (PKR Billion)
3,56
8 4,00
7 4,36
9 4,92
4
5,08
6
5,20
4
FY11 FY12 FY13 FY14 FY15 FY16
CAGR = 8%
31Annual Report 2016

MEDIA & ENTERTAINMENT
32 Cyan Limited

Did you know?• Number of news channels exceed that of entertainment
channels in Pakistan.
Market Size:
Advertising spend has been growing at a CAGR of 19% in last five years. Of the total TV advertising spend, entertainment channels account for approximately half of the total spend followed by second biggest category of 29% on News channels and remaining on others.
Industry Profile: Pakistan’s changing demographic trends portray a compelling consumer growth story with ever expanding urbanization supported by rising household income. Pakistan’s total number of households stand at 32 mn and total cable penetration is 38% suggesting higher TV viewership. Number of local TV channels have been on the rise and currently stand at 95 channels of which news channels comprise of 34%, entertainment channels 20%, regional channels 16% and remaining 30% is other category. Media industry’s major source of revenue is ad placement. Fast Moving Consumer Goods (FMCGs) account for majority of the advertisements placed on TV.
19%CAGR
(last 5 years)
Media Advertising Spend (PKR Billion)
0
10
20
30
40
50
60
70
80
32
40
47
54
67
76
FY11 FY12 FY13 FY14 FY15 FY16
CAGR = 19%
33Annual Report 2016

ANNUAL GENERAL MEETINGNOTICE OF THE FIFTY SEVENTH (57th)
Notice is hereby given that the Fifty Seventh (57th) Annual General Meeting (AGM) of Cyan Limited will be held at TDF Business Hub, Ground Floor, Dawood Centre, MT Khan Road, Karachi at 3:00 p.m. on Friday the April 28, 2017 to transact the following business:
ORDINARY BUSINESS1. To confirm the minutes of the 56th Annual General Meeting of the Company held on March 29, 2016.
2. To receive, consider and adopt the Audited Financial Statements of the Company for the year ended December
31, 2016 together with the Auditors’ and Directors’ Reports thereon.
3. To appoint Auditors for the year ending December 31, 2017 and to fix their remuneration.
4. To elect seven (7) Directors as fixed by the Board pursuant to the provisions of Section 178(1) of the Companies Ordinance, 1984 for a term of three years. The term of the present Board expires on April 30, 2017 and the new Board will assume office on the same day. The following retiring directors are eligible to offer themselves for re-election:
i. Shahzada Dawoodii. Kulsum Dawoodiii. Hasan Reza- Ur Rahimiv. Inam Ur Rahmanv. Kamran Nishatvi. Shafiq Ahmedvii. Sulaiman S. Mehdi
SPECIAL BUSINESS:5. To consider and if deemed fit, approve the alteration in Articles of Association of the Company as mentioned
in detail in the Statement under Section 160(1)(b) in connection with consent from shareholders for the transmission of the annual audited accounts in any approved transmission medium; and pass the following resolutions, with or without modifications, as Special Resolutions:
“RESOLVED that transmission of annual audited accounts of the Company either in hard copy (book form) or through any other approved transmission medium including CD/DVD/USB be and is hereby approved.
FURTHER RESOLVED that in connection with the resolution passed above and subject to the necessary approvals to be obtained from regulators and any consequent modification thereon, the alterations in Articles of Association of the Company which is laid before the members in the Statement under Section 160 (1) (b) of the Companies Ordinance, 1984 and forms an integral part of this resolution, be and is hereby approved.
FURTHER RESOLVED that the Chief Executive Officer and the Company Secretary be and hereby are jointly and severally authorized to fulfill all legal, corporate and procedural formalities for accomplishing alteration of the Company’s Articles of Association, as modified in the Annual General Meeting or in accordance with the advice of regulator.”
6. To transact any other business with the permission of the Chair.
Attached to this notice of meeting being sent to the members is a statement under Section160(1)(b) of the Companies Ordinance, 1984 setting forth all material facts concerning the resolutions contained in items No.4 and No.5 of the notice which will be considered for adoption at the Meeting.
By order of the Board
FAISAL MANGRORIAKarachi, April 07, 2017 Company Secretary
34 Cyan Limited

NOTES:
CLOSURE OF SHARE TRANSFER BOOKSThe Share transfer books of the Company will remain closed from Thursday, April 20, 2017 to Friday, April 28, 2017 (both days inclusive). Transfers received in order at the office of our Registrar, M/s. Technology Trade (Pvt.) Ltd., Dagia House, 241-C, Block-2, P.E.C.H.S., Off: Shahrah-e-Quaideen, Karachi by the close of business (5:00 p.m.) on Wednesday, April 19, 2017 will be treated in time for the purpose of attending and voting at the AGM.
PARTICIPATION IN THE ANNUAL GENERAL MEETING A member entitled to attend and vote at the meeting may appoint any other member as his/her proxy to attend and vote. A Corporation being a member may appoint any person, whether or not a member of the Company, as it’s proxy. A proxy, duly appointed, shall have such rights as respects speaking and voting at the meeting as are available to a member.
In order to be effective, proxy forms, duly filled and signed, must be received at the Registered Office of the Company, not less than forty eight (48) hours before the meeting. A blank proxy form is attached at the end of this report.
CDC account holders will further have to follow the under-mentioned guidelines as laid down by the Securities and Exchange Commission of Pakistan:
A. FOR ATTENDING THE METINGi. In case of individuals, the account holders or sub-account holders whose registration details
are uploaded as per the Regulations shall authenticate his/her original valid Computerized National Identity Card (CNIC) or the original passport at the time of attending the meeting.
ii. In case of corporate entity, the Board of Directors’ resolution /power of attorney with specimen signature of the nominee shall be produced (unless it has been provided earlier) at the time of the meeting.
B. FOR APPOINTING PROXIESi. In case of individuals, the account holders or sub-account holders whose registration details
are uploaded as per the Regulations shall submit the proxy form as per the above requirement.
ii. Attested copies of valid CNIC or the passport of the beneficial owners and the Proxy shall be furnished with the Proxy Form.
iii. The proxy shall produce original valid CNIC or original passport at the time of the meeting.
iv. In case of corporate entity, the Board of Directors’ resolution/power of attorney withspecimen signature shall be submitted (unless it has been provided earlier) along with the proxy form to the Company.
v. Proxy form will be witnessed by two persons whose names, addresses and valid CNIC numbers shall be mentioned on the forms.
CNIC NUMBERAs instructed by Securities & Exchange Commission of Pakistan (SECP) vide their letter No. EMD/D-II/Misc./2009-1342 dated April 4, 2013 dividend warrants cannot be issued without insertion of CNIC Numbers; therefore, all shareholders holding physical shares were requested to submit copies of their valid CNICs/NTN Certificates along with the folio numbers to the Company’s Share Registrar: M/s. Technology Trade (Pvt.) Ltd., Dagia House, 241-C, Block-2, P.E.C.H.S., Off: Shahrah-e-Quaideen, Karachi. No dividend will be payable unless the CNIC number is printed on the dividend warrants, so please let us have your CNIC numbers, failing which we will not be responsible if we are not able to pay the dividend.
DIVIDEND MANDATEIn order to make process of payment of cash dividend more efficient, SECP vide circular No. 8(4) SM/CDC 2008 dated April 5, 2013 have issued instructions so that the shareholders can get their dividend credited in their respective bank accounts electronically without any delay. You may therefore authorize the Company to credit the dividend directly to your
35Annual Report 2016

bank account for all future dividends declared by the Company. Accordingly all non CDC shareholders are requested to send their bank account details to the Company’s Registrar. Shareholders who hold shares with Participant/Central Depository Company of Pakistan (CDC) accounts are advised to provide the mandate to the concerned Stock Broker/Central Depository Company of Pakistan Ltd. (CDC).
Deduction of Income Tax from Dividend under Section 150 of the Income Tax Ordinance, 2001 (“Income tax Ordinance”)The Government of Pakistan through Finance Act, 2016 has made certain amendments in section 150 of the Income Tax Ordinance, 2001 whereby different rates are prescribed for deduction of withholding tax on amount of dividend paid to shareholders. These tax rates are as under:
(a) For filers of income tax returns 12.50%(b) For non-filer of income tax returns 20.00%
Withholding tax on Dividend in case of Joint Account HoldersMembers who have joint shareholdings held by Filers and Non-Filers shall be dealt with separately and in such particular situation, each account holder is to be treated as either a Filer or a Non-Filer and tax will be deducted according to his/her shareholding.
If the share is not ascertainable then each account holder will be assumed to hold equal proportion of shares and the deduction will be made accordingly. Therefore, in order to avoid deduction of tax at a higher side, the joint account holders are requested to provide the below details of their shareholding to the Share Registrar of the Company latest by the Annual General Meeting date.
Folio/CDCA/c No.
Total Noof Shares
Name of Principal Shareholder and CNIC #
ShareHolding
Name of Joint Shareholders and
CNIC #
ShareHolding
Valid Tax Exemption Certificate for Exemption from Withholding TaxA valid tax exemption certificate is necessary for exemption from the deduction of withholding tax under Section 150 of the Income Tax Ordinance, 2001. Members who qualify under Clause 47B of Part IV of the Second Schedule to the Income Tax Ordinance, 2001 and wish to seek an exemption must provide a copy of their valid tax exemption certificate to the Shares Registrar prior to the date of Book closure otherwise tax will be deducted according to the applicable law.
Consent for Video Conference FacilityMembers can also avail video conference facility. In this regard please fill the following and submit to registered address of the Company 10 days before holding the general meeting. If the Company receives consent from members holding in aggregate 10% or more shareholding residing at a geographical location, to participate in the meeting through video conference at least 10 days prior to the date of meeting, the Company will arrange video conference facility in that city subject to availability of such facility in that city.
The Company will intimate members regarding venue of conference facility at least 5 days before the date of general meeting alongwith complete information necessary to enable them to access such facility.
I/We,_________________________ of ______________________, being a member of Cyan Limited, holder of ____________________ ordinary share (s) as per Register Folio/CDC Account No_____________ hereby opt for video conference facility at ______________________.
_________________Signature of member(s)
Change of Address Shareholders (Non-CDC) are requested to promptly notify the Company’s Registrar of any change in their addresses and submit, if applicable to them, the Non-deduction of Zakat Form CZ-50 with the Company’s Registrar. All the shareholders holding their shares through the CDC are requested to please update their addresses and Zakat status with their participants. This will assist in the prompt receipt of Dividend.
36 Cyan Limited

STATEMENT OF MATERIAL FACTS UNDER SECTION 160(1)(B) OF THE COMPANIES ORDINANCE, 1984 REGARDING THE NORMAL AND SPECIAL BUSINESSThis statement sets out the material facts concerning the Normal and Special Business, as contained in agenda item No.4 and item No.5 respectively of the Notice, to be transacted at the Fifty Seventh (57th) Annual General Meeting of the Company.
ITEM (4) OF THE AGENDA
FOR CANDIDATES PARTICIPATING IN THE ELECTION OF DIRECTORSAny person who seeks to contest the election of director shall, whether he/she is a retiring director or otherwise file with the Company the following documents, at its Registered Office not later than fourteen days before the date of the meeting at which elections are to be held:
a) His/ her Folio No./CDC Investors Account No./CDC Participant No./Sub-Account No.;
b) Notice of his/her intention to offer himself/herself for the election of directors in terms of Section 178(3) of the Companies Ordinance, 1984;
c) Consent to act as director on Form 28 under Section 184 of the Companies Ordinance, 1984;
d) A detailed profile along with his / her office address as required under SECP’s SRO 634 (1)/2014 dated July 10, 2014; and
e) An attested copy of Computerized National Identity Card (CNIC).
f) A declaration confirming that:i. He/she is aware of the duties of directors under the Companies Ordinance, 1984, the Memorandum
and Articles of Association and Listing Regulations of Stock Exchange;
ii. He/she is not ineligible to become a director of the Company under any applicable laws and regulations (including Listing Regulations of Stock Exchange);
iii. He/she is not serving as a director of more than seven listed companies simultaneously. Provided that this limit shall not include the directorships in the listed subsidiaries of a listed holding company; and
iv. Neither he/she nor his/her spouse is engaged in the business of brokerage or is a sponsor, director or officer of a corporate brokerage house.
ITEM (5) OF THE AGENDAThrough SRO 470(1)/2016 dated 31st May, 2016 SECP has allowed companies to circulate the annual audited accounts to its members through CD/DVD/USB instead of transmitting the hard copies at their registered addresses subject to consent of shareholders and compliance with certain other conditions.
To give effect to the above, clause 128 of the Articles of Association of the company is proposed to be altered as follows:
Clause Existing Provision Proposed Provision Remarks128 A printed copy of every
Account, Balance Sheet, and report shall, twenty one days previously to the Meeting, be served on each of the registered holders of the Shares, in the manner in which notices are hereinafter directed to be served.
A copy of every account, balance sheet and report, shall be served / transmit-ted to each of the registered shareholders of the company, either in the printed form or in other mediums/forms including CD/DVD/USB as allowed under the applicable laws.
The Article has been revised to confirm that annual audited accounts can be sent to the members of the company in printed form or in other mediums/forms including CD/DVD/USB as allowed under the applicable laws.
37Annual Report 2016

PERSISTENCEWE ACCEPT CHALLENGES, SEEK ALTERNATIVES, AND CONTINUE LEARNING WITH


The Board of Directors is pleased to present the 57th Annual Report of the company together with the audited financial statements for the financial year ended December 31, 2016.
Economy ReviewPakistan’s economy achieved remarkable performance in FY16 with real GDP growing at an eight year high of 4.7% despite global slowdown. This growth is largely supported by impressive performance of manufacturing sector, upbeat private sector credit offtake, benign inflation level, contained fiscal deficit, stable exchange rate and robust foreign exchange levels. Continuing robust construction activities, persistent increase in the demand for consumer durables and fall in prices of key raw materials in the global market contributed to industrial growth of 6.8% in FY16.
LSM growth was observed at 3.2% in FY16 driven by automobiles, pharmaceuticals, cements and construction related activities. Although LSM growth remained subdued in 5MFY17 due to supply constraints experienced by textile sector and sluggish demand from regional countries, however, LSM performance is expected to remain upbeat owing to accelerated economic activity in the country.
FY16 observed significant jump in private sector credit offtake by 11% led by growing construction and manufacturing sectors. Manufacturing growth may further gain positive momentum owing to stipulated investments under CPEC. Construction and energy related projects to directly impact industrial growth. This is further reinforced by Dec 2016 growth of 14% YoY compared to 7% YoY in Dec 2015.
REPORTDIRECTORS’
LSM Growth - Cumulative
-1
0
1
2
3
4
5
FY15
July
- Ju
ne
July
- M
ay
July
- Ap
r
July
- M
ar
July
- Fe
b
July
- Ja
n
July
- D
ec
July
- N
ov
July
- O
ct
July
- Se
p
July
- Au
g
July
5MFY17FY16
5.0%
0.4%
2.6%
3.6%3.8% 3.7%
4.1% 4.0%
4.7%
0
1
2
3
4
5
FY16FY15FY14FY13FY12FY11FY10FY09FY08
GDP Growth Rate Private Sector Credit Offtake
PKR
Billio
n
0
1,000
2,000
3,000
4,000
5,000
Dec 16Dec 15FY16FY15FY14FY13FY12FY11FY10FY09FY08-2.0
0.5
3.0
5.5
8.0
10.5
13.0
15.5
18.0
2,66
2
16%
2,65
2
2,74
9
2,91
8
2,92
2
2,99
9
3,37
7
3,65
1 4,04
2
3,88
7 4,41
2
0%
4%
6%
0%
3%13% 8%
11%
7%
14%
Credit to Private Sector YOY Growth
40 Cyan Limited

Average inflation in FY16 stood at 2.9% compared to 4.6% in FY15 owing to smooth and timely pass-through of decline in commodity prices in the form of reduced transportation and energy prices, better supply of perishable items, stable exchange rate and contained monetary expansion. On Calendar Year basis, inflation in CY16 averaged at 3.8% as compared to 2.5% in same period last year (SPLY). Moreover, SBP has set the target of 4.5-5.5% for FY16-17 and government’s target inflation rate is 6% for FY16-17. Up till 1HFY17, average inflation is 3.9% compared to 2.1% SPLY led by volatile perishable food items’ prices and house rent.
Rising inflation rates leave limited room for SBP to cut the discount rate as real returns are decreasing. In the wake of such scenario, SBP announced
status quo at 5.75% with respect to policy rate in November’s Monetary Policy Review and highlighted that domestic demand will largely determine the inflation path going forward.
Fiscal deficit as % of GDP stood at 4.6% in FY16, slightly higher than the target of 4.3%, however lower than 5.3% recorded in FY15. This reduction was primarily attributed to: (i) 20% growth in FBR tax collections from PKR 2.6 trillion in FY15 to PKR 3.1 trillion in FY16 and (ii) slight fall in debt servicing expense by 3.1% that helped contain the growth in federal current expenditures. High fiscal deficit in 1QFY17 was primarily an outcome of low revenue generation which declined by 8% in 1QFY17 compared to 11.6% increase in SPLY due to deceleration in both tax and non-tax revenue.
CPI vs 1 Year T-bill Rate
0.0%
2.0%
4.0%
6.0%
8.0%
10.0%
12.0%
Nov
-16
Sep-
16
Jul-1
6
May
-16
Mar
-16
Jan-
16
Nov
-15
Sep-
15
Jul-1
5
May
-15
Mar
-15
Jan-
15
Nov
-14
Sep-
14
Jul-1
4
May
-14
Mar
-14
Jan-
14
CPI YoY1 Year Tbill Rate
Real Return
0
1
2
3
4
5
6
Nov
-16
Sep-
16
Jul-1
6
May
-16
Mar
-16
Jan-
16
Nov
-15
Sep-
15
Jul-1
5
May
-15
Mar
-15
Jan-
15
Nov
-14
Sep-
14
Jul-1
4
May
-14
Mar
-14
Jan-
14
Fiscal Deficit as % of GDP
7.3%
5.2%
6.2% 6.5%
8.8%8.2%
5.5% 5.3%4.6%
1.1% 1.3%
0
2
4
6
8
10
1Q FY171Q FY16FY16FY15FY14FY13FY12FY11FY10FY09FY08
Tax Revenue as % of GDP
9.5%8.8% 8.9%
8.5%9.4%
8.7% 9.0% 9.4%10.1%
2.4% 2.2%
0
2
4
6
8
10
12
1QFY 171QFY 16FY16FY15FY14FY13FY12FY11FY10FY09FY08
41Annual Report 2016
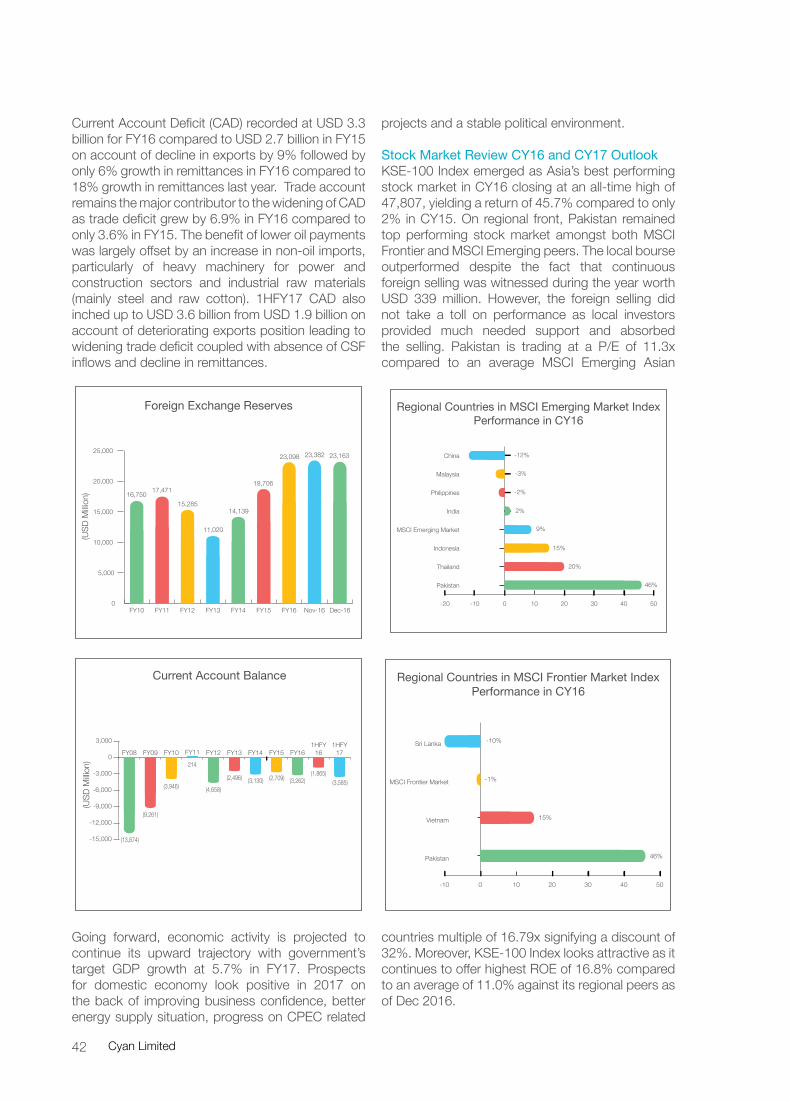
Current Account Deficit (CAD) recorded at USD 3.3 billion for FY16 compared to USD 2.7 billion in FY15 on account of decline in exports by 9% followed by only 6% growth in remittances in FY16 compared to 18% growth in remittances last year. Trade account remains the major contributor to the widening of CAD as trade deficit grew by 6.9% in FY16 compared to only 3.6% in FY15. The benefit of lower oil payments was largely offset by an increase in non-oil imports, particularly of heavy machinery for power and construction sectors and industrial raw materials (mainly steel and raw cotton). 1HFY17 CAD also inched up to USD 3.6 billion from USD 1.9 billion on account of deteriorating exports position leading to widening trade deficit coupled with absence of CSF inflows and decline in remittances.
Going forward, economic activity is projected to continue its upward trajectory with government’s target GDP growth at 5.7% in FY17. Prospects for domestic economy look positive in 2017 on the back of improving business confidence, better energy supply situation, progress on CPEC related
projects and a stable political environment.
Stock Market Review CY16 and CY17 OutlookKSE-100 Index emerged as Asia’s best performing stock market in CY16 closing at an all-time high of 47,807, yielding a return of 45.7% compared to only 2% in CY15. On regional front, Pakistan remained top performing stock market amongst both MSCI Frontier and MSCI Emerging peers. The local bourse outperformed despite the fact that continuous foreign selling was witnessed during the year worth USD 339 million. However, the foreign selling did not take a toll on performance as local investors provided much needed support and absorbed the selling. Pakistan is trading at a P/E of 11.3x compared to an average MSCI Emerging Asian
countries multiple of 16.79x signifying a discount of 32%. Moreover, KSE-100 Index looks attractive as it continues to offer highest ROE of 16.8% compared to an average of 11.0% against its regional peers as of Dec 2016.
Foreign Exchange Reserves
0
5,000
10,000
15,000
20,000
25,000
Dec-16Nov-16FY16FY15FY14FY13FY12FY11FY10
16,750 17,471
15,285
11,020
14,139
18,706
23,098 23,382 23,163
(USD
Milli
on)
(13,874)
(9,261)
(3,946)
214
(4,658)
(2,496) (3,130) (2,709) (3,262)(1,865)
(3,585)
-15,000
-12,000
-9,000
-6,000
-3,000
0
3,000 1HFY17
1HFY16FY16FY15FY14FY13FY12FY11FY10FY09FY08
Current Account Balance
(USD
Milli
on)
-12%
-3%
-2%
2%
9%
15%
20%
46%
-20 -10 0 10 20 30 40 50
Pakistan
Thailand
Indonesia
MSCI Emerging Market
India
Philippines
Malaysia
China
Regional Countries in MSCI Emerging Market IndexPerformance in CY16
-10%
-1%
15%
46%
-10 0 10 20 30 40 50
Pakistan
Vietnam
MSCI Frontier Market
Sri Lanka
Regional Countries in MSCI Frontier Market IndexPerformance in CY16
42 Cyan Limited

Factors that contributed to the impressive performance comprise of (i) most awaited upgrade of Pakistani stock market from Frontier to Emerging Market, (ii) enormous local liquidity, (iii) growing economy, (iv) progress on CPEC projects and (v) S&P upgrading Pakistan’s rating to “B” giving it a “Stable” outlook.
Foreign Portfolio Investment (FIPI) recorded an outflow of US$ 338mn during CY16. Foreign selling was observed during the four months from Jan 2016 to Apr 2016 worth US$ 119mn due to global uncertainty. However, with MSCI announcement of including Pakistan in Emerging Market Index in June 2016, foreign interest in the stock market was observed as foreign inflows increased by US$ 101mn between May and July 2016. Later on, geopolitical tensions and US Election generated uncertainty leading to outflows in the later months of the year. However, with rising investor confidence, locals continuously absorbed foreign selling thus providing liquidity on the bourse. Going forward, reclassification to MSCI EM Index is likely to result in some fresh liquidity from the global funds tracking the index.
Moreover, a landmark development was the sale of 40% strategic stake of PSX to a Chinese consortium valuing the exchange at US$ 212 million which shall further attract international investors as the new partners will be expected to introduce innovative products at PSX.
Despite outflows in FIPI, Average Daily Trading Volume (ADTV) on KSE 100 remained buoyant at 281 mn shares during CY16 compared to 246 mn shares in CY15 (+14% YoY) signifying greater activity. Upcoming reclassification in MSCI Emerging Index may result in further multiple rerating of the stock market.
25,000
30,000
35,000
40,000
45,000
50,000
Dec 16Nov 16Oct 16Sep 16Aug 16Jul 16Jun 16May 16Apr 16Mar 16Feb 16Jan 16
Telecom Policy2015-2016approved
Pakistan & Qatarsign $ 16 bn LNGdeal
Pakistan liftsIran sanctions,eyes $5 bn trade
IMF approved10th tranche
Federal Budget2016-2017
SBP maintainsstatus quo at6.25% discountrate
S&P upgradedPakistan’s ratingto “B” with“Stable” outlook
Pakistan issues$ 1bn five yearSukuk bonds
SBP maintainsstatus quo at6.25% discountrate
OPEC deal
New COASannounced
Us Election
World Bankproject 5.4%GDP growth in2018
Firts Chineseshipment rolls atGilgit Baltistan
Renault to beginassembling carsby 2018
Govermentlaunches US$500 mn inIslamic bonds
IMF MD visitsPakistan for thefirst time in tenyear
Auto Policyapproved
MSCI includedPakistan intoMSCI EmergingMarket Index
Pakistan & IMFconcluded finalreview of EFFProgram
KSE-100 Index - Event Chart CY16
43Annual Report 2016

Nasdaq Composite 5,383 5,007 7.5% 7.5% 5,487 4,267 2.2%
Oman 5,783 5,406 7.0% 7.0% 6,020 4,867 1.6%
Germany 11,481 10,743 6.9% 3.3% 11,481 8,753 1.6%
MSCI World 1,751 1,663 5.3% 5.3% 1,774 1,469 0.0%
Saudi Arabia 7,210 6,912 4.3% 4.4% 7,257 5,416 -1.0%
MSCI Asia ex Japan 427 411 3.7% 3.7% 458 358 -1.6%
Kuwait 5,748 5,615 2.4% 1.5% 5,753 4,937 -3.0%
India 26,626 26,118 1.9% -0.7% 29,045 22,952 -3.4%
Hong Kong 22,001 21,914 0.4% 0.3% 24,100 18,320 -4.9%
Qatar 10,437 10,429 0.1% 0.1% 11,409 8,517 -5.2%
Singapore 2,881 2,883 -0.1% -2.1% 2,961 2,533 -5.4%
MSCI Frontier Market 499 506 -1.3% -1.3% 519 452 -6.6%
Philippines 6,841 6,952 -1.6% -6.8% 8,102 6,084 -6.9%
Malaysia 1,642 1,693 -3.0% -6.9% 1,728 1,601 -8.3%
Sri Lanka 6,228 6,895 -9.7% -13.0% 6,895 5,862 -15.0%
China 3,104 3,539 -12.3% -18.0% 3,539 2,656 -17.6%
Worldwide Indices Performance In CY16
CountryIndex Index Relative to
WorldIndex31-Dec-16 31-Dec-15 Absolute
Return USD Return High Low
Russia 1,152 757 52.2% 52.2% 1,164 628 46.9%
Pakistan 47,807 32,816 45.7% 46.4% 47,807 30,565 40.4%
Brazil 60,227 43,350 38.9% 69.1% 64,925 37,497 33.6%
Thailand 1,543 1,288 19.8% 20.5% 1,553 1,225 14.5%
Indonesia 5,297 4,593 15.3% 18.1% 5,472 4,414 10.0%
Vietnam 665 579 14.8% 13.4% 689 522 9.5%
U.K. 7,143 6,242 14.4% -4.1% 7,143 5,537 9.1%
Dow Jones 19,763 17,425 13.4% 13.4% 19,975 15,660 8.1%
Dubai 3,531 3,151 12.1% 12.0% 3,657 2,622 6.7%
S&P 500 2,239 2,044 9.5% 9.5% 2,272 1,829 4.2%
MSCI Emerging Market 862 794 8.6% 8.6% 927 689 3.3%
44 Cyan Limited

Sectoral Performance in CY16
-10 0 10 20 30 40 50 60 70 80Automobile Assembler
Cement
Oil & Gas Marketing Companies
Textile
Oil & Gas Exploration Companies
Pharmaceuticals
Commercial Banks
Food & Personal Care Products
Insurance
Power Generation & Distribution
Fertilizer -5%10%
15%16%
33%47%
52%58%
66%66%
73%
Sector ReviewsOn sectoral front, Automobile Assemblers, Cements, Oil & Gas Marketing Companies (OMCs), Textiles, Oil & Gas Exploration Companies (E&Ps) and Pharmaceuticals outperformed KSE-100 Index, whereas, Banks, Food & Personal Care Product, Insurance, Power Generation & Distribution and Fertilizers underperformed.
Attractive valuations and improving earnings outlook owing to sharp recovery in oil prices resulted in impressive performance of E&Ps. OMCs also performed well on the back of upward trajectory witnessed in oil products volume coupled with improving margins on high speed diesel and motor gasoline which are now linked with CPI inflation.
The auto industry also continued its uptrend as auto volumes registered a hefty increase of 20% YoY in FY16 on the back of decreasing interest rates thus creating favorable scenario for the sector. The pricing power of local original euipment manufacturer allows them to maintain their margins and pass-on any negative exchange rate impact.
Cement sector remained buoyant led by surge in infrastructure development initiated by the current government and early harvest of CPEC related projects. Textile sector also remained in the limelight owing to long awaited Textile Package which is expected to boost the sector profitability and increase exports going forward.
45Annual Report 2016

Rs. in Million
Particular 2016 2015 Change
Return on investments 202 161 25%
Gain on sale of investments - net 259 323 (20%)
Other income 35 7 400%
496 491 1%
Unrealized appreciation 364 223 63%
860 714 20%
Operating & administrative expenses (113) (218) 48%
Financial charges (13) - N/A
Proft before tax 734 496 48%
Taxation (23) (161) 86%
Profit after tax 711 335 112%
Earnings per share – Rupees 12.13 5.71 112%
Company PerformanceDuring the year the company adopted an aggressive stance on the public equities and maintained its exposure at 96% (average), whereas 4% was vested towards mutual funds and Government Securities. The increase in equity exposure was based on overall improvement in the key macroeconomic metrics, particularly FX reserves and inflation in single digits. Investments were made in textile composite, power generation & distribution, cements, commercial bank, oil and gas marketing companies and fertilizer. With a sizeable exposure towards the public equities, dividends from our equity portfolio increased by 26% to Rs.199 million for the year 2016 as opposed to Rs.157 million earned last year. Dividend income from related parties increased by 46% from Rs.105 million to Rs.154 million due to good dividend from HUBCO, DAWH and DLL. Dividend income from
others decreased by 13% from Rs.52 million to Rs.45 million due to more concentration towards growth oriented stocks. The Company also earned realized capital gain of Rs.259 million (2015: Rs.323 million) and unrealized gain of Rs.364 million (2015: Rs.223 million).
Due to appreciation in the share price of Dawood Hercules and Dawood Lawrencepur Ltd. no fresh provision for impairment in value of available for sale investments was made during the year.
During 2016 profit after tax stood at Rs.711 million as compared to Rs.335 million reported last year.
The brief summary of the financial highlights for the year ended December 31, 2016 and 2015 is as under:
46 Cyan Limited

29.39%
45.14%45.68%
-10%-5%0%5%
10%15%20%25%30%35%40%45%50%55%60%65%70%
HUBCOOther than HubcoKSE-100 Return
unrealized gain 364Realized gain 259
Capital Gain
Rs.623 Million
Capital Gain on Equity 596Dividend Income 199Capital Gain on Mutual Fund 27Other Income 38
Total Income
Rs.860 Million
Related Party 154Others 45
Dividend Income
Rs.199 Million
Cyan’s Equity Portfolio Performance
Jan-16 Feb-16 Mar-16 Apr-16 May-16 Jun-16 Jul-16 Aug-16 Sep-16 Oct-16 Nov-16 Dec-16
47Annual Report 2016

0% 5% 10% 15% 20% 25% 30% 35% 40%
JS Bank
DAWH
SNGP
NBP
Nishat Mills
Gul Ahmed
Nishat Chunian
DGKC
DLL
HUBCO
Portfolio Breakup based on Top Ten Holdings * as at December 31, 2016
Textile Composite 40%Power generation & Distribution 38%Cement 7%Commercial Banks 8%Oil and Gas Marketing Companies 4%Fertilizer 3%
Sector wise Beakup based on Top Ten Holdings*
As atDecember 31, 2016
0
1000
2000
3000
4000
5000
6000
2007 2008 2009 2010 2011 2012 2013 2014 2015 2016
4,304 4,344
3,471
4,064
3,203
4,639
5,508
4,887
3,032
3,659
Total Assets
Rs. i
n M
illion
*Top ten holdings represent 99% of total portfolio
48 Cyan Limited

Earnings per ShareDuring the year the company posted earnings per share of Rs.12.13 compared to earnings per share of Rs.5.71 in 2015.
Appropriation and DividendThe Company’s profit after tax for the year ended December 31, 2016 stood at Rs.711 million compared to profit after tax of Rs.335 million last year.
The Company has announced two interim dividends of 25% each i.e. Rs.2.5 per share each thus making total payout of 50% or Rs.5 per share for its shareholders in 2016.
Objectives and Corporate StrategyCompany’s sound and satisfactory performance for last five years is backed by achievement of our corporate objectives. We are committed to mounting good asset quality portfolio and continuously build the Company at sound footing with diversified pool of income stream. We are perusing corporate finance advisory business for adding new stream of income. The key elements of our corporate strategy have been to effectively employ available resources and maximize profitability while managing and mitigating related risks.
Liquidity, Cash Flows and financing arrangementThe Company has an effective cash management system, powered by a team of dedicated and competent employees, preparing forecasts and regularly monitoring Company’s cash needs. Inflows and outflows of cash and other liquid assets, including investments, are managed on net adjusted return basis. The Company has running finance facility of Rs.1,000 million which has been utilized during the year and will be used as and when any investment opportunity arises.
Capital StructureIn the past years the Company has issued bonus shares which increased paid-up capital of the Company to Rs.586.28 million. Shareholders’ fund at the year-end totaled Rs.3,173 million. The liquidity position of the Company remains strong with a year-end current ratio of 8.
Risk management & Strategy for Mitigating RisksCompany also manages a portfolio of short term investments, made after thorough financial evaluation. The credit risk in short term investments is minimised through diversification in investments among Government Securities and highly rated money market mutual funds. Short term investments
include public equities having good financial health and highly rated money market mutual funds.
Credit riskCredit risk represents the risk of a loss if the counterparties fail to perform as contracted. The Company’s credit risk mainly arises from deposits with banks, loan to employees, Investments in mutual funds and trade and other receivables. For banks and financial institutions, management keeps deposits with reputed institutions. For investment in mutual funds, management keeps surplus funds in high rated mutual funds. Credit risk on account of dividend receivable is minimal due to the statutory protection. All transactions in listed securities are settled / paid for upon delivery using the system of National Clearing Company of Pakistan Limited. The risk of default in these transactions is considered minimal due to inherent systematic measures taken therein. Further, risk of investment in mutual funds is also minimal as Company is substantially exposed to high rated money market funds.
Market riskMarket risk is the risk of change in market prices, such as foreign exchange rates, interest rates and equity prices will affect the Company’s income or the value of its holdings of financial instruments. The objective of market risk management is to manage and control market risk exposures within acceptable parameters, while optimising the return. However, the Company is exposed to interest rate risk and equity price risk.
The Company is exposed to market risk with respect to its investments, long term loans, short term deposits and bank balances. The Company limits market risk by maintaining a diversified portfolio and by continuous monitoring of developments in the equity market. The market risks associated with the Company’s business activities are interest rate risk and price risk. The Company is not exposed to material currency risk.
Interest rate riskInterest rate risk is the risk that the fair values of future cash flows of a financial instrument will fluctuate because of changes in market interest rates. Since the Company has a substantial exposure towards money market mutual funds therefore it is exposed to interest rate risk, however the same is mitigated via investing in these funds with less than 90 days duration.
Equity price riskThe Company is exposed to equity price risk because of investments held by the Company and classified
49Annual Report 2016

on the Statement of Financial Position as available for sale and at fair value through profit or loss. To manage its price risk arising from investments in equity securities, the Company diversifies its portfolio within the eligible stocks.
Foreign currency risk The Company is not materially exposed to risk from foreign currency exchange rate fluctuations.
Relationships with StakeholdersThe Company recognizes and respects the rights of each and every stakeholder including shareholders, employees, creditors, local communities and others. The Company encourages active participation of shareholders in all general meetings of the Company and values their views towards better governance and operational management. The Company is also aware of its legal and constructive obligations towards its stakeholders where it operates and takes proper actions to timely respond to their expectations after taking into account a realistic view of their interests associated with the Company. A detailed presentation is made at all shareholders meeting for keeping them abreast with the overall performance of the Company.
Information TechnologyWe strongly believe that role of IT is very important for progress of any business. In order to achieve better market infrastructure and implementations of sound techniques for controls of risks, the role of IT is very important. Besides, significant progress has been made towards the implementation of certain other key applications, i.e. human resource management, risk management, enterprise general ledger and fixed assets module. We are hopeful that by the above developments, the operational capabilities of relevant department of the Company will be improved and this will support for improvement of internal controls and effective management information system.
Human Resources Development, Training & Succession Planning The Company has employed experienced and qualified human resources to meet the challenges ahead. Company also plans to strengthen its team, use employee performance evaluation methods and benchmark surveys to further strengthen organization structure and effectiveness.
Staff training is carried out on a continuous basis throughout the year, based on the assesse training need particularly in the area of knowledge enhancement and skills. Training and human resources development always remains very
important for the Company. The Company HR Manual is designed in such a way that always gives proper reward, sense of encouragement and motivation amongst the staff members.
The Company not only attracts the best talent in the company but also grooms and develops their abilities for future leadership roles. The Company believes in empowering employees by providing them with challenging opportunities to enhance their potential and develop their abilities. Clear roles and job descriptions are defined, based on which, succession plan is prepared for sensitive and critical positions in the Company.
Internal ControlThe internal control framework has been effectively implemented through an in-housed Internal Audit function established by the Board which is independent of the External Audit function. The Company’s system of internal control is sound in design and has been continually evaluated for effectiveness and adequacy. The Audit Committee has ensured the achievement of operational, compliance, risk management, financial reporting and control objectives, safeguarding of the assets of the Company and the shareholders’ wealth at all levels within the Company. The Internal Audit function has carried out its duties under the charter defined by the audit Committee. The Audit Committee has reviewed material Internal Audit findings, taking appropriate action or bringing the matters to the Board’s attention where required. Coordination between the External and Internal Auditors was facilitated to ensure efficiency and contribution to the Company’s objectives, including a reliable financial reporting system and compliance with laws and regulations.
Corporate Social Responsibility (CSR)Sustainable and responsible development is not only binding by local laws on corporate entities, but it is more about moral obligation which needs to be followed and practiced with the best spirit. Cyan strongly believes that improving its environmental and social performance is inevitable for its financial success. The Company always emphasises on culture of excellence, good governance, transparency, integrity and accountability. We continued with our CSR program with focus on:
• Education • Health Sector • Community Building
- Children Welfare- Heritage Preservation- Relief Activities
50 Cyan Limited

Energy ConservationThe Company’s energy conversation measures include usage of energy savers all around the company areas and shutting down auxiliaries and equipment’s wherever possible.
Occupational Health, Safety & Environment ProtectionWe are committed to achieve excellence in health, safety and environment across our business. Cyan maintains a safe working environment and takes responsibility for the health and wellbeing of its staff and stakeholders. All new employees are required to go through a compulsory medical checkup at the time of appointment.
Community investment & welfare schemesSupport of community development continued to be a significant element of Cyan’s CSR policy. The Company is committed to work with community in a way that delivers positive and lasting change for people in need.
Corporate RelationsCorporate relations promote efficiency, productivity and decent work. Indeed, a participative and mutually respecting relations, advance cooperation, enhance productivity and promote trust thereby reducing dislike and exploitation. During the year recreational and motivational activities in the form of cricket matches were organized with other institutions.
Business Ethics and Anti-corruption MeasuresIt is a fundamental policy of the Company to conduct its business with honesty, integrity and in accordance with the highest ethical and legal standards. Unethical practices of any sort are not to find their way into our business. All employees must act at all times in the interest of Company’s shareholders and no employee shall ever commit an illegal or an unethical act, or instruct and encourage another employee to do so.
The Company has communicated the Code of Conduct to all its directors and employees and has also placed it on its website.
Contribution to National ExchequerCyan made a sizeable contribution of Rs.47.18 million to the National Exchequer by way of taxes, during the year 2016.
Corporate AwardsThe Company was selected amongst the Top 25 Companies for the year 2014 by Pakistan Stock Exchange (PSX) on September 16, 2016. Cyan was
selected by the PSX on the basis of comprehensive parameters, which includes dividend payouts, return on equity, compliance with Listing Regulations and sound corporate governance practices.
The Company was ranked “3rd” in “Other Sector” category for the year 2015 by the Institute of Chartered Accountants of Pakistan (ICAP) and Institute of Cost and Management Accountants of Pakistan (ICMAP) on October 7, 2016. Cyan was selected by the ICAP and ICMAP on the basis of comprehensive parameters, which include transparency in preparing the annual reports according to international best practices, compliance with Listing Regulations and sound corporate governance practices.Credit RatingOn December 13, 2016 JCR-VIS Credit Rating Company Limited has reaffirmed the entity ratings of ‘A/A-1’ (A /A-One) to Cyan Limited (CL). Outlook on ratings is ‘Stable’.Related Party TransactionsDuring the year all transactions made with associated companies/related parties were duly recommended by Board’s Audit Committee and approved by the Board of Directors of the Company. All transactions with related parties are on arm’s length basis.Board of DirectorsThe Board comprises of Seven Directors. Changes in the BoardDuring the year, there were no changes in the Board of Directors of Cyan Limited.
Conflict of Interest among BOD MembersAny conflict of interest is managed as per provisions of the Ordinance and rules and regulations of SECP and Pakistan Stock Exchange Limited.CEO Performance ReviewAppointment of the Chief Executive Officer (CEO) is made by the Board of Directors for tenure of three years. Each year, the Board reviews performance of the CEO against pre-determined operational and strategic goals. The Board adopts the monitoring role, giving full authority to the CEO to manage the Company, implement strategic decisions and policies of the Board and align the Company’s direction.Directors Training ProgrammeAll seven directors have a minimum of fourteen years of education. All the directors have obtained certification under the Directors’ Training Program as stipulated in the Code of Corporate Governance
51Annual Report 2016

as contained in the PSX Rule Book.Safeguarding of Company RecordsDue to increasing dependence on IT for recording and reporting of financial transactions, due attention has been given to IT enabled tools for security of financial records. We archived financial and supporting record using Cloud services enabling timely and convenient retrieval of relevant documents. For ensuring safety of documentation, the Company has hired services of Data Recall, an organization responsible for maintaining documents in a sealed box at the state of the art designed facility. At the location, each box and cabinet are bar coded providing efficient and effective traceability.
Board MeetingsDuring the year under review, five (5) meetings of the Board of Directors were held, which were all presided over by the Chairman. The Chief Financial Officer and Company Secretary also attended the meetings required by the Code of Corporate Governance as contained under the PSX Rule Book. Attendance by each director was as follows:
No. of meetings
held
No. of meetings attended
Shahzada Dawood(Chairman) 5 5Kulsum Dawood (Director) 5 4Sulaiman S. Mehdi (CEO/Director) 5 5Ghias Uddin Khan (Director) 5 2Hassan Reza-ur Rahim (Director) 5 3Kamran Nishat (Director) 5 4Shafiq Ahmed (Director) 5 5
Board Audit Committee MeetingsNo. of
meetings held
No. of meetings attended
Kamran Nishat (Chairman) 6 5Ghias Uddin Khan (Member) 6 1Hasan Reza-ur Rahim (Member) 6 4Shafiq Ahmed (Member) 6 6
Board Investment Committee MeetingsNo. of
meetings held
No. of meetings attended
Hasan Reza-Ur Rahim (Chairman) 4 3Kulsum Dawood (Member) 4 3Shahzada Dawood (Member) 4 4Shafiq Ahmed (Member) 4 3
Board HR & Remuneration Committee Meetings No. of
meetings held
No. of meetings attended
Ghias Uddin Khan (Chairman) 1 1Hasan Reza-Ur Rahim (Member) 1 1Kamran Nishat (Member) 1 1
Code of ConductDuring the year, the Board of Directors adopted the Code of Conduct for Directors and for employees and the same has been circulated to board members and employees in terms of requirement of the amendments made in the Code of Corporate Governance. The Code of Conduct is also placed at the Company’s website.Corporate and Financial Reporting Framework a) The financial statements prepared by the
management of the Company, present fairly its State of Affairs, the Results of its Operations, Cash Flows and Statement of Changes in Equity.
b) The Company has maintained proper books of accounts as required under the Companies Ordinance, 1984.
c) The Company has followed consistent and appropriate accounting policies in the preparation of the financial statements. All changes, wherever made during the year have been adequately disclosed and accounting estimates are on the basis of prudent and reasonable judgment.
d) The International Financial Reporting Standards (IFRS), as applicable in Pakistan, have been followed in the preparation of financial statements and any departure there from has been adequately disclosed.
e) The system of internal control is sound in design and has been effectively implemented and monitored.
52 Cyan Limited

f) The fundamentals of the Company are strong and it has the ability to continue as a going concern free from uncertainties.
g) The Company has followed the best practices of the Corporate Governance as laid down in the PSX Rule Book and there has been no material departure there from.
h) There are no statutory payments on account of taxes, duties, levies and charges which are outstanding except in the ordinary course of business and described in the financial statements.
i) The value of investments of the Provident Fund as maintained by the Company on the basis of audited accounts as on June 30, 2016 is Rs.17.74 million.
j) There was no trading of shares by Directors, Chief Executive, Chief Financial Officer, Company Secretary, their spouses and minor children during the year.
k) All of the Company’s directors are Certified Directors under Directors’ Training Program from approved institutes as prescribed by SECP.
OwnershipAs at December 31, 2016, there were 1,976 shareholders on the record of the Company.Pattern of ShareholdingThe pattern of Shareholding of the Company as at December 31, 2016, along with the necessary information is available at the end of this report.AuditorsThe present auditors M/s. A.F. Fergusons &
Co. (Chartered Accountants) being eligible, has provided their consent for appointment at the 57th annual general meeting. The Audit Committee has recommended the appointment of M/s. A.F. Ferguson & Co. as Statutory Auditors of the Company for the year ending December 31, 2017. The Board has endorsed this recommendation.Key operating and financial dataA Statement summarizing the key financial and operating data for the last nine years along with the current year is included in the report.Forward Looking InformationPakistan’s economy is on track with CPEC turning from a dream to reality, Pakistan has attained serious attention from the world at large. There is optimism within the business community and overall improved economic activity. The Company is actively undertaking portfolio management business and corporate finance advisory business and the outlook is positive. The management team under its CEO is fully committed to deliver a superior risk adjusted return to the shareholders.
AcknowledgementWe would like to thank all our stakeholders, especially our valued investors, who have placed their confidence in us and also appreciate the efforts put in by the management team for their unswerving commitment and hard work. The Board would also like to place its appreciation for the Securities & Exchange Commission of Pakistan, State Bank of Pakistan and the management of the Pakistan Stock Exchange for their continued support and cooperation.
On behalf of the Board
Kamran Nishat Sulaiman S. Mehdi Director CEO
Karachi: February 22, 2017
53Annual Report 2016

Five years ago, the market capitalization of the Company was Rs.1.95 billion which has increased to Rs.4.52 billion on December 31, 2016.
Pakistan Stock Exchange (PSX) generated above average gains in the outgoing year 2016. Benchmark total return KSE-100 Index gained 46% (45% in US$ terms) in 2016 compared to last 10-year average return of 20% (15% in US$ terms) and last 20-year average return of 24% (19% in US$ terms).
Amongst Asian markets Pakistan remained on top. Moreover it also topped the MSCI Frontier Markets. Pakistan market posted 5th highest return in the world. Strong performance of Pakistan equities in 2016 was mainly led by strong local liquidity on account of falling
interest rates and rising investor interest due to inclusion in the MSCI EM Index. Automobiles and Cements remained top performing sectors in 2016 posting market cap gains of 73% and 66%, respectively. Index heavy weight Oil & Gas Exploration sector (E&Ps) was up 52% whereas Banks were up 33%. Fertilizer sector was down 5% due to weak fertilizer demand and high inventory levels.
During the year your Company earned Rs.711 million in net income and the portfolio was up 38.66% vs KSE-100 index of 45.68%. The underperformance was primarily due to below market performance of HUBCO having a significant weight of 36% in the total portfolio. During the year the Company adopted an aggressive stance on the public equities and maintained its exposure at 96% (average),
MESSAGECEO’S
54 Cyan Limited

whereas 4% was vested towards mutual funds and Government Securities. The equity portfolio was aligned towards high growth investments and to this effect investments were made in Textile Composite, Cements, Commercial Bank and Oil & Gas Marketing Companies.
Achieving MilestonesThe Company has announced two interim dividends of 25% each i.e. Rs.2.5 per share each thus making total payout of 50% or Rs.5 per share for its shareholders in 2016.
During five years, the market capitalization of the Company has grown from Rs.1.95 billion to Rs.4.52 billion generating return of 132%. During the last five years, the Company managed to pay a total dividend of Rs.5.30 billion which makes the total cumulative shareholders’ return of 484%; whereas the benchmark KSE-100 Index managed a return of 321% during the same period reflecting Cyan’s above average performance of 163%. This translates into a 5-year Compounded Annual Growth Rate (CAGR) of 42%, making the pay-back period of two years for an investor who invested in the stock five years ago.
Engaging New opportunitiesWe are also aggressively looking to explore corporate advisory services for adding new streams of revenue.
Economic OutlookThe economic future looks bright and keen. As the government remains focused and committed to energy and manufacturing sectors, and with the ongoing privatization, all ingredients are there in place for a probable, sustainable high growth trajectory. We expect stock market to continue its growth trajectory in 2017 due to notable improvement on the macro-economic front, rising domestic demand, CPEC led investments, increasing local liquidity and expected foreign flows due to reclassification to MSCI’s Emerging Market Index. Further, we prefer sectors which have direct exposure to infrastructure i.e. CPEC projects, which include Cements and Steels. We also like Consumers/Autos and Oil & Gas Marketing.
AcknowledgmentsI would like to take this opportunity to thank all our Shareholders and the Board of Directors for their immense support. The Company’s accomplishments and present standing could not have been possible without the commitment and efforts of our employees who deserve full compliment. I am confident that the team will continue to grow and constantly deliver on expectations of all stakeholders. Together, our future is exceedingly bright. Let us continue to unearth our potential and use it for our success.
Sulaiman S. Mehdi Chief Executive Officer
Karachi: Febuary 22, 2017
55Annual Report 2016

RESPONSIBILITY REPORTCORPORATE SOCIAL
Corporate Social Responsibility (CSR) is one of the core values and an integral part of the Company’s overall mission. By integrating CSR into our business strategy, Cyan is helping to drive shared value amongst its stakeholders and enhance its corporate brand image community wide.
We are determined to ensure that our businesses operate in an ethical, sound and responsible manner. We strive to generate maximum social value to build a better, more sustainable realm for all.
We take great pride in having continued our CSR efforts in 2016 through contributions for various initiatives that supported the provision of better health services, quality education and preservation of Pakistan’s culture.
56 Cyan Limited

Healthcare
Healthcare is an essential need of the society. Pakistan needs special attention to healthcare improvements and infrastructure. Cyan is cognizant of the fact that healthcare system should exist as a fundamental element that assures life and high standards of living, and it should be available to everyone.
In 2016, we continued supporting our belief by contributing with institutions that can help people suffering from various diseases in Pakistan. As a result, Cyan focused its support towards the following organizations:
Fatimid FoundationFatimid Foundation Quetta Centre (FFQC) is the only hope for thousands of children with Thalassemia and Hemophilia who live from moment to moment. FFQC is a benchmark for all hospitals in Balochistan providing free health care facilities to these young and poor Baloch patients suffering from these incurable lifelong diseases.
Cyan participated in their “Car Sticker Campaign” to support their cause.
Marie Adelaide Leprosy CentreOver the last 57 years, the Marie Adelaide Leprosy Centre (MALC) has been one of Pakistan’s leading institutions in the effort to eliminate leprosy, treat TB, prevent blindness and develop sustainable communities. The MALC has also been prominent in providing timely relief and rehabilitation for the victims of natural and human disasters. In 2016, Cyan contributed in their efforts to serve humanity.
57Annual Report 2016

Education Initiatives
Pakistan is one of countries across the world where difficult economic conditions result in less than half of enrolled students completing primary school before they are forced to join the workforce. In addition, the quality of education at state-owned educational institutions has sharply deteriorated in the past few decades.
The company recognizes education as one of the building blocks of any nation and considers it as a priority area for its CSR activities. All these initiatives have been undertaken to benefit the society the company is operating in, so to contribute in increasing the literacy levels.
Education Trust Nasra SchoolThe Trust was registered in 1950 under the Trust Act of 1982. The School which started off in 1949 with 2 rooms in the Wazir Ali Home, led over a period of 65 years to the establishment of 5 purpose built campuses located in Saddar, Malir, Korangi, Super Highway and North Karachi that provide education to thousands of underprivileged boys and girls from low income families.
The Education Trust Nasra School currently enrolls 10,900 children providing education from pre-primary to Higher Secondary levels in a healthy co-educated environment. The Trust provides scholarships to 20% of deserving students and also has a commitment to educate orphans.
This year, Cyan donated to support the Trust.
58 Cyan Limited

Culture and Community
Culture is the art and custom that characterize a particular society or nation and so it contributes as an essential pillar of corporate social responsibility. At Cyan we believe in reviving our culture and traditions to empower our heritage and boost our national values.
Our endeavors are aimed at sustaining values of society by preserving the richly diversified culture and heritage of Pakistan. In 2016, we continued our involvement in efforts to safeguard and highlight the ethos of Pakistan for future generations.
Department of Public Administration – University of KarachiThe University of Karachi is the biggest university in the country. It comprises eight faculties with which all the colleges of the city are affiliated.
Department of Public Administration at The University of Karachi organized a mega event on the occasion of 51st Defense Day named “A Fortress Rebuilt”, in memory of our brave soldiers who laid their lives protecting our homeland in the 1965 war against India. Cyan was one of the prominent sponsor to the mega event.
59Annual Report 2016


FOCUSWE NEVER LOOSE
SIGHT OF OUR AIMS, AND CONTINUE WITH

MAJOR EVENTSCALENDAR OF
February2016
Cyan Board of Directors meeting was held to approve the financial statements for the year ended December 31, 2015 and recommend 40% final cash dividend to the shareholders.
August2016
Cyan Board of Directors meeting was held to approve the unaudited financial statements for the half year ended June 30, 2016 and declare 25% interim cash dividend to the shareholders.
March2016
56th Annual General Meeting of the shareholders of the Company was held to approve financial statements for the year ended December 31, 2015 and 40% final cash dividend to the shareholders.
September 2016
The Company was ranked 3rd in Best Corporate Report Award by ICAP and ICMAP. The Company was also ranked among theTop 25 Companies for the year 2014 by Pakistan Stock Exchange.
April2016
Cyan Board of Directors meeting was held to approve the first quarter accounts for the period ended March 31, 2016.
October2016
Cyan Board of Directors meeting was held to approve the third quarter accounts for the nine months period ended September 30, 2016.
December2016
Cyan Board of Directors meeting was held to discuss Corporate Strategy for the year 2017. The Board of Directors also declared 25% interim cash dividend to the shareholders.
62 Cyan Limited

OPPORTUNITY REPORTRISK AND
The Company’s business activities are subject to significant risk factors that could affect Company’s operations, earnings, cash flows and other financial performance. Cyan management strives to manage risks in an organized manner in order to conduct business in a well-controlled environment.
A summary, highlighting major SWOT factors , is presented below:
STRENGTHS1. Successful track record of managing public equities portfolio2. Group credibility and relationships3. Team with diversified skill sets4. Group foot print in multiple sectors5. Successful history of pipe deals6. Good understanding of high potential sectors- Retail, Food, Agriculture, Health, Education, Logistics and Pharma
WEAKNESSES1. High tax burden under current legal structure2. Lean Team
1. Using network to identify new investment opportunities2. Targeting new high potential growth sectors3. Private Investment in Public Equities (PIPE) transactions
OPPORTUNITIES
1. Key Team members getting poached
THREATS
SWOT ANALYSIS
63Annual Report 2016

INFORMATIONSHAREHOLDERS’
Registered Off ice Share Registrar Off iceCyan Limited Technology Trade (Pvt.) Ltd.4th Floor, Dawood Centre, Dagia House, 241-C, Block-2,M. T. Khan Road, P.E.C.H.S., Off: Shahrah-e-QuaideenKarachi. Karachi. Tel # (92-21) 35634290-3 Tel # (92-21) 34391316-7 & 19, 34387960-61Fax # (92-21) 35680218 Fax # (92-21) 34391318 Web site: www.cyanlimited.com Web site: www.ttpl.com.pkEmail: [email protected]
Listing on Stock ExchangeCyan shares are listed on Pakistan Stock Exchange (PSX).
Listing FeesThe annual listing fee for the financial year 2016-2017 has been paid to the stock exchange within the prescribed time limit.
Stock CodeThe stock code for dealing in shares of Cyan at PSX is CYAN.
Investor Service CentreCYAN share department is operated by Technology Trade (Pvt.) Ltd, Registrar Services. It also functions as an Investor Service Centre and has been servicing nearly 2000 shareholders. The Investor Service Centre is managed by a well-experienced team of professionals and is equipped with the necessary infrastructure in terms of computer facilities and comprehensive set of systems and procedures for conducting the registration function. The team is headed by Mr. M. Junaid Dagia at Registrar Office and Mr. Wahaj Ghulam Hussain, Manager Compliance and Risk Management at Cyan Registered Office.
Cyan share department has online connectivity with Central Depository Company of Pakistan Limited. The share department undertakes activities pertaining to dematerialization of shares, shares transfer and transmission, issue of duplicate/ re-validated dividend warrants, issue of duplicate / replaced share certificates, change of address and other related matters.
For assistance, shareholders may contact either the Registered Office or the Share Registrar Office.
Contact Person: Contact Person:Cyan Limited Registrar Off iceMr. Wahaj Ghulam Hussain Mr. M. Junaid DagiaTel# (92-21) 35634290-3 Tel # (92-21) 34391316-7 & 19Email: [email protected] Email: [email protected]
64 Cyan Limited

Service StandardsCyan has always endeavored to provide investors with prompt services. Listed below are various investor services and the maximum time limits set for their execution:
For request(s) received
Through post Over the counter
Transfer of shares 45 days after receipt 45 days after receipt
Transmission of shares 45 days after receipt 45 days after receipt
Issue of duplicate share certificates 45 days after receipt 45 days after receipt
Issue of duplicate dividend warrants 5 days after receipt 5 days after receipt
Issue of revalidated dividend warrants 5 days after receipt 5 days after receipt
Change of address 2 days after receipt 1 day after receipt
Well reputed and experienced firm of the share registrar services has been entrusted with the responsibility of ensuring that services are rendered within the specified time limits.Statutory ComplianceDuring the year the Company has complied with all applicable provisions, filed all returns / forms and furnished all the relevant information as required under the Companies Ordinance 1984 and allied laws and rules, the Securities and Exchange Commission of Pakistan (SECP) Regulations and the PSX Rule Book.Book Closure DatesThe register of Members and share transfer books of the Company will remain closed from Thursday, 20th April 2017 to Friday, 28th April 2017 (both days inclusive).Investors GrievancesAs on date none of the investor or shareholder has filed any letter of complaints against any service provided by the Company to its shareholders.General Meetings & Voting RightsPursuant to section 158 of The Companies Ordinance 1984, Cyan holds a General Meeting of Shareholders at least once a year. Every shareholder has a right to attend the General Meeting. The notice of such meeting is sent to all the shareholders at least 21 days before the meeting and also advertised in at least one English and one Urdu newspaper having circulation in Sindh.All shares issued by the Company carry equal voting rights. Generally, matters at the General Meetings are decided by a show of hands in the first instance. Voting by show of hands operates on the principle of “One Member-One Vote”. If majority of shareholders raise their hands in favor of a particular resolution, it is taken as passed, unless a poll is demanded. ProxiesPursuant to Section 161 of The Companies Ordinance, 1984 and according to the Memorandum and Articles of Association of the Company, every shareholder of the Company who is entitled to attend and vote at a General Meeting of the Company, can appoint another person as his / her proxy to attend and vote instead of himself / herself. The instrument appointing proxy, duly signed by the shareholder appointing that proxy should be deposited at the office of the Company not less than forty-eight hours before the meeting.Web PresenceUpdated information regarding the Company can be accessed at Cyan website www.cyanlimited.com. The web site contains the latest financial results of the Company.
65Annual Report 2016

EXCELLENCEWE THRIVE ON SETTING GOALS FOR US TO ACHIEVE


TEN YEARS AT A GLANCE
HIGHLIGHTSKEY FINANCIAL
Particulars 2007 2008 2009 2010 2011 2012 2013 2014 2015 2016
Rupees in ‘000 Rupees in ‘000
Earnings
Investments income / (loss) 2,752,567 142,741 (111,619) 179,500 479,664 1,780,134 1,451,519 1,209,576 706,755 824,472 Profit / (loss) before taxation 2,764,738 133,687 (844,897) 114,268 (172,089) 1,503,026 1,212,275 1,027,245 495,907 734,281 Profit / (loss) after taxation 2,747,982 116,421 (855,118) 108,312 (197,508) 1,428,207 1,176,049 898,787 335,035 711,233
Pay Out Information %
Cash dividend 50 20 20 25 25 40 100 675 40 50 Stock dividend 20 20 25 50 40 50 - - - -
Balance Sheet
Paid up capital 139,834 184,581 203,039 279,179 390,851 586,277 586,277 586,277 586,277 586,277 Equity 4,115,396 4,187,070 3,315,346 3,884,527 3,154,067 4,463,798 5,311,292 4,590,513 2,515,137 3,172,603 Investments 4,108,830 1,991,293 3,272,032 3,927,349 2,947,025 4,533,865 5,383,322 4,780,356 2,825,317 3,612,508 Cash & cash equivalents 97,520 64,773 65,136 10,296 19,230 13,494 17,835 21,844 159,891 906 Fixed assets 4,103 3,187 2,558 1,944 1,590 26,194 22,814 18,752 15,623 14,017 Total assets 4,303,732 4,343,680 3,471,077 4,064,279 3,202,647 4,638,820 5,507,511 4,886,548 3,032,369 3,659,044
Operating Performance
Earning / (Loss) per share (Rupees) 148.88 5.73 (30.63) 2.77 (3.37) 24.36 20.06 15.33 5.71 12.13 Break up value per share (Rupees) 294.31 227.13 163.29 139.14 80.7 76 91.00 78.30 42.90 54.11 Absolute return on investments % 68.51 3.11 (3.43) 4.57 (3.00) 58.89 32.14 18.15 9.43 25.00 Return on investments % 98.61 2.80 (22.80) 3.01 (5.61) 37.49 24.10 22.47 14.78 29.18
68 Cyan Limited

Particulars 2007 2008 2009 2010 2011 2012 2013 2014 2015 2016
Rupees in ‘000 Rupees in ‘000
Earnings
Investments income / (loss) 2,752,567 142,741 (111,619) 179,500 479,664 1,780,134 1,451,519 1,209,576 706,755 824,472 Profit / (loss) before taxation 2,764,738 133,687 (844,897) 114,268 (172,089) 1,503,026 1,212,275 1,027,245 495,907 734,281 Profit / (loss) after taxation 2,747,982 116,421 (855,118) 108,312 (197,508) 1,428,207 1,176,049 898,787 335,035 711,233
Pay Out Information %
Cash dividend 50 20 20 25 25 40 100 675 40 50 Stock dividend 20 20 25 50 40 50 - - - -
Balance Sheet
Paid up capital 139,834 184,581 203,039 279,179 390,851 586,277 586,277 586,277 586,277 586,277 Equity 4,115,396 4,187,070 3,315,346 3,884,527 3,154,067 4,463,798 5,311,292 4,590,513 2,515,137 3,172,603 Investments 4,108,830 1,991,293 3,272,032 3,927,349 2,947,025 4,533,865 5,383,322 4,780,356 2,825,317 3,612,508 Cash & cash equivalents 97,520 64,773 65,136 10,296 19,230 13,494 17,835 21,844 159,891 906 Fixed assets 4,103 3,187 2,558 1,944 1,590 26,194 22,814 18,752 15,623 14,017 Total assets 4,303,732 4,343,680 3,471,077 4,064,279 3,202,647 4,638,820 5,507,511 4,886,548 3,032,369 3,659,044
Operating Performance
Earning / (Loss) per share (Rupees) 148.88 5.73 (30.63) 2.77 (3.37) 24.36 20.06 15.33 5.71 12.13 Break up value per share (Rupees) 294.31 227.13 163.29 139.14 80.7 76 91.00 78.30 42.90 54.11 Absolute return on investments % 68.51 3.11 (3.43) 4.57 (3.00) 58.89 32.14 18.15 9.43 25.00 Return on investments % 98.61 2.80 (22.80) 3.01 (5.61) 37.49 24.10 22.47 14.78 29.18
69Annual Report 2016

HIGHLIGHTSKEY FINANCIAL
Investments Income
2,7
52,5
67
142
,741
(111
,619
)
179
,500
479
,664
1,7
80,1
34
1,4
51,5
19
1,2
09,5
76
706
,755
824
,472
-500,000
0
500,000
1,000,000
1,500,000
2,000,000
2,500,000
3,000,000
2016201520142013201220112010200920082007
Investments Income
Rs. i
n 00
0,
Equity Total Assets
4,3
03,7
32
4,1
15,3
96
4,3
43,6
80
4,1
87,0
70
3,4
71,0
77
3,3
15,3
46
4,0
64,2
79
3,8
84,5
27
3,2
02,6
47
3,1
54,0
67
4,6
38,8
20
4,4
63,7
98
5,5
07,5
11
5,3
11,2
92
4,8
86,5
48
4,5
90,5
13
3,0
32,3
69
3,6
59,0
44
3,1
72,6
03
2,5
15,1
37
0
1,000,000
2,000,000
3,000,000
4,000,000
5,000,000
6,000,000
2016201520142013201220112010200920082007
Total Assets and Equity
Rs. i
n 00
0,
70 Cyan Limited

Shareholders’ equity and breakup value
Profit before taxation Profit aftertaxation
2,7
47,9
82
2,7
64,7
38
116
,421
1
33,6
87
(855
,118
) (8
44,8
97)
108
,312
1
14,2
68
(197
,508
) (1
72,0
89)
1,4
28,2
07
1,5
03,0
26
1,1
76,0
49
1,2
12,2
75
898
,787
1
,027
,245
335
,035
711
,233
7
34,2
81
495
,907
-1,000,000
-500,000
0
500,000
1,000,000
1,500,000
2,000,000
2,500,000
3,000,000
2016201520142013201220112010200920082007
Profit/ (Loss) before & after Tax
Rs. i
n 00
0,
Paid up Capital Equity
4,1
15,3
96
139
,834
4,1
87,0
70
184
,581
3,3
15,3
46
203
,039
3,8
84,5
27
279
,179
3,1
54,0
67
390
,851
4,4
63,7
98
586
,277
5,3
11,2
92
586
,277
4,5
90,5
13
586
,277
2,5
15,1
37
3,1
72,6
03
586
,277
586
,277
0
1,000,000
2,000,000
3,000,000
4,000,000
5,000,000
6,000,000
2016201520142013201220112010200920082007
Paid Up Capital & Total Equity
Rs. i
n 00
0,
71Annual Report 2016
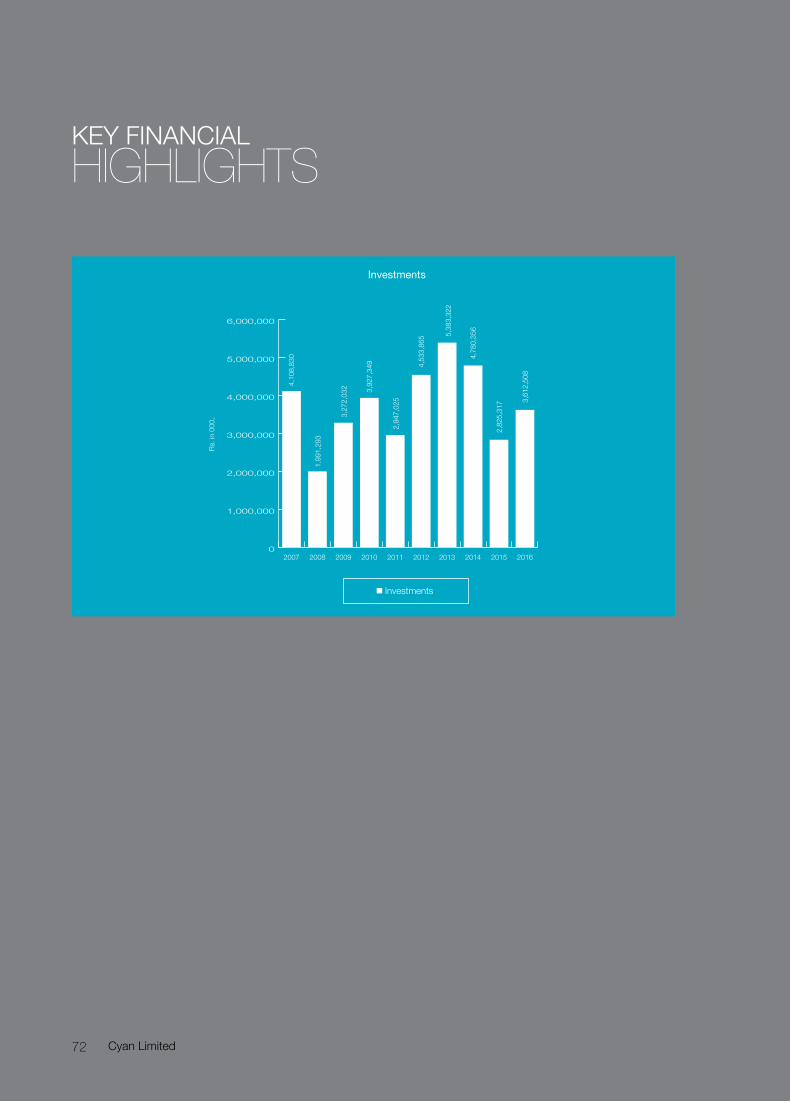
HIGHLIGHTSKEY FINANCIAL
Investments
4,1
08,8
30
1,9
91,2
93
3,2
72,0
32
3,9
27,3
49
2,9
47,0
25
4,5
33,8
65 5,3
83,3
22
4,7
80,3
56
2,8
25,3
17 3,6
12,5
08
0
1,000,000
2,000,000
3,000,000
4,000,000
5,000,000
6,000,000
2016201520142013201220112010200920082007
Investments
Rs. i
n 00
0,
72 Cyan Limited

Shareholders’ equity and breakup value
Cash Dividend Stock Dividend
50
20
20
20 20 25
25 5
0
2540 40 50
100
-
-
-
-
675
40 50
0
100
200
300
400
500
600
700
800
2016201520142013201220112010200920082007
Cash & Stock Dividend(%
)
73Annual Report 2016

Ratios Unit 2011 2012 2013 2014 2015 2016
ProfitabilityProfit before tax ratio % NA 87 83 84 70 85
Gross yield on earning assets % -4 38 27 25 24 24
Cost / income ratio % -53 13 17 16 30 15
Return on equity % -6 32 22 20 13 22
Return on capital employed % -6 37 24 18 9.43 25
Liquidity Ratios Current ratio Times 68 30 34 18 6 8
Investment / Market RatiosEarnings / (loss) per share - Basic Rs. (3.37) 24.36 20.06 15.33 5.71 12.13
Price earnings ratio Times NA 2.18 3.84 5.60 15.60 6.35
Price to book ratio Times 0.62 0.70 0.85 1.10 1.72 1.24
Dividend yield ratio % 5 8 13 79 4 6.49
Dividend payout ratio Times NA 0.16 0.50 4.40 0.70 0.41
Dividend cover ratio % NA 37 50 440 70 41
Market Value per share• At the end of the year Rs. 50 53 77 85.92 89.10 77.08
• High during the year Rs. 116 91 85 138.50 150.50 94.90
• Low during the year Rs. 54 48 47 71.79 65.17 62.50
Capital Structure RatiosEarning assets to total assets ratio Times 0.93 0.98 0.98 0.99 0.99 0.99
Net assets per share Times 81 76 91 78.30 42.90 54.11
ANALYSISRATIO
74 Cyan Limited

RATIO ANALYSISCOMMENTS ON
Comments on six years Profitability RatiosThe Company started active portfolio management after the revocation of insurance license in 2011 and the same was reflected in the last four years profitability where the Company has outperformed the KSE-100 Index, a benchmark used to gauge the performance of the Company. Despite the underperformance of the Company’s equity portfolio by 7.02% (38.66% vs KSE-100 Index performance of 45.68%) in CY16, the return on equity and return on capital employed increased compared to last year due to higher investment income in CY16.
Comments on six years Liquidity RatiosThe Company has retained its current ratio to more than 1.0x throughout the previous five years demon-strating sufficient capacity to pay its short term obligations. Further, all investments are categorized as short term investment with an objective to use these funds for the private investments as and when required.
Comments on six years Earning Asset RatiosAbove 95% of the assets of the Company contributed towards the earnings of the Company during the preceding five years indicating the efficient use of assets.
Comments on six years Balance Sheet AnalysisTotal assets and equity increased by 21% and 26% in CY16 respectively over the previous year. Currently, the total asset base of the Company stands at PKR 3.66 billion growing from PKR 3.20 billion in CY11 which translated into a Compounded Annual Growth Rate (CAGR) of 23% over the period of five years including dividend payout over five years.
Comments on six years Profit and Loss AnalysisThe factors contributing to the earnings of the Company are dependent on the performance of equity market. Consequently, variation in the net income can be witnessed from CY11 to CY16 from a loss of PKR198 million in CY11 to a profit of PKR 711 million in CY16. Apart from that, dividends and capital appreciation (realized and unrealized capital gains) in value of the overall portfolio including the strategic investments are the main contributors for revenues and hence profitability.
75Annual Report 2016

Month High Low Total Volume
Cyan Share Price on the PSX
Jan-16 90.9 77.1 598,000
Feb-16 94.90 69.55 1,818,500
Mar-16 78.9 67.10 1,214,000
Apr-16 74.1 64.50 649,000
May-16 69.70 63.00 516,000
Jun-16 68.98 62.50 238,500
Jul-16 74.00 64.00 601,000
Aug-16 74.89 69.26 977,000
Sep-16 72.87 64.51 1,018,000
Oct-16 72.00 65.55 1,235,000
Nov-16 71.99 66.00 751,000
Dec-16 82.25 70.50 1,764,000
The Company is exposed to equity price risk because of investments held by the Company and classfied on the Statement of Financial Position as available for sale and at fair value through profit or loss. To manage its price risk arising from investments in equity securities, the Company diverisfies its portfolio within the eligible stocks.
In case of increase / decrease in KSE-100 Index, the profitability of the Company would increase / decrease as a result of gains / losses on equity securities at fair value through profit or loss and available for sale. The impact of this financial performance therefore may affect share price of the Company.
SENSITIVITY ANALYSISSHARE PRICE
76 Cyan Limited

Value added 2016 2015Rs. 000 % Rs. 000 %
Return on investments 201,844 160,841 Capital gains 258,629 323,062Unrealized gain - Net 363,999 222,852Other income 35,882 7,319Gross revenue 860,354 714,074Less: Administrative expenses 65,698 72,610
794,656 100% 641,464 100%
Value Allocated
To EmployeesSalaries, allowances and other benefits 57,697 7% 131,185 19%
To ShareholdersCash dividend 381,080 48% 2,491,678 388%
To GovernmentCompany taxation 23,048 3% 160,872 25%
To SocietyWorkers' welfare fund - - 10,269 2%
To expansionDepreciation and amortization 2,678 - 4,103 1%
To growthAs reserve and retained earning 330,153 42% -2,156,643 -335%
794,656 100% 641,464 100%
VALUE ADDITIONSTATEMENT OF
Salaries, allowances and other benefitsCash DividendCompany TaxationWorkers' Welfare FundDepreciation and amortizationAs Reserve and Retained earning
7%48%
3%--
42%
Value Allocated2016
Salaries, allowances and other benefitsCash DividendCompany TaxationWorkers' Welfare FundDepreciation and amortizationAs Reserve and Retained earning
19%388%
25%2%1%
-335%
Value Allocated2015
77Annual Report 2016


TEAMWORKWE KEEP OUR WORDS, AND
GAIN TRUST THOUGH

COMPOSITIONBALANCE SHEET
Long term assets 1%Investments in Equities 97%Investments in Cash, Debt and Mutual Funds 1%Other Current assets 1%
Total Assets2016
Long term assets 1%Investments in Equities 88%Investments in Cash, Debt and Mutual Funds 10%Other Current assets 1%
Total Assets2015
Share Capital and Reserve 83%Non-Current Liabilities 3%Current Liabilities 14%
Shareholders'Equity & Liabilities
2016
Share Capital and Reserve 83%Non-Current Liabilities 2%Current Liabilities 15%
Shareholders'Equity & Liabilities
2015
80 Cyan Limited

ACCOUNT ANALYSIS OF PROFIT AND LOSS
Return on investments 24%Gain on sale of investments - net 30%Unrealised appreciation on re-measurement ofinvestments 42%Other income 4%
Analysis of Top Line Revenue- 2016
Return on investments 23%Gain on sale of investments - net 45%Unrealised appreciation on re-measurement ofinvestments 31%Other income 1%
Analysis of Top Line Revenue - 2015
81Annual Report 2016

ANALYSISHORIZONTAL
Particulars 2011 2012 2013 2014 2015 2016 12 Over 11 13 Over 12 14 Over 13 15 Over 14 16 Over 15Rupees in ‘000 Rupees in ‘000 Percentage Change
Cash and bank deposits 8,330 13,494 17,835 21,844 159,891 906 61.99% 32.17% 22.48% 631.97% -99.43%Loan to employee 7,892 7,492 6,960 16,020 14,060 12,315 -5.07% -7.10% 130.17% -12.25% -12.41%Investments 2,947,025 4,533,865 5,383,322 4,780,356 2,825,317 3,612,508 53.85% 18.74% -11.20% -40.90% 27.86%Deferred tax 3,437 - - - - - -100.00% - - - - Premiums due but unpaid 24 13 - - - - -45.83% -100.00% - - - Amounts due from other insurers / reinsurers 17,638 28,780 18,144 2,464 2,464 2,464 63.17% -36.96% -86.42% - - Accrued investment income 691 1,471 400 - - - 112.88% -72.81% -100.00% - - Reinsurance recoveries against outstanding claims 25,352 5,406 5,406 5,406 5,406 5,406 -78.68% - - - - Taxation - payments less provision 5,104 - - - - - - - - - - Advances, prepayments deposit & sundry receivables 185,583 22,105 52,630 41,706 9,608 11,428 -88.09% 138.09% -20.76% -76.96% 18.94%Fixed assets 1,590 26,194 22,814 18,752 15,623 14,017 1547.42% -12.90% -17.80% -16.69% -10.28%
Total Assets 3,202,666 4,638,820 5,507,511 4,886,548 3,032,369 3,659,044 44.84% 18.73% -11.27% -37.94% 20.67%
Issued, subscribed and paid up share capital 390,851 586,277 586,277 586,277 586,277 586,277 50.00% - - - - Unappropriated profit 2,592,494 3,688,477 4,395,503 3,535,458 1,378,815 1,708,968 42.28% 19.17% -19.57% -61.00% 23.94%Reserves 133,088 133,088 133,088 133,088 133,088 133,088 - - - - - Remeasurement of post employees benefits (36) (610) (1,726) (3,697) (3,480) (2,611) - 182.95% 114.19% 5.87% -24.97%Surplus on Revaluation - AFS investments 37,670 56,566 198,150 339,387 420,437 746,881 50.16% 250.30% 71.28% 23.88% 77.64%Provision for outstanding claims [including IBNR] 29,002 9,025 9,025 8,805 8,805 8,805 -68.88% - -2.44% - - Deferred liabilities 1,959 4,824 8,858 9,377 8,369 10,528 146.25% 83.62% 5.86% -10.75% 25.80%Deferred tax - 20,103 26,890 16,171 45,166 13,803 100.00% 33.76% -39.86% 179.30% -69.44%Amounts due to other insurers / reinsurers 3,038 1,725 587 587 587 587 -43.22% -65.97% - - - Accrued expenses 4,870 75,543 85,037 68,880 136,190 20,400 1451.19% 12.57% -19.00% 97.72% -85.02%Other creditor and accruals 383 36,590 25,573 28,337 109,105 27,712 9453.52% -30.11% 10.81% 285.04% -74.60%Accrued mark-up - - - - - 1,796 - - - - - Short term running finance - - - - - 183,265 - - - - - Taxation - net - 15,873 31,448 143,659 179,522 187,197 100.00% 98.12% 356.81% 24.96% 4.28%Unclaimed dividend 9,347 11,339 8,801 20,219 29,488 32,348 21.31% -22.38% 129.74% 45.84% 9.70%
Total Shareholders' Equity and Liabilities 3,202,666 4,638,820 5,507,511 4,886,548 3,032,369 3,659,044 44.84% 18.73% -11.27% -37.94% 20.67%
Balance Sheet
82 Cyan Limited
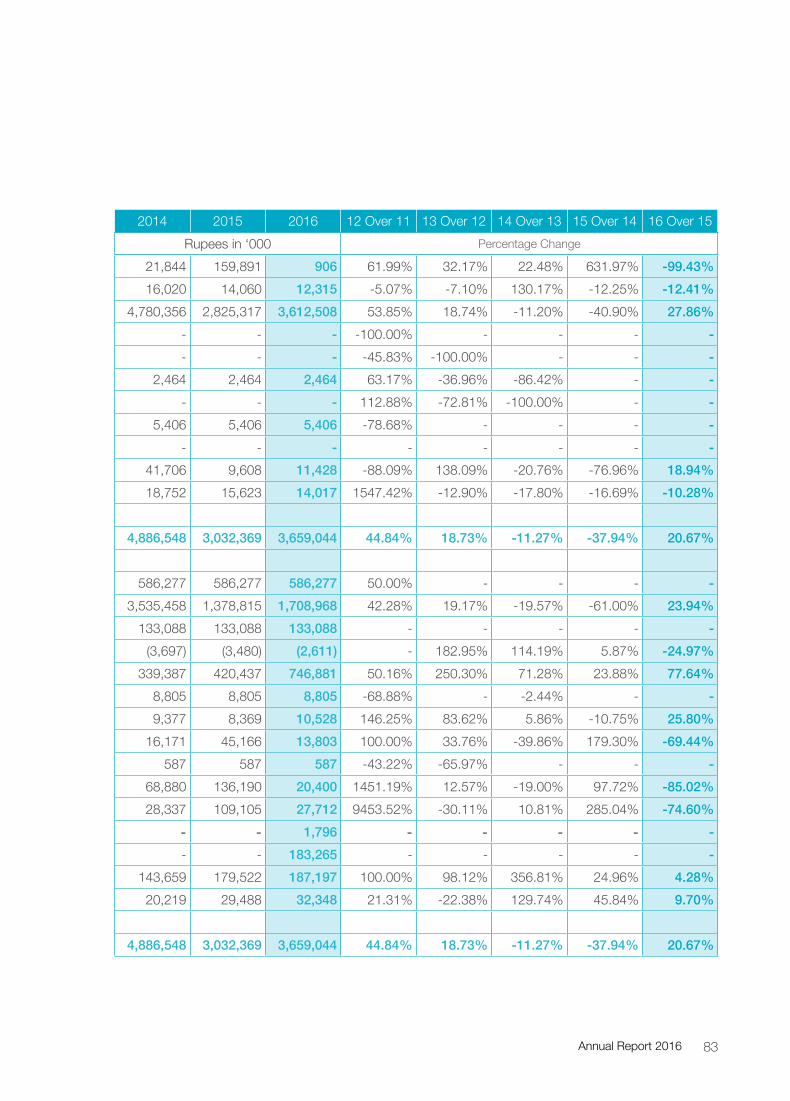
Particulars 2011 2012 2013 2014 2015 2016 12 Over 11 13 Over 12 14 Over 13 15 Over 14 16 Over 15Rupees in ‘000 Rupees in ‘000 Percentage Change
Cash and bank deposits 8,330 13,494 17,835 21,844 159,891 906 61.99% 32.17% 22.48% 631.97% -99.43%Loan to employee 7,892 7,492 6,960 16,020 14,060 12,315 -5.07% -7.10% 130.17% -12.25% -12.41%Investments 2,947,025 4,533,865 5,383,322 4,780,356 2,825,317 3,612,508 53.85% 18.74% -11.20% -40.90% 27.86%Deferred tax 3,437 - - - - - -100.00% - - - - Premiums due but unpaid 24 13 - - - - -45.83% -100.00% - - - Amounts due from other insurers / reinsurers 17,638 28,780 18,144 2,464 2,464 2,464 63.17% -36.96% -86.42% - - Accrued investment income 691 1,471 400 - - - 112.88% -72.81% -100.00% - - Reinsurance recoveries against outstanding claims 25,352 5,406 5,406 5,406 5,406 5,406 -78.68% - - - - Taxation - payments less provision 5,104 - - - - - - - - - - Advances, prepayments deposit & sundry receivables 185,583 22,105 52,630 41,706 9,608 11,428 -88.09% 138.09% -20.76% -76.96% 18.94%Fixed assets 1,590 26,194 22,814 18,752 15,623 14,017 1547.42% -12.90% -17.80% -16.69% -10.28%
Total Assets 3,202,666 4,638,820 5,507,511 4,886,548 3,032,369 3,659,044 44.84% 18.73% -11.27% -37.94% 20.67%
Issued, subscribed and paid up share capital 390,851 586,277 586,277 586,277 586,277 586,277 50.00% - - - - Unappropriated profit 2,592,494 3,688,477 4,395,503 3,535,458 1,378,815 1,708,968 42.28% 19.17% -19.57% -61.00% 23.94%Reserves 133,088 133,088 133,088 133,088 133,088 133,088 - - - - - Remeasurement of post employees benefits (36) (610) (1,726) (3,697) (3,480) (2,611) - 182.95% 114.19% 5.87% -24.97%Surplus on Revaluation - AFS investments 37,670 56,566 198,150 339,387 420,437 746,881 50.16% 250.30% 71.28% 23.88% 77.64%Provision for outstanding claims [including IBNR] 29,002 9,025 9,025 8,805 8,805 8,805 -68.88% - -2.44% - - Deferred liabilities 1,959 4,824 8,858 9,377 8,369 10,528 146.25% 83.62% 5.86% -10.75% 25.80%Deferred tax - 20,103 26,890 16,171 45,166 13,803 100.00% 33.76% -39.86% 179.30% -69.44%Amounts due to other insurers / reinsurers 3,038 1,725 587 587 587 587 -43.22% -65.97% - - - Accrued expenses 4,870 75,543 85,037 68,880 136,190 20,400 1451.19% 12.57% -19.00% 97.72% -85.02%Other creditor and accruals 383 36,590 25,573 28,337 109,105 27,712 9453.52% -30.11% 10.81% 285.04% -74.60%Accrued mark-up - - - - - 1,796 - - - - - Short term running finance - - - - - 183,265 - - - - - Taxation - net - 15,873 31,448 143,659 179,522 187,197 100.00% 98.12% 356.81% 24.96% 4.28%Unclaimed dividend 9,347 11,339 8,801 20,219 29,488 32,348 21.31% -22.38% 129.74% 45.84% 9.70%
Total Shareholders' Equity and Liabilities 3,202,666 4,638,820 5,507,511 4,886,548 3,032,369 3,659,044 44.84% 18.73% -11.27% -37.94% 20.67%
83Annual Report 2016

ANALYSISVERTICAL
Balance Sheet
Particulars 2011 2012 2013 2014 2015 2016 2011 2012 2013 2014 2015 2016Rupees in ‘000 Rupees in ‘000 Percentage Change
Cash and bank deposits 8,330 13,494 17,835 21,844 159,891 906 0.26% 0.29% 0.32% 0.45% 5.27% 0.02%Loan to Employee 7,892 7,492 6,960 16,020 14,060 12,315 0.25% 0.16% 0.13% 0.33% 0.46% 0.34%Investments 2,947,025 4,533,865 5,383,322 4,780,356 2,825,317 3,612,508 92.02% 97.74% 97.75% 97.83% 93.17% 98.73%Deferred tax 3,437 - - - - - 0.11% - - - - -Premiums due but unpaid 24 13 - - - - - - - - - -Amounts due from other insurers / reinsurers 17,638 28,780 18,144 2,464 2,464 2,464 0.55% 0.62% 0.33% 0.05% 0.08% 0.07%Accrued investment income 691 1,471 400 - - - 0.02% 0.03% 0.01% - - - Reinsurance recoveries against outstanding claims 25,352 5,406 5,406 5,406 5,406 5,406 0.79% 0.12% 0.10% 0.11% 0.18% 0.15%Taxation - payments less provision 5,104 - - - - - 0.16% - - - - - Advances, prepayments deposit & sundry receivables 185,583 22,105 52,630 41,706 9,608 11,428 5.79% 0.48% 0.96% 0.85% 0.32% 0.31%Fixed assets 1,590 26,194 22,814 18,752 15,623 14,017 0.05% 0.56% 0.41% 0.38% 0.52% 0.38%
Total Assets 3,202,666 4,638,820 5,507,511 4,886,548 3,032,369 3,659,044 100% 100% 100% 100% 100% 100.00%
Issued, subscribed and paid up share capital 390,851 586,277 586,277 586,277 586,277 586,277 12.20% 12.64% 10.65% 12.00% 19.33% 16.02%Unappropriated profit 2,592,494 3,688,477 4,395,503 3,535,458 1,378,815 1,708,968 80.95% 79.51% 79.81% 72.35% 45.47% 46.71%Reserves 133,088 133,088 133,088 133,088 133,088 133,088 4.16% 2.87% 2.42% 2.72% 4.39% 3.64%Remeasurement of post employees benefits (36) (610) (1,726) (3,697) (3,480) (2,611) - - -0.03% -0.08% -0.11% -0.07%Surplus on revaluation - AFS investments 37,670 56,566 198,150 339,387 420,437 746,881 1.18% 1.22% 3.60% 6.95% 13.86% 20.41%Provision for outstanding claims [including IBNR] 29,002 9,025 9,025 8,805 8,805 8,805 0.91% 0.19% 0.16% 0.18% 0.29% 0.24%Deferred liabilities 1,959 4,824 8,858 9,377 8,369 10,528 0.06% 0.10% 0.16% 0.19% 0.28% 0.29%Deferred tax - 20,103 26,890 16,171 45,166 13,803 - 0.43% 0.49% 0.33% 1.49% 0.38%Amounts due to other insurers / reinsurers 3,038 1,725 587 587 587 587 0.09% 0.04% 0.01% 0.01% 0.02% 0.01%Accrued expenses 4,870 75,543 85,037 68,880 136,190 20,400 0.15% 1.63% 1.54% 1.41% 4.49% 0.56%Other creditor and accruals 383 36,590 25,573 28,337 109,105 27,712 0.01% 0.79% 0.46% 0.58% 3.60% 0.76%Accrued mark-up - - - - - 1,796 - - - - - 0.05%Short term running finance - - - - - 183,265 - - - - - 5.00%Taxation - net - 15,873 31,448 143,659 179,522 187,197 - 0.34% 0.57% 2.94% 5.92% 5.12%Unclaimed dividend 9,347 11,339 8,801 20,219 29,488 32,348 0.29% 0.24% 0.16% 0.41% 0.97% 0.88%
Total Shareholders' Equity and Liabilities 3,202,666 4,638,820 5,507,511 4,886,548 3,032,369 3,659,044 100% 100% 100% 100% 100% 100.00%
84 Cyan Limited

Particulars 2011 2012 2013 2014 2015 2016 2011 2012 2013 2014 2015 2016Rupees in ‘000 Rupees in ‘000 Percentage Change
Cash and bank deposits 8,330 13,494 17,835 21,844 159,891 906 0.26% 0.29% 0.32% 0.45% 5.27% 0.02%Loan to Employee 7,892 7,492 6,960 16,020 14,060 12,315 0.25% 0.16% 0.13% 0.33% 0.46% 0.34%Investments 2,947,025 4,533,865 5,383,322 4,780,356 2,825,317 3,612,508 92.02% 97.74% 97.75% 97.83% 93.17% 98.73%Deferred tax 3,437 - - - - - 0.11% - - - - -Premiums due but unpaid 24 13 - - - - - - - - - -Amounts due from other insurers / reinsurers 17,638 28,780 18,144 2,464 2,464 2,464 0.55% 0.62% 0.33% 0.05% 0.08% 0.07%Accrued investment income 691 1,471 400 - - - 0.02% 0.03% 0.01% - - - Reinsurance recoveries against outstanding claims 25,352 5,406 5,406 5,406 5,406 5,406 0.79% 0.12% 0.10% 0.11% 0.18% 0.15%Taxation - payments less provision 5,104 - - - - - 0.16% - - - - - Advances, prepayments deposit & sundry receivables 185,583 22,105 52,630 41,706 9,608 11,428 5.79% 0.48% 0.96% 0.85% 0.32% 0.31%Fixed assets 1,590 26,194 22,814 18,752 15,623 14,017 0.05% 0.56% 0.41% 0.38% 0.52% 0.38%
Total Assets 3,202,666 4,638,820 5,507,511 4,886,548 3,032,369 3,659,044 100% 100% 100% 100% 100% 100.00%
Issued, subscribed and paid up share capital 390,851 586,277 586,277 586,277 586,277 586,277 12.20% 12.64% 10.65% 12.00% 19.33% 16.02%Unappropriated profit 2,592,494 3,688,477 4,395,503 3,535,458 1,378,815 1,708,968 80.95% 79.51% 79.81% 72.35% 45.47% 46.71%Reserves 133,088 133,088 133,088 133,088 133,088 133,088 4.16% 2.87% 2.42% 2.72% 4.39% 3.64%Remeasurement of post employees benefits (36) (610) (1,726) (3,697) (3,480) (2,611) - - -0.03% -0.08% -0.11% -0.07%Surplus on revaluation - AFS investments 37,670 56,566 198,150 339,387 420,437 746,881 1.18% 1.22% 3.60% 6.95% 13.86% 20.41%Provision for outstanding claims [including IBNR] 29,002 9,025 9,025 8,805 8,805 8,805 0.91% 0.19% 0.16% 0.18% 0.29% 0.24%Deferred liabilities 1,959 4,824 8,858 9,377 8,369 10,528 0.06% 0.10% 0.16% 0.19% 0.28% 0.29%Deferred tax - 20,103 26,890 16,171 45,166 13,803 - 0.43% 0.49% 0.33% 1.49% 0.38%Amounts due to other insurers / reinsurers 3,038 1,725 587 587 587 587 0.09% 0.04% 0.01% 0.01% 0.02% 0.01%Accrued expenses 4,870 75,543 85,037 68,880 136,190 20,400 0.15% 1.63% 1.54% 1.41% 4.49% 0.56%Other creditor and accruals 383 36,590 25,573 28,337 109,105 27,712 0.01% 0.79% 0.46% 0.58% 3.60% 0.76%Accrued mark-up - - - - - 1,796 - - - - - 0.05%Short term running finance - - - - - 183,265 - - - - - 5.00%Taxation - net - 15,873 31,448 143,659 179,522 187,197 - 0.34% 0.57% 2.94% 5.92% 5.12%Unclaimed dividend 9,347 11,339 8,801 20,219 29,488 32,348 0.29% 0.24% 0.16% 0.41% 0.97% 0.88%
Total Shareholders' Equity and Liabilities 3,202,666 4,638,820 5,507,511 4,886,548 3,032,369 3,659,044 100% 100% 100% 100% 100% 100.00%
85Annual Report 2016

Horizontal Analysis (Prof it and Loss Account)
Vertical Analysis (Profit and Loss Account)
Particulars 2011 2012 2013 2014 2015 2016 2011 2012 2013 2014 2015 2016
Rupees in '000 Rupees in ‘000 Percentage Change
Net premium revenue (4,503) - - - - - 2.28% - - - - -
Net claims 9,588 (37) - - - - -4.85% - - - - -
Expenses (19,647) (978) (768) - - - 9.95% -0.07% -0.07% - - -
Net commission 1,727 - - - - - -0.87% - - - - -
Investment income 479,664 1,780,134 1,451,519 1,209,576 706,755 824,472 -242.86% 124.64% 123.42% 134.58% 210.95% 115.92%
Provision for impairment (601,097) (50,506) - - - - 304.34% -3.54% - - - -
Other income 2,597 5,938 5,595 17,901 7,319 35,882 -1.31% 0.42% 0.48% 1.99% 2.18% 5.04%
Financial charges (225) (209) (235) (140) (83) (13,040) 0.11% -0.01% -0.02% -0.02% -0.02% -1.83%
General and administration expenses (40,193) (231,316) (243,836) (200,092) (218,084) (113,033) 20.35% -16.20% -20.73% -22.26% -65.09% -15.89%
Taxation (25,419) (74,819) (36,226) (128,458) (160,872) (23,048) 12.87% -5.24% -3.08% -14.29% -48.02% -3.24%
Profit / (Loss) after tax (197,508) 1,428,207 1,176,049 898,787 335,035 711,233 100% 100% 100% 100% 100.00% 100.00%
ANALYSISHORIZONTAL & VERTICAL
Particulars 2011 2012 2013 2014 2015 2016 12 Over 11 13 Over 12 14 Over 13 15 Over 14 16 Over 15
Rupees in '000 Rupees in ‘000 Percentage Change
Net premium revenue (4,503) - - - - - - - - - -
Net claims 9,588 (37) - - - - -100.39% 100% - - -
Expenses (19,647) (978) (768) - - - -95.02% -21.47% 100% - -
Net commission 1,727 - - - - - - - - - -
Investment income 479,664 1,780,134 1,451,519 1,209,576 706,755 824,472 271.12% -18.46% -16.67% -41.57% 16.66%
Provision for impairment (601,097) (50,506) - - - - -91.60% 100% - - -
Other income 2,597 5,938 5,595 17,901 7,319 35,882 128.65% -5.78% 219.95% -59.11% 390.26%
Financial charges (225) (209) (235) (140) (83) (13,040) -7.11% 12.44% -40.43% -40.71% 15610.84%
General and administration expenses (40,193) (231,316) (243,836) (200,092) (218,084) (113,033) 475.51% 5.41% -17.94% 8.99% -48.17%
Taxation (25,419) (74,819) (36,226) (128,458) (160,872) (23,048) 194.34% -51.58% 254.61% 25.23% -85.67%
Profit / (Loss) after tax (197,508) 1,428,207 1,176,049 898,787 335,035 711,233 -823.11% -17.66% -23.60% -62.7% 112.00%
Earnings / (Loss) per share - Rupees (Basic) (3.37) 24.36 20.06 15.33 5.71 12.13 -822.85% -17.65% -23.60% -62.7% 112.00%
86 Cyan Limited

Particulars 2011 2012 2013 2014 2015 2016 2011 2012 2013 2014 2015 2016
Rupees in '000 Rupees in ‘000 Percentage Change
Net premium revenue (4,503) - - - - - 2.28% - - - - -
Net claims 9,588 (37) - - - - -4.85% - - - - -
Expenses (19,647) (978) (768) - - - 9.95% -0.07% -0.07% - - -
Net commission 1,727 - - - - - -0.87% - - - - -
Investment income 479,664 1,780,134 1,451,519 1,209,576 706,755 824,472 -242.86% 124.64% 123.42% 134.58% 210.95% 115.92%
Provision for impairment (601,097) (50,506) - - - - 304.34% -3.54% - - - -
Other income 2,597 5,938 5,595 17,901 7,319 35,882 -1.31% 0.42% 0.48% 1.99% 2.18% 5.04%
Financial charges (225) (209) (235) (140) (83) (13,040) 0.11% -0.01% -0.02% -0.02% -0.02% -1.83%
General and administration expenses (40,193) (231,316) (243,836) (200,092) (218,084) (113,033) 20.35% -16.20% -20.73% -22.26% -65.09% -15.89%
Taxation (25,419) (74,819) (36,226) (128,458) (160,872) (23,048) 12.87% -5.24% -3.08% -14.29% -48.02% -3.24%
Profit / (Loss) after tax (197,508) 1,428,207 1,176,049 898,787 335,035 711,233 100% 100% 100% 100% 100.00% 100.00%
Particulars 2011 2012 2013 2014 2015 2016 12 Over 11 13 Over 12 14 Over 13 15 Over 14 16 Over 15
Rupees in '000 Rupees in ‘000 Percentage Change
Net premium revenue (4,503) - - - - - - - - - -
Net claims 9,588 (37) - - - - -100.39% 100% - - -
Expenses (19,647) (978) (768) - - - -95.02% -21.47% 100% - -
Net commission 1,727 - - - - - - - - - -
Investment income 479,664 1,780,134 1,451,519 1,209,576 706,755 824,472 271.12% -18.46% -16.67% -41.57% 16.66%
Provision for impairment (601,097) (50,506) - - - - -91.60% 100% - - -
Other income 2,597 5,938 5,595 17,901 7,319 35,882 128.65% -5.78% 219.95% -59.11% 390.26%
Financial charges (225) (209) (235) (140) (83) (13,040) -7.11% 12.44% -40.43% -40.71% 15610.84%
General and administration expenses (40,193) (231,316) (243,836) (200,092) (218,084) (113,033) 475.51% 5.41% -17.94% 8.99% -48.17%
Taxation (25,419) (74,819) (36,226) (128,458) (160,872) (23,048) 194.34% -51.58% 254.61% 25.23% -85.67%
Profit / (Loss) after tax (197,508) 1,428,207 1,176,049 898,787 335,035 711,233 -823.11% -17.66% -23.60% -62.7% 112.00%
Earnings / (Loss) per share - Rupees (Basic) (3.37) 24.36 20.06 15.33 5.71 12.13 -822.85% -17.65% -23.60% -62.7% 112.00%
87Annual Report 2016

2011 2012 2013 2014 2015 2016
Rupees in ‘000
Cash & Cash equivalents at the beginning of the year (25,924) 8,330 13,494 17,835 24,844 162,891
Net Cash used in operating activities
10,189 8,251 (491,672) (1,692,674) (2,520,881) (505,975)
Net Cash flow from investing activities
24,065 (3,087) 496,013 1,699,683 2,658,928 163,725
Net increase / (decrease) in cash & cash equivalent 34,254 5,164 4,341 7,009 138,047 (342,250)
Cash & Cash equivalents at the end of the year 8,330 13,494 17,835 24,844 162,891 (179,359)
CASH FLOW AT A GLANCESUMMARY OF SIX YEARS
88 Cyan Limited
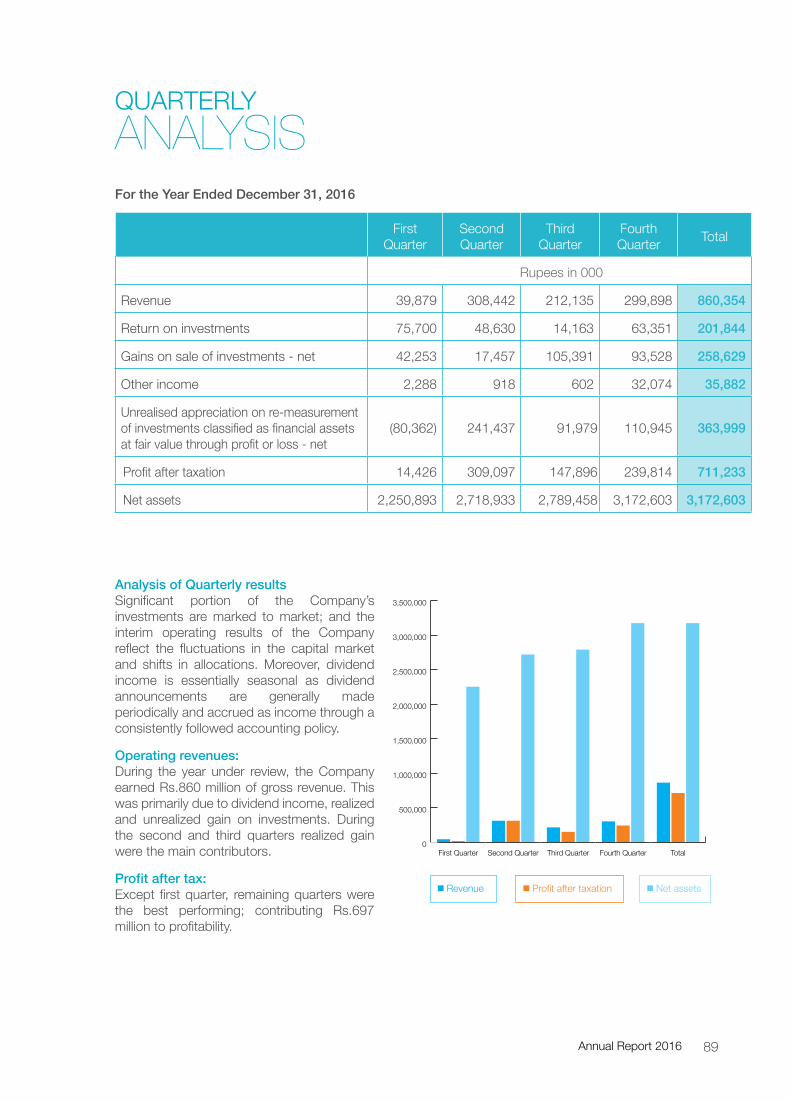
FirstQuarter
Second Quarter
ThirdQuarter
FourthQuarter Total
Rupees in 000
Revenue 39,879 308,442 212,135 299,898 860,354
Return on investments 75,700 48,630 14,163 63,351 201,844
Gains on sale of investments - net 42,253 17,457 105,391 93,528 258,629
Other income 2,288 918 602 32,074 35,882
Unrealised appreciation on re-measurement of investments classified as financial assets at fair value through profit or loss - net
(80,362) 241,437 91,979 110,945 363,999
Profit after taxation 14,426 309,097 147,896 239,814 711,233
Net assets 2,250,893 2,718,933 2,789,458 3,172,603 3,172,603
For the Year Ended December 31, 2016
Analysis of Quarterly results Significant portion of the Company’s investments are marked to market; and the interim operating results of the Company reflect the fluctuations in the capital market and shifts in allocations. Moreover, dividend income is essentially seasonal as dividend announcements are generally made periodically and accrued as income through a consistently followed accounting policy.
Operating revenues:During the year under review, the Company earned Rs.860 million of gross revenue. This was primarily due to dividend income, realized and unrealized gain on investments. During the second and third quarters realized gain were the main contributors.
Prof it after tax:Except first quarter, remaining quarters were the best performing; contributing Rs.697 million to profitability.
ANALYSISQUARTERLY
Revenue Profit after taxation Net assets
0
500,000
1,000,000
1,500,000
2,000,000
2,500,000
3,000,000
3,500,000
TotalFourth QuarterThird QuarterSecond QuarterFirst Quarter
89Annual Report 2016


LEADERSHIPWE TAKE GUIDANCE FROM
THE BEST AND VALUE

Kulsum DawoodDirector
Shahzada Dawood serves as a Director on the Boards of Dawood Corporation (Pvt) Ltd, Dawood Hercules Corporation Ltd, Engro Corporation Ltd, Engro Eximp & Agri Products (Pvt) Ltd, Engro Polymer & Chemicals Limited, Engro Vopak Terminal Ltd, Patek (Pvt) Ltd, Sirius (Pvt) Ltd and Cyan Limited.
He also serves as a Director of Dawood Lawrencepur Ltd and The Hub Power Company Ltd. He is a Trustee of The Dawood Foundation, which is one of the largest public charitable trusts in Pakistan, supporting education and health initiatives.
He is an M.Sc. in Global Textile Marketing from Philadelphia University, USA, and an LLB from Buckingham University, UK and a Certified Director of Corporate Governance from the Pakistan Institute of Corporate Governance. He joined the Board in 2015.
Mrs. Kulsum Dawood is a Trustee on the Board of Dawood Foundation, a philanthropic organization of The Dawood Group. Mrs. Dawood is also a Trustee of the Family Welfare Co-operative Society, an organization geared for the betterment of under-privileged Pakistani young women and member of DIL (Developments in Literacy) to work for the literacy in Pakistan.
Mrs Dawood takes her social and civic responsibilities seriously. She has supported various charities in healthcare, education and economic development. She is a member of SOS, a charity known for the care of orphans, as well as a Depilex Smile Again Foundation, an NGO for the treatment and rehabilitation of burn victims. She supports other charitable organizations such as CARE (Cooperation for Advancement, Rehabilitation & Education), The Lahore Hospital Welfare Society, The Pakistan Society for the Welfare of Mentally Retarded Children and All Pakistan Women’s Association. Mrs Dawood has also served as the President of Women’s Voluntary Service and the Punjab Women’s Swimming Association (2000-2005).
She has attended Family Business courses from the world’s leading Business Schools, The International Institute for Management Development (IMD), in Switzerland in 2004 and 2005 and the Institute European d’Administration des Affaires (INSEAD) in 2007. She regularly attends the World Economic Forum Annual Meetings in Davos.
Shahzada DawoodChairman
DIRECTORSBOARD OF
92 Cyan Limited

Kamran NishatDirector
Kamran Nishat joined the Board of Directors of Cyan Limited in 2014. He also serves on the board of Briogene Private Limited, Apollo Pharma Limited and ABL Asset Management Company Limited. He began his career at Al Ghazi Tractors in 1984 and held top management positions in reputable organizations across various sectors including Automotive, Textiles, Leather, Distribution and Consulting. He currently serves as CEO & Managing Director at Muller & Phipps Pakistan which is the largest and oldest cross industry Market Expansion Services Provider of the country. The company’s topline exceeds PKR 60 billion and its core function is to enable partner organizations to enter, establish and grow their market shares’ in key business sectors of Pakistan including Pharma, FMCG, Hospital Care and Telecommunications.
He is a Fellow member of Institute of Chartered Accountants of Pakistan, member Executive Committee & Chairman Finance & Taxation subcommittee at The American Business Council of Pakistan, member of Information Technology Committee (South) of ICAP and Vice President of Karachi Chapter, Information Systems Audit and Control Association.
Mr. Shafiq Ahmed joined The Dawood Group in 2007 and has worked for several Group concerns in different senior positions, including the Chief Executive Officer of Dawood Lawrencepur Limited and Tenaga Generasi Limited and currently looking after the Group’s Corporate Affairs at the Holding Company Level as Chief Financial Officer and Company Secretary. He is also serving on the Board of Directors of Dawood Lawrencepur Limited, Tenaga Generasi Limited, and Reon Limited. He also served on the Board of Directors of Cyan Limited during the period April 2011 to April 2014. Prior to joining Dawood Group, he served in senior management position in Pakistan National Shipping Corporation and has also been associated with Ernst & Young Ford Rhodes Sidat Hyder & Co., Chartered Accountants for nine years. Having a flair for textiles, energy and accounting, his career spans over 20 years working with industry leaders and pioneers in these fields. He is a Chartered Accountant from the Institute of Chartered Accountants of Pakistan and a degree in Law from Karachi University. Shafiq is also a certified director from Pakistan Institute of Corporate Governance.
Shafiq AhmedDirector
93Annual Report 2016

Ghias Uddin Khan*
Inam ur Rahman*
Director
Director
Ghias Khan is the President and Chief Executive Officer of Engro Corporation. Prior to his appointment as the President he headed the Corporate Office for the Chairman of Dawood Hercules Corporation Limited (DHCL) – Mr. Hussain Dawood – and is the Chairman’s principal aide on a range of matters of institutional importance including but not limited to board governance, Chairman’s communications, managing external relationships and special projects.
Prior to joining DHCL, Ghias served as the CEO of Inbox Business Technologies – a leading end-to-end Information Technology solution provider. He co-founded this company in 2001 and helped grow it to become the largest IT company in Pakistan with more than 1,900 employees. The turnover of the company for the year ended December 31st 2015 was over PKR 4 billion.
Ghias Khan is a graduate of the prestigious Institute of Business Administration (IBA) Karachi and began his career as a financial consultant at Indosuez W.I. Carr Securities in 1999. He then moved to Intel Pakistan Corporation in order to explore a career in Information Technology. With the vision to create the largest technology company in Pakistan Ghias Khan, along with three other partners, embarked on an entrepreneurial venture in 2001 and setup Inbox Business Technologies.
Along with Chairmanship of Engro subsidiaries, he also serves on the board of Cyan Limited and Dawood Lawrancepur Limited, and has in the past served on the board of Young Presidents Organization (YPO) Pakistan Chapter, Elixir Securities Pakistan Private Limited and Sindh Engro Coal Mining Company. In the past he has also served as the Co-Chairman of the Task Force set up by the Planning Commission of Pakistan for Information & Communication Technology. He joined the Engro Corporation board in 2016.
Mr. Inam ur Rahman joined the Cyan Limited Board in March 2017. Inam was appointed Chief Executive Officer of Dawood Hercules Corporation Limited in December 2016. Earlier he has been on the Boards of Sui Northern Gas Pipelines Limited, Sindh Engro Coal Mining Company Limited, Thar Power Company Limited, The Hub Power Company Limited and Laraib Energy Limited. For the past seven years, he was Chief Executive Officer at Dawood Lawrencepur Limited and Tenaga Generasi Limited. He also set up the renewable energy business for the group under the name Reon Energy Limited.
He was adjunct faculty at the Lahore University of Management Sciences during 2004 and 2009. He holds an MBA from the Lahore University of Management Sciences and a B.S. in Electrical Engineering from the University of Engineering and Technology. His passion is to make all energy renewable and free in the world.
*Board of Directors accepted the resignation of Mr. Ghias Uddin Khan and appointed Mr. Inam Ur Rahman with effect from March 29, 2017
94 Cyan Limited

Hasan Reza-Ur-RahimDirector
Mr. Rahim is an accomplished professional who has over 30 years of domestic and international experience in the Banking and Financial Services industry. Most recently he served as the Executive Director, in-charge of the Chairman’s Office of the Dawood Hercules Group, one of the largest entrepreneurial groups in Pakistan having a market capitalization of over USD 3.5 Billion on the Pakistan Stock Exchange. He currently serves on the Boards of Dawood Hercules Corporation Limited (flagship investment holding company) and Dawood Lawrencepur Limited (renewable energy investment holding company).He has also held several senior roles in international banks and has been instrumental in implementing new business initiatives and establishing novel client coverage platforms. At JPMorgan he set up and headed the Global Corporate Bank in Bahrain, Qatar and Saudi Arabia, prior to which he also was the Senior Country Officer in Pakistan and was a part of the Regional Corporate Finance team based in Singapore. He has originated, led and executed large complex M&A transactions and Privatizations totaling USD5.0 billion, Sovereign Debt and Bond issues of over USD2.0 billion in the Telecom, Airlines, O&G and Petrochemical industries.Previously, Mr. Rahim has worked with MashreqBank psc, ANZ Grindlays Bank plc, and Exxon Chemical Pakistan Limited. He was also posted to Zurich, Singapore, Bahrain and Dubai and received his degree from the University of Delaware in USA.
Sulaiman S. MehdiDirector/CEO
Sulaiman is the Chief Executive of Cyan Limited (formerly Central Insurance Company Limited - CICL). He joined CICL as the COO and Company Secretary (CS) on October 01, 2010 and led the insurance license revocation process for CICL. The revocation of CICL’s insurance license and its business restructuring from CICL to Cyan is a landmark transaction, and the first of its kind in Pakistan. He has Sixteen years’ experience of working with leading Financial Services Groups in senior positions in the area of investments, operations, marketing, legal and corporate affairs. He has the privilege of serving two of the largest conglomerates of Pakistan. Before Cyan, he served as the COO and CS for ABL Asset Management Company Limited from January 01, 2008 to September 30, 2010 and during his tenure the assets under management grew from a start-up fund of USD 18 million to USD130 million. Before ABL AMC he was associated with Allied Bank Limited - Corporate and Investment Banking Group as Senior Vice President (SVP) from June 2007 till December 31, 2007, and was primarily responsible for the formation of ABL AMC. Before joining ABL, he served as the COO and CS of PICIC Asset Management Company Ltd. - one of the leading Asset Management Company of Pakistan from July 2004 to June 2007 and was primarily responsible for the formation of PICIC AMC. During his tenure the assets under management in the form of closed end funds grew from USD 45 million to USD190 million.He has also served on the Board of Dawood Lawrencepur Limited, Inbox Business Technologies (Pvt.) Ltd., Inbox Consulting (Pvt.) Ltd., Inbox Corporation (Pvt.) Ltd., and was also a Director for FOCUS Pakistan. Presently he is Director on the Board of Cyan Limited, Sach International (Pvt.) Ltd. and Chairman of Pebbles Pvt. Ltd. – the real estate arm of Dawood Hercules (DH) Group and is leading all real estate initiatives of the Group.Sulaiman holds a Master’s degree and is also a Fellow member of the Institute of Corporate Secretaries of Pakistan (FCISP). He is also a certified director from the Pakistan Institute of Corporate Governance (PICG).
95Annual Report 2016

TEAMMANAGEMENT
Faisal Nadeem MangroriaChief Financial Officer &
Company Secretary
Mr. Faisal is a Certified Director of Corporate Governance from the Pakistan Institute of Corporate Governance (PICG) and a Fellow member of the Institute of Chartered Accountants of Pakistan (ICAP). He passed his Chartered Management Accountancy (CMA) exams from the Chartered Institute of Management Accountants (CIMA), UK. He has completed his articleship from Ernst & Young International (EY) and has professional experience at the executive cadre in the leading Financial Institutions where he was involved in the areas of core finance, risk management and internal audit. Before joining Cyan, he served as the Chief Financial Officer and Company Secretary at ABL Asset Management Company Limited, a subsidiary of Allied Bank Limited.
Narender LakhwaniInvestment Associate
Mr. Narender Lakhwani is a Team Lead – Growth Equity at Cyan Limited. He joined Cyan in December 2015 and has been the core member of Management Investment Committee. Mr. Lakhwani started his career in 2009 and has significant experience of capital markets. He has worked in the areas of investment analysis, private equity, asset management and business development. Prior to joining Cyan, he served as the senior member of the investments and business development teams at Magnus Investment Advisors Limited.
Mr. Lakhwani holds a Master of Finance degree from Melbourne Business School. He is also a CFA Charter holder and a member of CFA Institute
96 Cyan Limited

Ali Akber ZafarInvestment Associate
Mr. Ali has 5 years of diversified experience covering the corporate finance and private equity domains. He is currently employed as an Investment Associate at Cyan and Co-leads the Growth Equity Team. He is also on the Board of Pebbles (Pvt.) Ltd, the real estate arm of the Dawood Group.
He was previously associated with Ernst & Young where he advised the GoP in formulating a post-privatization tariff mechanism for standalone power distribution companies, a task that has never been undertaken in Pakistan. Other landmark deals he has worked on include Pakistan’s first ever Basel III compliant tier-II Sukuk as well as the privatizations of PPL, FESCO and NPGC. He holds a BSc (Honors) degree from the University of Nottingham and is a CFA Level II Candidate.
97Annual Report 2016

Research&
Advisory
ChiefExecutive
Officer
Administration & HR
FinanceInformationTechnology
Compliance & Risk
Management
STRUCTUREORGANIZATIONAL
Board ofDirectors
HR & Remuneration
Committee
Investment Committee
Audit Committee
Internal Audit
ChiefFinancialOfficer
Growth Equity
98 Cyan Limited

The Board has established three Committees namely Board Audit Committee, Board HR & Remuneration Committee and Board Investment Committee for effective governance of the Company.
The compositions, role and responsibilities of the Board Committees are clearly defined in their respective Terms of References.
Board Audit CommitteeThe Board Audit Committee is composed of the following Directors:
• Mr. Kamran Nishat Chairman • Mr. Hasan Reza Ur Rahim Member • Mr. Ghias Uddin Khan Member • Mr. Shafiq Ahmed Member
Terms of ReferenceThe Committee shall ensure that adequate internal control policies and procedures for safeguarding of company’s assets have been developed by the company. The Committee shall review the efficiency and effectiveness of the operations including non-financial control of the entity.
It shall perform the following functions:
a. External Audit Functioni The Committee shall, among other things, be
responsible for recommending to the Board of Directors the appointment of external auditors by the Company and shall consider any questions of resignation or removal of external auditors, audit fees and provision by external auditors of any service to the company in addition to audit of its financial statements;
ii The Committee shall evaluate on an annual basis, the qualification, independence, performance and scope of work of the external auditor; and
iii The Committee shall ensure that significant findings and recommendations made by external auditor and management response thereon are discussed and appropriately acted upon.
b. Internal Controls The Committee shall:
i Ascertain that the integrity of internal control system including financial and operational controls, risk management, accounting system and reporting structure are adequate and effective;
ii Determine the appropriateness of measures to safeguard the Company’s assets;
iii Evaluate the security of computer systems and applications and any contingency plans for processing financial and other information in the event of a computer systems breakdown;
iv Review the company’s system for monitoring compliance with laws, regulations and other external requirements and with management policies and directives and other internal requirements;
v Review the details of any investigation, review or inquiry made by any statutory body concerning the conduct of the company’s activities or the preparation of its financial statements; and
vi Monitor the compliance with the best practices of corporate governance and identification of significant violations thereof.
c. Internal Audit FunctionThe Committee shall:
i Review and discuss the adequacy of structure, responsibilities, staffing, resources and functioning of the company’s internal audit department;
ii Review the preparation, execution and results of the company’s annual internal audit work program;
iii Review and discuss the periodical internal audit reports; and
iv Ensure that significant internal audit findings and recommendations and Management’s responses are considered.
COMMITTEESBOARD
99Annual Report 2016

d. Financial Reportingi The Committee shall review the quarterly, half-
yearly and annual financial statements of the Company, prior to their approval by the Board of Directors, focusing on;
ii Significant accounting and reporting issues, including professional and regulatory pronouncements and assess their impact on the company’s financial statements;
iii Legal matters which could significantly impact the financial statements;
iv Annual financial statements and assess whether the financial statements reflect appropriate accounting principles;
v The judgments made in preparing the company’s financial statements, including any valuation of assets and liabilities, litigation, and other commitments and contingencies;
vi Significant or unusual events or transactions or adjustments resulting from the audit;
vii The going-concern assumption; and
viii Changes in accounting policies & practices and compliance with applicable accounting standards.
e. Other responsibilitiesOther responsibilities of the Committee shall also include:
i Review of preliminary announcements of results prior to publication;
ii Facilitating the external audit and discussion with external auditors of major observations arising from interim and final audits and any matter that the auditors may wish to highlight (in the absence of management, where necessary);
iii Review of management letter issued by external auditors and management’s response thereto;
iv Ensuring coordination between the internal and external auditors of the Company;
v Instituting special projects, value for money studies or other investigations on any matter specified by the Board of Directors, in consultation with the Chief Executive and to consider remittance of any matter to the external auditors or to any other external body;
vi Consideration of any other issue or matter as may be assigned by the Board of Directors;
vii Appointment of the Head of Internal Audit shall be made by the BOD subject to recommendation of the Committee; and
viii Details of all related party transactions shall be placed before the Audit Committee; and of the company for review and recommendation to the Board of Directors. The related party transactions which are not executed at arm’s length price will also be placed separately at each Board meeting along with necessary justification for consideration and approval of the Board after clearance from the Audit Committee of the Company.
Board HR & Remuneration CommitteeThe Board HR & Remuneration Committee is composed of the following Directors:
• Mr. Ghias Uddin Khan Chairman • Mr. Hasan Reza-Ur Rahim Member • Mr. Kamran Nishat Member
Terms of ReferenceThe general duties and responsibilities of the Committee shall be as follows:
i To develop the compensation philosophy for Executive Management and present the recommendations to the Board for approval;
ii To meet with Executive Management to establish Corporate objectives and, subsequently, to meet independently of Executive Management to assess progress in relation to these objectives;
iii To undertake the performance evaluation of the CEO and review for each member of the Executive Management in consultation with the Chair of the Board;
iv To review, establish and recommend to the Board, approval of the compensation of each member of the Executive Management;
v To recommend to the Board for consideration, approval and establishment of stock option plan, incentive plan or employee benefit plans to be granted to, Executive Management and other key employees of the Company and guidelines with respect thereto. The Committee may suggest amendments to any stock option plans
100 Cyan Limited

or incentive plans, provided that all amendments to such plans shall be subject to consideration and approval of the Board;
vi To review and recommend compensation packages for the Executive Directors that realistically reflect the responsibilities and risks involved in being an Executive Director;
vii To consider and make recommendations to the Board for its approval on all matters concerning perquisites and benefits to be granted to Executive Management, including levels and types of benefits, within guidelines, if any, established by the Board with respect thereto;
viii To review and recommend compensation packages for the non-executive directors and the Chair of the Board that realistically reflect the responsibilities and risks involved in being a non-executive director;
ix To regularly review the organization structure and report any significant organization changes to the Board;
x To review succession plans for Executive Management, including specific development plans, methods of achieving recommended action, and career planning for potential successors; and
xi To engage, through its Chair and in appropriate circumstances, at the expense of the Company, independent counsel and advisors; and to fulfill such other powers and duties as delegated to it by the Board.
Board Investment CommitteeThe Board Investment Committee is composed of the following Directors:
• Mr. Hasan Reza-Ur Rahim Chairman • Mrs. Kulsum Dawood Member • Mr. Shahzada Dawood Member • Mr. Shafiq Ahmed Member
Terms of ReferenceThe Board Investment Committee shall:
i Recommend asset allocation strategy for liquid and illiquid investments to the Board;
ii Review and monitor business development activities for illiquid investments;
iii Recommend sector focus for illiquid investments;
iv Recommend all illiquid transactions to the Board for approval;
v Recommend Employees Trading Policy for approval of the Board;
vi Recommend Investment Policy for approval of the Board;
vii Continually review the Investment Policy, Employee Trading Policy and approve changes (if necessary) subject to ratification of the BOD;
viii Consider any other issue or matter as may be assigned by the BOD; and
The BIC will periodically review the performance of the MIC for company’s liquid investments in purview of the various classes of assets and on overall basis, based on the following factors:
i Achievement of budgetary revenues;
ii Adherence to investment policy objectives;
iii Compliance with laws and regulations;
iv Performance relative to hurdles/benchmark approved by the BOD; and
v Performance vis-a-vis industry performance.
101Annual Report 2016


GOVERNANCE WE INSIST ON DOING THE RIGHT THING, ABIDING BY
THE LAW AIMING

A Company’s success is ultimately reflective of the capacity of its directors to provide direction which is in line with the vision in order to expand and flourish. The Company, hence, endeavours to develop the capacity of its Board of Directors to improve both their personal and collective contributions to the overall development of the Company.
A quality Board that really adds value is not just a panel of high performing individuals but a balanced team with harmonizing skill sets and a culture that allows them to function as a single unit to make the most effective decisions for the Company. While the guidance from the Chair is the key, the participation of every Board member is also vital for its effectiveness.
One of the most significant responsibilities of the Board of Directors is to ensure that the company has a strong leadership and an effective executive management. The Board establishes company policies and then delegates authority and responsibility to the CEO for the organization’s smooth operations.
Performance evaluation continues to gain profile and momentum within Boardrooms. Regulators and institutional investors increasingly endorse performance evaluation as a prerequisite for good corporate governance. The Board of Directors acts as a guardian of the shareholders money and translates the same into the Company’s mission and goals. In order to uphold the trust of stakeholders, the Board of Directors’ performance warrants assessment.
The evaluation of the performance will examine those key areas where the Board requires clarity in order to provide high level oversight, including: the strategic process; key business drivers and performance milestones; the global economic environment and competitive context in which the Company operates; the risks faced by the business; Board dynamics; capability and alignment; reputation; and information flows.
The Board of Directors have set the following evaluation criteria to judge its performance;
• Compliance with the legislative system in which Company operates, including Companies Ordinance 1984, Regulations of Pakistan Stock Exchange; and the Memorandum and Articles of Association of the Company;
• Active participation in strategic planning process, enterprise risk management system, policy development, financial structure, monitoring and approval;
• Hiring, evaluating, compensating and supporting the Executive Directors and other key positions including Chief Executive.
• Appropriate constitution of Board Committees with members possessing adequate technical know how and experience;
• Establishing adequate system of internal controls in the Company and its regular assessment through self-assessment mechanism or/and internal audit activities;
• Ensuring presence of required quorum in Board and Committees’ meeting; and
• Ensuring orientation and training of Board of Directors to enable them to perform their duties in an effective manner.
BOARD’S PERFORMANCECRITERIA TO EVALUATE
104 Cyan Limited

The Board of Directors of Cyan Limited regularly evaluates the performance of the CEO based on the financial and non-financial KPIs presented by him and agreed by the Board at the start of the year. The Board has reviewed the performance of the CEO for the current financial year and is truly content with the achievements for the year. The Board wishes to further report that Mr. Sulaiman S. Mehdi is committed to following best practices and the Code of Corporate Governance in true spirit. All Board meetings are attended by Mr. Sulaiman S. Mehdi, where he provides details and explanations for each agenda item. The Board has full confidence in his abilities to manage the affairs of the Company in the most professional and competent manner. He is also responsible for setting the corporate objectives and its alignment with the KPIs for his management team and regularly updates the Board about the performance of the management team in achieving the desired results. The Board ensures that the vision and mission sets the direction for the overall corporate strategy and Cyan’s future endeavors in making investments in organizations with realized high growth potential as well as to remain committed in maximizing the wealth of its shareholders. The Board is pleased to note that Mr. Sulaiman Mehdi‘s endeavors result from following and applying the corporate strategy that is conceived with the aid of the Company’s vision and mission. The entire organization is connected and driven by this purpose and it serves as the main decision making criterion.
PERFORMANCE REVIEWCEO’S
105Annual Report 2016
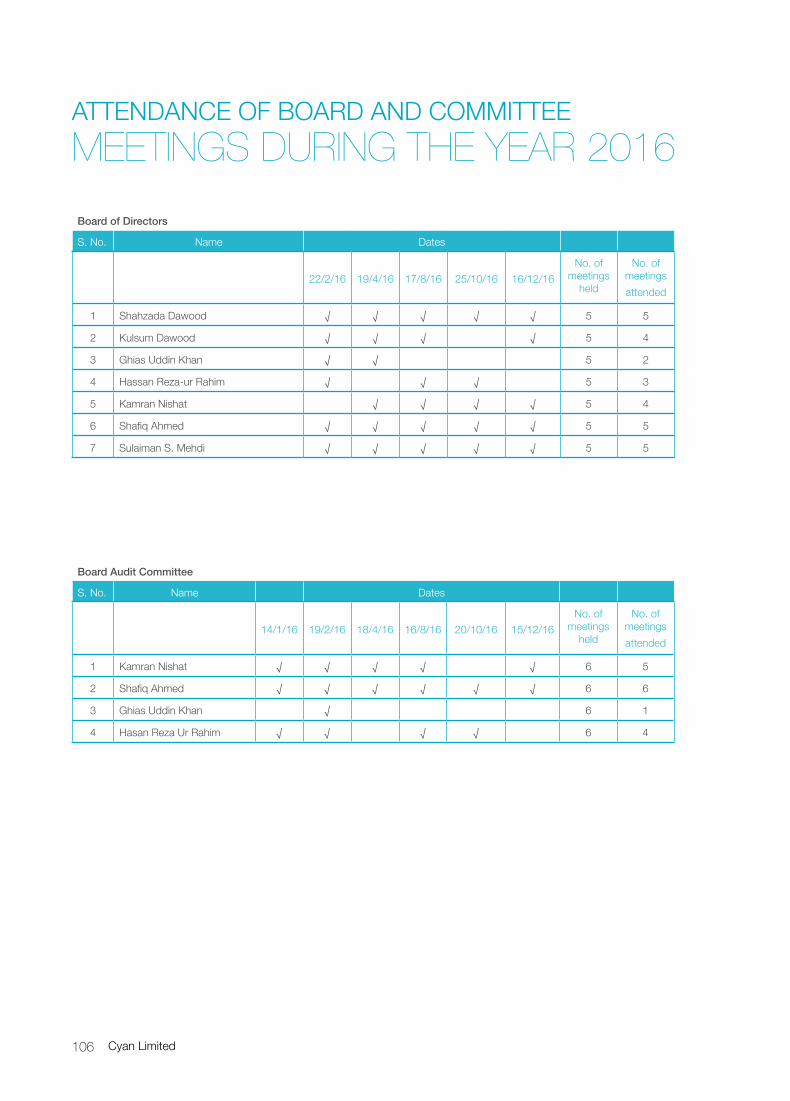
Board of Directors
S. No. Name Dates
22/2/16 19/4/16 17/8/16 25/10/16 16/12/16No. of
meetings held
No. of meetingsattended
1 Shahzada Dawood √ √ √ √ √ 5 5
2 Kulsum Dawood √ √ √ √ 5 4
3 Ghias Uddin Khan √ √ 5 2
4 Hassan Reza-ur Rahim √ √ √ 5 3
5 Kamran Nishat √ √ √ √ 5 4
6 Shafiq Ahmed √ √ √ √ √ 5 5
7 Sulaiman S. Mehdi √ √ √ √ √ 5 5
Board Audit Committee
S. No. Name Dates
14/1/16 19/2/16 18/4/16 16/8/16 20/10/16 15/12/16No. of
meetings held
No. of meetingsattended
1 Kamran Nishat √ √ √ √ √ 6 5
2 Shafiq Ahmed √ √ √ √ √ √ 6 6
3 Ghias Uddin Khan √ 6 1
4 Hasan Reza Ur Rahim √ √ √ √ 6 4
ATTENDANCE OF BOARD AND COMMITTEEMEETINGS DURING THE YEAR 2016
106 Cyan Limited

Board HR & Remuneration Committee
S. No. Name Dates
14/1/16No. of
meetings held
No. of meetingsattended
1 Ghias Uddin Khan √ 1 1
2 Kamran Nishat √ 1 1
3 Hasan Reza-ur Rahim √ 1 1
Board Investment Committee
S. No. Name Dates
14/1/16 19/2/16 28/10/16 16/12/16No. of
meetings held
No. of meetingsattended
1 Hasan Reza-ur Rahim √ √ √ 4 3
2 Kulsum Dawood √ √ √ 4 3
3 Shahzada Dawood √ √ √ √ 4 4
4 Shafiq Ahmed √ √ √ 4 3
107Annual Report 2016

Cyan (“the Company”) has an established Code of Conduct which sets out the standards of conduct expected in the management of its business. All employees are expected to carry out their duties in a manner that is consistent with the Code. If employees become aware of circumstances which are not in compliance with the Code then they should communicate their suspicions using the “whistle blowing” policy.
The term “whistle blowing” is most commonly used to describe when an employee discloses wrong doing within the Company. Such wrong doing can include unlawful conduct, financial malpractice or dangers to the public or the environment. Public disclosure of confidential information about the company could clearly be a breach of an employee’s contract, therefore special arrangements are needed to protect both the employee and the company. It is important that the employee’s concerns about illegal or unethical activities can be raised without fear of victimisation and that the company is alerted to malpractice early so that it can be stopped and the perpetrators dealt with.
A whistle blowing procedure allows employees to raise concerns with management about the conduct of others which they consider to be in some way damaging to the company or others within it.
There may sometimes be circumstances in which people feel uncomfortable raising issues directly with their managers/superiors. Hence we plan to provide a confidential “whistle blowing” mechanism throughout the Company which the Cyan stakeholders i.e. Employees, Service Providers, Contractors, Dealers, Customers as well as Vendors will be able to use to report to the management instances of unethical behavior / acts, actual or suspected fraud or violation of the Company’s code of conduct or ethics policy.
The purpose of this document is to provide a framework to promote responsible and secure whistle blowing. It protects the stakeholders wishing to raise a concern about serious irregularities within the Company. The policy neither exempts employees from their duty of confidentiality in the course of their work, nor it is a route for taking up personal grievance / act with a malafide intentions against fellow employee.
The Company believes in the conduct of the affairs of its constituents in a fair and transparent manner by adopting highest standards of professionalism, honesty, integrity and ethical behavior.
The Company is committed to developing a culture where it is safe for stakeholders i.e. employees, Service Providers, Contractors, dealers, customers as well as vendors for Cyan to raise concerns about any poor or unacceptable practice and any event of misconduct.
There is no any incidence reported during the year 2016 to the Audit Committee.
WHISTLEBLOWING POLICY
108 Cyan Limited

The Audit Committee has concluded its annual review of the conduct and operations of the Company during 2016, and reports that:
• The Company has issued a “Statement of Compliance with the Code of Corporate Governance” which has also been reviewed and certified by the Auditors of the Company.
• Understanding and compliance with Company codes and policies has been affirmed by the members of the Board, the Management and employees of the Company individually. Equitable treatment of shareholders has also been ensured.
• Appropriate accounting policies have been consistently applied. All cores & other applicable International
Accounting Standards were followed in preparation of financial statements of the Company on a going concern basis, for the financial year ended December 31, 2016, which present fairly the State of Affairs, Results of Operations, Profits, Cash Flows and Changes in Equities of the Company for the year under review.
• The Chief Executive and the Chief Financial Officer have reviewed the Financial Statements of the Company and the Directors’ Report. They acknowledge their responsibility for true and fair presentation of the Company’s financial condition and results, compliance with regulations and applicable accounting standards and establishment and maintenance of internal controls and systems of the Company.
• Accounting estimates are based on reasonable and prudent judgments. Proper and adequate accounting records have been maintained by the Company in accordance with the Companies Ordinance, 1984. The financial statements comply with the requirements of the Fourth Schedule to the Companies Ordinance, 1984 and the external reporting is consistent with Management processes and adequate for shareholder needs.
• All Directors have access to the Company Secretary. The Annual Secretarial Compliance Certificates are being filed regularly within stipulated time.
• Closed periods were duly determined and announced by the Company, limiting the Directors, the Chief Executive and Executives of the Company from dealing in Company shares, prior to each Board meeting involving announcement of interim / final results, distribution to shareholders or any other business decision, which could materially affect the share market price of Company, along with maintenance of confidentiality of all business information.
INTERNAL AUDIT
• The internal control framework has been effectively implemented; the Board has established an effective internal audit function within the Company.
• The Company’s system of internal control is sound in design and has been continually evaluated for effectiveness and adequacy.
• The Audit Committee has ensured the achievement of operational, compliance, risk management, financial reporting and control objectives, safeguarding of the assets of the Company and the shareholders wealth at all levels within the Company.
AUDIT COMMITTEEREPORT OF THE
109Annual Report 2016

• The Internal Audit function has carried out its duties under the charter approved by the Committee. The Committee has reviewed material Internal Audit findings, taking appropriate action or bringing the matters to the Board’s attention where required.
• The Head of Internal Audit has direct access to the Chairman of the Audit Committee and the function has all necessary access to Management and the right to seek information and explanations.
EXTERNAL AUDIT
• The statutory Auditors of the Company, A. F. Ferguson & Company, Chartered Accountants, have completed their Audit assignment of the “Company’s Financial Statements” and the “Statement of Compliance with the Code of Corporate Governance” for the financial year ended December 31, 2016 and shall retire on the conclusion of the 57th Annual General Meeting.
• The Audit Committee has reviewed and discussed Audit observations with the External Auditors.
• The Auditors have been allowed direct access to the Committee and the effectiveness, independence and objectivity of the Auditors has thereby been ensured. The Auditors attended the Annual General Meetings of the Company during the year and have confirmed attendance of the 57th Annual General Meeting scheduled for April 28, 2017 and have indicated their willingness to continue as Auditors.
• The Audit Committee has recommended the appointment of A.F. Ferguson & Co. Chartered Accountants
as External Auditors of the Company for the year ending December 31, 2017.
Kamran NishatKarachi, February 22, 2017 Chairman - Audit Committee
110 Cyan Limited
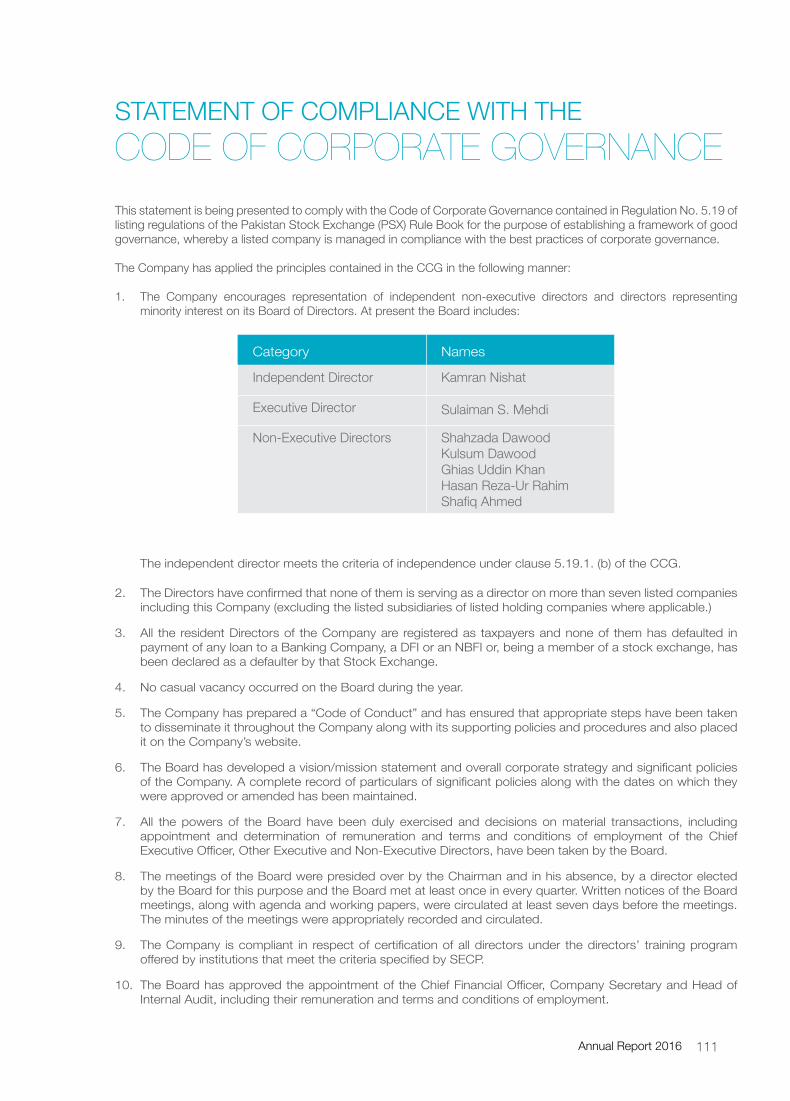
This statement is being presented to comply with the Code of Corporate Governance contained in Regulation No. 5.19 of listing regulations of the Pakistan Stock Exchange (PSX) Rule Book for the purpose of establishing a framework of good governance, whereby a listed company is managed in compliance with the best practices of corporate governance.
The Company has applied the principles contained in the CCG in the following manner:
1. The Company encourages representation of independent non-executive directors and directors representing minority interest on its Board of Directors. At present the Board includes:
Category Names
Independent Director Kamran Nishat
Executive Director Sulaiman S. Mehdi
Non-Executive Directors Shahzada DawoodKulsum DawoodGhias Uddin KhanHasan Reza-Ur RahimShafiq Ahmed
The independent director meets the criteria of independence under clause 5.19.1. (b) of the CCG.
2. The Directors have confirmed that none of them is serving as a director on more than seven listed companies including this Company (excluding the listed subsidiaries of listed holding companies where applicable.)
3. All the resident Directors of the Company are registered as taxpayers and none of them has defaulted in payment of any loan to a Banking Company, a DFI or an NBFI or, being a member of a stock exchange, has been declared as a defaulter by that Stock Exchange.
4. No casual vacancy occurred on the Board during the year.
5. The Company has prepared a “Code of Conduct” and has ensured that appropriate steps have been taken to disseminate it throughout the Company along with its supporting policies and procedures and also placed it on the Company’s website.
6. The Board has developed a vision/mission statement and overall corporate strategy and significant policies of the Company. A complete record of particulars of significant policies along with the dates on which they were approved or amended has been maintained.
7. All the powers of the Board have been duly exercised and decisions on material transactions, including appointment and determination of remuneration and terms and conditions of employment of the Chief Executive Officer, Other Executive and Non-Executive Directors, have been taken by the Board.
8. The meetings of the Board were presided over by the Chairman and in his absence, by a director elected by the Board for this purpose and the Board met at least once in every quarter. Written notices of the Board meetings, along with agenda and working papers, were circulated at least seven days before the meetings. The minutes of the meetings were appropriately recorded and circulated.
9. The Company is compliant in respect of certification of all directors under the directors’ training program offered by institutions that meet the criteria specified by SECP.
10. The Board has approved the appointment of the Chief Financial Officer, Company Secretary and Head of Internal Audit, including their remuneration and terms and conditions of employment.
STATEMENT OF COMPLIANCE WITH THECODE OF CORPORATE GOVERNANCE
111Annual Report 2016

11. The Directors’ Report for this year has been prepared in compliance with the requirements of the CCG and fully describes the salient matters required to be disclosed.
12. The financial statements of the Company were duly endorsed by Chief Executive Officer and Chief Financial Officer before approval of the Board.
13. The Directors, Chief Executive Officer and Executives do not hold any interest in the shares of the Company other than that disclosed in the pattern of shareholding.
14. The Company has complied with all the corporate and financial reporting requirements of the CCG.
15. The Board has formed an Audit Committee. It comprises of four members, of whom three are non-executive Directors and the Chairman of the Committee is an independent director.
16. The meetings of the Audit Committee were held at least once every quarter prior to approval of interim and final results of the Company and as required by the CCG . The Terms of Reference (TOR) of the Committee have been formed and advised to the Committee for compliance.
17. The Board has formed HR and Remuneration Committee. It comprises three members, of whom two are non-executive directors and one is an independent director.
18. The Board has set up an effective internal audit function which is considered suitably qualified and experienced for the purpose and is conversant with the policies and procedures of the company.
19. The statutory auditors of the Company have confirmed that they have been given a satisfactory rating under the Quality Control Review programme of the Institute of Chartered Accountants of Pakistan, that they or any of the partners of the firm, their spouses and minor children do not hold shares of the Company and that the firm and all its partners are in compliance with International Federation of Accountants (IFAC) guidelines on code of ethics as adopted by the Institute of Chartered Accountants of Pakistan.
20. The statutory auditors or the persons associated with them have not been appointed to provide other services except in accordance with the Listing Regulations and the auditors have confirmed that they have observed IFAC guidelines in this regard.
21. The ‘closed period’, prior to the announcement of interim/final results, and business decisions, which may materially affect the market price of the company’s securities, was determined and intimated to the directors, employees and stock exchange(s).
22. Material/price-sensitive information has been disseminated among all market participants at once through stock exchange.
23. The company has complied with the requirements relating to maintenance of register of persons having access to inside information by designated senior management officer in a timely manner and maintained proper record including basis for inclusion or exclusion of names of persons from the said list.
24. We confirm that all other material principles enshrined in the CCG have been complied with.
Sulaiman S. MehdiKarachi: February 22, 2017 CEO
112 Cyan Limited

AUDITORS’ REVIEW REPORT TO THE MEMBERS ON THESTATEMENT OF COMPLIANCE WITH THE
We have reviewed the enclosed Statement of Compliance with the best practices contained in the Code of Corporate Governance (‘the Code’) prepared by the Board of Directors (‘Board’) of Cyan Limited (‘the Company’) for the year ended December 31, 2016 to comply with the requirements of Rule 5.19 of the Pakistan Stock Exchange Regulations where the Company is listed. The responsibility for compliance with the Code is that of the Board of Directors of the Company. Our responsibility is to review, to the extent where such compliance can be objectively verified, whether the Statement of Compliance reflects the status of the Company’s compliance with the provisions of the Code and report if it does not and to highlight any non-compliance with the requirements of the Code. A review is limited primarily to inquiries of the Company’s personnel and review of various documents prepared by the Company to comply with the Code.
As a part of our audit of the financial statements, we are required to obtain an understanding of the accounting and internal control systems sufficient to plan the audit and develop an effective audit approach. We are not required to consider whether the Board of Directors’ statement on internal control covers all risks and controls or to form an opinion on the effectiveness of such internal controls, the Company’s corporate governance procedures and risks.
The Code requires the Company to place before the Audit Committee, and upon recommendation of the Audit Committee, place before the Board of Directors for their review and approval its related party transactions distinguishing between transactions carried out on terms equivalent to those that prevail in arm’s length transactions and transactions which are not executed at arm’s length price and recording proper justification for using alternate pricing mechanism. We are only required and have ensured compliance of this requirement to the extent of the approval of the related party transactions by the Board of Directors upon recommendation of the Audit Committee. We have not carried out any procedures to determine whether the related party transactions were undertaken at arm’s length price or not.
Based on our review, nothing has come to our attention which causes us to believe that the Statement of Compliance does not appropriately reflect the Company’s compliance, in all material respects, with the best practices contained in the Code as applicable to the Company for the year ended December 31, 2016.
Chartered AccountantsDated: February 23, 2017Karachi:
CODE OF CORPORATE GOVERNANCE
113Annual Report 2016

STATEMENTSF I N A N C I A L
114 Cyan Limited

We have audited the annexed statement of financial position of Cyan Limited as at December 31, 2016 and the related profit and loss account, statement of comprehensive income, cash flow statement and statement of changes in equity together with the notes forming part thereof, for the year then ended and we state that we have obtained all the information and explanations which, to the best of our knowledge and belief, were necessary for the purposes of our audit.
It is the responsibility of the company’s management to establish and maintain a system of internal control, and prepare and present the above said statements in conformity with the approved accounting standards and the requirements of the Companies Ordinance, 1984. Our responsibility is to express an opinion on these statements based on our audit.
We conducted our audit in accordance with the auditing standards as applicable in Pakistan. These standards require that we plan and perform the audit to obtain reasonable assurance about whether the above said state-ments are free of any material misstatement. An audit includes examining, on a test basis, evidence supporting the amounts and disclosures in the above said statements. An audit also includes assessing the accounting pol-icies and significant estimates made by management, as well as, evaluating the overall presentation of the above said statements. We believe that our audit provides a reasonable basis for our opinion and, after due verification, we report that:
(a) in our opinion, proper books of accounts have been kept by the company as required by the Companies Ordinance, 1984;
(b) in our opinion:
(i) the statement of financial position and profit and loss account together with the notes thereon have been drawn up in conformity with the Companies Ordinance, 1984, and are in agreement with the books of account and are further in accordance with accounting policies consistently applied; and
(ii) the expenditure incurred during the year was for the purpose of the company’s business; and
(iii) the business conducted, investments made and the expenditure incurred during the year were in accor-dance with the objects of the company;
(c) in our opinion and to the best of our information and according to the explanations given to us, the state-ment of financial position, profit and loss account, statement of comprehensive income, statement of chang-es in equity and cash flow statement together with the notes forming part thereof conform with approved accounting standards as applicable in Pakistan, and, give the information required by the Companies Ordi-nance, 1984, in the manner so required and respectively give a true and fair view of the state of the compa-ny’s affairs as at December 31, 2016 and of the profit, its comprehensive income, its cash flows and changes in equity for the year then ended; and
(d) in our opinion, Zakat deductible at source under the Zakat and Ushr Ordinance, 1980, was deducted by the company and deposited in the Central Zakat Fund established under Section 7 of that Ordinance.
Chartered AccountantsEngagement Partner: Rashid A. JaferDated: February 23, 2017Karachi
TO THE MEMBERSAUDITORS’ REPORT
115Annual Report 2016

116 Cyan Limited
Statement of Financial PositionAs at December 31, 2016
Sulaiman S. Mehdi Kamran NishatChief Executive Director
Notes 2016 2015(Rupees in ‘000)
ASSETS
Non-current assetsProperty and equipment 6 13,751 15,593 Intangible assets 7 266 30 Long term loans 8 9,985 11,712 Long term deposits 2,500 2,500
26,502 29,835
Current assetsShort term investments 9 3,612,508 2,825,317 Long term loans - current portion 8 2,330 2,348 Trade and other receivables 10 11,619 10,981 Advances and short-term prepayments 11 5,179 3,997 Cash and bank balances 12 906 159,891
3,632,542 3,002,534 TOTAL ASSETS 3,659,044 3,032,369
EQUITY AND LIABILITIES
Share capital and reservesAuthorised share capital100,000,000 (2015: 100,000,000) Ordinary
shares of Rs. 10 each 1,000,000 1,000,000
Issued, subscribed and paid-up share capital 13 586,277 586,277 Unappropriated profit 1,708,968 1,378,815 Reserves 14 133,088 133,088 Remeasurement on post retirement benefits obligation - net of tax (2,611) (3,480)Surplus on revaluation of available-for-sale investments 746,881 420,437
3,172,603 2,515,137 Non-current liabilitiesDeferred liability - gratuity 15 10,528 8,369 Deferred taxation 16 13,803 45,166
24,331 53,535 Current liabilitiesCreditors, accrued expenses and other liabilities 17 89,852 284,175 Accrued mark - up 18 1,796 - Short term borrowing 19 183,265 - Taxation - net 187,197 179,522
462,110 463,697
TOTAL EQUITY AND LIABILITIES 3,659,044 3,032,369
CONTINGENCIES AND COMMITMENTS 20
The annexed notes 1 to 38 form an integral part of these financial statements

117Annual Report 2016
Profit and Loss AccountFor the year ended December 31, 2016
Sulaiman S. Mehdi Kamran NishatChief Executive Director
Notes 2016 2015(Rupees in ‘000)
Return on investments 21 201,844 160,841 Gain on sale of investments - net 22 258,629 323,062 Other income 23 35,882 7,319
496,355 491,222
Unrealised appreciation on re-measurement of investmentsclassified as financial assets at fair value throughprofit or loss - net 24 363,999 222,852
860,354 714,074
EXPENSES
Operating and administrative expenses 25 (113,033) (218,084)Financial charges (13,040) (83)
(126,073) (218,167)
Profit before taxation 734,281 495,907
Taxation - current year 26.1 (54,856) (94,882)- prior year 26.1 - (37,423)- deferred 26.1 31,808 (28,567)
(23,048) (160,872)
Net profit for the year 711,233 335,035
------------- Rupees -------------
Basic and diluted earnings per share 34 12.13 5.71
The annexed notes 1 to 38 form an integral part of these financial statements

118 Cyan Limited
Statement of Comprehensive IncomeFor the year ended December 31, 2016
2016 2015(Rupees in ‘000)
Profit after taxation 711,233 335,035
Items that may be reclassified subsequently to profit or loss
Surplus on revaluation of available-for-sale securities 326,444 81,050
Items that will not be reclassified to profit or loss
Remeasurement of post retirement benefits obligation - net of tax 869 217
Total comprehensive income for the year 1,038,546 416,302
The annexed notes 1 to 38 form an integral part of these financial statements
Sulaiman S. Mehdi Kamran NishatChief Executive Director

119Annual Report 2016
Statement of Changes in EquityFor the year ended December 31, 2016
Share capital Capital reserves Revenue reserves Remeasur-ement
on post retirement benefits
obligation - net of tax
Surplus on revaluation of available
for sale investments
TotalIssued, subscribed and paid-up
Reserve for exceptional
losses
Capital gain reserve
General reserve
Unappropr-iated profit
---------------------------------------------------- (Rupees in ‘000)----------------------------------------------------
Balance as at January 1 , 2015. 586,277 10,535 2,553 120,000 3,535,458 (3,697) 339,387 4,590,513
Total comprehensive income for theyear ended December 31, 2015
Net profit for the year - - - - 335,035 - - 335,035
Other comprehensive income - - - - - 217 81,050 81,267
Transactions with owners recordeddirectly in equity
Final dividend of Rs.42.5 per share for theyear ended December 31, 2014 - - - - (2,491,678) - - (2,491,678)
Balance as at December, 31 2015. 586,277 10,535 2,553 120,000 1,378,815 (3,480) 420,437 2,515,137
Total comprehensive incomefor the year ended December 31, 2016
Net profit for the year - - - - 711,233 - - 711,233
Other comprehensive income - - - - - 869 326,444 327,313
Transactions with owners recordeddirectly in equity
Final dividend of Rs.4 per share for theyear ended December 31, 2015 - - - - (234,511) - - (234,511)
Interim dividend of Rs.2.50 per share for thehalf year ended June 30, 2016 - - - - (146,569) - - (146,569)
- - - - (381,080) - - (381,080)
Balance as at December 31, 2016 586,277 10,535 2,553 120,000 1,708,968 (2,611) 746,881 3,172,603
The annexed notes 1 to 38 form an integral part of these financial statements
Sulaiman S. Mehdi Kamran NishatChief Executive Director

120 Cyan Limited
Statement of Cash FlowsFor the year ended December 31, 2016
Note 2016 2015(Rupees in ‘000)
CASH FLOWS FROM OPERATING ACTIVITIES
Profit before taxation 734,281 495,907
Adjustment for non cash charges and other items:Depreciation 2,645 3,025 Amortisation 33 1,078 Gain on sale of property and equipment (7) (23)Capital gain on sale of investments - net (258,629) (323,062)Amortisation of premium on government securities (2,909) (3,565)Financial charges 13,040 83 Net unrealized gain on revaluation of investments
classified as at fair value through profit or loss (363,999) (222,852) (609,826) (545,316)
Operating profit / (loss) before working capital changes 124,455 (49,409)
(Increase) / Decrease in operating assets Trade and other receivables (638) 33,869 Long term loans 1,745 1,960 Advances and short-term prepayments (1,182) (1,771)
(75) 34,058 (Decrease) / Increase in operating liabilities
Deferred liability 3,473 (363)Trade and other payables (197,183) 73,767
(193,710) 73,404
Net cash (used in) / generated from operations (69,330) 58,053
Taxes paid (47,181) (96,442)Financial charges paid (11,244) (83)Dividend paid (378,220) (2,482,409)Net cash used in operating activities (505,975) (2,520,881)
CASH FLOWS FROM INVESTING ACTIVITIES
Proceeds from sale of investments 7,742,419 15,064,804 Investment in securities (7,577,629) (12,404,925)Capital expenditure incurred (1,166) (1,036)Proceeds from sale of property and equipment 101 85 Net cash generated from investing activities 163,725 2,658,928
CASH FLOWS FROM FINANCING ACTIVITIES - -
Net (decrease) / increase in cash and cash equivalents (342,250) 138,047 Cash and cash equivalents at the beginning of the year 162,891 24,844
Cash and cash equivalents at the end of the year 12.2 (179,359) 162,891
The annexed notes 1 to 38 form an integral part of these financial statements
Sulaiman S. Mehdi Kamran NishatChief Executive Director

121Annual Report 2016
Notes to and forming part of thefinancial statementsFor the year ended December 31, 2016
1 STATUS AND NATURE OF BUSINESS
Cyan Limited, a DH Group Company (“the Company”), is a Public Limited Company incorporated in Pakistan on 23 April 1960 under the Companies Act, 1913 (now Companies Ordinance, 1984). The Company is listed on the Pakistan Stock Exchange. The registered office of the Company is situated at 4th Floor Dawood Centre, Molvi Tamizuddin Khan Road, Karachi. Dawood Corporation (Private) Limited is the parent company of the entity.
The company is engaged in making equity investments in companies with high growth potential.
2 BASIS OF PREPARATION
2.1 Statement of compliance
These financial statements have been prepared in accordance with the approved accounting standards as applicable in Pakistan. Approved accounting standards comprise of such International Financial Reporting Standards (IFRSs) issued by the International Accounting Standards Board (IASB) as are notified under the Companies Ordinance, 1984, and the requirements of the Companies Ordinance 1984 and the directives issued by the Securities and Exchange Commission of Pakistan (SECP). Wherever the requirements of the Companies Ordinance 1984 or the directives issued by the SECP differ with the requirements of the IFRSs, the requirements of the Companies Ordinance 1984 or the directives of the SECP prevail.
2.2 Basis of measurement
These financial statements have been prepared on the historical cost basis, except for certain investments which are measured at fair value as described in note 4.4 and certain staff retirement benefits which are carried at present value.
2.3 Functional and presentation currency
These financial statements are presented in Pakistan Rupees, which is the Company’s functional and presentation currency and have been rounded off to the nearest thousand rupees.
2.4 Use of estimates and judgments
The preparation of financial statements in conformity with the approved accounting standards requires the management to make estimates, judgments and assumptions that affect the reported amounts of assets and liabilities, income and expenses. It also requires the management to exercise judgment in application of its accounting policies. The estimates, judgments and associated assumptions are based on the management’s experience and various other factors that are believed to be reasonable under the circumstances. These estimates and assumptions are reviewed on an ongoing basis. Revisions to accounting estimates are recognised in the period in which the estimate is revised if the revision affects only that period, or in the period of revision and future periods if the revision affects both current and future periods. The areas where various assumptions and estimates are significant to the Company’s financial statements or where judgment was exercised in application of accounting policies are as follows:
(a) Classification of investments (note 4.4 and 9).(b) Accounting for defined benefit plan (note 4.1 and 15).(c) Depreciation / amortization of operating fixed assets (note 4.9, 6 and 7)(d) Provision for taxation (current and prior years) and deferred taxation (note 4.10, 16 and 26)

122 Cyan Limited
Notes to and forming part of thefinancial statementsFor the year ended December 31, 2016
Estimates and judgments are continually evaluated and are based on historical experience and other factors, including expectation of future events that are believed to be reasonable under the circumstances. Actual results may differ from these estimates.
3 NEW STANDARDS, INTERPRETATIONS AND AMENDMENTS TO PUBLISHED APPROVED ACCOUNTING STANDARDS
3.1 Standards, Interpretations and Amendments to Published Approved Accounting Standards that are effective in the current period
There are certain new and amended standards, interpretations and amendments that are mandatory for accounting periods beginning on or after January 1, 2016 but are considered not to be relevant or do not have any significant effect on the Company’s operations and are, therefore, not detailed in these financial statements.
3.2 Standards, Interpretations and Amendments to Published Approved Accounting Standards that are not yet effective
There are certain new standards, amendments to the approved accounting standards and new interpretations that are mandatory for accounting periods beginning on or after January 1, 2017, but are considered not to be relevant or will not have any significant effect on the Company’s operations and are, therefore, not disclosed in these financial statements.
4 SUMMARY OF SIGNIFICANT ACCOUNTING POLICIES
The principal accounting policies applied in the preparation of these financial statements are set out below. These policies have been consistently applied to all the years presented unless stated otherwise.
4.1 Employee benefits
4.1.1 Defined contribution plan
The Company operates a recognised contributory provident fund scheme for all its eligible employees. Equal contributions are made by the Company and the employees at the rate of 10% (2015: 10%) of the basic salary.
4.1.2 Defined benefit plan
The Company operates an unfunded approved gratuity scheme for all permanent employees who have completed the minimum qualifying period of service. Contributions to the scheme are made in accordance with an independent actuarial valuation using the Projected Unit Credit Method. Amounts arising as a result of remeasurements, representing actuarial gains and losses are recognised in ‘other comprehensive income’ as they occur.
4.1.3 Employees’ compensated absences
The Company accounts for the liability in respect of employees compensated absences in the period in which they are earned.
4.2 Creditors, accruals and provisions
Liabilities for creditors and other amounts payable are carried at cost which is the fair value of the consideration to be paid in the future for the services received, whether or not billed to the Company.

123Annual Report 2016
Notes to and forming part of thefinancial statementsFor the year ended December 31, 2016
Provisions are recognised when the Company has a present legal or constructive obligation as a result of past events, it is probable that an outflow of resources embodying economic benefits will be required to settle the obligation and a reliable estimate of the amount can be made. Provisions are reviewed at each statement of financial position date and adjusted to reflect the current best estimate.
4.3 Cash and cash equivalents
Cash and cash equivalents consist of cash in hand and at banks, stamps in hand, deposits, short term placements with banks and short term borrowings which form an integral part of the Company’s cash management are included as a component of cash and cash equivalents for the purpose of the statement of cash flows.
4.4 Investments
The management of the Company determines the appropriate classification of its investments at the time of purchase or increase in holding and classifies its investments as at fair value through profit or loss, available for sale, held to maturity and loans and receivables. The classification depends on the purpose for which the investments were acquired.
All investments are initially recognised at cost, being the fair value of consideration given including transaction cost associated with the investment except in the case of fair value through profit or loss investments where transaction costs are charged to the profit and loss account when incurred.
Unquoted investments, for which an active market does not exist and fair value cannot be reasonably calculated, are carried at cost. Impairment in value, if any, is taken through the profit and loss account in the current year.
4.4.1 Financial assets at fair value through profit or loss
Financial assets at fair value through profit or loss include financial assets held for trading and financial assets designated upon initial recognition as at fair value through profit or loss.
Investments which are acquired principally for the purpose of generating profit from short term fluctuations in prices or dealer’s margin are classified as held for trading. After initial recognition, these are stated at fair values with any resulting appreciation or diminution recognised directly in the profit and loss account. Transaction costs are charged to the profit and loss account when incurred.
4.4.2 Available-for-sale
Investments which are intended to be held for an indefinite period of time but may be sold in response to the need for liquidity or changes in interest rates are classified as available-for-sale. Available for sale financial assets are non- derivative financial assets that are designated as available for sale or are not classified in any of the other categories of financial assets. Available for sale financial assets are recognised initially at fair value plus any directly attributable transaction costs. Subsequent to initial recognition, they are measured at fair value and changes therein, other than impairment loss are recognised in other comprehensive income and presented in the surplus on revaluation of available-for-sale investments in the statement of changes in equity. When an investment is derecognised, the gain and loss accumulated in equity is reclassified to the profit and loss account.
4.4.3 Held-to-maturity
Investments with fixed or determinable payments and fixed maturity, where the management has both the intent and the ability to hold to maturity, are classified as held-to-maturity and are stated at amortized cost. Impairment in value, if any, is taken to the profit and loss account.

124 Cyan Limited
Premiums and discounts on investments are amortized using the effective interest rate method and taken to the profit and loss account.
4.5 Regular way contracts
Regular purchases and sale of financial assets are recognised on the trade date, the date on which the Company commits to purchase or sell the asset.
4.6 Impairment
4.6.1 Financial assets
The Company assesses at each balance sheet date whether there is any objective evidence that a financial asset or a group of financial assets is impaired. A financial asset or a group of financial assets is deemed to be impaired if, and only if, there is objective evidence of impairment as a result of one or more events that has occurred after initial recognition of an asset (an incurred loss event) and that loss event (or events) has impact on the estimated future cash flows of the financial asset or the group of financial assets that can be reliably estimated.
If, in a subsequent period, the fair value of an impaired available for sale debt security increases and the increase can be objectively related to an event occurring after the impairment loss is recognised in the profit and loss account, the reversal of the previously recognised impairment loss is recognised in the profit and loss account. However, any subsequent recovery in the fair value of an impaired available for sale equity security is recognised in other comprehensive income.
4.6.2 Non-financial assets
Assets are reviewed for impairment whenever events or changes in circumstances indicate that the carrying amount may not be recoverable. An impairment loss is recognised for the amount by which the asset’s carrying amount exceeds its recoverable amount. The recoverable amount is the higher of an asset’s fair value less costs to sell and value in use. Non-financial assets that suffer an impairment are reviewed for possible reversal of the impairment at each reporting date.
4.7 Financial instruments
Financial instruments carried on the statement of financial position include investments, deposits, loans, advances, cash and bank, sundry receivables, loans to employees, accrued expenses, other creditors and accruals, unclaimed dividends and short term borrowings.
All financial assets and financial liabilities are recognised at the time when the Company becomes a party to the contractual provisions of the instrument and derecognised when the Company loses control of contractual rights that comprise the financial assets and in the case of financial liabilities when the obligation specified in the contract is discharged, cancelled or expired. At the time of initial recognition all financial assets and financial liabilities are measured at their fair values plus, in the case of a financial asset or financial liability not at fair value through profit or loss, transaction costs that are directly attributable to the acquisition or issue of the financial asset or financial liability.
4.8 Off-setting of financial assets and liabilities
Financial assets and liabilities are offset and the net amount is reported in the financial statements only when there is a legally enforceable right to offset the recognised amount and the Company intends either to settle on a net basis, or to realise the assets and to settle the liabilities simultaneously.
Notes to and forming part of thefinancial statementsFor the year ended December 31, 2016

125Annual Report 2016
Notes to and forming part of thefinancial statementsFor the year ended December 31, 2016
4.9 Property and equipment
4.9.1 Tangible
Fixed assets are stated at cost less accumulated depreciation and impairment loss, if any. Maintenance and normal repairs are charged to the profit and loss account as and when incurred. Subsequent costs are included in the assets’ carrying amount or recognised as a separate asset, as appropriate, only when it is possible that the future economic benefits associated with the items will flow to the Company and the cost of the item can be measured reliably.
Depreciation on tangible fixed assets is charged to the profit and loss account by applying the reducing balance method whereby the depreciable amount of an asset is written-off over its estimated useful life at the rates specified in note 6. Depreciation is charged on additions from the date the asset is available for use whereas depreciation on disposals is charged till the date of disposal.
An item of fixed asset is derecognised upon disposal or when no future economic benefits are expected from its use or disposal.
The assets’ residual values, useful lives and methods are reviewed and adjusted, if appropriate at each financial year end. Gain or loss on disposal of fixed assets is charged to the profit and loss account.
4.9.2 Intangible
Intangible assets comprise software license, and are stated at cost less accumulated amortization and impairment loss, if any. Amortisation is charged over the useful life of the asset on a systematic basis to profit and loss account by applying the straight line method at the rates specified in note 7 to the financial statements.
4.10 Taxation
Income tax expense comprises current and deferred tax. Income tax expense is recognised in the profit and loss account, except to the extent that it relates to items recognised directly in other comprehensive income or equity, in which case it is recognised in other comprehensive income or equity respectively.
4.10.1 Current
Provision for current taxation is based on taxable income at the enacted or substantively enacted rates of taxation after taking into account available tax credits and rebates, if any. The charge for current tax includes adjustments to charge for prior years, if any.
4.10.2 Deferred
Deferred tax is recognised using the balance sheet method, providing for temporary differences between the carrying amounts of assets and liabilities for financial reporting purposes and the amounts used for taxation purposes. The amount of deferred tax provided is based on the expected manner of realisation or settlement of the carrying amount of assets and liabilities, using the enacted or substantively enacted rates of taxation.
The Company recognises a deferred tax asset to the extent that it is probable that taxable profits for the foreseeable future will be available against which the asset can be utilized. Deferred tax assets are reduced to the extent that it is no longer probable that the related tax benefit will be realised.

126 Cyan Limited
Notes to and forming part of thefinancial statementsFor the year ended December 31, 2016
4.11 Revenue recognition
Return on Investments
i) Dividend income on equity securities is recognised in the profit or loss account when the right to receive the dividend is established.
ii) Realised capital gain / (losses) arising on sale of investments are included in the profit and loss account on the date at which the transaction takes place.
iii) Unrealised capital gains / (losses) arising on marking to market of investments classified as ‘Financial assets at fair value through profit or loss’ are included in the profit and loss account in the period in which they arise.
iv) Income on government securities is recognised on time proportion basis using the effective yield method.
v) Income on long term loans, bank deposits and placements is recognised on accrual basis.
4.12 Earnings per share (EPS)
The Company presents basic and diluted earnings per share (EPS) data for its ordinary shares. Basic EPS is calculated by dividing the profit or loss attributable to ordinary shareholders of the Company by the weighted average number of ordinary shares outstanding during the period, adjusted for own shares held. Diluted EPS is determined by adjusting the profit or loss attributable to ordinary shareholders and the weighted average number of ordinary shares outstanding, adjusted for own shares held, for the effects of all dilutive potential ordinary shares, which comprise convertible notes and share options granted to employees.
4.13 Foreign currencies
Transactions in foreign currencies are recorded at the rates prevailing on the date of the transactions. Monetary assets and liabilities in foreign currencies are translated at the rates of exchange prevailing on the reporting date. Exchange gains or losses, if any, are taken to the profit and loss account.
4.14 Dividend declaration and reserve appropriations
Dividend distribution and reserve appropriations are recorded in the period in which the distribution and appropriations are approved.
4.15 Discontinued operations
A discontinued operation is a separate major line of business, which is a distinct part of the business both operationally and for financial reporting purposes and which is in the process of being discontinued by the entity. When an operation is classified as a discontinued operation, the comparative income statement is re-presented as if the operation had been discontinued from the start of the comparative period.
5 DISCONTINUED OPERATIONS
In 2011, the Board of Directors and shareholders of the Company in their respective meetings held on January 27, 2011 and March 10, 2011 had approved a business restructuring plan (BRP), by virtue of which the Company discontinued its insurance business and continues to undertake only strategic and portfolio investment business and investments in other financial instruments. On November 30, 2011, the Securities and Exchange Commission of Pakistan (SECP), in exercise of

127Annual Report 2016
Notes to and forming part of thefinancial statementsFor the year ended December 31, 2016
its powers under section 9 (2) of the Insurance Ordinance, 2000, de-registered the Company as an insurer and revoked its insurance license to carry on insurance business.
6 PROPERTY AND EQUIPMENT
2016Cost Accumulated depreciation
Written down value as at December 31, 2016
Rate
As at January 1,
2016
Additions / (disposals)
As at December 31, 2016
As at January 1,
2016
For the year / (on disposals)
As at December 31, 2016
(%)
-------------------------------------------- (Rupees in ‘000) --------------------------------------------
Furniture and fixtures 15,773 - 15,773 4,608 1,120 5,728 10,045 10%
Office equipment 9,773 897 10,037 6,265 1,341 7,067 2,970 33% & 50% (633) (539)
Vehicles 3,067 - 3,067 2,147 184 2,331 736 20%
28,613 897 28,877 13,020 2,645 15,126 13,751 (633) (539)
2015Cost Accumulated depreciation
Written down value as at December 31, 2015
Rate
As at January 1,
2015
Additions / (disposals)
As at December 31, 2015
As at January 1,
2015
For the year / (on disposals)
As at December 31, 2015
(%)
--------------------------------------------- (Rupees in ‘000) ---------------------------------------------
Furniture and fixtures 15,754 19 15,773 3,369 1,239 4,608 11,165 10%
Office equipment 8,926 1,017 9,773 4,817 1,556 6,265 3,508 15 %, 33% & 50% (170) (108)
Vehicles 3,067 - 3,067 1,917 230 2,147 920 20%
27,747 1,036 28,613 10,103 3,025 13,020 15,593 (170) (108)

128 Cyan Limited
Notes to and forming part of thefinancial statementsFor the year ended December 31, 2016
6.1 Details of property and equipment disposed of are as follows:
2016
Cost Accumulated depreciation
Net book value
Sale proceeds Method of disposal
------------------------ (Rupees in ‘000) ------------------------Book value not exceeding Rs. 50,000 each
Office equipment 633 539 94 101 Various
7 INTANGIBLE ASSETS
2016Cost Accumulated amortization Written
down value as at December 31, 2016
RateAs at
January 1, 2016
Additions / (disposals)
As at December 31, 2016
As at January 1,
2016
For the year / (on disposals)
As at December 31, 2016
(%)
--------------------------------------------------- (Rupees in ‘000) ---------------------------------------------------
Computer software 6,799 269 7,068 6,769 33 6,802 266 33.33% - -
6,799 269 7,068 6,769 33 6,802 266 - -
2015Cost Accumulated amortisation Written
down value as at December 31, 2015
RateAs at
January 1, 2015
Additions / (disposals)
As at December 31, 2015
As at January 1,
2015
For the year / (on disposals)
As at December 31, 2015
(%)
--------------------------------------------------- (Rupees in ‘000) ---------------------------------------------------Computer software 6,799 - 6,799 5,691 1,078 6,769 30
- - 33.33% 6,799 - 6,799 5,691 1,078 6,769 30
- -
7.1 Included in cost of intangibles are fully amortised items which are still in use aggregating to Rs 6.72 million (2015: Rs 6.70 million).
Note 2016 2015(Rupees in ‘000)
8 LONG TERM LOANS
Considered good-due from executives 8.1 12,315 14,042 -due from other employees 8.2 - 18
12,315 14,060 Current portion of long-term loans (2,330) (2,348)
9,985 11,712
8.1 House loans given to chief executive officer and chief financial officer are repayable in ten years in equal monthly installments at a mark-up of 6% per annum.

129Annual Report 2016
Notes to and forming part of thefinancial statementsFor the year ended December 31, 2016
8.2 All employees, on completion of one continuous year of service with the Company, are entitled to apply for personal / emergency loan payable in 24 to 36 equal monthly instalments. Annual mark-up on this loan is charged at a rate of 3 months KIBOR + 2%.
Note 2016 20158.3 Following is the movement of long term loans to employees: (Rupees in ‘000)
Long termOpening balance 14,060 16,020 Amount disbursed - 530 Repayments (2,348) (3,226)Add: Interest receivable 603 736 Closing balance 8.4 12,315 14,060
8.4 The maximum aggregate amount of loans and advances outstanding at any time since the previous statement of financial position was Rs. 14.04 million (2015: Rs. 15.85 million).
9 SHORT-TERM INVESTMENTS
Investments comprise of the following: - Held-to-maturity investments 9.1 44,367 44,077 - Available-for-sale investments 9.2 864,822 548,028 - Investments carried at fair value through profit or loss 9.3 2,700,319 2,230,212 - Loans and receivables 9.4 3,000 3,000
3,612,508 2,825,317 3,612,508 2,825,317
9.1 Held-to-maturity investments
Face value Coupon Particulars(Rupees) rate (%)
45,000,000 6.2 Treasury Bills Tenure - 1 Year 44,367 44,077
Market value as at December 31, 2016 of Government Securities is Rs. 44.361 million (2015: Rs. 44.20 million). These are placed with the State Bank of Pakistan (SBP) as statutory deposit in accordance with the requirements of clause (a) of sub section 2 of section 29 of the Insurance Ordinance, 2000 and will be released once the outstanding claims and balances relating to insurance are settled.
Note Market Value 2016 2015
9.2 Available-for-sale investments (Rupees in ‘000)
Un-quoted shares 9.2.1 - - Mutual funds and quoted shares 9.2.2 - 38,301 Un-quoted debentures 9.2.3 - - Quoted shares - related parties 9.2.4 864,822 509,727
864,822 548,028

130 Cyan Limited
Notes to and forming part of thefinancial statementsFor the year ended December 31, 2016
9.2.1 Un-quoted SharesNote Number of Shares Cost
Name of investee company 31-Dec-16 31-Dec-15 31-Dec-16 31-Dec-15------ (Rupees in ‘000) ------
Bankers Equity Limited 9.2.1.1 13,465 13,465 117 117 Cost as on December 31 117 117Less: Provision for Impairment (117) (117)Carrying Value - -
9.2.1.1 Unquoted company in which the Company has made investment is in the process of liquidation, therefore, the name of the respective Chief Executive is not available.
9.2.2 Mutual Funds and Quoted Shares
Number of Units Cost Market valueName of fund 31-Dec-16 31-Dec-15 31-Dec-16 31-Dec-16 31-Dec-15
--------------- (Rupees in ‘000) ---------------
National Investment Unit Trust (NIT) - 240,500 - - 15,208 Golden Arrow Selected Stock Fund - 2,405,532 - - 23,093
- - 38,301
9.2.3 Un-quoted debentures Number of Bonds Cost
Name of investee company 31-Dec-16 31-Dec-15 31-Dec-16 31-Dec-15------ (Rupees in ‘000) ------
Hyson Sugar Mills Limited 240,500 240,500 60 60 60 60
Less: Provision for Impairment (60) (60)Carrying Value - -
9.2.4 Quoted Shares - Related Parties
Number of Shares Cost Market valueName of investee company 31-Dec-16 31-Dec-15 31-Dec-16 31-Dec-16 31-Dec-15
--------------- (Rupees in ‘000) --------------- FertilizerDawood Hercules Corporation Limited 794,380 794,380 47,652 114,653 94,643 Equity held: 0.17% (2015: 0.17%)
Textile CompositeDawood Lawrencepur Limited 2,965,095 2,965,095 222,110 750,169 415,084 Equity held: 5.02% (2015: 5.02%)
269,762 864,822 509,727 Less: Provision for Impairment (151,821)Carrying Value 117,941
Market Value as at December 31, 2016 864,822
Unrealised gain 746,881

131Annual Report 2016
Note Market Value2016 2015
9.3 Investments carried at fair value through Profit or loss (Rupees in ‘000)
Quoted shares 9.3.1 2,697,752 2,124,447 Mutual funds 9.3.2 2,567 105,765
2,700,319 2,230,212
9.3.1 Quoted Shares
Name of investee company Number of Shares Carrying Value Market valueMarket
value as a percentage of total value of Investment
Investment as a percentage
of paid-up capital of investee company31-Dec-16 31-Dec-15 31-Dec-16 31-Dec-16 31-Dec-15
--------------- (Rupees ‘000) --------------- RefineryPakistan Refinery Limited - 500,000 - - 22,605
Oil and Gas Marketing CompaniesHascol Petroleum Limited - 1,091,200 - - 157,406 Sui Northern Gas Pipeline Limited 1,648,000 - 120,520 134,427 - 3.72% 0.26%Sui Southern Gas Co. Limited - 2,000,000 - - 74,700
120,520 134,427 232,106 3.72%EngineeringAisha Steel Mills Limited 5,000,000 - 81,588 78,650 - 2.18% 1.84%
Textile SpinningHira Textile Mills Limited 4,600,000 - 62,510 60,490 - 1.67% 5.31%
CementD.G Khan Cement Company Limited 1,000,000 250,000 202,630 221,730 36,898 6.14% 0.23%Dewan Cement Limited - 1,500,000 - - 19,425 Maple Leaf Cement Company Limited - 1,000,000 - - 74,580 Thatta Cement Limited 500,000 - 19,278 19,690 - 0.55% 0.50%
221,908 241,420 130,903 6.69%
Textile CompositeNishat Mills Limited 1,000,000 - 112,082 152,270 - 4.22% 0.28%Nishat Chunian Limited 3,000,000 - 140,781 187,290 - 5.18% 1.25%Gul Ahmad Textile Mills Limited 3,600,000 1,000,000 161,443 184,212 36,240 5.10% 1.21%
414,306 523,772 36,240 14.50%Automobile Parts and AccessoriesGeneral Tyre and Rubber Company of
Pakistan Limited - 200,000 - - 34,316
Automobiles AssemblerHonda Atlas Cars (Pakistan) Limited - 101,200 - - 24,181
Technology & CommunicationMedia Times Limited 5,000,000 - 25,587 24,750 - 0.69% 2.80%TRG Pakistan Limited - 10,000,000 - - 346,500
25,587 24,750 346,500 0.69%
Notes to and forming part of thefinancial statementsFor the year ended December 31, 2016
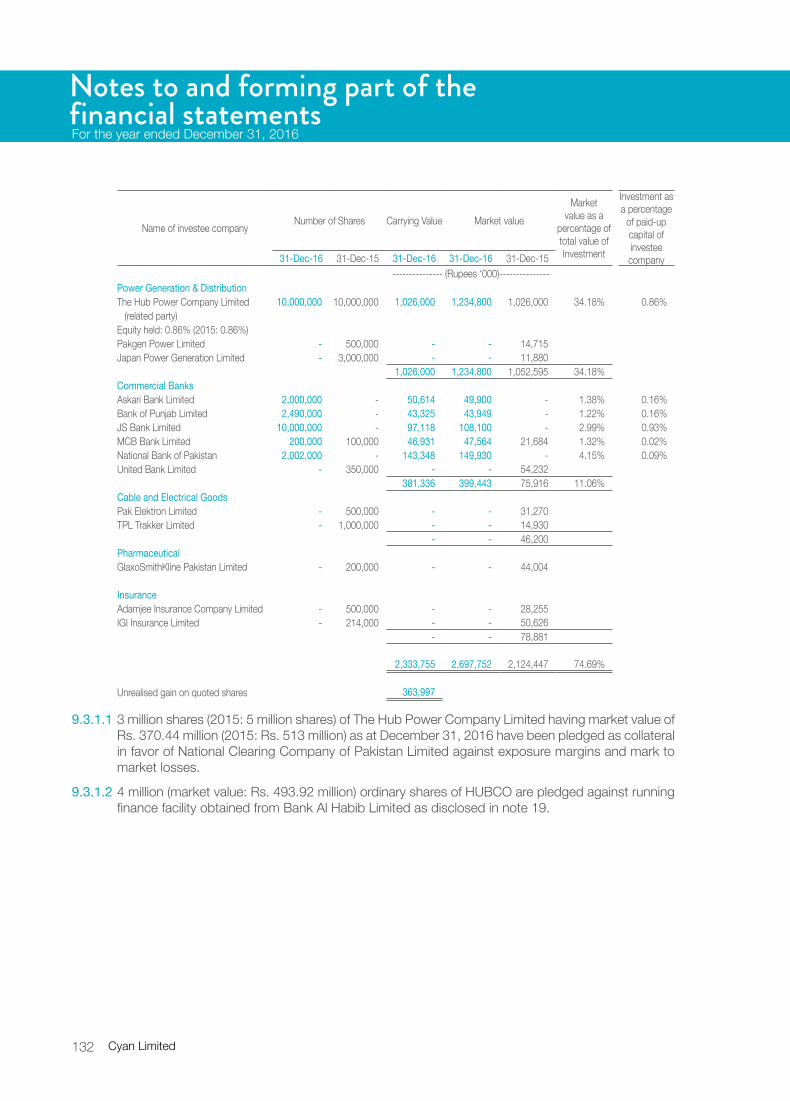
132 Cyan Limited
Notes to and forming part of thefinancial statementsFor the year ended December 31, 2016
Name of investee company Number of Shares Carrying Value Market valueMarket
value as a percentage of total value of Investment
Investment as a percentage
of paid-up capital of investee company31-Dec-16 31-Dec-15 31-Dec-16 31-Dec-16 31-Dec-15
--------------- (Rupees ‘000)--------------- Power Generation & DistributionThe Hub Power Company Limited 10,000,000 10,000,000 1,026,000 1,234,800 1,026,000 34.18% 0.86%
(related party)Equity held: 0.86% (2015: 0.86%)Pakgen Power Limited - 500,000 - - 14,715 Japan Power Generation Limited - 3,000,000 - - 11,880
1,026,000 1,234,800 1,052,595 34.18%Commercial BanksAskari Bank Limited 2,000,000 - 50,614 49,900 - 1.38% 0.16%Bank of Punjab Limited 2,490,000 - 43,325 43,949 - 1.22% 0.16%JS Bank Limited 10,000,000 - 97,118 108,100 - 2.99% 0.93%MCB Bank Limited 200,000 100,000 46,931 47,564 21,684 1.32% 0.02%National Bank of Pakistan 2,002,000 - 143,348 149,930 - 4.15% 0.09%United Bank Limited - 350,000 - - 54,232
381,336 399,443 75,916 11.06%Cable and Electrical GoodsPak Elektron Limited - 500,000 - - 31,270 TPL Trakker Limited - 1,000,000 - - 14,930
- - 46,200 Pharmaceutical GlaxoSmithKline Pakistan Limited - 200,000 - - 44,004
InsuranceAdamjee Insurance Company Limited - 500,000 - - 28,255 IGI Insurance Limited - 214,000 - - 50,626
- - 78,881
2,333,755 2,697,752 2,124,447 74.69%
Unrealised gain on quoted shares 363,997
9.3.1.1 3 million shares (2015: 5 million shares) of The Hub Power Company Limited having market value of Rs. 370.44 million (2015: Rs. 513 million) as at December 31, 2016 have been pledged as collateral in favor of National Clearing Company of Pakistan Limited against exposure margins and mark to market losses.
9.3.1.2 4 million (market value: Rs. 493.92 million) ordinary shares of HUBCO are pledged against running finance facility obtained from Bank Al Habib Limited as disclosed in note 19.

133Annual Report 2016
Notes to and forming part of thefinancial statementsFor the year ended December 31, 2016
9.3.2 Mutual Funds
Note Number of Units Carrying Value Market value
Name of fund 31-Dec-16 31-Dec-15 31-Dec-16 31-Dec-16 31-Dec-15 ------------- (Rupees ‘000) -------------
AKD Cash Fund - 487,282 - - 25,108 Atlas Money Market Fund - 67,602 - - 35,118 Meezan Islamic Income Fund - 323,378 - - 17,023 NAFA Government Securities Liquid Fund 9.3.2.1 246,349 236,220 2,565 2,567 2,462 NAFA Money Market Fund - 2,572,465 - - 26,054 Carrying Cost as at December 31, 2016 2,565 2,567 105,765 Market Value as at December 31, 2016 2,567 Unrealised gain on mutual funds 2
9.3.2.1 223,871 units (2015: 223,871 units) of NAFA Government Securities Liquid Fund having a market value of Rs. 2.332 million (2015: Rs.2.333 million) have been kept under pledge with National Bank of Pakistan pending settlement of a claim in litigation.
Note 2016 20159.4 Loans and receivables (Rupees in ‘000)
Deposits maturing within one month 9.4.1 3,000 3,000
9.4.1 Term Deposit Receipts carry mark-up at 5.25% (2015: 5.5%) per annum and maturity on January 28, 2017.
10 TRADE AND OTHER RECEIVABLES
Amounts due from other insurers / reinsurers - Discontinued Operations 10.1 2,465 2,465
Reinsurance recoveries against outstanding claims - Discontinued Operations 5,406 5,406 Sundry receivables 10.2 3,748 3,110
11,619 10,981 10.1 Amounts due from other insurers / reinsurers - unsecured
Considered good - foreign 542 542 - local 1,923 1,923 Considered doubtful 74 74
2,539 2,539 Provision against amounts due from other
insurers / reinsurers (74) (74) 2,465 2,465
10.2 Sundry receivable
Profit on bank deposits- Saving accounts 6 23 - Term deposits 1 2
Others 3,741 3,085 3,748 3,110
11 ADVANCES AND SHORT-TERM PREPAYMENTS
Advances and deposits 3,339 2,271 Prepayments 1,298 934 Club Membership - employees (related party) 542 792
5,179 3,997

134 Cyan Limited
Notes to and forming part of thefinancial statementsFor the year ended December 31, 2016
Note 2016 2015 (Rupees in ‘000)
12 CASH AND BANK BALANCES
Cash in hand 20 6 Saving accounts 12.1 886 159,885
906 159,891
12.1 These include balances amounting to Rs. 0.878 million placed under mark-up arrangement with mark-up ranging between 4.0% to 5.5% (December 31, 2015: 5.5% to 7%) per annum and balances amounting to Rs. 0.008 million placed under Shariah permissible modes with profit rates of 3.03% per annum (2015: Nil).
12.2 Cash and cash equivalents
Cash and cash equivalents for the purpose of cash flow statement comprises of the following:
- Cash and bank balances 906 159,891 - Short term borrowing (183,265) - - Term deposit receipts 9.4 3,000 3,000
(179,359) 162,891
13 ISSUED, SUBSCRIBED AND PAID-UP SHARE CAPITAL
2016 2015 2016 2015(Number of shares) (Rupees in ‘000)
250,000 250,000 Ordinary shares of Rs. 10 each fully paid in cash 2,500 2,500
58,377,722 58,377,722 Ordinary shares of Rs. 10 each issued as fully paid bonus shares 583,777 583,777
58,627,722 58,627,722 586,277 586,277
13.1 As at December 31, 2016, related parties hold 41,470,337 (2015: 41,470,337) ordinary shares of Rs. 10 each.
14 RESERVES
Capital reserves- Reserve for exceptional losses 14.1 10,535 10,535 - Capital gain reserve 2,553 2,553
13,088 13,088 Revenue reserve
- General reserve 120,000 120,000 133,088 133,088
14.1 The reserve for exceptional losses is a specific purpose reserve created to provide for possible losses on exceptional insurance claims which the Directors do not consider to be available for dividend distribution.

135Annual Report 2016
Notes to and forming part of thefinancial statementsFor the year ended December 31, 2016
15 DEFERRED LIABILITY
15.1 Defined Benefit Plan
As explained in note 4.1.2 the Company operates an unfunded approved gratuity scheme for all permanent employees.
The latest actuarial valuation of the gratuity scheme was carried out as of December 31, 2016. The principal actuarial assumptions used for the purpose of the valuation were as follows:
Principal actuarial assumptions
The following significant assumptions have been used for valuation of this scheme.
2016 2015
a. Valuation discount rate 10.50% 10.00%b. Salary increase rate 10.50% 10.00%c. Average expected service length of employees (in years) 3.61 2.65
d. Assumption regarding future mortality experience are based on actuarial recommendations and published statistics. The rates assumed are based on the SLI 2001-05 mortality rates, related down by one year.
The gratuity scheme exposes the entity to the following risks:
Mortality risks
The risk that the actual mortality experience is different. The effect depends on the beneficiaries’ service / age distribution and the benefit.
Final salary risks
The risk that the final salary at the time of cessation of service is higher than what was assumed. Since the benefit is calculated on the final salary, the benefit amount increases similarly.
15.2 The amount recognised in the Statement of financial position is determined as follows:
2016 2015 (Rupees in ‘000)
Present value of defined benefit obligations 10,528 8,369
15.3 Reconciliation of payable to defined benefit plan
Present value of Defined Benefit Obligation 10,528 8,369 Net actuarial gains / (losses) not recognised - - Balance at the end of the year 10,528 8,369
15.4 Movement in net liability recognized in the balance sheet
At January 1 8,369 9,377 Current service cost 2,646 2,388 Interest expense / (income) 836 924
11,851 12,689 Remeasurements:
- Gain from change in demographic assumptions - - - Gain from change in financial assumptions 24 - - Experience adjustments (1,338) (645)
(1,314) (645)Benefit payments (9) (3,675)At December 31 10,528 8,369

136 Cyan Limited
Notes to and forming part of thefinancial statementsFor the year ended December 31, 2016
15.5 The sensitivities of the defined benefit obligation to changes in the weighted principal assumptions are as under:
2016 2015
Impact on defined benefit obligation - Increase / (decrease)
Impact on defined benefit obligation - Increase / (decrease)
Change in assumption
Increase in assumption
Decrease in assumption
Change in assumption
Increase in assumption
Decrease in assumption
--------------------------------------- In percentage ---------------------------------------
Discount rate 0.5% -7.24% 7.94% 0.5% -7.45% 8.19%Salary increase rate 0.5% 8.15% -7.48% 0.5% 8.39% -7.69%
The above sensitivities analysis is based on a change in an assumption while holding all other assumptions constant. When calculating the sensitivity of the defined benefit obligation to significant actuarial assumptions the same method (present value of the defined benefit obligation calculated with the projected unit credit method at the end of the reporting period) has been applied as when calculating the gratuity liability recognised within the balance sheet.
15.6 The weighted average duration of the defined benefit obligation is 15.25 years.
15.7 Expected maturity analysis of undiscounted defined benefit obligation for the gratuity scheme is as follows:
At December 31, 2016 Less than a year
Between 1-2 years
Between 2-5 years
Over 5years Total
------------------------------ Rupees in ‘000 ------------------------------
Gratuity 310 302 871 66,349 67,832
2016 2015 2014 2013 2012 15.7.1 Historical information ------------------------------ Rupees in ‘000 ------------------------------
Defined benefit obligation 10,528 8,369 9,377 8,858 4,824 Fair value of plan assets - - - - - (Surplus) / Deficit 10,528 8,369 9,377 8,858 4,824 Remeasurement (Gain) / Loss on obligation (1,314) (645) 3,033 1,717 884 Remeasurement (Gain) / Loss on plan assets - - - - -
(1,314) (645) 3,033 1,717 884
15.7.2 Funding levels are monitored on an annual basis and are based on actuarial recommendations. Gratuity cost comprising the service cost and the net interest cost for the next year works out to Rs. 3.59 million as per the actuarial valuation report of the Company as of December 31, 2016.
15.8 The disclosure made in notes 15.1 to 15.7.2 are based on the information included in the actuarial valuation report of the Company as of December 31, 2016.

137Annual Report 2016
Notes to and forming part of thefinancial statementsFor the year ended December 31, 2016
Note 2016 201516 DEFERRED TAXATION (Rupees in ‘000)
Deductible temporary differencesStaff gratuity 3,158 2,594 Leave encashment 862 846
4,020 3,440 Taxable temporary differences
Revaluation of investments (16,982) (47,761)Accelerated tax depreciation (841) (845)
(17,823) (48,606) (13,803) (45,166)
16.1 Reconciliation of deferred tax liability
Opening balance (45,166) (16,171)Recognised in profit and loss account 31,808 (28,567)Recognised in equity (445) (428)Closing balance (13,803) (45,166)
17 CREDITORS, ACCRUED EXPENSES AND OTHERLIABILITIES
Amounts due to other insurers / reinsurers - Discontinued Operations 17.1 587 587
Accrued expenses 17.2 20,400 136,190 Provision for outstanding claims - Discontinued Operations 8,805 8,805 Payable against purchase of investment - net 24,911 74,311 Other creditors and accruals 17.3 2,801 34,794 Unclaimed dividend 32,348 29,488
89,852 284,175
17.1 Amounts due to other insurers / reinsurers
Foreign companies - - Local companies 587 587
587 587
17.2 The amount includes balance of compensated absences of key management personel amounting to Rs 2.87 million as at December 31, 2016 (2015: Rs 2.50 million).
2016 2015 (Rupees in ‘000)
17.3 Other creditors and accruals
Workers’ Welfare Fund - 31,718 Premium refundable to policy holders - Discontinued Operations 171 171 Brokerage payable 2,034 1,673Sundry creditors 596 1,232
2,801 34,794
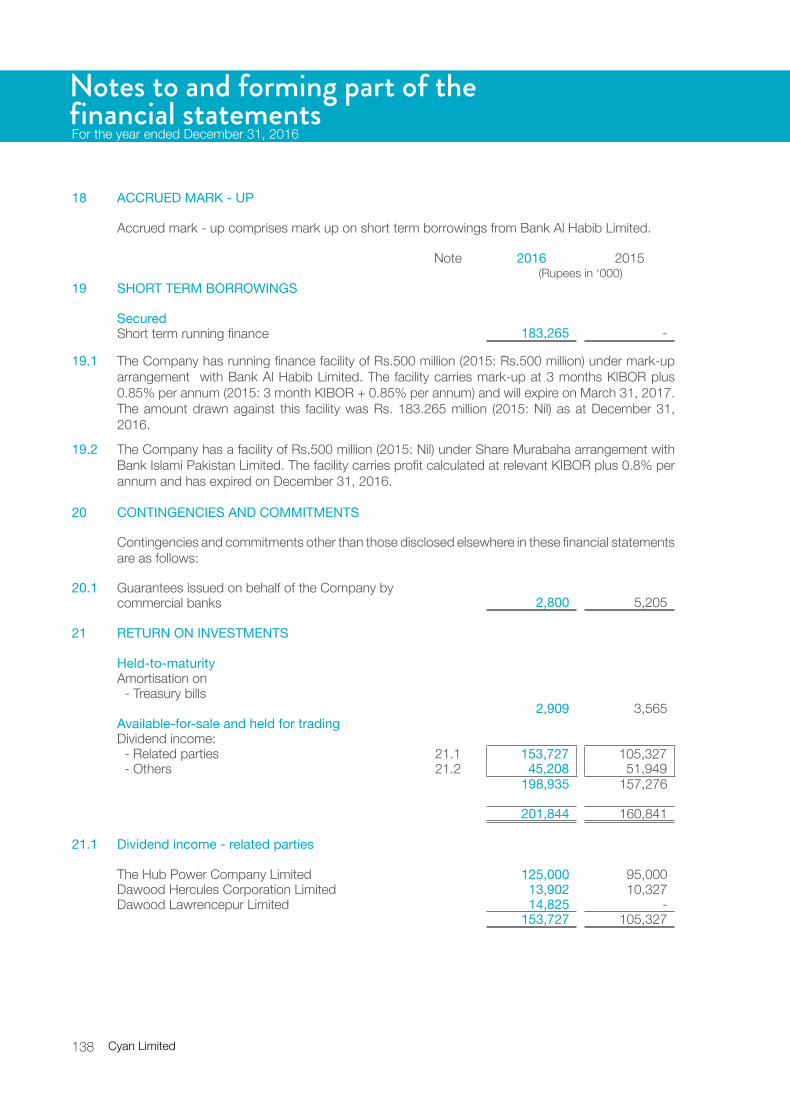
138 Cyan Limited
Notes to and forming part of thefinancial statementsFor the year ended December 31, 2016
18 ACCRUED MARK - UP
Accrued mark - up comprises mark up on short term borrowings from Bank Al Habib Limited.
Note 2016 2015(Rupees in ‘000)
19 SHORT TERM BORROWINGS
SecuredShort term running finance 183,265 -
19.1 The Company has running finance facility of Rs.500 million (2015: Rs.500 million) under mark-up arrangement with Bank Al Habib Limited. The facility carries mark-up at 3 months KIBOR plus 0.85% per annum (2015: 3 month KIBOR + 0.85% per annum) and will expire on March 31, 2017. The amount drawn against this facility was Rs. 183.265 million (2015: Nil) as at December 31, 2016.
19.2 The Company has a facility of Rs.500 million (2015: Nil) under Share Murabaha arrangement with Bank Islami Pakistan Limited. The facility carries profit calculated at relevant KIBOR plus 0.8% per annum and has expired on December 31, 2016.
20 CONTINGENCIES AND COMMITMENTS
Contingencies and commitments other than those disclosed elsewhere in these financial statements are as follows:
20.1 Guarantees issued on behalf of the Company bycommercial banks 2,800 5,205
21 RETURN ON INVESTMENTS
Held-to-maturityAmortisation on
- Treasury bills 2,909 3,565
Available-for-sale and held for tradingDividend income:
- Related parties 21.1 153,727 105,327 - Others 21.2 45,208 51,949
198,935 157,276
201,844 160,841
21.1 Dividend income - related parties
The Hub Power Company Limited 125,000 95,000 Dawood Hercules Corporation Limited 13,902 10,327 Dawood Lawrencepur Limited 14,825 -
153,727 105,327

139Annual Report 2016
Notes to and forming part of thefinancial statementsFor the year ended December 31, 2016
2016 2015(Rupees in ‘000)
21.2 Dividend income - others
Adamjee Insurance Company Limited 750 8,748 Agriauto Industries Limited 1,901 - DG Khan Cement Company Limited - 500 Attock Refinery Limited 750 - Fauji Fertilizer Company Limited - 1,970 Gul Ahmed Textile Mills Limited 5,489 1,500 General Tyre & Rubber Company of Pakistan Limited - 810 Golden Arrow Selected Stock Fund - 8,299 IGI Insurance Limited 760 400 I.C.I Pakistan Limited - 495 Hascol Petroleum Limited 880 - Habib Bank Limited 2,625 711 Habib Metropolitan Bank Limited - 12,288 Kohat Cement Company Limited - 400 Lalpir Power Limited - 2,235 Maple Leaf Cement Factory Limited 1,125 - Millat Tractors Limited 1,500 1,250 MCB Bank Limited - 400 Mughal Iron & Steel Industries Limited - 375 National Bank of Pakistan 7,500 - Nishat (Chunian) Limited 7,500 - Nishat Mills Limited 5,000 - The National Investment Units Trust - 1,022 Oil & Gas Development Company Limited 740 58 Pak Elektron Limited 2,501 321 Pakgen Power Limited 500 - Pakistan Oilfields Limited 3,750 - Pakistan State Oil Company Limited - 400 Pakistan Telecommunication Company - 6,750
United Bank Limited 1,800 2,850 NAFA Government Securities Liquid Fund 137 167
45,208 51,949
22 There were certain shares that were held by the Company which are included in the All Share Islamic Index. Capital gain on sale of these investments amounted to Rs.123.45 million (December 31, 2015: Rs.134.95 million).
23 OTHER INCOME
Income from financial assetsProfit on bank deposits 23.1 3,448 2,614 Income from non-financial assetsGain on sale of property and equipment 7 23 Income from long term loans 604 748 Others 23.2 31,823 3,934
35,882 7,319
23.1 These include income of Rs. 0.015 million (December 31, 2015: Nil) earned on deposit with Bank Islami Pakistan Limited as per arrangements permissible under Shariah.

140 Cyan Limited
Notes to and forming part of thefinancial statementsFor the year ended December 31, 2016
23.2 During the current year, the Company made a formal assessment and based on the advice of its tax consultant concluded that Sindh Workers Welfare Fund (SWWF) is not applicable on the Company as the entity is not an ‘industrial establishment’ as defined under the SWWF Act 2014 and therefore does not fall under the scope for levy of SWWF. Accordingly, the Company has reversed the charge booked in respect of SWWF in prior years amounting to Rs. 31. 7 million.
24 There are certain shares held by the Company which are included in the All Share Islamic Index. Unrealised gain on these shares amounts to Rs.282.41 million (December 31, 2015: Rs.199.77 million).
Note 2016 2015(Rupees in ‘000)
25 OPERATING AND ADMINISTRATIVE EXPENSES
Salaries, wages and other benefits 25.1 & 25.2 57,697 131,185 Levy, cess and insurance 1,114 1,089 Rent, rates and taxes 7,824 6,853 Depreciation 2,645 3,025 Amortisation 33 1,078 Legal and professional charges 2,050 12,526 Printing and stationery 2,581 2,167 Utilities 1,889 1,680 Vehicle running expenses 170 194 Advertisement, promotion and event expenses 493 2,697 Security guards expenses 998 907 Auditors’ remuneration 25.3 907 769 Entertainment 2,633 2,758 Travelling and communication expenses 1,957 2,213 Fees and subscription 4,229 3,540 Postage and telegram 385 356 Books and periodicals 13 10 Repairs, renewal and decoration 1,171 878 Workers’ welfare fund - 10,269 Brokerage, commission and advisory expense 18,719 21,830 Bank and settlement charges 1,991 1,960 Employee training fee 376 2,453 Due diligence charges - 4,075 Research expense 1,961 2,371 Other expenses 1,197 1,201
113,033 218,084
25.1 This includes Rs. 2.48 million (2015: Rs. 2.12 million) in respect of employees’ provident fund.
25.2 This includes Rs. 3.48 million (2015: Rs. 3.31 million) in respect of employees’ gratuity fund.
25.3 Auditors’ remuneration
Annual audit fee 411 352 Review and certifications 324 280
735 632 Sindh sales tax on services 59 38 Out of pocket expenses 113 99
907 769

141Annual Report 2016
Notes to and forming part of thefinancial statementsFor the year ended December 31, 2016
26 TAXATION
Tax returns have been filed up to the Tax year 2016 (Accounting year December 31, 2015) which are deemed as assessments completed in terms of section 120(1) of the Income Tax Ordinance 2001 (ITO). However, the Company and the Department have filed appeals in respect of certain assessment years which relate to the following:
The Additional Commissioner Inland Revenue passed an order under section 122(5A) of the Income Tax Ordinance, 2001 for the tax year 2006 on account of disallowance of exempt capital gain and provision for incurred but not reported (IBNR) resulting in an additional tax liability of Rs. 31.818 million. Against the said order an appeal was filed before the Commissioner Inland Revenue, (Appeal-1) Karachi. The Commissioner Inland Revenue (Appeals-1) deleted disallowance of exempt capital gain but did not allow provision for incurred but not reported (IBNR) having an impact of increase in tax liability of Rs. 0.821 million. The Company has filed an appeal against the said order for Rs.0.821 million (IBNR) before the Appellate Tribunal Inland Revenue.
Against the order of the Deputy Commissioner of Inland Revenue for the Tax year 2007, the Commissioner Inland Revenue (Appeal-I) LTU Karachi had deleted various additions on which the Department had gone into appeal before the learned Appellate Tribunal Inland Revenue which dismissed their appeals. Further, it had referred back various additions i.e. disallowances of management and general expenses, capitalization of short term finance and provision for IBNR to the assessing officer for re-examination against which the Company has filed appeal before the learned Appellate Tribunal Inland Revenue and the Tribunal had referred back the matter for adjudication to the Commissioner Inland Revenue. Moreover a Miscellaneous application was filed with the Appellate Tribunal Inland Revenue for disallowance of amortisation of computer software and non-deduction of withholding tax from commission. The Commissioner Inland Revenue filed appeal in the High Court of Sindh against the order of the learned Appellate Tribunal Inland Revenue on deletion of addition on account of proration of expenses allocated under section 67 of the Income Tax Ordinance, 2001, which was adjudicated in favour of the Company. The Commissioner Inland Revenue filed a civil review petition in the Supreme Court of Pakistan against the judgment of the High Court of Sindh.
The Additional Commissioner Inland Revenue (ACIR) passed order on June 27, 2014 under section 122(5A) of the Income Tax Ordinance, 2001 for the tax year 2008 on account of disallowance of provision for incurred but not reported claims (IBNR), taxing dividend income separately and levying minimum tax resulting in an additional tax liability of Rs.0.144 million. The Company has filed an appeal against the said order before the Commissioner Inland Revenue (Appeals-1) LTU, Karachi.
For the tax year 2010, the Deputy Commissioner Inland Revenue (DCIR) passed order on July 25, 2014 under section 122(1) of the Income Tax Ordinance, 2001 on account of disallowance of provision for incurred but not reported claims (IBNR), apportionment of management expenses against dividend income and taxing dividend income separately resulting in an additional tax liability of Rs.8.886 million. Further the DCIR has not allowed credit for taxes deducted / paid aggregating to Rs.19.758 million. The Company has filed an appeal against the said order before the Commissioner Inland Revenue (Appeals-1) LTU, Karachi.
The management, based on the opinion of its tax advisor, is confident about the favourable outcome of the above matters and hence, no additional provision has been considered necessary in these financial statements.

142 Cyan Limited
Notes to and forming part of thefinancial statementsFor the year ended December 31, 2016
2016 2015 (Rupees in ‘000)
26.1 Provision for taxation
Current year (54,856) (94,882)Prior years - (37,423)Deferred 31,808 (28,567)
(23,048) (160,872)
26.2 Tax expense (23,048) (160,872)(23,048) (160,872)
26.3 Relationship between tax expense and accounting profit
Profit for the year before taxation 734,281 495,907
Tax effect of reduction in tax rate (1,507) (2,076)Tax at the applicable rate of 31% (2015: 32%) 227,627 158,690 Tax effect of capital loss / (gain) exempt from tax (7,189) - Tax effect of capital loss / (gain) taxed at a lower rate (39,593) (84,252)Tax effect of dividend income taxed at a lower rate (43,061) (36,416)Tax effect of unrealised gain taxed at lower rate (95,858) (71,313)Reversal of prior year charge - 37,423 Tax effect of (income) / expenses that are not considered
in determining taxable income (17,101) 158,211 Others (270) 605
23,048 160,872
27 REMUNERATION OF DIRECTORS AND EXECUTIVES
Aggregate amounts charged in the financial statements for the year for remuneration, including all benefits, to the directors and executives of the Company are as follows:
Chief Executive Directors Executives Total2016 2015 2016 2015 2016 2015 2016 2015
----------------------------------------- (Rupees in ‘000) -----------------------------------------
Fees - - 1,850 1,150 - - 1,850 1,150 Managerial remuneration 16,028 103,900* - - 18,120 39,149* 34,148 143,049 House rent, conveyance,
and other allowances 7,376 7,152 - - 8,595 7,834 15,971 14,986 Contribution to provident fund 1,135 1,100 - - 1,113 837 2,248 1,937
24,539 112,152 1,850 1,150 27,828 47,820 54,217 161,122
Number of persons 1 1 4 4 9 10 14 15
28 TRANSACTIONS WITH RELATED PARTIES
Related parties comprise companies with common directors, group companies, defined contribution plan and defined benefit plan, directors and key management personnel. Transactions with related parties are entered into at rates negotiated with them. Remuneration to key management personnel are in accordance with their terms of engagement. Transactions with related parties other than those which have been disclosed elsewhere in the financial statements are as follows:

143Annual Report 2016
Notes to and forming part of thefinancial statementsFor the year ended December 31, 2016
2016 2015 (Rupees in ‘000)
Rent paid 7,824 6,853 Dividend received 153,727 105,327 Dividend paid 255,208 1,668,671 Brokerage - 746 Commission income from related party on sale of property - 3,900 Contribution to provident fund 2,479 2,117 Charge for staff retirement gratuity scheme 3,482 3,312
Key management personnel and close family membersDividend paid 14,349 17,850 Remuneration 52,367 159,972* Director fee 1,850 1,150
Employee loan issued - 530 Employee loan recovery 2,348 3,226 Disposal of office equipment - 38 Prepaid club membership amortized during the year. 250 250
BalancesEmployee loan to Chief Executive Officer 3,940 4,881 Employee loan to other Executives 8,375 9,179 Receivable from related parties 755 - Payable to related parties 5,094 700
Investments in and balance outstanding with related parties have been disclosed in the specific notes to the financial statements.
*These amounts have been restated to include variable compensation based on performance on accrual basis. Previously, variable compensation was disclosed on paid basis.
29 FINANCIAL STRUCTURE /MODE
Conventional mode:
AssetsShort term investments 3,000 3,000 Cash and bank balances 878 159,885
LiabilitiesShort term borrowings 183,265 -
Shariah compliant mode:
AssetsCash and bank balances 8 -

144 Cyan Limited
Notes to and forming part of thefinancial statementsFor the year ended December 31, 2016
30 FINANCIAL INSTRUMENTS BY CATEGORY
As at December 31, 2016, the financial assets carried on the statement of financial position are categorised either as ‘Loans and receivables’, ‘financial assets at fair value through profit or loss’, ‘held to maturity’ or ‘available for sale’. The financial liabilities carried on the statement of assets and liabilities are categorised as other financial liabilities i.e. liabilities other than ‘at fair value through profit or loss’.
--------------------As at December 31, 2016--------------------
Loans and receivables
Held to maturity
Financial assets
available for sale
Financial assets at fair value through
profit or loss
Total
Financial assets -------------------------- Rupees in ‘000 --------------------------Loan to employees 12,315 - - - 12,315 Long term deposits 2,500 - - - 2,500 Trade and other receivables 11,619 - - - 11,619 Advances 3,881 - - - 3,881 Cash and bank balances 906 - - - 906 Investments 3,000 44,367 864,822 2,700,319 3,612,508
34,221 44,367 864,822 2,700,319 3,643,729
-------- As at December 31, 2016 -------- Liabilities
‘at fair value through
profit or loss’
Other financial liabilities
Total
---------------Rupees in ‘000---------------Financial liabilities Deferred liability - 10,528 10,528 Creditors, accrued expenses and other liabilities - 89,852 89,852 Accrued mark-up - 1,796 1,796
- 102,176 102,176
-------------------------As at December 31, 2015-------------------------
Loans and receivables
Held to maturity
Financial assets
available for sale
Financial assets at fair value through profit or loss
Total
Financial assets ------------------------------- Rupees in ‘000 -------------------------------Loan to employees 14,060 - - - 14,060 Long term deposits 2,500 - - - 2,500 Trade and other receivables 10,981 - - - 10,981 Advances 3,063 - - - 3,063 Cash and bank balances 159,891 - - - 159,891 Investments 3,000 44,077 548,028 2,230,212 2,825,317
193,495 44,077 548,028 2,230,212 3,015,812

145Annual Report 2016
Notes to and forming part of thefinancial statementsFor the year ended December 31, 2016
--------As at December 31, 2015-------- Liabilities
‘at fair value through profit
or loss’
Other financial liabilities
Total
---------------Rupees in ‘000---------------Financial liabilities Deferred liability - 8,369 8,369 Creditors, accrued expenses and other liabilities - 252,457 252,457 Accrued mark-up - - -
- 260,826 260,826
31 FINANCIAL RISK MANAGEMENT OBJECTIVES AND POLICIES
The Company’s activities expose it to a variety of financial risks: credit risk, liquidity risk and market risk (including interest/ mark-up rate risk, foreign exchange risk and equity price risk). The Company’s overall risk management focuses on the unpredictability of financial markets and seeks to minimize potential adverse effects on the financial performance. The Company actively monitors the key factors that affect the stock market. The Company consistently manages its exposure to financial risk in the manner described in the notes below.
31.1 Risk management framework
The Board of Directors has the overall responsibility for establishment and oversight of the Company’s risk management framework. The executive management team is responsible for developing and monitoring the Company’s risk management policies. The team regularly meets and any changes and compliance issues are reported to the Board of Directors.
Risk management systems are reviewed regularly by the executive management team to reflect changes in market conditions and the Company’s activities. The Company, through its training and management standards and procedures, aims to develop a disciplined and constructive control environment in which all employees understand their roles and obligations.
31.2 Credit risk
Credit risk represents the risk of a loss if the counterparties fail to perform as contracted. The Company’s credit risk mainly arises from deposits with banks, loan to employees, advances and trade and other receivables. For banks and financial institutions, management keeps deposits with reputed institutions. Credit risk on account of dividend receivable is minimal due to the statutory protection. All transactions in listed securities are settled / paid for upon delivery using the system of National Clearing Company of Pakistan Limited. The risk of default in these transactions is considered minimal due to inherent systematic measures taken therein. The details on account of certain classified equity and debt securities and provision held thereagainst are stated in note 9.2.1 and 9.2.3 to these financial statements. Investments amounting to Rs. 44.367 million (2015: Rs. 44.077 million) relate to Government Securities and are not considered as credit risk due to government guarantee.

146 Cyan Limited
Notes to and forming part of thefinancial statementsFor the year ended December 31, 2016
31.2.1 Exposure to credit risk
The book value of financial assets represents the maximum credit exposure, as specified below:
Note 2016 2015Financial assets (Rupees in ‘000)
Long term loan 31.2.1.4 12,315 14,060 Long term deposits 2,500 2,500 Trade and other receivables 31.2.1.1 11,619 10,981 Advances 3,881 3,063 Cash and bank balances 31.2.1.3 906 159,891 Investments 3,612,508 2,825,317
3,643,729 3,015,812
31.2.1.1The maximum exposure to credit risk for trade and other receivables at the balance sheet date are as follows:
2016 2015Gross Impairment Net Gross Impairment Net
-------------------------------------(Rupees in ‘000)-------------------------------------
Not past due 3,748 - 3,748 3,110 - 3,110 Past due but not impaired 7,871 - 7,871 7,871 - 7,871 Past due and impaired 74 (74) - 74 (74) -
11,693 (74) 11,619 11,055 (74) 10,981
31.2.1.2The maximum exposure to credit risk for premium receivable and amount due from other insurers / reinsurers as at December 31 by geographic region was:
2016 2015 (Rupees in ‘000)
Foreign 542 542 Domestic 1,923 1,923
2,465 2,465
31.2.1.3The credit quality of the Company’s bank balances other than statutory deposits with SBP can be assessed with reference to external credit ratings as follows:
2016 Rating Rating Agency
(Rupees inShort term Long term ‘000)
Habib Bank Limited A-1+ AAA JCR - VIS 830 Bank Islami Pakistan Limited A-1 A+ PACRA 8 Summit Bank Limited A-1 A- JCR - VIS 9 Bank Al Falah Limited A1+ AA PACRA 16 Allied Bank Limited A1+ AA+ PACRA 23
886
2015 Rating Rating Agency
(Rupees inShort term Long term ‘000)
Habib Bank Limited A-1+ AAA JCR - VIS 1,109 Bank AL Habib Limited A1+ AA+ PACRA 155,655 Summit Bank Limited A-1 A JCR - VIS 3,083 Bank Al Falah Limited A1+ AA PACRA 16 Allied Bank Limited A1+ AA+ PACRA 22
159,885
31.2.1.4The credit risk on long term loan is minimal as these loans are given to employees and are deductible from their remuneration.

147Annual Report 2016
Notes to and forming part of thefinancial statementsFor the year ended December 31, 2016
31.3 Liquidity risk
Liquidity risk is the risk that the Company will encounter difficulty in meeting the obligations associated with its financial liabilities that are settled by delivering cash or another financial asset. Management closely monitors the Company’s liquidity and cash flow position. This includes maintenance of statement of financial position liquidity ratios, debtors and creditors concentration in terms of the overall funding mix.
The table below analyses the Company’s financial liabilities into relevant maturity groupings based on the remaining period at the reporting date to the maturity date.
2016Carrying Contractual Less than
one year1-2 2-5 Over 5 yearsamount cash flows years years
------------------------------ (Rupees in ‘000) ------------------------------On balance sheet financial liabilities and othersDeferred liability 10,528 10,528 - - - (10,528)Creditors, accrued expenses and other liabilities 89,852 89,852 (89,852) - - - Accrued mark-up 1,796 1,796 (1,796) - - -
102,176 102,176 (91,648) - - (10,528)
2015Carrying Contractual Less than one
year1-2 2-5 Over 5 Yearsamount cash flows years years
-------------------------------- (Rupees in ‘000) --------------------------------
On balance sheet financial liabilities and othersDeferred liability 8,369 8,369 - - - (8,369)Creditors, accrued expenses and other liabilities 252,457 252,457 (252,457) - - - Accrued mark-up - - - - - -
260,826 260,826 (252,457) - - (8,369)
31.4 Market risk
Market risk is the risk that changes in market prices, such as foreign exchange rates, interest rates and equity prices will affect the Company’s income or the value of its holdings of financial instruments. The objective of market risk management is to manage and control market risk exposures within acceptable parameters, while optimising the return. However, the Company is exposed to interest rate risk and equity price risk.
The Company is exposed to market risk with respect to its investments, long term loan , short term deposits and bank balances. The Company limits market risk by maintaining a diversified portfolio and by continuous monitoring of developments in the equity market. The market risks associated with the Company’s business activities are interest rate risk and price risk. The Company is not exposed to material currency risk.
31.4.1 Interest rate risk
Interest rate risk is the risk that the fair values of future cash flows of a financial instrument will fluctuate because of changes in market interest rates. At the reporting date, the interest rate profile of the Company’s interest-bearing financial instruments was:

148 Cyan Limited
Carrying amounts Effective interest (Rupees in ‘000) rate in %
Financial Assets 2016 2015 2016 2015
Fixed rate instruments- Government Securities 44,367 44,077 6.20% 7.76%- TDR 3,000 3,000 5.25% 5.5%
Variable rate instruments- Saving accounts 886 159,885 3.03% to 5.5% 5.5% to 7%
Sensitivity analysis for fixed rate instruments
The Company does not account for fixed rate financial assets at fair value through profit or loss. Therefore, a change in interest rates at the reporting date would not affect profit and loss account and equity of the Company.
Sensitivity analysis for variable rate instruments
A change of 100 basis points in interest rates at the year end would have increase or decrease net assets by Rs.0.009 million (2015: Rs.1.60 million). The analysis assumes that all other variables remain constant.
31.4.1.1 Maturity profile of financial assets and liabilities
2016
Profit rate % per annum
Interest / mark-up bearingNot
exposed to yield / interest rate risk
TotalUpto three months
More than three
months and up to one year
More than one year
----------------------------(Rupees in ‘000)----------------------------Financial assetsLoan to employees 6.00% 699 1,631 9,985 - 12,315 Long term deposits - - - 2,500 2,500 Advances - - - 3,881 3,881 Investments 5.25% to 6.20% 3,000 44,367 - 3,565,141 3,612,508 Trade and other receivables - - - 11,619 11,619 Cash and bank balances 3.03% to 5.5% 886 - - 20 906
4,585 45,998 9,985 3,583,161 3,643,729 Financial liabilitiesDeferred liability - - - 10,528 10,528 Creditors, accrued expenses and other liabilities - - - 89,852 89,852 Accrued mark-up - - - 1,796 1,796
- - - 102,176 102,176
On-balance sheet gap (a) 4,585 45,998 9,985 3,480,985 3,541,553
Off-balance sheet financial instruments - - - - -
Off-balance sheet gap (b) - - - - -
Total interest rate sensitivity gap (a) + (b) 4,585 45,998 9,985 3,480,985 3,541,553
Cumulative interest rate sensitivity gap 4,585 50,583 60,568
Notes to and forming part of thefinancial statementsFor the year ended December 31, 2016

149Annual Report 2016
2015
Profit rate % per annum
Interest / mark-up bearingNot
exposed to yield / interest rate risk
TotalUpto three months
More than three months
and up to one year
More than one year
--------------------------- (Rupees in ‘000) --------------------------Financial assetsLoan to employees 6% & 11.47% 717 1,631 11,712 - 14,060 Long term deposits - - - 2,500 2,500 Advances - - - 3,063 3,063 Investments 5.5% to 7.76% 3,000 44,077 - 2,778,240 2,825,317 Trade and other receivables - - - 10,981 10,981 Cash and bank balances 5.5% to 7% 159,885 - - 6 159,891
163,602 45,708 11,712 2,794,790 3,015,812 Financial liabilitiesDeferred liability - - - 8,369 8,369 Creditors, accrued expenses and other liabilities - - - 252,457 252,457 Accrued mark-up - - - - -
- - - 260,826 260,826
On-balance sheet gap (a) 163,602 45,708 11,712 2,533,964 2,754,986
Off-balance sheet financial instruments - - - - -
Off-balance sheet gap (b) - - - - -
Total interest rate sensitivity gap (a) + (b) 163,602 45,708 11,712 2,533,964 2,754,986
Cumulative interest rate sensitivity gap 163,602 209,310 221,022
31.4.2 Equity price risk
The Company is exposed to equity price risk because of investments held by the Company and classified on the Statement of Financial Position as available for sale and at fair value through profit or loss. To manage its price risk arising from investments in equity securities, the Company diversifies its portfolio within the eligible stocks.
In case of 5% increase / decrease in KSE 100 index on December 31, 2016, net profit for the year would increase / decrease by Rs. 35.128 million (2015: Rs. 26.875 million) as a result of gains / losses on equity securities at fair value through profit or loss and available for sale.
The analysis is based on the assumption that the equity index had increased / decreased by 5% with all other variables held constant and all the Company’s equity instruments moved according to the historical correlation with the index. This represents management’s best estimate of a reasonable possible shift in the KSE-100 index, having regard to the historical volatility of the index. The composition of the Company’s investment portfolio and the correlation thereof to the KSE index, is expected to change over time. Accordingly, the sensitivity analysis prepared as of December 31, 2016 is not necessarily indicative of the effect on the Company’s net assets of future movements in the level of the KSE-100 index.
31.4.3 Foreign currency risk
The Company is not materially exposed to risk from foreign currency exchange rate fluctuations.
Notes to and forming part of thefinancial statementsFor the year ended December 31, 2016

150 Cyan Limited
32 FAIR VALUE OF FINANCIAL INSTRUMENTS
Fair value is an amount for which an asset could be exchanged, or a liability settled, between knowledgeable willing parties in an arm’s length transaction. Consequently, differences may arise between the carrying values and the fair value estimates.
Underlying the definition of fair value is the presumption that the Company is a going concern without any intention or requirement to curtail materially the scale of its operations or to undertake a transaction on adverse terms.
Financial assets which are tradable in an open market are revalued at the market prices prevailing on the reporting date. The estimated fair value of all other financial assets and liabilities is considered not significantly different from carrying value as the items are short-term in nature or periodically repriced.
As per the requirements of the IFRS 13, the Company shall classify fair value measurements using a fair value hierarchy that reflects the significance of the inputs used in making the measurements. The fair value hierarchy has the following levels:
- Quoted prices (unadjusted) in active markets for identical assets or liabilities (level 1);
- Inputs other than quoted prices included within level 1 that are observable for the asset or liability, either directly (i.e. as prices) or indirectly (i.e. derived from prices) (level 2); and
- Inputs for assets or liability that are not based on observable market data (i.e. unobservable inputs) (level 3).
Investment carried at fair value are categorized as follows:
-------------- As at December 31, 2016 -------------- Level 1 Level 2 Level 3 Total------------------- (Rupees in ‘000) -------------------
ASSETS
Investment in securities - financial assets atfair value through profit or loss
- Quoted shares 2,697,752 - - 2,697,752 - Mutual fund units 2,567 - - 2,567
Investment in securities - financial assetsavailable for sale
- Quoted shares 864,822 - - 864,822 - Mutual fund units - - - -
--------------- As at December 31, 2015 --------------- Level 1 Level 2 Level 3 Total
ASSETS --------------------- (Rupees in ‘000) ---------------------
Investment in securities - financial assets atfair value through profit or loss- Quoted Shares 2,124,447 - - 2,124,447 - Mutual fund units 105,765 - - 105,765
Investment in securities - financial assetsavailable for sale
- Quoted Shares 509,727 - - 509,727 - Mutual fund units 38,301 - - 38,301
Notes to and forming part of thefinancial statementsFor the year ended December 31, 2016

151Annual Report 2016
33 CAPITAL RISK MANAGEMENT
The Company’s objective when managing capital is to safeguard the Company’s ability to continue as a going concern so that it can continue to provide returns for shareholders and benefits for other stakeholders and to maintain a strong capital base to support the sustained development of its businesses.
The Company manages its capital structure by monitoring return on net assets and makes adjustments to it in the light of changes in economic conditions. In order to maintain or adjust the capital structure, the Company may adjust the amount of dividend paid to shareholders or issue new shares.
2016 201534 EARNINGS PER SHARE – basic and diluted (Rupees in ‘000)
Net profit for the year attributable to ordinary shareholders 711,233 335,035
(Number of shares)
Weighted average number of ordinary shares outstanding during the year 58,627,722 58,627,722
(Rupees)
Basic earnings per share 12.13 5.71
35 PROVIDENT FUND RELATED DISCLOSURES
The following information is based on the latest unaudited financial statements of the Fund for the half year ended December 31, 2016:
2016 2015(Rupees in ‘000)
Size of the fund - Total assets 20,269 15,076
Cost of investments made 20,196 14,762
Percentage of investments made 99.64% 98%
Fair value of investments 20,196 14,762
35.1 The break-up of fair value of investments is2016 2015
(Rupees in ‘000) % (Rupees in ‘000) %
Cash and Bank deposits 20,196 100% 14,762 100%
The investments of the provident fund have been made in accordance with the provisions of Section 227 of the Companies Ordinance, 1984 and the rules formulated for this purpose.
Notes to and forming part of thefinancial statementsFor the year ended December 31, 2016

152 Cyan Limited
36 NUMBER OF EMPLOYEES
The total average number of employees during the year and as at December 31, 2016 and 2015 respectively are as follows:
2016 2015No of employees
Average number of employees during the year 16 16
Number of employees as at December 31 16 17
37 GENERAL
Comparative information has been re-classified, re-arranged or additionally incorporated in these financial statements, wherever necessary to facilitate comparison and to conform with changes in presentation in the current year. There were no significant reclassifications / restatements during the year.
38 DATE OF AUTHORISATION FOR ISSUE
These financial statements were authorised for issue on February 22, 2017 by the Board of Directors of the Company.
Notes to and forming part of thefinancial statementsFor the year ended December 31, 2016
Sulaiman S. Mehdi Kamran NishatChief Executive Director
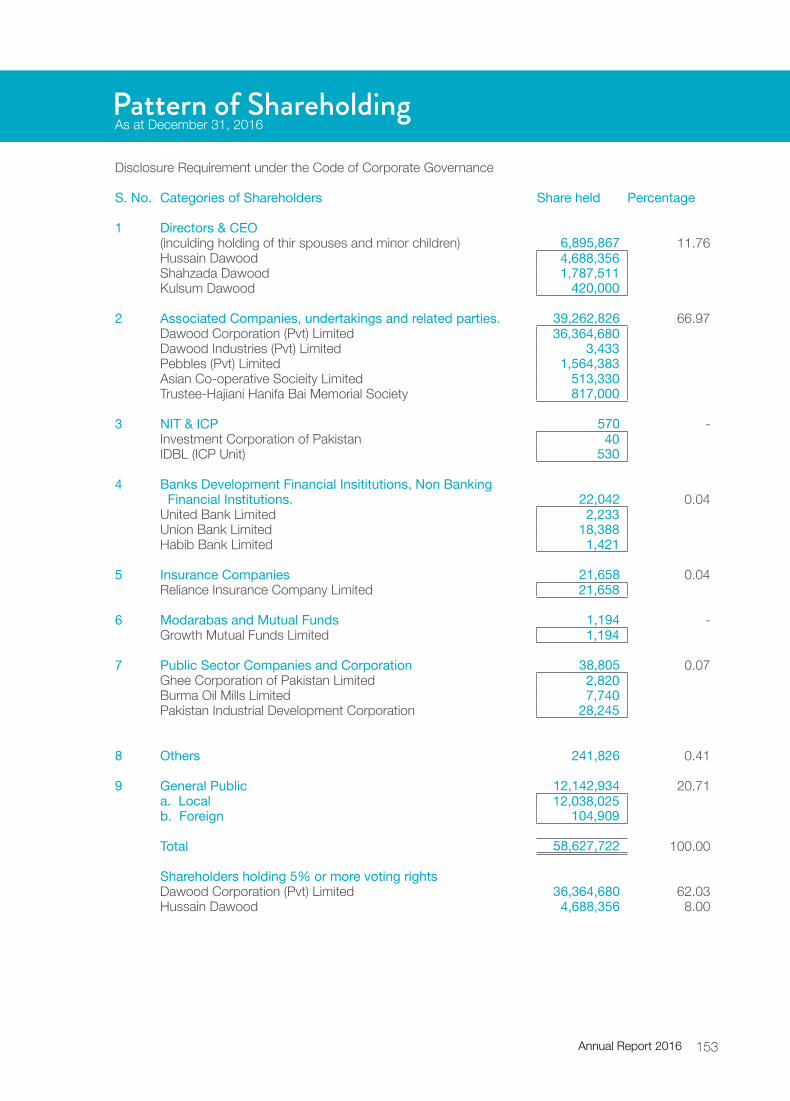
153Annual Report 2016
Pattern of ShareholdingAs at December 31, 2016
Disclosure Requirement under the Code of Corporate Governance
S. No. Categories of Shareholders Share held Percentage
1 Directors & CEO(inculding holding of thir spouses and minor children) 6,895,867 11.76Hussain Dawood 4,688,356 Shahzada Dawood 1,787,511 Kulsum Dawood 420,000
2 Associated Companies, undertakings and related parties. 39,262,826 66.97Dawood Corporation (Pvt) Limited 36,364,680 Dawood Industries (Pvt) Limited 3,433 Pebbles (Pvt) Limited 1,564,383 Asian Co-operative Socieity Limited 513,330 Trustee-Hajiani Hanifa Bai Memorial Society 817,000
3 NIT & ICP 570 - Investment Corporation of Pakistan 40 IDBL (ICP Unit) 530
4 Banks Development Financial Insititutions, Non BankingFinancial Institutions. 22,042 0.04
United Bank Limited 2,233 Union Bank Limited 18,388 Habib Bank Limited 1,421
5 Insurance Companies 21,658 0.04Reliance Insurance Company Limited 21,658
6 Modarabas and Mutual Funds 1,194 - Growth Mutual Funds Limited 1,194
7 Public Sector Companies and Corporation 38,805 0.07Ghee Corporation of Pakistan Limited 2,820 Burma Oil Mills Limited 7,740 Pakistan Industrial Development Corporation 28,245
8 Others 241,826 0.41
9 General Public 12,142,934 20.71a. Local 12,038,025 b. Foreign 104,909
Total 58,627,722 100.00
Shareholders holding 5% or more voting rights Dawood Corporation (Pvt) Limited 36,364,680 62.03Hussain Dawood 4,688,356 8.00

154 Cyan Limited
Pattern of ShareholdingAs at December 31, 2016
No. of Shareholders
Shareholding Range Total Shares heldFrom To
337 1 100 7,041374 101 500 159,304386 501 1000 366,405566 1001 5000 1,489,869138 5001 10000 1,052,14447 10001 15000 597,59128 15001 20000 510,74319 20001 25000 420,93321 25001 30000 602,5836 30001 35000 198,2508 35001 40000 309,0224 40001 45000 167,3365 45001 50000 242,2013 50001 55000 156,9633 55001 60000 176,6162 60001 65000 129,0003 65001 70000 200,4492 70001 75000 140,6533 75001 80000 234,2043 80001 85000 245,8131 90001 95000 93,7441 95001 100000 100,0001 100001 105000 104,2002 110001 115000 223,1271 120001 125000 124,0001 170001 175000 172,0711 190001 195000 190,5001 415001 420000 420,0001 495001 500000 500,0001 510001 515000 513,3301 815001 820000 817,0001 1560001 1565000 1,564,3831 1775001 1780000 1,777,6031 1780001 1785000 1,780,0971 1785001 1790000 1,787,5111 4685001 4690000 4,688,3561 36360001 36365000 36,364,680
1,976 58,627,722

155Annual Report 2016
Pattern of ShareholdingAs at December 31, 2016
S.No. Caegories of Shareholders Number of Shareholders
Total Shares Held Percentage
1 Banks Development Financial 3 22,042 0.04Instituations, Non Banking FinancialInstituations.
2 Insurance Companies 1 21,658 0.04
3 Directors, Chief Executive Officer 3 6,895,867 11.76and their spouse and minor children
4 Associated Companies, undertaking 5 39,262,826 66.97and related parties
5 NIT & ICP 2 570 -
6 Modarbas and Mutual Funds 1 1,194 -
7 Public Sector Companies and Corporation 3 38,805 0.07
8 Foreign Investors 3 104,909 0.18
9 Others 22 241,826 0.41
10 Individuals 1,933 12,038,025 20.53 1,976 58,627,722 100
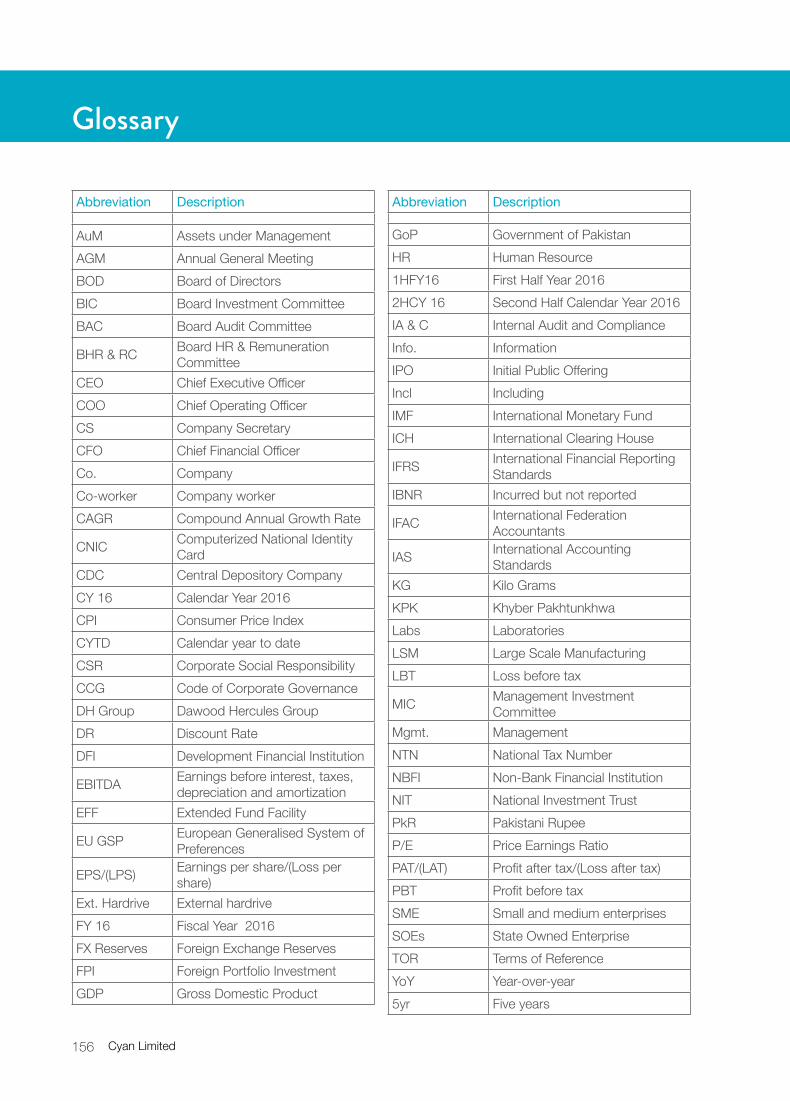
156 Cyan Limited
Glossary
Abbreviation Description
AuM Assets under ManagementAGM Annual General MeetingBOD Board of DirectorsBIC Board Investment CommitteeBAC Board Audit Committee
BHR & RC Board HR & Remuneration Committee
CEO Chief Executive OfficerCOO Chief Operating OfficerCS Company SecretaryCFO Chief Financial OfficerCo. CompanyCo-worker Company workerCAGR Compound Annual Growth Rate
CNIC Computerized National Identity Card
CDC Central Depository CompanyCY 16 Calendar Year 2016CPI Consumer Price IndexCYTD Calendar year to dateCSR Corporate Social ResponsibilityCCG Code of Corporate GovernanceDH Group Dawood Hercules GroupDR Discount RateDFI Development Financial Institution
EBITDA Earnings before interest, taxes, depreciation and amortization
EFF Extended Fund Facility
EU GSP European Generalised System of Preferences
EPS/(LPS) Earnings per share/(Loss per share)
Ext. Hardrive External hardriveFY 16 Fiscal Year 2016FX Reserves Foreign Exchange ReservesFPI Foreign Portfolio Investment GDP Gross Domestic Product
Abbreviation Description
GoP Government of PakistanHR Human Resource1HFY16 First Half Year 20162HCY 16 Second Half Calendar Year 2016IA & C Internal Audit and ComplianceInfo. InformationIPO Initial Public OfferingIncl IncludingIMF International Monetary FundICH International Clearing House
IFRS International Financial Reporting Standards
IBNR Incurred but not reported
IFAC International Federation Accountants
IAS International Accounting Standards
KG Kilo GramsKPK Khyber PakhtunkhwaLabs LaboratoriesLSM Large Scale ManufacturingLBT Loss before tax
MIC Management Investment Committee
Mgmt. ManagementNTN National Tax NumberNBFI Non-Bank Financial InstitutionNIT National Investment TrustPkR Pakistani RupeeP/E Price Earnings RatioPAT/(LAT) Profit after tax/(Loss after tax)PBT Profit before taxSME Small and medium enterprisesSOEs State Owned EnterpriseTOR Terms of ReferenceYoY Year-over-year5yr Five years

157Annual Report 2016

158 Cyan Limited

159Annual Report 2016
160 Cyan Limited

161Annual Report 2016

162 Cyan Limited

163Annual Report 2016

164 Cyan Limited

165Annual Report 2016

166 Cyan Limited

167Annual Report 2016

168 Cyan Limited

169Annual Report 2016

170 Cyan Limited

171Annual Report 2016

This page left blank intentionally.

I/We_________________________________________________ of ____________________
being a member of CYAN LIMITED and holder of _______________ Ordinary Shares as
per Share Register Folio No.____________ and/or CDC participant ID No. __________
and Account / Sub Account No.________________ hereby appoint __________________
_________________________ of ________________________________________________
or failing him/her ________________________ of __________________ as my proxy to
vote for me and on my/our behalf at the Annual General Meeting of the company to
be held at Dawood Center, Karachi on April 28, 2017 at 3:00 pm and at any adjournment
thereof.
Signed this ________ day of___________ 2017
Witness 1Signature _________________________Name _________________________CNIC No. or _________________________Passport No. _________________________Address _________________________
Witness 2Signature _________________________Name _________________________CNIC No. or _________________________Passport No. _________________________Address _________________________
Notes:• A member entitled to attend and vote at the meeting may appoint any member as his/her proxy to attend
the meeting and vote.
• If a member is unable to attend the meeting, they may complete and sign this form and send it to the Company Secretary, Cyan Limited at the registered office 4th floor, Dawood Centre, M.T Khan Road, Karachi so as to reach not less than 48 hours before the time appointed for holding the Meeting.
• For CDC Account Holders / Corporate Entities In addition to the above the following requirements have to be met.
(i) The proxy form shall be witnessed by two persons whose names, addresses and CNIC numbers shall be stated on the form.
(ii) Attested copies of CNIC or the passport of the beneficial owners and the proxy shall be provided with the proxy form.
(iii) The proxy shall produce his original CNIC or original passport at the time of the meeting. In case of a corporate entity, the Board of Director resolution / power of attorney with the specimen signature shall be submitted (unless it has been provided earlier) along with the proxy form to the Company.
Signature on Revenue Stamps of Rupees Five
Signature should agree with specimen signature with the Company.
Proxy Form
The Company Secretary,Cyan Limited4th Floor, Dawood CentreM.T. Khan RoadKarachi

االجس اعم اسالہن اتسووناں ڈاک � �
ملی ان سی
مسمی/امسمۃ_____________________________اسنک______________________________________________/ می
اسنک_____________________ مسمی /امسمۃ ڈ، /
� �ملی ان سی ربمم
تی� �
ث� بح�ی �
________________________ علض __________________
ررکایچ� ن
سی داٴود ہک وج اعم االجس ہن ےک ۵۷ اسال ےسینپمک رطف ری / امہری می اور ہگج ری / امہری می وہ اتہک وہں رکات ایسک( رقمر وطبر اتخمر )رپ وک
ڈاےل۔ ووٹ می االجس دشہ وتلمی یسک ےک اس اور ےہ وہراہ دقعنم دورہپ ۳:۰۰ ےجب وبتق ہعمج �ی ۲۰۱۷ ربوز ۲۸ ارپن ی
اتبر� می
دطختس ___________ربوز ___________۲۰۱۷
وگاہ )۱(
وگاہ : ___________ دطختس
انم : ___________
ا : ___________ �ی ربمن اکرڈ انشیتخ وقیم
ربمن : ___________ اپوپسرٹ
وگاہ )۲(
وگاہ : ___________ دطختس
انم : ___________
ا : ___________ �ی ربمن اکرڈ انشیتخ وقیم
ربمن : ___________ اپوپسرٹ
ونسٹ :
ووٹ اور رشتک می االجس وک ربمم اور یسک ہگج اینپ وہ وہ الہ اک ڈاےنل ووٹ اور رشتک می االجس وج ااگتفن/ ربمم �ی صصح ا ا�ی اک ینپمک
ےہ۔ اتکس رک انزمد لی ےک ڈاےنل
روڈ، -یٹ-اخن ر، ا�ی� ن سی زنمل، داٴود وچیھت آسف ررٹی ، ررٹسجڈ سی ینپمک انبم افرم رپایسک بج یگ وہں رث وم می وصرت ایس اں گی انزمد امتم
وہں۔ وموصل لبق ےس ۴۸ ےٹنھگ وتق رقمرہ ےک ااقعند ےک االجس رکایچ، وک
ےہ : الزیم رکان وپرا یھب وک رشاطئ ز�ی درج العوہ ےک وضاطب ابال دنمر ہج لی ےک ان ربمم � روپر�ی واےل / اک رےنھک CDC ااکٴوٹن
۔ ی اچ�ہ وہےن رپ اسھت ربمنےک اکرڈ انشیتخ وقیم اور وگایہ، ےتپ یک ااخشص دو افرم انزمدیگ
۔ ی اچ�ہ وہین کلسنم وقنل دشہ ت
دصت�ی یک اکرڈ انشیتخ ےک وکی از مب اور ااگتفن �ی صصح اسدہ اسھت ےک افرم انزمیگ
افرم )رپایسک انزمد می وصرت یک ادارے ۔ رک�ی ث
ی �پ رضور وپسرٹ ااپ �ی اکرڈ انشیتخ الص اانپ وتق ےک االجس وہڈلر( ےک وکی )رپایسک از مب
۔ یئ
رکوا� عمج ذہامی ینپمک اسھت ےک ومنہن دیطختس ےک صخش رکدہ انزمد ہعمب انہم اتخمر ا داد�ی رقار یک ز ر � ڈارئ�ی آف وبرڈ اسھت افرم( ےک
افرم اک ڈامندنئیگ � �
ملی ان سی
اک( روےپ ولطمہب )اپچن
رک�ی دطختس اور رک�ی اپسچں وٹکٹ ین
�ی و ر�ی
وہےن اطمقب ےک ومنہن دیطختس وفحمظ ےس ےلہپ اپس ےک ینپمک دطختس
۔ ی �ہ رضوری
)۱
)۲
)۳

The Company Secretary,Cyan Limited4th Floor, Dawood CentreM.T. Khan RoadKarachi

