inhibition of schistosoma japonicum glutathione
TRANSCRIPT
i
Inhibition of Schistosoma japonicum glutathione
transferase by Cibacron Blue: Insights from
structural, functional and molecular modelling
studies
Babongiwe Hlabano
A dissertation submitted to the Faculty of Science, University of the Witwatersrand
Johannesburg, in fulfilment of the requirements for the degree of Master of Science.
July, 2018

i
DECLARATION
I declare that this dissertation is my own, unaided work. It is being submitted for the degree of
Master of Science in the University of the Witwatersrand, Johannesburg. It has not been
submitted for any other degree or examination at any other University.
__________________
Babongiwe Hlabano
25th day of July, 2018
ii
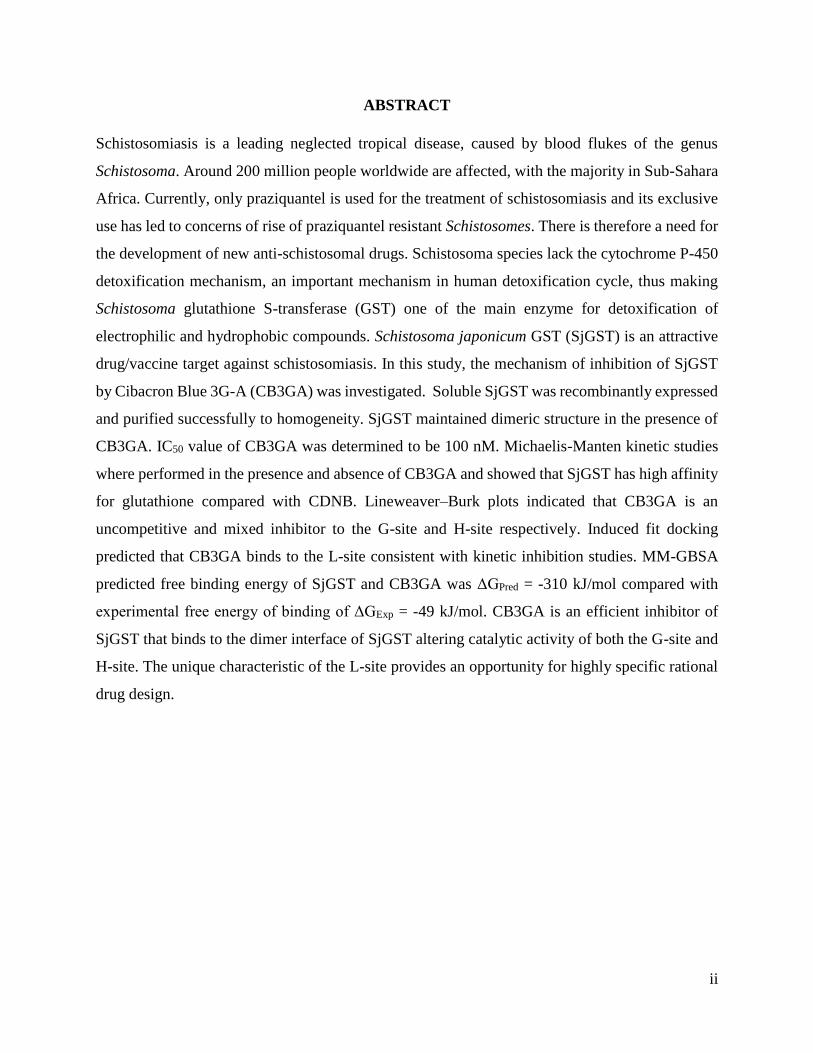
ABSTRACT
Schistosomiasis is a leading neglected tropical disease, caused by blood flukes of the genus
Schistosoma. Around 200 million people worldwide are affected, with the majority in Sub-Sahara
Africa. Currently, only praziquantel is used for the treatment of schistosomiasis and its exclusive
use has led to concerns of rise of praziquantel resistant Schistosomes. There is therefore a need for
the development of new anti-schistosomal drugs. Schistosoma species lack the cytochrome P-450
detoxification mechanism, an important mechanism in human detoxification cycle, thus making
Schistosoma glutathione S-transferase (GST) one of the main enzyme for detoxification of
electrophilic and hydrophobic compounds. Schistosoma japonicum GST (SjGST) is an attractive
drug/vaccine target against schistosomiasis. In this study, the mechanism of inhibition of SjGST
by Cibacron Blue 3G-A (CB3GA) was investigated. Soluble SjGST was recombinantly expressed
and purified successfully to homogeneity. SjGST maintained dimeric structure in the presence of
CB3GA. IC50 value of CB3GA was determined to be 100 nM. Michaelis-Manten kinetic studies
where performed in the presence and absence of CB3GA and showed that SjGST has high affinity
for glutathione compared with CDNB. Lineweaver–Burk plots indicated that CB3GA is an
uncompetitive and mixed inhibitor to the G-site and H-site respectively. Induced fit docking
predicted that CB3GA binds to the L-site consistent with kinetic inhibition studies. MM-GBSA
predicted free binding energy of SjGST and CB3GA was ΔGPred = -310 kJ/mol compared with
experimental free energy of binding of ΔGExp = -49 kJ/mol. CB3GA is an efficient inhibitor of
SjGST that binds to the dimer interface of SjGST altering catalytic activity of both the G-site and
H-site. The unique characteristic of the L-site provides an opportunity for highly specific rational
drug design.

iii
DEDICATION
To my mom and dad “I’m getting closer”
Gogo maNyathi lo Baba Muhle “lakusasa lingadinwa eGabula”
My family and loved ones who have stood by my side.
iv
ACKNOWLEDGEMENTS
To my supervisor, Dr. Ikechukwu A. Achilonu, I am most grateful for your guidance, patience and
extending your valuable knowledge through the course of my research. Your love for science is
contagious. I am a better scientist today, “daalu nke ukwuu”.
Prof H.W. Dirr for his support. “I have realised my potential”
Tshireletso “Fam” Mentor for his assistance in computational work. “It’s done”.
Members of the Protein Structure-Function Research Unit for providing a good working
environment.
The University of the Witwatersrand and the Council for Scientific and Industrial Research (CSIR)
for financial assistance.
v
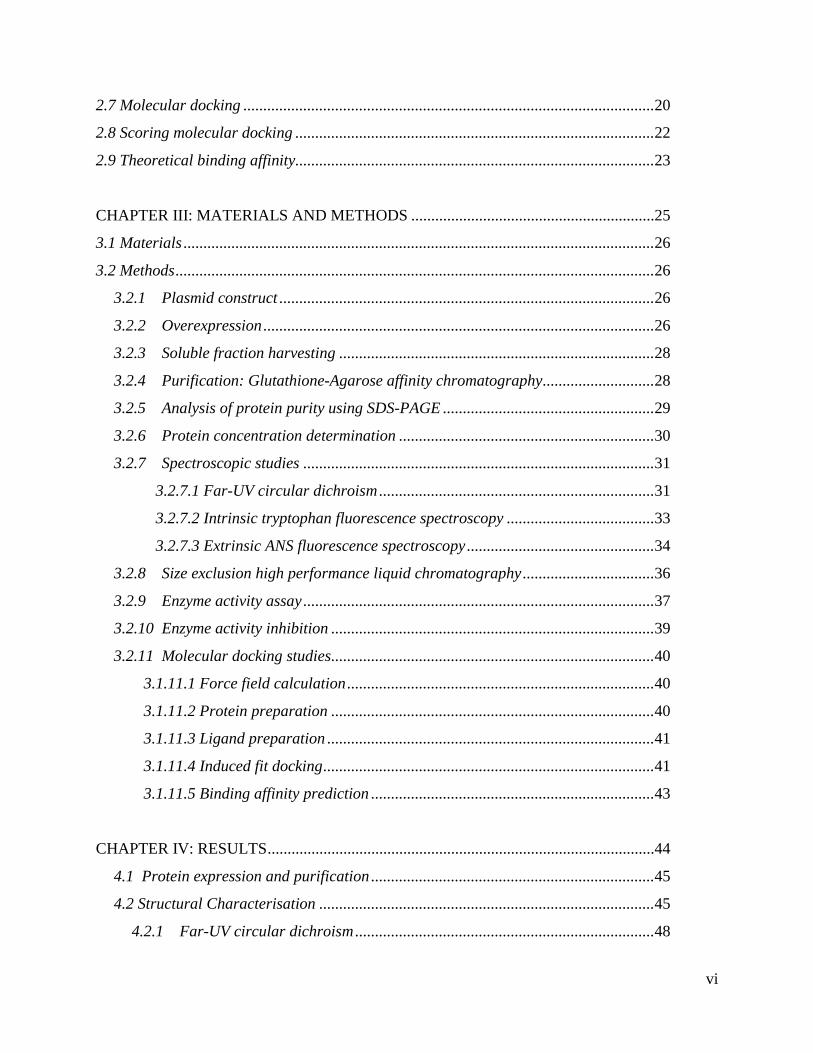
TABLE OF CONTENTS
DECLARATION ................................................................................................................. i
ABSTRACT ........................................................................................................................ ii
ACKNOWLEDGEMENT ................................................................................................. iv
TABLE OF CONTENTS .....................................................................................................v
LIST OF FIGURES ......................................................................................................... viii
LIST OF TABLES ............................................................................................................. ix
ABBREVIATIONS .............................................................................................................x
CHAPTER I: INTRODUCTION .........................................................................................1
1.1 Schistosomiasis overview ...............................................................................................2
1.2 Problem statement .........................................................................................................2
1.3 Rationale ........................................................................................................................3
1.4 Novelty ...........................................................................................................................4
1.5 Aim .................................................................................................................................4
1.6 Objectives .......................................................................................................................4
1.7 Overview ........................................................................................................................5
CHAPTER II: LITERATURE REVIEW ............................................................................6
2.1 Schistosomiasis ..............................................................................................................7
2.1.1 Background ........................................................................................................7
2.1.2 Schistosoma life cycle ..........................................................................................9
2.1.3 Pathogenesis of schistosomiasis ..........................................................................9
2.1.4 Treatment of schistosomiasis.............................................................................11
2.2 Oxidative stress in Schistosoma ...................................................................................12
2.3 Helminth glutathione S-transferases............................................................................13
2.4 Schistosoma glutathione S-transferase ........................................................................14
2.5 Enzyme inhibition.........................................................................................................15
2.6 Enzyme inhibition kinetics ...........................................................................................17
vi
2.7 Molecular docking .......................................................................................................20
2.8 Scoring molecular docking ..........................................................................................22
2.9 Theoretical binding affinity..........................................................................................23
CHAPTER III: MATERIALS AND METHODS .............................................................25
3.1 Materials ......................................................................................................................26
3.2 Methods ........................................................................................................................26
3.2.1 Plasmid construct ..............................................................................................26
3.2.2 Overexpression ..................................................................................................26
3.2.3 Soluble fraction harvesting ...............................................................................28
3.2.4 Purification: Glutathione-Agarose affinity chromatography ............................28
3.2.5 Analysis of protein purity using SDS-PAGE .....................................................29
3.2.6 Protein concentration determination ................................................................30
3.2.7 Spectroscopic studies ........................................................................................31
3.2.7.1 Far-UV circular dichroism .....................................................................31
3.2.7.2 Intrinsic tryptophan fluorescence spectroscopy .....................................33
3.2.7.3 Extrinsic ANS fluorescence spectroscopy ...............................................34
3.2.8 Size exclusion high performance liquid chromatography .................................36
3.2.9 Enzyme activity assay ........................................................................................37
3.2.10 Enzyme activity inhibition .................................................................................39
3.2.11 Molecular docking studies .................................................................................40
3.1.11.1 Force field calculation .............................................................................40
3.1.11.2 Protein preparation .................................................................................40
3.1.11.3 Ligand preparation ..................................................................................41
3.1.11.4 Induced fit docking ...................................................................................41
3.1.11.5 Binding affinity prediction .......................................................................43
CHAPTER IV: RESULTS .................................................................................................44
4.1 Protein expression and purification .......................................................................45
4.2 Structural Characterisation ....................................................................................45
4.2.1 Far-UV circular dichroism ...........................................................................48
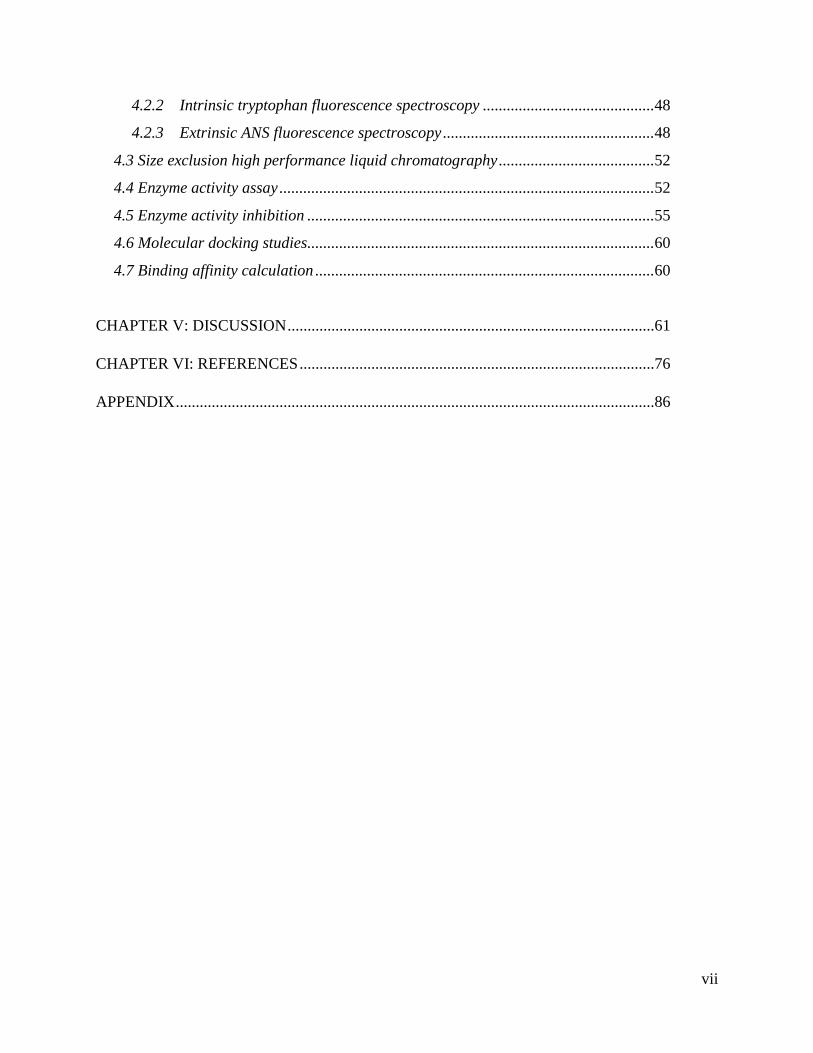
vii
4.2.2 Intrinsic tryptophan fluorescence spectroscopy ...........................................48
4.2.3 Extrinsic ANS fluorescence spectroscopy .....................................................48
4.3 Size exclusion high performance liquid chromatography .......................................52
4.4 Enzyme activity assay ..............................................................................................52
4.5 Enzyme activity inhibition .......................................................................................55
4.6 Molecular docking studies.......................................................................................60
4.7 Binding affinity calculation .....................................................................................60
CHAPTER V: DISCUSSION ............................................................................................61
CHAPTER VI: REFERENCES .........................................................................................76
APPENDIX ........................................................................................................................86
viii
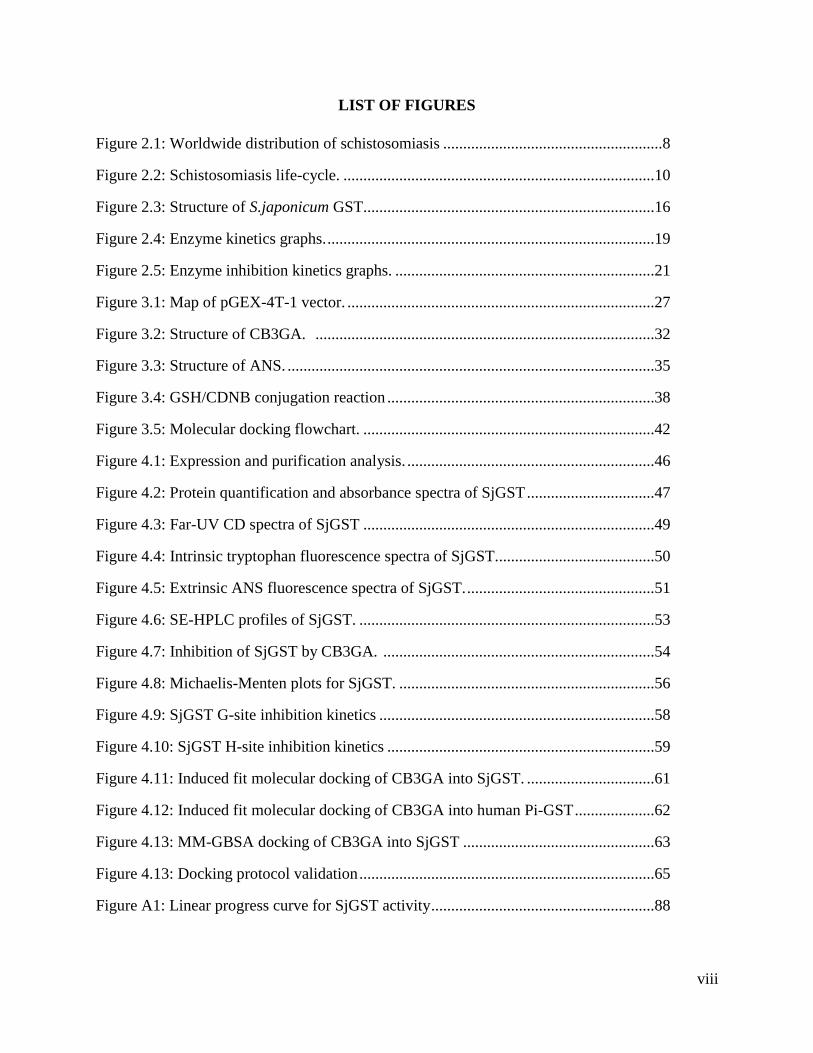
LIST OF FIGURES
Figure 2.1: Worldwide distribution of schistosomiasis .......................................................8
Figure 2.2: Schistosomiasis life-cycle. ..............................................................................10
Figure 2.3: Structure of S.japonicum GST.........................................................................16
Figure 2.4: Enzyme kinetics graphs. ..................................................................................19
Figure 2.5: Enzyme inhibition kinetics graphs. .................................................................21
Figure 3.1: Map of pGEX-4T-1 vector. .............................................................................27
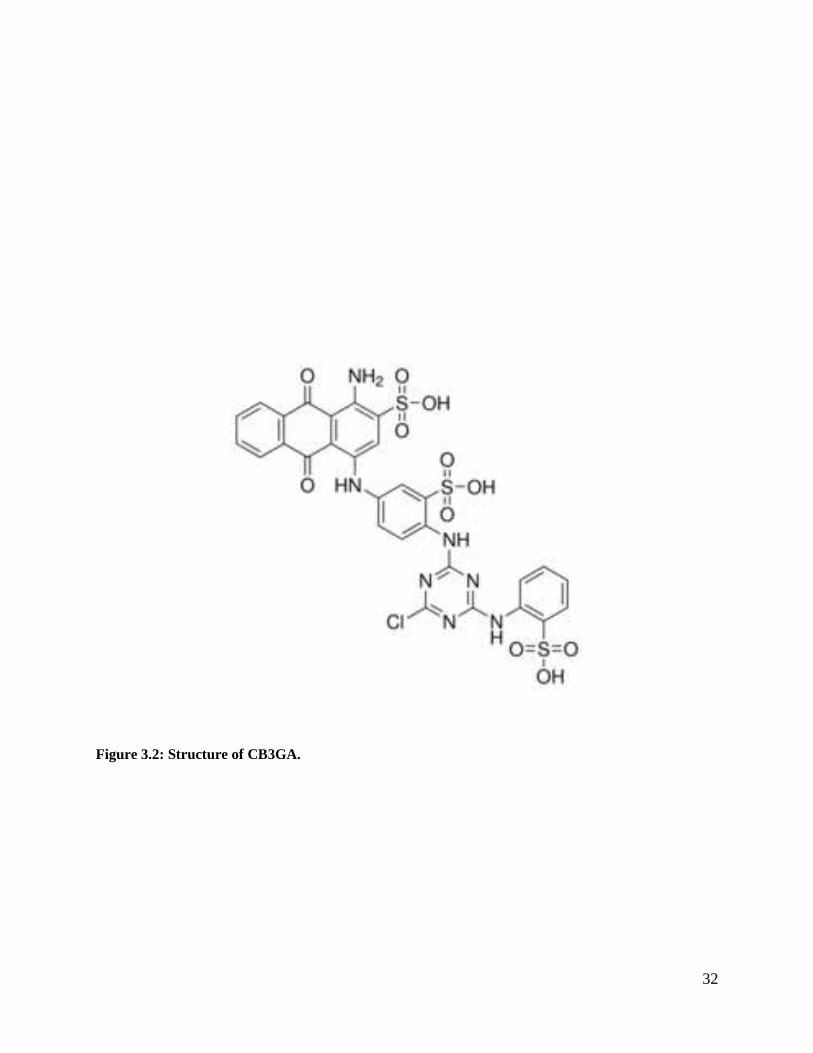
Figure 3.2: Structure of CB3GA. .....................................................................................32
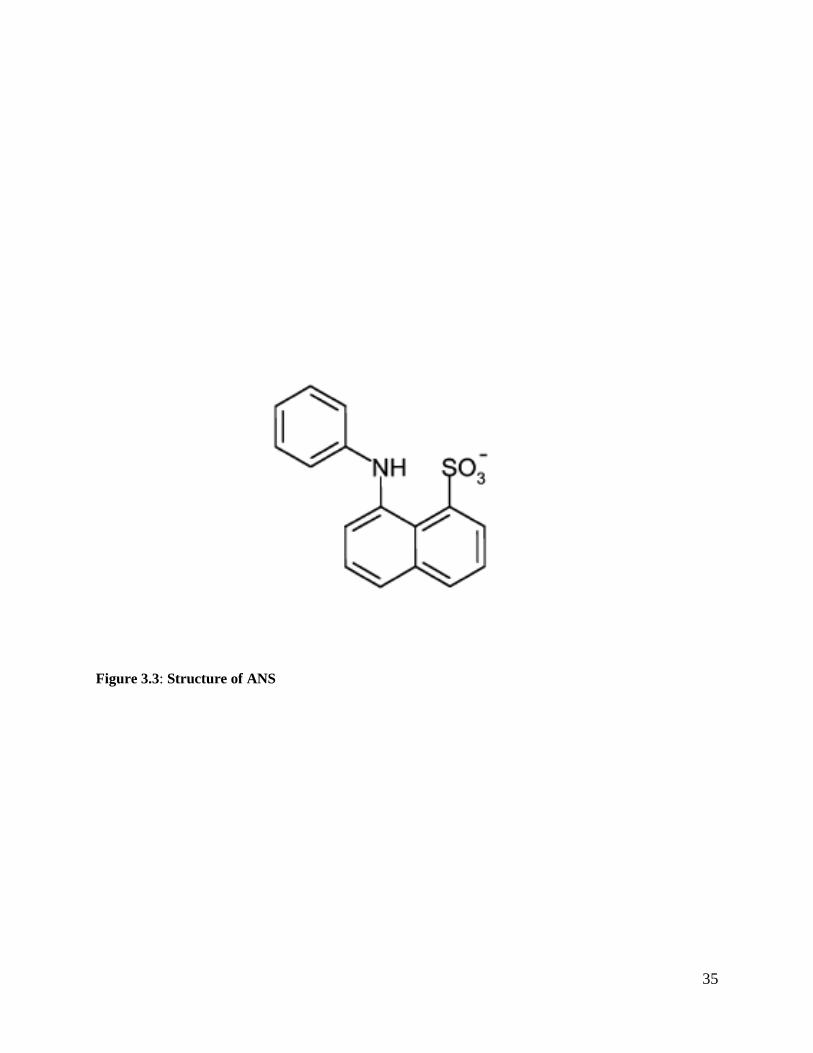
Figure 3.3: Structure of ANS. ............................................................................................35
Figure 3.4: GSH/CDNB conjugation reaction ...................................................................38
Figure 3.5: Molecular docking flowchart. .........................................................................42
Figure 4.1: Expression and purification analysis. ..............................................................46
Figure 4.2: Protein quantification and absorbance spectra of SjGST ................................47
Figure 4.3: Far-UV CD spectra of SjGST .........................................................................49
Figure 4.4: Intrinsic tryptophan fluorescence spectra of SjGST. .......................................50
Figure 4.5: Extrinsic ANS fluorescence spectra of SjGST. ...............................................51
Figure 4.6: SE-HPLC profiles of SjGST. ..........................................................................53
Figure 4.7: Inhibition of SjGST by CB3GA. ....................................................................54
Figure 4.8: Michaelis-Menten plots for SjGST. ................................................................56
Figure 4.9: SjGST G-site inhibition kinetics .....................................................................58
Figure 4.10: SjGST H-site inhibition kinetics ...................................................................59
Figure 4.11: Induced fit molecular docking of CB3GA into SjGST. ................................61
Figure 4.12: Induced fit molecular docking of CB3GA into human Pi-GST ....................62
Figure 4.13: MM-GBSA docking of CB3GA into SjGST ................................................63
Figure 4.13: Docking protocol validation ..........................................................................65
Figure A1: Linear progress curve for SjGST activity ........................................................88
ix
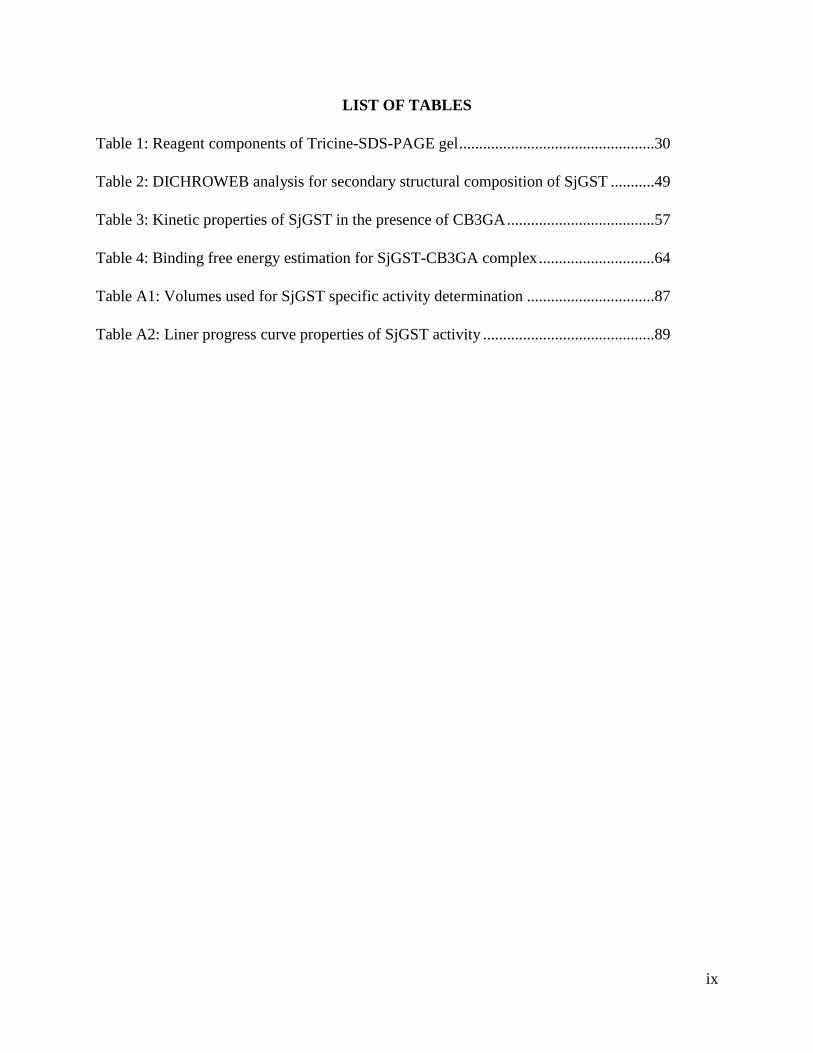
LIST OF TABLES
Table 1: Reagent components of Tricine-SDS-PAGE gel .................................................30
Table 2: DICHROWEB analysis for secondary structural composition of SjGST ...........49
Table 3: Kinetic properties of SjGST in the presence of CB3GA .....................................57
Table 4: Binding free energy estimation for SjGST-CB3GA complex .............................64
Table A1: Volumes used for SjGST specific activity determination ................................87
Table A2: Liner progress curve properties of SjGST activity ...........................................89
x
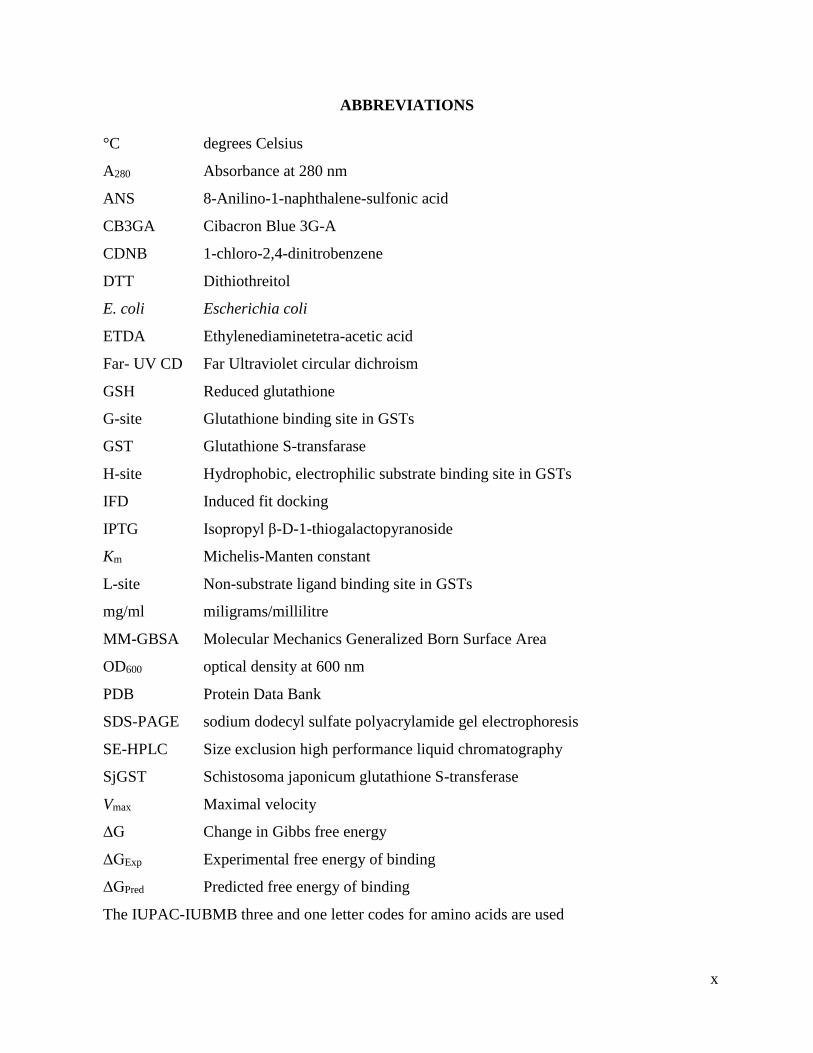
ABBREVIATIONS
°C degrees Celsius
A280 Absorbance at 280 nm
ANS 8-Anilino-1-naphthalene-sulfonic acid
CB3GA Cibacron Blue 3G-A
CDNB 1-chloro-2,4-dinitrobenzene
DTT Dithiothreitol
E. coli Escherichia coli
ETDA Ethylenediaminetetra-acetic acid
Far- UV CD Far Ultraviolet circular dichroism
GSH Reduced glutathione
G-site Glutathione binding site in GSTs
GST Glutathione S-transfarase
H-site Hydrophobic, electrophilic substrate binding site in GSTs
IFD Induced fit docking
IPTG Isopropyl β-D-1-thiogalactopyranoside
Km Michelis-Manten constant
L-site Non-substrate ligand binding site in GSTs
mg/ml miligrams/millilitre
MM-GBSA Molecular Mechanics Generalized Born Surface Area
OD600 optical density at 600 nm
PDB Protein Data Bank
SDS-PAGE sodium dodecyl sulfate polyacrylamide gel electrophoresis
SE-HPLC Size exclusion high performance liquid chromatography
SjGST Schistosoma japonicum glutathione S-transferase
Vmax Maximal velocity
ΔG Change in Gibbs free energy
ΔGExp Experimental free energy of binding
ΔGPred Predicted free energy of binding
The IUPAC-IUBMB three and one letter codes for amino acids are used

1
CHAPTER I
INTRODUCTION
2
1.1 Overview of Schistosomiasis
Schistosomiasis (Bilharzia) is a leading parasitic disease in terms of public health impact,
accounting for 40% of tropical disease burden, if malaria is excluded (Adenowo et al., 2015).
Schistosomiasis is caused by a parasitic blood flukes of genus Schistosoma, infections pose serious
burden to socio-economic state of countries affected. The main species affect humans are S.
japonicum, S. haematobium, and S. mansoni, all three have different clinical manifestations. The
parasitic disease is prevalent in Sub-Saharan Africa, which has the most impoverished populations
in the world (Muhumuza et al., 2009). The disease has remained a neglected tropical disease,
despite the disease having detrimental socio-economic impact (WHO, 2017). However, recently
some attention has been drawn to schistosomiasis due to a possibility of being associated with
human immunodeficiency virus (HIV). In a study by Secor (2012), genital schistosomiasis
infection was an apparent co-factor in the transmission of HIV. In another study by Kallestrup et
al., (2006), HIV infected patients responded poorly to schistosomiasis chemotherapy.
The preventive and first line of treatment of all types of schistosomiasis rely heavily on the
extensive use of praziquantel. Treatment with praziquantel has high cure rates with reduced
transmission and morbidity (Cioli et al., 2014). Even though praziquantel is effective after a single
dose, it does not protect individuals from re-infection (Rollinson, 2009). This is a huge problem,
especially in young children, where repeated parasitic infections lead to chronic diseases such as
impaired learning (cognitive) and growth (physiological), splenomegaly, anaemia, fibrosis and
granulomatous reactions for some tissues due to repeated inflammation (Jordan et al., 1993).
1.2 Problem statement
Praziquantel is currently the only drug against schistosomiasis and is the basis of schistosomiasis
mass control worldwide (WHO, 2017). The mechanism of action of praziquantel against
schistosomiasis remains unknown. Praziquantel was introduced to schistosomiasis endemic areas
for morbidity control and has been in use for more than four decades. Prolonged use of the
praziquantel can act as a selection pressure for the emergence of minor pre-existing resistant sub-
populations of Schistosoma (Wang et al., 2012). Drug resistance remains a concern for
schistosomiasis control because of the largescale and repeated use of the drug in the treatment of
disease. There are many factors that lead to emergence of drug resistant strains in general. In
3
helminths, extensive use of praziquantel, in low sub-curative dose led to the development of
resistance to the recommended therapeutic dose (Ismail et al., 1994). In mice infected with S.
mansoni, treatment with a sub-curative dose, led to the rise of praziquantel resistant strains (Fallon
and Doenhoff, 1994). Schistosomiasis endemic areas usually have limited resources and health
authorities are compelled to equally share drugs. In most cases a sub-curative dosage is used to
cover a wider population (Baan et al., 2016; De Sousa et al., 2014; Doenhoff et al., 2009). This is
one example where current practices act as selective pressure for the emergence of praziquantel
resistant strains. The use of praziquantel will increase in the foreseeable future, whether given
alone or co-administered with other anthelminthic in integrated control programs (De Sousa et al.,
2014). Praziquantel resistance remains a threat and requires adequate monitoring of current mass
drug administration programs. The effect of drugs selective pressures and long-term drug use for
treatment of schistosomiasis is poorly understood. There is no alternative drug for schistosomiasis
treatment if resistance emerges. Therefore, a need to develop novel anti-schistosomal drugs.
1.3 Rationale
Oxamniquine and metrifonate are the other two drugs used to treat schistosomiasis. However,
oxamniquine can only treat intestinal S. mansoni schistosomiasis (Ferrari et al., 2003). Metrifonate
is only effective against urinary S. haematobium schistosomiasis (Feldmeier and Chitsulo, 1999).
The challenge with these two drugs is the limited specificity against different types of
schistosomiasis; hence, they are inadequate in mass control of schistosomiasis. Other
disadvantages of both drugs are that they have a high operational cost per dose and unpleasant side
effects (Reich et al., 1998). These factors carry a heavy financial burden in the eradication of
schistosomiasis in endemic countries most of which have a low gross domestic product (Adenowo
et al., 2015). Therefore, the new drug to be developed requires to be highly effective against all
forms of schistosomiasis, cheap and easily distributed with no special conditions needed such as
refrigerated logistics.
Upon the entry to the human host schistosomes rapidly transform from free-swimming infective
cercariae to endoparasitic schistosomules. These migrate and access the circulatory system to site
of infection (bladder or intestines) (Jordan et al., 1993). During these stages schistosomes undergo
various morphological, physiological and biochemical changes into adult phase, in order to adapt
4
and ensure survival (Ressurreição et al., 2016). The series of changes is accompanied by high
oxidative stress from internally (physiological changes) and externally (host immune response)
(Alger and Williams, 2002). Hence, to abate oxidative stress schistosomes must possess adequate
mechanisms of detoxification systems. These rely on reducing equivalents from the disulfide
oxidoreductases, glutathione (GSH) and thioredoxin (Alger and Williams, 2002). Schistosoma
species have limited detoxification enzymes such as superoxide dismutase, glutathione peroxidase,
glutathione S-transfarase and catalase. Glutathione S-transferase (GST) is one of the major enzyme
involved in detoxification in Schistosoma. GSTs catalyse conjugation of GSH with endogenous
xenobiotic compounds for elimination from the cell (Brophy and Barrett, 1990). GST serves as a
suitable drug target because Schistosoma GST (SGST) serves as a primary defence against
oxidative damage and toxic electrophilic xenobiotics (Brophy and Barrett, 1990). Hence,
inhibition of SGST may be adverse to Schistosoma. In this study, focus will be on the inhibition
of S. japonicum GST (SjGST) which will serve as a model for all Schistosoma species because all
Schistosoma GSTs have similar structural fold and function.
1.4 Novelty
Cibacron Blue 3G-A (CB3GA) is a GST inhibitor. The mode of inhibition of CB3GA on SjGST
has not been established. The kinetics of SjGST inhibition by CB3GA will help to understand the
functional properties of SjGST. The findings can then be applied to aid rational drug design against
Schistosoma GSTs.
1.5 Aim
The aim of the study is to biophysically characterise S. japonicum glutathione S-transferase
(SjGST) inhibition by CB3GA.
1.6 Objectives
In order to accomplish the aim of the study, the objectives of this study are to:
• recombinantly express and purify SjGST.
• characterise the secondary structure of SjGST using Far-ultraviolet circular dichroism (Far-
UV CD).
5
• characterise the tertiary structure of SjGST using intrinsic tryptophan fluorescence and
extrinsic 8-Anilino-1-naphthalenesulfonic acid (ANS) fluorescence.
• characterise quaternary structure of SjGST in the presence and absence of CB3GA using
size exclusion high performance liquid chromatography SE-HPLC.
• determine specific activity SjGST in the presence and absence of CB3GA
• use molecular docking and MM-GBSA in order to describe the interaction between SjGST
and CB3GA.
1.7 Overview of the dissertation
The report begins in Chapter 2 (Literature review) were background information relating
information on schistosomiasis and glutathione S-transferases is provided. Chapter 3 (Materials
and Methods) provides details on the techniques and methodologies used in this study to monitor
the effect of CB3GA on SjGST. Chapter 4 (Results) here observations of this study are presented.
This chapter explains results obtained in this study. Chapter 5 (Discussion) explains and analyses
the findings of the study. The chapter provides a link of this study with pre-existing knowledge on
CB3GA and SjGST. The conclusions and future work are presented.

6
CHAPTER II
LITERATURE REVEIW
7
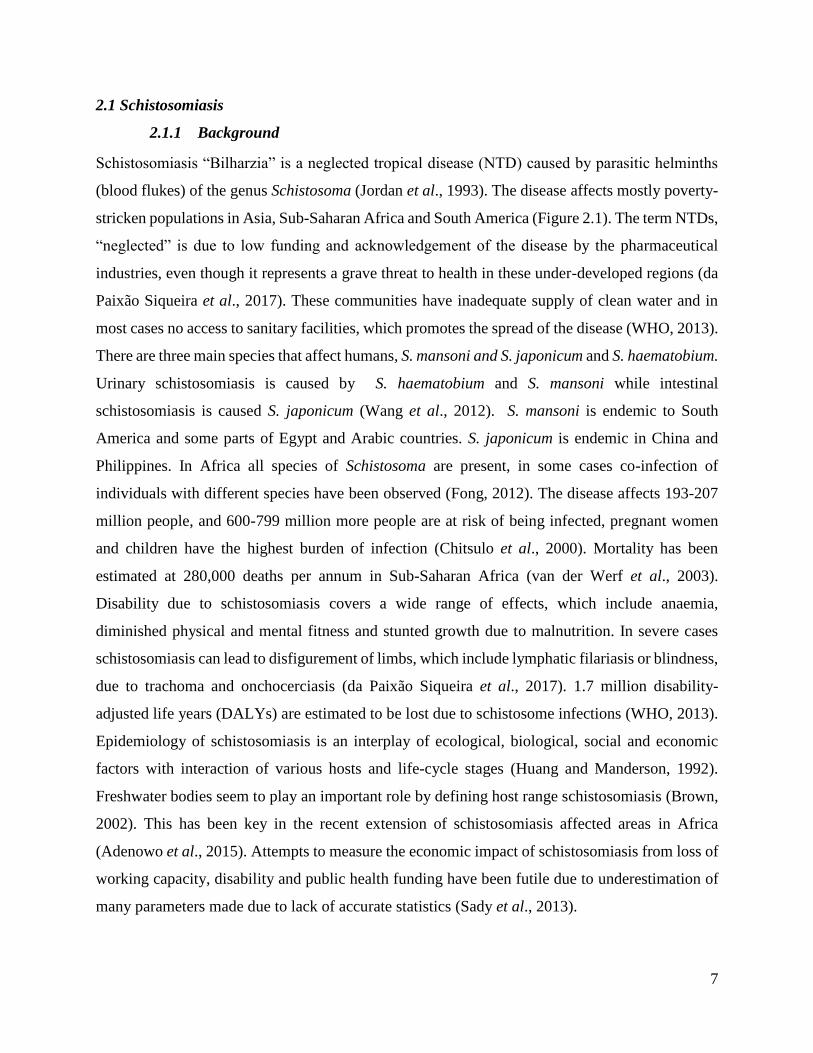
2.1 Schistosomiasis
2.1.1 Background
Schistosomiasis “Bilharzia” is a neglected tropical disease (NTD) caused by parasitic helminths
(blood flukes) of the genus Schistosoma (Jordan et al., 1993). The disease affects mostly poverty-
stricken populations in Asia, Sub-Saharan Africa and South America (Figure 2.1). The term NTDs,
“neglected” is due to low funding and acknowledgement of the disease by the pharmaceutical
industries, even though it represents a grave threat to health in these under-developed regions (da
Paixão Siqueira et al., 2017). These communities have inadequate supply of clean water and in
most cases no access to sanitary facilities, which promotes the spread of the disease (WHO, 2013).
There are three main species that affect humans, S. mansoni and S. japonicum and S. haematobium.
Urinary schistosomiasis is caused by S. haematobium and S. mansoni while intestinal
schistosomiasis is caused S. japonicum (Wang et al., 2012). S. mansoni is endemic to South
America and some parts of Egypt and Arabic countries. S. japonicum is endemic in China and
Philippines. In Africa all species of Schistosoma are present, in some cases co-infection of
individuals with different species have been observed (Fong, 2012). The disease affects 193-207
million people, and 600-799 million more people are at risk of being infected, pregnant women
and children have the highest burden of infection (Chitsulo et al., 2000). Mortality has been
estimated at 280,000 deaths per annum in Sub-Saharan Africa (van der Werf et al., 2003).
Disability due to schistosomiasis covers a wide range of effects, which include anaemia,
diminished physical and mental fitness and stunted growth due to malnutrition. In severe cases
schistosomiasis can lead to disfigurement of limbs, which include lymphatic filariasis or blindness,
due to trachoma and onchocerciasis (da Paixão Siqueira et al., 2017). 1.7 million disability-
adjusted life years (DALYs) are estimated to be lost due to schistosome infections (WHO, 2013).
Epidemiology of schistosomiasis is an interplay of ecological, biological, social and economic
factors with interaction of various hosts and life-cycle stages (Huang and Manderson, 1992).
Freshwater bodies seem to play an important role by defining host range schistosomiasis (Brown,
2002). This has been key in the recent extension of schistosomiasis affected areas in Africa
(Adenowo et al., 2015). Attempts to measure the economic impact of schistosomiasis from loss of
working capacity, disability and public health funding have been futile due to underestimation of
many parameters made due to lack of accurate statistics (Sady et al., 2013).
8
Figure 2.1: Worldwide distribution of schistosomiasis. Adapted World Health Organization online
resource: http://gamapserver.who.int/mapLibrary/ [Accessed 19/03/2018]
9
In most cases individuals in schistosomiasis endemic areas are also co-infected with other parasitic
diseases such as hook worm and malaria.
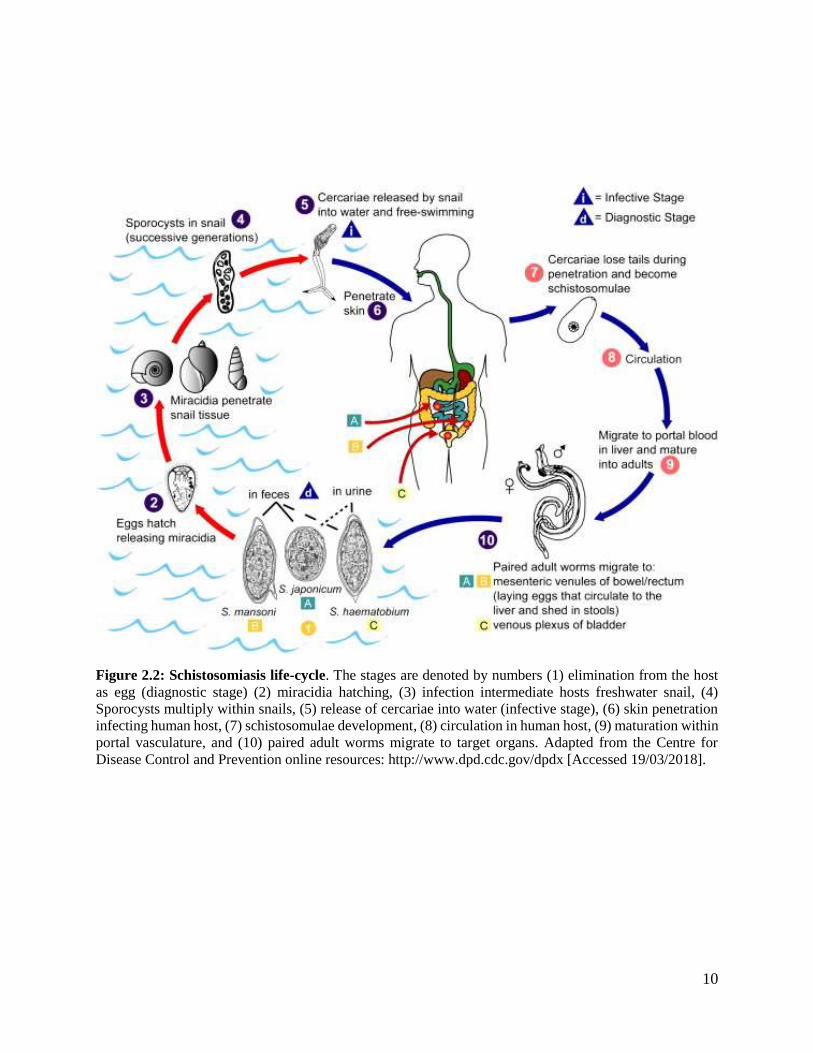
2.1.2 Schistosoma life cycle
Schistosoma species have a complex life cycle (Figure 2.2) that has multiple hosts, with a series
morphological and biochemical conversions between: the intermediate snail host, two free-
swimming aquatic larval forms, and a warm-blooded mammalian host (Figure 2.2) (Jolly et al.,
2007). Humans are the only common host, in the inter-host pathway of Schistosoma species; thus,
posing a challenge for the control of the disease. Humans acquire schistosomiasis by getting into
contact with Schistosoma skin-penetrating larvae-contaminated waters during occupational
activities. Most populations were schistosomiasis is prevalent rely on agriculture and fishing for
their livelihood. The general life cycle of Schistosoma species (Figure 2.2) starts with egg-
containing urine/stool being deposited into water. The egg hatches and releases miracidium. The
miracidium then infects freshwater snail, which divides inside the snail and transforms into
numerous sporocysts which further divide into hundreds of cercariae. The cercariae escape the
snail and swim to find and penetrate the skin of a mammalian host. Each Schistosoma species has
a limited snail host range; hence, the transmission is dependent on host snail habitat (Colley and
Secor, 2014). In humans the larva accesses the circulatory system and ends up as a young adult in
the portal vessels in the liver. The male and female worms pair up for the rest of the life cycle in
humans. They migrate downstream to the bladder or small intestines. The female lays eggs, which
are secreted via urine or stool (Abdalla et al., 2002).
2.1.3 Pathogenesis of Schistosomiasis
Morbidity due to schistosomiasis infection is characterised by three stages; migratory (cercarial
dermatitis and swimmer’s itch), acute (katayama syndrome) and chronic (organ specific)
schistosomiasis. Clinical manifestations of schistosomiasis are due to eggs trapped in the host
tissue. The eggs secrete antigens, which initiate granulomatous host immune response
characterised by lymphocytes which produce T-helper-2 cytokines, eosinophils and activated
macrophages (Pearce and MacDonald, 2002). The process of granuloma formation induces chronic
inflammation leading to tissue damage (Peterson and von Lichtenberg, 1965). Pathology
associated with chronic schistosomiasis has a wide range of clinical manifestations which are
10
Figure 2.2: Schistosomiasis life-cycle. The stages are denoted by numbers (1) elimination from the host
as egg (diagnostic stage) (2) miracidia hatching, (3) infection intermediate hosts freshwater snail, (4)
Sporocysts multiply within snails, (5) release of cercariae into water (infective stage), (6) skin penetration
infecting human host, (7) schistosomulae development, (8) circulation in human host, (9) maturation within
portal vasculature, and (10) paired adult worms migrate to target organs. Adapted from the Centre for
Disease Control and Prevention online resources: http://www.dpd.cdc.gov/dpdx [Accessed 19/03/2018].
11
species-dependent such as genital lesions, bladder, calcification of tissues, bloody diarrhoea and
urinary tract infections (Wami, 2015) . Childhood development is severely affected by repeated
schistosome infection, which compromises the immune system (Jordan et al., 1993). In female’s
genital schistosomiasis causes infertility, menstrual disorders and dyspareunia. This is due to
Schistosoma eggs that find their way to the genital region causing granulomas in the uterus. During
pregnancy, Schistosoma infection alters the uterine environment leading to severe anaemia, low
birth weight infants and increased maternal and infant mortality rates. Tissue damage can lead to
susceptibility of infection and co-infection by bacterial and viral infections such as HIV in genital
manifestations of schistosomiasis (Mazigo et al., 2014). The nature of the host immune response,
is the determinant of pathological changes associated with schistosome infections; hence,
determining severity of the infection (Ressurreição et al., 2016).
2.1.4 Treatment of schistosomiasis
Praziquantel, a pyrazinoisoquinoline derivative, is the first line of defence against all forms of
schistosomiasis. However, the mode of action of the drug is not understood. It is the primary basis
for schistosomiasis control worldwide (Doenhoff et al., 2009). Praziquantel is highly effective
with cure rate of 75-82% after 6-8 week upon initial treatment with tolerable side effects (Reich et
al., 1998). Praziquantel is effective against adult worms. But has poor activity against immature
schistosome larvae. Therefore, there is high risk of re-infection, which calls for rounds of treatment
for control of schistosomiasis (WHO, 2013). The drug affects the physiology and morphology of
the schistosomes, by altering intracellular voltage-gated calcium ion (Ca2+) levels in the adult
worm. The exposure of schistosomes to praziquantel disrupts the calcium transport, thereby
triggering rapid and sustained contraction of the worm's tegument. This exposes schistosomes
surface antigens of the worm to attack by the host immune system (Doenhoff et al., 2008).
Efficacy of praziquantel is reliant on the presence of mature antibodies to act against the parasite
(Harnett and Kusel, 1986). Praziquantel has managed to reduce the prevalence of schistosomiasis
in humans in the endemic areas such as China, Japan and Tunisia. However, it fails in reducing
new infections and transmission (Zhou et al., 2005). Humans are the most common host for
schistosomes, therefore persisting snail populations cause cycles of re-infection.
12
Metrifonate and oxamniquine are two other drugs that have been used to treat schistosomiasis.
However, due to lack of efficacy against all Schistosoma species, high cost, low efficacy and low
operational convenience. Praziquantel remains a drug of choice for the treatment of
schistosomiasis. Currently Bilhvax and Sm14 are schistosomiasis vaccines that have made it to the
clinical trials (Ricciardi and Ndao, 2015). Extensive use of praziquantel with a poorly understood
mode of action has called for the search for alternative drugs. Resistance against praziquantel is a
legitimate concern since the drug has been used since the 1970’s. In a study in Senegal by
Southgate (1997) , praziquantel showed a reduced cure rate against S. mansoni (36%) compared
with the expected 90% cure rate. In a mass schistosomiasis treatment in Egypt 1.6% of the treated
population sample showed no sign of treatment by passing viable eggs thus high doses were
required for effective treatment (Ismail et al., 1996). In Senegal and Egypt, S.mansoni has been
observed to have reduced sensitivity to praziquantel. However, resistance has not been established
at significant rates. Resistance against praziquantel has been induced and established in laboratory
conditions (Fallon and Doenhoff, 1994; Ismail et al., 1994).
2.2 Oxidative stress in Schistosoma
Schistosoma species undergo extensive physiological and morphological changes, which are
accompanied by production of reactive oxidative species. Upon entry into the human host,
Schistosoma elicits host immune response. The host defence is mediated by reactive oxidative
species against Schistosoma. Hence, they need to possess efficient detoxification systems for
survival. Three anti-oxidant enzymes are expressed by Schistosoma species namely; glutathione
peroxidase, superoxide dismutase and GST (Zelck and Von Janowsky, 2004). Anti-oxidant
systems in Schistosoma are limited. Thus, these three enzymes are critical for survival of
schistosomes with limited salvage pathways for detoxification (Zelck and Von Janowsky, 2004).
Glutathione peroxidase is involved in hydrogen peroxide detoxification via glutathione oxidation
(Arthur, 2001). Superoxide dismutase is responsible for the dismutation of toxic superoxide
radicals into oxygen and hydrogen peroxide via oxidative metal potentials (Mkoji et al., 1988).
GSTs are involved in the conjugation of electrophilic xenobitic compounds with GSH. GSTs also
neutralise reactive oxidative species from lipid peroxidation, which act on cell membranes (Zelck
and Von Janowsky, 2004). This links GST with the membrane, suggesting that it might be involved
in parasite defence against host immune response (Braschi et al., 2006). Mechanisms in
13
Schistosoma detoxification remain unclear, despite relevance to drug development and drug
resistance. These may be exploited for rational drug design to sensitise the parasite for the host
immune defence mechanism leading to elimination of schistosomiasis.
2.3 Helminth glutathione S-transferases
GSTs are a major class of multifunctional enzymes found across aerobic organisms’ kingdoms.
GST are involved detoxification by conjugating GSH with a wide range of electrophilic xenobiotic
compounds (Mannervik et al., 1988; Oakley et al., 1999). GSTs also have non-catalytic functions,
such as intracellular transport of hydrophobic ligands (Bhargava et al., 1978). Helminths have a
limited number of detoxification enzymes and lack the cytochrome P-450 detoxification
mechanism present in humans (Brophy and Barrett, 1990). GSTs have been found in all helminth
species suggesting critical role in homeostasis and survival. Helminths express more cytosolic
GSTs than microsomal GSTs and few secretory GSTs (Brophy and Pritchard, 1994). Level of
expression and activity of GST is species-dependent. However, helminths with a naked tegument
seem to have higher GST activity (Brophy, 1988). Twelve different classes of cytosolic GST have
been identified and classified namely; Alpha, Beta, Delta, Mu, Phi, Pi, Theta, Kappa, Sigma, Tau,
Omega and Zeta. Classification is based on primary and tertiary structure similarities,
immunological identity, kinetic and substrate/inhibitor specificity (Sheehan, 2001). GSTs are
dimeric proteins with a molecular weight of around 50 000 Da. A representative structure for each
class has been solved using crystallography, which shows all classes have a similar structural fold
despite varying primary structures (Mannervik et al., 1988). Non-mammalian GSTs exhibit unique
biological activity when compared with mammalian GSTs such as regeneration of S-thiolated
proteins, conjugation of GSH with endogenous ligands, involvement in metabolic pathways other
than detoxification and removal of reactive oxygen species (superoxide radical and hydrogen
peroxide). This functional diversity is due to the properties of the thiol group that participates in
redox transitions, thiol exchange reactions, thioether formation, and radical scavenging
(Graminski et al.,1989)
14
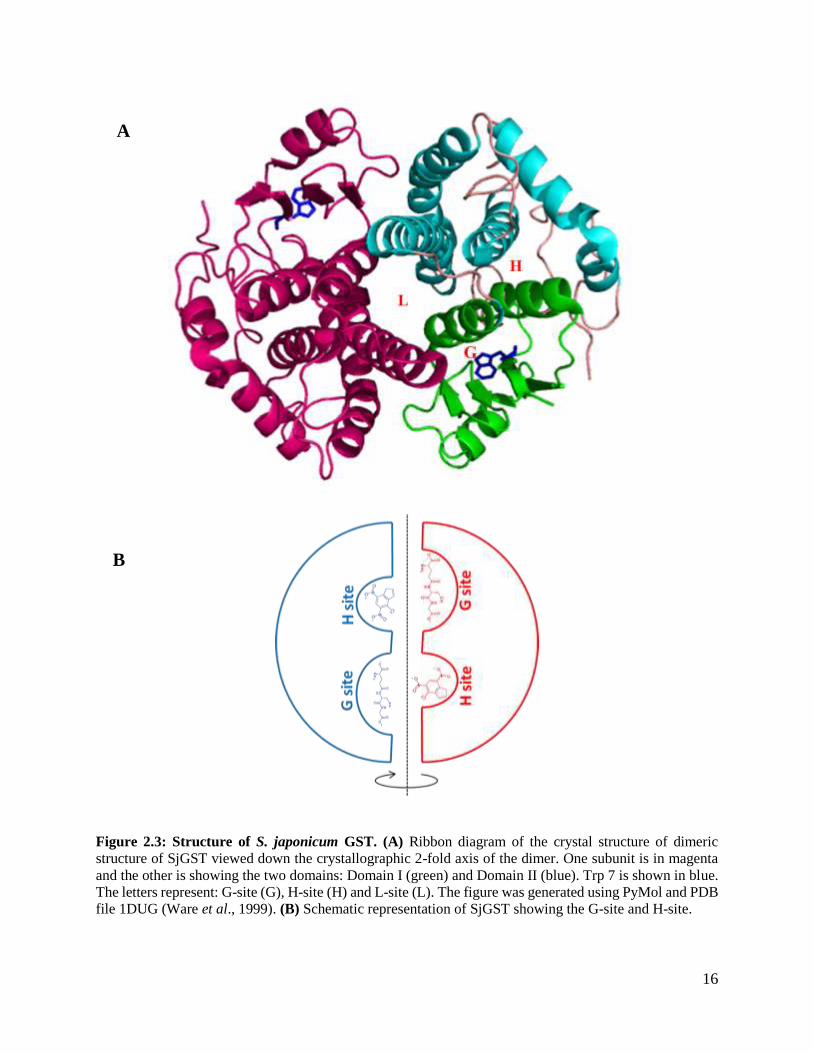
2.4 Schistosoma japonicum glutathione S-transferase
Schistosoma japonicum GST (SjGST) has two isoenzymes of molecular weight 26 000 Da and 28
000 Da, which are primary detoxification enzymes in the parasite (McTigue et al., 1995a). The
SjGST 26-kDa isoenzyme has been extensively studied. All information will be based on this
isoenzyme. Each subunit of SjGST contains 218 amino acids which fold to form two distinct
domains: N-terminal domain (residue 1-78) which contains three alpha helixes and four anti-
parallel beta sheets, this domain is referred to as the thioredoxin fold (Figure 2.3) (McTigue et al.,
1995b). The thioredoxin fold forms the hydrophobic core of SjGST based on the helix packing.
This fold has been shown to facilitate hydrophobic collapse of GST hence, detecting the folding
mechanism (Martin, 1995). The N-terminal domain contains the catalytic glutathione binding site
“G-site” (Lim et al., 1994). The larger C terminal domain (residue 85-218) contains five alpha
helixes and an extended coil (residue 195-218). The C terminal domain contains the “H-site”,
which binds to hydrophobic substrates. The H-site is highly diverse which renders the binding site
with an extensive range of possible substrates. The binding affinity and catalytic efficiency for the
different compounds vary in GST classes (Torres and Landa, 2008). SjGST contains sequence
synonymous with SNAIL/TRAIL in mammals, which is another determinant in GST
classification. The two domains are linked by a short sequence (residue 77-84) (McTigue et al.,
1995b). The SjGST fold is similar to known GST structures; however, it contains a distinct loop
(residue 33-41) (McTigue et al., 1995b). The G-site is highly specific than the H-site, however the
two sites work together to promote GSH conjugation of electrophilic substrates. A functional
SjGST contains two subunits, this dimeric form is critical for stabilising the tertiary structure of
the enzyme (Figure 2.3). The dimer interface is leads to the formation of a unique long and narrow
non-substrate binding site (L-site) (McTigue et al., 1995b). The ligandin binding site “L-site” is
poorly understood among GST families because of limited information on the structural,
thermodynamic and ligandin function. The structural differences specifically the L-site and G-site,
suggest that SjGST belongs to a new class of GSTs. Even though SjGST is classified under Mu-
GST, SjGST does not contain the loop between β2 strand and α2 helix, which is a property of Mu-
GST isoenzymes (McTigue et al., 1995a). Kinetic properties of SjGST and parasites GST are
generally understudied. Available sources have multiple variations; hence, not comparable.
Studies on SjGST have been done using GSH for G-site and 1-chloro-2,4-dinitrobenzene (CDNB)
for the H-site. SjGST has a higher affinity for GSH compared to CDNB (Torres and Landa, 2008).
15
GSTs are bi-substrate enzyme, the order and mode of substrate interaction is dependent on the
GST isoform. Unlike other cytosolic GSTs that exhibit random order of substrate binding, rat liver
alpha-GST and SjGST preferentially bind to GSH. SjGST displays random sequential single-
displacement mechanism (Stefanidis et al., 2018). SjGST is a structurally unique GST expressed
in all stages of the Schistosoma life cycle. Therefore, it is a suitable chemotherapeutic target for
the treatment of schistosomiasis.
2.5 Enzyme inhibition
Enzymes are biological catalyst with high substrate specificity and tight regulation (control).
Therefore, enzymes are good therapeutic targets because they modulate cellular activities (Kraut
et al., 2003). On the other hand, inhibitors have a direct effect on the enzyme target. Therefore,
can act as catalytic controls which can be used to study the mode of enzyme action. Development
and characterisation of inhibitors to regulate the enzyme activity are very important for disease
treatment. Inhibitors have been used in the classification of different GSTs (Mannervik et al., 1988;
Sheehan et al., 2001). Therefore, an inhibitor can be used to give insight on the catalytic
mechanism, binding topology, contributions and requirements of substrates for catalysis by
SjGST. Enzyme assays are used to study enzyme activities, they are used to determine the rates of
enzyme-catalysed reactions and play crucial importance in understanding enzyme kinetics and
enzyme inhibition studies. GSTs catalyse a wide range of reactions in the cell. GST is usually
studied using the GSH/CDNB (1-chloro-2,4-dinitrobenzene) conjugation reaction is commonly
used for assaying GST enzymatic activity. In this study SjGST activity relates to the activity of
SjGST based on the GSH/CDNB conjugation assay.
16
Figure 2.3: Structure of S. japonicum GST. (A) Ribbon diagram of the crystal structure of dimeric
structure of SjGST viewed down the crystallographic 2-fold axis of the dimer. One subunit is in magenta
and the other is showing the two domains: Domain I (green) and Domain II (blue). Trp 7 is shown in blue.
The letters represent: G-site (G), H-site (H) and L-site (L). The figure was generated using PyMol and PDB
file 1DUG (Ware et al., 1999). (B) Schematic representation of SjGST showing the G-site and H-site.
A
B
17
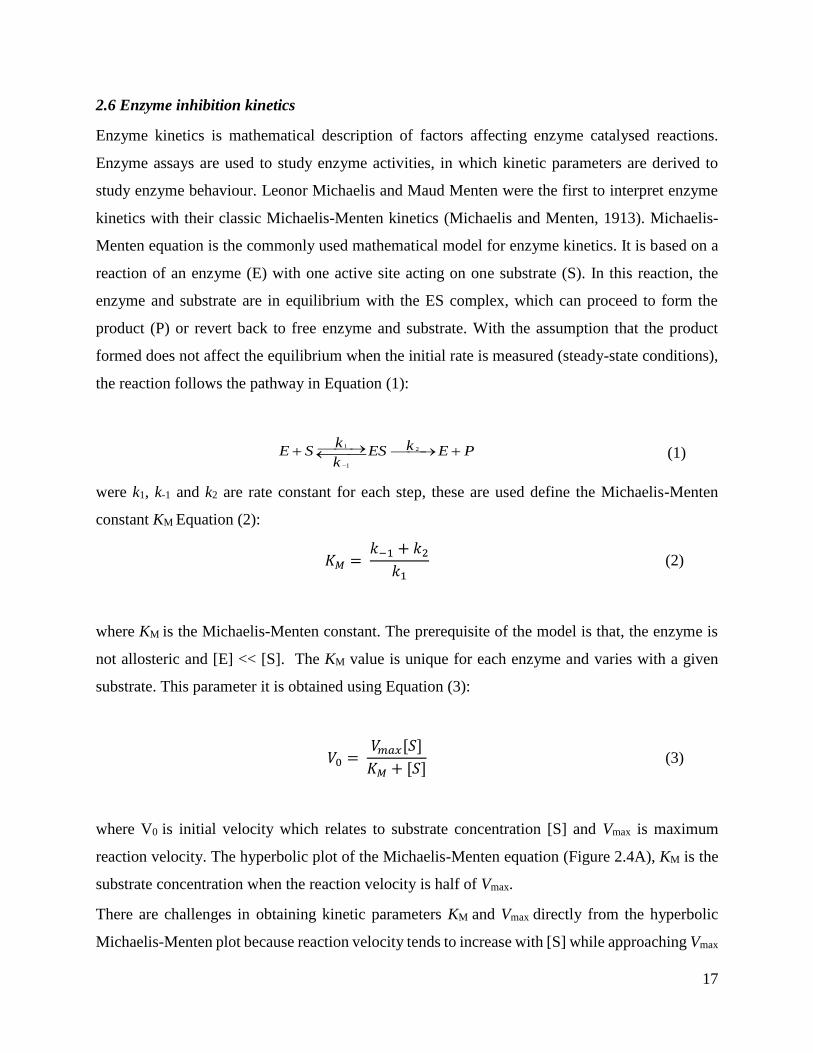
2.6 Enzyme inhibition kinetics
Enzyme kinetics is mathematical description of factors affecting enzyme catalysed reactions.
Enzyme assays are used to study enzyme activities, in which kinetic parameters are derived to
study enzyme behaviour. Leonor Michaelis and Maud Menten were the first to interpret enzyme
kinetics with their classic Michaelis-Menten kinetics (Michaelis and Menten, 1913). Michaelis-
Menten equation is the commonly used mathematical model for enzyme kinetics. It is based on a
reaction of an enzyme (E) with one active site acting on one substrate (S). In this reaction, the
enzyme and substrate are in equilibrium with the ES complex, which can proceed to form the
product (P) or revert back to free enzyme and substrate. With the assumption that the product
formed does not affect the equilibrium when the initial rate is measured (steady-state conditions),
the reaction follows the pathway in Equation (1):
12
1
k kE S ES E Pk −
⎯⎯→+ ⎯⎯→ +⎯⎯ (1)
were k1, k-1 and k2 are rate constant for each step, these are used define the Michaelis-Menten
constant KM Equation (2):
𝐾𝑀 = 𝑘−1 + 𝑘2
𝑘1 (2)
where KM is the Michaelis-Menten constant. The prerequisite of the model is that, the enzyme is
not allosteric and [E] << [S]. The KM value is unique for each enzyme and varies with a given
substrate. This parameter it is obtained using Equation (3):
𝑉0 = 𝑉𝑚𝑎𝑥[𝑆]
𝐾𝑀 + [𝑆] (3)
where V0 is initial velocity which relates to substrate concentration [S] and Vmax is maximum
reaction velocity. The hyperbolic plot of the Michaelis-Menten equation (Figure 2.4A), KM is the
substrate concentration when the reaction velocity is half of Vmax.
There are challenges in obtaining kinetic parameters KM and Vmax directly from the hyperbolic
Michaelis-Menten plot because reaction velocity tends to increase with [S] while approaching Vmax
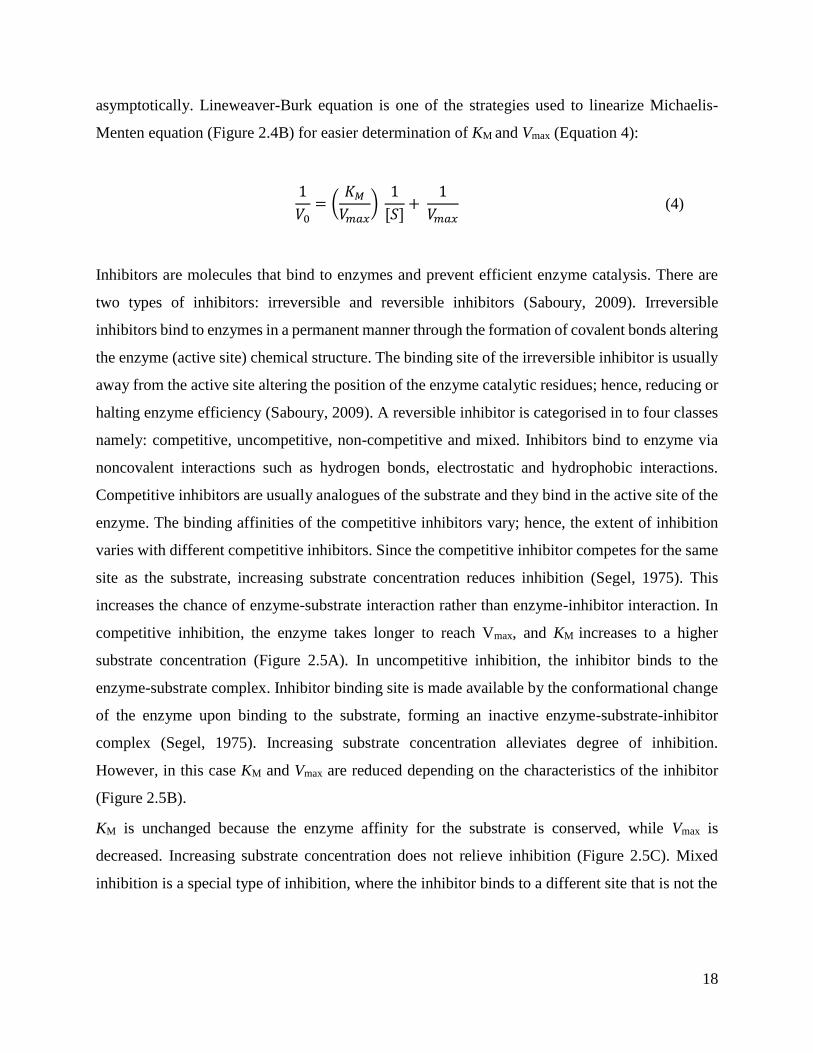
18
asymptotically. Lineweaver-Burk equation is one of the strategies used to linearize Michaelis-
Menten equation (Figure 2.4B) for easier determination of KM and Vmax (Equation 4):
1
𝑉0= (
𝐾𝑀
𝑉𝑚𝑎𝑥)
1
[𝑆]+
1
𝑉𝑚𝑎𝑥 (4)
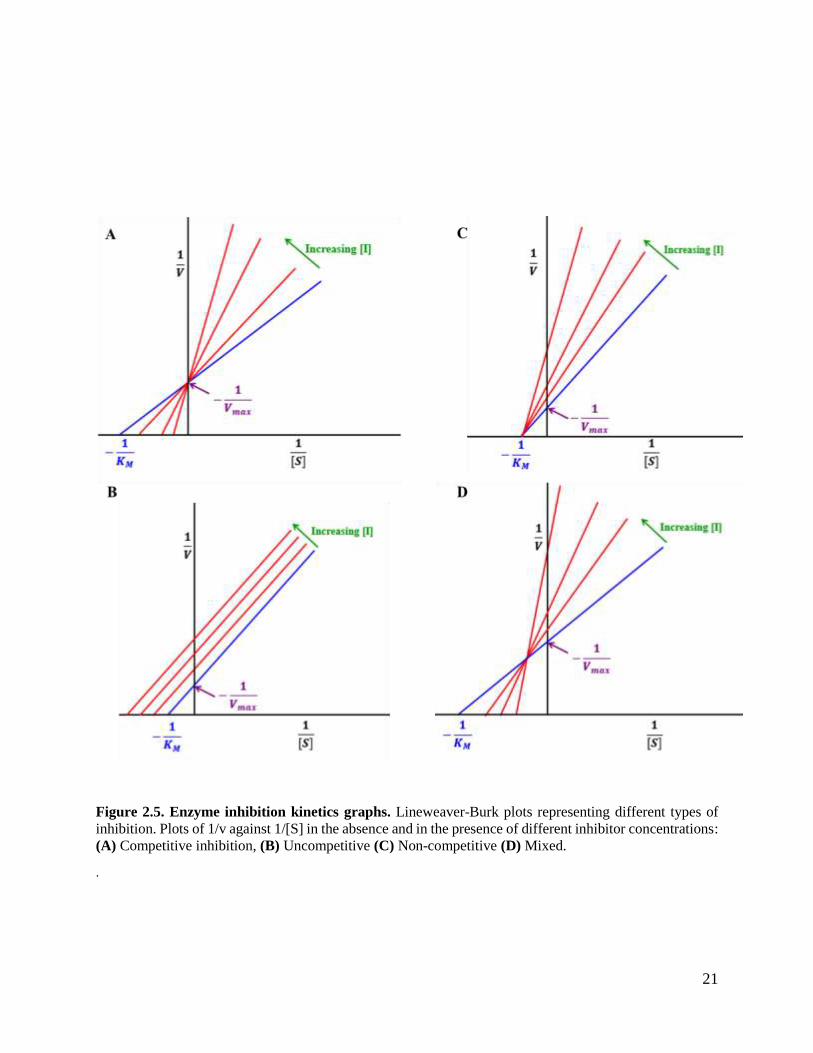
Inhibitors are molecules that bind to enzymes and prevent efficient enzyme catalysis. There are
two types of inhibitors: irreversible and reversible inhibitors (Saboury, 2009). Irreversible
inhibitors bind to enzymes in a permanent manner through the formation of covalent bonds altering
the enzyme (active site) chemical structure. The binding site of the irreversible inhibitor is usually
away from the active site altering the position of the enzyme catalytic residues; hence, reducing or
halting enzyme efficiency (Saboury, 2009). A reversible inhibitor is categorised in to four classes
namely: competitive, uncompetitive, non-competitive and mixed. Inhibitors bind to enzyme via
noncovalent interactions such as hydrogen bonds, electrostatic and hydrophobic interactions.
Competitive inhibitors are usually analogues of the substrate and they bind in the active site of the
enzyme. The binding affinities of the competitive inhibitors vary; hence, the extent of inhibition
varies with different competitive inhibitors. Since the competitive inhibitor competes for the same
site as the substrate, increasing substrate concentration reduces inhibition (Segel, 1975). This
increases the chance of enzyme-substrate interaction rather than enzyme-inhibitor interaction. In
competitive inhibition, the enzyme takes longer to reach Vmax, and KM increases to a higher
substrate concentration (Figure 2.5A). In uncompetitive inhibition, the inhibitor binds to the
enzyme-substrate complex. Inhibitor binding site is made available by the conformational change
of the enzyme upon binding to the substrate, forming an inactive enzyme-substrate-inhibitor
complex (Segel, 1975). Increasing substrate concentration alleviates degree of inhibition.
However, in this case KM and Vmax are reduced depending on the characteristics of the inhibitor
(Figure 2.5B).
KM is unchanged because the enzyme affinity for the substrate is conserved, while Vmax is
decreased. Increasing substrate concentration does not relieve inhibition (Figure 2.5C). Mixed
inhibition is a special type of inhibition, where the inhibitor binds to a different site that is not the
19
Figure 2.4: Enzyme kinetics graphs. (A) Michaelis-Menten equation graphical plot of reaction velocity
(v) against substrate concentration [S]. (B) Lineweaver-Burk graphical plot of 1/v against 1/[S]. Km and
Vmax can be determined directly by the intersection on the x-axis and y-axis respectively. In both cases
enzyme concentration is kept constant. Adapted from Jiang (2013).
A B
20
active site. However, binding of both the substrate and the inhibitor influences the binding of the
other. This type of inhibition is not a mixture of the types of inhibition; rather the substrate and KM
is unchanged because the enzyme affinity for the substrate is conserved, while Vmax is decreased.
Increasing substrate concentration does not relieve inhibition (Saboury, 2009) (Figure 2.5C).KM
and Vmax are both altered depending of the inhibitor/substrate interaction (Figure 2.5D). Mixed
inhibition is particularly important for GST since they have an additional binding site, which
allows for binding of other molecules besides GST substrates (van Bladeren and van Ommen,
1991). Lineweaver-Burk plots in the presence of different inhibitor concentrations helps to
determine the mode of enzyme inhibition. The understanding of enzyme kinetic parameters is
derived from graphical profiles rather than the actual numerical derivations from the kinetics
graphs. Thermodynamics and binding kinetics parameters and binding kinetics parameters and
binding kinetics parameters are a better strategy in the qualitative analysis of enzyme inhibition.
2.7 Molecular docking
Molecular docking is a theoretical tool used to study the structure of molecular recognition events
in-silico. Docking is of importance for rational drug design because it enables prediction of
molecular organisation of protein-ligand complexes (Sousa et al., 2006). It is a useful tool since
there is a limited number of protein crystal structures bound to desired ligand. Docking acts as a
measure to identify leading molecules (virtual screening) for drug design; thus, saving time and
money. Docking has become a standard prerequisite for drug discovery (Chaudhary and Mishra,
2016). Docking programs typically have three key components: depiction of the binding site,
algorithm for conformational search which generates binding poses and an affinity prediction
using scoring functions. There are a number of docking software available in the market such as
AUTODOCK, GLIDE, FLexX, ICM, DOCK and CHARMM to mention a few. The aim of
molecular docking is to firstly determine the lowest energy conformation of: (1) ligand
21
Figure 2.5. Enzyme inhibition kinetics graphs. Lineweaver-Burk plots representing different types of
inhibition. Plots of 1/v against 1/[S] in the absence and in the presence of different inhibitor concentrations:
(A) Competitive inhibition, (B) Uncompetitive (C) Non-competitive (D) Mixed.
.
22
conformation in the active site and (2) protein-ligand complex. Secondly, assess (score) the ligand
orientation in the protein binding site. Advancement of this technique has allowed to be a reliable
method to study protein-ligand complexes, one being the ability to dock a fully flexible ligand to
a protein (which was not possible previously) (Carlson, 2002a). Protein crystal structures used for
docking are rigid, however proteins are realistically non-static. To achieve protein flexibility in
molecular docking is computationally expensive, in most cases it cannot be resources to achieve
this are not available. Therefore, it is a better strategy to allow for flexibility of the ligand at least
to explore possible binding conformations in the static protein binding site during docking
(Teague, 2003). There are challenges that are associated with protein and/or ligand flexibility,
including providing binding site for a non-binding ligand, increased protein affinity for ligand and
determination of multiple minimised protein energy states (Carlson, 2002a). Current docking tools
have incorporated induced fit and lock-and-key mechanism to counter for protein flexibility
(Sherman et al., 2006). There are a number of limitations with docking such as the
absence/inaccurate cellular solvent, rigid binding site and inherent software errors (Sousa et al.,
2006).
2.8 Scoring of molecular docking
Scoring functions are used to predict binding affinity of the protein and ligand (Sousa et al., 2006).
There are three classes of scoring functions force field based, knowledge based and empirical
based (Liu and Wang, 2015). Scoring is a critical step in docking, which enable to distinguish the
true binding site from the alternative binding sites and/or between random and active compounds.
Scoring functions examine protein-ligand interactions, which are driven by a number of non-
covalent interactions such as hydrogen bonding, ionic interactions, van der Waals forces and
hydrophobic packing. In most docking studies, solvents are excluded from docking due high
number of degrees of freedom for solvent molecules. These are accounted for in some scoring
functions after docking (Wong and Lightstone, 2011). Rigorous analysis binding conformations.
Exhaustive analysis of the scoring functions comes with the demand of high computational power,
in most cases this may not be feasible with available computational power. Therefore, scoring
functions are oversimplified and many assumptions are made for less tedious and cheaper work
hence compromising accuracy and speed of ligand docking (Tame, 2005). Different scoring
functions can be used to satisfy the need for the research question at hand. Scoring functions rank
23
the protein-ligand complexes giving an indication of which protein-ligand conformation is
favourable. Depending on the research question one can make use of the ranking suitable for their
study. The highest ranked conformation should be the closest to the crystallographic structure with
lower root-mean-square deviation of atomic positions (RMSD). However, in some cases the
crystallographic structures are not available for comparison purposes (Alfarano, 2010).
2.9 Theoretical binding affinity
Molecular docking and scoring provide the most energy minimised protein-ligand complex
however, lack in binding affinity prediction. This is because molecular docking only provides
affinities based on single protein-ligand complex and does not account for protein flexibility
(Srivani et al., 2007). Trade off of speed and physical accuracy in docking makes it rarely accurate
to predict binding affinity. Therefore, molecular docking fitness requires to be replaced by
thermodynamic parameters which account for appropriate binding contributors. Binding energy
calculations are done using alternative scoring functions. Molecular docking is a pre-requisite for
all binding affinity predictions by providing starting structures to determine free energy of binding.
There are various post-processing methods used to estimate free energy of binding such as linear
interaction energy analysis, free-energy perturbation, thermodynamic integration molecular
mechanics Poisson−Boltzmann surface area (MM-PBSA) and the molecular mechanics
generalized Born surface area (MM-GBSA) (Srivastava and Sastry, 2012). MM-PBSA and MM-
GBSA are the commonly used functions due to lower demand in computational power. They
estimate free energy of binding from changes in configurational entropy, solvation free energy and
gas-phase energy upon protein-ligand complex formation. MM-PBSA and MM-GBSA also have
a robust sampling of physical and conformations of the ligand and protein. Hence, they take longer
to process and need more computational power compared to normal docking. MM-PBSA and
MM-GBSA protocols generates characteristic bound and unbound structures in explicit solvent
using molecular mechanics simulations or by energy minimisation of a protein-ligand complex.
The aim is to compare average enthalpy of bound and unbound states, thereby estimating the
change in binding enthalpy. Water is removed during the process and the binding free energies
and enthalpies are assessed using known (Poisson-Boltzmann or Generalized Born) representation
of water. Binding free energy estimate accounts for the change in solvation free energy and the
enthalpy change using the explicit solvent (Mobley and Dill, 2009). MM-GBSA is the preferred

24
method for estimating binding affinity than MM-PBSA in most cases, since it has been shown to
produce better affinity determination results (Hou et al., 2010).

25
CHAPTER III
MATERIALS AND METHODS
26
3.1 Materials
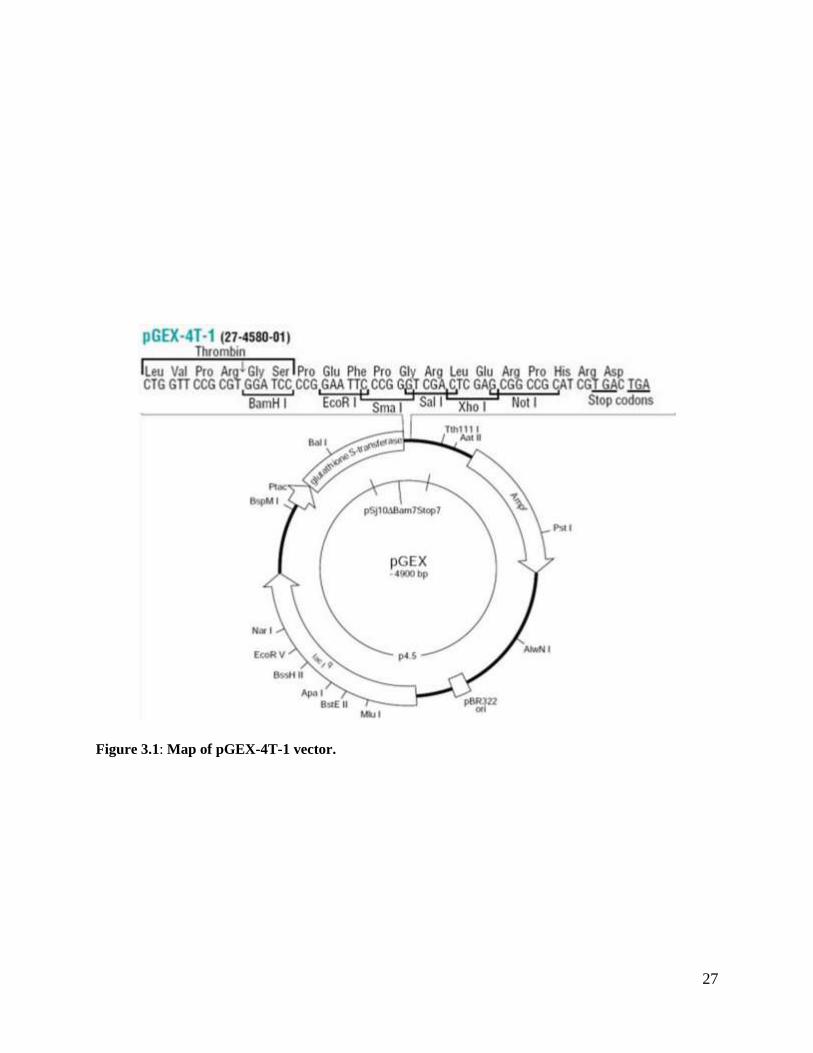
Glycerol stock of Escherichia coli T7 cells transformed pGEX-4T-1 (Figure 3.1) encoding SjGST
was a gift from Blessing Oyiogu. Yeast extract, tryptone, isopropyl thioglucopyranoside (IPTG),
ampicillin, imidazole, Tris, glycerol, β-mercaptoethanol, Tris, Tricine, Coomassie Brillant Blue
R-250, Urea, 8-Anilinonaphthalene-1-sulfonic acid (ANS), CB3GA, Na2HPO4,
(Ethylenedinitrilo)tetraacetic acid (ETDA), Dithiothreitol (DTT) and Sodium chloride (NaCl)
were supplied by Sigma Aldrich. Electrophoresis casting apparatus purchased from Bio-Rad.
Escherichia coli T7 competent cells were from (New England Biolabs)
3.2 Methods
3.2.1 Plasmid construct
Expression vector pGEX-4T-1 was not modified since it contains S.japonicum GST as a fusion
tag for protein expression. Crystal structure of native SjGST matches that of recombinant SjGST
from pGEX vectors (McTigue et al., 1995a). Recombinant SjGST from the vector contains a nine
residue peptide at its C-terminus. Expression of SjGST is under the control of an IPTG inducible
tac promoter. No background expression has been observed under the tac promoter which is a
hybrid of the lac and trp promoter (De Boer et al., 1983) and confers ampicillin resistance to cells
transformed with pGEX-4T-1.Vector plasmid map is shown in Figure 2.1.
3.2.2 Overexpression
Overnight culture was prepared by inoculating 10 µl of SjGST glycerol stock to 100 ml of 2×YT
media [1.6% (w/v) tryptone, 1% (w/v) yeast extracts and 0.5% (w/v) NaCl] supplemented with
100 μg/ml of ampicillin and 30 μg/ml chloramphenicol. The solution was incubated overnight at
37°C 230 rpm in Excella® E24 benchtop incubator shaker. Overnight cultures were diluted 1:50
with fresh 2×YT supplemented with ampicillin and chloramphenicol to a final concentration 30
μg/ml and 100 μg/ml respectively. The flasks were incubated at 37°C at 230 rpm in a shaker.
Growth of the cells was monitored by measuring optical density at 600 nm (OD600) using Jasco
V630 spectrophotometer. At OD600 of 0.5, the culture was incubated on ice for 15 min.
Overexpression of SjGST was induced by addition IPTG to a final concentration of 0.25 mM.
27
Figure 3.1: Map of pGEX-4T-1 vector.
28
The flasks were then incubated at 30°C at 230 rpm in a shaker for 6 h. These conditions were
advised by pGEX 4T-1 supplier (G.E. Healthcare, U.S.A.)
Bacterial cells were harvested by centrifugation at 5000×g for 30 min at 4°C. Supernatant was
discarded and the cells were re-suspended in resuspension buffer [50 mM Tris-HCl, 150 mM NaCl,
0.1µM phenylmethane sulfonyl fluoride, 0.4 mg/ml lysozyme, pH 7.4]. Pellet obtained from 500
ml of media was re-suspended in 10 ml of resuspension buffer and incubated at -80°C overnight
to facilitate cell lysis.
3.2.3 Soluble fraction harvesting
Cells where thawed at 37°C and thereafter cells were then incubated in ice for 1 hour to cool.
Sonication was used to lyse the cells at two-minute intervals on ice to avoid overheating. The
procedure was done until the cells attained water-like consistency. Based on the findings by
Blessing Oyiogu SjGST is soluble after overexpression. The soluble fraction was obtained by
centrifugation of lysate at 23000×g for 30 min at 4°C. The supernatant and pellet were separated
and reserved.
3.2.4 Purification: Glutathione-Agarose affinity chromatography
Affinity chromatography is a method used to separate biological mixtures on the basis of reversible
specific biological interactions. The technique uses covalently bound glutathione on solid
chromatographic support (agarose) to entrap proteins that can bind to glutathione. GSTs have high
affinity for glutathione hence bind to the matrix isolating GSTs from other proteins. GSTs have
higher affinity for free reduced GSH compared to immobilised GSH leading to the elution of GST-
GSH complex. Glycine at very low pH (2-3) or high pH (9-11) can be used to elute GSTs from
GSH-agarose column by disrupting hydrogen bonding, ionic and hydrophobic interactions
between immobilised GSH and GSTs. Conditions such as pH, temperature, buffer system and type
of GST can also affect the efficacy purification. Advantage of using affinity chromatography is
the reversibility of the binding of the binding partners hence this serves as an ideal method to
separate the protein of interest.
In this experiment a 20 ml GSH-agarose column was connected to the automated ÄKTAprime
chromatographic system combined to a computer with PrimeView 1.0 software (GE Healthcare,
Sweden) for purification. The column was equilibrated with 100 ml of equilibration buffer [50
29
mM Tris-HCl, 150 mM NaCl, 10% (v/v) glycerol, 0.02% (w/v) NaN3, pH 7.4]. The supernatant
collected from lysing cells was loaded in to the column (40 ml) and was allowed to flow through
the column at 2 ml/min. The flow through was collected and kept for analysis in case SjGST did
not bind to the column. The column was washed to remove any unbound proteins and weakly
bound proteins to avoid contamination of SjGST using 100 ml wash buffer [50 mM Tris-HCl,150
NaCl, 10% (v/v) glycerol, 0.02% (w/v) NaN3, pH 7.4]. A single step elution was done to elute
SjGST using 10 mM glycine-NaOH, pH 10. The elution was monitored at A280 and fractions with
A280 > 0.5 were pooled together. The pooled together fractions were immediately dialysed to
storage buffer dialysing the protein in storage buffer [20 mM Na2HPO4, 1 mM EDTA, 0.02%
sodium azide, pH 6.5] at 4°C. SDS-PAGE was used to assess purity and homogeneity of purified
SjGST.
3.2.5 Analysis of protein purity using SDS-PAGE
Sodium dodecyl sulfate polyacrylamide gel electrophoresis (SDS-PAGE) is an analytic procedure
that enables the separation of bio-molecules based on their molecular weight and their movement
in an electric field (Laemmli, 1970). The proteins move through the matrix proportional to
molecular weight because presence of SDS gives the molecules an overall negative charge. SDS
is an anionic detergent, when heated with protein sample it denatures the protein to elongated
conformation. The binding of SDS to protein is proportional to molecular weight with 1.4 g of
SDS binding to 1 g of protein. Further denaturation of protein samples is enhanced by the addition
of β-Mercaptoethanol, which breaks down disulfide bonds in the protein, hence attaining a more
elongated structure. In this experiment a tricine-SDS-PAGE developed by (Schägger, 2006),
which has a high resolving capacity compared to the glycine-SDS-PAGE (Laemmli, 1970) was
used to analyse the purity of the protein sample and estimate the molecular weight based upon the
molecular standards resolved alongside the protein samples.
The gel components were made as follows: Monomer solution [48 g of acrylamide and 1.5 g of
bisacrylamide in 100 ml of deionised water], Gel buffer (×3) [3 M Tris, 1 M Tricine, 0.3% SDS
(w/v)), anode buffer (×10) 1 M Tris, 0.225 M HCl, pH 8.9], cathode buffer (×10) [1 M Tris, 1 M
Tricine, 1% SDS (w/v)) and initiator reagent (10% (w/v) ammonium persulfate]. The reagents
were mixed as shown in Table 1:
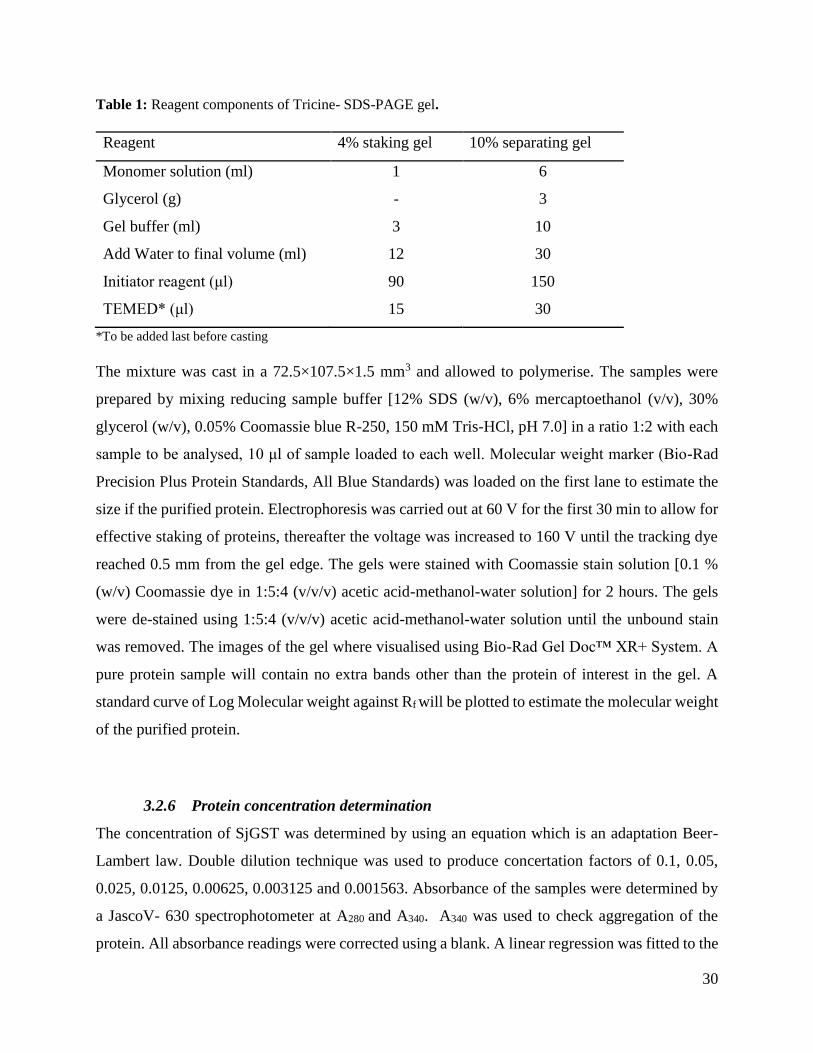
30
Table 1: Reagent components of Tricine- SDS-PAGE gel.
Reagent 4% staking gel 10% separating gel
Monomer solution (ml) 1 6
Glycerol (g) - 3
Gel buffer (ml) 3 10
Add Water to final volume (ml) 12 30
Initiator reagent (μl) 90 150
TEMED* (μl) 15 30
*To be added last before casting
The mixture was cast in a 72.5×107.5×1.5 mm3 and allowed to polymerise. The samples were
prepared by mixing reducing sample buffer [12% SDS (w/v), 6% mercaptoethanol (v/v), 30%
glycerol (w/v), 0.05% Coomassie blue R-250, 150 mM Tris-HCl, pH 7.0] in a ratio 1:2 with each
sample to be analysed, 10 μl of sample loaded to each well. Molecular weight marker (Bio-Rad
Precision Plus Protein Standards, All Blue Standards) was loaded on the first lane to estimate the
size if the purified protein. Electrophoresis was carried out at 60 V for the first 30 min to allow for
effective staking of proteins, thereafter the voltage was increased to 160 V until the tracking dye
reached 0.5 mm from the gel edge. The gels were stained with Coomassie stain solution [0.1 %
(w/v) Coomassie dye in 1:5:4 (v/v/v) acetic acid-methanol-water solution] for 2 hours. The gels
were de-stained using 1:5:4 (v/v/v) acetic acid-methanol-water solution until the unbound stain
was removed. The images of the gel where visualised using Bio-Rad Gel Doc™ XR+ System. A
pure protein sample will contain no extra bands other than the protein of interest in the gel. A
standard curve of Log Molecular weight against Rf will be plotted to estimate the molecular weight
of the purified protein.
3.2.6 Protein concentration determination
The concentration of SjGST was determined by using an equation which is an adaptation Beer-
Lambert law. Double dilution technique was used to produce concertation factors of 0.1, 0.05,
0.025, 0.0125, 0.00625, 0.003125 and 0.001563. Absorbance of the samples were determined by
a JascoV- 630 spectrophotometer at A280 and A340. A340 was used to check aggregation of the
protein. All absorbance readings were corrected using a blank. A linear regression was fitted to the
31
seven points for A280. The slope of the line was factored into the Equation (5) to determine protein
concentration below:
𝐶𝑜𝑛𝑐𝑒𝑡𝑟𝑎𝑡𝑖𝑜𝑛 =𝑀𝑜𝑙𝑒𝑐𝑢𝑙𝑎𝑟 𝑤𝑒𝑖𝑔ℎ𝑡 × 𝑠𝑙𝑜𝑝𝑒
Ɛ × 𝑝𝑎𝑡ℎ 𝑙𝑒𝑛𝑔ℎ𝑡 (𝑐𝑚)
(5)
were molar extinction coefficient (Ɛ) of 85720 M-1 cm-1determined using Protparam algorithm,
implemented in Expasy.org (Gasteiger et al., 2005) and path length used was 1 cm. All
measurements were done at 20°C.
3.2.7 Spectroscopic studies
CB3GAa triazine dye (Figure 3.2) an inhibitor of GSTs. All spectroscopic studies were done in
the absence of CB3GA. This is due to the fact that CB3GA interferes with resultant spectra in a
concentration dependent manner. The spectra alterations were observed at 10 nM CB3GA
concentration.
3.2.7.1 Far-UV circular dichroism
Secondary structure characterisation was done using Far-UV circular dichroism which measures
the difference in absorption of left and right circularly polarised light of chiral chromophores,
which are optically active or placed in solvents that are optically active. To obtain a CD spectrum,
dichroism is measured as a function of wavelength (Kelly and Price, 2000). Far-UV CD is
measured at a range 190 to 250 nm at this range, the peptide back bone is the principal
chromophore hence giving global secondary structure of the protein. There is a weak but broad
n→π* transition at 220 nm and a more intense π→π* transition around 190 nm. These give
characteristic far-UV CD spectra which is indicative of secondary structure composition of the
protein based on amide bond transitions (Kelly et al., 2005). A far-UV CD spectrum gives a trace
of the global secondary structure of a protein however it does not quantify α-helical, β-sheet and
random coil composition of the protein. Algorithms can be used to quantify secondary
32
Figure 3.2: Structure of CB3GA.
33
structural composition of a protein by using data obtained from Far-UV CD such as DICHROWEB
(Whitmore and Wallace, 2004). In this study Far-UV CD was used to determine secondary
structure profile of SjGST and the actual values of secondary structure composition were
determined using DICHROWEB algorithm.
Far-UV CD was done using Jasco J-1500 spectropolarimeter. Protein (native and denatured)
concentration used was 3 μM of in 20 mM Na2HPO4, 1 mM EDTA, 0.02 % (w/v) sodium azide, 2
mM DTT pH 7.4 and 8 M urea for the denatured protein sample at a range of 190 nm to 250 nm
in 0.2 mm quartz cuvette with 1 nm band width, 200 nm/min scan speed and the readings were an
average 5 accumulations. The temperature was kept constant at 20 °C using a Peltier temperature
control system. The percentage of α-helixes and β-sheets was determined using DICHROWEB
algorithm. The values to be used for the plot were corrected by subtracting Far-UV CD of the
buffer from the protein. Molar ellipticity per mean residue deg.cm2.dmol-1 was calculated by the
Equation (6):
[𝜃] =100 × 𝜃
𝐶𝑛𝑙
(6)
where θ is the measured ellipticity in millidegree, C is the protein concentration in mM, n is the
number of residues, and l is the path length (cm).
The spectra obtained using Equation (2) is to be submitted to DICHROWEB (Whitmore and
Wallace, 2004) server, CONTINLL algorithm implemented to estimate α-helices, β-strands, and
β-turns as a fraction of amino acid involved in the formation of each secondary structural
component with respect to the amino acids involved in the formation of unordered forms.
3.2.7.1 Intrinsic tryptophan fluorescence spectroscopy
Molecules absorb light this induces the passage of electrons from the single ground electronic level
S0 to an excited state Sn (n > 1). The molecule becomes unstable and should return to a ground
state, fluorescence is the emission which results from the lower orbital of paired electrons from an
excited singlet state (Lakowicz, 1999). Intrinsic fluorescence spectroscopy arises from the
aromatic amino acids tryptophan, tyrosine and phenylalanine. Tryptophan residues are commonly
used for most protein fluorescence studies. This is because tryptophan has a higher quantum yield
34
compared to tyrosine and phenylalanine. Most proteins have a limited number of tryptophan
residues therefore act as a better probe. The indoles ring of tryptophan is highly sensitive changes
in its micro-environment. This enables the detection of minute changes in the tertiary structure of
the protein (Lakowicz, 1999).
Analysis of intrinsic fluorescence was done by preparing 3 μM of protein (native and denatured)
in 20 mM Na2HPO4, 1 mM EDTA, 0.02% (w/v) sodium azide, 2 mM DTT pH 7.4 and 8 M urea
for the denatured protein sample using Jasco FP-6300 fluorescence spectrometer. Tryptophan was
selectively excited at 295 nm and emission was monitored at a range of 300-450 nm with scan
speed of 200 nm/min using a 1 mm quartz cuvette. Excitation and emission band width filters were
set at 5 nm and 2.5 nm respectively. All final readings were an average of three accumulations for
each sample. The values used for the plot were corrected by subtracting the fluorescence values of
the buffer.
3.2.7.2 Extrinsic ANS fluorescence spectroscopy
8-Anilino-1-naphthalene sulfonate (ANS) (Fig 3.3) is an amphiphilic dye that is used to monitor
surface hydrophobicity by binding to hydrophobic surfaces of protein. Upon binding a blue shift
in the emission maximum wavelength and an increase of quantum yield is observed when
compared to free ANS (Matulis and Lovrien, 1998). Mechanisms of ANS binding to protein is via
non-covalent interactions, such as ion pairing between positively charged amino acids (arginine,
lysine, histidine) and negatively charged sulfonate group of ANS (Hawe et al., 2008). ANS
samples were prepared by dissolving 1g of ANS in 2 ml of 20 mM Na2HPO4, 1 mM EDTA, 0.02%
(w/v) sodium azide, 2 mM DTT pH 7.4, due to the hydrophobic nature of ANS it was allowed to
dissolve in the buffer for 2 hours in a rotator covered with foil, to avoid reaction with light. The
concentration of ANS was determined by Beer-Lambert law at 350 nm wavelength using molar
extinction coefficient of 5000 M-1.cm-1 (Hawe et al., 2008). The samples for ANS fluorescence
studies were prepared by incubating 3 μM of protein with 100 μM of ANS in 20 mM Na2HPO4, 1
mM EDTA, 0.02 % (w/v) sodium azide, 2 mM DTT pH 7.4 for 30 min in the dark. Readings of
free ANS were obtained using Jasco FP-6300 fluorescence spectrophotometer.
35
Figure 3.3: Structure of ANS
36
ANS was excited at 390 nm and emission was monitored at a range of 380-600 nm with scan speed
of 200 nm/min using a quartz cuvette with 1 cm path length. Excitation and emission band width
filters were set at 5 nm. All final readings were an average of three accumulations for each sample.
The values used for the plot were corrected by subtracting the values of the buffer.
3.2.8 Size exclusion high performance liquid chromatography
Size exclusion high performance liquid chromatography (SE-HPLC) is a technique that separates
proteins based on hydrodynamic volume (size), diffusion coefficient and surface properties. The
separation is hugely reliant on the inert particles packed into the column. The column matrix has
an exclusion limit were molecules with size above the limit will be excluded from the matrix and
elute first. However smaller molecules will with in the matrix taking longer time to elute. Hence
this is the basis of size exclusion chromatography.
Quaternary structure of SjGST was characterised using SE-HPLC using Phenomenex Gel
Filtration /Size Exclusion silica column, Yarra 3u SEC-2000 with Phenomenex SecurityGuard
ULTRA guard column. The apparatus was connected to a Shimadzu Prominence HPLC system
(SPD20A). The column was equilibrated with filtered and degassed 20 mM Na2HPO4, 200 mM
NaCl, 1 mM EDTA, 0.02% sodium azide, pH 7.4, flow rate of the system was kept constant at
0.25 ml/min for 30 minutes these conditions were kept for all samples for consistency. Calibration
of the column was done by loading Bio-Rad Gel Filtration standards which contain Bovine
thyroglobulin (670 kDa), γ-globulin (154 kDa), Ovalbumin (44 kDa), Myoglobulin (17 kDa),
Vitamin B12 (1.35 kDa) which were used to plot the standard curve to determine size of the
unknown sample. Standards were run each time when the buffer system was changed to account
for changes in the system. Analysis of SjGST was done by injecting 20 µl sample of 10 µM SjGST
in 20 mM Na2HPO4, 200 mM NaCl, 1 mM EDTA, 2 mM DTT, 0.02% sodium azide, pH 7.4.
Examination of the effect of oxidation on the structure of SjGST was done in the absence of DTT.
A 20 µl sample of 10 µM SjGST in 20 mM Na2HPO4, 200 mM NaCl, 1 mM EDTA, 0.02% sodium
azide, pH 7.4 was loaded into the column pre-equilibrated with the same buffer. The effect of
CB3GA was done by pre-incubating 10 µM of SjGST in 1 mM CB3GAfor 1 hour and loaded in
37
column pre-equlibrated with 20 mM Na2HPO4, 200 mM NaCl, 1 mM EDTA, 2 mM DTT, 0.02%
sodium azide, 1 mM CB3GA, pH 7.4.
3.2.9 SjGST activity assay
GSH-CDNB conjugation assay was used to determine the specific activity of SjGST according to
Habig et al. (1974). GSTs catalyse conjugation of 1-chloro-2,4-dinitrobenzene (CDNB) to GSH
forming chromophoric product 1-(S-glutathionyl)-2,4- dinitrobenzene. SjGST activity was
monitored at 340 nm by measuring the formation of 1-(S-glutathionyl)-2,4-dinitrobenzene with
extinction co-efficient of 9600 M-1cm-1 using Jasco V- 630 spectrophotometer. The reaction
pathway is shown in Figure 3.4. The assay was carried out in 20 mM Na2HPO4, 1 mM EDTA,
0.02% (w/v) sodium azide, 2 mM DTT pH 7.4 buffer and recorded at 20°C. The assay had a final
concentration of 1 mM GSH and 1 mM CDNB in 3% (v/v) ethanol. SjGST concentration was
varied between 0 nm to 50 nm. All reactions were followed as linear progress curves for 60
seconds. All reactions were corrected for by subtracting the non-enzymatic control data from final
obtained data. Specific activity (μmol.min-1.mg-1) was determined using a linear regression slope
between initial velocity of complex formation(1-(S-glutathionyl)-2,4-dinitrobenzene)
(μmol.min-1) versus protein amount (mg).
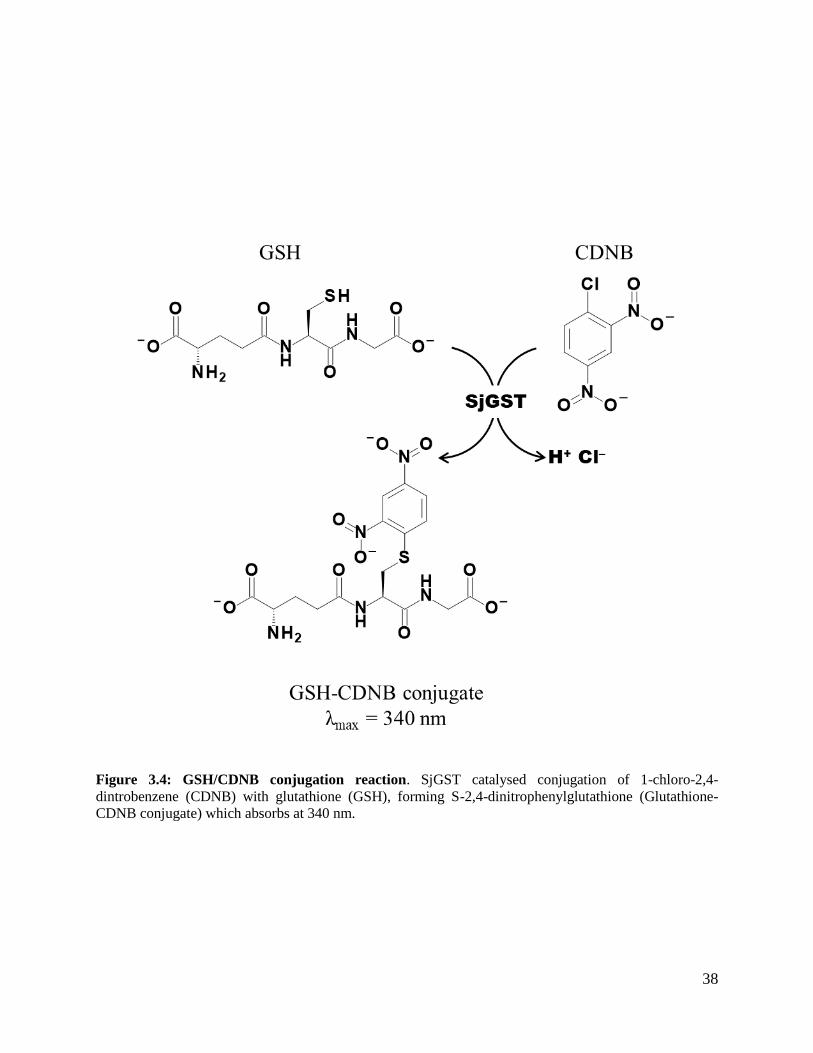
38
Figure 3.4: GSH/CDNB conjugation reaction. SjGST catalysed conjugation of 1-chloro-2,4-
dintrobenzene (CDNB) with glutathione (GSH), forming S-2,4-dinitrophenylglutathione (Glutathione-
CDNB conjugate) which absorbs at 340 nm.
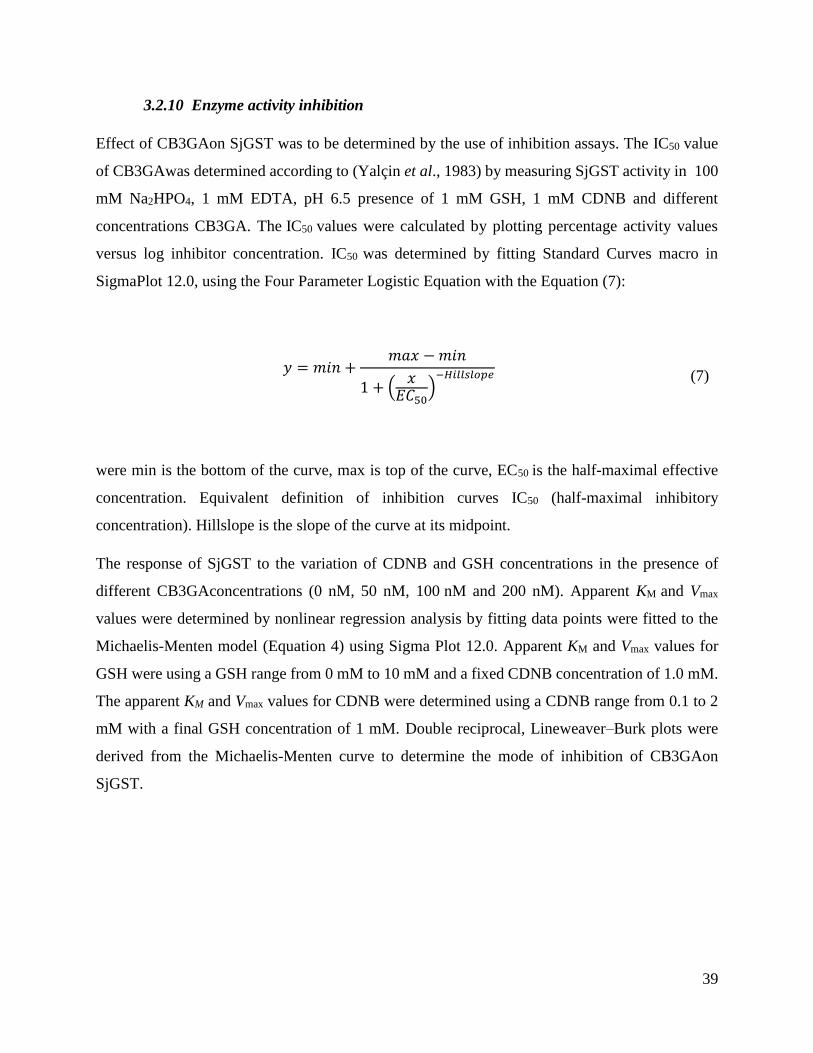
39
3.2.10 Enzyme activity inhibition
Effect of CB3GAon SjGST was to be determined by the use of inhibition assays. The IC50 value
of CB3GAwas determined according to (Yalçin et al., 1983) by measuring SjGST activity in 100
mM Na2HPO4, 1 mM EDTA, pH 6.5 presence of 1 mM GSH, 1 mM CDNB and different
concentrations CB3GA. The IC50 values were calculated by plotting percentage activity values
versus log inhibitor concentration. IC50 was determined by fitting Standard Curves macro in
SigmaPlot 12.0, using the Four Parameter Logistic Equation with the Equation (7):
𝑦 = 𝑚𝑖𝑛 +𝑚𝑎𝑥 − 𝑚𝑖𝑛
1 + (𝑥
𝐸𝐶50)
−𝐻𝑖𝑙𝑙𝑠𝑙𝑜𝑝𝑒
(7)
were min is the bottom of the curve, max is top of the curve, EC50 is the half-maximal effective
concentration. Equivalent definition of inhibition curves IC50 (half-maximal inhibitory
concentration). Hillslope is the slope of the curve at its midpoint.
The response of SjGST to the variation of CDNB and GSH concentrations in the presence of
different CB3GAconcentrations (0 nM, 50 nM, 100 nM and 200 nM). Apparent KM and Vmax
values were determined by nonlinear regression analysis by fitting data points were fitted to the
Michaelis-Menten model (Equation 4) using Sigma Plot 12.0. Apparent KM and Vmax values for
GSH were using a GSH range from 0 mM to 10 mM and a fixed CDNB concentration of 1.0 mM.
The apparent KM and Vmax values for CDNB were determined using a CDNB range from 0.1 to 2
mM with a final GSH concentration of 1 mM. Double reciprocal, Lineweaver–Burk plots were
derived from the Michaelis-Menten curve to determine the mode of inhibition of CB3GAon
SjGST.
40
3.2.11 Docking studies
Molecular docking methods are routinely used for theoretical prediction of protein–ligand
interactions. Work done by Sastry et al. (2013) served as guideline for the docking studies. In this
study a single step protocol for the preparation of ligand (CB3GA) and protein (SjGST). Docking
was carried out using Induced fit docking protocol, which accounts for both receptor and ligand
flexibility.
3.2.11.1 Force field calculations
Computational force field calculations were performed using Schrödinger Maestro 11.2 software.
The calculations were carried out based on the force field OPLS (optimised potentials for liquid
simulations). The structure of the SjGST was kept rigid while CB3GA was flexible during the
calculation. The resulting structures were obtained from the result of 1000 calculation cycles.
3.2.11.2 Protein preparation
The structure of SjGST was obtained from Protein Data Bank (PDB: 1DUG). The role of protein
preparation in molecular docking serves as a procedure to correct structures of proteins before
initial docking experiments. It is a prerequisite for all computational work to correct crystal
structures by adding missing hydrogens, remove ambiguous protonation states and include missing
side chains and loops. Schrodinger-Maestro 11.2, Protein Preparation Wizard (PrepWizard) was
used for preparation of SjGST (PDB: 1DUG). Protein preparation involved hydrogen bond
optimisation using ProtAssign which involved assessment terminal Asn, Gly and His which are
sampled to analyse 180° flips. Hydroxyl hydrogens, thiol hydrogens and protonated or neutral
states of His, Glu, Asp and two His tautomeric forms contribute to the hydrogen bond network.
An exhaustive mode protocol was used for hydrogen bond optimisation. The following step
involved protein minimisation using Impref module of Impact and OPLS-2005 force field. All
water molecules are removed from the structure. For validation of the docking results human Pi-
GST (PDB: 5DCG) was used and was prepared the same way as SjGST.
41
3.2.11.3 Ligand preparation
Energy minimization CB3GA structure was performed using the OPLS-2005 force field. The
Ligprep (LigPrep, 2009) module was used to prepare CB3GA using default parameters in
Schrödinger software, Maestro 11.2.
3.2.11.4 Induced fit docking
Induced Fit (IFD) protocol Schrodinger-Maestro 11.2 (Sherman et al., 2006) was done for docking
CB3GA onto SjGST. The IFD protocol, complex factor in docking studies which predicts accurate
ligand-binding modes and associated structural movements in the protein using a flexible ligand.
CB3GA was docked into rigid SjGST using soften potential docking which reduces steric clashes.
In most protein structures, some side chains assume unfavourable rotameric states which hamper
ligand binding. Glide was used to generate a docking grid file of the active centres of the SjGST
to get detailed information about possible binding motifs using default parameters using OPLS
2005 force field. Calculations were run on HTVS mode (High-Throughput Virtual Screening)
using default settings, flow chat (Figure 3.5). Glide XP (Friesner et al., 2004) was used for all the
docking calculations. Emodel, a composite energy scoring function of Glide XP Score was used
for this study. It combines ligand-receptor molecular mechanics and ligand strain energy to select
a correctly docked ligand. Emodel has a more significant weighing force field component such as
Van der Waals, Coulombic interactions, strain energy of the ligand and electrostatic energies. It is
a better measure of the analysis of different ligand binding conformations, if one ligand is used.
RMSD value to was used validate the docking protocol by analysing the conformational similarity
of the docked structure and solved crystal structure. The higher the value of RMSD the lower the
conformational similarity. This was done by repeating the IFD protocol used, to dock GSH into
1DUG and comparing the GSH conformation with a solved crystal structure of SjGST-GSH
complex (PDB: 1UA5) (Kursula et al., 2005).
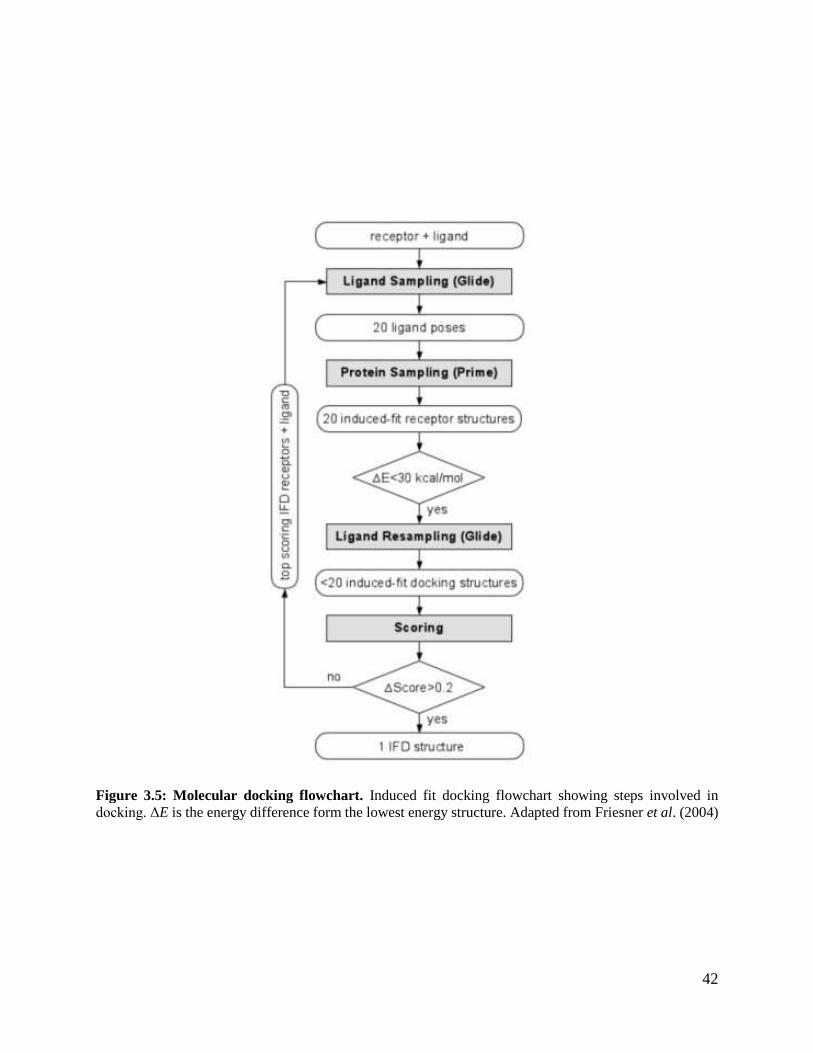
42
Figure 3.5: Molecular docking flowchart. Induced fit docking flowchart showing steps involved in
docking. ΔE is the energy difference form the lowest energy structure. Adapted from Friesner et al. (2004)
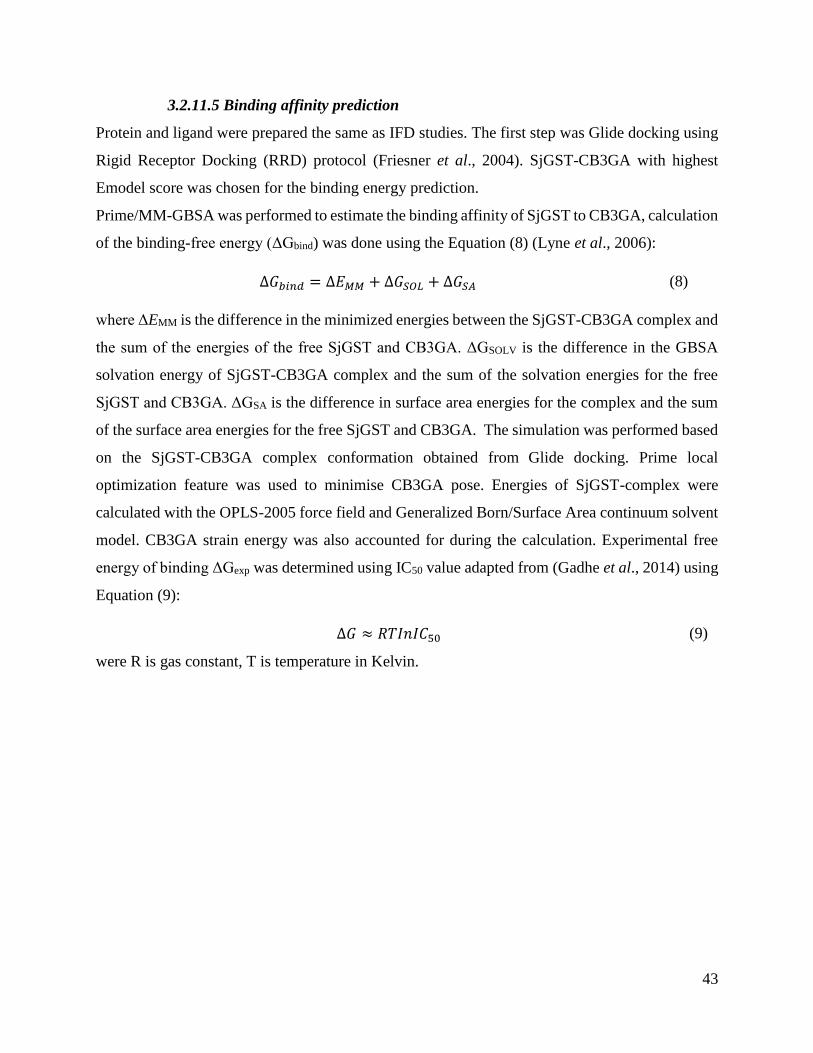
43
3.2.11.5 Binding affinity prediction
Protein and ligand were prepared the same as IFD studies. The first step was Glide docking using
Rigid Receptor Docking (RRD) protocol (Friesner et al., 2004). SjGST-CB3GA with highest
Emodel score was chosen for the binding energy prediction.
Prime/MM-GBSA was performed to estimate the binding affinity of SjGST to CB3GA, calculation
of the binding-free energy (ΔGbind) was done using the Equation (8) (Lyne et al., 2006):
∆𝐺𝑏𝑖𝑛𝑑 = ∆𝐸𝑀𝑀 + ∆𝐺𝑆𝑂𝐿 + ∆𝐺𝑆𝐴 (8)
where ΔEMM is the difference in the minimized energies between the SjGST-CB3GA complex and
the sum of the energies of the free SjGST and CB3GA. ΔGSOLV is the difference in the GBSA
solvation energy of SjGST-CB3GA complex and the sum of the solvation energies for the free
SjGST and CB3GA. ΔGSA is the difference in surface area energies for the complex and the sum
of the surface area energies for the free SjGST and CB3GA. The simulation was performed based
on the SjGST-CB3GA complex conformation obtained from Glide docking. Prime local
optimization feature was used to minimise CB3GA pose. Energies of SjGST-complex were
calculated with the OPLS-2005 force field and Generalized Born/Surface Area continuum solvent
model. CB3GA strain energy was also accounted for during the calculation. Experimental free
energy of binding ΔGexp was determined using IC50 value adapted from (Gadhe et al., 2014) using
Equation (9):
∆𝐺 ≈ 𝑅𝑇𝐼𝑛𝐼𝐶50 (9)
were R is gas constant, T is temperature in Kelvin.

44
CHAPTER IV
RESULTS
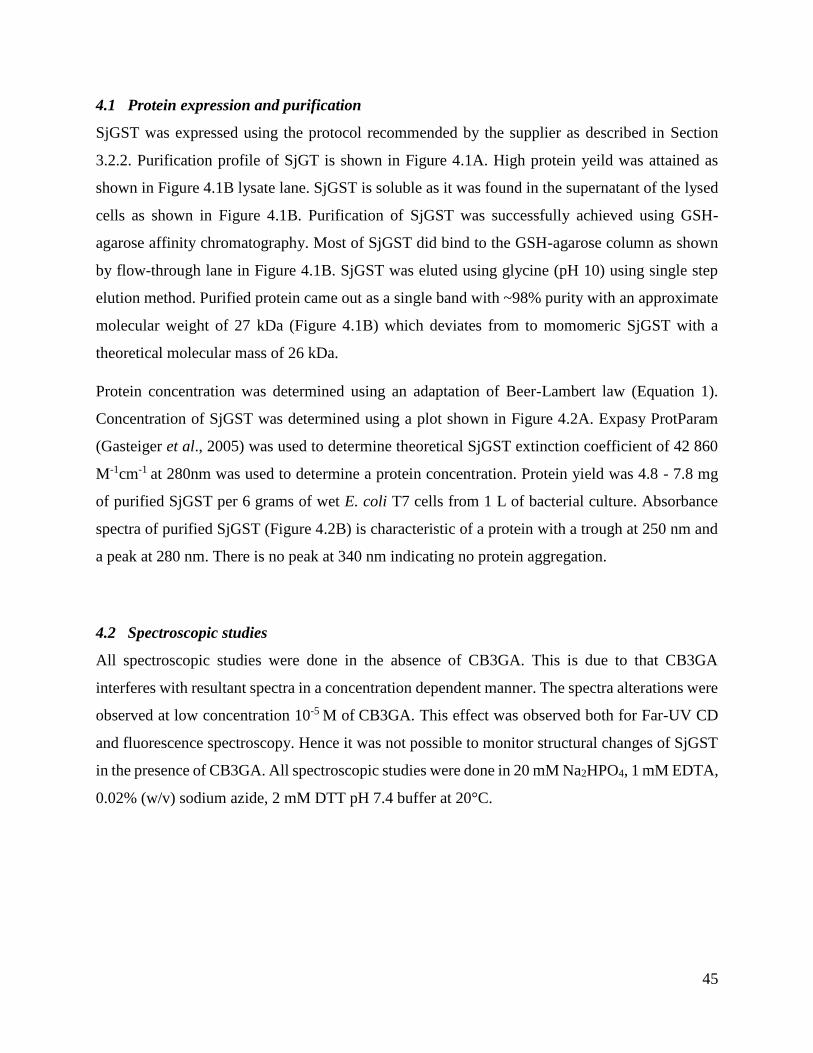
45
4.1 Protein expression and purification
SjGST was expressed using the protocol recommended by the supplier as described in Section
3.2.2. Purification profile of SjGT is shown in Figure 4.1A. High protein yeild was attained as
shown in Figure 4.1B lysate lane. SjGST is soluble as it was found in the supernatant of the lysed
cells as shown in Figure 4.1B. Purification of SjGST was successfully achieved using GSH-
agarose affinity chromatography. Most of SjGST did bind to the GSH-agarose column as shown
by flow-through lane in Figure 4.1B. SjGST was eluted using glycine (pH 10) using single step
elution method. Purified protein came out as a single band with ~98% purity with an approximate
molecular weight of 27 kDa (Figure 4.1B) which deviates from to momomeric SjGST with a
theoretical molecular mass of 26 kDa.
Protein concentration was determined using an adaptation of Beer-Lambert law (Equation 1).
Concentration of SjGST was determined using a plot shown in Figure 4.2A. Expasy ProtParam
(Gasteiger et al., 2005) was used to determine theoretical SjGST extinction coefficient of 42 860
M-1cm-1 at 280nm was used to determine a protein concentration. Protein yield was 4.8 - 7.8 mg
of purified SjGST per 6 grams of wet E. coli T7 cells from 1 L of bacterial culture. Absorbance
spectra of purified SjGST (Figure 4.2B) is characteristic of a protein with a trough at 250 nm and
a peak at 280 nm. There is no peak at 340 nm indicating no protein aggregation.
4.2 Spectroscopic studies
All spectroscopic studies were done in the absence of CB3GA. This is due to that CB3GA
interferes with resultant spectra in a concentration dependent manner. The spectra alterations were
observed at low concentration 10-5 M of CB3GA. This effect was observed both for Far-UV CD
and fluorescence spectroscopy. Hence it was not possible to monitor structural changes of SjGST
in the presence of CB3GA. All spectroscopic studies were done in 20 mM Na2HPO4, 1 mM EDTA,
0.02% (w/v) sodium azide, 2 mM DTT pH 7.4 buffer at 20°C.
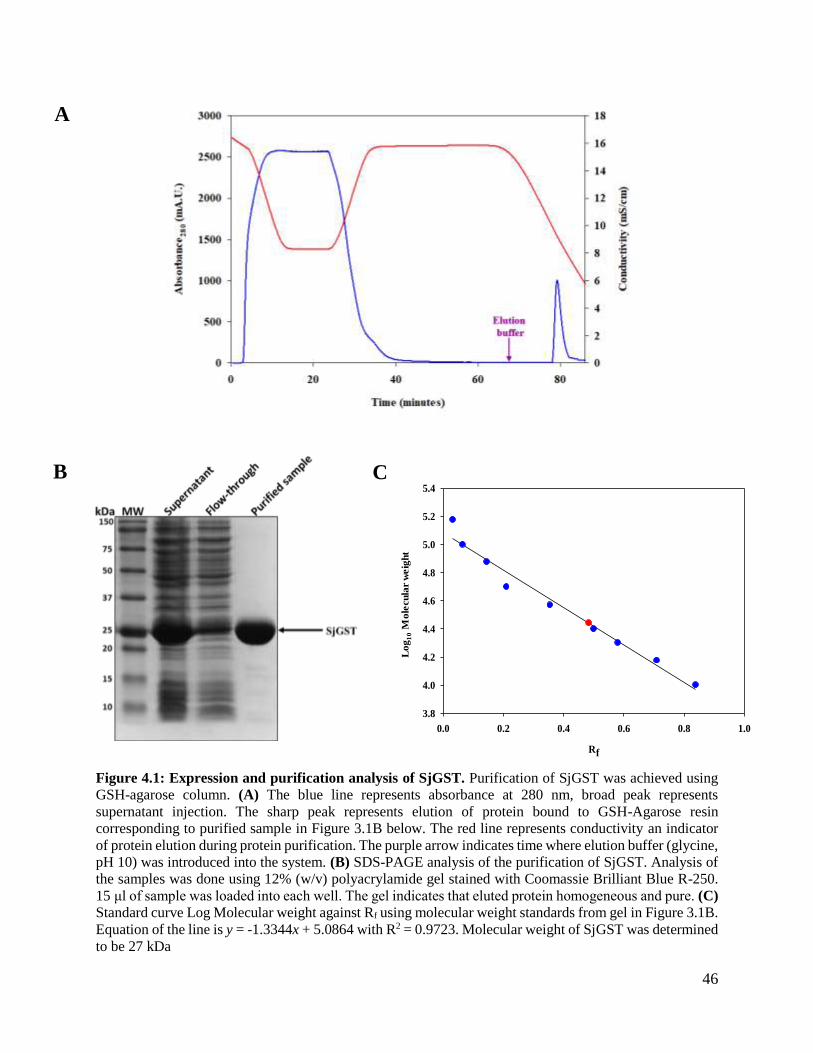
46
Rf
0.0 0.2 0.4 0.6 0.8 1.0
Lo
g1
0 M
ole
cula
r w
eig
ht
3.8
4.0
4.2
4.4
4.6
4.8
5.0
5.2
5.4
Figure 4.1: Expression and purification analysis of SjGST. Purification of SjGST was achieved using
GSH-agarose column. (A) The blue line represents absorbance at 280 nm, broad peak represents
supernatant injection. The sharp peak represents elution of protein bound to GSH-Agarose resin
corresponding to purified sample in Figure 3.1B below. The red line represents conductivity an indicator
of protein elution during protein purification. The purple arrow indicates time where elution buffer (glycine,
pH 10) was introduced into the system. (B) SDS-PAGE analysis of the purification of SjGST. Analysis of
the samples was done using 12% (w/v) polyacrylamide gel stained with Coomassie Brilliant Blue R-250.
15 μl of sample was loaded into each well. The gel indicates that eluted protein homogeneous and pure. (C)
Standard curve Log Molecular weight against Rf using molecular weight standards from gel in Figure 3.1B.
Equation of the line is y = -1.3344x + 5.0864 with R2 = 0.9723. Molecular weight of SjGST was determined
to be 27 kDa
A
B C
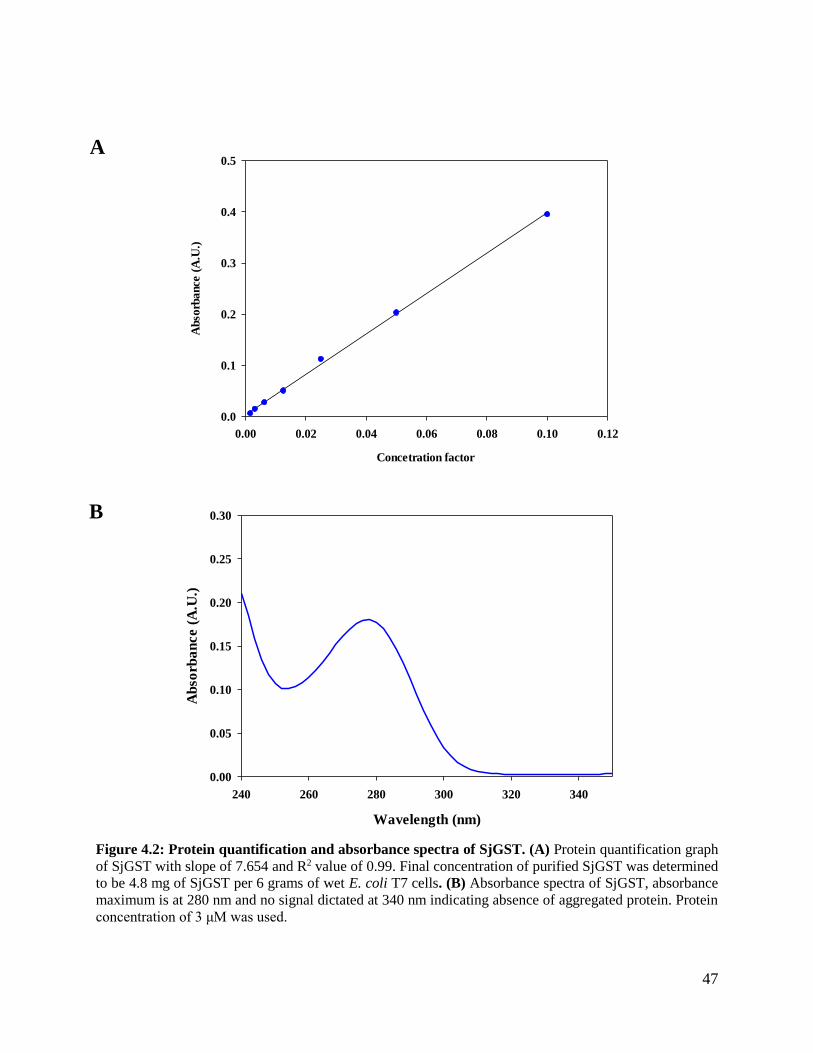
47
Concetration factor
0.00 0.02 0.04 0.06 0.08 0.10 0.12
Abso
rba
nce
(A
.U.)
0.0
0.1
0.2
0.3
0.4
0.5
Wavelength (nm)
240 260 280 300 320 340
Ab
sorb
an
ce (
A.U
.)
0.00
0.05
0.10
0.15
0.20
0.25
0.30
Figure 4.2: Protein quantification and absorbance spectra of SjGST. (A) Protein quantification graph
of SjGST with slope of 7.654 and R2 value of 0.99. Final concentration of purified SjGST was determined
to be 4.8 mg of SjGST per 6 grams of wet E. coli T7 cells. (B) Absorbance spectra of SjGST, absorbance
maximum is at 280 nm and no signal dictated at 340 nm indicating absence of aggregated protein. Protein
concentration of 3 μM was used.
B
A
48
4.2.1 Far-UV CD
Far-UV CD was used to monitor the secondary structure of SjGST between 250 nm and 190 nm.
The spectra were plotted as mean residue ellipticity versus wavelength as shown in Figure 4.3. The
spectra exhibited troughs at 208 nm and 222 nm and a peak at 193 nm. This is indicative of proteins
with high helical content. SjGST lost all secondary structure arrangement in the presence of 8 M
urea as shown in Figure 4.3. This is shown by the loss of indicative signals of secondary structure
as in the native state of SjGST. The structural analysis using DICHROWEB indicated that SjGST
is predominantly alpha helical (98%) see Table 2.
4.2.2 Tryptophan fluorescence spectroscopy
Tertiary structure of SjGST was investigated using fluorescence spectroscopy. The technique
servers as an intrinsic probe on the micro-environment around tryptophan residues. SjGST has
four tryptophan residues on each subunit therefore they are adequate to give a high quantum yield
upon selective excitation at 295 nm. Fluorescence emission maximum of SjGST is ~ 340 nm,
indicating partial exposure to solvent (Figure 4.4). The spectrum displays a shoulder at the peak.
In the presence of 8M urea, fluorescent properties of tryptophan were lost with a flat spectrum
being observed (Figure 4.4).
4.2.3 Extrinsic ANS fluorescence
ANS is an anionic dye that is generally used an extrinsic probe for detection of ordered
hydrophobic regions in protein. Unbound ANS displays reduced quantum yield in an aqueous
environment, upon binding to a hydrophobic patch on a protein ANS displays increased quantum
yield coupled with a blueshift. In Figure 4.5 in the presence of SjGST an increased quantum yield
and a blueshift from 519 nm to 498 nm is observed indicating a solvent accessible hydrophobic
patch on the surface of SjGST.
49
Figure 4.3: Far-UV CD spectra of SjGST. Spectra of native (blue line) and denatured using 8 M urea
(red dotted line). Protein concentration for both experiments is 3 μM in 20 mM Na2HPO4, 1 mM EDTA,
0.02% (w/v) sodium azide, 2 mM DTT pH 7.4 buffer and recorded at 20°C. The plot is the average of three
buffer corrected experiments.
Table 2: DICHROWEB analysis to determine secondary structural composition of SjGST.
Helix1 Helix2 Strand1 Strand2 Turns Unordered Total
SjGST 0.457 0.518 0 0.025 0 0 1
Wavelength (nm)
190 200 210 220 230 240 250
md
eg
.cm
2.d
mo
l-1)
-30000
-20000
-10000
0
10000
20000
30000
50
Wavelength (nm)
300 320 340 360 380 400 420 440
Corr
ect
ed F
luore
scence
(A
.U.)
0
50
100
150
200
Figure 4.4: Intrinsic tryptophan fluorescence spectra of SjGST. Tertiary structure of SjGST is based
on the micro-environment of tryptophan in native protein (blue line) and denatured protein (red dotted line)
using 8 M urea. Protein concentration for both experiments is 3 μM in 20 mM Na2HPO4, 1 mM EDTA,
0.02% (w/v) sodium azide, 2 mM DTT pH 7.4 buffer and recorded at 20°C. Tryptophan was excited at 295
nm. The plot is the average of three buffer-corrected experiments.
51
Wavelenght (nm)
400 450 500 550 600 650
Corr
ect
ed F
luore
scence
(A
.U.)
0
2
4
6
8
10
12
14
16
18
Figure 4.5: Extrinsic ANS fluorescence spectra of SjGST. The emission spectrum of ANS fluorescence
(excitation at 390 nm) was measured with pre-incubation of 3 μM SjGST with 100 μM ANS in 20 mM
Na2HPO4, 1 mM EDTA, 0.02% (w/v) sodium azide, 2 mM DTT pH 7.4 buffer and recorded at 20°C. SjGST
bound to ANS (blue line) and control free ANS (red dashed line). ANS was excited at 390 nm. Blueshift
emission with increased quantum yield from 519 nm to 498 nm. The plot is the average of three buffer-
corrected experiments.
52
4.3 Size exclusion high performance liquid chromatography SE-HPLC
Size exclusion high performance liquid chromatography (SE-HPLC) was used to assess the
oligomeric and hydrodynamic volume of SjGST. The experiment was carried out in 20 mM
Na2HPO4, 1 mM EDTA, 0.02% (w/v) sodium azide, 2 mM DTT pH 7.4 buffer and recorded at
20°C. Gel filtration standards were used for the calibration of the column. A standard curve of Log
of molecular weight against retention time was plotted as shown in Figure 4.6A. The standard
curve was then used to determine the molecular weight of SjGST. The elution profile of SjGST
indicated that the apparent molecular weight of SjGST is 55 kDa corresponding to the dimeric and
functional form of the protein (Figure 4.6B). However, it is larger than the theoretical molecular
weight of 52 kDa determined using Expasy ProtParam (Gasteiger et al., 2005). In the presence of
saturating concentration of 1mM of CB3GA, quaternary structure SjGST was not altered as shown
in Figure 4.6B, since it has the same retention time as apo-SjGST. In the absence of a reducing
agent DTT, SjGST undergoes oxidative aggregation due to the presence of three exposed cysteine
residues per monomer. These form intermolecular disulfide bond to form higher order oligomeric
larger than 430 kDa as shown in Figure 4.6B. SE-HPLC elution profile in Figure 4.6B shows that
all protein used in this study was homogenous and pure because SjGST eluted as a single peak
with no artefacts observed.
4.4 Enzyme activity assay
GSH CDNB-conjugation assay (Habig and Jakoby, 1981) was used to determine the enzyme
activity of SjGST. Figure 4.7B shows the specific activity of SjGST in the presence and absence
of CB3GA. Activity of the enzyme is monitored spectrophotometrically at 340 nm on the basis of
the extinction coefficient for the product 1-(S-dinitrophenyl)-2,4-dinitrobenzene (ε340nm = 9.6 mM-
1cm-1). SjGST specific activity (µmol.min-1.mg-1) was obtained using the slope of a linear fit of
activity (µmol.min-1) plotted obtained through experimental data against amount of protein (mg)
used. The assay was carried out in 100 mM Na2HPO4, 1 mM EDTA, pH 6.5 at 20°C with final
concentration of 1 mM CDNB and 1 mM GSH. The details on obtaining specific activity is fully
described in the Appendix.
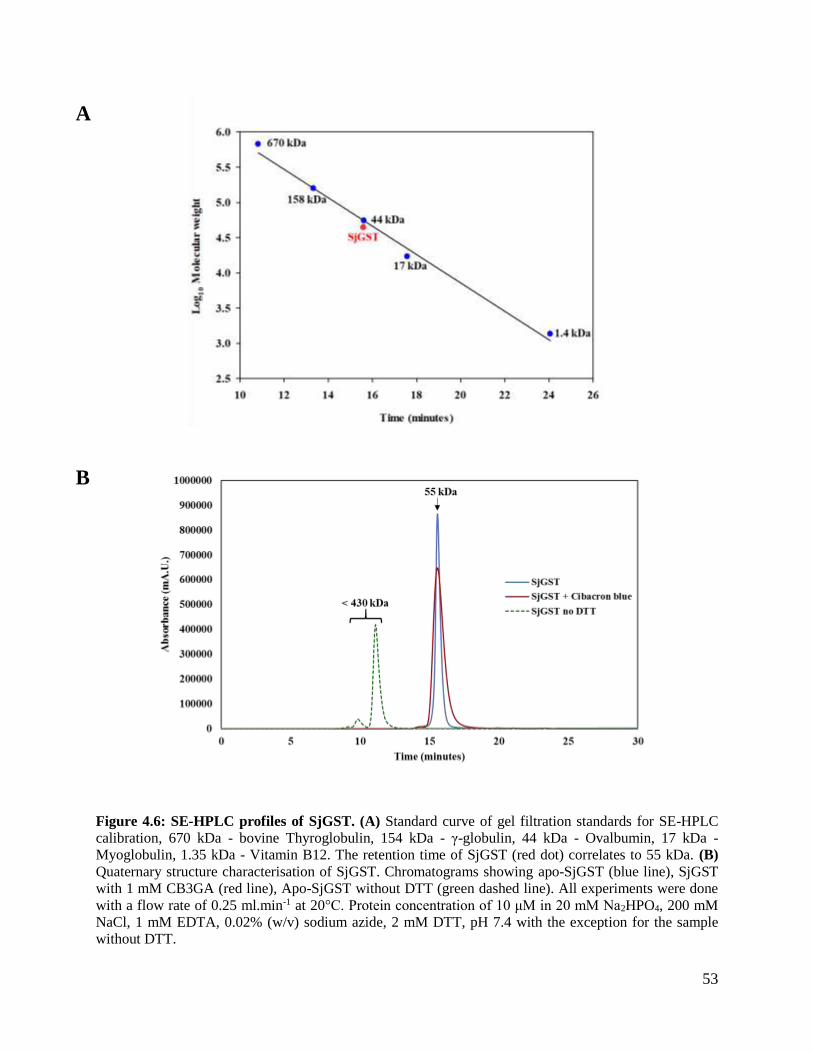
53
Figure 4.6: SE-HPLC profiles of SjGST. (A) Standard curve of gel filtration standards for SE-HPLC
calibration, 670 kDa - bovine Thyroglobulin, 154 kDa - γ-globulin, 44 kDa - Ovalbumin, 17 kDa -
Myoglobulin, 1.35 kDa - Vitamin B12. The retention time of SjGST (red dot) correlates to 55 kDa. (B)
Quaternary structure characterisation of SjGST. Chromatograms showing apo-SjGST (blue line), SjGST
with 1 mM CB3GA (red line), Apo-SjGST without DTT (green dashed line). All experiments were done
with a flow rate of 0.25 ml.min-1 at 20°C. Protein concentration of 10 μM in 20 mM Na2HPO4, 200 mM
NaCl, 1 mM EDTA, 0.02% (w/v) sodium azide, 2 mM DTT, pH 7.4 with the exception for the sample
without DTT.
A
B
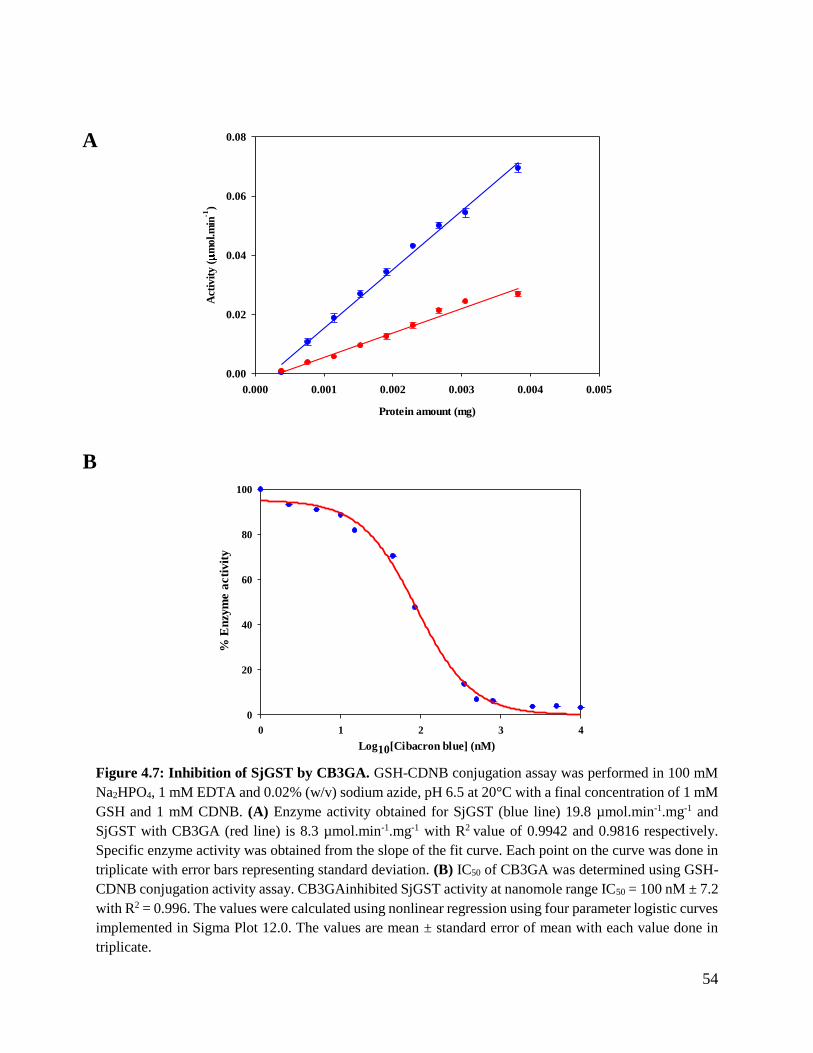
54
Log10[Cibacron blue] (nM)
0 1 2 3 4
% E
nzy
me a
cti
vit
y
0
20
40
60
80
100
Figure 4.7: Inhibition of SjGST by CB3GA. GSH-CDNB conjugation assay was performed in 100 mM
Na2HPO4, 1 mM EDTA and 0.02% (w/v) sodium azide, pH 6.5 at 20°C with a final concentration of 1 mM
GSH and 1 mM CDNB. (A) Enzyme activity obtained for SjGST (blue line) 19.8 µmol.min-1.mg-1 and
SjGST with CB3GA (red line) is 8.3 µmol.min-1.mg-1 with R2 value of 0.9942 and 0.9816 respectively.
Specific enzyme activity was obtained from the slope of the fit curve. Each point on the curve was done in
triplicate with error bars representing standard deviation. (B) IC50 of CB3GA was determined using GSH-
CDNB conjugation activity assay. CB3GAinhibited SjGST activity at nanomole range IC50 = 100 nM ± 7.2
with R2 = 0.996. The values were calculated using nonlinear regression using four parameter logistic curves
implemented in Sigma Plot 12.0. The values are mean ± standard error of mean with each value done in
triplicate.
Protein amount (mg)
0.000 0.001 0.002 0.003 0.004 0.005
Act
ivit
y (
mol.m
in-1
)
0.00
0.02
0.04
0.06
0.08A
B
55
CB3GA is a known inhibitor of GSTs, however studies with SjGST are not available. The study
assumed that that CB3GA does inhibit SjGST. The IC50 curve was constructed using GSH-CDNB
conjugation to determine the amount of CB3GA needed to inhibit SjGST activity by 50% (Figure
4.7A). IC50 of CB3GA value was determined to be 100 nM. IC50 value determined (100 nM) from
the curve was used to monitor the effect of CB3GA on the specific activity of SjGST as shown in
Figure 4.7B. Specific activity values obtained for SjGST (19.8 µmol.min-1.mg-1) and SjGST with
CB3GA (8.3 µmol.min-1.mg-1). CB3GA showed 50 % inhibition effect on SjGST.
4.5 Enzyme activity inhibition
Effect of CB3GA on the activity of SjGST was further analysed by the use of steady state kinetics
to determine the mode of inhibition of CB3GA. GSH-CDNB conjugation assay was used for all
kinetic studies in 100 mM Na2HPO4, 1 mM EDTA and 0.02% (w/v) sodium azide, pH 6.5 at 20°C.
Enzyme activity was measured at different substrate concentration with fixed SjGST concentration
for different CB3GAconcentrations. SjGST followed Michaelis-Menten kinetics in both cases
when GSH and CDNB were used as substrates as shown in Figure 4.8A and Figure 4.8B
respectively, saturation was reached in all cases. Mode of inhibition was determined by the use of
Lineweaver-Burk plots (Figure 4.9A and Figure 4.10). Analysis of SjGST with GSH as the
substrate, the Lineweaver-Burk plot indicate mixed inhibition (Figure 4.9A) with plots not
intersecting on either x-axis or y-axis. Dixon plots were used as an aid to identify inhibition
behaviour (Figure 4.9B). Parallel lines in a Dixon plot were obtained, indicating uncompetitive
inhibition of SjGST by CB3GA. Analysis of SjGST with CDNB as the substrate the Lineweaver-
Burk plot indicate non-competitive inhibition (Figure 4.10) with plots intersecting on the x-axis.
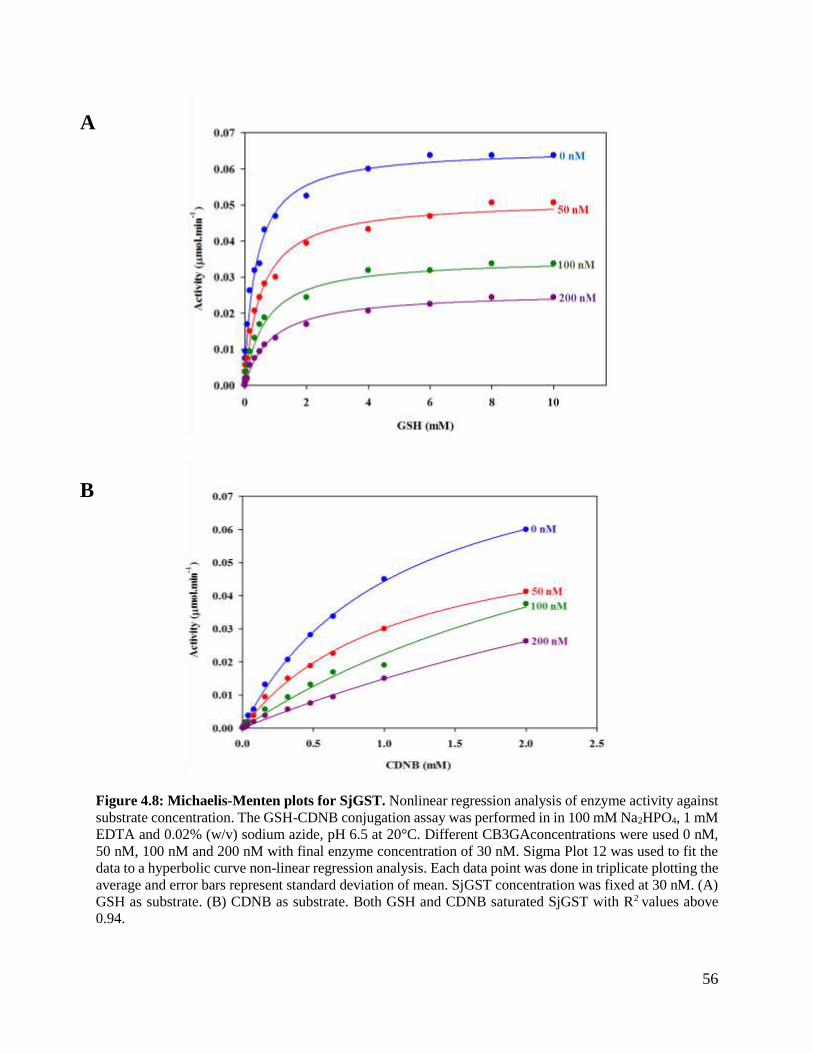
56
Figure 4.8: Michaelis-Menten plots for SjGST. Nonlinear regression analysis of enzyme activity against
substrate concentration. The GSH-CDNB conjugation assay was performed in in 100 mM Na2HPO4, 1 mM
EDTA and 0.02% (w/v) sodium azide, pH 6.5 at 20°C. Different CB3GAconcentrations were used 0 nM,
50 nM, 100 nM and 200 nM with final enzyme concentration of 30 nM. Sigma Plot 12 was used to fit the
data to a hyperbolic curve non-linear regression analysis. Each data point was done in triplicate plotting the
average and error bars represent standard deviation of mean. SjGST concentration was fixed at 30 nM. (A)
GSH as substrate. (B) CDNB as substrate. Both GSH and CDNB saturated SjGST with R2 values above
0.94.
A
B
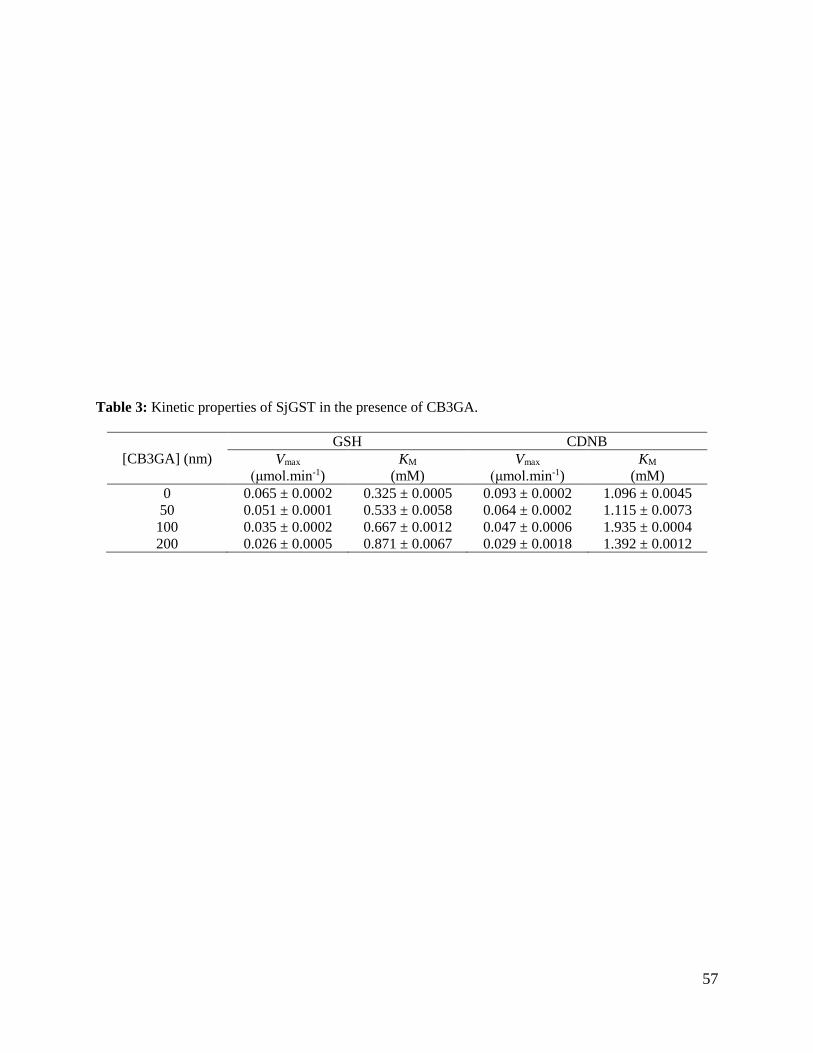
57
Table 3: Kinetic properties of SjGST in the presence of CB3GA.
[CB3GA] (nm)
GSH CDNB
Vmax
(μmol.min-1)
KM
(mM)
Vmax
(μmol.min-1)
KM
(mM)
0 0.065 ± 0.0002 0.325 ± 0.0005 0.093 ± 0.0002 1.096 ± 0.0045
50 0.051 ± 0.0001 0.533 ± 0.0058 0.064 ± 0.0002 1.115 ± 0.0073
100 0.035 ± 0.0002 0.667 ± 0.0012 0.047 ± 0.0006 1.935 ± 0.0004
200 0.026 ± 0.0005 0.871 ± 0.0067 0.029 ± 0.0018 1.392 ± 0.0012
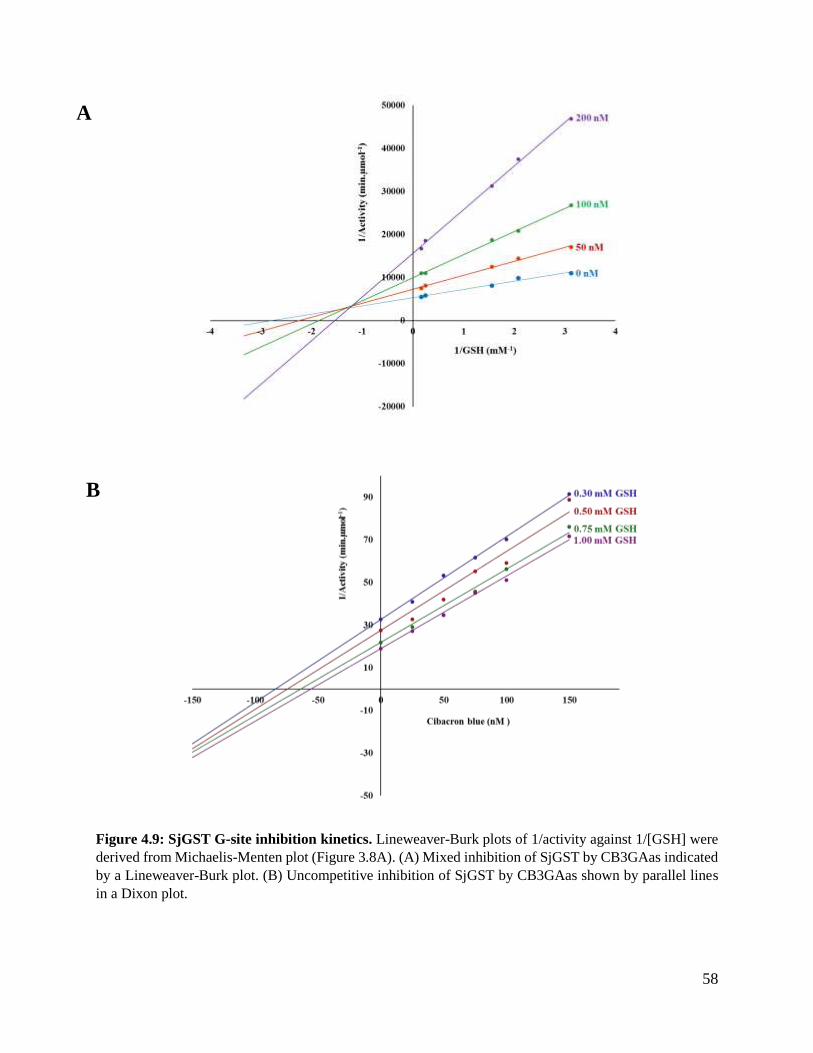
58
Figure 4.9: SjGST G-site inhibition kinetics. Lineweaver-Burk plots of 1/activity against 1/[GSH] were
derived from Michaelis-Menten plot (Figure 3.8A). (A) Mixed inhibition of SjGST by CB3GAas indicated
by a Lineweaver-Burk plot. (B) Uncompetitive inhibition of SjGST by CB3GAas shown by parallel lines
in a Dixon plot.
A
B
59
Figure 4.10: SjGST H-site inhibition kinetics. Lineweaver-Burk plots of 1/activity against 1/[CDNB]
were derived from Michaelis-Menten plot (Figure 3.8B). Non-competitive inhibition as indicated by
intersecting plots on the x-axis.
60
4.6 Molecular docking studies
Kinetic studies did not give conclusive results on the mode of inhibition of SjGST by CB3GA.
CB3GA is not directly inhibiting SjGST active sites rather affects the structure remote to the active
sites. IFD was used to theoretically prediction of CB3GA interaction with SjGST. Glide XP
Emodel scoring function which provides the best pose for the ligand based on the force field and
the molecular interactions of the ligand and the protein. SjGST was kept rigid while of CB3GA
was flexible during the conformational search. Glide XP predicted that CB3GA binds to the dimer
interface of dimeric SjGST with the highest pose based on Emodel scoring 742 kJ/mol (Figure
4.11A). Two-dimensional interaction of CB3GA and SjGST (Figure 4.11B) indicates that the
binding is characterised by hydrogen bonding. Chain A (Tyr 6, Trp 7, Asn 53, Met 68, Arg 107,
and Trp 110) and Chain B (Arg 100 and Asp 107), suggesting that CB3GA binds to the dimer
interface of SjGST (Figure 4.11A). Validation of docking was done by running Apo human GST-
Pi (PDB: 5DCG) with and CB3GA which showed binds adjacent to the H-site blocking part of the
H site as shown in Figure 4.12A with a Emodel score of 528 kJ/mol. Two-dimensional interaction
of SjGST and CB3GA (Figure 4.11B) is characterised by hydrogen bonding with Asp 98 and Lys
103. However, CB3GA seems to be interacting with GSH bound the G site of SjGST. This was
comparable with crystal structure of human GST-Pi with CB3GA (PDB: 20GS). RMSD was used
for validating the docking protocol with a value of 0.024 Å.
4.7 Binding affinity calculation
MM-GBSA was used to estimate SjGST affinity to CB3GA based on the Glide docking. MM-
GBSA protocol puts into accounts for energy landscapes defining ligand binding which contribute
to the final free energy of binding (Table 4). The predicted free energy of binding (ΔGpred) is -310
kJ/mol. Two-dimensional presentation of SjGST-CB3GA complex (Figure 4.13), CB3GA forms
hydrogen bonds with: Chain A (Arg 107, Tyr 110 and Asn 53) and Chain B (Arg 107), π-π*
stacking with Trp 40. Experimental free energy of binding (ΔGexp) was determined to be 46.93
kJ/mol.
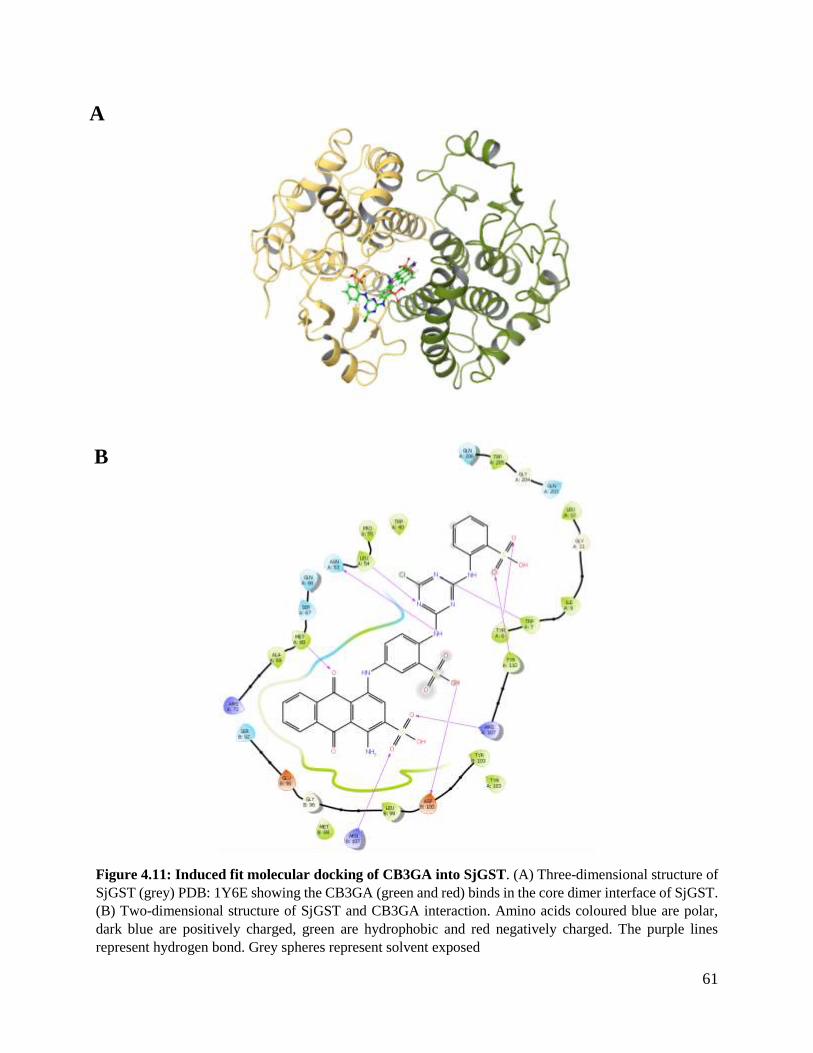
61
Figure 4.11: Induced fit molecular docking of CB3GA into SjGST. (A) Three-dimensional structure of
SjGST (grey) PDB: 1Y6E showing the CB3GA (green and red) binds in the core dimer interface of SjGST.
(B) Two-dimensional structure of SjGST and CB3GA interaction. Amino acids coloured blue are polar,
dark blue are positively charged, green are hydrophobic and red negatively charged. The purple lines
represent hydrogen bond. Grey spheres represent solvent exposed
B
A
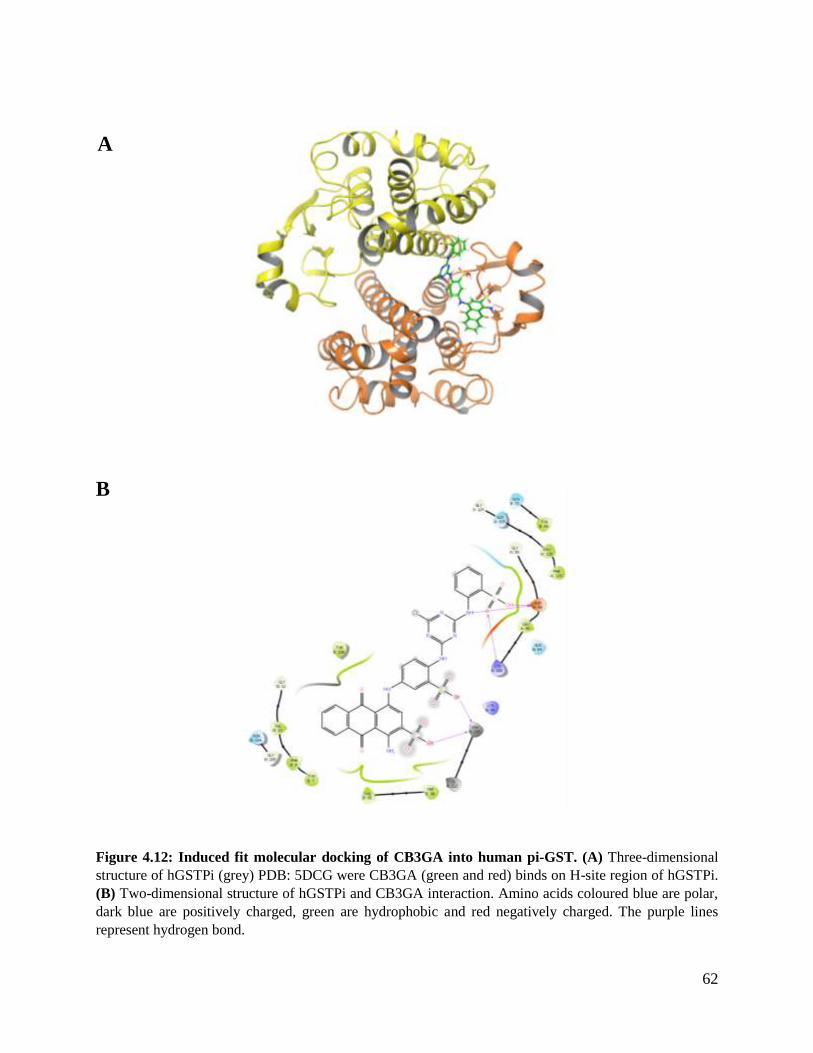
62
Figure 4.12: Induced fit molecular docking of CB3GA into human pi-GST. (A) Three-dimensional
structure of hGSTPi (grey) PDB: 5DCG were CB3GA (green and red) binds on H-site region of hGSTPi.
(B) Two-dimensional structure of hGSTPi and CB3GA interaction. Amino acids coloured blue are polar,
dark blue are positively charged, green are hydrophobic and red negatively charged. The purple lines
represent hydrogen bond.
A
B
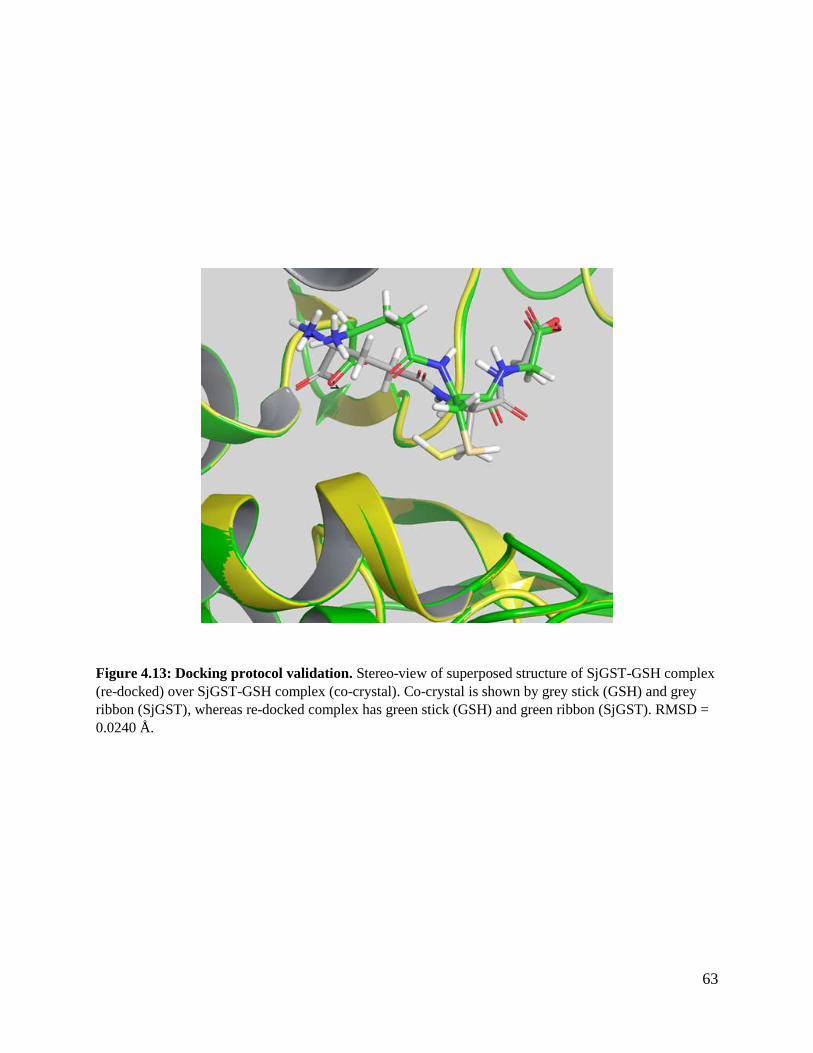
63
Figure 4.13: Docking protocol validation. Stereo-view of superposed structure of SjGST-GSH complex
(re-docked) over SjGST-GSH complex (co-crystal). Co-crystal is shown by grey stick (GSH) and grey
ribbon (SjGST), whereas re-docked complex has green stick (GSH) and green ribbon (SjGST). RMSD =
0.0240 Å.
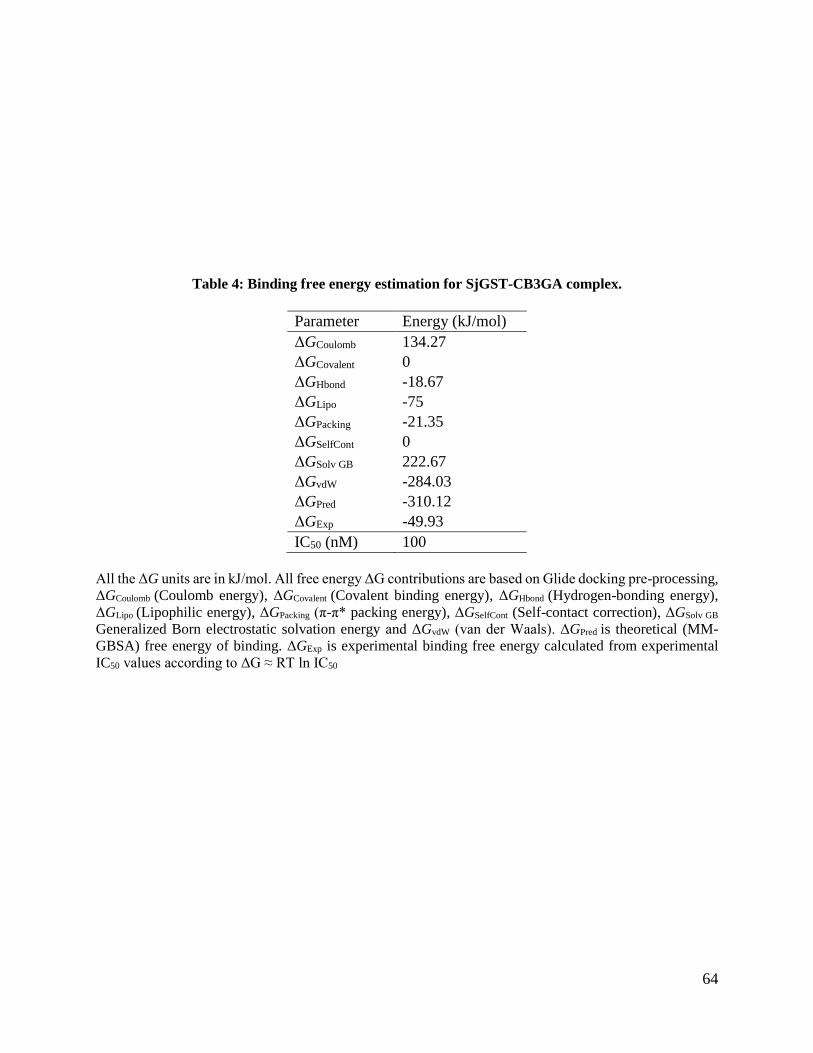
64
Table 4: Binding free energy estimation for SjGST-CB3GA complex.
Parameter Energy (kJ/mol)
ΔGCoulomb 134.27
ΔGCovalent 0
ΔGHbond -18.67
ΔGLipo -75
ΔGPacking -21.35
ΔGSelfCont 0
ΔGSolv GB 222.67
ΔGvdW -284.03
ΔGPred -310.12
ΔGExp -49.93
IC50 (nM) 100
All the ΔG units are in kJ/mol. All free energy ΔG contributions are based on Glide docking pre-processing,
ΔGCoulomb (Coulomb energy), ΔGCovalent (Covalent binding energy), ΔGHbond (Hydrogen-bonding energy),
ΔGLipo (Lipophilic energy), ΔGPacking (π-π* packing energy), ΔGSelfCont (Self-contact correction), ΔGSolv GB
Generalized Born electrostatic solvation energy and ΔGvdW (van der Waals). ΔGPred is theoretical (MM-
GBSA) free energy of binding. ΔGExp is experimental binding free energy calculated from experimental
IC50 values according to ΔG ≈ RT ln IC50
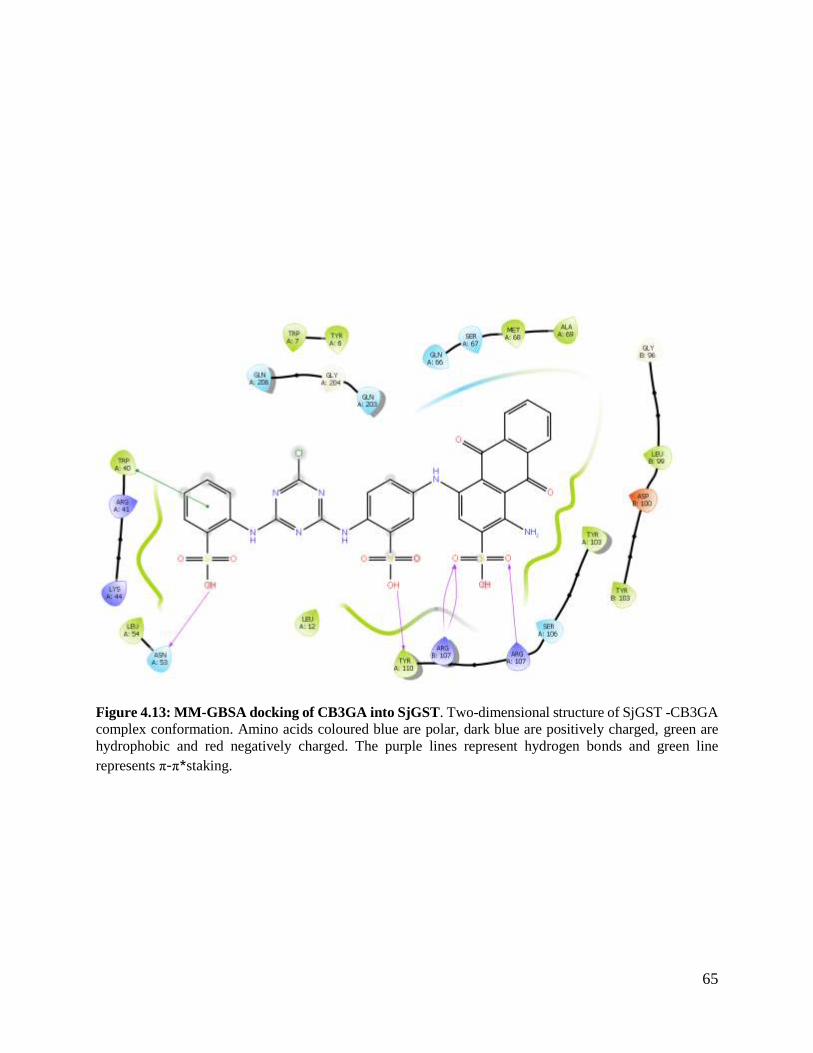
65
Figure 4.13: MM-GBSA docking of CB3GA into SjGST. Two-dimensional structure of SjGST -CB3GA
complex conformation. Amino acids coloured blue are polar, dark blue are positively charged, green are
hydrophobic and red negatively charged. The purple lines represent hydrogen bonds and green line
represents π-π*staking.

66
CHAPTER V
DISCUSSION
67
Schistosomiasis is a major neglected tropical disease with unacknowledged chronic impact
affecting schistosomiasis-endemic areas due to repeated cycles of infection. Praziquantel is the
only drug available for the treatment of schistosomiasis and resistance against praziquantel has
been observed in some schistosomiasis-endemic areas which is a huge concern for the public
health sector. Hence, new strategies and chemotherapeutic treatments have to be devolved to
combat schistosomiasis.
In this study, the effect of CB3GA (GST inhibitor) on the structure and function of SjGST was
analysed using low resolution spectroscopic techniques. SjGST is a key enzyme involved in the
detoxification, ligand transportation, and modulation of cellular activities in Schistosoma. Hence,
SjGST maybe a possible therapeutic target due to its multiple cellular activities in the parasite.
CB3GA is a known inhibitor of GSTs (Mahajan and Atkins, 2005). The aim of the study was to
obtain an insight of the mode of inhibition of CB3GA on SjGST using biophysical, functional and
molecular modelling studies.
Heterologous protein expression and purification of target protein is often a challenge in most
structural biology studies. SjGST was over-expressed using the pGEX4T-1 expression vector
which encodes SjGST as a fusion tag for heterologous protein expression. The structure and
biochemical properties of native SjGST and recombinant SjGST have comparable structural and
functional properties (McTigue et al., 1995; Parker et al., 1990). All of the over-expressed protein
was in the soluble fraction with high expression yield (Figure 4.1B). Proteins are studied in the
soluble form to mimic cytosolic conditions.
Purification of SjGST was done using GSH-Agarose column. SjGST binds efficiently to the
column, only a small fraction was obtained in the flow-through (Figure 4.1B). In this study protein
purification was done using non-reducing conditions (no DTT) because SjGST was in a soluble
aggregated (oxidative) form (Figure 4.6B) with no priotein fraction in the native conformation.
The active site of SjGST was still available to bind to immobilised GSH. SjGST has four cysteine
residues (Cys 84, Cys 138, Cys 169 and Cys 178), only Cys 169 is buried in the core of SjGST.
The exposed cysteine residues lead to the formation higher order oligomers through the formation
of intermolar disulfide bonds. None of the cysteine residues are directly involved or in close
proximity with the active site of SjGST. Also, these cysteine residues are not involved in intra- or
inter- disulfide linkages which facilitate functional conformation in the active dimeric enzyme
68
(McTigue et al., 1995b). In the presence of DTT, oxidative aggregation of SjGST is reversed
(Figure 4.6B) because SjGST exists as a dimer. Glycine-NaOH at pH 10 was used to elute SjGST
compared with using GSH, this is to avoid bias in functional investigations of SjGST since GSH
was to be used as a substrate in downstream experiments. Glycine-NaOH (pH 10) alters specific
non-covalent interactions between SjGST and immobilised GSH, leading to SjGST elution. A
single step elution was done and a pure (98%) protein sample was obtained; no other protein band
was predominant in the SDS-PAGE electrophoretogram (Figure 4.1B). SjGST is a highly soluble
protein and stable because the protein can be concentrated to 10 mg/ml without aggregation. The
initial enzyme activity can be maintained after 2 weeks when kept at -4°C. The standard curve
(Figure 4.1A) is not a reliable method for the estimation of molecular weight because the porosity
of the gel can become irregular; Hence, altering the size of a protein resolved using SDS-PAGE
(Chrambach and Rodbard, 1971).
Protein quality assessment is a critical step in biophysical and structural characterisation because
level of protein purity has impact on the accuracy and reproducibility of results. The absorbance
spectrum (Figure 4.2A) was used to assess quality of the purified protein sample, the spectrum
showed a characteristic of pure protein. The highest peak is at 280 nm and no signal detected at
340 nm indicates absence of aggregation and nucleic acid contamination. SE-HPLC showed that
SjGST is pure, homogenous and that SjGST exist as a dimer (Figure 3.6B). Protein quantification
was done to determine working sample concentrations, the value of A340 nm was not accounted for
since it was close to zero or negative. The highest point on the absorbance spectrum and
concentration determination curve was below 1. Absorbance readings above 1 can be misleading
since the Beer-Lambert law might deviate giving inaccurate results (Kaplan et al., 1997). Linearity
of the standard curve was not determined at higher absorbance values to determine if they correlate
with lower values. Beer-Lambert law linearity is dependent on the machinery used.
Structural characterisation enables to elucidate the structure-function relationship of proteins and
how alteration of protein structure affects the functional capacity of a protein (Otaki et al., 2010).
In this study CB3GA was to be used as a probe to monitor structural changes. However, due to its
complex multiple ring structure upon interaction with light anomalous behaviour was observed.
The effect of CB3GA on the resultant spectra is in a concentration dependent manner. In a study
69
by Axarli et al. (2004), the formation of Zea mays GST-CB3GA complex was detected by an
increase at 650 nm in absorbance spectra, this was not observed for SjGST-CB3GA complex.
For CB3GA to act as an efficient structural probe, intrinsic and extrinsic optical activity properties
of anthraquinone ring (CB3GA chromophore) must to be determined. Optical activity of CB3GA
highly dependent on solvent properties for its spectroscopic behaviour (Edwards and Woody,
1983). Secondary structural characterisation was done to analyse backbone conformation of
SjGST. The results indicated that SjGST is predominantly α-helical (98%). The far-UV spectrum
showed troughs at 210 and 222 nm. This was in line with the crystal structure PDB:1Y6E (Rufer
et al., 2005). Far-UV CD spectra obtained for SjGST is comparable with studies by Brockwell et
al. (2001).
Tertiary structure characterisation using Trp as a probe indicated that most of the Trp residues are
partially accessible with maximum emission wavelength at ~340 nm. This partial exposure is in
line with the crystal structure PDB:1DUG. The peak shows a shoulder (Figure 4.4) which is
indicative of unresolved vibrational transitions of the excitation of the Trp residues (Albrecht,
2008). However, it is a challenge to separate the spectral contributions of each tryptophan in a
multi-tryptophan protein. SjGST contains four Trp residues namely Trp 7, Trp 40, Trp 200, and
Trp 205 in each subunit. When SjGST was denatured (8 M urea), there was complete loss of
fluorescent properties, which was unexpected. This is not comparable with other studies where a
red shift coupled with reduced quantum yield is observed. This may be due to quenching of the
Trp fluorescence by the protein backbone (Eftink, 2006) in the presence of 8 M urea where SjGST
is in an elongated form. In a study by Kaplan et al. (1997) shows that Trp residues in SjGST are
located in the hydrophobic environment in the native state, due to the red shift from 335 nm to 355
nm upon unfolding coupled with quenching of Trp fluorescence which occurs during SjGST
unfolding rather than complete loss of fluorescent properties.
Tertiary structure analysis with ANS probe shows presence of ANS accessible hydrophobic cavity
due to the increase in quantum yield coupled with a blue shift in the maximum emission
wavelength of ANS (Figure 4.5). The observations made in this study are consistent with Mu-GST
class which SjGST is evolutionary related with (McTigue et al., 1995b). ANS also bind to rat
GSTM1-1 a class Mu-GST enzyme (Kinsley et al., 2008) which was used for molecular
replacement in the elucidation of SjGST crystal structure (Lim et al., 1994). Therefore, comparable
70
with closely related GST isoenzymes. The extent of the blue-shift emission maxima is determined
by the ANS binding site polarity (Lakowicz, 1999). A less polar environment leads to high
quantum yield as indicated by lipid binding proteins (Sayed et al., 2000). Evaluation of
enhancement or quenching of the ANS is an indication of the degree of exposure of hydrophobic
surfaces of the protein being studied to the surrounding environment. ANS is also able bind to
polar regions of a protein using its negatively charged sulfonate group. The sulfonate group
interacts with cationic amino acid residues in the protein forming ion pairs. These are followed by
hydration changes which allow ANS binding to hydrophobic patches. Therefore, polar
environments to a greater extent are the primary determinants of ANS binding to protein (Matulis
and Lovrien, 1998). This is true for SjGST because hydrophobic van der Waals forces are not the
only interacting forces participates in the binding of ANS to SjGST as determined by isothermal
calorimetry (Yassin et al., 2004). The study was done under the assumption that ANS does not
alter the structure of SjGST because it was shown that ANS can alter the structure of some proteins
(Celej et al., 2005). In a study by Dirr et al., (2005) showed that ANS binds to the non-polar active
site (H-site) of human Alpha GST.
Quaternary structure characterisation was done using SE-HPLC to monitor the hydrodynamic
volume and apparent molecular weight of SjGST in the presence and absence of CB3GA. We
postulated that CB3GA could alter the quaternary structure of the native dimeric structure SjGST.
In the presence of 1 mM CB3GA, SjGST maintained its dimer conformation and no aggregates
were observed (Figure 4.6B). This was useful for functional characterisation as SjGST maintained
its native conformation in the presence of CB3GA. Hence, any inhibition due CB3GA interaction
will not be as a result of changes in the quaternary structure of SjGST. An apparent molecular
weight of 55 kDa was obtained, in the presence and absence of CB3GA, which is greater than the
theoretical molecular weight because it accounts for gaps within the protein structure. Hence, it is
a true representative of the globular size of SjGST. The apparent molecular weight does not deviate
much from the dimeric theoretical molecular weight 52 kDa, this is within reasonable limits.
Structural changes, would be difficult to monitor using low resolution techniques such as Far-UV
CD and Trp fluorescence (considering SjGST is a multitryptophan protein) since SjGST remains
a dimer in the presence of CB3GA. To date there are no ligands known to alter the quaternary
structure of GSTs. GST normally exist in an active dimeric form. The presence of a functionally
stable monomeric form remains unclear, Abdalla et al. (2002) showed that monomeric human Pi-
71
GST is dysfunctional. SjGST has similar structural characteristics when compared to other GSTs
(Salinas and Wong, 1999; Wilce and Parker, 1994), predominantly α-helical in structure with
comparable tertiary structure. This conservation of secondary, tertiary and quaternary structure
ensures conservation of functional properties in GSTs.
The functional characterisation SjGST was done using the universal CDNB-GSH conjugation
assay. Mode of SjGST inhibition by CB3GA has not yet been identified. Reversible enzyme
inhibition is generally classified in mainly three classes namely: competitive, non-competitive,
mixed and uncompetitive inhibition. This gives an idea on how an inhibitor interacts with an
enzyme. In this study GSH (G-site) and CDNB (H-site) were used as substrates to determine mode
of inhibition, SjGST activity in this study is based on this assay. Beyond the G and H site there
could be other binding sites that can alter the conformation of the active site, resulting in the
inhibition of SjGST. IC50 value determination was the starting point for analysing SjGST
inhibition by CB3GA under assumption that CB3GA does inhibit SjGST as observed in other
GSTs (Mahajan and Atkins, 2005). An IC50 value will also be indicative of the optimal CB3GA
concentration to be used in subsequent inhibition studies. IC50 of CB3GA was determined to be
100 nM (Figure 4.7A). The IC50 value of CB3GA in GSTs varies greatly from 15 nM to 250 nM
(Ilio et al., 1988). However, that of GST is comparable with a helminth GST Fasciola gigantica
of 135 nM (Kalita et al., 2017). IC50 value of CB3GA on SjGST falls within the range of Mu-GST
isoenzyme with a range of 50 nM to 700 nM. However, it is not useful since the range is extensive
hence not comparable. The Mu-GST class has the highest sensitivity to CB3GA in cytosolic GSTs
(Mannervik et al., 1985). There is no defined range for CB3GA inhibition on GSTs. The
nanomolar range inhibition makes CB3GA a worth candidate to effective GST inhibition because
at low CB3GA concentration there is substantial inhibition of SjGST. However, due to CB3GA
promiscuous nature of binding, it has to be modified for GST specificity. Efficient inhibition of
SjGST is essential for effective Schistosoma elimination.
Specific activity of SjGST in the presence of CB3GA was 8.3 µmol. min-1.mg-1 compared with
19.8 µmol. min-1.mg-1 in the absence of CB3GA (Figure 4.7B). Specific activity of SjGST was
reduced by ~50%. Specific activity obtained in this study for free SjGST is comparable with
studies by Walker et al. (1993) and Smith et al. (1988). Inhibition steady state kinetics of SjGST
were analysed to determine the mode of inhibition of CB3GA on SjGST using GSH as a probe for
72
G site and CDNB for the H site. The concentrations used for the inhibition studies were set based
on the IC50 value. The GSH-CDNB conjugation assay in the presence of CB3GA was used in the
to study inhibition kinetics of SjGST.
Lineweaver-Burke plots were derived from Michaelis-Menten data in order to determine the
CB3GA mode of inhibition. The goodness of fit of regression coefficients was greater than 0.95
for all fits except for CDNB plots for 100 nM and 200 nM. This deviation can be attributed to
superimposition of either product inhibition or enzyme memory loss of SjGST (Mannervik et al.,
1988). SjGST is bi-substrate enzyme, the G-site and the H-site do not display cooperativity active
sites, since GSH and CDNB plots show a hyperbolic plot for Michelis-Manten kinetics (Figure
4.8) (Berg et al., 2002). Change in KMGSH/CDNB and Vmax
GSH/CDNB in the presence of CB3GA is
shown in Table 2. Control KMGSH/CDNB were consistent with what was obtained by Walker et al.
(1993) and Stefanidis et al. (2018). With respect to G-site CB3GA showed uncompetitive
inhibition as described by the Dixon plot (Figure 3.9B) on the other hand the H-site CB3GA
showed non-competitive inhibition (Figure 3.10). The results indicate that SjGST has higher
affinity to GSH (KM = 0.33 mM) compare with CDNB (KM = 1.10 mM), this is consistent with
observations in most GSTs (Armstrong, 1991). SjGST requires no specific order for
substrate/ligand association its catalytic mechanism (random sequential single displacement)
which has been observed in most parasitic GSTs (Torres and Landa, 2008). GSH has been
suggested to be the first to bind to SjGST due high cytosolic GSH concentration (up to 10 mM)
considering that the KM of GSH is in most cases is below 1 mM (Clark, 1989). Lineweaver-Burke
plots are prone to error at low substrate concentrations due to 1/[S] derivation inflating the
influence of low substrate concentrations on the overall shape of the graph and mathematical flaws
as described by Ochs (2010). However, they give an idea on the mode of enzyme inhibition not
actual numeric kinetic parameters. It is better to use more accurate techniques such as isothermal
titration calorimetry to determine the kinetic parameters for CB3GA binding to SjGST. CB3GA
seems to be remotely affecting both active sites suggesting another binding site on SjGST. The
assumption of the presence of an alternative binding site prompted the use of molecular docking
to theoretically determine the location of this site.
Schrödinger IFD protocol was used to predict the conformation of SjGST-CBG3A complex. It is
generally accepted that induced fit docking is a more reliable method of docking when compared
73
with rigid docking. Induced fit docking used in this study allows for ligand flexibility hence
exploring a wide range of possible binding conformations in the rigid protein structure. Induced
fit docking is a valid method to predict ligand binding conformation as demonstrated by Sherman
et al. (2006) where IFD provided a better fit (RMSD) comparable with crystal structures. Co-
crystallised protein-ligand complexes were compared to IFD results of protein and respective
ligand. The study demonstrated that structures obtained induced fit docking are of sufficient
quality assisting in lead molecule optimization effort.
Glide Emodel scoring function was used for analysis of CB3GA binding to SjGST. Emodel scoring
uses more significant force field components (electrostatic and van der Waal energies) for the
conformation of the ligand. These are suited for comparing ligand conformations ultimately
selecting the optimal ligand pose in the lowest energy state in the protein binding site. The lower
the Emodel value the better the binding affinity between protein and ligand. IFD determined that
within 4 Å of CB3GA makes hydrogen bond contacts with: from Chain A Tyr 6, Trp 7, Leu 54,
Asn 53, Met 68, Arg 107, Tyr 110 and on Chain B Arg 107 and Asp 100 (Figure 4.11B). One
molecule of CB3GA binds per dimeric GST in the long groove of the dimer interface in proximity
to the catalytic active sites (Figure 4.11A) protruding into the H-site (Figure 4.11B). CB3GA forms
a direct hydrogen bond with Trp 7 a residue critical for GST catalysis. Trp 7 has been postulated
to be responsible for stabilising GSH thiolate anion and enhancing nucleophilicity of protonated
thiol (Andújar-Sánchez et al., 2003). Try 111 is important for the water molecule coordination in
SjGST active site (Lim et al., 1994). CB3GA interacts with Tyr 110 which can affect atomic
arrangement that allow for suitable water molecule coordination. These factors could be the cause
of efficient CB3GA inhibition because it interacts with Trp 7 and Tyr 110 residues which have
key roles in SjGST catalytic mechanism (Cardoso et al., 2003). SjGST W7F mutation displays
high affinity for GSH than wild type SjGST and complete loss of activity towards CDNB
(Andújar-Sánchez et al., 2003). Suggesting that Trp 7 plays a key role in SjGST catalysis. CB3GA
seems to be protruding into the H-site of SjGST (Figure 4.11B) this is consistent with non-
competitive inhibition observed experimentally (Figure 4.10) and a stoichiometry of 1 CB3GA
molecule binging to the dimer interface, which is associated with ligandin type inhibitors of GST
(Mahajan and Atkins, 2005). The promiscuity of the L-site suggests that the inhibition observed is
dependent on the nature of the binding ligand due to different residues being involved L-site
binding. An important consideration when IFD is done is that: the observed protein-complex
74
conformation may not be the same as the one observed in the cell. The energy minimised state in-
silico may not be the most populated protein conformation which will bind to the ligand. Therefore,
other high energy states need to be considered. This could be done by considering other protein-
ligand conformations with a higher Emodel score (Carlson, 2002b; Teague, 2003).
CB3GA binds on the dimer interface of SjGST, this site is referred to as the non-substrate binding
site (L-Site) which is poorly defined in most GSTs. CB3GA seems to be binding in a similar site
as praziquantel. However, praziquantel does not inhibit the SjGST activity (Milhon et al., 1997).
It might be because praziquantel does not interact with SjGST residues involved in catalysis
particularly Trp 7. The non-competitive steady state kinetic nature of CB3GA inhibition of SjGST
with respect to CDNB, is a feature observed for “ligandin” inhibitors (bind to L-site) of GSTs. In
some cases partially occupying the H-site within the cleft (Mahajan and Atkins, 2005). This further
validates the L-site binding of CB3GA to SjGST based on the IFD results. The ability of CB3GA
and praziquantel to bind on a similar site indicates the versatility of the L-site. Hence, wide range
of L-site inhibitors can be formulated. Validation of the induced fit docking method was done by
using human Pi-GST. Docking results observed were comparable with the crystal structure of
human Pi-GST-CB3GA complex (Oakley et al., 1999). The CB3GA occupies a part of the H-site
in Pi-GST, this lead to the suggestion that the L-site of Pi-GST is not on the dimer interface
(Oakley et al., 1999). Pi-GST-CB3GA complex shows that the L-site is different in GST isoforms,
therefore more studies have to be done to characterise the L-site in GSTs. The RMSD value of
0.024 Å shows that the IFD protocol was valid, since the SjGST-GSH complex re-docked structure
was similar to a solved crystal SjGST-GSH complex. Therefore, RMSD validation provides a
strategy to explore multi-objective optimisation for the development of docking procedures (Poli
et al., 2016).
Binding affinity prediction was done using a SjGST-CB3GA complex structure obtained Glide
docking rather than Quantum Mechanics/Molecular Mechanics (QM/MM) docking because
CB3GA is a highly charged molecule. Highly charged molecules have shown to alter MM-GBSA
predictions (Sun et al., 2014), QM/MM increases formal partial charge to ligands in this case
CB3GA is a highly charged hence MM-GBSA may fail to perform free energy predictions for the
protein-ligand complex with high ligand charges. The advantage of using MM-GBSA is that it
breaks down ΔGPred to individual components, giving a better understanding of the binding process
75
involved in complex formation. Table 4 shows that ΔGCovalent and ΔGSolv GB unfavourable
contributions for binding. This can be attributed to the unfavourable displacement of implicit
solvent model in the dimer interface of SjGST which has a large surface area of 40 Å (McTigue et
al., 1995b). Favourable ΔGCoulomb and ΔGvdW drive binding, this may be due to the configuration
of SjGST and the net charge of CB3GA that favour binding. However, it should be noted that MM-
GBSA only accounts for the residues proximal to the binding site. It does not include ensembles
and alternative conformers on the protein or ligand that remotely affect binding affinity (Du et al.,
2016). SjGST-CB3GA complex assumes a different conformation in MM-GBSA when compared
with IFD conformation. However, CB3GA still binds in the dimer interface of SjGST. π-π*-
staking between SjGST (Trp 40) and CB3GA is observed in MM-GBSA complex and not in the
IFD complex. π-π*-staking is directional form of interaction hence it can be the primary force
driving CB3GA binding. However, standard force field methods have insufficient treatment of π-
π*-staking interaction (Li et al., 2011). Free energy of binding from MM-GBSA
ΔGPred (- 265.15 kJ/mol) compared with experimental ΔGExp (-49.93 kJ/mol) differ substantially.
This was expected since MM-GBSA does not account for all molecular forces affecting free energy
of binding. However, both show that binding is favourable at different magnitudes. Molecular
dynamics (MD) may be a better starting method for MM-GBSA to give a better depiction when
compared with experimental binding affinity. MD uses multiple conformations for MM-GBSA at
different time points during the simulation while IFD uses one conformation. Also, MD can dictate
other conformations that are have not been considered in Glide docking due to limited
computational power.
Conclusion and future work.
CB3GA is an efficient inhibitor of SjGST that binds to the dimer interface of SjGST altering
catalytic activity of both the G-site and H-site. The forces that govern the efficient inhibition of
SjGST should be analysed close so that they can be applied to drug design for efficient inhibition.
Ligandin function of SjGST can be exploited for rational drug design since ligands such as CB3GA
can affect the activity of both catalytic active sites paying special attention to the L-site which is
overlaps onto the H-site (distinct xenobiotic binding) providing expansive binding surface of
ligands. However, the binding process to the L-site is dependent on size, structure and nature of
the ligand. The unique characteristic of the L-site provides an opportunity for highly specific

76
rational drug design. Theoretical and experimental binding affinities favour SjGST-complex
formation. Further work will involve crystallisation of SjGST with CB3GA, without
crystallography data the exact binding mode of CB3GA remains elusive. Isothermal titration
calorimetry to analyse thermodynamics involved in SjGST binding to CB3GA.

77
REFERENCES
.
78
1. Abdalla, A.-M., Bruns, C.M., Tainer, J.A., Mannervik, B., Stenberg, G., (2002).
Design of a monomeric human glutathione transferase GSTP1, a structurally stable but
catalytically inactive protein. Protein Engineering 15, 827-834.
2. Adenowo, A.F., Oyinloye, B.E., Ogunyinka, B.I., Kappo, A.P., (2015). Impact of human
schistosomiasis in sub-Saharan Africa. Brazilian Journal of Infectious Diseases 19, 196-
205.
3. Albrecht, C., (2008). Joseph R. Lakowicz: Principles of fluorescence spectroscopy.
Analytical and Bioanalytical Chemistry 390, 1223-1224.
4. Alfarano, P. (2010). Structure-based Methods for Virtual Screening, Protein Design, and
Protein Function Studies (Doctoral dissertation).
5. Alger, H.M., Williams, D.L., (2002). The disulfide redox system of Schistosoma mansoni
and the importance of a multifunctional enzyme, thioredoxin glutathione reductase.
Molecular and Biochemical Parasitology 121, 129-139.
6. Andújar-Sánchez, M., Clemente-Jiménez, J.M.a., Las Heras-Vázquez, F.J.,
Rodrı́guez-Vico, F., Cámara-Artigas, A., Jara-Pérez, V., (2003). Thermodynamics of
glutathione binding to the tyrosine 7 to phenylalanine mutant of glutathione S-transferase
from Schistosoma japonicum. International Journal of Biological Macromolecules 32, 77-
82.
7. Armstrong, R. N., (1991). Glutathione S-transferases: reaction mechanism, structure, and
function. Chemical research in toxicology, 4(2), 131-140.
8. Arthur, J., (2001). The glutathione peroxidases. Cellular and Molecular Life Sciences 57,
1825-1835.
9. Axarli, I.A., Rigden, D.J., Labrou, N.E., (2004). Characterization of the ligandin site of
maize glutathione S-transferase I. Biochemical Journal 382, 885-893.
10. Baan, M., Galappaththi-Arachchige, H.N., Gagai, S., Aurlund, C.G., Vennervald,
B.J., Taylor, M., van Lieshout, L., Kjetland, E.F., (2016). The Accuracy of Praziquantel
Dose Poles for Mass Treatment of Schistosomiasis in School Girls in KwaZulu-Natal,
South Africa. PLoS Neglected Tropical Diseases 10, e0004623.
11. Berg, J., Tymoczko, J., Stryer, L., (2002). The Michaelis-Menten model accounts for the
kinetic properties of many enzymes. Biochemistry, 5.
12. Bhargava, M. M., Listowsky, I., & Arias, I. M. (1978). Ligandin. Bilirubin binding and
glutathione-S-transferase activity are independent processes. Journal of Biological
Chemistry 253(12), 4112-4115.
13. Braschi, S., Curwen, R.S., Ashton, P.D., Verjovski‐Almeida, S., Wilson, A., (2006).
The tegument surface membranes of the human blood parasite Schistosoma mansoni: a
proteomic analysis after differential extraction. Proteomics 6, 1471-1482.
14. Brockwell, D., Yu, L., Cooper, S., Mccleland, S., Cooper, A., Attwood, D., Gaskell,
S.J., Barber, J., (2001). Physicochemical consequences of the perdeuteriation of
glutathione S‐transferase from S. japonicum. Protein Science 10, 572-580.
79
15. Brophy, P., (1988). The role of glutathione S-transferase in cestodes. Institute of
Biological Sciences. University of Wales, Aberystwyth.
16. Brophy, P., Barrett, J., (1990). Glutathione transferase in helminths. Parasitology 100,
345-349.
17. Brophy, P.M., Pritchard, D.I., (1994). Parasitic helminth glutathione S-transferases: an
update on their potential as targets for immuno-and chemotherapy. Experimental
Parasitology 79, 89-96.
18. Brown, D.S., (2002). Freshwater snails of Africa and their medical importance. CRC press.
19. Cardoso, R. M., Daniels, D. S., Bruns, C. M., & Tainer, J. A.B, (2003). Characterization
of the electrophile binding site and substrate binding mode of the 26‐kDa glutathione S‐
transferase from Schistosoma japonicum. Proteins: Structure, Function, and
Bioinformatics, 51(1), 137-146.
20. Carlson, H.A., (2002a). Protein flexibility and drug design: how to hit a moving target.
Current Opinion in Chemical Biology 6, 447-452.
21. Carlson, H.A., (2002b). Protein flexibility is an important component of structure-based
drug discovery. Current Pharmaceutical Design 8, 1571-1578.
22. Celej, M.S., Dassie, S.A., Freire, E., Bianconi, M.L., Fidelio, G.D., (2005). Ligand-
induced thermostability in proteins: Thermodynamic analysis of ANS–albumin interaction.
Biochimica et Biophysica Acta (BBA)-Proteins and Proteomics 1750, 122-133.
23. Chaudhary, K.K., Mishra, N., (2016). A Review on Molecular Docking: Novel Tool for
Drug Discovery. Databases 3, 4.
24. Chitsulo, L., Engels, D., Montresor, A., Savioli, L., (2000). The global status of
schistosomiasis and its control. Acta Tropica 77, 41-51.
25. Chrambach, A., Rodbard, D., (1971). Polyacrylamide gel electrophoresis. Science 172,
440-451.
26. Cioli, D., Pica-Mattoccia, L., Basso, A., Guidi, A., (2014). Schistosomiasis control:
praziquantel forever ?. Molecular and Biochemical Parasitology 195, 23-29.
27. Clark, A.G., (1989). The comparative enzymology of the glutathione S-transferases from
non-vertebrate organisms. Comparative Biochemistry and Physiology Part B:
Comparative Biochemistry 92, 419-446.
28. Colley, D., Secor, W., (2014). Immunology of human schistosomiasis. Parasite
Immunology 36, 347-357.
29. da Paixão Siqueira, L., Fontes, D.A.F., Aguilera, C.S.B., Timóteo, T.R.R., Ângelos,
M.A., Silva, L.C.P.B.B., de Melo, C.G., Rolim, L.A., da Silva, R.M.F., Neto, P.J.R.,
(2017). Schistosomiasis: drugs used and treatment strategies. Acta Tropica 176, 179-187.
30. De Boer, H.A., Comstock, L.J., Vasser, M., (1983). The tac promoter: a functional hybrid
derived from the trp and lac promoters. Proceedings of the National Academy of Sciences
80, 21-25.
31. De Sousa, C. A. P., Brigham, T., Chasekwa, B., Mbuya, M. N., Tielsch, J. M.,
Humphrey, J. H., & Prendergast, A. J., (2014). Dosing of praziquantel by height in sub-
80
Saharan African adults. The American Journal of Tropical Medicine and Hygiene 90(4),
634-637.
32. Dirr, H.W., Little, T., Kuhnert, D.C., Sayed, Y., (2005). A conserved N-capping motif
contributes significantly to the stabilization and dynamics of the C-terminal region of class
Alpha Glutathione S-transferases. Journal of Biological Chemistry 280, 19480-19487.
33. Doenhoff, M., Hagan, P., Cioli, D., Southgate, V., Pica-Mattoccia, L., Botros, S., Coles,
G., Tchuenté, L.T., Mbaye, A., Engels, D., (2009). Praziquantel: its use in control of
schistosomiasis in sub-Saharan Africa and current research needs. Parasitology 136, 1825-
1835.
34. Doenhoff, M.J., Cioli, D., Utzinger, J., (2008). Praziquantel: mechanisms of action,
resistance and new derivatives for schistosomiasis. Current Opinion in Infectious Diseases
21, 659-667.
35. Du, X., Li, Y., Xia, Y.-L., Ai, S.-M., Liang, J., Sang, P., Ji, X.-L., Liu, S.-Q., (2016).
Insights into protein–ligand interactions: mechanisms, models, and methods. International
Journal of Molecular Sciences 17, 144.
36. Edwards, R.A., Woody, R.W., (1983). Molecular orbital calculations of the optical
properties of Congo Red and Cibacron Blue and their complexes with proteins. The
Journal of Physical Chemistry 87, 1329-1337.
37. Eftink, M.R., (2006). Fluorescence techniques for studying protein structure. Methods of
Biochemical Analysis: Protein Structure Determination 35, 127-205.
38. Fallon, P.G., Doenhoff, M.J., (1994). Drug-resistant schistosomiasis: resistance to
praziquantel and oxamniquine induced in Schistosoma mansoni in mice is drug specific.
The American Journal of Tropical Medicine and Hygiene 51, 83-88.
39. Feldmeier, H., Chitsulo, L., (1999). Therapeutic and operational profiles of metrifonate
and praziquantel in Schistosoma haematobium infection. Arzneimittelforschung 49, 557-
565.
40. Ferrari, M., Coelho, P., Antunes, C., Tavares, C., Da Cunha, A., (2003). Efficacy of
oxamniquine and praziquantel in the treatment of Schistosoma mansoni infection: a
controlled trial. Bulletin of the World Health Organization 81, 190-196.
41. Fong, I.W., (2012). Challenges in infectious diseases. Springer Science & Business Media.
42. Friesner, R.A., Banks, J.L., Murphy, R.B., Halgren, T.A., Klicic, J.J., Mainz, D.T.,
Repasky, M.P., Knoll, E.H., Shelley, M., Perry, J.K., (2004). Glide: a new approach for
rapid, accurate docking and scoring. Method and assessment of docking accuracy. Journal
of Medicinal Chemistry 47, 1739-1749.
43. Gadhe, C.G., Balupuri, A., Kothandan, G., Cho, S.J., (2014). Theoretical
characterization of binding mode of organosilicon inhibitor with p38: Docking, MD
simulation and MM/GBSA free energy approach. Bulletin of the Korean Chemical Society
35, 2494-2504.
44. Gasteiger, E., Hoogland, C., Gattiker, A., Wilkins, M.R., Appel, R.D., Bairoch, A.,
(2005). Protein identification and analysis tools on the ExPASy server. Springer.
81
45. Graminski, G. F., Kubo, Y., & Armstrong, R. N., (1989). Spectroscopic and kinetic
evidence for the thiolate anion of glutathione at the active site of glutathione S-
transferase. Biochemistry 28(8), 3562-3568.
46. Habig, W.H., Jakoby, W.B., (1981). Assays for differentiation of glutathione S-
Transferases, Methods in enzymology. 398-405.
47. Habig, W.H., Pabst, M.J., Jakoby, W.B., (1974). Glutathione S-transferases the first
enzymatic step in mercapturic acid formation. Journal of Biological Chemistry 249, 7130-
7139.
48. Harnett, W., Kusel, J., (1986). Increased exposure of parasite antigens at the surface of
adult male Schistosoma mansoni exposed to praziquantel in vitro. Parasitology 93, 401-
405.
49. Hawe, A., Sutter, M., Jiskoot, W., (2008). Extrinsic fluorescent dyes as tools for protein
characterization. Pharmaceutical Research 25, 1487-1499.
50. Hou, T., Wang, J., Li, Y., Wang, W., (2010). Assessing the performance of the
MM/PBSA and MM/GBSA methods. The accuracy of binding free energy calculations
based on molecular dynamics simulations. Journal of Chemical Information and Modeling
51, 69-82.
51. Huang, Y., Manderson, L., (1992). Schistosomiasis and the social patterning of infection.
Acta Tropica 51, 175-194.
52. Ilio, C., Aceto, A., Boccio, G., Casalone, E., Pennelli, A., Federici, G., (1988).
Purification and characterization of five forms of glutathione transferase from human
uterus. The FEBS Journal 171, 491-496.
53. Ismail, M., Metwally, A., Farghaly, A., Bruce, J., Tao, L.-F., Bennett, J.L., (1996).
Characterization of isolates of Schistosoma mansoni from Egyptian villagers that tolerate
high doses of praziquantel. The American Journal of Tropical Medicine and Hygiene 55,
214-218.
54. Ismail, M.M., Taha, S.A., Farghaly, A.M., El-Azony, A., (1994). Laboratory induced
resistance to praziquantel in experimental schistosomiasis. Journal of the Egyptian Society
of Parasitology 24, 685-695.
55. Jiang, Q.Q., (2013). Discovery of potent inhibitors of human β-tryptase by protein surface
recognition. (PhD Dissertation).
56. Jolly, E.R., Chin, C.-S., Miller, S., Bahgat, M.M., Lim, K., DeRisi, J., McKerrow, J.H.,
(2007). Gene expression patterns during adaptation of a helminth parasite to different
environmental niches. Genome Biology 8, R65.
57. Jordan, P., Webbe, G., Sturrock, R.F., (1993). Human schistosomiasis. CAB
International.
58. Kalita, J., Shukla, R., Shukla, H., Gadhave, K., Giri, R., Tripathi, T., (2017).
Comprehensive analysis of the catalytic and structural properties of a mu-class glutathione
s-transferase from Fasciola gigantica. Scientific Reports 7, 17547.
82
59. Kallestrup, P., Zinyama, R., Gomo, E., Butterworth, A.E., van Dam, G.J., Gerstoft,
J., Erikstrup, C., Ullum, H., (2006). Schistosomiasis and HIV in rural Zimbabwe:
efficacy of treatment of schistosomiasis in individuals with HIV coinfection. Clinical
Infectious Diseases 42, 1781-1789.
60. Kaplan, W., Erhardt, J., Sluis‐Cremer, N., Dirr, H., Hüsler, P., Klump, H., (1997).
Conformational stability of pGEX‐expressed Schistosoma japonicum glutathione S‐
transferase: a detoxification enzyme and fusion‐protein affinity tag. Protein Science 6, 399-
406.
61. Kelly, S.M., Jess, T.J., Price, N.C., (2005). How to study proteins by circular dichroism.
Biochimica et Biophysica Acta (BBA)-Proteins and Proteomics 1751, 119-139.
62. Kelly, S.M., Price, N.C., (2000). The use of circular dichroism in the investigation of
protein structure and function. Current Protein and Peptide Science 1, 349-384.
63. Kinsley, N., Sayed, Y., Mosebi, S., Armstrong, R.N., Dirr, H.W., (2008).
Characterization of the binding of 8-anilinonaphthalene sulfonate to rat class Mu GST M1-
1. Biophysical Chemistry 137, 100-104.
64. Kraut, D. A., Carroll, K. S., & Herschlag, D., (2003). Challenges in enzyme mechanism
and energetics. Annual Review of Biochemistry 72(1), 517-571.
65. Kursula, I., Heape, A. M., & Kursula, P. (2005). Crystal Structure of Non-Fused
Glutathione S-Transferase from Schistosoma 709 japonicum in Complex with
Glutathione. Protein and peptide letters, 12(7), 709-712.
66. Laemmli, U.K., (1970). Cleavage of structural proteins during the assembly of the head of
bacteriophage T4. Nature 227, 680-685.
67. Lakowicz, J. R., (1999) Principles of Fluorescence Spectroscopy. Plenum Press, New
York.
68. Li, J., Abel, R., Zhu, K., Cao, Y., Zhao, S., Friesner, R.A., (2011). The VSGB 2.0 model:
a next generation energy model for high resolution protein structure modeling. Proteins:
Structure, Function, and Bioinformatics 79, 2794-2812.
69. LigPrep, (2009). 2.3, Schrodinger. LLC, New York, NY.
70. Lim, K., Ho, J.X., Keeling, K., Gilliland, G.L., Ji, X., Rüker, F., Carter, D.C., (1994).
Three‐dimensional structure of Schistosoma japonicum glutathione S‐transferase fused
with a six‐amino acid conserved neutralizing epitope of gp41 from HIV. Protein Science
3, 2233-2244.
71. Liu, J., Wang, R., (2015). Classification of current scoring functions. Journal of Chemical
Information and Modelling 55, 475-482.
72. Lyne, P.D., Lamb, M.L., Saeh, J.C., (2006). Accurate prediction of the relative potencies
of members of a series of kinase inhibitors using molecular docking and MM-GBSA
scoring. Journal of Medicinal Chemistry 49, 4805-4808.
73. Mahajan, S., Atkins, W., (2005). The chemistry and biology of inhibitors and pro-drugs
targeted to glutathione S-transferases. Cellular and Molecular Life Sciences 62, 1221-
1233.
83
74. Mannervik, B., Alin, P., Guthenberg, C., Jensson, H., Tahir, M.K., Warholm, M.,
Jörnvall, H., (1985). Identification of three classes of cytosolic glutathione transferase
common to several mammalian species: correlation between structural data and enzymatic
properties. Proceedings of the National Academy of Sciences 82, 7202-7206.
75. Mannervik, B., Helena Danielson, U., Ketterer, B., (1988). Glutathione transferases—
structure and catalytic activit. Critical Reviews in Biochemistry 23, 283-337.
76. Martin, J.L., (1995). Thioredoxin-a fold for all reasons. Structure 3, 245-250.
77. Matulis, D., Lovrien, R., (1998). 1-Anilino-8-naphthalene sulfonate anion-protein
binding depends primarily on ion pair formation. Biophysical Journal 74, 422-429.
78. Mazigo, H.D., Dunne, D.W., Wilson, S., Kinung’hi, S.M., de Moira, A.P., Jones, F.M.,
Morona, D., Nuwaha, F., (2014). Co-infection with Schistosoma mansoni and Human
Immunodeficiency Virus-1 (HIV-1) among residents of fishing villages of north-western
Tanzania. Parasites & Vectors 7, 587.
79. McTigue, M.A., Bernstein, S.L., Williams, D.R., Tainer, J.A., (1995a). Purification and
crystallization of a schistosomal glutathione S-Transferase. Proteins: Structure, Function,
and Bioinformatics 22, 55-57.
80. McTigue, M.A., Williams, D.R., Tainer, J.A., (1995b). Crystal Structures of a
Schistosomal Drug and Vaccine Target: Glutathione S-Transferase from Schistosoma
japonica and its Complex with the Leading Antischistomal Drug Praziquantel. Journal of
Molecular Biology 246, 21-27.
81. Michaelis, L., Menten, M., (1913). Die kinetik der invertinwirkung Biochem Z 49: 333–
369.
82. Mkoji, G., Smith, J., Prichard, R., (1988). Antioxidant systems in Schistosoma mansoni:
evidence for their role in protection of the adult worms against oxidant killing.
International Journal for Parasitology 18, 667-673.
83. Mobley, D.L., Dill, K.A., (2009). Binding of small-molecule ligands to proteins:“what you
see” is not always “what you get”. Structure 17, 489-498.
84. Muhumuza, S., Kitimbo, G., Oryema‐Lalobo, M., Nuwaha, F., (2009). Association
between socio economic status and schistosomiasis infection in Jinja District, Uganda.
Tropical Medicine & International Health 14, 612-619.
85. Oakley, A.J., Bello, M.L., Nuccetelli, M., Mazzetti, A.P., Parker, M.W., (1999). The
ligandin (non-substrate) binding site of human pi class glutathione transferase is located in
the electrophile binding site (H-site). Journal of Molecular Biology 291, 913-926.
86. Ochs, R., (2010). The Problem with double reciprocal plots. Current Enzyme Inhibition 6,
164-169.
87. Otaki, J.M., Tsutsumi, M., Gotoh, T., Yamamoto, H., (2010). Secondary structure
characterization based on amino acid composition and availability in proteins. Journal of
Chemical Information and Modeling 50, 690-700.
88. Pearce, E.J., MacDonald, A.S., (2002). The immunobiology of schistosomiasis. Nature
Reviews Immunology 2, 499.
84
89. Peterson, W.P., von Lichtenberg, F., (1965). Studies on granuloma formation. IV: In
vivo antigenicity of schistosome egg antigen in lung tissue. The Journal of Immunology
95, 959-965.
90. Poli, G., Martinelli, A., Tuccinardi, T., (2016). Reliability analysis and optimization of
the consensus docking approach for the development of virtual screening studies. Journal
of Enzyme Inhibition and Medicinal Chemistry 31, 167-173.
91. Reich, M.R., Govindaraj, R., Dumbaugh, K., Yang, B.-m., Brinkmann, A., El-
Saharty, S., Organization, W.H., (1998). International Strategies for Tropical Disease
Treatments: Experiences with Praziquantel.
92. Ressurreição, M., Elbeyioglu, F., Kirk, R.S., Rollinson, D., Emery, A.M., Page, N.M.,
Walker, A.J., (2016). Molecular characterization of host-parasite cell signalling in
Schistosoma mansoni during early development. Scientific Reports 6, 35614.
93. Ricciardi, A., Ndao, M., (2015). Still hope for schistosomiasis vaccine. Human Vaccines
& Immunotherapeutics 11, 2504-2508.
94. Rollinson, D., (2009). A wake-up call for urinary schistosomiasis: reconciling research
effort with public health importance. Parasitology 136, 1593-1610.
95. Rufer, A.C., Thiebach, L., Baer, K., Klein, H.W., Hennig, M., (2005). X-ray structure
of glutathione S-transferase from Schistosoma japonicum in a new crystal form reveals
flexibility of the substrate-binding site. Acta Crystallographica Section F: Structural
Biology and Crystallization Communications 61, 263-265.
96. Saboury, A., (2009). Enzyme inhibition and activation: a general theory. Journal of the
Iranian Chemical Society 6, 219-229.
97. Sady, H., Al-Mekhlafi, H.M., Mahdy, M.A., Lim, Y.A., Mahmud, R., Surin, J., (2013).
Prevalence and associated factors of schistosomiasis among children in Yemen:
implications for an effective control programme. PLoS Neglected Tropical Diseases 7,
2377.
98. Salinas, A.E., Wong, M.G., (1999). Glutathione S-transferases-a review. Current
Medicinal Chemistry 6, 279-310.
99. Sayed, Y., Wallace, L.A., Dirr, H.W., (2000). The hydrophobic lock-and-key intersubunit
motif of glutathione transferase A1-1: implications for catalysis, ligandin function and
stability. FEBS letters 465, 169-172.
100. Schägger, H., (2006). Tricine–SDS-PAGE. Nature Protocols 1, 16-22.
101. Secor, W.E., (2012). The effects of schistosomiasis on HIV/AIDS infection, progression
and transmission. Current Opinion in HIV and AIDS 7, 254-259.
102. Segel, I.H., (1975). Enzyme kinetics: behaviour and analysis of rapid equilibrium and
steady state enzyme systems. Biochemistry and Molecular Biology Education 4, 16
103. Sheehan, D., Meade, G., Foley, V.M., Dowd, C.A., (2001). Structure, function and
evolution of glutathione transferases: implications for classification of non-mammalian
members of an ancient enzyme superfamily. Biochemical Journal 360, 1.
85
104. Sherman, W., Day, T., Jacobson, M.P., Friesner, R.A., Farid, R., (2006). Novel
procedure for modeling ligand/receptor induced fit effects. Journal of Medicinal Chemistry
49, 534-553.
105. Smith, D.B., Rubira, M.R., Simpson, R.J., Davern, K.M., Tiu, W.U., Board, P.G.,
Mitchell, G.F., (1988). Expression of an enzymatically active parasite molecule in
Escherichia coli: Schistosoma japonicum glutathione S-transferase. Molecular and
Biochemical Parasitology 27, 249-256.
106. Sousa, S.F., Fernandes, P.A., Ramos, M.J., (2006). Protein–ligand docking: current
status and future challenges. Proteins: Structure, Function, and Bioinformatics 65, 15-26.
107. Southgate, V., (1997). Schistosomiasis in the Senegal River Basin: before and after the
construction of the dams at Diama, Senegal and Manantali, Mali and future prospects.
Journal of Helminthology 71, 125-132.
108. Srivani, P., Srinivas, E., Raghu, R., Sastry, G.N., (2007). Molecular modeling studies of
pyridopurinone derivatives—potential phosphodiesterase 5 inhibitors. Journal of
Molecular Graphics and Modelling 26, 378-390.
109. Srivastava, H.K., Sastry, G.N., (2012). Molecular dynamics investigation on a series of
HIV protease inhibitors: assessing the performance of MM-PBSA and MM-GBSA
approaches. Journal of Chemical Information and Modeling 52, 3088-3098.
110. Stefanidis, L., Scinto, K.V., Strada, M.I., Alper, B.J., (2018). Bisubstrate Kinetics of
Glutathione S-Transferase: A Colorimetric Experiment for the Introductory Biochemistry
Laboratory. Journal of Chemical Education.
111. Sun, H., Li, Y., Tian, S., Xu, L., Hou, T., (2014). Assessing the performance of
MM/PBSA and MM/GBSA methods. 4. Accuracies of MM/PBSA and MM/GBSA
methodologies evaluated by various simulation protocols using PDBbind data set. Physical
Chemistry Chemical Physics 16, 16719-16729.
112. Tame, J.R., (2005). Scoring functions–the first 100 years. Journal of Computer-Aided
Molecular Design 19, 445-451.
113. Teague, S.J., (2003). Implications of protein flexibility for drug discovery. Nature Reviews
Drug Discovery 2, 527.
114. Torres, A., Landa, A., (2008). Glutathione transferases from parasites: a biochemical
view. Acta Tropica 105, 99-112.
115. van Bladeren, P.J., van Ommen, B., (1991). The inhibition of glutathione S-transferases:
mechanisms, toxic consequences and therapeutic benefits. Pharmacology & Therapeutics
51, 35-46.
116. van der Werf, M.J., de Vlas, S.J., Brooker, S., Looman, C.W., Nagelkerke, N.J.,
Habbema, J.D.F., Engels, D., (2003). Quantification of clinical morbidity associated with
schistosome infection in sub-Saharan Africa. Acta Tropica 86, 125-139.
117. Walker, J., Crowley, P., Moreman, A.D., Barrett, J., (1993). Biochemical properties of
cloned glutathione S-transferases from Schistosoma mansoni and Schistosoma japonicum.
Molecular and Biochemical Parasitology 61, 255-264.
86
118. Wami, W.M., (2015). Paediatric Schistosomiasis: diagnosis, morbidity and
treatment.(PhD Dissertation)
119. Wang, W., Wang, L., Liang, Y.S., (2012). Susceptibility or resistance of praziquantel in
human schistosomiasis: a review. Parasitology Research 111, 1871-1877.
120. Ware, S., Donahue, J. P., Hawiger, J., Anderson, W. F., (1999). Structure of the
fibrinogen γ-chain integrin binding and factor XIIIa cross-linking sites obtained through
carrier protein driven crystallization. Protein Science, 8(12), 2663-2671.
121. Whitmore, L., Wallace, B., (2004). DICHROWEB, an online server for protein secondary
structure analyses from circular dichroism spectroscopic data. Nucleic Acids Research 32,
668-673.
122. WHO, (2013). Schistosomiasis: progress report 2001-2011, strategic plan 2012-2020.
123. WHO, (2017). Crossing the billion: lymphatic filariasis, onchocerciasis, schistosomiasis,
soil-transmitted helminthiases and trachoma: preventive chemotherapy for neglected
tropical diseases.
124. Wilce, M.C., Parker, M.W., (1994). Structure and function of glutathione S-transferases.
Biochimica et Biophysica Acta (BBA)-Protein Structure and Molecular Enzymology 1205,
1-18.
125. Wong, S.E., Lightstone, F.C., (2011). Accounting for water molecules in drug design.
Expert Opinion on Drug Discovery 6, 65-74.
126. Yalçin, S., Jensson, H., Mannervik, B., (1983). A set of inhibitors for discrimination
between the basic isozymes of glutathione transferase in rat liver. Biochemical and
Biophysical Research Communications 114, 829-834.
127. Yassin, Z., Ortiz-Salmerón, E., Garcı́a-Maroto, F., Barón, C., Garcı́a-Fuentes, L.,
(2004). Implications of the ligandin binding site on the binding of non-substrate ligands to
Schistosoma japonicum-glutathione transferase. Biochimica et Biophysica Acta (BBA)-
Proteins and Proteomics 1698, 227-237.
128. Zelck, U., Von Janowsky, B., (2004). Antioxidant enzymes in intramolluscan
Schistosoma mansoni and ROS-induced changes in expression. Parasitology 128, 493-
501.
129. Zhou, X.-N., Wang, L.-Y., Chen, M.-G., Wu, X.-H., Jiang, Q.-W., Chen, X.-Y., Zheng,
J., Jürg, U., (2005). The public health significance and control of schistosomiasis in
China—then and now. Acta Tropica 96, 97-105.

87
APPENDIX
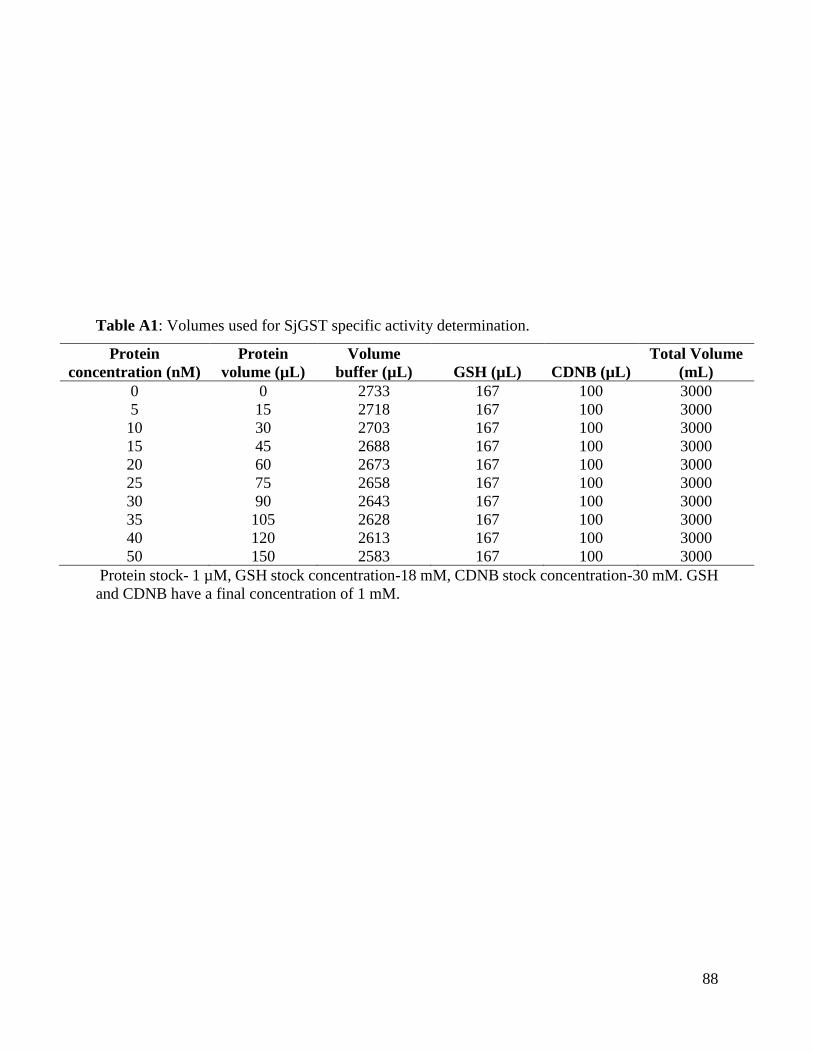
88
Table A1: Volumes used for SjGST specific activity determination.
Protein
concentration (nM)
Protein
volume (µL)
Volume
buffer (µL) GSH (µL) CDNB (µL)
Total Volume
(mL)
0 0 2733 167 100 3000
5 15 2718 167 100 3000
10 30 2703 167 100 3000
15 45 2688 167 100 3000
20 60 2673 167 100 3000
25 75 2658 167 100 3000
30 90 2643 167 100 3000
35 105 2628 167 100 3000
40 120 2613 167 100 3000
50 150 2583 167 100 3000
Protein stock- 1 µM, GSH stock concentration-18 mM, CDNB stock concentration-30 mM. GSH
and CDNB have a final concentration of 1 mM.
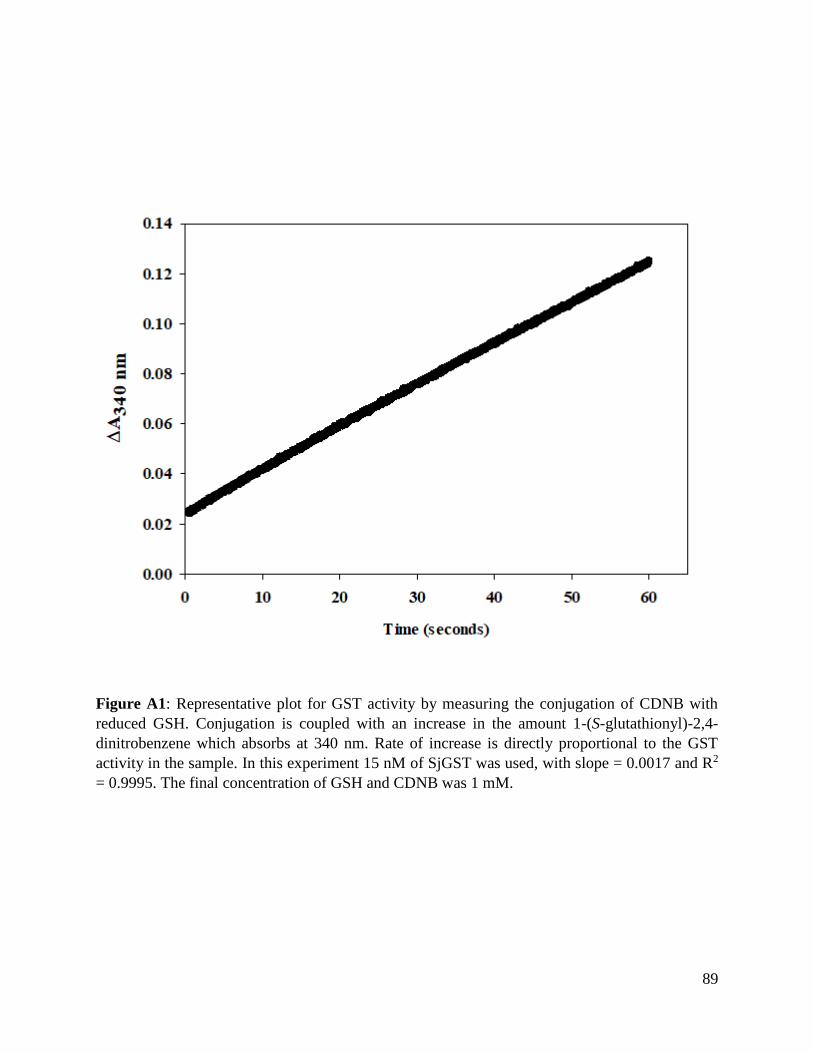
89
Figure A1: Representative plot for GST activity by measuring the conjugation of CDNB with
reduced GSH. Conjugation is coupled with an increase in the amount 1-(S-glutathionyl)-2,4-
dinitrobenzene which absorbs at 340 nm. Rate of increase is directly proportional to the GST
activity in the sample. In this experiment 15 nM of SjGST was used, with slope = 0.0017 and R2
= 0.9995. The final concentration of GSH and CDNB was 1 mM.
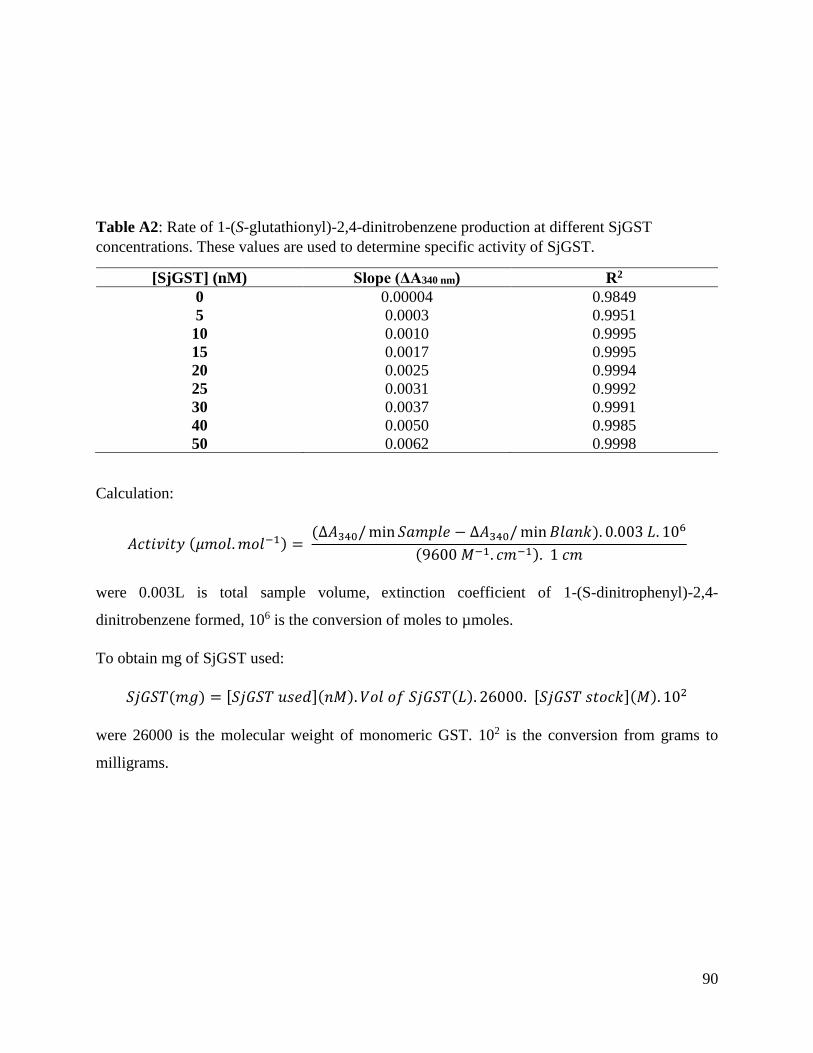
90
Table A2: Rate of 1-(S-glutathionyl)-2,4-dinitrobenzene production at different SjGST
concentrations. These values are used to determine specific activity of SjGST.
[SjGST] (nM) Slope (ΔA340 nm) R2
0 0.00004 0.9849
5 0.0003 0.9951
10 0.0010 0.9995
15 0.0017 0.9995
20 0.0025 0.9994
25 0.0031 0.9992
30 0.0037 0.9991
40 0.0050 0.9985
50 0.0062 0.9998
Calculation:
𝐴𝑐𝑡𝑖𝑣𝑖𝑡𝑦 (𝜇𝑚𝑜𝑙. 𝑚𝑜𝑙−1) = (∆𝐴340/ min 𝑆𝑎𝑚𝑝𝑙𝑒 − ∆𝐴340/ min 𝐵𝑙𝑎𝑛𝑘). 0.003 𝐿. 106
(9600 𝑀−1. 𝑐𝑚−1). 1 𝑐𝑚
were 0.003L is total sample volume, extinction coefficient of 1-(S-dinitrophenyl)-2,4-
dinitrobenzene formed, 106 is the conversion of moles to µmoles.
To obtain mg of SjGST used:
𝑆𝑗𝐺𝑆𝑇(𝑚𝑔) = [𝑆𝑗𝐺𝑆𝑇 𝑢𝑠𝑒𝑑](𝑛𝑀). 𝑉𝑜𝑙 𝑜𝑓 𝑆𝑗𝐺𝑆𝑇(𝐿). 26000. [𝑆𝑗𝐺𝑆𝑇 𝑠𝑡𝑜𝑐𝑘](𝑀). 102
were 26000 is the molecular weight of monomeric GST. 102 is the conversion from grams to
milligrams.

91