initial characterization of murine epidermal lgr6+ stem cells
TRANSCRIPT

Initial characterization of murine epidermal
Lgr6+ stem cells
Armando Nicolás Bastidas Torres
Leiden University
Master in Life Science and Technology Research and Development
January 2013 – November 2013
Leiden University Medical Center (LUMC)
Dermatology Department

Initial characterization of murine epidermal lgr6+ stem cells
Page 2
Title page
Title: Transcriptomic characterization of murine epidermal stem cells
Author: Armando Nicolás Bastidas Torres
Student Number: s1125354
University: Leiden University
Faculty: Science
Department: Leiden Institute of Chemistry
Program: Master in Life Science and Technology
Specialization: Research and Development
Group: Molecular Genetics
Mentor: Prof. Dr. Mathieu Noteborn
Internship location: Leiden University Medical Center
Internship department: Dermatology
Internship period: January 2013 – November 2013
Internship supervisors: GC van de Glind (MSc) and Dr. C.P. Tensen

Initial characterization of murine epidermal lgr6+ stem cells
Page 3
List of Abbreviations
ASC BMP Cyc1 CSC Ddx52 eGFP EGF FACS FGF Fz GPCR Hh Hprt1 Lgr4 Lgr5 Lgr6 LGR6 LRP PE RSPO TAC Tfip11 TGFβ WT
adult stem cell bone morphogenetic protein cytochrome 1 cancer stem cell DEAD (Asp-Glu-Ala-Asp) box polypeptide 52 enhanced green fluorescent protein epidermal growth factor flow cytometry-assisted cell sorting fibroblast growth factor frizzled receptor G protein-coupled receptor Hedgehog hypoxanthine phosphoribosyltransferase 1 murine leucine‐rich‐repeat‐containing G‐protein‐couple receptor 4 murine leucine‐rich‐repeat‐containing G‐protein‐couple receptor 5 murine leucine‐rich‐repeat‐containing G‐protein‐couple receptor 6 human leucine‐rich‐repeat‐containing G‐protein‐couple receptor 6 lipoprotein receptor-related protein Phycoerythrin R-spondin transit-amplifying cell tuftelin interacting protein 11 tumor growth factor beta wild type

Initial characterization of murine epidermal lgr6+ stem cells
Page 4
Summary
Adult stem cells (ASCs) are undifferentiated cells that replace damaged and dead cells in organs. ASCs
have recently being hypothesized as initiators of cancer due to their long residence time in the body
which might allow them to accumulate more mutations and epigenetic abnormalities than mature cells.
In the murine skin, the 7-TM protein Lgr6 marks an ASC population residing in the hair follicle (HF)
capable of producing all skin cell lineages in homeostasis and wound healing. Lgr proteins are
characterized by a leucine-rich repeat containing N-terminal domain, and are known to enhance Wnt
pathway activation. The role of Lgr6 in physiology remains unknown but its high homology with Lgr4 and
5 suggests it might be important in embryonic development. Remarkably, transgenic mice reported as
null for Lgr6 due to the disruption of this locus with an EGFP-Ires-CreERT2 construct are viable and
fertile. In this study, we assessed the presence of Lgr6 transcripts in frozen skin samples and sorted
epidermal cell populations from homozygous and heterozygous Lgr6 knock-in mice by RT-qPCR.
Additionally, Wnt pathway activation was evaluated in basal layer Lgr6- and Lgr6+ cells by detecting Wnt
pathway target genes (Cyclin D1 and Myc) and Axin2, a signal transduction component of the pathway.
Finally, the expression of three other epidermal stem cell markers (Gli1, Lrig1 and Plet1) was assessed in
the basal layer Lgr6- and Lgr6+ keratinocytes. The results showed that unlike reported; Lgr6 is expressed
in homozygous and heterozygous Lgr6 knock-in mice. However, the homozygous knock-in animals seem
to express variant(s) of Lgr6 that lack exon 1. The Wnt pathway was shown to be slightly upregulated in
the basal layer Lgr6+ cells compared to their negative counterparts based on Axin2 and Cyclin D1
expression. Finally, Gli1 expression was found to be higher in basal layer Lgr6+ cells compared to the
Lgr6- population, suggesting this marker might be a suitable alternative for the identification of skin
stem cells.

Initial characterization of murine epidermal lgr6+ stem cells
Page 5
Table of contents
Contents Chapter 1: Introduction ................................................................................................................................ 7
1.1. Adult stem cells and their role in skin maintenance .......................................................................... 7
1.2. Lgr6 as a marker for epidermal adult stem cells ................................................................................ 8
1.3. Lgr family of proteins: Structure and Signaling Role .......................................................................... 9
1.4. Adult Stem Cells and the Cancer Stem Cell Theory ......................................................................... 10
1.5. Evidence for putative role of Lgr6 in cancer .................................................................................... 10
Chapter 2: Materials and Methods ............................................................................................................. 12
2.1. Biological material............................................................................................................................ 12
2.2. Primer design and primer efficiency testing .................................................................................... 12
2.3. RNA isolation and reverse transcription .......................................................................................... 12
2.4. qPCR: Gene expression analysis ....................................................................................................... 13
2.5. Cell suspension preparation, antibody labeling and FACS sorting .................................................. 13
2.6. RNA precipitation, library preparation and RNA deep sequencing ................................................. 13
Chapter 3: Results ....................................................................................................................................... 15
3.1. Lgr6 expression in homozygous and heterozygous Lgr6 knock-in mice .......................................... 15
3.2. Visualization of eGFP+ cells in keratinocyte suspensions by immunocytochemistry ...................... 16
3.3. FACS-mediated isolation of Lgr6+ and Lgr6- basal layer epidermal cells from Lgr6 knock-in hairless
mice ......................................................................................................................................................... 16
3.4. Lgr6 expression in FACS-isolated cell populations from homozygous and heterozygous Lgr6 knock-
in mice ..................................................................................................................................................... 18
3.5. Wnt pathway activation in Lgr6+ and Lgr6- basal layer epidermal cells from Lgr6 knock-in hairless
mice ......................................................................................................................................................... 18
3.6. Expression of additional stem cell markers in Lgr6+ and Lgr6- basal layer epidermal cells from Lgr6
knock-in hairless mice ............................................................................................................................. 19
Chapter 4: Discussion and conclusion......................................................................................................... 20
4.1. Lgr6 expression in homozygous and heterozygous Lgr6 knock-in mice .......................................... 20
4.2. FACS-mediated isolation of Lgr6+ and Lgr6- basal layer epidermal cells from Lgr6 knock-in hairless
mice ......................................................................................................................................................... 20

Initial characterization of murine epidermal lgr6+ stem cells
Page 6
4.3. Wnt pathway activation in basal layer Lgr6+ and Lgr6- epidermal cells from Lgr6 knock-in hairless
mice ......................................................................................................................................................... 21
4.4. Expression of additional stem cell markers in Lgr6+ and Lgr6- basal layer epidermal cells from Lgr6
knock-in hairless mice ............................................................................................................................. 22
4.5. Overall conclusion and Future Plans ................................................................................................ 22
Chapter 5: Acknowledgements ................................................................................................................... 24
Chapter 6: References ................................................................................................................................. 25
Appendix 1: Scheme of eGFP-Ires-CreERT2 construct inserted in the Lgr6 locus ...................................... 26
Appendix 2: Primers .................................................................................................................................... 26
A2.1. Primers used for Lgr6 detection in murine material ..................................................................... 26
A2.2. Primers used for the detection of Wnt pathway activation markers in murine material ............. 27
A2.3. Primers used for the detection of stem cell markers in murine material ..................................... 29
Appendix 3: RNA extraction and precipitation ........................................................................................... 30
A3.1. RNeasy mini kit (Qiagen) ............................................................................................................... 30
A3.2. Ethanol-based RNA precipitation protocol .................................................................................... 34
Appendix 4: Reverse transcription and qPCR ............................................................................................. 34
A4.1. Reverse transcripton with iScript cDNA synthesis kit (Bio-Rad) .................................................... 34
A4.2. RT-qPCR protocol with iQ SYBR Green Supermix (Bio-Rad) .......................................................... 35
Appendix 5: Isolation and staining of epidermal cells ................................................................................ 35
A5.1. Adult mouse epidermis suspension protocol* .............................................................................. 35
A5.2. Staining of cell suspensions with CD49f antibody for FACS .......................................................... 37
A5.3. Immunocytochemistry on cytospins ............................................................................................. 37
Levamisol .................................................................................................................................................... 39
Appendix 6: Detailed information of samples used for RNA deep sequencing .......................................... 39
A6.1. Concentration, purity and integrity values of RNA samples before combination ........................ 39
A6.2. List of combined RNA samples ...................................................................................................... 39
Appendix 7: Detailed information of samples used for RNA deep sequencing .......................................... 40
A7.1. RNA quality results: RIN score, rRNA ratio and virtual gel ............................................................ 40
Initial characterization of murine epidermal lgr6+ stem cells
Page 7
Chapter 1: Introduction
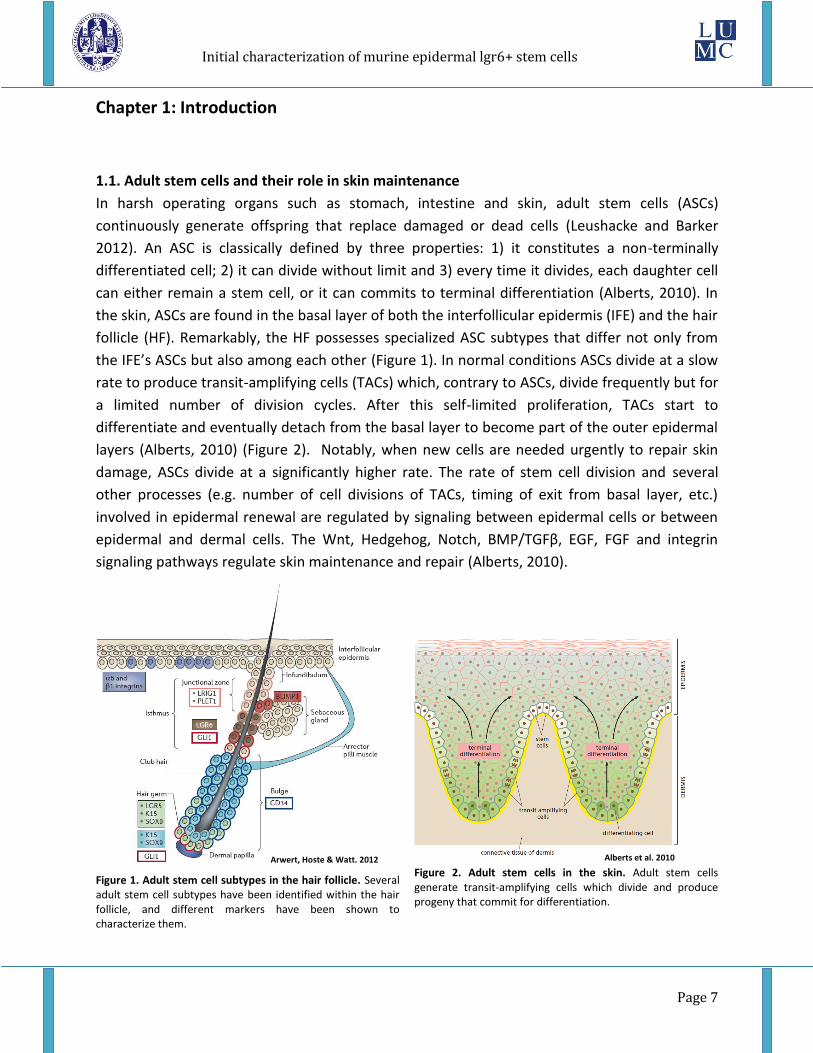
1.1. Adult stem cells and their role in skin maintenance
In harsh operating organs such as stomach, intestine and skin, adult stem cells (ASCs)
continuously generate offspring that replace damaged or dead cells (Leushacke and Barker
2012). An ASC is classically defined by three properties: 1) it constitutes a non-terminally
differentiated cell; 2) it can divide without limit and 3) every time it divides, each daughter cell
can either remain a stem cell, or it can commits to terminal differentiation (Alberts, 2010). In
the skin, ASCs are found in the basal layer of both the interfollicular epidermis (IFE) and the hair
follicle (HF). Remarkably, the HF possesses specialized ASC subtypes that differ not only from
the IFE’s ASCs but also among each other (Figure 1). In normal conditions ASCs divide at a slow
rate to produce transit-amplifying cells (TACs) which, contrary to ASCs, divide frequently but for
a limited number of division cycles. After this self-limited proliferation, TACs start to
differentiate and eventually detach from the basal layer to become part of the outer epidermal
layers (Alberts, 2010) (Figure 2). Notably, when new cells are needed urgently to repair skin
damage, ASCs divide at a significantly higher rate. The rate of stem cell division and several
other processes (e.g. number of cell divisions of TACs, timing of exit from basal layer, etc.)
involved in epidermal renewal are regulated by signaling between epidermal cells or between
epidermal and dermal cells. The Wnt, Hedgehog, Notch, BMP/TGFβ, EGF, FGF and integrin
signaling pathways regulate skin maintenance and repair (Alberts, 2010).
Figure 1. Adult stem cell subtypes in the hair follicle. Several adult stem cell subtypes have been identified within the hair follicle, and different markers have been shown to characterize them.
Figure 2. Adult stem cells in the skin. Adult stem cells generate transit-amplifying cells which divide and produce progeny that commit for differentiation.
Arwert, Hoste & Watt. 2012 Alberts et al. 2010

Initial characterization of murine epidermal lgr6+ stem cells
Page 8
1.2. Lgr6 as a marker for epidermal adult stem cells
In mouse skin, the surface protein Lgr6 (Leucine‐rich‐repeat‐containing G‐protein‐couple
receptor 6) has been shown to mark ASCs capable of producing all skin lineages, including those
originating the upper part of the hair follicle, sebaceous gland and IFE. Snippert et al (2010)
demonstrated Lgr6+ cells reside at the central isthmus of the hair follicle (Figure 3A), and
contribute to skin wound repair using mouse models (Figure 3B). Although the role of Lgr6 as a
skin stem cell marker is now well-supported, its potential role in stem cell physiology is still
unknown. As other members of the Lgr family of proteins (e.g. Lgr4 and Lgr5) have already been
proven to enhance Wnt signaling, a similar role for Lgr6 seems likely (Gong et al. 2012). In fact,
Lgr6 has already been shown to have a positive effect on Wnt/β-catenin signalling in HEK293
cell lines; though this effect was modest compared to Lgr4 and 5 (Gong et al. 2012). Despite
this, other authors have disesteemed a potential role of Lgr6 in Wnt signalling since Lgr6+ cells
are thought to reside in a Wnt-independent niche of the HF (Snippert et al. 2010, Fuchs and
Horsley 2008). This apparent contradiction between functional and histological evidence
reflects the need for further research on the role of Lgr6 in stem cell biology.
Figure 3. Lgr6+ cell niche and their role in wound healing. A) Lgr6+ cells are located at the isthmus in the hair follicle B) Lgr6+ cells have been shown to participate in wound healing, by producing cell lineages for repairing epidermal wounds.
A B
Leushacke & Barker. 2012
Initial characterization of murine epidermal lgr6+ stem cells
Page 9
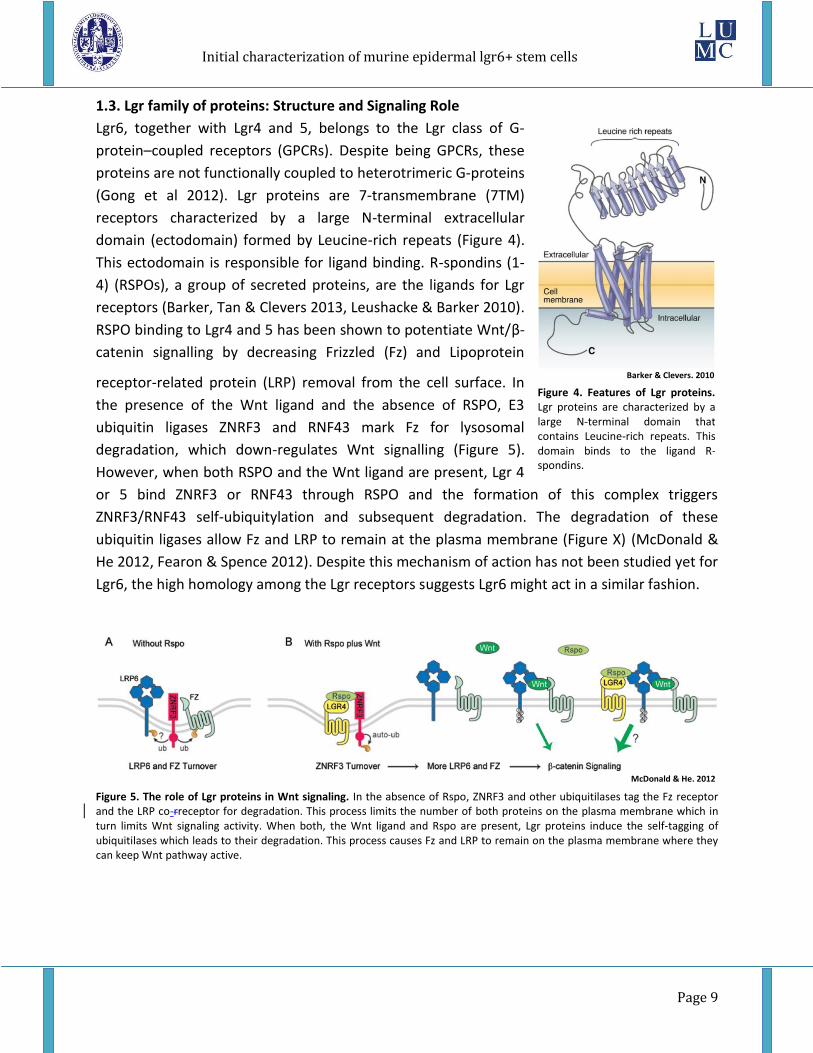
1.3. Lgr family of proteins: Structure and Signaling Role
Lgr6, together with Lgr4 and 5, belongs to the Lgr class of G-
protein–coupled receptors (GPCRs). Despite being GPCRs, these
proteins are not functionally coupled to heterotrimeric G-proteins
(Gong et al 2012). Lgr proteins are 7-transmembrane (7TM)
receptors characterized by a large N-terminal extracellular
domain (ectodomain) formed by Leucine-rich repeats (Figure 4).
This ectodomain is responsible for ligand binding. R-spondins (1-
4) (RSPOs), a group of secreted proteins, are the ligands for Lgr
receptors (Barker, Tan & Clevers 2013, Leushacke & Barker 2010).
RSPO binding to Lgr4 and 5 has been shown to potentiate Wnt/β-
catenin signalling by decreasing Frizzled (Fz) and Lipoprotein
receptor-related protein (LRP) removal from the cell surface. In
the presence of the Wnt ligand and the absence of RSPO, E3
ubiquitin ligases ZNRF3 and RNF43 mark Fz for lysosomal
degradation, which down-regulates Wnt signalling (Figure 5).
However, when both RSPO and the Wnt ligand are present, Lgr 4
or 5 bind ZNRF3 or RNF43 through RSPO and the formation of this complex triggers
ZNRF3/RNF43 self-ubiquitylation and subsequent degradation. The degradation of these
ubiquitin ligases allow Fz and LRP to remain at the plasma membrane (Figure X) (McDonald &
He 2012, Fearon & Spence 2012). Despite this mechanism of action has not been studied yet for
Lgr6, the high homology among the Lgr receptors suggests Lgr6 might act in a similar fashion.
Figure 5. The role of Lgr proteins in Wnt signaling. In the absence of Rspo, ZNRF3 and other ubiquitilases tag the Fz receptor and the LRP co-rreceptor for degradation. This process limits the number of both proteins on the plasma membrane which in turn limits Wnt signaling activity. When both, the Wnt ligand and Rspo are present, Lgr proteins induce the self-tagging of ubiquitilases which leads to their degradation. This process causes Fz and LRP to remain on the plasma membrane where they can keep Wnt pathway active.
Figure 4. Features of Lgr proteins. Lgr proteins are characterized by a large N-terminal domain that contains Leucine-rich repeats. This domain binds to the ligand R-spondins.
Barker & Clevers. 2010
McDonald & He. 2012

Initial characterization of murine epidermal lgr6+ stem cells
Page 10
1.4. Adult Stem Cells and the Cancer Stem Cell Theory
The cancer stem cell (CSC) theory proposes that tumorigenesis is driven by a subpopulation of
neoplastic cells endowed with stem cell-like properties. Theoretically, CSCs can originate either
from deregulated ASCs (Figure 6) or from differentiated cells which have reactivated embryonic
pathways (Wnt, Hedgehog, Notch, etc). In rapidly-renewing tissues (e.g. skin, stomach and
intestine) cancer is thought to be initiated and maintained by ASCs since their longevity and
intrinsic self-renewal capacity might allow them to accumulate many more genetic and
epigenetic abnormalities than their shortly-lived differentiating counterparts (Baccelli &
Trumpp 2012, Blanpain 2013). If true, Lgr6 might allow us to identify not only ASCs in skin, but
also the cell population responsible for skin cancer development.
Figure 6. The cancer stem cell theory. Stem cells are believed to initiate (some) cancers as they are stably maintained in time within tissues, and consequently, are more likely to accumulate mutations and epigenetic abnormalities. Moreover, the intrinsic self-renewal capacity of stem cells might contribute to cancer maintenance.
1.5. Evidence for putative role of Lgr6 in cancer
There is evidence that LGR6 is frequently mutated in human colon, ovary and pancreatic cancer
which suggests it might have a relevant role in tumorigenesis (Gong et al. 2012). Moreover, the
known link between Lgr proteins and the Wnt pathway provides a potential connection
between the functional alteration of LGR6 and cancer. Interestingly, some studies link LGR6 to
human cancer as a tumor suppressor (Gong et al. 2012), while others have reported
Jordan et al. 2006

Initial characterization of murine epidermal lgr6+ stem cells
Page 11
circumstantial evidence that suggest its role as an oncogene (Steffen et al 2012). Loss-of-
function mutations and promoter hypermethylation, which have been found at the LGR6 locus
in colon cancer, support the former role; while a statistically significant correlation between
LGR6 up-regulation and increased local tumor growth in gastric cancer patients, supports the
latter one (Steffen et al 2012).
Regardless of what is true, this evidence suggests LGR6 as a functional factor in human cancer.
This study represents a first effort to characterize Lgr6+ epidermal cells from the murine
epidermis. Since several cancers are believed to be initiated by stem cells (Gong et al. 2012),
data linking Lgr6 with cancer could mean that Lgr6+ cells are in fact cancer initiating cells in the
skin. The proteomic and transcriptomic characterization of murine Lgr6+ cells might reveal
important information about their potential role as cancer stem cells. This information could
serve as the starting point for future characterization of LGR6+ cells in human skin.

Initial characterization of murine epidermal lgr6+ stem cells
Page 12
Chapter 2: Materials and Methods
2.1. Biological material
The LUMC’s dermatology department possesses heterozygous and homozygous knock-in Lgr6
mouse strains in which Lgr6 has been either singly (Lgr6+/-) or doubly (Lgr6-/-) disrupted by an
eGFP (enhanced Green Fluorescent Protein) construct, respectively (see Appendix 1). These
animals were originally developed for lineage tracing of Lgr6+ cells which are currently
regarded as epidermal stem cells. Despite Lgr6 disruption, both mouse strains show normal
phenotype and behavior. Frozen total skin and FACS-sorted epidermal cells from both
transgenic genotypes were used for gene expression experiments whereas only FACS-sorted
epidermal cells were used for RNA deep sequencing.
2.2. Primer design and primer efficiency testing
Primers employed for RT-qPCR applications met the following criteria: 1) primer length: 18-22
nucleotides, 2) melting temperature: ~60°C, 3) GC content: 40-60% and 4) Absence of 3’end GC
clamp, single base-long runs and di-nucleotide repeats. Primer sequences were designed using
the Primer3 v0.4.0 (Rozen S. and Skaletsky 2006) and NCBI’s Primer-Blast (Ye et al. 2012) online
tools, and their specificity was predicted by using NCBI’s Refseq mRNA database. Finally, primer
sets exhibiting single specificity for the intended target or the fewest possible cross-
amplification were purchased from Sigma-Aldrich (see Appendix 2). Primers designed for
mouse material were tested for efficiency on cDNA synthesized from a mixture of murine total
RNA derived from UV-irradiated and un-irradiated hairless skin, haired skin and tumors.
Reference cDNA was 2-fold serially diluted until 1/128 of its original concentration. Serial
dilutions were used as template for primer efficiency reactions. Efficiency values for all primer
sets were obtained by using the standard curve application of the CFX Manager software (Bio-
Rad).
2.3. RNA isolation and reverse transcription
Total RNA from both frozen skin and sorted cells was extracted by using RNeasy Mini kit
(Qiagen, Cat No. 74106). To ensure high RNA purity, samples were subjected to on-membrane
DNAse I digestion. RNA extraction was executed according to the manufacturer’s instructions
(see Appendix 3). All samples were eluted in 35 µl of RNAse-free water. RNA concentration
(absorbance at 260 nm) and purity (260/280 and 260/230 ratios) were determined using a
Nanodrop 1000 spectrophotometer (Thermo Scientific). In addition, samples meant for RNA
deep sequencing were subjected to on-chip-electrophoresis (RNA Pico Chip, Agilent
Technologies) to determine RNA integrity. Only RIN scores above 8 were selected. For qPCR

Initial characterization of murine epidermal lgr6+ stem cells
Page 13
applications cDNA was generated from total RNA by using iScript cDNA Synthesis kit (Bio-Rad,
Cat No. 170-8891) (see Appendix 4).
2.4. qPCR: Gene expression analysis
The relative expression of genes of interest was determined by RT-qPCR. Every experiment
included a positive control (reference cDNA) and a non-template control (water). In addition,
experiments for Lgr6 detection in mouse frozen skin also included reverse transcriptase
negative (RTneg) controls for every sample. RTneg controls are samples that do not receive RT
as part of the cDNA synthesis reaction mix, but are processed just like RT-containing samples.
Hypoxanthine phosphoribosyltransferase 1 (Hprt1), DEAD (Asp-Glu-Ala-Asp) box polypeptide 52
(Ddx52), cytochrome c-1 (Cyc1) and Tuftelin interacting protein 11 (Tfip11), which were
previously proven to be stably expressed in murine samples (Hoeboer S. 2011), were used as
reference genes. The CFX384 Real Time System (Bio-Rad) was employed for RT-qPCR
amplification. PCR reactions were performed in 384-well plates. Each well contained iQ SYBR
Green Supermix (Bio-Rad), the template (sample or control) and a specific primer set. The total
reaction volume was 7 µl (see Appendix 4). Finally, data were processed as gene expression
analyses by using Bio-Rad’s CFX manager 2.0 software (Bustin et al. 2012, VanGuilder, Vrana &
Freeman 2006, Udvardi, Czechowski & Scheible. 2008, Nolan Hands & Bustin 2006)
.
2.5. Cell suspension preparation, antibody labeling and FACS sorting
Epidermal cell suspensions were obtained by trypsin digestion. A modified version of the
protocol described by Jansen et al. (2010) (see Appendix 5) was implemented. Prior to the use
of the suspensions for FACS, the effectiveness of this protocol for Lgr6+ cell isolation was
verified by staining cells with an anti-eGFP antibody and visualizing them with a microscope.
eGFP staining was performed according to protocol HEG-93 of the Dermatology department
(see Appendix 5). For FACS, cell suspensions were stained with PE-conjugated anti-α6-integrin
(6μl per 106 cells, CD49f clone GoH3, BD) for 1 hour at 4°C. Cells were sorted on the basis of
single cellularity, viability and both eGFP and CD49f status. A FACSAria III cell sorter (BD
Bioscience) was used for the isolation of PE+/eGFP-and PE+/ eGFP+ cells from cell suspensions.
Nozzle size and sheath pressure were 85 μm and 45 p.s.i, respectively. Sorted cells were
collected in sheath fluid. The FlowJo software was used to obtain FACS plots from the raw data.
In every experiment, RNA extraction was performed right after cell sorting.
2.6. RNA precipitation, library preparation and RNA deep sequencing
Every sample used for sequencing contained approximately 450 ng of total RNA from 2
individuals (a male and a female) bearing the same transgene zygosity, (see Appendix 6). The

Initial characterization of murine epidermal lgr6+ stem cells
Page 14
combined RNA samples were brought to a final volume of 10 μl by ethanol-mediated
precipitation and subsequent resuspension in RNA-free water (see Appendix 3). Library
preparation and sequencing were performed by staff from the Leiden Genomic Technology
Center (LGTC). The former involved the use of the Ribo-zero magnetic kit for rRNA depletion
while the latter was performed on an Illumina HiSeq-2000 (paired-end 2x100 bp with sample
index on version 3 flowcells and reagents).

Initial characterization of murine epidermal lgr6+ stem cells
Page 15
Chapter 3: Results
3.1. Lgr6 expression in homozygous and heterozygous Lgr6 knock-in mice
In mammals, intended or incidental disruption of physiologically relevant genes leads to
developmental alterations that range from embryonic lethality to abnormal phenotype. The
GPCR Lgr6 is presumed to be important for cell functioning as other members of the Lgr protein
family (e.g. Lgr4 and Lgr5) are known to play active roles in embryonic development.
Surprisingly, homozygous and heterozygous Lgr6 knock-in mice developed by Snippert et al.
appear to be healthy and fertile, despite their Lgr6 alleles are supposedly null due to EGFP-Ires-
CreERT2 integration. To verify the transcriptional status of Lgr6 in both knock-in strains, primers
annealing on different exon combinations (e.g. 17/18, 4/5, 3/4, 2/3, 1/3, and 1/2) were
developed. After testing the efficiency of all primer sets on reference cDNA (see materials and
methods), only those with scores between 80% and 105% were used for Lgr6 detection. Two
heterozygous (2031 and 4123) and two homozygous (1782 and 1803) Lgr6 Knock-in individuals
were included in the assays. Additionally, two wild type (WT) individuals (a haired (Bl6) and a
hairless (SKH) mouse) were included as control samples in every experiment. As shown in
Figure 7, Lgr6 was detected not only in the controls but also in both Lgr6 knock-in genotypes by
using primers for exons 3/4 and exons 4/5 (data not shown). Since Lgr6 disruption had been
reported to occur between the 5’-UTR and the coding part of exon 1, Lgr6 transcripts in
homozygous knock-in animals most probably are variants that lack exon 1. To assess the
presence of exon 1 in transcripts from both genotypes, two primer sets annealing on exons 1
and 2 were used for Lgr6 detection. Figure 7B and 7C show that the heterozygous knock-in
animals express transcripts that contain exon 1, whereas no transcripts are detected in the
homozygous knock-in individuals.
Lgr6-Ex3/4
No
rmalized
fo
ld e
xp
ressio
n
0.0
0.5
1.0
1.5
2.0
2.5
2031 4123 18031782 Bl6 SKH
Lgr6-Ex1/2a
No
rmalized
fo
ld e
xp
ressio
n
0.0
0.5
1.0
1.5
2.0
2.5
2031 4123 18031782 Bl6 SKH
Lgr6-Ex1/2b
No
rmalized
fo
ld e
xp
ressio
n
0.0
0.5
1.0
1.5
2.0
2.5
2031 4123 18031782 Bl6 SKH
Figure 7. Lgr6 detection in frozen skin samples from homozygous and heterozygous Lgr6 knock-in mice by using different primer sets annealing on different exon combinations. A) A primer set annealing on exon 3 and 4 reveals Lgr6 expression in heterozygous knock-in (2031 and 4123), homozygous knock-in (1782 and 1803) and wild type (Bl6 and SKH) mice. B) and C) Primer sets annealing on exons 1 and 2 are able to detect Lgr6 expression in the heterozygous knock-in and wild type individuals. However, Lgr6 signal is lost for the homozygous knock-in animals.
A B C

Initial characterization of murine epidermal lgr6+ stem cells
Page 16
3.2. Visualization of eGFP+ cells in keratinocyte suspensions by immunocytochemistry
A trypsin-based protocol for the preparation of keratinocyte suspensions from the epidermis of
hairless mice was implemented for FACS-mediated isolation of Lgr6+ and lgr6- basal layer cells
(see materials and methods). The presence of eGFP+ cells in epidermal cell suspensions was
assessed by immunocytochemistry prior to the start of the FACS experiments. Since the
protocol used for eGFP staining was originally designed for paraffin sections and not for cell
suspensions, three different fixatives (acetone, formaldehyde and methanol) were tested in the
experiment. The formaldehyde-mediated staining revealed numerous eGFP+ cells in the
samples (Figure 8A), while the other two fixatives were not able to reveal the antibodies. eGFP+
cells (stained in red) (Figure 8A) were easily identifiable by their round shape and smaller size
compared to other epidermal cells. In general terms, their appearance matches the general
phenotypic features ASCs from the skin are reported to have.
Figure 8. eGFP staining on cytospots by using an rabbit anti-mouse eGFP antibody. A) The use of formaldehyde as fixative
revealed the GFP+ cells in the cytospins. B) Negative control.
3.3. FACS-mediated isolation of Lgr6+ and Lgr6- basal layer epidermal cells from Lgr6 knock-in
hairless mice
FACS allows the isolation of specific cell populations based on the detection of fluorescence-
labeled markers. In this study eGFP (which marks for Lgr6 expression) and PE (which marks for
α6-integrin expression) were used to detect and isolate two cell populations from transgenic
animals: 1) basal layer epidermal cells, which are characterized by the expression of α6 integrin
and 2) alleged epidermal stem cells which besides expressing α6 integrin, express Lgr6 too. The
FACS plots show three main distinguishable areas: alleged Lgr6+ epidermal stem cells
(PE+/GFP+), cells that are negative for both markers (PE-/GFP-) and alleged basal layer
epidermal cells (PE+/GFP-); the latter group constituting the largest fraction of cells in
suspension. Contrary to α6-integrin detection which is mediated by a labeled antibody, eGFP is
an endogenously expressed marker. Therefore, eGFP expression is directly affected by
B A

Initial characterization of murine epidermal lgr6+ stem cells
Page 17
transgene zygosity. In the context of transgenic organisms, zygosity describes whether an
organism possesses one (hemizygous) or two (homozygous) copies of the transgene in the
genome. In principle, cells with two copies of a transgene are expected to generate 2 times
more product than cells with only one. Surprisingly, according to the FACS plots, eGFP+ cells
coming from homozygous knock-in mice represent 10-20% of the total number of cells in
suspension while only 1-7% when derived from heterozygous knock-in animals (Figure 9A, 9B
and 9C). Since the detection of eGFP+ cells greatly depends on eGFP signal intensity which is
affected by the number of eGFP-expressing cells in suspension and the amount of eGFP being
expressed in each cell, this might suggest that eGFP+ cells derived from mice with 2 copies of
the transgene either have more Lgr6+ cells or express considerably higher amounts of eGFP
than animals carrying only 1 copy.
A
B
C Figure 9. A) Heterozygous Lgr6+ knock-in mice
contain around 2-6% of eGFP+ (Lgr6+) cells. B)
Homozygous Lgr6+ knock-in mice possesses 10-
20% of eGFP+ (Lgr6+) cells. C) eGFP-/PE+ cells
represents around 30% of cells in suspension in
both transgenic genotypes whereas eGFP+/PE+
cells constitute on average 2.5% and 15% of all
cells in suspension in heterozygous and
homozygous knock-in animals, respectively. Error
Bars: Standard Error, Tg/0 (n=11), Tg/Tg (n=4).
Comp-GFP-A 0 103 104 105
100
150
50

Initial characterization of murine epidermal lgr6+ stem cells
Page 18
3.4. Lgr6 expression in FACS-isolated cell populations from homozygous and heterozygous
Lgr6 knock-in mice
The presence of Lgr6 was also assessed in FACS-isolated PE+/eGFP+ and PE+/eGFP- cells which
theoretically correspond to Lgr6+ stem cells and a mixture of diverse basal layer epidermal
cells, respectively. Cells from three homozygous (508, 509 and 550) and three heterozygous
(182, 185 and 773) Lgr6 knock-in individuals were used in the experiment. The objectives of this
assay were: 1) to assess the expression of Lgr6 in PE+/eGFP+ and PE+/eGFP- cells derived from
both transgenic genotypes and 2) to confirm the absence of exon 1 in epidermal cells derived
from homozygous Lgr6 knock-in mice. Lgr6 expression was detected not only in all individuals,
but also in both types of sorted cells: PE+/eGFP+ and PE+/eGFP-, when primers annealing on
exons 4 and 5 were used (Figure 10A). Expectedly, Lgr6 was no longer detected in all three
homozygous Lgr6 knock-in individuals when primer sets for exons 1/2 and 1/3 were used
(Figure 10B and 10C). This was evidenced for both cell populations (PE+/eGFP+ and PE+/eGFP-)
coming from these animals.
Lgr6-Ex4/5
No
rmalized
fo
ld e
xp
ressio
n
0.0
0.5
1.0
1.5
2.0
2.5
182 185 508773 509 550
P+G-
P+G+
Lgr6-Ex1/2
No
rmalized
fo
ld e
xp
ressio
n
0
1
2
3
182 185 508773 509 550
P+G-
P+G+
Lgr6-Ex1/3
No
rmalized
fo
ld e
xp
ressio
n
0
1
2
3
182 185 508773 509 550
P+G-
P+G+
Figure 10. Lgr6 detection in sorted cells from homozygous (508, 509, 550) and heterozygous (182, 185, 773) Lgr6 knock-in mice by using different primer sets. A) A primer set annealing on exon 4 and 5 reveals higher Lgr6 expression in the majority of eGFP+ cells compared to their eGFP- counterparts. B) and C) Primer sets annealing on exons 1 & 2 (B) and 1 & 3 (C) are able to detect Lgr6 expression in the heterozygous Lgr6 knock-in individuals. However, Lgr6 signal is lost for the homozygous knock-in animals.
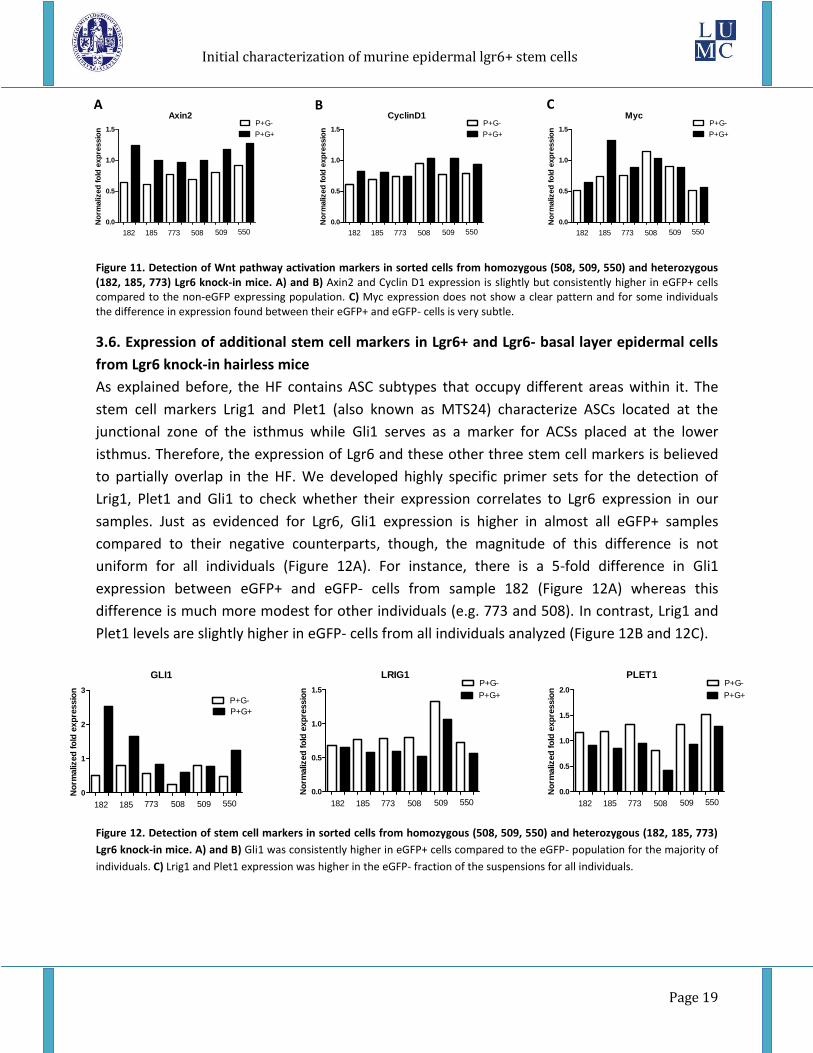
3.5. Wnt pathway activation in Lgr6+ and Lgr6- basal layer epidermal cells from Lgr6 knock-in
hairless mice
The expression level of Axin2, Cyclin D1 and Myc was determined to assess Wnt pathway
activation in eGFP+ and eGFP- epidermal cells. Axin2 is a component of the signal transduction
machinery of this pathway, whereas Cyclin D1 and Myc are targets of it. In general terms,
higher expression of these genes correlates with higher activation of the Wnt pathway (Alonso
& Fuchs, 2003). The results show that both, homozygous and hemizygous eGFP+ epidermal
cells, have a slight increase in the expression of Axin2 and Cyclin D1 compared to their eGFP-
counterparts (Figure 11A and 11B). On the contrary, no pattern is evident for Myc expression
(Figure 11C).
A B C
Initial characterization of murine epidermal lgr6+ stem cells
Page 19
Axin2
No
rmaliz
ed
fo
ld e
xp
ressio
n
0.0
0.5
1.0
1.5
182 185 508773 509 550
P+G-
P+G+
CyclinD1
No
rmaliz
ed
fo
ld e
xp
ressio
n
0.0
0.5
1.0
1.5
182 185 508773 509 550
P+G-
P+G+
Myc
No
rmaliz
ed
fo
ld e
xp
ressio
n
0.0
0.5
1.0
1.5
182 185 508773 509 550
P+G-
P+G+
Figure 11. Detection of Wnt pathway activation markers in sorted cells from homozygous (508, 509, 550) and heterozygous (182, 185, 773) Lgr6 knock-in mice. A) and B) Axin2 and Cyclin D1 expression is slightly but consistently higher in eGFP+ cells compared to the non-eGFP expressing population. C) Myc expression does not show a clear pattern and for some individuals the difference in expression found between their eGFP+ and eGFP- cells is very subtle.
3.6. Expression of additional stem cell markers in Lgr6+ and Lgr6- basal layer epidermal cells
from Lgr6 knock-in hairless mice
As explained before, the HF contains ASC subtypes that occupy different areas within it. The
stem cell markers Lrig1 and Plet1 (also known as MTS24) characterize ASCs located at the
junctional zone of the isthmus while Gli1 serves as a marker for ACSs placed at the lower
isthmus. Therefore, the expression of Lgr6 and these other three stem cell markers is believed
to partially overlap in the HF. We developed highly specific primer sets for the detection of
Lrig1, Plet1 and Gli1 to check whether their expression correlates to Lgr6 expression in our
samples. Just as evidenced for Lgr6, Gli1 expression is higher in almost all eGFP+ samples
compared to their negative counterparts, though, the magnitude of this difference is not
uniform for all individuals (Figure 12A). For instance, there is a 5-fold difference in Gli1
expression between eGFP+ and eGFP- cells from sample 182 (Figure 12A) whereas this
difference is much more modest for other individuals (e.g. 773 and 508). In contrast, Lrig1 and
Plet1 levels are slightly higher in eGFP- cells from all individuals analyzed (Figure 12B and 12C).
GLI1
No
rmaliz
ed
fo
ld e
xp
ressio
n
0
1
2
3
182 185 508773 509 550
P+G+
P+G-
LRIG1
No
rmaliz
ed
fo
ld e
xp
ressio
n
0.0
0.5
1.0
1.5
182 185 508773 509 550
P+G-
P+G+
PLET1
No
rmaliz
ed
fo
ld e
xp
ressio
n
0.0
0.5
1.0
1.5
2.0
182 185 508773 509 550
P+G-
P+G+
Figure 12. Detection of stem cell markers in sorted cells from homozygous (508, 509, 550) and heterozygous (182, 185, 773)
Lgr6 knock-in mice. A) and B) Gli1 was consistently higher in eGFP+ cells compared to the eGFP- population for the majority of
individuals. C) Lrig1 and Plet1 expression was higher in the eGFP- fraction of the suspensions for all individuals.
A B C

Initial characterization of murine epidermal lgr6+ stem cells
Page 20
Chapter 4: Discussion and conclusion
4.1. Lgr6 expression in homozygous and heterozygous Lgr6 knock-in mice
The RT-qPCR data clearly shows that Lgr6 is not null at the transcriptional level in Lgr6 knock-in
hairless transgenic mice. This was confirmed in both frozen skin and sorted keratinocytes. On
the other hand, the inability to detect Lgr6 with primers that anneal on exons 1 and 2 in
homozygous knock-in animals is consistent with Lgr6 disruption at exon 1 as reported by
Snippert et al (2010). We sequenced the knock-in Lgr6 locus of the hairless mice and confirmed
that the EGFP-Ires-CreERT2 cassette is inserted between the 5’-UTR and the start of the coding
part of exon 1 as described by the authors. The greater distance between the transcription start
site (TSS) and the start of exon 1 caused by the insertion of the construct most probably
rendered the TSS unable to drive transcription of the full version of Lgr6, which includes exon 1.
Positive Lgr6 detection with other primer sets in homozygous Lgr6 knock-in animals could be
explained by the existence of alternative TSS within intronic region(s) of the Lgr6 locus
preceding exon 2. In support to this notion, a shorter Lgr6 transcript has already been reported
on Ensembl. This alternative version of Lgr6, labeled Lgr6-002, matches to a great extent Lgr6-
001, the larger and more commonly transcribed version of Lgr6. Both transcripts share the
same sequence from exon 2 to 18, with exon 1 being the only region that differs between
them. We designed Lgr6-002-specific primers based on its unique exon 1 sequence and tested
them using murine cDNA as template. Unfortunately, all Lgr6-002 primer sets proved
unreliable, producing multi-peaked curves and amplicons with more than one melting
temperature. Consequently, Lgr6-002 presence in our transgenic mouse strains could not be
further assessed. Despite this, the detection of (alternative) Lgr6 transcripts in these transgenic
strains opens the possibility for a relevant role of Lgr6 in the physiology and pathophysiology of
the skin. The detection of Lgr6 at the protein level in homozygous Lgr6 knock-in mice would
constitute a crucial next step in support of this hypothesis.
4.2. FACS-mediated isolation of Lgr6+ and Lgr6- basal layer epidermal cells from Lgr6 knock-in
hairless mice
There is a possible disagreement between the immunocytochemical detection and FACS data.
The eGFP stained cytospin images show that eGFP+ cells represent an important proportion of
cells in suspension. However, the FACS plots indicate they constitute only 1-20% of cells
depending on transgene zygosity. There are some possible explanations for this difference.
First, unspecific staining of cells with the anti-eGFP antibody which can cause an overestimation

Initial characterization of murine epidermal lgr6+ stem cells
Page 21
of eGFP+ cells seen under the microscope. Second, stem cell overlooking by the sorter due to
their relatively low eGFP expression or loss of signal in the course of preparation due to eGFP
bleaching when exposed to light. On the other hand, the apparent difference in Lgr6+ cell
abundance between the homozygous (10-20%) and heterozygous (1-7%) knock-in mice can also
be associated with the speculated inability of the sorter to detect cells expressing low eGFP
amounts. Regarding the latter, it must be pointed out that a large proportion of transgenic
organisms bearing eGFP constructs are designed to constitutively express this protein in specific
tissues by putting constructs under the control of constitutive viral promoters, so eGFP
fluorescence can be easily visualized and detected. However, in this case eGFP expression
depends on regulatory sequences of the Lgr6 locus as it was originally used for lineage tracing
of Lgr6+ cells. Therefore, the expression of eGFP in many Lgr6+ cells might not be high enough
to be detected by the machine, causing an overall underestimation of Lgr6+ cell abundance. In
support to this hypothesis, all sorted suspensions from mice bearing 2 copies of the eGFP gene
contained 10-20% of eGFP+ cells while mice with only 1 copy contained 1-7%. This suggests
higher eGFP expression in homozygous Lgr6 knock-in animals might enable the sorter to detect
more Lgr6+ cells in suspension compared to the lower eGFP levels in heterozygous Lgr6 knock-
in animals. This ultimately might give the impression of a difference in the abundance of Lgr6+
cells between both genotypes. If so, this implies that epidermis of these transgenic animals is
constituted by at least 10-20% of Lgr6-expressing cells. It also implies that Lgr6+ cells might end
up forming part of the eGFP- fraction of cells during sorting due to their relatively low eGFP
signal. This might explain why varying levels of Lgr6 expression were detected in the eGFP-
populations from all individuals. An alternative explanation is that Lgr6 disruption actually
disturbs stem cell homeostasis which causes differences in Lgr6+ cell production between both
transgenic genotypes. Specifically, lack of fully functional Lgr6 alleles in the homozygous knock-
in animals may increase Lgr6+ stem cell numbers to compensate for the lack of fully functional
Lgr6 proteins. Accordingly, since heterozygous Lgr6 knock-in animals still have one fully
functional Lgr6 allele, they might produce less Lgr6+ cells as less compensation is needed. This
physiological adjustment might allow strains to maintain their normal phenotype. Finally, the
FACS plots show absence of cells that express eGFP but lack α6 integrin. From the biological
perspective, this is consistent with the notion that Lgr6+ stem cells are only found in the basal
layer of the HF and perhaps the IFE, and once they start to differentiate Lgr6 expression is lost.
4.3. Wnt pathway activation in basal layer Lgr6+ and Lgr6- epidermal cells from Lgr6 knock-in
hairless mice
Positive expression of the Wnt pathway activation markers, Axin2, Cyclin D1 and Myc, was
detected in eGFP- and eGFP+ epidermal cells. Remarkably, even though the majority of
individuals showed just a slight increase in the expression of Axin2 and Cyclin D1 in their eGFP+

Initial characterization of murine epidermal lgr6+ stem cells
Page 22
cells compared to their corresponding eGFP- populations, this pattern was consistently
observed in most individuals. It must be emphasized that the eGFP- fraction may contain
misidentified Lgr6+ cells and other basal layer ASC subtypes that do not express Lgr6 but do
have the Wnt pathway active (e.g. through expression of Lgr4 or 5). Furthermore, this little but
consistent difference may reflect a significantly higher activation of the Wnt pathway in Lgr6+
cells under physiological conditions. On the other hand, Myc expression was similar in eGFP-
and eGFP+ cells for almost all individuals, and the slight expression differences detected were
not linked to any particular cell population. The exception was sample 185, whose eGFP+ cells
expressed almost 2 times more Myc than the other population.
4.4. Expression of additional stem cell markers in Lgr6+ and Lgr6- basal layer epidermal cells
from Lgr6 knock-in hairless mice
The results show that in the majority of individuals, eGFP+ cells have higher Gli1 expression
than eGFP- cells, analogous to what is evidenced for Lgr6 in the same cell types. This suggests
that the spatial distribution of Gli1 and Lgr6 in the HF, and perhaps in the IFE, follows a similar
pattern. As Gli1 is part of the Hedgehog (Hh) signaling pathway, this also suggests this pathway
is up-regulated in Lgr6+ stem cells. The Hh pathway is another well-known embryonic pathway
which, just as the Wnt pathway, is involved in stem cell biology. In the hair follicle, the Hh
pathway is known to positively regulate differentiation of matrix cells and most importantly its
up-regulation characterizes a stem cell subpopulation that resides in the bulge and lower
isthmus. These Gli1-expressing cells have been shown to migrate to the IFE during wound
healing where they contribute to the restitution of the epidermal layer (Arwert, Hoste & Watt
2012). The similar roles of Lgr6+ and Gli1+ cells during wound healing and their close spatial
localization in the HF suggest these are closely related cell lineages with similar phenotypes and
functional abilities. On the other hand, expression of Lrig1 and Plet1 was found in both eGFP-
and eGFP+ cells with slight but consistent higher levels in the former compared to the latter.
This suggests that in general Lgr6+ cells express lower levels of these markers than the rest of
epidermal cells.
4.5. Overall conclusion and Future Plans
This study demonstrates Lgr6 is transcribed in homozygous and heterozygous Lgr6 knock-in
mice. The RT-qPCR data suggests the former strain type express variants of Lgr6 which do not
include exon 1 from the native version of the transcript. However, the production of shorter
alternative Lgr6 transcripts in heterozygous Lgr6 knock-in cannot be excluded either. In
addition, the Wnt pathway was shown to be slightly increased in basal layer Lgr6+ cells
compared to the Lgr6- fraction of cells on the basis of Axin2 and Cyclin D1 expression; two Wnt
pathway activation markers. Finally, compared to Lgr6- cells, Lgr6+ cells seem to be
characterized by higher expression of Gli1 and lower expression of Lrig1 and Plet1 as evidenced
by the RT-qPCR data.

Initial characterization of murine epidermal lgr6+ stem cells
Page 23
As described in Materials and Methods, high quality RNA samples of basal layer Lgr6- and Lgr6+
cells from both knock-in genotypes were prepared for RNA deep sequencing (see Appendix 6).
These samples will be sequenced soon and are expected to reveal differences in gene
expression between both cell population types. This information might also reveal genes
uniquely expressed in Lgr6+ cells which can be used as flags for immunohistochemistry
applications. In addition to the quantitative information, the characterization of the
transcriptomes of these cells by RNA-sequencing will also provide qualitative (sequence)
information of the mRNAs being expressed in the transgenic animals. This might permit precise
identification of Lgr6 variants (alternative starts and/or splicing variants) expressed by the
homozygous knock-in mice and the development of specific primers for detection of this
transcript. Next wild type hairless and haired mice could be screened to determine whether
these transcripts are specific for homozygous knock-in mice or are also expressed in
heterozygous knock-in mice or, biologically more relevant, in wild type mice.

Initial characterization of murine epidermal lgr6+ stem cells
Page 24
Chapter 5: Acknowledgements
Members of the Dermatology Department:
Kees Tensen
Frank de Gruijl
Gerline van de Glind
Heggert Rebel
Coby Out
Vincent van Drongelen
Mariam Alloul
Wim Zoutman
My Mentor from the Faculty of Science of Leiden University:
Prof. Dr. Mathieu Noteborn

Initial characterization of murine epidermal lgr6+ stem cells
Page 25
Chapter 6: References
1. Alberts, B., Molecular biology of the cell. 5th ed. 2008, New York: Garland Science. 2. Alonso L. and Fuchs E. Stem cells in the skin: waste not, Wnt not. Genes and
Development. 2003. 17: 1189-1200 3. Baccelli I. and Trumpp A. The evolving concept of cancer and metastasis stem cells. The
Journal of Cell Biology 198 (3) 281 293 (2012). 4. Barker, N. and H. Clevers, Leucine‐rich repeat‐containing G‐protein‐coupled receptors as
markers of adult stem cells. Gastroenterology, 2010. 138(5): 1681‐96. 5. Blanpain C. Tracing the cellular origin of cancer. Nature Cell Biology. 2013. 15(2): 126-34 6. Bustin, S. A. et al. The MIQE guidelines: minimum information for publication of
quantitative real‐time PCR experiments. Clinical Chemistry. 2009. 55(4): 611‐22. 7. Fearon E. R. and Spence J. R. Cancer biology: a new RING to Wnt signaling. Curr Biol.
2012. (19): R849-51 8. Gong X., Carmon K. S., Lin Q., et al. LGR6 Is a High Affinity Receptor of R-Spondins and
Potentially Functions as a Tumor Suppressor. Plos One. 2012. 7(5):e37137 9. VanGuilder H. D., Vrana K. E. & Freeman W. M.Twenty-five years of quantitative PCR for
gene expression analysis. BioTechniques. 2006. 44:619-626 10. Herpin, A., et al., Molecular characterization of a new leucine‐rich repeat‐containing G
protein‐coupled receptor from a bivalve mollusc: evolutionary implications. Biochimica Biophysica Acta, 2004. 1680(3): 137‐44.
11. Jordan C. T, Guzman, M. L., Noble M. Cancer Stem Cells. New England Journal of Medicine. 2006. 355:1253-1261
12. Leushacke M. & Barker N. Lgr5 and Lgr6 as markers to study adult stem cell roles in self-renewal and cancer. Oncogene. 2012. 31: 3009–302
13. MacDonald B. T. and He X. A finger on the pulse of Wnt receptor signaling Cell Research (2012) 22: 1410-1412.
14. Udvardi M. K., Czechowski T. and Scheible W. Eleven Golden Rules of Quantitative RT-PCR. The Plant Cell, Vol. 20: 1736–1737, July 2008
15. Monroe M. M., et al. The functional and clinical significance of LGR6 expression in head and neck squamous cell carcinoma. Poster: 8th International conference on head and neck cancer. 2012.
16. Nolan T, Hands R. E. & Bustin S. A. Quantification of mRNA using real-time RT-PCR. Nature Protocols. 2006. 1(3): 1559-82
17. Snippert H. J, Haegebarth A., Kasper M., et al. Lgr6 marks stem cells in the hair follicle that generate all cell lineages of the skin. Science. 2010. 327: 1385-89
18. Rozen S. and Skaletsky H. Primer3 on the WWW for general users and for biologist programmers. Methods in Molecular Biology, 2000. 132: 365‐86.
19. Ye et al.: Primer-BLAST: A tool to design targetspecific primers for polymerase chain reaction. BMC Bioinformatics 2012 13:134

Initial characterization of murine epidermal lgr6+ stem cells
Page 26
Appendix 1: Scheme of eGFP-Ires-CreERT2 construct inserted in the Lgr6 locus
Appendix 2: Primers
A2.1. Primers used for Lgr6 detection in murine material
Primer sequences designed for Lgr6-001 transcript detection
Primer Name* Target Gene Transcript Target region Primer sequence
LGR6_001M-EX4/5-FW1-NBT Lgr6 1 Exon 4 CTCAACAACCTTCCTGCCCT
LGR6_001M-EXN4/5-RV1-NBT Lgr6 1 Exon 5 GCGGTTGTTATGTAGATGCAG
LGR6_001M-EX4/5-FW2-NBT Lgr6 1 Exon 4 GCTGCGCCTAGATGCTAATC
LGR6_001M-EX4/5-RV2-NBT Lgr6 1 Exon 5 GGCAGGAAGGTTGTTGAGAG
LGR6_001M-EX2/3-FW1-NBT Lgr6 1 Exon 2 AACAACCTCACGGAGCTTCA
LGR6_001M-EX2/3-RV1-NBT Lgr6 1 Exon 3 TGTGAGAGGTGGTTCCCTGA
LGR6_001M-EX1/2-FW1-NBT Lgr6 1 Exon 1 GCTGTCCGCTGACTGCTC
LGR6_001M-EX1/2-RV1-NBT Lgr6 1 Exon 2 AGCTCCGTGAGGTTGTTCAT
LGR6_001M-EX1/2-RV2-NBT Lgr6 1 Exon 2 AAGCTCCGTGAGGTTGTTCA
LGR6_001M-EX1/3-FW1-NBT Lgr6 1 Exon 1 GGACCCCCTGACGGCTTA
LGR6_001M-EX1/3-RV1-NBT Lgr6 1 Exon 3 TGTGAGAGGTGGTTCCCTGA
LGR6_001M-EX1/3-RV2-NBT Lgr6 1 Exon 3 TGAGAGGTGGTTCCCTGAGA
LGR6_001M-EX3/4-FW1-NBT Lgr6 1 Exon 3 TCAGGGAACCACCTCTCACA
LGR6_001M-EX3/4-RV1-NBT Lgr6 1 Exon 4 CATAGTGCCTCTGCTGGGAT
*The letter “M” in the name of primers stands for “murine”
Primer sets for Lgr6-001 transcript detection
Snippert et al. 2010

Initial characterization of murine epidermal lgr6+ stem cells
Page 27
Primer combination Amplicon size (bp) Efficiency (%)
LGR6_001M-EX4/5-FW1RV1 120 637
LGR6_001M-EX4/5-FW2RV2 136 95*
LGR6_001M-EX2/3-FW1RV1 86 180
LGR6_001M-EX1/2-FW1RV1 102 95*
LGR6_001M-EX1/2-FW1RV2 103 82
LGR6_001M-EX1/3-FW1RV1 120 95*
LGR6_001M-EX1/3-FW1RV2 118 82
LGR6_001M-EX3/4-FW1RV1 113 92*
*These sets were used for Lgr6-001 detection on the basis of their efficiency values
Primers designed for Lgr6-002 transcript detection*
Primer Name** Target Gene Transcript Target region Primer sequence
LGR6_002M-FW1-NBT Lgr6 2 Exon 1 CCTCAACATGGGACTGTGAA
LGR6_002M-RV1-NBT Lgr6 2 Exon 2 GCTTTCTCTGGGATAGCCTTG
LGR6_002M-FW2-NBT Lgr6 2 Exon 1 TAATCAGGACCAGCCCTCAAC
LGR6_002M-RV2-NBT Lgr6 2 Exon 2 GGGAACTCCTGCAGCTCATTA
LGR6_002M-FW3-NBT Lgr6 2 Exon 1 CCCTCAACATGGGACTGTGAA
LGR6_002M-RV3-NBT Lgr6 2 Exon 2 TCCGGATAGCCAAGGGGAAC
LGR6_002M-FW4-NBT Lgr6 2 Exon 1 TGGGACTGTGAAGTGCAACG
LGR6_002M-RV4-NBT Lgr6 2 Exon 2 GAAACCCAATTCCTGCAGCCT
*All primers on this list recurrently amplified more than one product. Therefore, they were not further used. **The letter “M” in the name of primers stands for “murine”
A2.2. Primers used for the detection of Wnt pathway activation markers in murine material
Primer sequences for Axin2 detection
Primer Name Target Gene Transcript Target region Primer sequence
AXIN2-001m-EX2/3-FW1 Axin2 1 Exon 2 AGAAGCGACCCAGTCAATCC
AXIN2-001m-EX2/3-RV1 Axin2 1 Exon 3 TGGACATGGAATCGTCGGTC
AXIN2-001m-EX2/3-FW2 Axin2 1 Exon 2 AAGAGAAGCGACCCAGTCAA
AXIN2-001m-EX2/3-RV2 Axin2 1 Exon 3 ACATGGAATCGTCGGTCAGT
AXIN2-001m-EX2/3-FW3 Axin2 1 Exon 2 CACGTAGGTTCCGGCTATGT
AXIN2-001m-EX2/3-RV3 Axin2 1 Exon 3 TACGCTACTGTCCGTCATGG

Initial characterization of murine epidermal lgr6+ stem cells
Page 28
Primer sets for Axin2 detection
Primer combination Amplicon size (bp) Efficiency (%)
AXIN2-001m-EX2/3-FW1RV1 115 85
AXIN2-001m-EX2/3-FW2RV2 115 101
AXIN2-001m-EX2/3-FW3RV3 108 100*
*This set was used for Axin2-001 detection on the basis of its efficiency value
Primer sequences for Myc detection
Primer Name Target Gene Transcript Target region Primer sequence
Myc-005m-EX2-FW1 Myc 5 Exon 2 GTCAGAGGAGGAACGAGCTG
Myc-005m-EX2-RV1 Myc 5 Exon 2 CTCGTCTGCTTGAATGGACA
Myc-005m-EX2-FW2 Myc 5 Exon 2 ACACGGAGGAAAACGACAAG
Myc-005m-EX2-RV2 Myc 5 Exon 2 AATTCAGGGATCTGGTCACG
Myc-005m-EX1-FW1 Myc 5 Exon 1 GCCCAGTGAGGATATCTGGA
Myc-005m-EX1-RV1 Myc 5 Exon 1 GACCGCAACATAGGATGGAG
Primer sets for Myc detection
Primer combination Amplicon size (bp) Efficiency (%)
Myc-005m-EX2-FW1RV1 140 104*
Myc-005m-EX2-FW2RV2 106 NOT TESTED
Myc-005m-EX1-FW1RV1 100 83
*This set was used for Myc-005 detection on the basis of its efficiency value
Primer sequences for Cyclin D1 detection
Primer Name Target Gene Transcript Target region Primer sequence
CycD1-001m-EX1/2-FW1 CyclinD1 1 Exon 1 GCGTACCCTGACACCAATCT
CycD1-001m-EX1/2-RV1 CyclinD1 1 Exon 2 ATCTCCTTCTGCACGCACTT
CycD1-001m-EX1/2-RV2 CyclinD1 1 Exon 2 AATCTCCTTCTGCACGCACT
CycD1-001m-EX3/4-FW1 CyclinD1 1 Exon 1 CAAAATGCCAGAGGCGGATG
CycD1-001m-EX3/4-RV1 CyclinD1 1 Exon 2 CATGGAGGGTGGGTTGGAAA
Primer sets for Cyclin D1 detection
Primer combination Amplicon size (bp) Efficiency (%)
CycD1-001m-EX1/2-FW1RV1 110 96
CycD1-001m-EX1/2-FW1RV2 111 105
CycD1-001m-EX3/4-FW1RV1 109 100*
*This set was used for CyclinD1-001 detection on the basis of its efficiency value

Initial characterization of murine epidermal lgr6+ stem cells
Page 29
A2.3. Primers used for the detection of stem cell markers in murine material
Primer sequences designed for Lrig1 transcript detection
Primer Name Target Gene Transcript Target region Primer sequence
LRIG1-002-EX3/4m-FW1 LRIG1 2 Exon 3 TTTGCAGCACAACAAGATCC
LRIG1-002-EX3/4m-RV1 LRIG1 2 Exon 4 CTCCGAATTTCCGTGATGTT
LRIG1-002-EX3/4m-FW2 LRIG1 2 Exon 3 TGAGCTGACAGCCATACCAT
LRIG1-002-EX3/4m-RV2 LRIG1 2 Exon 4 GCTCCCATCCACACTAAGGA
LRIG1-002-EX3/4m-FW3 LRIG1 2 Exon 3 GCGCTGCTTCCATAGGAGTT
LRIG1-002-EX3/4m-RV3 LRIG1 2 Exon 4 GGAGCTCCGAATTTCCGTGA
LRIG1-002-EX3/4m-FW4 LRIG1 2 Exon 3 CAGCCATACCATCACTGGGC
LRIG1-002-EX3/4m-RV4 LRIG1 2 Exon 4 GGCTCCCATCCACACTAAGG
Primer sets for Lrig1 detection
Primer combination Amplicon size (bp) Efficiency (%)
LRIG1-002-EX3/4m-FW1RV1 105 114
LRIG1-002-EX3/4m-FW2RV2 94 102*
LRIG1-002-EX3/4m-FW3RV3 140 106
LRIG1-002-EX3/4m-FW4RV4 87 NOT TESTED
*This set was used for LRIG1-002 detection on the basis of its efficiency value
Primer sequences designed for Plet1 transcript detection
Primer Name Target Gene Transcript Target region Primer sequence
PLET1-201-EX1/2m-FW1 PLET1 201 Exon 1 TGATAATGGGTCCTGCGTGG
PLET1-201-EX1/2m-RV1 PLET1 201 Exon 2 ACGGCACTGACTGAATCGTT
PLET1-201-EX2/3m-FW1 PLET1 201 Exon 2 CTTGACATCCCAAAGCCAGT
PLET1-201-EX2/3m-RV1 PLET1 201 Exon 3 TGTTCCATTTTCACGGATGA
PLET1-201-EX4m-FW1 PLET1 201 Exon 4 TACAACCCTCAGCCTCAACC
PLET1-201-EX4m-RV1 PLET1 201 Exon 4 TTGGCTGTGTTCACAGTTGG
PLET1-201-EX4m-RV2 PLET1 201 Exon 4 GTGGTGTTGGCTGTGTCCTT

Initial characterization of murine epidermal lgr6+ stem cells
Page 30
Primer sets for Plet1 detection
Primer combination Amplicon size (bp) Efficiency (%)
PLET1-201-EX1/2m-FW1RV1 135 109
PLET1-201-EX2/3m-FW1RV1 135 101*
PLET1-201-EX4m-FW1RV1 85 110
PLET1-201-EX4m-FW1RV2 115 NOT TESTED
*This set was used for PLET1-201 detection on the basis of its efficiency value
Primer sequences designed for Gli1 transcript detection
Primer Name Target Gene Transcript Target region Primer sequence
GLI1-201-EX2/3m-FW1 GLI1 201 Exon 2 TGTCAGGGTCCCAGGGTTAT
GLI1-201-EX2/3m-RV1 GLI1 201 Exon 3 GAGAGAGCCCGCTTCTTTGT
GLI1-201-EX3m-FW1 GLI1 201 Exon 3 CCTCCTCGGAGTTCAGTCAA
GLI1-201-EX3m-RV1 GLI1 201 Exon 3 ATTACGGTTTGCAGGTCGAG
GLI1-201-EX3m-FW2 GLI1 201 Exon 3 CTCGACCTGCAAACCGTAAT
GLI1-201-EX3m-RV2 GLI1 201 Exon 3 CAATGGAGAGATGGCCGTAG
GLI1-201-EX3/4m-FW1 GLI1 201 Exon 3 TGGTACCATGAGCCCTTCTT
GLI1-201-EX3/4m-RV1 GLI1 201 Exon 4 GTGGTACACAGGGCTGGACT
Primer sets for Gli1 detection
Primer combination Amplicon size (bp) Efficiency (%)
GLI1-201-EX2/3m-FW1RV1 121 95*
GLI1-201-EX3m-FW1RV1 89 NOT TESTED
GLI1-201-EX3m-FW2RV2 103 81
GLI1-201-EX3/4m-FW1RV1 92 NOT TESTED
*This set was used for GLI1-201 detection on the basis of its efficiency value
Appendix 3: RNA extraction and precipitation
A3.1. RNeasy mini kit (Qiagen)
A3.1.1. Extraction and Purification of Total RNA from Animal Tissues
This is the adapted protocol from the manufacture of the RNeasy mini kit Qiagen, steps that were not used are excluded from this protocol. Things to do before starting

Initial characterization of murine epidermal lgr6+ stem cells
Page 31
β‐Mercaptoethanol (β‐ME) must be added to Buffer RLT before use. Add 10 μl β‐ME per 1 ml Buffer RLT. Dispense in a fume hood and wear appropriate protective clothing. Buffer RLT containing β‐ME can be stored at room temperature for up to 1 month.
Alternatively, add 20 μl of 2 M dithiothreitol (DTT) per 1 ml Buffer RLT. The stock solution of 2 M DTT in water should be prepared fresh or frozen in single‐use aliquots. Buffer RLT containing DTT can be stored at room temperature for up to 1 month.
Buffer RPE is supplied as a concentrate. Before using for the first time, add 4 volumes of ethanol (96–100%) as indicated on the bottle to obtain a working solution. If performing optional on‐column DNase digestion, prepare DNase I stock solution as described in Appendix D (page 69). Procedure 1. Excise the tissue sample from the animal or remove it from storage. Remove RNAlater
stabilized tissues from the reagent using forceps. Determine the amount of tissue. Do not use more than 30 mg.
Weighing tissue is the most accurate way to determine the amount. Note: If the tissues were stored in RNAlater reagent at –20°C, be sure to remove any crystals that may have formed.
2. Follow either step 2a or 2b. a. For RNAlater stabilized tissues:
If using the entire tissue, place it directly into a suitably sized vessel for disruption and homogenization, and proceed to step 3. If using only a portion of the tissue, cut it on a clean surface. Weigh the piece to be used, and place it into a suitably sized vessel for disruption and homogenization. Proceed to step 3. RNA in RNAlater stabilized tissues is protected during cutting and weighing of tissues at ambient temperature (15–25°C). It is not necessary to cut the tissues on ice or dry ice or in a refrigerated room. Remaining tissues can be stored in RNAlater RNA Stabilization Reagent. Previously stabilized tissues can be stored at –80°C without the reagent.
b. For unstabilized fresh or frozen tissues: If using the entire tissue, place it directly into a suitably sized vessel for disruption and homogenization, and proceed immediately to step 3. If using only a portion of the tissue, weigh the piece to be used, and place it into a suitably sized vessel for disruption and homogenization. Proceed immediately to step 3. RNA in harvested tissues is not protected until the tissues are treated with RNAlater RNA Stabilization Reagent, flash‐frozen, or disrupted and homogenized in step 3. Frozen tissues should not be allowed to thaw during handling. The relevant procedures should be carried out as quickly as possible. Note: Remaining fresh tissues can be placed into RNAlater RNA Stabilization Reagent to stabilize RNA (see protocol on page 36). However, previously frozen tissues thaw too slowly in the reagent, preventing the reagent from diffusing into the tissues quickly enough to prevent RNA degradation.

Initial characterization of murine epidermal lgr6+ stem cells
Page 32
3. Disrupt the tissue and homogenize the lysate in Buffer RLT (do not use more than 30 mg
tissue) according to step 3a, 3b, 3c, or 3d. See “Disrupting and homogenizing starting material”, pages 20–23, for more details on disruption and homogenization. Note: Ensure that _‐ME is added to Buffer RLT before use (see “Things to do before starting”). After storage in RNAlater RNA Stabilization Reagent, tissues may become slightly harder than fresh or thawed tissues. Disruption and homogenization using standard methods is usually not a problem. For easier disruption and homogenization, we recommend using 600 μl Buffer RLT. Note: Incomplete homogenization leads to significantly reduced RNA yields and can cause clogging of the RNeasy spin column. Homogenization with the TissueLyser and rotor–stator homogenizers generally results in higher RNA yields than with other methods.
a. Disruption and homogenization using a rotor–stator homogenizer:
Place the weighed (fresh, frozen, or RNAlater stabilized) tissue in a suitably sized vessel. Add the appropriate volume of Buffer RLT (see Table 8). Immediately disrupt and homogenize the tissue using a conventional rotor–stator homogenizer until it is uniformly homogeneous (usually 20–40 s). Proceed to step 4.
4. Centrifuge the lysate for 3 min at full speed. Carefully remove the supernatant by pipetting,
and transfer it to a new microcentrifuge tube (not supplied). Use only this supernatant (lysate) in subsequent steps.
In some preparations, very small amounts of insoluble material will be present after the 3 min centrifugation, making the pellet invisible.
5. Add 1 volume of 70% ethanol* to the cleared lysate, and mix immediately by pipetting. Do not centrifuge. Proceed immediately to step 6.
Note: The volume of lysate may be less than 350 μl or 600 μl due to loss during homogenization and centrifugation in steps 3 and 4.Note: Precipitates may be visible after addition of ethanol. This does not affect the procedure.
6. Transfer up to 700 μl of the sample, including any precipitate that may have formed, to an RNeasy spin column placed in a 2 ml collection tube (supplied). Close the lid gently, and centrifuge for 15 s at _8000 x g (_10,000 rpm). Discard the flow‐through.†
6.1. Reuse the collection tube in step 7. If the sample volume exceeds 700 μl, centrifuge successive aliquots in the same RNeasy spin column. Discard the flow‐through after each centrifugation 7. D1. Add 350 μl Buffer RW1 to the RNeasy spin column. Close the lid gently, and centrifuge for 15 s at _8000 x g (_10,000 rpm) to wash the spin column membrane. Discard the flow‐through. Reuse the collection tube in step D4.

Initial characterization of murine epidermal lgr6+ stem cells
Page 33
D2. Add 10 μl DNase I stock solution (see above) to 70 μl Buffer RDD. Mix by gently inverting the tube, and centrifuge briefly to collect residual liquid from the sides of the tube.
Buffer RDD is supplied with the RNase‐Free DNase Set. Note: DNase I is especially sensitive to physical denaturation. Mixing should only be carried out by gently inverting the tube. Do not vortex.
D3. Add the DNase I incubation mix (80 μl) directly to the RNeasy spin column membrane, and place on the benchtop (20–30°C) for 15 min. Note: Be sure to add the DNase I incubation mix directly to the RNeasy spin column membrane. DNase digestion will be incomplete if part of the mix sticks to the walls or the O‐ring of the spin column. D4. Add 350 μl Buffer RW1 to the RNeasy spin column. Close the lid gently, and centrifuge for 15 s at _8000 x g (_10,000 rpm). Discard the flow‐through. Continue with the first Buffer RPE wash step in the relevant protocol. Note: In most of the protocols, the immediately following Buffer RW1 wash step is skipped (as indicated in the protocol). Continue with the first Buffer RPE wash step. 8. Add 500 μl Buffer RPE to the RNeasy spin column. Close the lid gently, and centrifuge for 15 s at _8000 x g (_10,000 rpm) to wash the spin column membrane. Discard the flow‐through.
Reuse the collection tube in step 9. Note: Buffer RPE is supplied as a concentrate. Ensure that ethanol is added to Buffer RPE before use (see “Things to do before starting”).
9. Add 500 μl Buffer RPE to the RNeasy spin column. Close the lid gently, and centrifuge for 2 min at _8000 x g (_10,000 rpm) to wash the spin column membrane.
The long centrifugation dries the spin column membrane, ensuring that no ethanol is carried over during RNA elution. Residual ethanol may interfere with downstream reactions. Note: After centrifugation, carefully remove the RNeasy spin column from the collection tube so that the column does not contact the flow‐through. Otherwise, carryover of ethanol will occur.
10. Optional: Place the RNeasy spin column in a new 2 ml collection tube (supplied), and discard the old collection tube with the flow‐through. Close the lid gently, and centrifuge at full speed for 1 min. Perform this step to eliminate any possible carryover of Buffer RPE, or if residual flow‐through remains on the outside of the RNeasy spin column after step 9. 11. Place the RNeasy spin column in a new 1.5 ml collection tube (supplied). Add 30–50 μl RNase‐free water directly to the spin column membrane. Close the lid gently, and centrifuge for 1 min at _8000 x g (_10,000 rpm) to elute the RNA.
Initial characterization of murine epidermal lgr6+ stem cells
Page 34
A3.2. Ethanol-based RNA precipitation protocol
1. Add to the RNA sample:
1 μl Pellet Paint 1/10x volumes 3 M sodium acetate, pH5.2 4 volumes of 100% ethanol
2. Mix thoroughly and incubate at –80° C for ~1 h, or, overnight at -20° C.
Make sure the centrifuge is cooled to 4° C Centrifuge at top speed for 30 min at 4° C. Wash the pellet by adding 500 μl 80% cold EtOH (4° C). Make sure the pellet is completely dry Dissolve the RNA in 20 μl DEPC-Treated water.
Appendix 4: Reverse transcription and qPCR
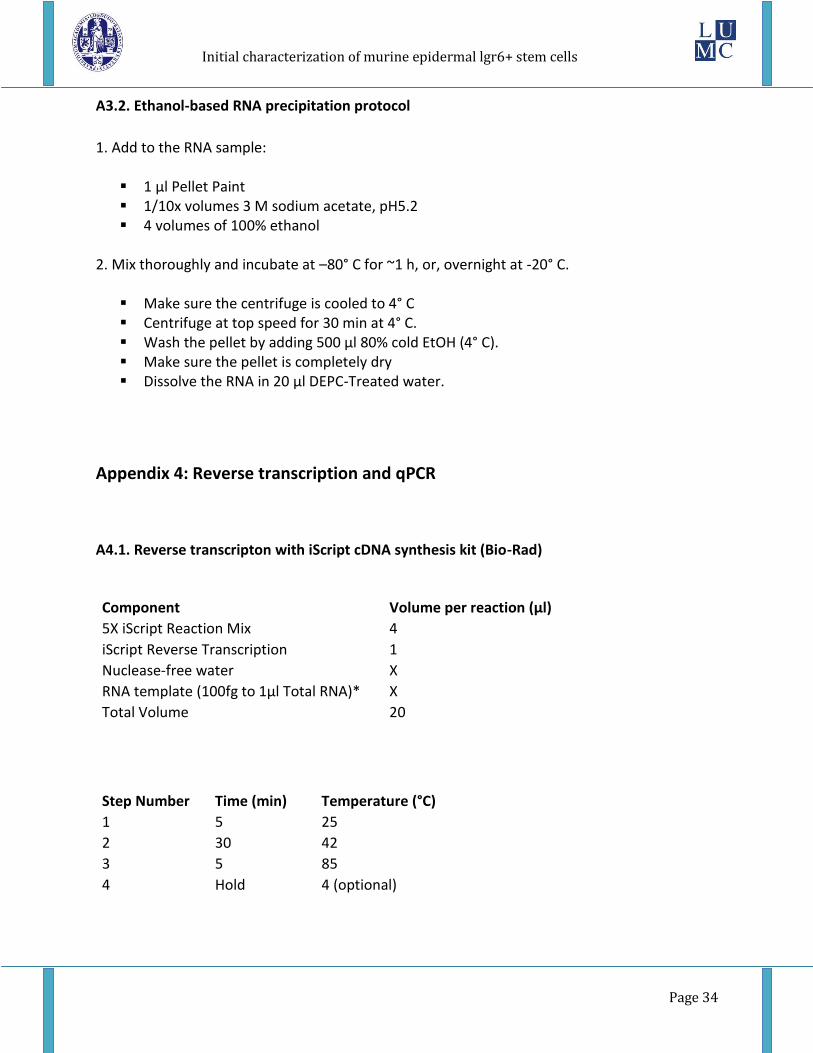
A4.1. Reverse transcripton with iScript cDNA synthesis kit (Bio-Rad)
Component Volume per reaction (μl)
5X iScript Reaction Mix 4
iScript Reverse Transcription 1
Nuclease-free water X
RNA template (100fg to 1μl Total RNA)* X
Total Volume 20
Step Number Time (min) Temperature (°C)
1 5 25
2 30 42
3 5 85
4 Hold 4 (optional)

Initial characterization of murine epidermal lgr6+ stem cells
Page 35
A4.2. RT-qPCR protocol with iQ SYBR Green Supermix (Bio-Rad)
Master Mix 1 Component Volume per reaction (μl)
iQ SYBR Green Supermix (1X) 2
Primer Set Mix (Fw + Rv) (10pm/μl) 2
Total Volume 4*
*Pippette 3.5μl deep into the well
Master Mix 2 Component Volume per reaction (μl)
iQ SYBR Green Supermix (1X) 2
cDNA template (10ng/μl) 2
Total Volume 4*
*Pippette 3.5μl highly onto the side of the well
Step Number Time Temperature (°C)
1 3 min 95
2 10 sec 96
3 30 min 60
4 10 sec 95
5 25 min 65 - 95*
*Steps of 10 sec per every 0.2 °C increase
Appendix 5: Isolation and staining of epidermal cells
A5.1. Adult mouse epidermis suspension protocol*
*Based on Jensen et al. 2010 protocol Important note:
1. Throughout this protocol tissue and cells must be kept in the dark as much as possible. 2. During the time in between steps tissue and cells must be kept on ice.

Initial characterization of murine epidermal lgr6+ stem cells
Page 36
1. Kill mouse by using an approved technique. 2. Remove the back and belly skin from the mouse with dissection tools and process them as independent samples. 3. Place the skin flat in a 100-mm cell culture dish. 4. Start the preparation by sterilizing the tissue. Prepare two petri dishes with 70% ethanol and one petri dish with sterile PBS. The tissue is bathed in each dish with 70% ethanol for 1 min and then in sterile PBS for 2 min. Although we do not require sterile material, this step makes the scraping process easier. 5. Place the back skin flat in a petri dish, dermal side facing up. 6. Scrape the dermal side of the skin with tweezers or scalpels to remove adipose tissue and the muscle 7. Float the tissue epidermal side up in 25 ml trypsin in a petri dish over night at 4°C. 8.The next morning, incubate the skin at 37°C for 15 minutes. 9. Transfer the floating tissue to the inside of the lid of the petri dish epidermal side up. 10. Pressing one edge of the tissue down on the lid with forceps, use another forceps to scrape the epidermis off the dermis without exerting excessive force. 11. Discard the dermis and mince the epidermis using a razor blade. 11. Transfer the minced epidermis into a sterile 50 ml Falcon tube in 8 ml of the trypsin solution that was used for the digestion step. 13. Repeatedly pipette the tissue suspension up and down until the small clumps disaggregate (~30 times). 14. Add 16 ml PBS supplemented with BSA (5%), DNAse I (200 Kunitz units/ml) and MgCl2.6H2O (5mM), and pour the suspension through a 70 µm cell strainer. 15. Incubate the cell suspension at room temperature for 30 minutes. 16. Spin down the cells at 350g (1200 RPM) for 6 min at room temperature. 17. Aspirate the supernatant. Leave a 300 µl remainder in the tube. 18. Resuspend the pellet, and subsequently add 8 ml PBS supplemented with BSA (1%), DNAse I (50 Kunitz units/ml) and MgCl2.6H2O (5mM). 19. Transfer the suspension to a 14 ml sterile Corning tube and centrifuge at 350g (1200 RPM) for 6 min. 20. Aspirate the supernatant. Leave a 300 µl remainder in the tube. 21. Resuspend the pellet, and subsequently, bring the volume to 2 ml with PBS supplemented with BSA (0.2%), DNAse I (50 Kunitz units/ml) and MgCl2.6H2O (5mM). 22. Combine the back and belly cell suspensions belonging to the same animal in a single 14 ml Corning tube. The final volume should not exceed 4.5 ml if planning to use 5ml FACS tubes for cell sorting. 23. Determine cell number and viability using an automated cell counter by adding 10 µl Trypan blue to 10 µl cell suspension. The final suspension is expected to contain between 1×10⁷ and 1.5×10⁷ live cells per ml. 24. If the suspension is too diluted, spin down the cells and resuspend at a dilution of 1.5×10⁷ cells per ml in PBS supplemented with BSA (0.2%), DNAse I (50 Kunitz units/ml) and MgCl2.6H2O (5mM) for flow cytometry.

Initial characterization of murine epidermal lgr6+ stem cells
Page 37
A5.2. Staining of cell suspensions with CD49f antibody for FACS
25. Transfer the suspension to a 5ml FACS tube. 26. Add PE-labeled CD49f antibody directly into the FACS tube. Use 5 µl of antibody per 1×10⁶ live cells (e.g. 5×10⁷ live cells = 250 µl PE-labeled CD49f antibody). 27. Homegenize the suspension by inverting the tube 5-10 times. 28. Incubate the cells for 1h at 4°C. To minimize clump formation, invert the tubes a couple times every 15 minutes. 29. Spin down the cells at 350g (1200 RPM) for 6 min at room temperature. 30. Aspirate the supernatant. Make sure no liquid is left in the tube. 31. Resuspend the pellet in ~300 µl PBS supplemented with BSA (0.2%), DNAse I (50 Kunitz units/ml) and MgCl2.6H2O (5mM), and once the pellet is fully dissolved, bring the volume to 4ml with the same solution. 32. Mix the suspension by inverting the tube 5-10 times. This step is important to get rid of unspecific staining. 33. Spin down the cells at 350g (1200 RPM) for 6 min at room temperature. 34. Aspirate the supernatant. Make sure no liquid is left in the tube. 35. Resuspend the pellet in ~300 µl PBS supplemented with BSA (0.2%), DNAse I (50 Kunitz units/ml) and MgCl2.6H2O (5mM), and once the pellet is fully dissolved, bring the volume to 4ml with the same solution. 36. Mix the suspension by inverting the tube 5-10 times. 37. Pour the suspension through a 40 µm cell strainer into a new FACS tube. 38. Take the cells on ice to the FACS facility.
A5.3. Immunocytochemistry on cytospins
eGFP staining protocol on cytospins
1. Wash in PBS. Perform antigen retrieval, in 10 mM sodium citrate, set pH 6.0 with 10 mM citric acid, in autoclave 5 min 110 °C, Let slide cool down slowly in hood.
2. Wash with PBS. 3. Block with 1% BSA/PBS. 4. Incubate with 100 μl Rabbit anti-mouse GFP diluted 1:400 in 1%
BSA/PBS in humidified box. 5. Wash with PBS. 6. Incubate with 100 μl Goat anti Rb-FITC 1:200 in 1% BSA/PBS (in the
dark). 7. Wash with PBS. 8. Incubate with 100 μl Sheep anti FITC-AP 1:400 in 1% BSA/PBS. 9. Wash with PBS. 10. Incubate with Fast Red (see protocol below).
5 min 3x 5 min 1 h O/N at 4°C 3x 5 min 45 min, RT 3x 5 min 1 h 3x 5 min

Initial characterization of murine epidermal lgr6+ stem cells
Page 38
11. Stop reaction with MQ water. 12. Counterstain nuclei with Mayers Haematoxylin (2-30 sec). Rinse with
tap water. 13. Mount in Kaizers Glycerin.
7 min 5 min.
Reagents for eGFP staining
10 mM citratebuffer: anti-GFP: Goat anti Rb-FITC: Sheep anti FITC-AP: Keizers Glycerin:
2.94 g Tri-sodiumcitrate-2-hydrate/litre MQ water, adjust to pH 6,0 with
0.01 M of citric acid (0.42 g in 200 ml of MQ water), store at 4 C. Rabbit anti-mouse GFP, Santa Cruz biotechnology, art# SC-8334). Goat anti Rabbit-FITC 1:200 (Zymed/Sanbio 65-6111, lot 293106). Sheep anti FITC-Alkaline Phosphatase (Roche 11091800, 1:400). Kaiser’s glycerol gelatin (contains phenol) Merck 1.09242.0100.
Fast Blue and Fast Red staining
1. Weigh 25 mg of Fast Blue BB salt and dissolve in 100 ml Tris/HCl/MgCl2 (pH 8.5).
2. Weigh 12.5 mg of naphthol AS-MX phosphate and dissolve in 500 L of DMF.
3. Weigh 35 mg levamisol and dissolve in 2 ml Tris/HCl/MgCl2 (pH 8.5).
4. Add Naphthol AS-MX phosphate dropwise to add blue solution of mixing Fast.
5. Add the dissolved levamisol.
6. Filter the solution with a filter paper.
7. Incubate until staining occurs, usually + 7 min
8. Stop the reaction with distilled water.
Note: Fast Blue substituted for Fast Red gives a red precipitate reaction.
Note 2: Naphthol AS-MX phosphate is a substrate for alkaline phosphatase.
Note 3: Levamisole inhibits endogenous alkaline phosphatase activity.
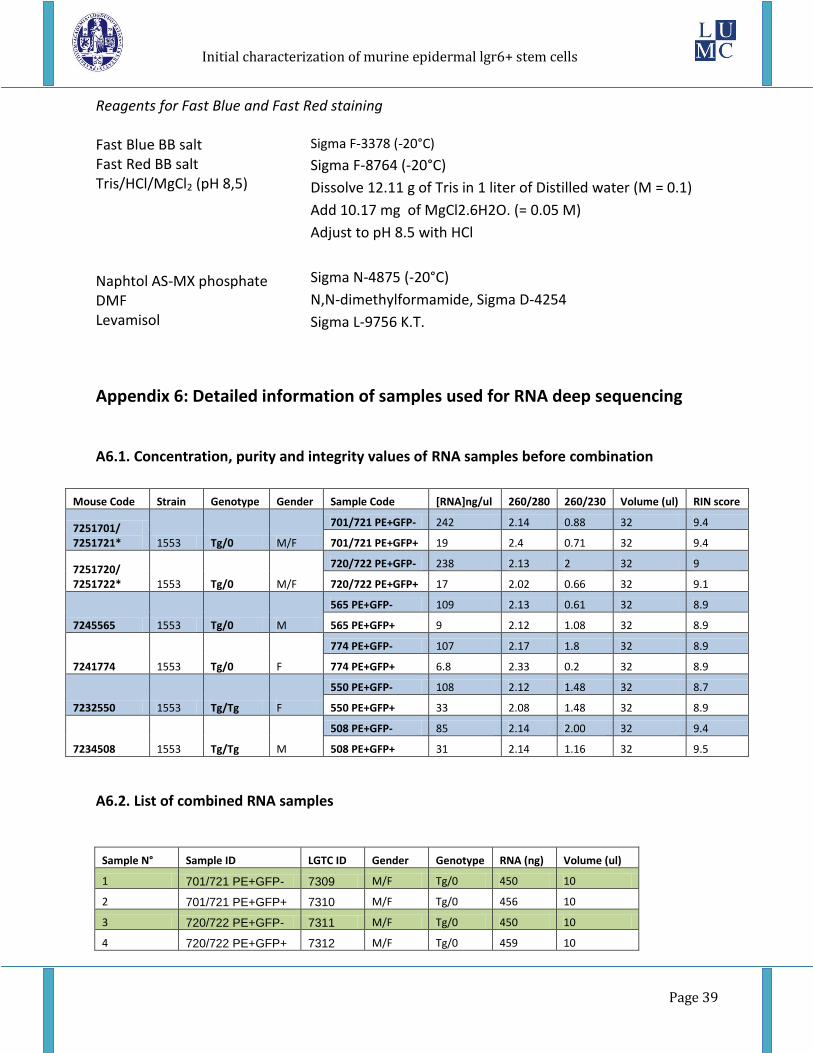
Initial characterization of murine epidermal lgr6+ stem cells
Page 39
Reagents for Fast Blue and Fast Red staining Fast Blue BB salt Fast Red BB salt Tris/HCl/MgCl2 (pH 8,5) Naphtol AS-MX phosphate DMF Levamisol
Sigma F-3378 (-20°C)
Sigma F-8764 (-20°C)
Dissolve 12.11 g of Tris in 1 liter of Distilled water (M = 0.1)
Add 10.17 mg of MgCl2.6H2O. (= 0.05 M)
Adjust to pH 8.5 with HCl
Sigma N-4875 (-20°C)
N,N-dimethylformamide, Sigma D-4254
Sigma L-9756 K.T.
Appendix 6: Detailed information of samples used for RNA deep sequencing
A6.1. Concentration, purity and integrity values of RNA samples before combination
Mouse Code Strain Genotype Gender Sample Code [RNA]ng/ul 260/280 260/230 Volume (ul) RIN score
7251701/ 7251721* 1553 Tg/0 M/F
701/721 PE+GFP- 242 2.14 0.88 32 9.4
701/721 PE+GFP+ 19 2.4 0.71 32 9.4
7251720/ 7251722* 1553 Tg/0 M/F
720/722 PE+GFP- 238 2.13 2 32 9
720/722 PE+GFP+ 17 2.02 0.66 32 9.1
7245565 1553 Tg/0 M
565 PE+GFP- 109 2.13 0.61 32 8.9
565 PE+GFP+ 9 2.12 1.08 32 8.9
7241774 1553 Tg/0 F
774 PE+GFP- 107 2.17 1.8 32 8.9
774 PE+GFP+ 6.8 2.33 0.2 32 8.9
7232550 1553 Tg/Tg F
550 PE+GFP- 108 2.12 1.48 32 8.7
550 PE+GFP+ 33 2.08 1.48 32 8.9
7234508 1553 Tg/Tg M
508 PE+GFP- 85 2.14 2.00 32 9.4
508 PE+GFP+ 31 2.14 1.16 32 9.5
A6.2. List of combined RNA samples
Sample N° Sample ID LGTC ID Gender Genotype RNA (ng) Volume (ul)
1 701/721 PE+GFP- 7309 M/F Tg/0 450 10
2 701/721 PE+GFP+ 7310 M/F Tg/0 456 10
3 720/722 PE+GFP- 7311 M/F Tg/0 450 10
4 720/722 PE+GFP+ 7312 M/F Tg/0 459 10

Initial characterization of murine epidermal lgr6+ stem cells
Page 40
5 565/744 PE+GFP- 7313 M/F Tg/0 450 10
6 565/744 PE+GFP+ 7314 M/F Tg/0 456 10
7 508/550 PE+GFP- 7315 M/F Tg/Tg 450 10
8 508/550 PE+GFP+ 7316 M/F Tg/Tg 463.5 10
Appendix 7: Detailed information of samples used for RNA deep sequencing
A7.1. RNA quality results: RIN score, rRNA ratio and virtual gel
1. Sample 7234508

Initial characterization of murine epidermal lgr6+ stem cells
Page 41
2. Sample 7232550

Initial characterization of murine epidermal lgr6+ stem cells
Page 42
3. Sample 7245565

Initial characterization of murine epidermal lgr6+ stem cells
Page 43
4. Sample 7241774

Initial characterization of murine epidermal lgr6+ stem cells
Page 44
5. Sample 7251701/ 7251721

Initial characterization of murine epidermal lgr6+ stem cells
Page 45
6. Sample 7251720/ 7251722

Initial characterization of murine epidermal lgr6+ stem cells
Page 46