initial evaporative comparison of r-22 with alternative refrigerants
TRANSCRIPT
Initial Evaporative Comparison of R-22 with Alternative Refrigerants R-134a and R-321R-125
J. P. Wattelet, J. C. Chato, A. L. Souza, and B. R. Christoffersen
ACRCTR-39
For additional information:
Air Conditioning and Refrigeration Center University of Illinois Mechanical & Industrial Engineering Dept. 1206 West Green Street Urbana, IL 61801
(217) 333-3115
June 1993
Prepared as part of ACRC Project 01 Refrigerant-Side Evaporation and Condensation Studies
1. C. Chato, Principal Investigator
The Air Conditioning and Refrigeration Center was founded in 1988 with a grant from the estate of Richard W. Kritzer, the founder of Peerless of America Inc. A State of Illinois Technology Challenge Grant helped build the laboratory facilities. The ACRC receives continuing support from the Richard W. Kritzer Endowment and the National Science Foundation. Thefollowing organizations have also become sponsors of the Center.
Acustar Division of Chrysler Allied-Signal, Inc. Amana Refrigeration, Inc. Brazeway, Inc. Carrier Corporation Caterpillar, Inc. E. I. du Pont de Nemours & Co. Electric Power Research Institute Ford Motor Company Frigidaire Company General Electric Company Harrison Division of GM ICI Americas, Inc. Modine Manufacturing Co. Peerless of America, Inc. Environmental Protection Agency U. S. Army CERL Whirlpool Corporation
For additional iriformation:
Air Conditioning & Refrigeration Center Mechanical & Industrial Engineering Dept. University of Illinois 1206 West Green Street Urbana IL 61801
2173333115

INITIAL EVAPORATIVE COMPARISON OF R·22 WITH ALTERNATIVE REFRIGERANTS R·l34a AND R·32/R·125
J.P. Wattelet, J.C. ehato, A.L. Souza, and B.R. Christoffersen
ABSTRACT
Initial R-22 alternatives were examined for conditions found in stationary air
conditioning system evaporators. Heat transfer coefficients for both R-134a and a
60%/40% azeotropic mixture of R-32/R-125 are reported and compared with those for R-
22. Data were collected in a 0.305" ID, smooth, copper tube. For convectively
dominated situations (e.g. low heat flux cases), the heat transfer coefficients for the three
refrigerants were roughly the same based on equivalent mass flux conditions. For higher
heat flux cases where both convective and nucleate boiling playa role, R-32/R-125 had a
much higher heat transfer coefficient than R-22 or R-134a. Pressure drop for the tests
conducted was lowest for R-32/R-125, followed by R-22 and R-134a. A heat transfer
coefficient correlation has been developed for pure refrigerants based on experimental
data for R-134a and R-12. The model is based on an asymptotic addition of nucleate
boiling and convective boiling components. This model was compared to the
experimental data, including the azeotropic refrigerant mixture of R-32/R-125. The mean
deviations of the correlation from the experimental data for R-134a, R-22, and R-32/R-
125 were 7.7%, 7.8%, and 11.1 %, respectively.
1

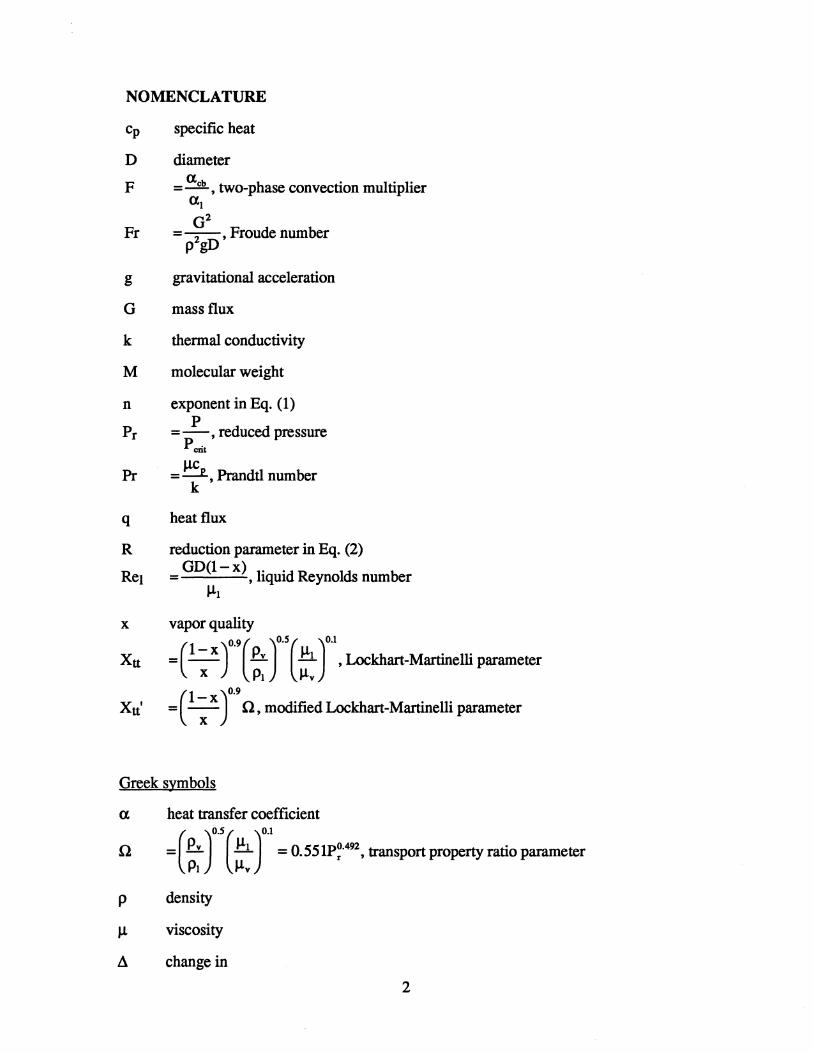
NOMENCLATURE
cp specific heat
diameter D
F = a cb , two-phase convection multiplier a l
Fr
g
G
k
M
n
Pr
G2
= -2-' Froude number pgD
gravitational acceleration
mass flux
thermal conductivity
molecular weight
exponent in Eq. (1) P
= -, reduced pressure P crit
= Ilcp , Prandtl number k
heat flux
reduction parameter in Eq. (2)
q
R
ReI = GD(l- x) , liquid Reynolds number III
x vapor quality
Xtt = e : x )''( :: r (~ r · ~khart-Martinelli parameter
Xtt' = ( 1 ~ x )0.9 n, modified Lockhart-Martinelli parameter
Greek symbols
a heat transfer coefficient
( )O.S( )0.1 n = ~~ ~~ = o. 55IP~·492, transport property ratio parameter
p density
Il viscosity
L\ change in
2
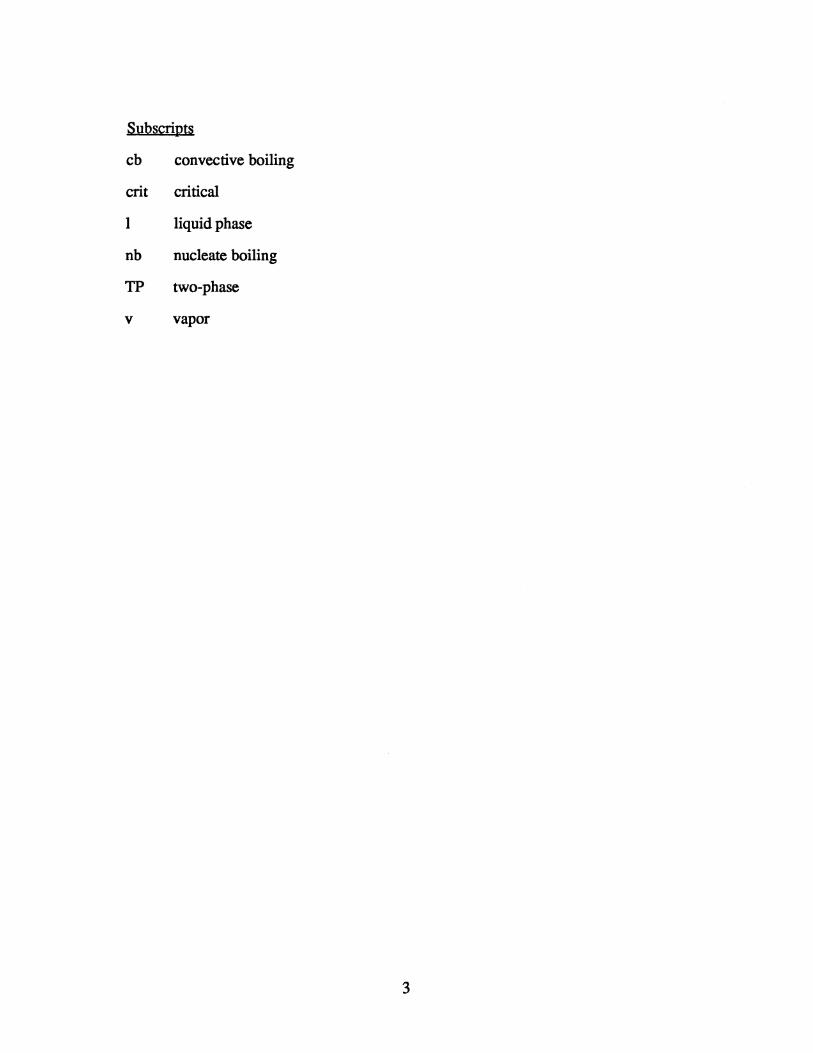
Subscripts
cb convective boiling
crit critical
1 liquid phase
nb nucleate boiling
TP two-phase
v vapor
3
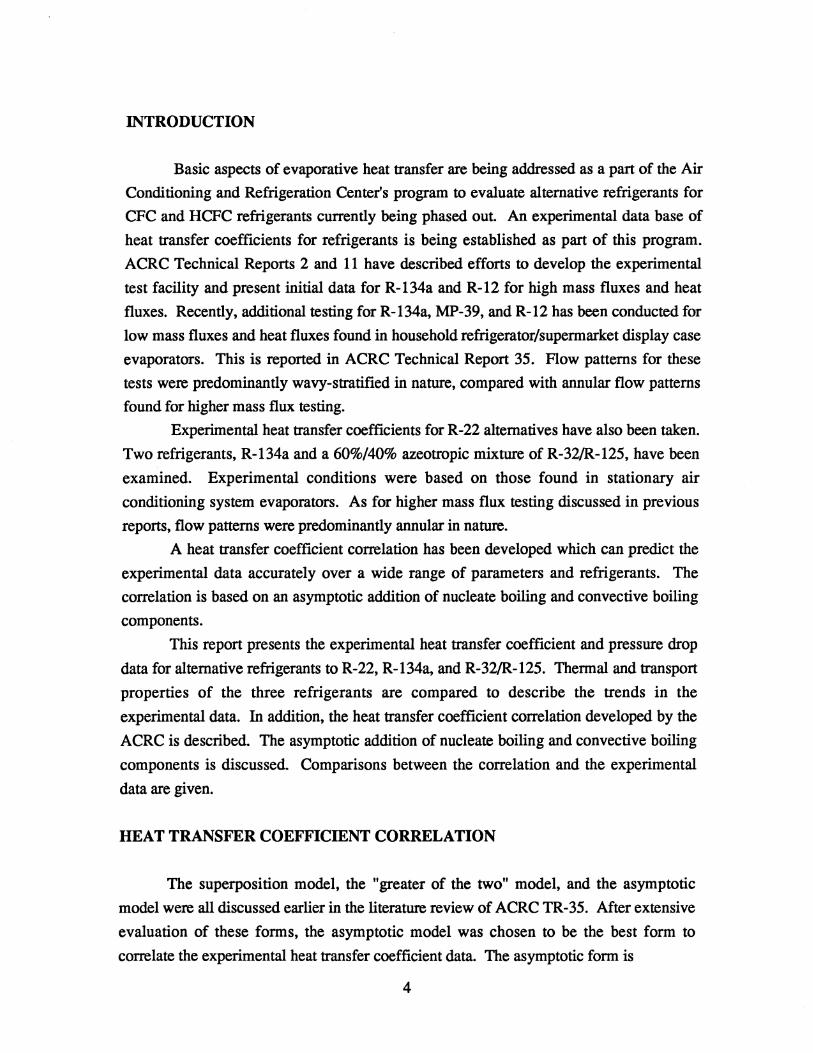
INTRODUCTION
Basic aspects of evaporative heat transfer are being addressed as a part of the Air
Conditioning and Refrigeration Center's program to evaluate alternative refrigerants for
CFC and HCFC refrigerants currently being phased out. An experimental data base of
heat transfer coefficients for refrigerants is being established as part of this program.
ACRC Technical Reports 2 and 11 have described efforts to develop the experimental
test facility and present initial data for R-134a and R-12 for high mass fluxes and heat
fluxes. Recently, additional testing for R-134a, MP-39, and R-12 has been conducted for
low mass fluxes and heat fluxes found in household refrigerator/supermarket display case
evaporators. This is reported in ACRC Technical Report 35. Flow patterns for these
tests were predominantly wavy-stratified in nature, compared with annular flow patterns
found for higher mass flux testing.
Experimental heat transfer coefficients for R-22 alternatives have also been taken.
Two refrigerants, R-134a and a 60%/40% azeotropic mixture of R-32/R-125, have been
examined. Experimental conditions were based on those found in stationary air
conditioning system evaporators. As for higher mass flux testing discussed in previous
reports, flow patterns were predominantly annular in nature.
A heat transfer coefficient correlation has been developed which can predict the
experimental data accurately over a wide range of parameters and refrigerants. The
correlation is based on an asymptotic addition of nucleate boiling and convective boiling
components.
This report presents the experimental heat transfer coefficient and pressure drop
data for alternative refrigerants to R-22, R-134a, and R-32/R-125. Thermal and transport
properties of the three refrigerants are compared to describe the trends in the
experimental data. In addition, the heat transfer coefficient correlation developed by the
ACRC is described. The asymptotic addition of nucleate boiling and convective boiling
components is discussed. Comparisons between the correlation and the experimental
data are given.
HEAT TRANSFER COEFFICIENT CORRELATION
The superposition model, the "greater of the two" model, and the asymptotic
model were all discussed earlier in the literature review of ACRC TR-35. After extensive
evaluation of these forms, the asymptotic model was chosen to be the best form to
correlate the experimental heat transfer coefficient data. The asymptotic form is
4
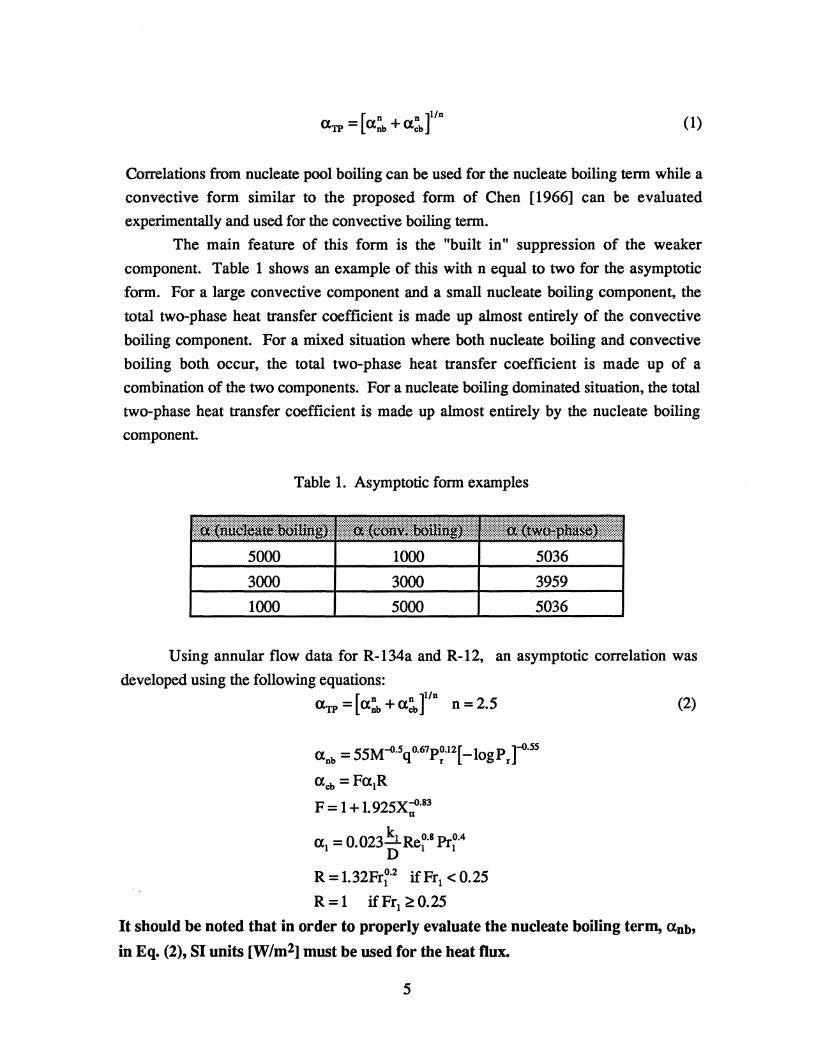
(1)
Correlations from nucleate pool boiling can be used for the nucleate boiling term while a
convective form similar to the proposed form of Chen [1966] can be evaluated
experimentally and used for the convective boiling term.
The main feature of this form is the "built in" suppression of the weaker
component. Table 1 shows an example of this with n equal to two for the asymptotic
form. For a large convective component and a small nucleate boiling component, the
total two-phase heat transfer coefficient is made up almost entirely of the convective
boiling component. For a mixed situation where both nucleate boiling and convective
boiling both occur, the total two-phase heat transfer coefficient is made up of a
combination of the two components. For a nucleate boiling dominated situation, the total
two-phase heat transfer coefficient is made up almost entirely by the nucleate boiling
component.
Table 1. Asymptotic form examples
5000 1000 5036
3000 3000 3959
1000 5000 5036
Using annular flow data for R-134a and R-12, an asymptotic correlation was
developed using the following equations:
aTP = [a~ + a~bJ'n n = 2.5
(lnb = 55M-o·5qO.67p~.l2[_10gPJ~·55 a cb = Fa1R
F = 1 + 1. 925X:·83
k a1 = 0.023-1 Re~·8 Pr~.4 D
R = 1.32Fr~·2 ifFr1 < 0.25
R = 1 ifFr1 ~ 0.25
(2)
It should be noted that in order to properly evaluate the nucleate boiling term, anb,
in Eq. (2), SI units [W 1m2] must be used for the heat flux.
5

To account for the decease in convective heat transfer due to loss in convective
boiling surface area and a loss of turbulence for lower Reynolds number flows, a Froude
dependence has been added to the convective tenn. This offsets the overestimation of the
single-phase liquid heat transfer coefficient through use of the Dittus-Boelter correlation
[McAdams, 1942] for tests with Reynolds numbers below to,OOO. Many practical uses
of refrigerants inside horizontal tubes, such as in household refrigerator evaporators, have
Reynolds numbers below 4,000. Because the form of the Dittus-Boelter correlation is
more tractable to modification compared with other single-phase heat transfer coefficient
correlations such as the Gnielinski correlation, the Dittus-Boelter correlation was selected
for use in the convective boiling tenn of Eq. (2).
Two recent pool boiling correlations have been developed that are more accurate
than some of the original correlations and are easier to evaluate. The Cooper correlation
[1984] is based on reduced pressure, heat flux, and molecular weight and is of the same
order of accuracy as the well known Forster-Zuber [1955] correlation, but is much easier
to evaluate. The other recent correlation developed in the literature is that of Stephan and
Abdelsalam [1980] ,and is used in the Jung-Radennacher correlation [1989]. Because of
model simplicity, need for surface tension in the Stephan-Adelsalam correlation, and
similar accuracy in correlating the present flow boiling data, the Cooper correlation was
selected for the nucleate boiling tenn in Eq. (2). Again, it should be noted that in order
to properly evaluate the nucleate boiling term, <Xnb, in Eq. (2), SI units [W/m2] must
be used for the heat flux.
A modified fonn of the convective tenn in the Chen correlation was selected.
Kenning and Cooper [1989] have shown this to be the appropriate fonn for this tenn.
However, the Chen correlation has been found to underestimate their data and others.
The convective boiling dominated experimental data in this paper also is underestimated
by the Chen correlation. The fonn for the two-phase multiplier, F, in Eq. (2) is
approximately 10 to 30% higher than the Chen two-phase multiplier between qualities of
10 and 90 percent for refrigerants R-134a and R-12.
The value of n selected in the asymptotic model was 2.5. This values was
detennined by a regression analysis for values of n between 1 to 3.
PROPERTY COMPARISON
To properly predict heat transfer coefficients, a knowledge of the thennal and
transport properties of a fluid is necessary. While thennal and transport properties are
well known for R-22, these properties have only recently becomes available for R-134a
and are still difficult to obtain for R-32/R-125. To be consistent for the three refrigerants,
all thennal and transport properties were obtained from REFPROP 3.0 and 3.0x by the
6

National Institute of Standards and Technology (NIST). Table 2 shows a comparison of
those thennal and transport properties of R-22, R-134a, and R-32/R-125 that affect heat
transfer and pressure drop at 41°F.
Two-phase convective heat transfer can accurately be correlated by multiplying
the single-phase liquid heat transfer coefficient correlation by a two-phase multiplier, as
shown in Eq. (2). Convectively, the three properties that affect single-phase liquid heat
transfer the most are liquid thennal conductivity, liquid specific heat and liquid viscosity.
The density ratio affects the two-phase multiplier most. Examining the Dittus-Boelter
correlation for single-phase liquid heat transfer and the two-phase multiplier given in Eq.
(2), initial comparisons can be given between the three refrigerants. For the single-phase heat transfer coefficient, the property ratio is kIO.6cpl0.4/J.1I0.4. Evaluating this ratio for
the three refrigerants, R-32/R-125 has the highest value, followed by R-22 and R-134a.
For the two-phase multiplier, the density ratio is (Pl/pv)O.5, with the highest value being
the most beneficial to heat transfer. R-134a has the highest value followed by R-22 and
R-32/R-125. Combining these ratios, the three refrigerants have approximately the same
overall value within 3% of the mean value. This means that for an equivalent mass flux,
the convective heat transfer of the three refrigerants is approximately the same. For an
equivalent cooling capacity based on the ratio of enthalpy of vaporization in Table 2, R-
134a has the highest convective heat transfer coefficient followed by R-22 and R-32/R-
125. However, these values are again within 8% of the mean value of the three
refrigerants. With the developed correlation having roughly a 10% uncertainty, the heat
transfer coefficient values again can be roughly considered to be the same.
In addition to convective boiling, nucleate boiling also affects two-phase heat
transfer. For a given heat flux, several of the most important parameters affecting
nucleate boiling heat transfer are functions of reduced pressure, PsatfPcrit. The higher the
reduced pressure, the higher the nucleate boiling heat transfer coefficient. For 41°F, R-
32/R-125 has the highest reduced pressure followed by R-22 and R-134a. For relatively
low heat fluxes, convective boiling dominates, while for relatively high heat fluxes, both
convective boiling and nucleate boiling contribute to the heat transfer coefficient. For
these higher values of heat flux, R-32/R-125 will have the highest heat transfer
coefficient followed by R-22 and R-134a, according to the correlation developed in Eq.
(2).
Utilizing the Souza correlation for the frictional pressure drop [Souza et aI.,
1992], the frictional pressure drop is proportional to the following property ratios for a
constant mass flux, inside tube diameter, quality, and saturation temperature:
7
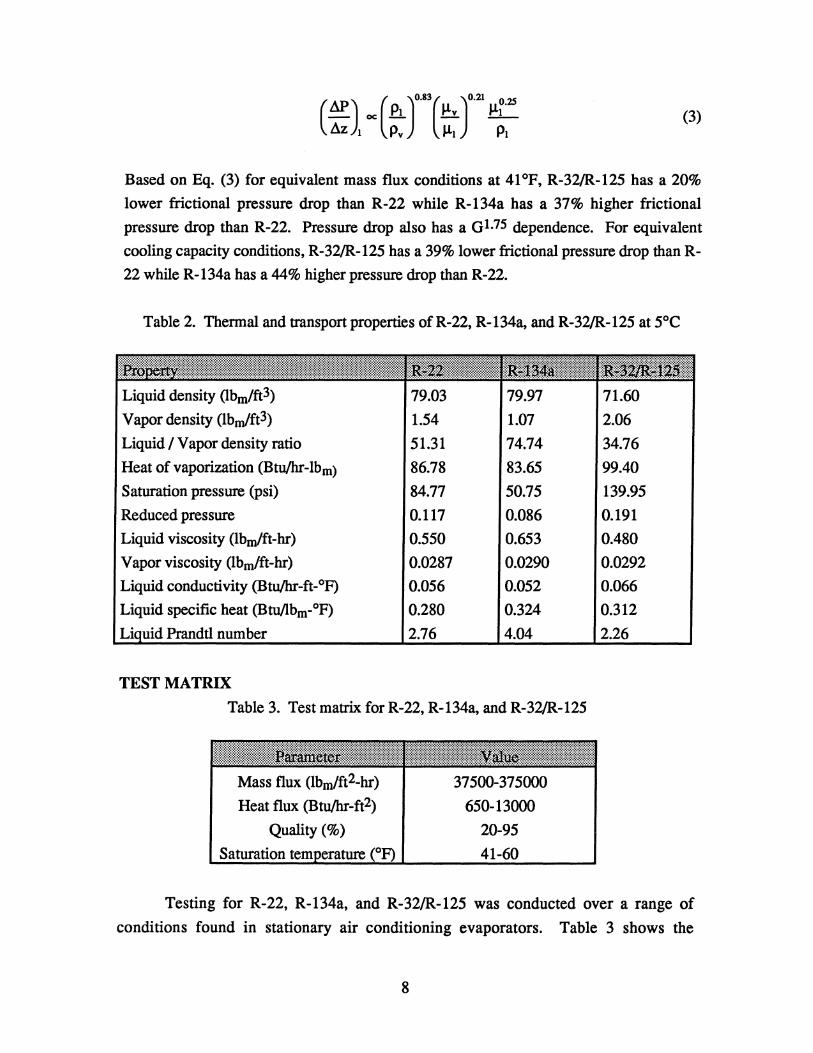
( ) ( JO.S3( JO.21 0.25
All oc.E!. ~v H:L Ilz I Pv ~l PI
(3)
Based on Eq. (3) for equivalent mass flux conditions at 41°F, R-32/R.-125 has a 20%
lower frictional pressure drop than R-22 while R-134a has a 37% higher frictional
pressure drop than R-22. Pressure drop also has a G1.7S dependence. For equivalent
cooling capacity conditions, R-32/R.-125 has a 39% lower frictional pressure drop than R-
22 while R-134a has a 44% higher pressure drop than R-22.
Table 2. Thermal and transport properties of R-22, R-134a, and R-32/R.-125 at 5°C
Liquid density (lbm/ft3) 79.03 79.97
Vapor density (lbm/ft3) 1.54 1.07
Liquid I Vapor density ratio 51.31 74.74
Heat of vaporization (Btu/hr-Ibm) 86.78 83.65
Saturation pressure (psi) 84.77 50.75
Reduced pressure 0.117 0.086
Liquid viscosity (lbmlft-hr) 0.550 0.653
Vapor viscosity (lbm/ft-hr) 0.0287 0.0290
Liquid conductivity (Btu/hr-ft_°F) 0.056 0.052
Liquid specific heat (BtuIlbm-OF) 0.280 0.324
Prandtl number 2.76 4.04
TEST MATRIX
Table 3. Test matrix for R-22, R-134a, and R-32/R.-125
Mass flux (lbm/ft2-hr)
Heat flux (Btu/hr-ft2)
Quality (%)
Saturation
37500-375000
650-13000
20-95
41-60
71.60
2.06
34.76
99.40
139.95
0.191
0.480
0.0292
0.066
0.312
2.26
Testing for R-22, R-134a, and R-32/R.-125 was conducted over a range of
conditions found in stationary air conditioning evaporators. Table 3 shows the
8
parameters varied and the specific ranges. Testing was conducted in a 0.305" ID smooth,
copper tube.
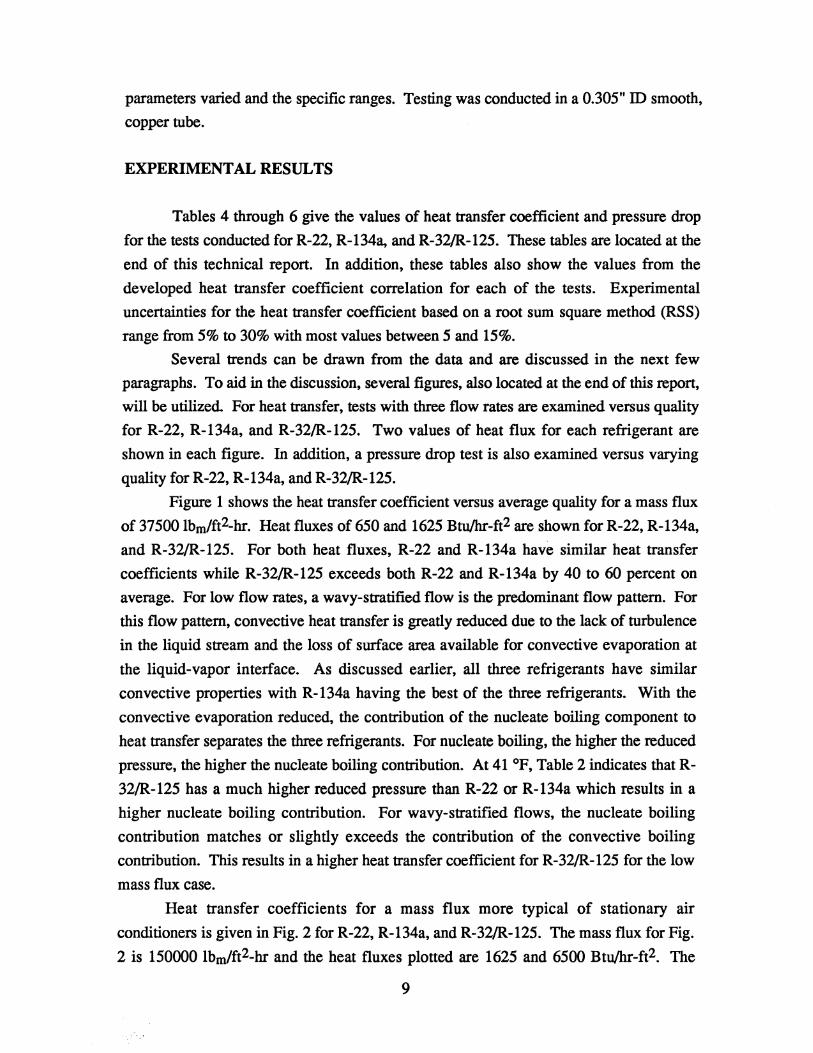
EXPERIMENTAL RESULTS
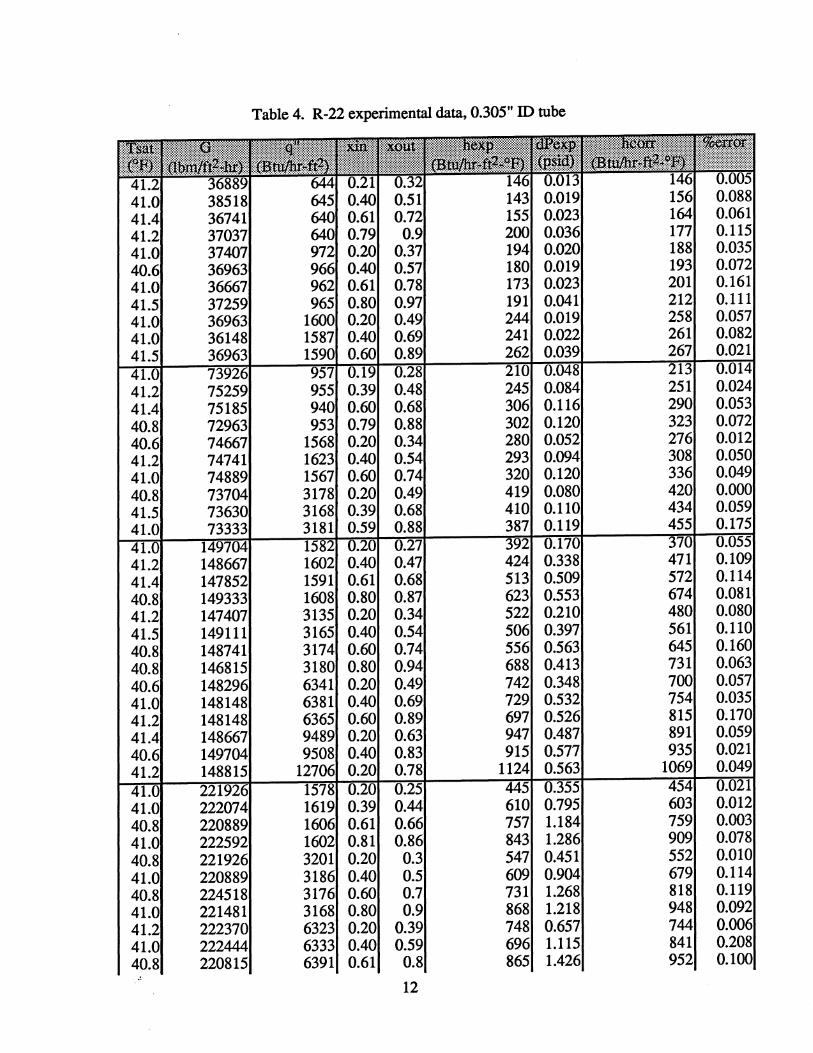
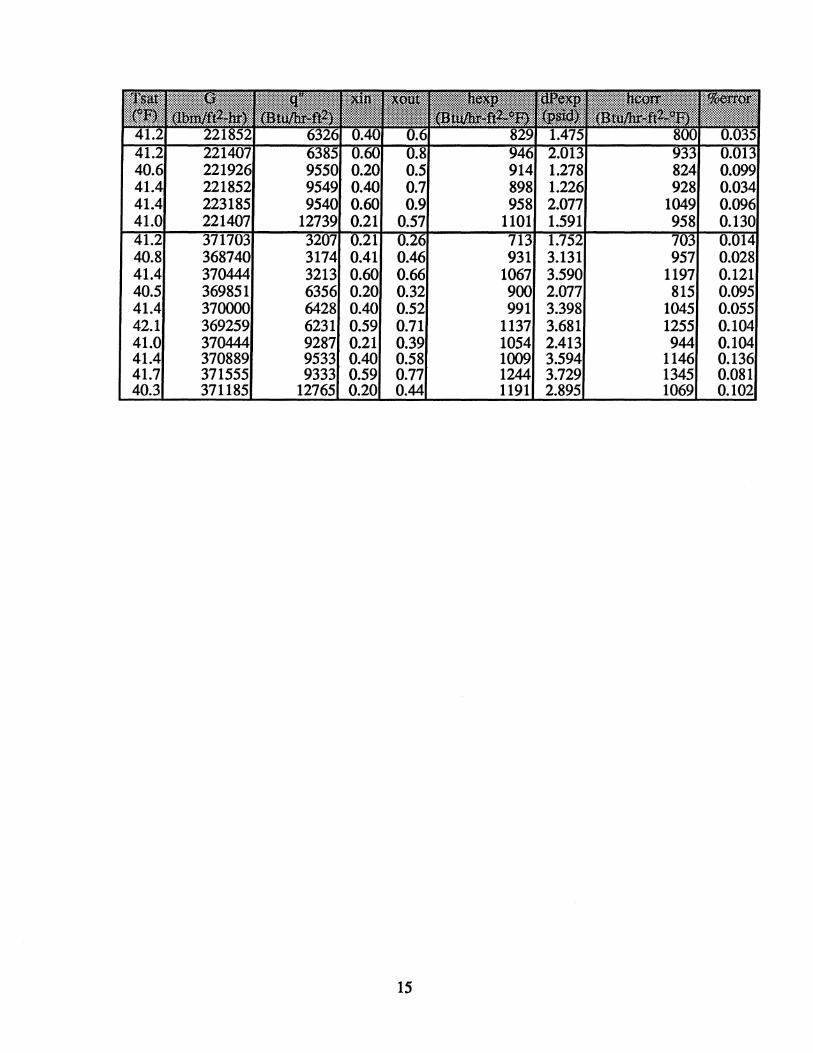
Tables 4 through 6 give the values of heat transfer coefficient and pressure drop
for the tests conducted for R-22, R-134a, and R-32/R-125. These tables are located at the
end of this technical report. In addition, these tables also show the values from the
developed heat transfer coefficient correlation for each of the tests. Experimental
uncertainties for the heat transfer coefficient based on a root sum square method (RSS)
range from 5% to 30% with most values between 5 and 15%.
Several trends can be drawn from the data and are discussed in the next few
paragraphs. To aid in the discussion, several figures, also located at the end of this report,
will be utilized. For heat transfer, tests with three flow rates are examined versus quality
for R-22, R-134a, and R-32/R-125. Two values of heat flux for each refrigerant are
shown in each figure. In addition, a pressure drop test is also examined versus varying
quality for R-22, R-134a, and R-32/R-125.
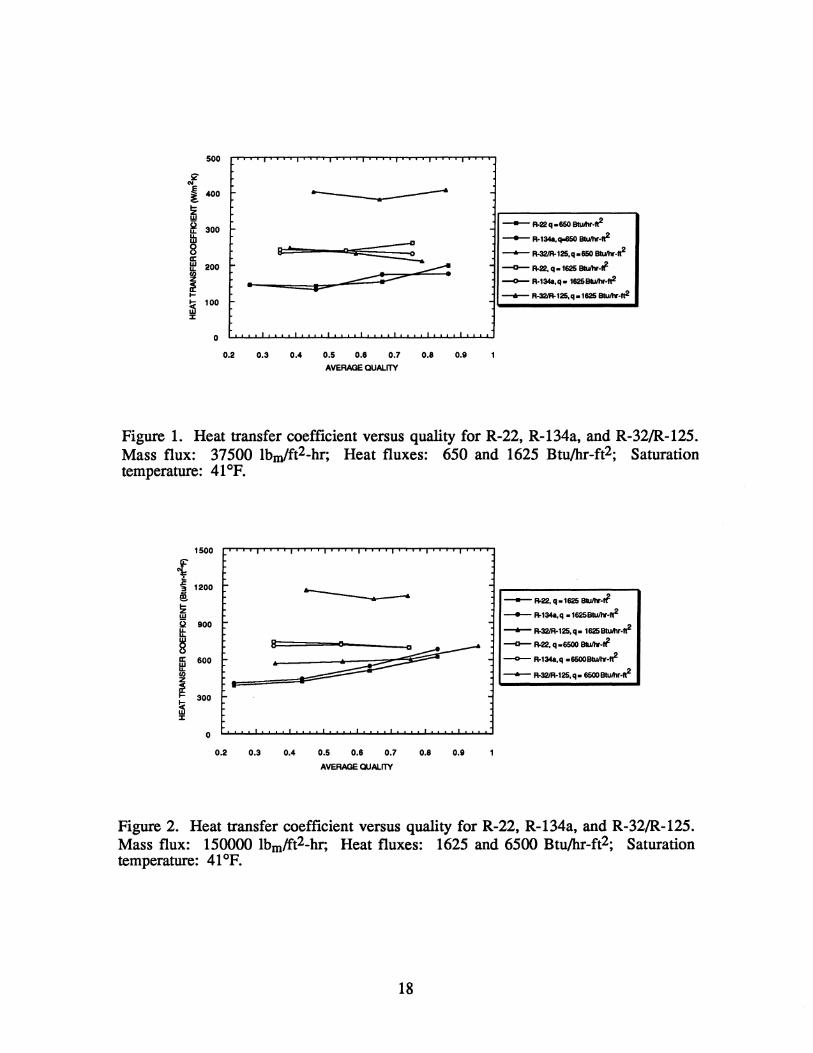
Figure 1 shows the heat transfer coefficient versus average quality for a mass flux
of 37500 Ibm/ft2-hr. Heat fluxes of 650 and 1625 Btu/hr-ft2 are shown for R-22, R-134a,
and R-32/R-125. For both heat fluxes, R-22 and R-134a have similar heat transfer
coefficients while R-32/R-125 exceeds both R-22 and R-134a by 40 to 60 percent on
average. For low flow rates, a wavy-stratified flow is the predominant flow pattern. For
this flow pattern, convective heat transfer is greatly reduced due to the lack of turbulence
in the liquid stream and the loss of surface area available for convective evaporation at
the liquid-vapor interface. As discussed earlier, all three refrigerants have similar
convective properties with R-134a having the best of the three refrigerants. With the
convective evaporation reduced, the contribution of the nucleate boiling component to
heat transfer separates the three refrigerants. For nucleate boiling, the higher the reduced
pressure, the higher the nucleate boiling contribution. At 41°F, Table 2 indicates that R-
32/R-125 has a much higher reduced pressure than R-22 or R-134a which results in a
higher nucleate boiling contribution. For wavy-stratified flows, the nucleate boiling
contribution matches or slightly exceeds the contribution of the convective boiling
contribution. This results in a higher heat transfer coefficient for R-32/R-125 for the low
mass flux case.
Heat transfer coefficients for a mass flux more typical of stationary air
conditioners is given in Fig. 2 for R-22, R-134a, and R-32/R-125. The mass flux for Fig.
2 is 150000 Ibm/ft2-hr and the heat fluxes plotted are 1625 and 6500 Btu/hr-ft2. The
9
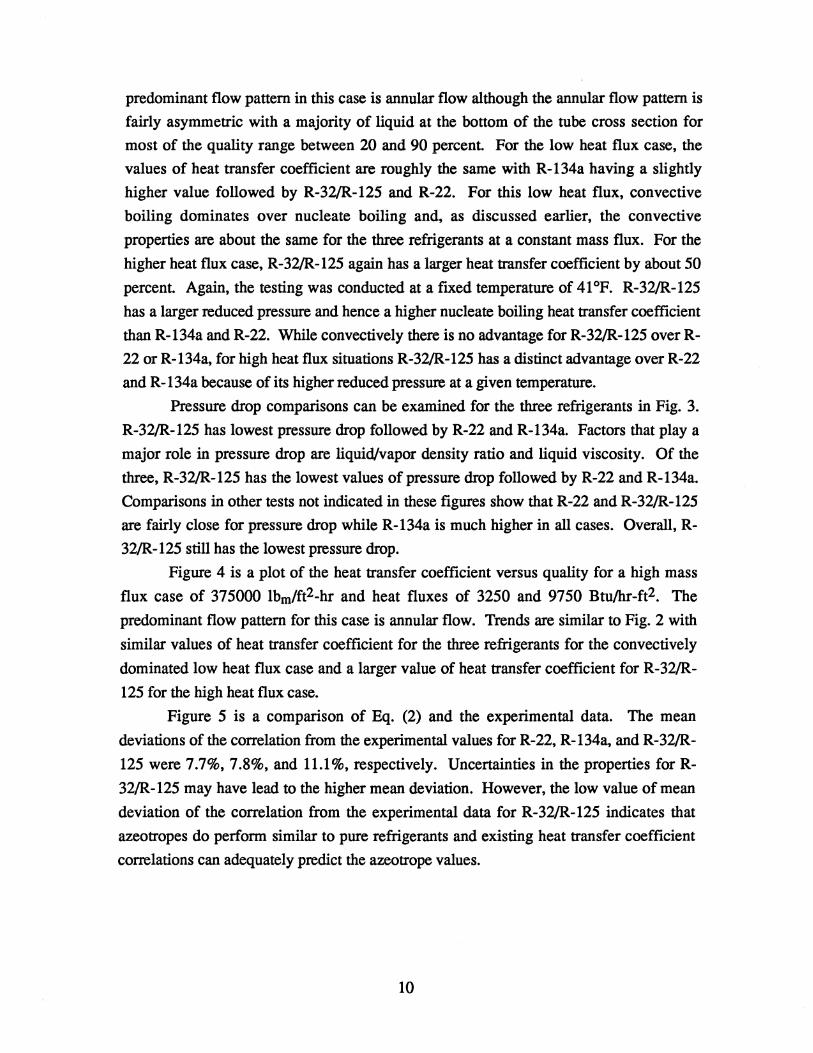
predominant flow pattern in this case is annular flow although the annular flow pattern is
fairly asymmetric with a majority of liquid at the bottom of the tube cross section for
most of the quality range between 20 and 90 percent. For the low heat flux case, the
values of heat transfer coefficient are roughly the same with R-134a having a slightly
higher value followed by R-32/R-125 and R-22. For this low heat flux, convective
boiling dominates over nucleate boiling and, as discussed earlier, the convective
properties are about the same for the three refrigerants at a constant mass flux. For the
higher heat flux case, R-32/R-125 again has a larger heat transfer coefficient by about 50
percent. Again, the testing was conducted at a fixed temperature of 41°F. R-32/R-125
has a larger reduced pressure and hence a higher nucleate boiling heat transfer coefficient
than R-134a and R-22. While convectively there is no advantage for R-32/R-125 over R-
22 or R-134a, for high heat flux situations R-32/R-125 has a distinct advantage over R-22
and R-134a because of its higher reduced pressure at a given temperature.
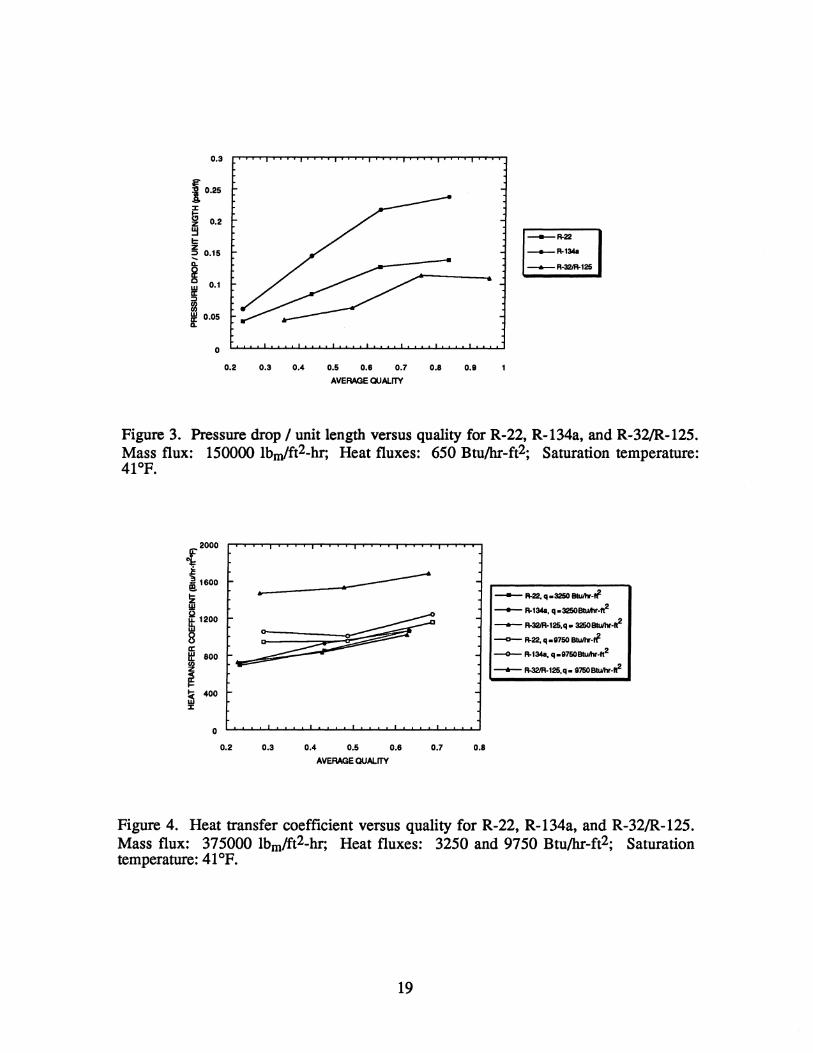
Pressure drop comparisons can be examined for the three refrigerants in Fig. 3.
R-32/R-125 has lowest pressure drop followed by R-22 and R-134a. Factors that playa
major role in pressure drop are liquid/vapor density ratio and liquid viscosity. Of the
three, R-32/R-125 has the lowest values of pressure drop followed by R-22 and R-134a.
Comparisons in other tests not indicated in these figures show that R-22 and R-32/R-125
are fairly close for pressure drop while R-134a is much higher in all cases. Overall, R-
32/R-125 still has the lowest pressure drop.
Figure 4 is a plot of the heat transfer coefficient versus quality for a high mass
flux case of 375000 Ibm/ft2-hr and heat fluxes of 3250 and 9750 Btulhr-ft2. The
predominant flow pattern for this case is annular flow. Trends are similar to Fig. 2 with
similar values of heat transfer coefficient for the three refrigerants for the convectively
dominated low heat flux case and a larger value of heat transfer coefficient for R-32/R-
125 for the high heat flux case.
Figure 5 is a comparison of Eq. (2) and the experimental data. The mean
deviations of the correlation from the experimental values for R-22, R-134a, and R-32/R-
125 were 7.7%,7.8%, and 11.1%, respectively. Uncertainties in the properties for R-
32/R-125 may have lead to the higher mean deviation. However, the low value of mean
deviation of the correlation from the experimental data for R-32/R-125 indicates that
azeotropes do perform similar to pure refrigerants and existing heat transfer coefficient
correlations can adequately predict the azeotrope values.
10

CONCLUSIONS
Several experimental heat transfer coefficients and pressure drops values have
been taken for R-22, R-134a, and a 60%/40% azeotropic mixture of R-32/R-125. Test
conditions were as follows: mass flux, 37500-375000 Ibm/ft2-hr; heat flux, 650-13000
Btu/hr-ft2; quality, 20-90 percent; saturation temperature, 41-60 oF. For convectively
boiling dominated situations (e.g. low heat fluxes), heat transfer coefficients were roughly
the same due to similar convective properties of the three refrigerants. R-134a has the
highest value of heat transfer coefficient followed by R-32/R-125 and R-22 for these
cases. All values were within ±1O% of each other and based on the uncertainty of the
experimental measurements, these values can be considered to be the same. For higher
heat flux cases where contributions of nucleate boiling and convective boiling are both
important, R-32/R-125 has much higher heat transfer coefficients than R-134a or R-22
due to its higher reduced pressure for the same temperature. The higher reduced pressure
allows easier generation of bubbles at the tube wall and hence a higher nucleate boiling
heat transfer coefficient Pressure drop for R-32/R-125 was the lowest followed by R-22
and R-134a. R-22 had a closer pressure drop to R-32/R-125 than R-134a. The low
liquid/vapor density ratio and the lower liquid viscosity of R-32/R-125 help to give it the
lowest pressure drop values of the three refrigerants. A semi-theoretical correlation for
heat transfer coefficient was developed by Project 01 for R-134a and R-12 based on an
asymptotic model combining convective and nucleate boiling contributions to the heat
transfer coefficient This model is compared to the experimental data including the
azeotropic refrigerant mixture of R-32/R-125. The mean deviation of the correlation
from the experimental data for R-134a, R-22, and R-32/R-125 were 7.7%, 7.8%, and
11.1 %, respectively.
ACKNOWLEDGMENTS
The support by the Air Conditioning and Refrigeration Center of the University of
lllinois is gratefully acknowledged by the authors. They would also like to extend their
appreciation to Allied Signal and E.!. du Pont de Nemours and Company for providing
some of the refrigerants used in this investigation, and particularly to Dr. Don Bivens.
11
4 4 40. 4 41. 40. 40. 40. 41 41 41 40. 41
Table 4. R-22 experimental data, 0.305" 10 tube
12

13

Table 5. R-134a experimental data, 0.305" ID tube
14
15
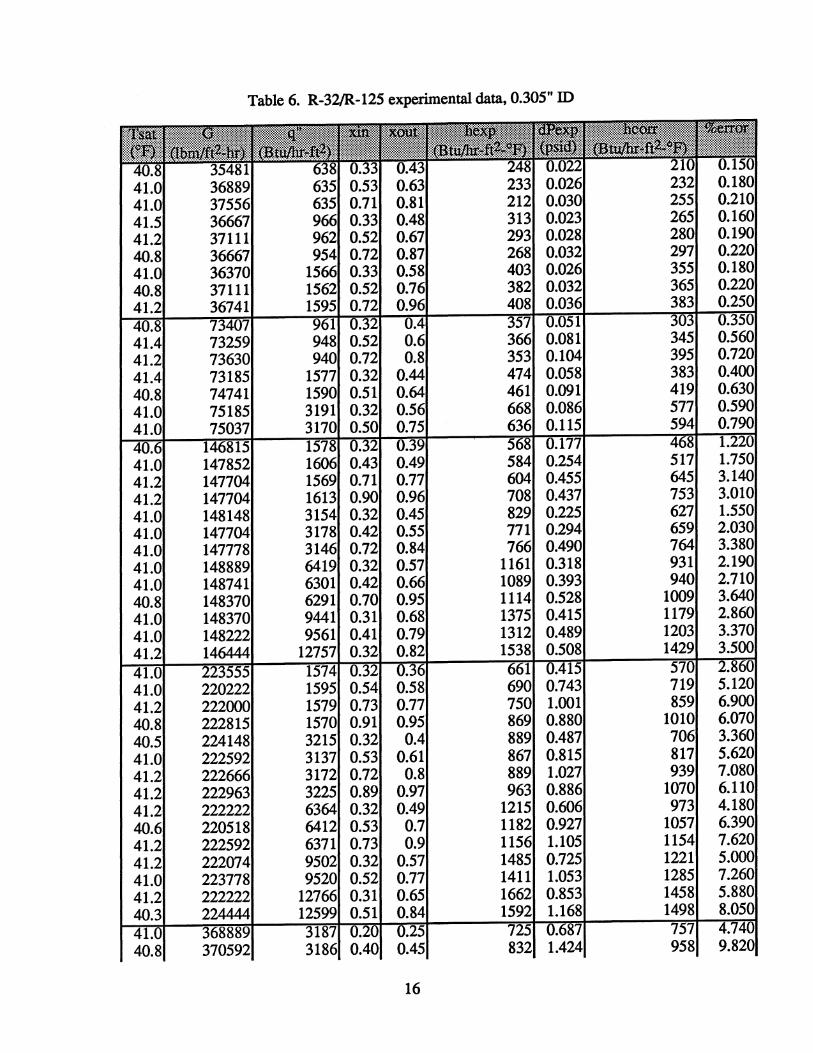
Table 6. R-32/R-125 experimental data, 0.305" ID
16

17
500
o
~
~~ B .. "Y
~::::=-=- ----=== • ... .....
0.2 0.3 0.4 0.5 0.6 0.7 0.8 0.9
AVERAGE QUAlITY
---R-22q.650_.~ --- R-134a.q.660 _.~
--...- R-32JR.125.q.650 BtuIhr.~ ---D-- R-22. q .1625 BtuIhr.tt-
__ R.I34a.q. 1625_·ft2
__ R-32JR.125.q.l625 B1uJIY.ft2
Figure 1. Heat transfer coefficient versus quality for R-22, R-134a, and R-32/R-125. Mass flux: 37500 Ibm/ft2-hr; Heat fluxes: 650 and 1625 Btulhr-ft2; Saturation temperature: 41°F.
1500
.{ ~ 1200 !!i.
~ Q 900
~ II: 600
i I!: 300
~ :I:
o
--------• ~-~
0.2 0.3 0.4 0.5 0.6 0.7 0.8 0.9
AVERAGE QUAlITY
--R-22, q .1625 B1uJIY.tt-
_ R-134a.q • 1625B1uJ1Y·1I2
-- R-32IR.125.q.I625B1u1hr.~ ---D-- 1\-22. q.6500 B1uJIY.1i
--0- R-134a.q .6500BtuIhr·~
--...- R-32JR.125.q. 65OOB1uIhr.1I2
Figure 2. Heat transfer coefficient versus quality for R-22, R-134a, and R-32/R-125. Mass flux: 150000 Ibm/ft2-hr; Heat fluxes: 1625 and 6500 Btulhr-ft2; Saturation temperature: 41°F.
18
0.3
10•25
I 0.2
I:: ~ 0.15
R 0.1 It!
I 0.05
0
0.2 0.3 0.4 0.5 0.6 0.7 0.8 0.8
AVERAGE QUALITY
_11-22
_"-1348 __ '25
Figure 3. Pressure drop I unit length versus quality for R-22, R-134a, and R-32/R-125. Mass flux: 150000 Ibm/ft2-hr; Heat fluxes: 650 Btu/hr-ft2; Saturation temperature: 41°F.
{ 2000
i 1600
~ ~ 1200
- 11-22. q_3250 BIu/II'.tI
- R-134a, q _3250IIIUA1r·tf!
--_'25,q _ 3250BIu/II'.a2
8 --- fI.Z!, q_8750 BIu/II'.i
i- _ "-1348. q_8750Btu.tv.1\2
--fl.32lR.l25.q_ 8750BtuIhr·Jt!
~ 400 :l:
0.2 0.3 0.4 0.5 0.6 0.7 0.8
AVERAGE QUALITY
Figure 4. Heat transfer coefficient versus quality for R-22, R-134a, and R-32/R-125. Mass flux: 375000 Ibmlft2-hr; Heat fluxes: 3250 and 9750 Btulhr-ft2; Saturation temperature: 41°F.
19

i 2000
~ !i 1600
!II
i 1200
1-~ :I: 400 fil Q
~ 0
o R-22
• 1I-134a
" 11-_-125
o 500 1 000 1500 2000
EXPERIMENTAl HEAT TRANSFER COEFFICIENT (BllNhr-ft2-'f)
Figure 5. Predicted heat transfer coefficients from Eq. (2) versus experimental heat transfer coefficients for R-22, R-134a, and R-32/R-125.
20

REFERENCES
Chen, J.C. 1966. A correlation for boiling heat transfer to saturated fluids in convective flow. Industrial and Engineering Chemistry, Process Design and Development 5(3): 322-329.
Cooper, M.G. 1984. Saturation pool boiling--A simple correlation. International Chemical Engineering Symposium Series 86:785-792.
Forster; H.K., and N. Zuber. 1955. Dynamics of vapour bubbles and boiling heat transfer. A.I. Ch. E. Journal 1: 531-535.
Gnielinski, v. 1976. New equations for heat and mass transfer in turbulent pipe and channel flow. International Chemical Engineer 16: 359-368.
Jung, D.S., and R. Radermacher. 1989. A study of flow boiling heat transfer with refrigerant mixtures. International Journal of Heat and Mass Transfer 32(9): 1751-1764.
Kenning, D.B.R., and M.G. Cooper. 1989. Saturated flow boiling of water in vertical tubes. International Journal of Heat and Mass Transfer 32(3): 445-458.
McAdams, W.H. 1942. Heat transmission. 2d ed. New York: McGraw-Hill.
Panek, J.S., et al. 1991. Evaporation heat transfer and pressure drop in ozone-safe refrigerants and refrigerant-oil mixtures. ACRC Technical Report 11. Air Conditioning and Refrigeration Center. University of Illinois at UrbanaChampaign.
Souza, A.L. et al. 1992. Pressure drop during two-phase flow of refrigerants in horizontal smooth tubes. ACRC Technical Report 25. Air Conditioning and Refrigeration Center. University of Illinois at Urbana-Champaign.
Stephan, K., and M. Abdelsalam. 1980. Heat transfer correlation for natural convection boiling. International Journal of Heat and Mass Transfer 23: 73-80.
Wattelet, J.P. et al. 1990. Design, building, and baseline testing of an experimental apparatus used to measure evaporation characteristics of ozone-safe refrigerants. ACRC Technical Report 2. Air Conditioning and Refrigeration Center. University of Illinois at Urbana-Champaign.
Wattelet, J.P. et al. 1993. Evaporative characteristics of R-134a, MP-39, and R-12 at low mass fluxes. ACRC Technical Report 35. Air Conditioning and Refrigeration Center. University of Illinois at Urbana-Champaign.
21