initial technical analysis report produced by new venture
TRANSCRIPT
1
Far Northern California Food Hub Study Phase I: Secondary Research Technical Memo
Developed by New Venture Advisors, May 2016
INTRODUCTION
Shasta Regional Transportation Agency (SRTA), Superior California Economic Development (SCED), and Growing Local
formed a partnership in 2015 to explore the feasibility of a centrally located hub to address the California North State
economy’s lack of intermodal infrastructure for aggregation, wholesale, and distribution of regional commodities. SRTA
secured a ‘Strategic Partnerships’ planning grant from the California State Department of Transportation (Caltrans) to
support the group’s efforts. New Venture Advisors, a business advisory firm specializing in local food systems
development, was selected by the group to conduct a feasibility study, develop a business plan, and deliver a
demonstration project from 2016‐2017.
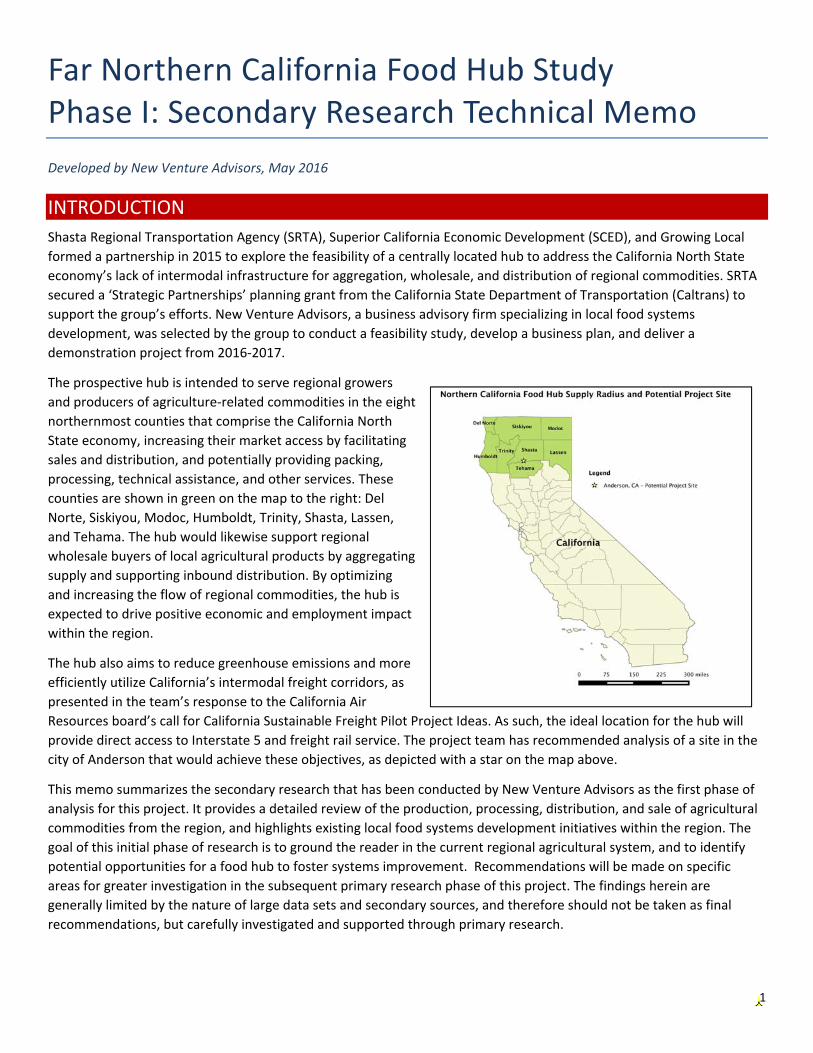
The prospective hub is intended to serve regional growers
and producers of agriculture‐related commodities in the eight
northernmost counties that comprise the California North
State economy, increasing their market access by facilitating
sales and distribution, and potentially providing packing,
processing, technical assistance, and other services. These
counties are shown in green on the map to the right: Del
Norte, Siskiyou, Modoc, Humboldt, Trinity, Shasta, Lassen,
and Tehama. The hub would likewise support regional
wholesale buyers of local agricultural products by aggregating
supply and supporting inbound distribution. By optimizing
and increasing the flow of regional commodities, the hub is
expected to drive positive economic and employment impact
within the region.
The hub also aims to reduce greenhouse emissions and more
efficiently utilize California’s intermodal freight corridors, as
presented in the team’s response to the California Air
Resources board’s call for California Sustainable Freight Pilot Project Ideas. As such, the ideal location for the hub will
provide direct access to Interstate 5 and freight rail service. The project team has recommended analysis of a site in the
city of Anderson that would achieve these objectives, as depicted with a star on the map above.
This memo summarizes the secondary research that has been conducted by New Venture Advisors as the first phase of
analysis for this project. It provides a detailed review of the production, processing, distribution, and sale of agricultural
commodities from the region, and highlights existing local food systems development initiatives within the region. The
goal of this initial phase of research is to ground the reader in the current regional agricultural system, and to identify
potential opportunities for a food hub to foster systems improvement. Recommendations will be made on specific
areas for greater investigation in the subsequent primary research phase of this project. The findings herein are
generally limited by the nature of large data sets and secondary sources, and therefore should not be taken as final
recommendations, but carefully investigated and supported through primary research.

2
SUMMARY OF KEY INSIGHTS AND RECOMMENDATIONS
Regional Geography & Industry Clusters This eight county region of the California North State is diverse in terms of geography and agricultural production. The
prospective project site is located in Shasta County, which spans the northern most region of the Sacramento Valley and
stretches into the Cascade Mountains, coming close to Mount Shasta itself. The region also includes two coastal
counties, Del Norte and Humboldt.
A cluster analysis region was conducted using the U.S. Cluster Mapping tool developed by the Massachusetts Institute of
Technology and Harvard Business School in partnership with the United States Economic Development Administration.
The tool is designed to identify pockets of high activity among related industries, which are grouped into clusters. The
tool defines “strong clusters” as a group of related industries whose relative employment specialization share puts them
in the top 25% of regions across the U.S. for that cluster.1 The existence of strong clusters is said to spur and support
innovation in a certain set of industries, due to the ability to more equally share resources, achieve synergy, and
collaborate.
The cluster analysis revealed that both Agricultural Inputs and Services, and Fishing are considered to be strong clusters
for the North State region.
The role of agriculture varies from county to county within the region. While there is a significant level of production
across all eight counties, agriculture only ranks as a primary employer in Modoc County, where it is the second most
important industry in terms of employment. Both coastal counties, Del Norte and Humboldt have significant fishing
industries.
Shasta County, and the Redding area in particular, is well‐positioned as a transportation hub for the North State region,
as the area is well‐served by major roadways and railways that provide connection to major markets in adjacent regions.
Regional Agricultural Production Regional production analysis revealed almost $1 billion in agricultural production across the region. The table below
shows the value of production by category across the region’s counties.
Supply Radius ‐ Value of Agricultural Production ‐ 2012
County Vegetables,
melons,
potatoes, &
sweet
potatoes
($1000)
Fruits,
tree nuts,
and
berries
($1000)
Poultry &
Eggs
($1000)
Cattle &
Calves
($1000)
Milk from
Cows
($1000)
Hogs &
Pigs
($1000)
Grains,
oilseeds,
dry beans,
and dry
peas
($1000)
Total Value
of
Agricultural
Products
($1000)
Del Norte 25 117 17 1,818 17,214 3 D 35,651
Humboldt 3,917 1,882 60 (D) 73,264 24 124 203,260
Lassen 2,165 (D) 110 22,691 (D) 13 1,882 72,671
Modoc 17,577 51 13 30,891 (D) D D 106,606
Shasta 629 6,559 105 25,751 (D) 28 5,351 65,622
Siskiyou 26,549 947 71 28,184 2,663 57 18,654 223,096
1(Harvard Business School 2016)

3
Tehama 330 158,116 279 41,968 21,188 679 5,479 240,818
Trinity (D) 868 37 (D) ‐ 27 ‐ 5,161
Total 51,192 168,540 692 151,303 114,329 831 31,025 952,885
(D): Information withheld in order to protect privacy of producer. Source: 2012 USDA Census of Agriculture
This table reveals that the most important product sets in the region, in terms of production value, are Fruits, tree nuts,
and berries, ($168.5 million) and Cattle and calves ($151.3 million).
Tehama County is the top producer for both of these product categories, and accounts for 93% of the value of fruits, tree nuts, and berries produced in these eight counties.
Key Insights:
Production is varied across the North State region: Both in terms of the level of production occurring in each
county and the type of products that are being produced. An analysis of top fruits and vegetables being grown in
these eight counties revealed a diverse set of products that could potentially feed into a food hub. Further, the
level of production varies dramatically across the region, with Tehama County producing $240.8 million in
agricultural products annually, while Trinity County is producing just $5.1 million. Further research might
examine the differing needs of producers operating in these different contexts.
Lack of strong produce processing: The cluster analysis and additional secondary research revealed that this
area does not have a strong fruit and vegetable processing industry, with the exception of Tehama County,
which is listed as having a high level of specialization in this sector. Additional research should work to identify
potential need among small‐medium producers for additional processing services.
Moderately developed wholesale/distribution cluster – lack of emphasis on local: Cluster analysis and
additional research revealed a fairly strong wholesale industry in the North State. However, existing food
wholesalers and distributors in the area do not seem to have a strong focus on local distribution.
Regional Agricultural Demand
Demand analysis revealed a growing market for locally sourced food within the North State region, and indicated that an
Anderson based food hub would be well‐positioned to fulfill additional demand for regionally sourced products in
important metropolitan markets within adjacent regions.
Households in this eight county region of Northern California spent a combined $1.435 billion on food between July
2014‐June 2015. The table below breaks this number down by product sets that are relevant to this potential food hub.
Consumer Spending – Eight County Region
Fruit &
Vegetables
Cereals & Bakery
Products
Meat, Poultry,
Fish, & Eggs
Dairy Products
$282,856,853 $177,211,522 $317,276,783 $150,970,585
Source: BLS CEX 2014; ACS 2014
Meat, poultry, fish & eggs constitute the largest expenditure on food, with produce being the second largest category in
terms of consumer spending.
There are several important metropolitan areas within 300 miles of Shasta County that may be potential markets for the
hub to sell into. These are Reno, Nevada, the San Francisco Bay Area, and Sacramento. All are within a four‐hour drive
from Anderson, CA. The Sacramento MSA and San Francisco Bay Area are both accessible primarily by I‐5. Reno is
connected to Anderson, CA via Hwy‐44/US‐395 or I‐80.
4
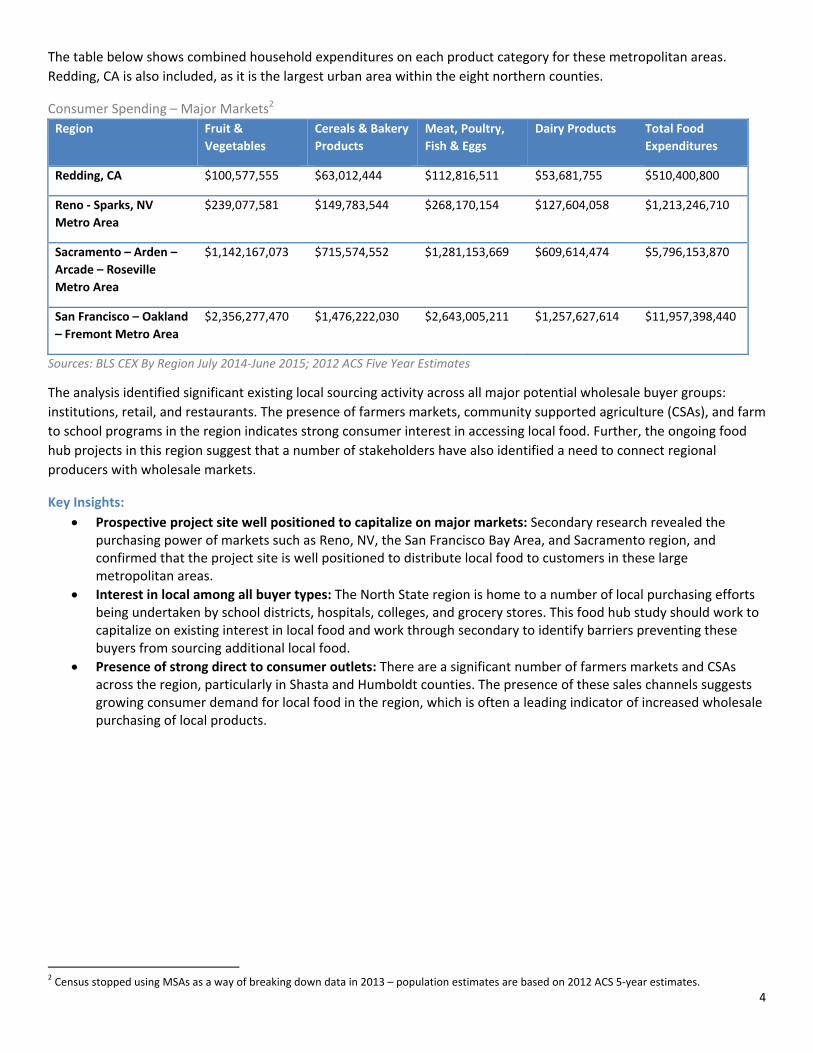
The table below shows combined household expenditures on each product category for these metropolitan areas.
Redding, CA is also included, as it is the largest urban area within the eight northern counties.
Consumer Spending – Major Markets2
Region Fruit &
Vegetables
Cereals & Bakery
Products
Meat, Poultry,
Fish & Eggs
Dairy Products Total Food
Expenditures
Redding, CA $100,577,555 $63,012,444 $112,816,511 $53,681,755 $510,400,800
Reno ‐ Sparks, NV
Metro Area
$239,077,581 $149,783,544 $268,170,154 $127,604,058 $1,213,246,710
Sacramento – Arden –
Arcade – Roseville
Metro Area
$1,142,167,073 $715,574,552 $1,281,153,669 $609,614,474 $5,796,153,870
San Francisco – Oakland
– Fremont Metro Area
$2,356,277,470 $1,476,222,030 $2,643,005,211 $1,257,627,614 $11,957,398,440
Sources: BLS CEX By Region July 2014‐June 2015; 2012 ACS Five Year Estimates
The analysis identified significant existing local sourcing activity across all major potential wholesale buyer groups:
institutions, retail, and restaurants. The presence of farmers markets, community supported agriculture (CSAs), and farm
to school programs in the region indicates strong consumer interest in accessing local food. Further, the ongoing food
hub projects in this region suggest that a number of stakeholders have also identified a need to connect regional
producers with wholesale markets.
Key Insights:
Prospective project site well positioned to capitalize on major markets: Secondary research revealed the purchasing power of markets such as Reno, NV, the San Francisco Bay Area, and Sacramento region, and confirmed that the project site is well positioned to distribute local food to customers in these large metropolitan areas.
Interest in local among all buyer types: The North State region is home to a number of local purchasing efforts being undertaken by school districts, hospitals, colleges, and grocery stores. This food hub study should work to capitalize on existing interest in local food and work through secondary to identify barriers preventing these buyers from sourcing additional local food.
Presence of strong direct to consumer outlets: There are a significant number of farmers markets and CSAs across the region, particularly in Shasta and Humboldt counties. The presence of these sales channels suggests growing consumer demand for local food in the region, which is often a leading indicator of increased wholesale purchasing of local products.
2 Census stopped using MSAs as a way of breaking down data in 2013 – population estimates are based on 2012 ACS 5‐year estimates.

5
Recommendations As this project continues into the primary research phase, there are several important areas for additional research that
have been revealed by this secondary research:
Product set to focus on in primary research: Production in the region is varied and the food hub will need to
make some critical decisions about the type of products it will focus on. This will depend in large part upon the
types of products being demanded by wholesale buyers in the region and in nearby metropolitan markets,
which the next phase of research should explore in depth. That said, the preliminary production and demand
levels assessed in this secondary research recommend a greater focus on the following product categories:
fruits, vegetables, nuts, and wild rice. One key barrier to further explore is the lack of produce distribution and
processing infrastructure in the North State. Shasta County is the most important producer of wild rice in the
state and production is also high in Modoc County, providing both supply and product differentiation reasons for
further evaluation. Cattle, dairy, and fish should also be considered, but careful attention should be paid to the
processing needs of these producers and the regulatory requirements associated with handling these products.
Production counties to focus on: While there is agricultural production occurring in all eight of the counties
included in the supply radius, five of these counties emerged as particularly important potential supply centers:
Tehama, Siskiyou, Modoc, Humboldt and Shasta. Tehama County has the highest total value of agricultural
production at over $240M, and produces 93% of the region’s fruit, tree nuts and berries. Siskiyou County has the
second highest total agricultural production value at $223M, and is the leading producer of vegetables in the
region. Siskiyou is followed by Modoc County as the second highest producer of vegetables, and as mentioned in
above, is an important producer of wild rice. Modoc also has the highest percentage of the county’s workforce
employed in agriculture at 15.60%. Humboldt has the 3rd highest total value of agricultural production at $203M,
the highest value of dairy production at $73M, as well as the greatest number of organic farms. Finally, while
Shasta County ranks fifth in overall production value, fruit production is second only to Tehama and the county
is ideally positioned to host the food hub site based on intermodal freight access. It will be critical to successfully
engage growers in these counties in interviews and surveying to evaluate their needs. Siskiyou, Shasta and
Tehama counties are all crossed by I‐5, making them ideal counties for initial distribution to a central food hub.
Demand markets to focus on: Within the eight county region, Humboldt and Shasta counties emerged as
leaders in local food sourcing, and therefore interesting potential markets to examine further through primary
research efforts. Additionally, the accessibility of major markets such as Reno, Nevada, Sacramento, and the San
Francisco Bay Area make all three of these areas important potential markets for a food hub.
Status of food hub projects in development: In the next phase of research, it is recommended that the team
look for opportunities for collaboration with existing local food distribution projects in the region and in nearby
metropolitan markets: Sacramento Food Hub, Surprise Valley Food Hub, California Food Hub Network.
Assess demand for processing: Producer interviews and surveys should analyze the level of need for produce
processing, as well as processing in other product categories. Demand interviews and surveys should assess
buyer interest in purchasing fresh cut or frozen produce and other agricultural products.
Better understand profile of fishing operations in coastal counties: Secondary research alone doesn’t provide a
clear picture of the needs of the fishing industry in Humboldt and Del Norte counties. For example, the
Department of Fish and Wildlife does not report on the size or sales channels used by most fishing operations,
therefore it is difficult to ascertain through secondary analysis alone, whether there may be an opportunity for a
food hub to work with small fishing operations in order to improve distribution of local seafood.
Identify additional local sourcing efforts across buyer groups: Through interviews and surveys, identify local
sourcing efforts currently underway in these groups that may not have emerged through secondary research
alone. Additionally, identify barriers currently preventing these buyer groups from sourcing local goods.

6
REGIONAL BACKGROUND AND DEMOGRAPHICS
This project focuses on the eight northernmost counties of
California, shown in green on the map to the right: Del Norte,
Siskiyou, Modoc, Humboldt, Trinity, Shasta, Lassen, and Tehama.
The proposed site for a food hub serving producers in the
Northern California region is in Anderson, CA, which is located in
Shasta County. Anderson is depicted with a star on the map.
California is an incredibly diverse state in terms of not only
population demographics, but also climate, geography, and
regional economies. In order to best understand this region and
the potential for a food hub located in the Shasta area, this
analysis will first provide an overview of the North State region,
before delving into a food system overview that explains the
economic landscape as it relates to Northern California and the
way in which food moves across the region.
Regional Overview and Demographic Profile
Shasta County and Eight County Region – Demographic Profile
This eight county region of Northern California is diverse in terms of geography and agricultural production. The project
site is located in Shasta County, which spans the northern most region of the Sacramento Valley and stretches into the
Cascade Mountains, coming close to Mount Shasta itself. The region also includes two coastal counties, Del Norte and
Humboldt, both of which have significant fishing industries.
Shasta County is located in Northern California and is positioned relatively equidistant from the Western and Eastern
borders of the state, along Interstate 5. The county is home to 178,520 residents, making it the most populous of
California’s eight northernmost counties.3 Redding, CA is the county seat of Shasta and the most populous city in this
region, with around 90,725 residents in 2014.4
Shasta County is demographically similar to the other seven most northern counties of the state. All are predominantly
white, ranging from 62.0% white in Del Norte County to 80.7% white in Shasta County. There is a significant population
of Hispanic Americans in the region as well.
In 2014, median household income in the region ranged from $36,862 in Trinity County to a high of $44,556 in Shasta
County. Unemployment rates in all but one of these counties (Siskiyou 7.50%) were higher than in the state as a whole.
While California had an unemployment rate 11.0% in 2014, unemployment in these 7 counties ranged from 11.30%
(Humboldt County) to 16.10% (Tehama County).
In 2014, the median owner‐occupied property value in Shasta County was $213,700 (down from $233,400 in 2012). This
is considerably lower than the statewide median owner‐occupied property value, which was $371,400 in the same year.
It is much higher than median owner‐occupied property value, which was $156,900 in 2014, down from $158,700 in
2012.5
North State Economic Drivers and Cluster Analysis
A cluster analysis region was conducted using the U.S. Cluster Mapping tool developed by the Massachusetts Institute of
Technology and Harvard Business School in partnership with the United States Economic Development Administration.
3 (American Community Survey 2014) 4 Ibid 5 Ibid

7
The tool is designed to identify pockets of high activity among related industries, which are grouped into clusters. The
tool defines “strong clusters” as a group of related industries whose relative employment specialization share puts them
in the top 25% of regions across the U.S. for that cluster.6 The existence of strong clusters is said to spur and support
innovation in a certain set of industries, due to the ability to more equally share resources, achieve synergy, and
collaborate.
A cluster analysis of this eight state region revealed that both Agricultural Inputs and Services, and Fishing are
considered to be strong clusters for the North State. The image below shows these alongside other strong clusters for
this region of California.
Strong Cluster Portfolio for 8 County Region
Source: U.S. Cluster Mapping Tool
The table below provides a deeper look at the importance of the agricultural sector as an employer in this region.
Modoc County has the highest percentage of its workforce employed in agriculture at 15.60%, while Shasta County is
the lowest, with just 2.40%.
Workforce Employed in Agriculture by County
County Employed in Agriculture
Del Norte 3.80%
Siskiyou 8.30%
Modoc 15.60%
Humboldt 4.20%
Trinity 3.40%
Shasta 2.40%
Lassen 4.60%
Tehama 6.90%
Source: American Community Survey 2014 5‐year Estimates
Anderson, CA – Potential Project Site
The potential site for this project is located in Anderson, CA, just 15 minutes south of Redding on I‐5. Due in part to its
proximity to this major commercial corridor, Anderson is a suitable candidate for consideration as this hub goes into
development.
6(U.S. Cluster Mapping Tool)

8
The city is home to 10,066 residents.7 Its top three industries in terms of employment percentage are: (1) Educational
services, and health care, and social assistance; (2) Retail trade, and (3) Arts, entertainment, and recreation, and
accommodation and foodservices.8 Median household income in Anderson was $35,225 in 2014.9 This is 20% lower than
the median household income for Shasta County as a whole, which is just over $44,000 annually.10
The city is well‐positioned in relation to easily access major markets across the region such as Redding, CA, the
Sacramento Area, the San Francisco Bay Area, and Reno, NV. All are within a four‐hour drive of Anderson.
Regional Transportation System Shasta County, and the Redding area in particular, is well‐positioned as a transportation hub for the North State region,
as the area is well‐served by major roadways and railways that provide connection to major markets in adjacent regions.
According to the SRTA 2015 Regional Transportation Plan for Shasta County, just 15% of the $1.245 billion worth of
commodities produced annually in Shasta County are consumed locally, while the remainder is exported to other
markets.11 Therefore, it is critical that the region be able to efficiently move product to nearby markets and ports. The
map below shows the flow of goods from the North State region to nearby major markets.
Source: Shasta Regional Transportation Agency
The vast majority of North State exports are distributed to the San Francisco Bay Area and Sacramento region. However,
a significant portion of exports is distributed to Washoe County, of which Reno is the seat, and to Southern Oregon.
These products are currently moved primarily by trucking routes, and government agencies continue to look for ways to
make such shipping more efficient across this region.12
7 (American Community Survey 2014) 8 Ibid 9 Ibid 10 Ibid 11 (Shasta Regional Transportation Agency 2015) 12 Ibid

9
Major Roadways Serving the North State
Interstate 5 is one of the most important shipping corridors
serving California. It runs from the Mexican border, north through
the Central Valley, passes through both Anderson and Redding,
and continues north to the Canadian border. This roadway
enables transport from Shasta County to the Sacramento region
and through connection with other major interstates, to the San
Francisco Bay. The map at right shows the major highways and
interstates that cross California. Highway 1/US‐101 run the length
of the California coast and connect the northernmost coastal
counties in the state, Del Norte and Humboldt, to the San
Francisco Bay Area. While there is some shipping that occurs on
this route, the truck traffic volume is much lower than on I‐5.
These roadways are also less conducive to trucking in that they
are curvy and treacherous at times, while I‐5 is generally an easily
navigable roadway.
The map below, produced by SRTA, shows the level of trucking
use across major roads serving northern California. I‐5 stands out
as the most heavily used road among the group.
This map effectively illustrates movement from the regions
on either side of Shasta County to the central I‐5 corridor.
It is clear that Hwy‐299 (which runs from the coast of
Humboldt County to the Nevada border of Modoc County),
Hwy‐89, Hwy‐99 and Hwy‐97, in particular play important
roles in moving goods across the region.
Major Railways Serving the North State Region
Shasta County is served by two major rail companies that carry freight: Union Pacific Railroad and Burlington Northern.
While most freight is transported by truck, these railways are important alternatives for the transportation of goods into
and out of the region.
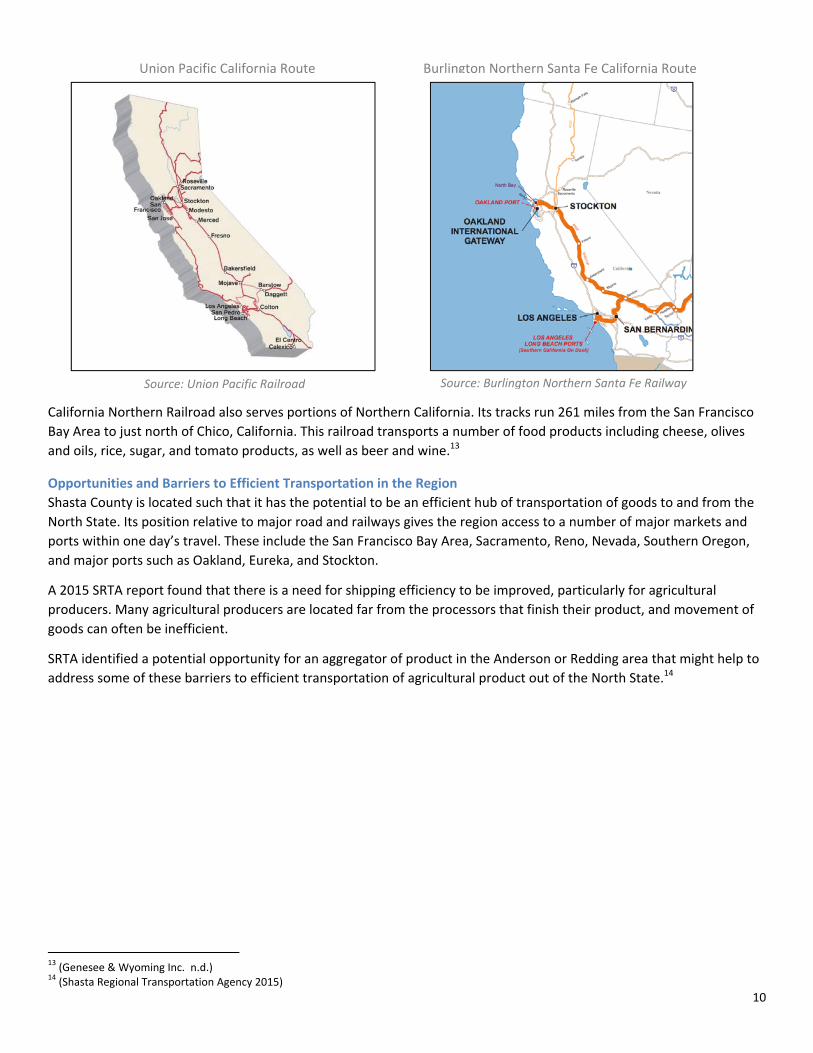
The map below on the left shows the route of Union Pacific Railroad in California. The railroad follows the trajectory of I‐
5 through Northern California and also provides connection to major ports, such as Stockton and Oakland. The railroad
also provides access to the Reno, Nevada region.
The map below on the right shows the Burlington Northern Santa Fe rail system route in California. Burlington Northern
Santa Fe Railway runs a similar route through Northern California. The system also serves major ports, but runs further
east than Union Pacific.
Source: Gocalifornia.about.com, adapted from Google
Source: Shasta Regional Transportation Agency
10
California Northern Railroad also serves portions of Northern California. Its tracks run 261 miles from the San Francisco
Bay Area to just north of Chico, California. This railroad transports a number of food products including cheese, olives
and oils, rice, sugar, and tomato products, as well as beer and wine.13
Opportunities and Barriers to Efficient Transportation in the Region
Shasta County is located such that it has the potential to be an efficient hub of transportation of goods to and from the
North State. Its position relative to major road and railways gives the region access to a number of major markets and
ports within one day’s travel. These include the San Francisco Bay Area, Sacramento, Reno, Nevada, Southern Oregon,
and major ports such as Oakland, Eureka, and Stockton.
A 2015 SRTA report found that there is a need for shipping efficiency to be improved, particularly for agricultural
producers. Many agricultural producers are located far from the processors that finish their product, and movement of
goods can often be inefficient.
SRTA identified a potential opportunity for an aggregator of product in the Anderson or Redding area that might help to
address some of these barriers to efficient transportation of agricultural product out of the North State.14
13 (Genesee & Wyoming Inc. n.d.) 14 (Shasta Regional Transportation Agency 2015)
Source: Union Pacific Railroad Source: Burlington Northern Santa Fe Railway
Union Pacific California Route Burlington Northern Santa Fe California Route

11
REGIONAL FOOD SYSTEM OVERVIEW
California Agricultural Overview California is the top ranked state in the nation in terms of agricultural production and export value. In 2014, California
cash receipts for all agricultural commodities totaled over $54 billion, more than $20 billion greater than the total for
Iowa, which ranked 2nd in terms of cash receipts.15
In 2014, California exported approximately $22 billion of agricultural products, comprising 41% of all agricultural
commodities produced in the state. 16 The state’s top five agricultural exports by value in 2014 were almonds ($4.5
million), dairy ($2.4 million), walnuts ($1.4 million), wine ($1.4 million) and pistachios ($1.1 million). Additionally,
California is the country’s sole exporter of several agricultural commodities, supplying 99% or more of: table grapes,
raisins, dried plums, kiwi, dates, olives and olive oil, figs, almonds, walnuts, pistachios, garlic and artichokes. 17
California’s cash receipts for vegetables and melons account for 43.9% of U.S. vegetable and melon production. The
state’s fruit and nuts cash receipts accounted for 70.7% of U.S. fruit and nut production. The state is also the top
producer of dairy in terms of value of cash receipts, accounting for 19.0% of U.S. cash receipts of dairy products.18 The
table below lists the top 10 agricultural commodities produced in California by cash receipt value.
Top 10 Agricultural Commodities in California by Production Value
Commodity Value of 2014 Cash Receipts
1. Milk $9.4 billion
2. Almonds $5.9 billion
3. Grapes $5.2 billion
4. Cattle, Calves $3.7 billion
5. Strawberries $2.5 billion
6. Lettuce $2 billion
7. Walnuts $1.8 billion
8. Tomatoes $1.6 billion
9. Pistachios $1.6 billion
10. Hay $1.3 billion
Source: California Department of Food and Agriculture 2014
The state’s Mediterranean climate makes it particularly well suited for the production of a wide variety of agricultural
products, with over 400 different agricultural commodities produced in the state. 19
Impact of Drought on Agricultural Production
Since 2013, California has been suffering the consequences of extreme drought, which has had a devastating impact on
many producers across the state.20 In order to cope with the water shortage, the State has relied heavily on
groundwater stores, which are now much lower than they have been historically.21
While 2016 has brought the rains of El Niño to the Golden State, the state needs additional precipitation to make a
considerable dent in the deficits caused by three years of drought. While rainfall is 108% of normal for this time of year,
15 (USDA ERS 2014) 16 (California Department of Food and Agriculture 2014) 17 Ibid 18 Ibid 19 Ibid 20 (State of California 2015) 21 (Gillis & Richtel 2015)

12
California remains at 91% normal snowpack for this point in the year. Further, scientists predict that as climate change
progresses, these drought events will only become more frequent and more extreme.22
The impact on the agricultural sector has been particularly detrimental for producers in the Central Valley and Southern
California.23 Very little literature discusses the impact that the drought has had on producers in the North State region,
which generally experiences greater rainfall than the region to its south. However, because California redistributes
water across the state and relies on snowpack for a large portion of its water supply, it is likely that if drought continues
to plague California, the impact will be increasingly felt by producers in the north.
Regional Agricultural Production and Cluster Analysis This section provides an analysis of agricultural production across the eight‐county North State region, with an emphasis
on the impact of the agricultural clusters that exist across this area.
This analysis begins with cluster mapping, before delving into a more detailed analysis of the role that agriculture plays
in the region.
Cluster Mapping: Agricultural Industries in the North State Region
The U.S. Cluster Mapping Tool provides helpful visualization and statistics on the way that industries interact and
coalesce across the country. When using the tool to analyze agriculture it is critical to understand that the tool may
understate the role of agriculture, due to the fact that it relies primarily on U.S. Census Bureau data as opposed to USDA
Census of Agriculture data. For example, while the 2012 Census of Agriculture reports that Tehama County is home to
1,743 farms, the U.S. Cluster Mapping Tool reports only 5 agriculture establishments in the county. Therefore, the in‐
depth analysis that follows the cluster mapping section is critical to a complete understanding of the agricultural profile
of this region.
The U.S. Cluster Mapping Tool defines the Agricultural Inputs and Services Cluster as a 9‐industry cluster that includes all
establishments primarily engaged in farming and related services: “soil preparation, planting, cultivation, harvest,
fertilizer creation, and postharvest activities…services that supply farm labor, support for animal production…operations
management.”24
While Agricultural Inputs and Services is identified as a strong cluster for the eight‐county region as a whole, it is only
considered a strong cluster in Tehama County, when the counties are considered individually. The map below shows the
strength of this cluster across the state, with the eight‐county region highlighted in black. The color blue denotes
counties where Agricultural Inputs and Services is a strong cluster with high employment specialization and share. This
visual makes clear that, although there is significant agricultural production in these counties, the agricultural cluster is
significantly weaker than in other regions of the State.
22 (KPBS 2016) 23 (California Energy Commission 2016) 24 (U.S. Cluster Mapping Tool)

13
Specialization in Agriculture Cluster by County, 2013
Source: U.S. Cluster Mapping Tool
This analysis now turns to a more detailed analysis of the agricultural landscape in this region in order to identify
important product sets and agricultural trends across the eight counties, which are not revealed by a general cluster
analysis.
Volume of Agricultural Output in the North State Region
These counties have fewer farms than those in other regions of the state, but agriculture remains an important industry
in the region. The map below shows the number of farms across California counties, relying on data from the 2012
Census of Agriculture. Shasta and Tehama counties lead this eight county region in terms of number of farms, while
Modoc, Lassen, Del Norte, and Trinity counties all have less than 500 farms.
Source: Map, New Venture Advisors; Data, 2012 USDA Census of Agriculture

14
The tables below provide a detailed look at the number and size of farms within these counties. Shasta and Tehama
counties lead the region in terms of number of farms, while Modoc, Lassen, and Siskiyou are home to larger farms.
North State Region: Number and Size of Farms
County Number of Farms Average Farm Size (Acres) Median Farm Size (Acres)
Del Norte 121 (D) 20
Humboldt 930 638 40
Lassen 448 1077 80
Modoc 437 1198 277
Shasta 1544 244 15
Siskiyou 929 778 107
Tehama 1743 354 27
Trinity 247 712 40
Total/Average 6399 714 76
Source: 2012 USDA Census of Agriculture
Trends for the value of agricultural production generally correlate with the number of farms per county. The exception
to this trend is Shasta County, which is second in the region in terms of number of farms, but produces just $65.6 million
in agricultural products annually. This is unsurprising given that the median farm size in Shasta is just 15 acres, the
smallest of all eight counties analyzed here. This indicates that the bulk of North State production is occurring outside of
Shasta County and an aggregation hub should consider ways to ensure that it is sourcing from those more distant and
more productive counties as well as from Shasta itself.
The table below shows the total value of agricultural products produced in each of the eight counties. The average value
of agricultural products per California county is $734.96 million. These counties together account for $952.88 million in
agricultural products. Comparing production in these counties to production in the state as a whole emphasizes the fact
that production is much lower in the North State region than in many parts of the Central Valley. However, there is still a
significant level of agricultural production occurring in the North State. Among these counties, Tehama, Siskiyou, and
Humboldt counties are the most significant producers of agricultural product by value in the region.
North State Region: 2012 Value of Production by County
County Total Value of Agricultural Products Sold ($1000s)
Percent of Total Regional Production Value
Del Norte 35,651 4%
Humboldt 203,260 21%
Lassen 72,671 8%
Modoc 106,606 11%
Shasta 65,622 7%
Siskiyou 223,096 23%
Tehama 240,818 25%
Trinity 5,161 1%
Total 952,885 100%
Source: 2012 USDA Census of Agriculture
The table below provides updated information on the value of regional agricultural production from the most recent
California county crop reports, as summarized in the 2014 California Agricultural Statistics Review. Please note that
reports were not published for Modoc or Trinity counties. Significant growth in value since 2012 was reported across all
counties with data presented, ranging from 31% growth in Lassen County to 119% growth in Shasta County. It is worth

15
noting that the data presented in the above and below tables is from two different sources: the USDA Census of
Agriculture in 2012 and the County Agricultural Commissioners’ Reports in 2014.
North State Region: 2014 Value of Production by County, Growth Estimate
County Total Value of Agricultural Products Sold ($1000s)
Increase since 2012 USDA Census of Agriculture
County Rank within State (out of 56)
Del Norte 51,117 43% 45
Humboldt 278,303 37% 30
Lassen 94,947 31% 40
Modoc Data not provided Data not provided Data not provided
Shasta 143,594 119% 36
Siskiyou 363,330 63% 28
Tehama 390,748 62% 26
Trinity Data not provided Data not provided Data not provided
Source: California Agricultural Statistics Review 2014‐2015
Volume of Organic Production in the North State Region
According to the USDA, California leads the country in terms of organic agriculture sales, with $2.2 billion in 2014.25 The
chart below provides a rough overview of organic production in the eight counties of the North State by showing the
number of exempt and certified organic operations in the region. Humboldt is a clear leader with 170 total farms.
North State Region: Organic Production
County # Farms: USDA National Organic Program,Certified Organic Production
# Farms: USDA National Organic Program,Exempt from Certification
Del Norte 10 5
Humboldt 125 45
Lassen 4 1
Modoc 15 1
Shasta 12 20
Siskiyou 30 3
Tehama 18 8
Trinity 2 3
Total 216 86
Source: 2014 USDA Organic Survey
Type of Agricultural Production in the North State Region
Like other regions of California, this eight county region is extremely diverse in terms of the type of agricultural products
that it produces. The following tables aim to provide insights into the breakdown of production by product type across
the eight counties. This information will be used to inform the types of products that an aggregation hub may choose to
focus on and identify need for additional research.
The chart below shows the top crop items and top livestock inventory items for each county. The categories are rather
broad, but provide a sense of the locus of production in each county. Forage‐land is the most prevalent use of acreage
for every county except Tehama, which dedicates more acreage to walnut production. It is worth noting that vegetable
acreage ranks among the top five crop items in five of these counties. Wild rice ranks in both Modoc and Shasta counties
25 (United States Department of Agriculture 2014)

16
as a top crop. Shasta County is the top producer of wild rice in the state and ranks 4th amongst all U.S. counties in terms
of wild rice production, making this an interesting crop to consider for this project.26
North State Region: Top Agricultural Products by County
County 2012 Top Crop Items (acres) 2012 Top Livestock Inventory Items (number)
2014 Leading Commodities (value)
Del Norte Forage‐land (5,915)
Nursery stock crops (D)
Bulbs, coms, rhizomes, tubers –dry (D)
Vegetables harvested, all (54)
Pumpkins (25)
Cattle and calves (14,654)
Layers (1,141)
Broilers & meat chickens (327)
Sheep and lambs (223)
Ducks (216)
Cattle, milk, nursery,
manufactured dairy
Humboldt Forage‐land (10,455)
Vegetables harvested, all (598)
Corn for silage (227)
Grapes (170)
Floriculture and bedding crops (131)
Cattle and calves (56,524)
Sheep and lambs (4,281)
Layers (3,069)
Goats, all (2,980)
Horses and ponies (1,732)
Cattle and calves,
nursery, milk, cattle
(milk cows)
Lassen Forage‐land (35,117)
Bulbs, corms, rhizomes, tubers –dry (D)
Triticale (D)
Wheat for grain, all (901)
Winter wheat for grain (777)
Cattle and calves (40,820)
Sheep and lambs (7,992)
Horses and ponies (1,498)
Layers (1,191)
Hay (other), hay
(alfalfa), vegetables,
cattle (steers)
Modoc Forage‐land (96,740)
Wheat for grain, all (12,102)
Winter wheat for grain (8,314)
Wild rice (4,698)
Vegetables harvested, all (4,386)
Cattle and calves (51,705)
Sheep and lambs (13,462)
Goats, all (2,016)
Horses and ponies (1,271)
Layers (923)
Data not provided
Shasta Forage‐land (13,696)
Wild rice (5,157)
Nursery stock crops (1,812)
Olives (781)
Barley for grain (D)
Colonies of bees (36,305)
Cattle and calves (35,122)
Layers (6,453)
Horses and ponies (4,385)
Goats, all (3,220)
Hay (other), forest,
cattle, rice
Siskiyou Forage‐land (90,042)
Wheat for grain, all (22,209)
Spring wheat for grain (15,964)
Vegetables harvested, all (9,129)
Potatoes (6,217)
Cattle and calves (53,944)
Layers (3,672)
Sheep and lambs (3,494)
Broilers, other meat‐type chickens (2,254)
Horses and ponies (1,956)
Nursery, hay (alfalfa),
cattle and calves,
wheat
Tehama Walnuts, English (22,681)
Forage‐land (17,640)
Olives (8,647)
Plums and prunes (8,056)
Almonds (7,552)
Cattle and calves (61,785)
Colonies of bees (14,427)
Broilers and other meat‐type chickens (7,015)
Sheep and lambs (6,238)
Goats, all (6,221)
Walnuts, almonds,
olives, plums
Trinity Forage‐land (464)
Grapes (231)
Vegetables harvested, all (67)
Apples (19)
Land in berries (14)
Cattle and calves (4,526)
Broilers/other meat‐type chickens (3,027)
Layers (1,466)
Hogs and pigs (744)
Horses and ponies (475)
Data not provided
26 (USDA 2012)

17
(D): Information withheld in order to protect privacy of producer. Source: 2012 USDA Census of Agriculture, California Agricultural
Statistics Review 2014‐2015
Cattle and calves is the highest volume livestock product for all counties except Shasta, where it ranks second after
colonies of bees. Layer chickens are also quite common, ranking in the top five livestock products in 7 of the 8 counties.
This data on cropland usage and the level of livestock inventory within each of the eight counties helps to provide a
sense of the breakdown of the agricultural sector in this North State region.
The following table builds on the previous one by showing the value of production across agricultural product sets, along
with the total value of agricultural production in each county. This table reveals that the most important product sets in
the region, in terms of production value, are Fruits, tree nuts, and berries, ($168.5 million) and Cattle and calves ($151.3
million). Tehama County is the top producer for both of these product categories, and accounts for 93% of the value of
fruits, tree nuts, and berries produced in these eight counties.
North State Region: Value of Agricultural Production ‐ 2012
County Vegetables,
melons,
potatoes, &
sweet
potatoes
($1000)
Fruits,
tree
nuts, and
berries
($1000)
Poultry
& Eggs
($1000)
Cattle &
Calves
($1000)
Milk
from
Cows
($1000)
Hogs &
Pigs
($1000)
Grains,
oilseeds, dry
beans, and
dry peas
Total Value
of
Agricultural
Products
($1000)
Del Norte 25 117 17 1,818 17,214 3 D 35,651
Humboldt 3,917 1,882 60 (D) 73,264 24 124 203,260
Lassen 2,165 (D) 110 22,691 (D) 13 1,882 72,671
Modoc 17,577 51 13 30,891 (D) D D 106,606
Shasta 629 6,559 105 25,751 (D) 28 5,351 65,622
Siskiyou 26,549 947 71 28,184 2,663 57 18,654 223,096
Tehama 330 158,116 279 41,968 21,188 679 5,479 240,818
Trinity (D) 868 37 (D) ‐ 27 ‐ 5,161
Total 51,192 168,540 692 151,303 114,329 831 31,025 952,885
(D): Information withheld in order to protect privacy of producer. Source: 2012 USDA Census of Agriculture
The primary driver of Humboldt’s ranking as third highest total value of agricultural production appears to come from
dairy. While Tehama and Siskiyou, ranked first and second in total value of production, are more diverse in their
production and have significantly higher volumes of fruit and vegetable production, respectively.
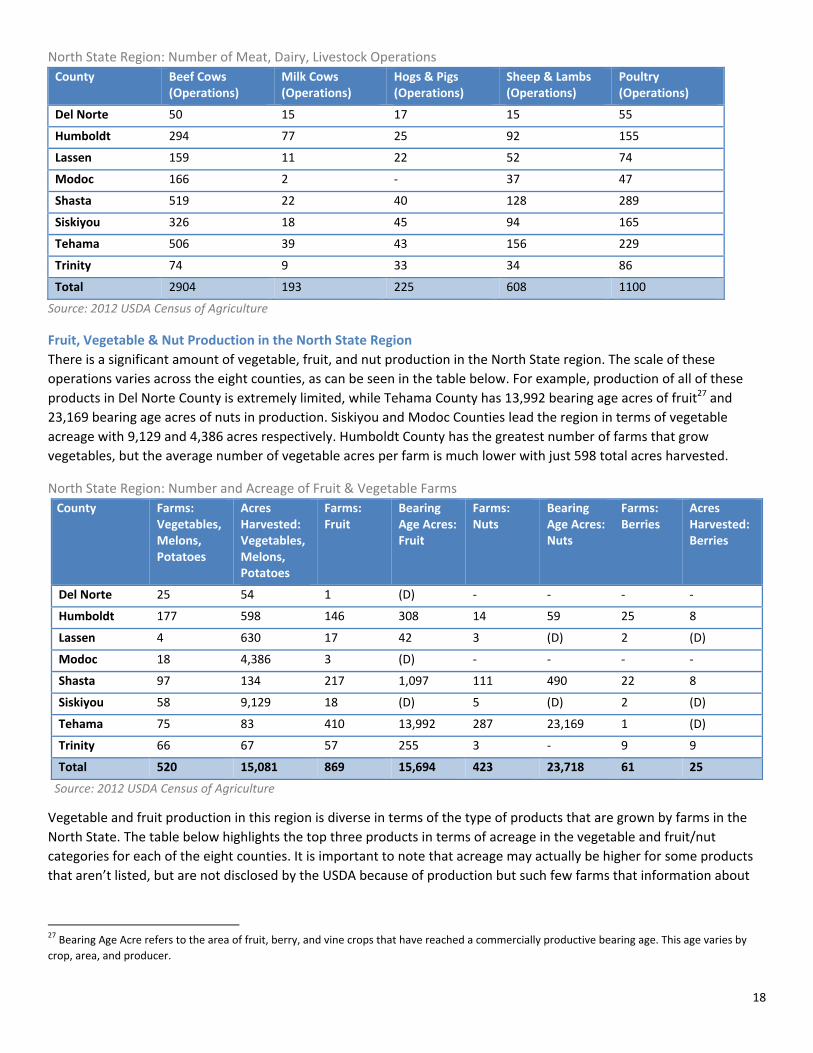
Meat and Livestock Production in the North State Region
There is a significant amount of meat and dairy production in the area. The table below shows the distribution of
production across the region. Across these eight counties, beef and poultry operations are the most common. Shasta
County leads the region with the highest number of beef, sheep & lamb, and poultry operations, and is also home to a
significant number of hog & pig operations. Humboldt County has the largest number of dairy cow operations of the
counties in the region, while Siskiyou County is home to the largest number of hog & pig operations. Note that a single
operation may raise more than one type of livestock, and therefore be counted in multiple categories.
18
North State Region: Number of Meat, Dairy, Livestock Operations
County Beef Cows (Operations)
Milk Cows (Operations)
Hogs & Pigs (Operations)
Sheep & Lambs (Operations)
Poultry (Operations)
Del Norte 50 15 17 15 55
Humboldt 294 77 25 92 155
Lassen 159 11 22 52 74
Modoc 166 2 ‐ 37 47
Shasta 519 22 40 128 289
Siskiyou 326 18 45 94 165
Tehama 506 39 43 156 229
Trinity 74 9 33 34 86
Total 2904 193 225 608 1100
Source: 2012 USDA Census of Agriculture
Fruit, Vegetable & Nut Production in the North State Region
There is a significant amount of vegetable, fruit, and nut production in the North State region. The scale of these
operations varies across the eight counties, as can be seen in the table below. For example, production of all of these
products in Del Norte County is extremely limited, while Tehama County has 13,992 bearing age acres of fruit27 and
23,169 bearing age acres of nuts in production. Siskiyou and Modoc Counties lead the region in terms of vegetable
acreage with 9,129 and 4,386 acres respectively. Humboldt County has the greatest number of farms that grow
vegetables, but the average number of vegetable acres per farm is much lower with just 598 total acres harvested.
North State Region: Number and Acreage of Fruit & Vegetable Farms
County Farms: Vegetables, Melons, Potatoes
Acres Harvested: Vegetables, Melons, Potatoes
Farms: Fruit
Bearing Age Acres: Fruit
Farms: Nuts
Bearing Age Acres: Nuts
Farms: Berries
Acres Harvested: Berries
Del Norte 25 54 1 (D) ‐ ‐ ‐ ‐
Humboldt 177 598 146 308 14 59 25 8
Lassen 4 630 17 42 3 (D) 2 (D)
Modoc 18 4,386 3 (D) ‐ ‐ ‐ ‐
Shasta 97 134 217 1,097 111 490 22 8
Siskiyou 58 9,129 18 (D) 5 (D) 2 (D)
Tehama 75 83 410 13,992 287 23,169 1 (D)
Trinity 66 67 57 255 3 ‐ 9 9
Total 520 15,081 869 15,694 423 23,718 61 25
Source: 2012 USDA Census of Agriculture
Vegetable and fruit production in this region is diverse in terms of the type of products that are grown by farms in the
North State. The table below highlights the top three products in terms of acreage in the vegetable and fruit/nut
categories for each of the eight counties. It is important to note that acreage may actually be higher for some products
that aren’t listed, but are not disclosed by the USDA because of production but such few farms that information about
27 Bearing Age Acre refers to the area of fruit, berry, and vine crops that have reached a commercially productive bearing age. This age varies by
crop, area, and producer.

19
acreage could be linked back to a specific grower. However, even with this caveat, the data set below illustrates the
diversity of vegetable, fruit and nut production in the region and gives a sense of the variance from county to county.
North State Region: Top Crop Production of Vegetables & Melons, Fruits & Tree Nuts
County Top Three Vegetables & Melons (Acres) Top Three Fruits & Tree Nuts (Acres)
Del Norte 1. Pumpkins (25)2. Kale (6) 3. Lettuce (5)
(D)
Humboldt 1. Pumpkins (109)2. Potatoes (82) 3. Tomatoes in the open (66)
1. Grapes (170)2. Apples (112) 3. Chestnuts (53)
Lassen* 1. Watermelons (3) 1. Apples (26)2. Peaches (11) 3. Grapes (9)
Modoc* 1. Lima Beans (7)2. Cantaloupes & Muskmelons (7)
(D)
Shasta 1. Tomatoes in the open (41)2. Squash, all (16) 3. Cantaloupes & Muskmelons (15)
1. Olives (781)2. Walnuts (539) 3. Grapes (201)
Siskiyou 1. Potatoes (6,217)2. Onion, dry (2,837) 3. Pumpkins (15)
1. Apples (24)2. Grapes (19) 3. Walnuts (3)
Tehama 1. Tomatoes in the open (18)2. Pumpkins (13) 3. Cantaloupes & Muskmelons (12)
1. Walnuts (22,681) 2. Olives (8,647) 3. Almonds (7,552)
Trinity 1. Tomatoes in the open (13)2. Peppers, Bell (6) 3. Cantaloupes & Muskmelons (6) 4. Lettuce (6)
1. Grapes (231)2. Apples (19) 3. Pears (10)
*Most information on vegetable acreage is redacted, so production may be greater in other crops. (D): Information
withheld in order to protect privacy of producer. Source: 2012 USDA Census of Agriculture
Regional Seafood & Fisheries Production and Cluster Analysis Fishing emerged as a strong cluster in the eight‐county North State region through use of the U.S. Cluster Mapping tool.
This cluster includes five industries that are “engaged primarily in catching fish and other seafood and processing the

20
catch for consumption.”28 It is perhaps unsurprising that the coastal counties, Del Norte and Humboldt, have strong
fishing clusters. More interesting is the fact that Lassen County, which borders Nevada, also has a strong fishing cluster.
Specialization in Fishing Cluster by County, 2013
Source: U.S. Cluster Mapping Tool
Specialization in the fishing cluster is generally concentrated along the coast. There are several important fishing ports in
Del Norte and Humboldt counties29:
Crescent City (Del Norte County): In 2007, there were approximately 100 vessels based at the port, which were
primarily crabber/trollers, with the exception of five groundfish/shrimp trawlers. Most fishermen at Crescent
City fish multiple fisheries (i.e. shrimp and crab).
Trinidad (Humboldt County): Home to 17 commercial fishing operations in 2007. Most of these operations were
managed by one skipper and a crew of two, meaning that they were relatively small operations.
Eureka/Fields Landing (Humboldt County): In 2007, there were between 100‐120 fishing boats based in Eureka
Landing. This group included approximately 20 salmon trollers, 5‐10 groundfish vessels, 80 crabbers, and 8‐10
trawlers.
Data collected by the California Department of Fish and Wildlife provides a more complete picture of the level of fishing
occurring in these ports today. The table below shows the top fisheries for each port in terms of pounds landed, along
with the reported market value of the commercial landings. It is important to note that the market value is self reported
and fishermen often underreport the price received for their catch. A representative of the Department explained that
there is some distrust of the data collection process among fishermen, which leads to less honest disclosure of data.
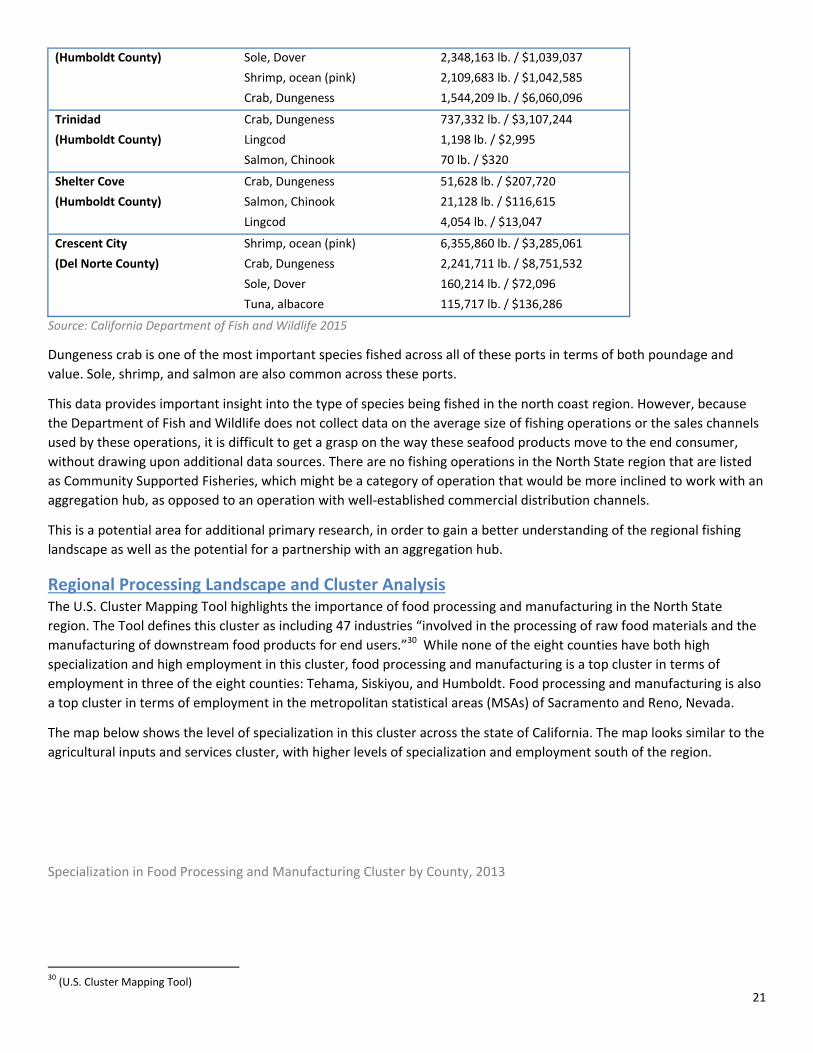
North State Region: Value of Commercial Landings By Port – 2014
Port Species Pounds/Value
Eureka Squid, market 4,794,649 lb. / $1,558,261
28 (U.S. Cluster Mapping Tool) 29 (Pomeroy et al. 2010)
21
(Humboldt County) Sole, Dover
Shrimp, ocean (pink)
Crab, Dungeness
2,348,163 lb. / $1,039,037
2,109,683 lb. / $1,042,585
1,544,209 lb. / $6,060,096
Trinidad
(Humboldt County)
Crab, Dungeness
Lingcod
Salmon, Chinook
737,332 lb. / $3,107,244
1,198 lb. / $2,995
70 lb. / $320
Shelter Cove
(Humboldt County)
Crab, Dungeness
Salmon, Chinook
Lingcod
51,628 lb. / $207,720
21,128 lb. / $116,615
4,054 lb. / $13,047
Crescent City
(Del Norte County)
Shrimp, ocean (pink)
Crab, Dungeness
Sole, Dover
Tuna, albacore
6,355,860 lb. / $3,285,061
2,241,711 lb. / $8,751,532
160,214 lb. / $72,096
115,717 lb. / $136,286
Source: California Department of Fish and Wildlife 2015
Dungeness crab is one of the most important species fished across all of these ports in terms of both poundage and
value. Sole, shrimp, and salmon are also common across these ports.
This data provides important insight into the type of species being fished in the north coast region. However, because
the Department of Fish and Wildlife does not collect data on the average size of fishing operations or the sales channels
used by these operations, it is difficult to get a grasp on the way these seafood products move to the end consumer,
without drawing upon additional data sources. There are no fishing operations in the North State region that are listed
as Community Supported Fisheries, which might be a category of operation that would be more inclined to work with an
aggregation hub, as opposed to an operation with well‐established commercial distribution channels.
This is a potential area for additional primary research, in order to gain a better understanding of the regional fishing
landscape as well as the potential for a partnership with an aggregation hub.
Regional Processing Landscape and Cluster Analysis The U.S. Cluster Mapping Tool highlights the importance of food processing and manufacturing in the North State
region. The Tool defines this cluster as including 47 industries “involved in the processing of raw food materials and the
manufacturing of downstream food products for end users.”30 While none of the eight counties have both high
specialization and high employment in this cluster, food processing and manufacturing is a top cluster in terms of
employment in three of the eight counties: Tehama, Siskiyou, and Humboldt. Food processing and manufacturing is also
a top cluster in terms of employment in the metropolitan statistical areas (MSAs) of Sacramento and Reno, Nevada.
The map below shows the level of specialization in this cluster across the state of California. The map looks similar to the
agricultural inputs and services cluster, with higher levels of specialization and employment south of the region.
Specialization in Food Processing and Manufacturing Cluster by County, 2013
30 (U.S. Cluster Mapping Tool)

22
Source: U.S. Cluster Mapping Tool
However, the entirety of the food processing and manufacturing cluster is not relevant to this study. This report will look
more closely at four relevant sub‐clusters: fruit and vegetable processing, milling, dairy processing, livestock processing.
Packaged Fruit and Vegetable Sub‐cluster
The Packaged Fruit and Vegetable sub‐cluster has the lowest presence of the four aforementioned sub‐clusters in this
eight county region. Tehama County is the only county in the supply radius to have a high employment specialization
and share for this sub‐cluster.
Specialization in Packaged Fruit and Vegetable Sub‐cluster by County, 2013
Source: U.S. Cluster Mapping Tool
Packaged Fruit and Vegetable industries appear to be stronger in areas to the south of Shasta County. The Bay Area has
a high employment share in this sub‐cluster. Unsurprisingly, the Central Valley appears to have a particularly strong
packaged fruit and vegetable presence.
This data is supported by additional secondary research into the presence of fruit and vegetable processors in Northern
California. Research revealed no fruit and vegetable processors within the eight county region, let alone processors that
cater to the needs of small growers or growers who market their products as “local.” The table below highlights the
most relevant produce processors to this project.
Northern California Produce Processors: Outside of Region
Company Name Location Product
California Fruit Processors Stockton Processed fruits &

23
vegetables – no online presence.
Mariani Vacaville Packaged dried fruits for retail – under own label
Seneca Foods Courtland Processed fruit, beans, & vegetables under private label or Seneca’s labels. Shelf stable and frozen options.
Stanislaus Food Products Modesto Specialize in “real Italian” tomato products
Milling and Refining of Cereals and Oilseeds Sub‐cluster
The milling and refining of cereals and oilseeds sub‐cluster reveals a stronger presence in the northernmost counties of
California than that of the produce processing sub‐cluster. The map of specialization suggests that Humboldt and
Tehama counties both have a strong Milling and Refining sub‐cluster, meaning that both employment share and level of
specialization are high in these counties.
Specialization in Milling and Refining of Cereals and Oilseeds Sub‐cluster by County, 2013
Source: U.S. Cluster Mapping Tool
This trend is interesting given that there is a significant level of grain produced in the eight‐county region, at a
production value of $31 million annually, not to mention the high level of wild rice production based in Shasta and
Modoc counties.
It will be critical during the primary research phase to gain a better understanding of the flow of grains into and out of
the current grain processing facilities in Humboldt and Tehama counties, and evaluate opportunities to improve
distribution.
Dairy Processing Sub‐cluster
Humboldt and Del Norte counties both register as having high employment specialization in the Dairy Products Sub‐
cluster. Humboldt is stronger in this sub‐cluster than Del Norte, but both rank higher than surrounding counties.
Specialization in Dairy Processing Sub‐cluster by County, 2013

24
Source: U.S. Cluster Mapping Tool
Given the colocation of dairy processing sub‐clusters with the majority of dairy production in this region, there will likely
not be as strong of a need for analysis of distribution between production and processing facilities. However, it may be
worth spending time in primary research to better understand the flow of processed dairy products from these facilities
to wholesale buyers within and outside of the region.
High employment specialization and high employment share of dairy processing is less widespread across the state than
was the case for the packaged fruit and vegetable sub‐cluster, but there is still a concentration of activity in the Central
Valley, along I‐5. Washoe County, Nevada, which includes Reno, Nevada, is also considered to have a high employment
share in this sub‐cluster.
Livestock Processing Sub‐cluster
Although there is a significant presence of meat production in Northern California, none of these regions had strong
livestock processing clusters. This finding indicates the need for additional research into the meat processing landscape
within the region. During the primary research phase, it will be important to evaluate the need for additional meat
processing infrastructure in the region with particular attention paid to cattle, given the volume of production in the
region. However, stringent regulations for meat processing facilities are often considered barriers for inclusion in food
hub model development. Additional analysis within this sub‐cluster should carefully weigh the benefits and challenges
that would be associated with including meat processing in the hub’s scope of services.
Regional Wholesale Landscape and Cluster Analysis Distribution emerged as a strong cluster in many parts of Northern California, and ranked as a top employer in all but
two of the eight counties in the North State region. In total, the Distribution and E‐Commerce cluster includes 62
industries, many of which are not directly relevant to the movement of food. Instead, here we focus on the Wholesale of
Food Products Sub‐cluster. A map of the level of specialization in this sub‐cluster across California is below.
Specialization in Wholesale of Food Products Sub‐cluster by County, 2013

25
Source: U.S. Cluster Mapping Tool
There is a significant level of food wholesaling activity in Siskiyou, Modoc, and Trinity counties, as well as in Reno,
Nevada, Sacramento, and the Bay Area. The strong clusters in Sacramento and the Bay Area make sense given the large
populations living in those regions. However, it is interesting to see a high employment specialization level in Siskiyou,
Modoc, and Trinity counties.
There are a significant number of distribution companies that serve the Northern California region. However, relatively
few of these distributors focus on the distribution of local products.
The table below highlights traditional food wholesale distributors in Northern California. Most are located outside of the
eight‐county region, with the exception of Pro Pacific Fresh and Pacific Fresh Seafood Company.
Northern California Wholesale Food Distributors
Company Name City Diverse Product Set
Offers Local
Source Identified
Notes
Within North State Region
Pro Pacific Fresh Redding Y N? N Fresh produce, dairy, deli
Pacific Fresh Seafood Company
Eureka, Sacramento
Y N N Seafood only – International distributor
Outside of North State Region
Jacmar Food Service Northern California
West Sacramento
Y N N
Tony’s Fine Foods West Sacramento
Y N N No fresh produce – meat & seafood, bakery, cheese, deli
Nor Cal Produce West Sacramento
Y N? N? Produce only
C & S Wholesale Grocers Sacramento Y N N Large distributor
Calvada Food Sales Co Sacramento, and Reno
Specialize in meat distribution

26
Sysco Reno Y Y N Large distributor
Mahoney’s Seafood Inc. San Francisco Y N? N Small seafood distributor
US Foods San Francisco Y Y N Large distributor
Additional research on these distributors should be conducted in the primary phase, to better understand their
participation or barriers to their participation in the movement of local, source‐identified products.
Regional Demand Landscape for Agriculture‐Related Products This analysis now moves to a discussion of the demand landscape across the North State region and in nearby
metropolitan markets. This section includes a high level analysis of regional consumer expenditures on food products,
and discussion of the retail, institutional, and restaurant landscape.
Consumer Demand
Households in this eight county region spent a combined $1.435 billion on food between July 2014 and June 2015. The
table below breaks this number down by category.
North State Region: Consumer Spending on Food
Fruit & Vegetables Cereals & Bakery Products Meat, Poultry, Fish, & Eggs Dairy Products
$282,856,853 $177,211,522 $317,276,783 $150,970,585
Source: BLS CEX 2014; ACS 2014
Meat, poultry, fish & eggs constitute the largest category of consumer expenditure on food at $317M, followed by fruits
and vegetables at $283M.
There are several important metropolitan areas within 300 miles of Shasta County that may be potential markets for
North State food hub sales. These markets include Reno, Nevada, the San Francisco Bay Area, and Sacramento. All are
within a four‐hour drive from Anderson, CA. The Sacramento MSA and San Francisco Bay Area are both accessible
primarily by I‐5. Reno is connected to Anderson, CA via Hwy‐44/US‐395 or I‐80.
The table below shows combined household expenditures on each product category for these metropolitan areas. For
comparison, the Redding, California Metro Area is included, as it is the largest urban area within the North State region.
Nearby Major Metropolitan Markets: Consumer Spending on Food
Market Fruit & Vegetables
Cereals & Bakery Products
Meat, Poultry, Fish & Eggs
Dairy Products Total Food Expenditures
Redding, CA Metro Area
$100,577,555 $63,012,444 $112,816,511 $53,681,755 $510,400,800
Reno ‐ Sparks, NV Metro Area
$239,077,581 $149,783,544 $268,170,154 $127,604,058 $1,213,246,710
Sacramento – Arden – Arcade – Roseville Metro Area
$1,142,167,073 $715,574,552 $1,281,153,669 $609,614,474 $5,796,153,870
San Francisco – Oakland – Fremont Metro Area
$2,356,277,470 $1,476,222,030 $2,643,005,211 $1,257,627,614 $11,957,398,440
Sources: BLS CEX By Region July 2014‐June 2015; 2012 ACS Five Year Estimates
As compared to Redding, total food expenditure is more than 2 times greater in Reno, 10 times greater in Sacramento
and 20 times greater in San Francisco. As such, it will be critical for the food hub to have access to these markets

27
outside of the North State region to ensure maximum sales potential. Given that the prospective food hub site in
Anderson, California is within four hours of each of these markets, the feasibility of serving these markets is high.
Retail Sector
Retail outlets are an important potential set of buyers for a food hub. Northern California is home to a number of
supermarket chains that have begun local purchasing initiatives in order to respond to rising consumer demand for local
food. These include national specialty grocery chains such as Whole Foods, as well as local grocery chains such as
Holiday Market and Raley’s.
The Healthy Shasta Local Food Guide lists eight retail stores in Shasta County alone that sell locally produced foods.31
This set of retailers will likely serve as potential customers for a North State regional food hub.
Whole Foods: Whole Foods is well known for its strong local purchasing programs. The company’s definition of local
varies from store to store. The map below shows the distribution of Whole Foods stores across northern California and
Reno. There are forty locations in this region. While there is one location in Reno and several in the Sacramento area,
the majority of the chain’s northern California locations are in the San Francisco Bay Area.
While there are no Whole Foods store locations in the eight‐county North State region, the presence of stores in
neighboring regions and metropolitan markets may merit additional primary research to quantify interest in food hub
purchase potential from Whole Foods.
Whole Foods Northern California Store Location Map
Source: Whole Foods, Google Maps
Holiday Market: Holiday Market is a 12‐store grocery chain operating across Northern California. Holiday Market has a
commitment to organic and local sourcing of produce, meats, dairy, wine and grocery items ‐ with over 1,200 local
products in their inventory.32 The chain has 5 locations in the North State region, including 4 locations in Shasta County
and 1 location in Modoc County. Two of the Shasta County store locations are in Redding, California.
Holiday Market Store Location Map
31 http://healthyshasta.org/downloads/eathealthy/resources/LocalFoodGuide_4‐25‐13.pdf 32 Holiday Market website: http://shophqf.com/foodwine.html
28
Source: Holiday Market, Google Maps
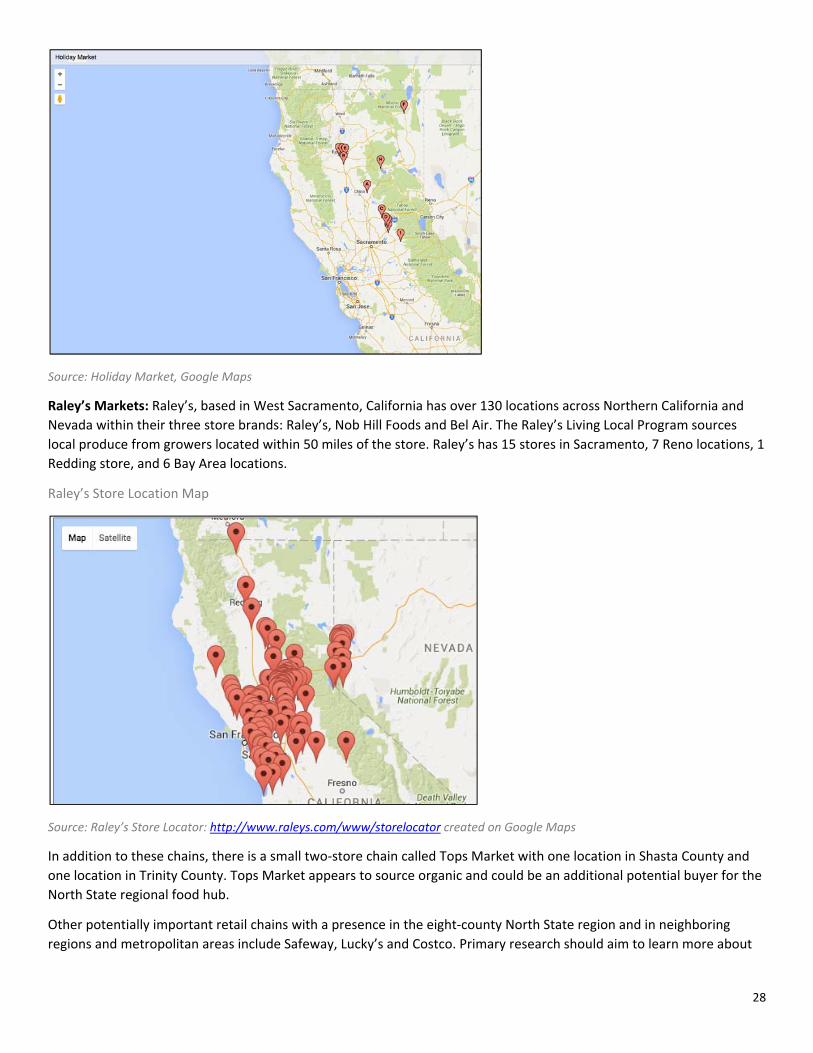
Raley’s Markets: Raley’s, based in West Sacramento, California has over 130 locations across Northern California and
Nevada within their three store brands: Raley’s, Nob Hill Foods and Bel Air. The Raley’s Living Local Program sources
local produce from growers located within 50 miles of the store. Raley’s has 15 stores in Sacramento, 7 Reno locations, 1
Redding store, and 6 Bay Area locations.
Raley’s Store Location Map
Source: Raley’s Store Locator: http://www.raleys.com/www/storelocator created on Google Maps
In addition to these chains, there is a small two‐store chain called Tops Market with one location in Shasta County and
one location in Trinity County. Tops Market appears to source organic and could be an additional potential buyer for the
North State regional food hub.
Other potentially important retail chains with a presence in the eight‐county North State region and in neighboring
regions and metropolitan areas include Safeway, Lucky’s and Costco. Primary research should aim to learn more about

29
the local purchasing efforts that are already being taken on by these supermarkets and the potential for a North State
regional food hub to sell into these prospective customers.
Institutional Buyers
Institutions such as hospitals and schools are another important purchaser of food. This section seeks to describe the
institutional buyer landscape in the eight counties within the North State region and present local purchasing efforts
already underway at these institutions.
The table below provides a count of these buyers broken out by type for Shasta County and the eight‐county North State
Region as a whole. While there are a large number of school districts in this part of the state, colleges/universities and
hospitals are not as plentiful in the area.
North State Region: Potential Institutional Buyers
Category Shasta County North State Region
School Districts33 28 134
Colleges & Universities34 3 6
Hospitals35 2 9
However, among the institutions that are located in this region, local purchasing is fairly common. This is particularly
true in the case of school districts. The table below lists those school districts that spent at least $10,000 of their annual
food budget on local food during the 2013‐14 academic year. These school districts are fairly evenly spread across just
Humboldt, Shasta, and Tehama counties. As of the 2015 Farm to School Census there were no school districts in the
other five counties that spent more than $10,000 on local food products.
North State Region: Farm to School Programs
School District County Food Budget Spent Locally in 2013‐20114 Farm to School Census
Total Annual Food Budget 2013‐2014
Plans for Local Purchasing in Coming School Year
Mattole Unified School District
Humboldt $11,500 $14,000 Increase
McKinleyville Union Elementary School District
Humboldt $12,500 $110,000 Increase
Scotia Union Elementary School District
Humboldt $20,000 $50,000 Increase
Castle Rock Union Elementary School District
Shasta $13,000 $15,000 Increase
Enterprise Elementary School District
Shasta $70,000 $910,000 Maintain
Gateway Unified School District
Shasta $150,000 $400,000 Maintain
Black Butte Union Elementary School District
Shasta $21,600 $47,025 Increase
33 (National Center for Education Statistics 2015) 34 (Univsource n.d.) 35 Yelp.com
30
Corning Union School District
Tehama $12,500 $502,680 Maintain
Evergreen Union School District
Tehama $50,000 $160,000 Increase
Richfield Elementary School District
Tehama $10,000 $37,000 Increase
Source: 2015 USDA Farm to School Census
These districts all plan to either maintain or increase their local purchasing in the coming school year, a promising trend
for local producers and distributors that seek to focus on local products.
Local sourcing among hospitals and colleges or universities is harder to discern through secondary research alone. The
table below lists institutions in those categories that have known local procurement programs in place. Primary research
should be conducted to identify additional local sourcing initiatives within these types of institutional buyers.
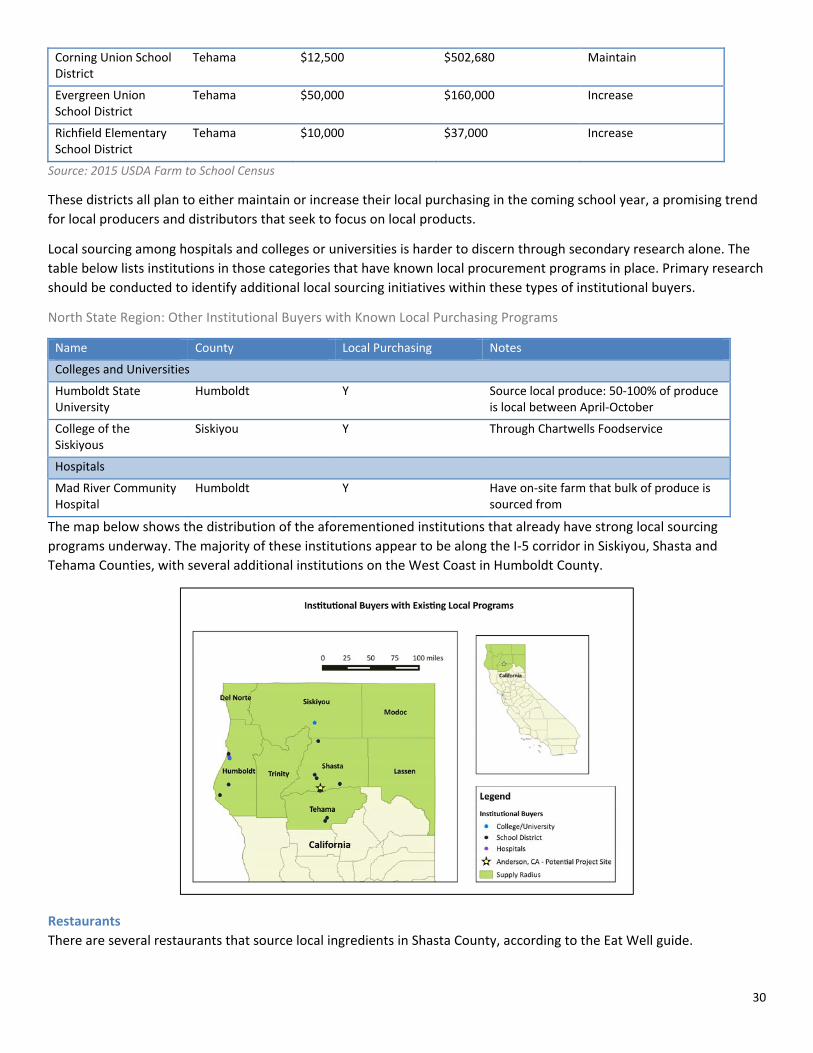
North State Region: Other Institutional Buyers with Known Local Purchasing Programs
Name County Local Purchasing Notes
Colleges and Universities
Humboldt State University
Humboldt Y Source local produce: 50‐100% of produce is local between April‐October
College of the Siskiyous
Siskiyou Y Through Chartwells Foodservice
Hospitals
Mad River Community Hospital
Humboldt Y Have on‐site farm that bulk of produce is sourced from
The map below shows the distribution of the aforementioned institutions that already have strong local sourcing
programs underway. The majority of these institutions appear to be along the I‐5 corridor in Siskiyou, Shasta and
Tehama Counties, with several additional institutions on the West Coast in Humboldt County.
Restaurants
There are several restaurants that source local ingredients in Shasta County, according to the Eat Well guide.

31
Humboldt County, one of the two coastal counties in this region, has a growing farm to table movement. The county has
a restaurant week in September and has officially dubbed the month Local Food Month. A recent article on the subject
listed six upscale restaurants in the county that source local.36
The table below highlights the restaurants currently sourcing local as listed in these two resources.
North State Region: Restaurants that Source Locally
Restaurant Town County Cuisine
View 202 Redding Shasta Modern American
Woodside Grill Redding Shasta American
Chipotle Mexican Grill Redding Shasta Mexican – Fast Food
Folie Douce Arcata Humboldt Mediterranean‐French
Japhy’s Arcata Humboldt Asian Noodle House
La Trattoria Bayside Humboldt Italian
Taste Eureka Humboldt American
Brick & Fire Bistro Eureka Humboldt Mediterranean
Restaurant 301 Eureka Humboldt American
Source: Eat Well; Redwood Vacations
There are undoubtedly more restaurants with local sourcing efforts that could be uncovered through additional
research. The local sourcing efforts of these restaurants and others yet to be identified in the North State region is a key
area for additional research, as this group of buyers could be an important customer base for the North State regional
food hub.
The large markets that are within range of the potential food hub may also provide opportunities to sell to restaurants.
For example, the San Francisco Bay Area is a renowned leader in the local food movement and has a strong group of
farm to table restaurants across the metropolitan area.
The North State regional food hub would likely service restaurant buyers outside of the region through a distributor that
provides metropolitan area restaurants with regionally sourced products. The next phase of research should further
evaluate the local and regional food product distributors serving Reno, Sacramento and San Francisco Bay metropolitan
areas.
LOCAL FOOD INITIATIVES WITHIN THE REGION
Local Food Hubs and Distribution Initiatives There are a number of existing food hubs serving Northern California. However, none of these are located within the
eight‐county North State Region.
The hub currently furthest to the north is the North Valley Food Hub in Chico, California. North Valley Food Hub is a
virtual marketplace that facilitates the sale of local fruit and vegetables to wholesale buyers.
The map below shows the location of existing food hubs or ongoing food hub projects across Northern California. Given
the distribution of these hubs and ongoing projects between the North State Region and the southern metropolitan
markets of Sacramento and the San Francisco Bay Area, it will be important to evaluate the potential to collaborate with
these food hubs to reach those markets most efficiently.
36 (Redwood Vacations 2015)

32
The table below provides details on the existing food hubs that are currently serving Northern California.
Existing Food Hubs in Northern California, Outside of North State Region
Hub Name City (Distance from Anderson, CA)
Diverse Product Set
Offers Local Source Identified
Notes
North Valley Food Hub
Chico
(60 miles S)
N Y Y Virtual hub, fruit & vegetables only
Next Generation Foods
Olivehurst
(112 miles S)
N? Y Y Sell to restaurants and retailers
Capay Valley Farm Shop
Esparto
(130 miles S)
N Y Y Primarily direct to consumer, but also sell to institutions. Products rotate each week, selection seems fairly limited
Mandela Foods Distribution
Oakland
(200 miles SW)
N Y Y Connected to Mandela Marketplace, produce only
Tahoe Food Hub Alpine Meadows
(200 miles SE)
N Y Y? Produce only
Recent Food Hub Studies in Northern California
In addition to the existing food hubs serving Northern California, in recent years there have been a number of additional
food hub studies and projects in the region. These range from feasibility studies for a single food hub to research into
the potential for a food hub network that would increase local food distribution across the state. These initiatives are
described below.
Sacramento Food Hub Feasibility Study (2015): The Sacramento Food Hub Feasibility Study was completed in 2015 and
found that there is a need for a food hub serving the Sacramento area. The project estimated that although local
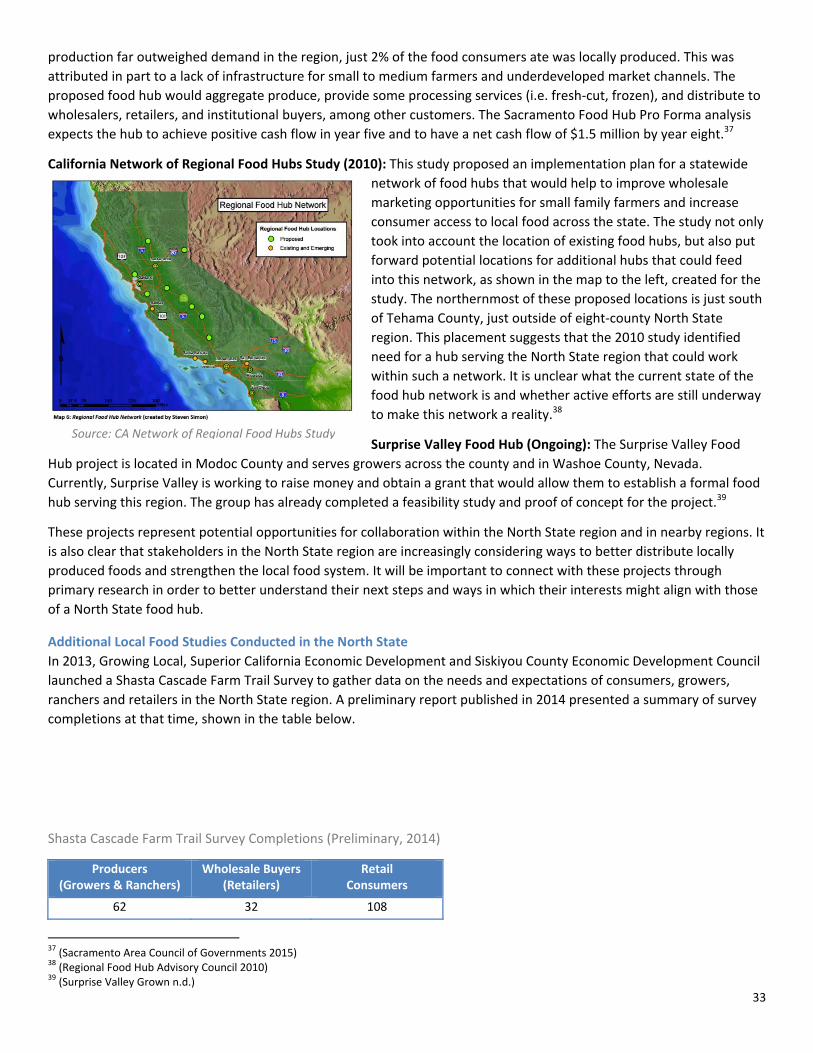
33
production far outweighed demand in the region, just 2% of the food consumers ate was locally produced. This was
attributed in part to a lack of infrastructure for small to medium farmers and underdeveloped market channels. The
proposed food hub would aggregate produce, provide some processing services (i.e. fresh‐cut, frozen), and distribute to
wholesalers, retailers, and institutional buyers, among other customers. The Sacramento Food Hub Pro Forma analysis
expects the hub to achieve positive cash flow in year five and to have a net cash flow of $1.5 million by year eight.37
California Network of Regional Food Hubs Study (2010): This study proposed an implementation plan for a statewide
network of food hubs that would help to improve wholesale
marketing opportunities for small family farmers and increase
consumer access to local food across the state. The study not only
took into account the location of existing food hubs, but also put
forward potential locations for additional hubs that could feed
into this network, as shown in the map to the left, created for the
study. The northernmost of these proposed locations is just south
of Tehama County, just outside of eight‐county North State
region. This placement suggests that the 2010 study identified
need for a hub serving the North State region that could work
within such a network. It is unclear what the current state of the
food hub network is and whether active efforts are still underway
to make this network a reality.38
Surprise Valley Food Hub (Ongoing): The Surprise Valley Food
Hub project is located in Modoc County and serves growers across the county and in Washoe County, Nevada.
Currently, Surprise Valley is working to raise money and obtain a grant that would allow them to establish a formal food
hub serving this region. The group has already completed a feasibility study and proof of concept for the project.39
These projects represent potential opportunities for collaboration within the North State region and in nearby regions. It
is also clear that stakeholders in the North State region are increasingly considering ways to better distribute locally
produced foods and strengthen the local food system. It will be important to connect with these projects through
primary research in order to better understand their next steps and ways in which their interests might align with those
of a North State food hub.
Additional Local Food Studies Conducted in the North State
In 2013, Growing Local, Superior California Economic Development and Siskiyou County Economic Development Council
launched a Shasta Cascade Farm Trail Survey to gather data on the needs and expectations of consumers, growers,
ranchers and retailers in the North State region. A preliminary report published in 2014 presented a summary of survey
completions at that time, shown in the table below.
Shasta Cascade Farm Trail Survey Completions (Preliminary, 2014)
Producers (Growers & Ranchers)
Wholesale Buyers (Retailers)
Retail Consumers
62 32 108
37 (Sacramento Area Council of Governments 2015) 38 (Regional Food Hub Advisory Council 2010) 39 (Surprise Valley Grown n.d.)
Source: CA Network of Regional Food Hubs Study

34
Source: Shasta Cascade Farm Trail Survey Preliminary Report, Growing Local
The report presented preliminary results of the survey, including the following data on the demographics, needs and
interests of these three categories of respondents. 40
Producers:
30% make 50‐100% of their income from farming or ranching
60% interested in significantly increasing their income from agriculture if it could be done profitably
36% define local as North State, 38% define local as Shasta County
Listed temporary help, market & advertising, packaging & distribution as top barriers to growth
Top sales channels included on‐site (over 60%), farmers market (over 30%), restaurants (approximately 30%) and stores (approximately 30%)
Wholesale Buyers:
59% define local as North State, 18% define local as Shasta County
Ranked “grown/produced locally” almost evenly with “price”, “freshness and appearance” in likelihood to positively affect customers purchase decisions; “knowing the grower/rancher” was ranked lower
81% would be interested in purchasing and promoting locally grown or produced foods, or increasing the amount currently offered
89% felt their consumers would be willing to pay a price premium for locally grown or produced food, with 41% estimating a willingness to pay a 15% premium and 15% estimating a willingness to pay a 20% premium
Over 90% expressed the following concerns with carrying local food products: availability in season, price, quality, seasonality of products
Consumers:
61% define local as North State, 26% define local as Shasta County
Ranked “grown/produced locally” almost evenly with “price”, “freshness and appearance” in likelihood to positively affect customers purchase decisions; “knowing the grower/rancher” was ranked lower
94% said they would be willing to pay a price premium for locally grown or produced food, with 33% willing to pay a 15% premium and 25% willing to pay a 20% premium
Local Sourcing Initiatives California is often considered a pioneer in the local food movement. However, the strength of local food distribution and
the presence of local food initiatives varies significantly across the state, as indicated by the state’s Locavore Index
rating.
The Locavore index takes into account each state’s per capita sales by farmers directly to consumers; along with per‐
capita numbers of farmers markets, community supported agriculture (CSAs), food hubs and the percentage of school
districts with farm‐to‐school programs. 41
California ranked 36th in the 2015 Locavore Index, up from 38th in 2014. As shown in the table below, the state had
approximately 761 farmers markets, 369 CSAs, 56% of schools participating in farm to school activities, 12 food hubs and
$4.38 in direct farm‐to‐consumer sales per capita in 2015.
40 (Shasta Cascade Farm Trail Survey Preliminary Report, Growing Local 2014) 41 (Strolling of the Heifers 2015)

35
California: Local Food Statistics
# Farmers
Markets
# CSAs Farm‐to‐School %
# Food Hubs Direct sales /capita
Locavore Rank (out of 50)
761 369 56% 12 $4.38 36th
Source: Locavore Index 2015
Many of these data points at face value compare well against other states in the country. California had the highest
number of farmers markets, the third highest number of CSAs, and the fifth highest number of food hubs in the country
in 2015. However, California also had the highest population per state at 38,802,500 in 2015. As a result, these data
points paled in comparison to many other states when considered at the per‐capita level, especially the direct farm‐to‐
consumer sales per capita where California was ranked 27th.
The Locavore ranking and accompanying data on local food consumption suggest that California has significant room to
improve in terms of local food systems development across the state’s dispersed population. More remote areas of the
state which tend to have lesser presence of local food initiatives, such as the eight‐county North State region, are likely
to benefit from an increased focus on regional food distribution and to impact the state’s overall performance in the
index in future years.
North State Spotlight: Local Food Infrastructure and Initiatives
The eight counties of the North State region have a growing number of CSAs and farmers markets that are helping to
connect producers directly with consumers. Secondary research revealed 19 CSAs across these counties, at an average
of 2.4 CSAs per county.42 This is significantly lower than the state average of 6.4 CSAs per county. Humboldt County is
home to 9 of those CSAs ‐ more than half of those within the region, a trend that is mirrored in a heavier distribution of
farmers markets within Humboldt County as compared to the rest of the region.
According to the USDA Local Food Directory, this eight county region is home to 42 total farmers markets. In addition to
the 16 farmers markets located in Humboldt County, 12 can be found in Shasta County. The city of Anderson has 2
farmers markets and Redding has 6. There is at least one farmers market in each of these eight counties.
The image below provides a view of the farmers markets and CSAs across the region.
42 (Local Harvest 2016; Healthy Shasta 2013; USDA AMS 2016)

36
Source: USDA Local Food Directory; Healthy Shasta; Local Harvest
The table provides a count of farmers markets by county and/or city within the North State region.
North State Region: Farmers Markets and CSAs by County & City
Area Number of Farmers Markets Number of CSAs
Shasta County 12 5
Del Norte County 1 1
Humboldt County 16 9
Lassen County 1 ‐
Modoc County 1 ‐
Siskiyou County 7 3
Tehama County 3 1
Trinity County 3 ‐
Anderson, CA 2 ‐
Redding, CA 6 2
Source: Local Harvest 2016, Healthy Shasta 2013, USDA Local Food Directories 2016
It appears that Humboldt and Shasta counties have considerably more local food activity already in place. It may be
worth identifying potential buyers in Humboldt County due to the high number of local food activities, including the
countywide activities such as restaurant week and Local Food Month that occur there.
37
CONCLUSIONS AND KEY TAKEAWAYS
Anderson, California within Shasta County appears to be well positioned as a potential site for a food hub that
aggregates and distributes agriculture‐related products for growers in the eight‐county North State region of California.
This area is easily accessible by rail and by Interstate 5, the major commercial corridor that runs directly through
Anderson. Major markets outside of the eight‐county region are accessible within one day’s drive, and the area is fairly
well connected to the surrounding counties.
While production in the region is lower than in California’s Central Valley, there are a large and diverse set of producers
that operate across the eight counties, creating opportunity for a food hub to carry a diverse product set.
Currently, these counties are not being served by a food hub or traditional distributor that emphasizes local. There also
appear to be very few processors that focus on the needs of small‐medium producers in the region. It will be important
to gather additional information on the primary needs of producers across this North State region in order to determine
the services that would be most important for the food hub to provide.
The presence of farmers markets, CSAs, and farm to school programs in the region indicates a strong and growing
consumer interest in accessing local food. Further, the ongoing food hub projects that have focused on this region
suggest that a growing number of stakeholders are interested in ways to improve the access of regional farmers to
larger wholesale markets.
Recommendations As this project continues into the primary research phase, there are several important areas for additional research that
have been revealed by this secondary research:
Product set to focus on in primary research: Production in the region is varied and the food hub will need to
make some critical decisions about the type of products it will focus on. This will depend in large part upon the
types of products being demanded by wholesale buyers in the region and in nearby metropolitan markets,
which the next phase of research should explore in depth. That said, the preliminary production and demand
levels assessed in this secondary research recommend a greater focus on the following product categories:
fruits, vegetables, nuts, and wild rice. One key barrier to further explore is the lack of produce distribution and
processing infrastructure in the North State. Shasta County is the most important producer of wild rice in the
state and production is also high in Modoc County, providing both supply and product differentiation reasons for
further evaluation. Cattle, dairy, and fish should also be considered, but careful attention should be paid to the
processing needs of these producers and the regulatory requirements associated with handling these products.
Production counties to focus on: While there is agricultural production occurring in all eight of the counties
included in the supply radius, five of these counties emerged as particularly important potential supply centers:
Tehama, Siskiyou, Modoc, Humboldt and Shasta. Tehama County has the highest total value of agricultural
production at over $240M, and produces 93% of the region’s fruit, tree nuts and berries. Siskiyou County has the
second highest total agricultural production value at $223M, and is the leading producer of vegetables in the
region. Siskiyou is followed by Modoc County as the second highest producer of vegetables, and as mentioned in
above, is an important producer of wild rice. Modoc also has the highest percentage of the county’s workforce
employed in agriculture at 15.60%. Humboldt has the 3rd highest total value of agricultural production at $203M,
the highest value of dairy production at $73M, as well as the greatest number of organic farms. Finally, while
Shasta County ranks fifth in overall production value, fruit production is second only to Tehama and the county
is ideally positioned to host the food hub site based on intermodal freight access. It will be critical to successfully
engage growers in these counties in interviews and surveying to evaluate their needs. Siskiyou, Shasta and
Tehama counties are all crossed by I‐5, making them ideal counties for initial distribution to a central food hub.
Demand markets to focus on: Within the eight‐county region, Humboldt and Shasta counties emerged as
leaders in local food sourcing, and therefore interesting potential markets to examine further through primary

38
research efforts. Additionally, the accessibility of major markets such as Reno, Nevada, Sacramento, and the San
Francisco Bay Area make all three of these areas important potential markets for a food hub.
Status of food hub projects in development: In the next phase of research, it is recommended that the team
look for opportunities for collaboration with existing local food distribution projects in the region and in nearby
metropolitan markets: Sacramento Food Hub, Surprise Valley Food Hub, California Food Hub Network.
Assess demand for processing: Producer interviews and surveys should analyze the level of need for produce
processing, as well as processing in other product categories. Demand interviews and surveys should assess
buyer interest in purchasing fresh cut or frozen produce and other agricultural products.
Better understand profile of fishing operations in coastal counties: Secondary research alone doesn’t provide a
clear picture of the needs of the fishing industry in Humboldt and Del Norte counties. For example, the
Department of Fish and Wildlife does not report on the size or sales channels used by most fishing operations,
therefore it is difficult to ascertain through secondary analysis alone, whether there may be an opportunity for a
food hub to work with small fishing operations in order to improve distribution of local seafood.
Identify additional local sourcing efforts across buyer groups: Through interviews and surveys, identify local
sourcing efforts currently underway in these groups that may not have emerged through secondary research
alone. Additionally, identify barriers currently preventing these buyer groups from sourcing local goods.
Next Steps This secondary research memo is intended to lay the groundwork for the primary research phase and identify new
directions for future research. This document will be refined as the product set is narrowed and the proposed services
for the food hub are narrowed, in the meantime, it serves to provide a foundational understanding of trends
surrounding agriculture and local food in the region.

39
WORKS CITED Bureau of Labor Statistics. 2015. Consumer Expenditure Survey by Region July 2014‐June 2015. Washington, D.C.
California Department of Fish & Wildlife. 2014. Table 16Pub – Poundage and Value of Landings by Port, Eureka Area During 2014.
California Department of Food & Agriculture. 2014. California Agricultural Production Statistics.
California Department of Food & Agriculture. 2014‐2015. California Agricultural Statistics Review.
California Energy Commission. 2016. Snowpack: Decadal Averages Map.
Cooley H. et al. 2015. The Impacts of California’s Ongoing Drought: Agriculture. The Pacific Institute.
Eat Well Guide. 2016. Accessed through: http://www.eatwellguide.org/
Genesse & Wyoming. N.d. “California Northern Railroad.” Accessed through:
https://www.gwrr.com/operations/railroads/north_america/california_northern_railroad
Gillis, J. & Richtel M. 2015. “Beneath California Crops, Groundwater Crisis Grows.” The New York Times. 5 April 2015.
Harvard Business School. 2016. United States Cluster Mapping Tool. Accessed through: http://www.clustermapping.us/
Healthy Shasta & Growing Local. 2013. Local Food Guide: Shasta County and Surrounding Areas.
LocalHarvest. 2016. Local Food Database. Accessed through: http://www.localharvest.org/
National Center for Education Statistics. (2015). Common Core of Data.
Pomeroy, C. et al. 2010. California’s North Coast Fishing Communities: Historical Perspective and Recent Trends. University of California San Diego.
Redwood Coast Vacation Rentals. 2015. “Farm‐to‐Table: The Local Grind of Humboldt County.”
Regional Food Hub Advisory Council. 2010. California Network of Regional Food Hubs: A Vision Statement and Strategic Implementation Plan.
Sacramento Area Council of Governments (SACOG). 2015. Sacramento Region Food Hub Feasibility Analysis. Presentation. 20 May 2015.

40
Shasta Cascade Farm Trail Survey Preliminary Results. 2014. Provided by Growing Local.
Shasta Regional Transportation Agency. 2015. 2015 Regional Transportation Plan for Shasta County.
Strolling of the Heifers. 2015. The 2015 Locavore Index. Accessed through: http://www.strollingoftheheifers.com/locavoreindex/
Surprise Valley Grown. N.d. The Surprise Valley Food Hub Project. Accessed through: http://svg.lxw.com/
Union Pacific Railroad. 2015. Union Pacific in California.
United States Census Bureau. 2014. American Community Survey 2014 5‐year estimates. Washington, D.C.
United States Department of Agriculture (USDA). 2016. Local Food Directories. Accessed through: https://www.ams.usda.gov/services/local‐
regional/food‐directories
USDA. 2016. 2015 Farm to School Census.
USDA. 2014. Organic Agriculture Survey.
USDA. 2012. Census of Agriculture.
Univsource. Retrieved from: http://www.univsource.com/Ca.htm