initialization and synchronization of power …...energies article initialization and...
TRANSCRIPT

energies
Article
Initialization and Synchronization of PowerHardware-In-The-Loop Simulations A Great BritainNetwork Case Study
Efren Guillo-Sansano ID Mazheruddin H Syed ID Andrew J Roscoe and Graeme M Burt
Institute for Energy and Environment Electronic and Electrical Engineering DepartmentUniversity of Strathclyde Glasgow G1 1XW UK mazheruddinsyedstrathacuk (MHS)andrewjroscoestrathacuk (AJR) graemeburtstrathacuk (GMB) Correspondence efrenguillo-sansanostrathacuk Tel +44-(0)-141-444-7280
Received 3 April 2018 Accepted 25 April 2018 Published 28 April 2018
Abstract The hardware under test (HUT) in a power hardware in the loop (PHIL) implementationcan have a significant effect on overall system stability In some cases the system under investigationwill be unstable unless the HUT is already connected and operating Accordingly initialization of thereal-time simulation can be difficult and may lead to abnormal parameters of frequency and voltageTherefore a method to initialize the simulation appropriately without the HUT is proposed in thiscontribution Once the initialization is accomplished a synchronization process is also proposedThe synchronization process depends on the selected method for initialization and therefore bothmethods need to be compatible In this contribution a recommended practice for the initializationof PHIL simulations for synchronous power systems is presented Experimental validation ofthe proposed method for a Great Britain network case study demonstrates the effectiveness ofthe approach
Keywords PHIL (power hardware in the loop) simulation initialization synchronization time delaysynchronous power system stability accuracy
1 Introduction
Electrical power systems are under continuous development accelerated by regulations enforcedto mitigate climate change the need to enhance efficiency and the substantial technology evolutionPower systems are evolving into a more variable and difficult to predict system with a mix ofnovel and complex components such as renewable energy sources or power electronics componentsand conventional components with well-known behavior The interaction between such componentsis an important area of research to achieve a resilient and secure power system
For the assessment of novel complex components the interactions between modern and legacypower system components and the validation of novel control algorithms for future power systemshardware-in-the-loop (HIL) techniques are proving to be a useful approach [1] Depending uponthe validation objectives and infrastructure available HIL is broadly classified into two categories(i) controller-HIL (CHIL) if the HUT is a controller or low power component (such as protectiondevices) and (ii) Power-HIL (PHIL) when the HUT is a high-power component requiring amplificationof the simulated signal in order to be coupled together
Specifically PHIL is gaining attention internationally due to its good performance for testingpower and energy systems at reduced cost and risk [2ndash5] Typically PHIL has been utilized in a rangeof applications including (i) where a component (such as PV inverter) is physically available and it iscomputationally more efficient to utilize the component within a PHIL setup rather than developing a
Energies 2018 11 1087 doi103390en11051087 wwwmdpicomjournalenergies
Energies 2018 11 1087 2 of 14
detailed and accurate model of the component (ii) where novel power components need to be testedbefore their wide scale deployment and (iii) where the interactions of modern components with the gridneed to be captured to understand the implication of its deployment In all these applications the HUTrepresents a relatively small portion of the network compared to the grid emulation ie the rest of thesystem being simulated on the Digital Real-Time Simulator (DRTS) [6ndash8] However this balance inPHIL between hardware and software is insufficient when it comes to validating wide area monitoringprotection and control (WAMPAC)mdashan area of increasing interest given the recent advancements inphasor measurement units (PMU) [9] Such validation would increasingly require a rebalancing suchthat the HUT is composed of a larger portion of the test network
An example representation of a PHIL implementation is presented in Figure 1 This shows a PHILimplementation comprising a virtually simulated network implemented within a DRTS a hardwarecomponent (the HUT) and the power interface used for interconnecting both subsystems [10]The HUT connected to the simulation can represent generation or load components this may consistof many devices interconnected or just a simple significant device The power interface allows for theinterconnection of the two subsystems The conventional approach of setting up a particular PHILsimulation involves the following steps
bull The power network within the DRTS is initialized allowing for it to achieve steady state (referredto as initialization in this work)
bull Interface signals from the initialized DRTS simulation are reproduced by the power interfacebull The HUT response to the reproduced signals is measured and fed back to the DRTS to complete
the loop (referred to as synchronization in this work)
Energies 2018 11 x FOR PEER REVIEW 2 of 14
developing a detailed and accurate model of the component (ii) where novel power components
need to be tested before their wide scale deployment and (iii) where the interactions of modern
components with the grid need to be captured to understand the implication of its deployment In all
these applications the HUT represents a relatively small portion of the network compared to the grid
emulation ie the rest of the system being simulated on the Digital Real-Time Simulator (DRTS) [6ndash
8] However this balance in PHIL between hardware and software is insufficient when it comes to
validating wide area monitoring protection and control (WAMPAC)mdashan area of increasing interest
given the recent advancements in phasor measurement units (PMU) [9] Such validation would
increasingly require a rebalancing such that the HUT is composed of a larger portion of the test
network
An example representation of a PHIL implementation is presented in Figure 1 This shows a
PHIL implementation comprising a virtually simulated network implemented within a DRTS a
hardware component (the HUT) and the power interface used for interconnecting both subsystems
[10] The HUT connected to the simulation can represent generation or load components this may
consist of many devices interconnected or just a simple significant device The power interface allows
for the interconnection of the two subsystems The conventional approach of setting up a particular
PHIL simulation involves the following steps
The power network within the DRTS is initialized allowing for it to achieve steady state
(referred to as initialization in this work)
Interface signals from the initialized DRTS simulation are reproduced by the power interface
The HUT response to the reproduced signals is measured and fed back to the DRTS to complete
the loop (referred to as synchronization in this work)
Figure 1 PHIL implementation
For studies of synchronous power systems the load and generation conditions along with the
power transfer at points of interest are selected from known scenarios This allows for testing under
known stress conditions of the network or scenarios of interest For example a previously measured
pre-fault condition of the network may be considered where a novel control algorithm can be tested
in order to analyze if the performance of such a controller could have improved the response to the
event Therefore when a PHIL simulation is initialized and synchronized it is important to ensure
that the conditions at the different buses of the test network are comparable to that of a pure
simulation
In cases were the HUT is relatively small compared to the DRTS simulated power system [6ndash8]
the DRTS simulation can be initialized without the HUT hence the power network within the DRTS
performs as a stiff grid whose voltage and frequency are not dependent upon the HUT to be
interconnected Then the HUT is typically synchronized with the DRTS simulation by means of a
simple switching action closing the loop between the HUT and DRTS Operation of the switch always
introduces transient however in the cases of a stiff simulated grid or a modest HUT this transient
Figure 1 PHIL implementation
For studies of synchronous power systems the load and generation conditions along with thepower transfer at points of interest are selected from known scenarios This allows for testing underknown stress conditions of the network or scenarios of interest For example a previously measuredpre-fault condition of the network may be considered where a novel control algorithm can be tested inorder to analyze if the performance of such a controller could have improved the response to the eventTherefore when a PHIL simulation is initialized and synchronized it is important to ensure that theconditions at the different buses of the test network are comparable to that of a pure simulation
In cases were the HUT is relatively small compared to the DRTS simulated power system [6ndash8]the DRTS simulation can be initialized without the HUT hence the power network within theDRTS performs as a stiff grid whose voltage and frequency are not dependent upon the HUT tobe interconnected Then the HUT is typically synchronized with the DRTS simulation by means of a
Energies 2018 11 1087 3 of 14
simple switching action closing the loop between the HUT and DRTS Operation of the switch alwaysintroduces transient however in the cases of a stiff simulated grid or a modest HUT this transientdoes not pose a significant risk for a stable operating point to be achieved at the start of the studyThe processes of initialization and synchronization of PHIL are thus relatively straightforward
However for cases where the network is not a stiff grid and the HUT is significant for thegrid (either to be able to initialize without it or to remain stable if it is directly connected) aninitialization procedure for the simulated part of the system as well as a reliable synchronizationprocedure is required
In this paper the initialization and synchronization of a PHIL simulation where the HUTrepresents a larger portion of the test network is investigated The various possible options forinitialization and synchronization of such PHIL setup are presented and their applicability advantagesand disadvantages discussed A process of initialization and synchronization using a controlledcurrent source is further evaluated by means of two case studies undertaken on a reduced dynamicmodel of the Great Britain (GB) power system
2 PHIL Initialization and Synchronization
A number of studies have investigated the stability of PHIL simulations [11ndash15] where the mainfindings include the establishment of stability thresholds imposed by the interface algorithms usedfor the PHIL implementation Improvements to alleviate the identified stability limitations havebeen proposed in [121617] However these studies investigate the stability of an operational PHILsetup assuming a successful initialization of simulation and hardware have already been establishedindependently and straightforward synchronization has been achieved In the following sub-sectionsthis assumption is shown to be limiting and options to address the resulting challenge are explored
21 The Challenge
The issues associated with initialization and synchronization of a PHIL simulation arise when theHUT represents a more significant portion of the test network and these conditions can broadly beclassified into two (i) where the test network to be represented by the HUT is critical for initializationof the DRTS simulation and (ii) where the test network to be represented by the HUT affects the voltageand frequency of the DRTS simulation These are elaborated as follows
bull HUT critical for initialization In such cases the initialization and synchronization of the PHILexperiment present a paradoxical scenario where the DRTS simulation cannot be initializedwithout the hardware currents while the hardware currents cannot be produced without theDRTS simulation being initialized To elaborate the DRTS simulation will fail to initialize due to alack of generation or load leading to not enough synchronizing torque in the simulated networkWithout the DRTS simulation initialized the power interface will not be capable of reproducingthe interface signals and therefore the HUT response cannot be synchronized On the other handreproducing the interface signal during the initialization of DRTS is risky as the signal might notbe suitable for reproduction or may be over the safety limits of the power amplifier and HUT
bull HUT affects voltage and frequency Here the HUT is not critical (the simulation can start withoutit connected) but still significant as to affect the frequency and voltage considerably triggeringcontrol actions from the components in the simulation leading to a modified initial state of thesystem This can also result in an impractical voltage and frequency levels for the initialization ofthe HUT
22 Initialization of DRTS Simulation
A solution is therefore required to overcome the aforementioned problems and allow PHILsimulations to be commenced even in these situations For this purpose the use of an auxiliary
Energies 2018 11 1087 4 of 14
emulated HUT component is required Four possible options to enable the initialization of difficultPHIL simulations by emulating the HUT component have been identified
1 Detailed simulation of HUT a detailed model of the HUT can be included as part of the simulationfor establishing the initial conditions of the DRTS simulation However developing a detailedmodel of the HUT can be an arduous task and considering that the expected power flows at thePCC can typically be estimated simpler solutions can be utilized for the initialization process
2 AC voltage source readily available in every power system simulation tool voltage source modelscan be utilized to initialize the simulated test network for PHIL simulations emulating the HUTHowever as AC voltage sources act as infinite sources the power flow of the network at thePCC cannot be controlled This would lead to an unsuccessful initialization as the state of thenetwork is no longer the intended for the test scenario Additionally with the change in powerflows new stability analyses would need to be undertaken as the system state under which theHUT was intended to be connected is no longer the same unless an adjustment of the powersetpoints is performed until power exchange with the infinite bus is brought to zero
3 Synchronous generator a synchronous generator model can control the active power at its outputterminals for emulating the HUT required active power transfers at the PCC this being controlledby means of a simple set-point The reactive power of a synchronous generator is controlled bymanipulating the excitation system Either manual tuning of the voltage reference to the exciter ordeveloping a simple PI control is required to attain the required reactive power flow at the PCC
4 AC Controlled Current Source for the emulation of the HUT power transfer at the PCCa controlled current source allows for a straightforward implementation with high accuracyThis implementation will only require the measured voltage and the P and Q set points at thePCC for generating the current signals as shown
Id =Pre f Vd minusQre f Vq
Vd2 + Vq2 (1)
Iq =Pre f Vq + Qre f Vd
Vd2 + Vq2 (2)
where Id is the direct axis current Iq is the quadrature axis current Pref and Qref are the referenceactive and reactive powers to be injected at the PCC respectively Vd is the direct axis voltage atthe PCC and Vq is the quadrature axis voltage at PCC The direct and quadrature axis voltagesrequired can be obtained with Parkrsquos transformation as Vd
Vq
V0
=23
cos(θ) cos(θ minus 2π3) cos(θ + 2π3)minus sin(θ) minus sin(θ minus 2π3) minus sin(θ + 2π3)
12 12 12
Va
VbVc
(3)
The three phase currents required for the current controlled source can be obtained from thequadrature and direct currents using the inverse Parkrsquos transformation as Ia
IbIc
=
cos(θ) minus sin(θ) 1cos(θ minus 2π3) minus sin(θ minus 2π3) 1cos(θ + 2π3) minus sin(θ + 2π3) 1
Id
Iq
I0
(4)
In this manner the initialization is straightforward and accurate when the power transfers at thePCC are known
In this paper the main focus is on situations where the HUT component contributes a significantactive or reactive power without which the simulated network cannot survive due to underoverfrequencyvoltage In this case the simplest approach is to implement method (4) the controlled
Energies 2018 11 1087 5 of 14
current source This is because it is a conventional approach that can be implemented in simulationusing well-known dq axis control techniques These techniques are common to most conventionalconverter-connected generation active front-end and storage device technologies
In some other scenarios it may be that the HUT properties which are required to stabilise thepower network are not so much absolute balances of fundamental active and reactive power but otherproperties such as synchronising torque grid stiffness harmonic damping etc In these cases which areout of the scope of the present paper a simulated HUT using a current-source approach may notbe appropriate or sufficient and a voltage-source approach may be more suitable along the lines ofmethod (2) or (3) These types of solution could be explored in future work and one potential solutionhas been referred to (within a simulation-only environment without hardware) in [18]
Accordingly the AC current controlled source is the ideal alternative for the initialization and hasbeen implemented for its evaluation A schematic of the current source configuration for initializationpurposes of PHIL simulations is shown in Figure 2 for a six-area GB power system This study presentsfour simulated areas and two areas (Areas 1 and 2) represented in hardware The initializationtherefore sees the latter emulated by current sources
Energies 2018 11 x FOR PEER REVIEW 5 of 14
other properties such as synchronising torque grid stiffness harmonic damping etc In these cases
which are out of the scope of the present paper a simulated HUT using a current-source approach
may not be appropriate or sufficient and a voltage-source approach may be more suitable along the
lines of method (2) or (3) These types of solution could be explored in future work and one potential
solution has been referred to (within a simulation-only environment without hardware) in [18]
Accordingly the AC current controlled source is the ideal alternative for the initialization and
has been implemented for its evaluation A schematic of the current source configuration for
initialization purposes of PHIL simulations is shown in Figure 2 for a six-area GB power system This
study presents four simulated areas and two areas (Areas 1 and 2) represented in hardware The
initialization therefore sees the latter emulated by current sources
Figure 2 PHIL initialization and synchronization structure at DRTS side
23 Synchronization
In typical PHIL simulations the HUT is connected to the DRTS simulation (synchronized)
through the action of closing a simple switch thus closing the loop between the HUT and the DRTS
During the process of synchronization the currents from the auxiliary emulated HUT utilized for
initialization need to be replaced with the hardware currents (ie the measured response from the
HUT) It is essential to ensure that during the process of synchronization the voltage and frequency
of the network do not exceed the safety margins of the power interface and HUT In addition when
any voltage or frequency control algorithms are implemented within the network it is often desired
that the synchronization of the HUT causes the least possible change in system frequency and voltage
in order not to cause any undesired control actions The synchronization method chosen will be
dependent upon the initialization method selected Therefore in this section the synchronization
process for each of the initialization methods presented in previous section is discussed
Detailed simulation of HUT while this could be the best option for the purpose of initialization of
PHIL assuming an accurate enough model of HUT is available for the purpose of
synchronization a dispatching algorithm to reduce the generation and load of the emulated
HUT would be required to avoid the frequency going to abnormal values when the HUT is first
connected It can therefore be said that utilizing a detailed model of the HUT is very challenging
for initialization and synchronization of PHIL setups due to the requirement of developing
dedicated HUT models and dispatch algorithms
AC voltage source Apart from the fact that the AC voltage source is not the ideal approach for
initialization due to its response as an infinite source similarly the power output of the voltage
source cannot be controlled and the process can lead to an erroneous synchronization
Synchronous generator In order to attain a smooth transition from the auxiliary emulated HUT
(the synchronous generator) and the HUT a complex control would be required (for governor
Figure 2 PHIL initialization and synchronization structure at DRTS side
23 Synchronization
In typical PHIL simulations the HUT is connected to the DRTS simulation (synchronized) throughthe action of closing a simple switch thus closing the loop between the HUT and the DRTS Duringthe process of synchronization the currents from the auxiliary emulated HUT utilized for initializationneed to be replaced with the hardware currents (ie the measured response from the HUT) It isessential to ensure that during the process of synchronization the voltage and frequency of the networkdo not exceed the safety margins of the power interface and HUT In addition when any voltageor frequency control algorithms are implemented within the network it is often desired that thesynchronization of the HUT causes the least possible change in system frequency and voltage in ordernot to cause any undesired control actions The synchronization method chosen will be dependentupon the initialization method selected Therefore in this section the synchronization process for eachof the initialization methods presented in previous section is discussed
bull Detailed simulation of HUT while this could be the best option for the purpose of initialization ofPHIL assuming an accurate enough model of HUT is available for the purpose of synchronizationa dispatching algorithm to reduce the generation and load of the emulated HUT would be requiredto avoid the frequency going to abnormal values when the HUT is first connected It can therefore
Energies 2018 11 1087 6 of 14
be said that utilizing a detailed model of the HUT is very challenging for initialization andsynchronization of PHIL setups due to the requirement of developing dedicated HUT modelsand dispatch algorithms
bull AC voltage source Apart from the fact that the AC voltage source is not the ideal approach forinitialization due to its response as an infinite source similarly the power output of the voltagesource cannot be controlled and the process can lead to an erroneous synchronization
bull Synchronous generator In order to attain a smooth transition from the auxiliary emulated HUT(the synchronous generator) and the HUT a complex control would be required (for governorand excitation system) to ensure least deviation in frequency and voltage during the processThis controller would be a generic solution that can be reused however would be limited toscenarios where the HUT effectively emulates generation
bull AC Controlled Current Source if a controlled current source is utilized the synchronization can beachieved with a proposed simple logic as presented in Figure 2 The synchronization process isbegun by means of a synchronization switch that inversely ramps up and down both controlledcurrent sources The ramp rate can be chosen such that it doesnrsquot create any oscillations ortransients on the system once the currents from the auxiliary emulated HUT are reduced to zeroand the currents from the HUT are fully connected to the simulation the system is synchronized
From the above discussion it can be deduced that for the purpose of initialization andsynchronization of PHIL setups where the HUT represents a significant part of the test networkthe most convenient option available is to utilize a controlled current source It performs ideally underall scenarios with accurate performance and a reliable straightforward implementation Furthermoreit is a generic approach that can be utilized when the HUT emulates net generation or load
A proposed process for performing the initialization and synchronization is shown in Figure 3 witha flowchart This process assumes that the PHIL simulation is stable for the interface algorithm chosenThis should be ensured before the PHIL simulation initialization and synchronization procedureis begun
Energies 2018 11 x FOR PEER REVIEW 6 of 14
and excitation system) to ensure least deviation in frequency and voltage during the process
This controller would be a generic solution that can be reused however would be limited to
scenarios where the HUT effectively emulates generation
AC Controlled Current Source if a controlled current source is utilized the synchronization can
be achieved with a proposed simple logic as presented in Figure 2 The synchronization process
is begun by means of a synchronization switch that inversely ramps up and down both
controlled current sources The ramp rate can be chosen such that it doesnrsquot create any
oscillations or transients on the system once the currents from the auxiliary emulated HUT are
reduced to zero and the currents from the HUT are fully connected to the simulation the system
is synchronized
From the above discussion it can be deduced that for the purpose of initialization and
synchronization of PHIL setups where the HUT represents a significant part of the test network the
most convenient option available is to utilize a controlled current source It performs ideally under
all scenarios with accurate performance and a reliable straightforward implementation
Furthermore it is a generic approach that can be utilized when the HUT emulates net generation or
load
A proposed process for performing the initialization and synchronization is shown in Figure 3
with a flowchart This process assumes that the PHIL simulation is stable for the interface algorithm
chosen This should be ensured before the PHIL simulation initialization and synchronization
procedure is begun
Figure 3 Initialization and synchronization flowchart
3 Experimental Setup for PHIL
In this section the different components of the PHIL setup used for the validation of the
proposed initialization and synchronization process are described First the real-time simulation
model of the Great Britain (GB) reference power system developed within RSCAD (a power system
simulation software from RTDS Technologies Winnipeg MB Canada) is described the
characteristics of the power interface used for the interconnection of the simulated system with the
hardware is presented the HUT utilized is detailed and finally the existing time delay within the
setup is considered for the synchronization
31 GB Power System
A reduced six-bus dynamic model of the GB power system has been chosen as the simulated
network for this PHIL setup A single line diagram of the GB power system is shown in Figure 4a
The choice of a six-area model is based on the GB National Electricity Transmission System (NETS)
boundary map presented in the Electricity Ten Year Statement (ETYS) of National Grid Transmission
System Operator (TSO) of GB where the GB transmission network is grouped into six regions [19]
Figure 3 Initialization and synchronization flowchart
3 Experimental Setup for PHIL
In this section the different components of the PHIL setup used for the validation of the proposedinitialization and synchronization process are described First the real-time simulation model of theGreat Britain (GB) reference power system developed within RSCAD (a power system simulationsoftware from RTDS Technologies Winnipeg MB Canada) is described the characteristics of thepower interface used for the interconnection of the simulated system with the hardware is presented
Energies 2018 11 1087 7 of 14
the HUT utilized is detailed and finally the existing time delay within the setup is considered forthe synchronization
31 GB Power System
A reduced six-bus dynamic model of the GB power system has been chosen as the simulatednetwork for this PHIL setup A single line diagram of the GB power system is shown in Figure 4aThe choice of a six-area model is based on the GB National Electricity Transmission System (NETS)boundary map presented in the Electricity Ten Year Statement (ETYS) of National Grid TransmissionSystem Operator (TSO) of GB where the GB transmission network is grouped into six regions [19]These regions have been developed around major generation sources power flow corridors and loadcentres [19] The model is based on real power flow data of the six regions Each area is built asthe combination of a lumped generator and load The area wise generation area wise active andreactive power load and inter-area power flows have been presented in Tables 1 and 2 The modelhas been developed in RSCAD and simulated in real-time using a Real Time Digital Simulator fromRTDS Technologies
Energies 2018 11 x FOR PEER REVIEW 7 of 14
These regions have been developed around major generation sources power flow corridors and load
centres [19] The model is based on real power flow data of the six regions Each area is built as the
combination of a lumped generator and load The area wise generation area wise active and reactive
power load and inter-area power flows have been presented in Tables 1 and 2 The model has been
developed in RSCAD and simulated in real-time using a Real Time Digital Simulator from RTDS
Technologies
(a) (b)
Figure 4 (a) Reduced six-bus dynamic model of the GB power system (b) Dynamic power system
laboratory (HUT)
Table 1 Area wise capacity and initial load condition
Capacity and loading conditions Area1 Area2 Area3 Area 4 Area 5 Area 6
Area wise generation capacity (MVA) 11000 20000 9160 5500 15500 2000
Area wise active power load (MW) 8468 12548 8398 2150 26852 100
Area wise reactive power load (MVAr) 4109 6077 4067 1041 13005 500
Table 2 Inter-area power flows
Inter-area active power flow (MW) P1-2 P2-3 P3-4 P4-5 P6-4
2097 8900 9105 13080 970
Inter-area reactive power flow (MVAr) Q1-2 Q2-3 Q3-4 Q4-5 Q6-4
1328 4257 5025 7088 155
32 Power Interface
The power interface is composed of a 90 kVA back-to-back converter unit with a switching
frequency of 8 kHz responsible for amplifying the signal received from the DRTS Different interface
algorithms have been described in the literature [11172021] For the purpose of this paper the
voltage ideal transformer method (ITM) has been selected due to its straightforward implementation
and good stability performance Accordingly the power interface amplifies and reproduces the
voltages received from the simulation and therefore is controlled as a voltage source At the same
time in the configuration used for this experiment the power interface is also responsible for
measuring the response of the HUT and sending it back to the DRTS for closing the loop with the
simulation Having analog-to-digital and digital-to-analog conversions at both ends analog interface
signals are exchanged between the power interface and the DRTS
Figure 4 (a) Reduced six-bus dynamic model of the GB power system (b) Dynamic power systemlaboratory (HUT)
Table 1 Area wise capacity and initial load condition
Capacity and Loading Conditions Area 1 Area 2 Area 3 Area 4 Area 5 Area 6
Area wise generation capacity (MVA) 11000 20000 9160 5500 15500 2000Area wise active power load (MW) 8468 12548 8398 2150 26852 100
Area wise reactive power load (MVAr) 4109 6077 4067 1041 13005 500
Table 2 Inter-area power flows
Inter-area active power flow (MW)P1-2 P2-3 P3-4 P4-5 P6-4
2097 8900 9105 13080 970
Inter-area reactive power flow (MVAr)Q1-2 Q2-3 Q3-4 Q4-5 Q6-4
1328 4257 5025 7088 155
Energies 2018 11 1087 8 of 14
32 Power Interface
The power interface is composed of a 90 kVA back-to-back converter unit with a switchingfrequency of 8 kHz responsible for amplifying the signal received from the DRTS Different interfacealgorithms have been described in the literature [11172021] For the purpose of this paper the voltageideal transformer method (ITM) has been selected due to its straightforward implementation andgood stability performance Accordingly the power interface amplifies and reproduces the voltagesreceived from the simulation and therefore is controlled as a voltage source At the same time in theconfiguration used for this experiment the power interface is also responsible for measuring theresponse of the HUT and sending it back to the DRTS for closing the loop with the simulation Havinganalog-to-digital and digital-to-analog conversions at both ends analog interface signals are exchangedbetween the power interface and the DRTS
33 HUT
The Dynamic Power Systems Laboratory (DPSL) will be utilized as the HUT within this paperfor the example case study DPSL comprises a reconfigurable 125 kVA 400 V three-phase AC powernetwork with multiple controllable supplies and loads with flexible control systems and interfacesThe one-line diagram of DPSL is presented in Figure 4b The laboratory network is designed such thatit can be split into three separate power islands (represented as cells in Figure 4b) under independentcontrol or as a centralized interconnected system
For the example case study only cell 2 and 3 of Figure 4b will form the HUT while the 90 kVAunit from cell 1 will represent the power interface Since the laboratory equipment is relatively smallcompared to the required power transfers at the PCC the response of the HUT (the measured currentsat the hardware PCC) will be scaled up proportionally to match the test scenario
The scaling of the response does not impact the simulation results however the scaling of theresponse does make the system more sensitive to oscillations Small oscillations within the HUT canresult in large power oscillations within the simulated system This can lead the system to instability orcause the implemented controllers to malfunction This further demonstrates the need for appropriatemeasures to be undertaken for initialization and synchronization of large synchronous power systemsthat become sensitive to oscillations under scaled PHIL setups
34 Time Delay Compensation
The synchronization process is completed when the measured response of the HUT is injectedinto the simulation However typically the hardware response (measured currents at the PCC)is delayed compared to the reference currents generated during initialization The entire PHILprocess the processing time of the DRTS the communication between DRTS and power interfacethe power interface processing time for amplifying the signal and the feedback loop measurement andcommunication contributes to this delay For this work a phase compensation method as reportedin [22] is utilized for compensating the time delay If the delay is not compensated it is not possibleto ensure the equality of the reference power and the injected power and therefore the fidelityof the simulation Once the delay has been accounted for the hardware and simulation can beaccurately synchronized
4 Experimental Assessment and Validation
In this section an assessment of the proposed initialization and synchronization procedures forPHIL simulations is performed Two case studies have been developed for this purpose first a casewith a significant HUT that affects the PHIL initialization and synchronization if no measure is inplace and afterwards a case in which the simulation could be initialized without HUT although witherroneous voltage and frequency parameters
Energies 2018 11 1087 9 of 14
Case Study A HUT critical for the stability of the real-time simulation
For the first case study the HUT is to represent Area 1 and 2 of the GB power system (as shown inFigure 4a) while the remaining areas will be part of the simulated network on the DRTS As can beobserved from Table 2 there is an active and reactive power flow from Area 2 to Area 3 This powerflow needs to be matched by the HUT effectively emulating generation of active and reactive powerCell 2 and Cell 3 of the DPSL represent Area 2 and Area 1 respectively while the 90kVA back-to-backconverter is used as the power interface
Initialization
The active and reactive power flow from Area 2 to Area 3 is 8900 MW and 4257 MVAR Without theHUT representing Area 1 and 2 the remainder of the simulated GB power system (Area 3ndash6) withinRSCAD fails to initialize due to a lack of generation supposed to be produced by Area 1 and 2The HUT emulates a large generation portion and the DRTS simulation model is unstable without theHUT Hence the process shown in Figure 3 is followed were initialization of the RT system with aninitialization technique is required The AC current source mode for initialization is implemented dueto its simplicity and its suitability to perform the synchronization process
The schematic of the used methodology for initialization and synchronization of this PHILimplementation is shown in Figure 2 As can be observed from the figure the auxiliary emulatedHUT (the controlled current source in this case) is utilized to reproduce currents generated from thepower reference ie 8900 MW and 4257 MVAR Once the RT simulation is initialized and attainedsteady state the PCC voltages (scaled down to 400 V) are reproduced in the laboratory using thepower interface Trying to reproduce the simulation voltages when the simulation is not yet stabilizedor initialized properly can damage the hardware components as large transients orand oscillationscan be present With stable voltage being reproduced at the laboratory the HUT components are thenconnected and initialized
Synchronization
The main objective of the synchronization is to replace the auxiliary currents generated by thecontrolled current sources with the measured HUT currents This is intended to be performed sothat there is least change in frequency and voltage during the process of synchronization and leastimpact on the stability of the simulated network After the DRTS is successfully initialized the voltagefrom the simulation is reproduced by the power interface allowing for the set reference power to beinjected into the PCC In this case the net generation is produced by the 15 kVA back-to-back converterthe synchronous generator in cell 1 and the 10 kVA inverter in cell 2 A load bank has been added ineach of the cells to represent the local loads within the two areas By using these three power sourcesthe maximum power injection is limited to 27 kVA The parameters used for the different hardwarecomponents are listed in Table 3 In order to represent the 8900 MW and 4257 MVAR from Area 2the hardware currents are scaled by means of a scaling factor For this work the scaling factor is chosenas k = 9 times 105
Table 3 Power setpoints for hardware components for case study A
Area Component P (W) Q (Var)
Cell 215 kVA B2B Inverter 7000 3600
2 kVA Synchronous Generator 1500 0Load Bank 2 minus1500 0
Cell 310 kVA Inverter 6600 1100
Load Bank 3 minus3300 0
Consequently the measured HUT currents when injected into the simulation should be equalto the auxiliary emulated HUT currents In this case the currents are being generated by small
Energies 2018 11 1087 10 of 14
scale power converters which produce a considerable number of harmonics The amplitude of theharmonic components when scaled up is not typical of transmission levels To mitigate this issuethe currents received at the DRTS are filtered by means of a low pass filter The low pass filter cut offfrequency is selected as 200 Hz in order to reduce the impact of the harmonics thereby alleviating thesensitivity of the simulation to oscillations However the low pass filter increases the time delay ofthe received signal Therefore time delay compensation is required not only to compensate for thedelay characteristics of PHIL structures but more importantly in this case the delay introduced bythe filter This is because the selected cut-off frequency attains a much larger delay than the typicaldelay of PHIL setups The results for the compensation of the time delay in this implementation arepresented in Figure 5aEnergies 2018 11 x FOR PEER REVIEW 10 of 14
(a) (b)
(c) (d)
Figure 5 Results for study case A HUT critical for stability of RT simulation (a) time delay
compensation (b) currents swapping during synchronization (c) frequency at PCC during
synchronization and (d) voltage at PCC during synchronization
Once the measured hardware currents (after scaling) and the auxiliary signals used for
initialization are of the same magnitude and phase the replacement process is initiated by means of
the synchronization switch shown in Figure 2 The currents are then ramped up and down
simultaneously over a period of 90 s as shown in Figure 5b The frequency and voltage at PCC during
the process of synchronization are presented in Figure 5c d respectively As can be observed from
the two figures although the HUT currents have been compensated for the time delay and filter delay
and are approximately similar to the emulated currents (as shown in Figure 5a) there is an obvious
change in both voltage and frequency during the process of synchronization The change in frequency
is less than 002 and the change in voltage is less than 005 This is mainly due to small inaccuracies
such as losses in small impedances measurements inaccuracies and control inaccuracies of the
hardware assets although in this case the difference is not affecting to the test implementation
The ramp rate utilized plays an important practical role in minimizing such impacts during the
process of synchronization Synchronizing without a ramp rate risks transients being introduced
The ramp rate is dependent upon the acceptable variation on voltage and frequency during the
process of synchronization With the PHIL simulation fully synchronized and the power transfers set
as required by the scenario the testing of for example new control algorithms in a more realistic
environment is made possible
Case Study B HUT Affecting Voltage and Frequency During Initialization
For the second case study the HUT represents Area 5 of the GB power system (as shown in
Figure 4a) As can be observed from Table 2 there is an active and reactive power flow into Area 5
Therefore in this case the HUT effectively emulates a consumer area at the PCC Cell 2 Cell 3 and
the 40 kVA load bank of Cell 1 combined represent Area 4 while the 90 kVA power converter from
Cell 1 is used as the power interface The specific setpoints used for each of the components in each
cell are presented in Table 4
Figure 5 Results for study case A HUT critical for stability of RT simulation (a) time delaycompensation (b) currents swapping during synchronization (c) frequency at PCC duringsynchronization and (d) voltage at PCC during synchronization
Once the measured hardware currents (after scaling) and the auxiliary signals used forinitialization are of the same magnitude and phase the replacement process is initiated by means of thesynchronization switch shown in Figure 2 The currents are then ramped up and down simultaneouslyover a period of 90 s as shown in Figure 5b The frequency and voltage at PCC during the processof synchronization are presented in Figure 5cd respectively As can be observed from the twofigures although the HUT currents have been compensated for the time delay and filter delay and areapproximately similar to the emulated currents (as shown in Figure 5a) there is an obvious change inboth voltage and frequency during the process of synchronization The change in frequency is lessthan 002 and the change in voltage is less than 005 This is mainly due to small inaccuracies suchas losses in small impedances measurements inaccuracies and control inaccuracies of the hardwareassets although in this case the difference is not affecting to the test implementation
The ramp rate utilized plays an important practical role in minimizing such impacts during theprocess of synchronization Synchronizing without a ramp rate risks transients being introducedThe ramp rate is dependent upon the acceptable variation on voltage and frequency during theprocess of synchronization With the PHIL simulation fully synchronized and the power transfers
Energies 2018 11 1087 11 of 14
set as required by the scenario the testing of for example new control algorithms in a more realisticenvironment is made possible
Case Study B HUT Affecting Voltage and Frequency During Initialization
For the second case study the HUT represents Area 5 of the GB power system (as shown inFigure 4a) As can be observed from Table 2 there is an active and reactive power flow into Area 5Therefore in this case the HUT effectively emulates a consumer area at the PCC Cell 2 Cell 3 and the40 kVA load bank of Cell 1 combined represent Area 4 while the 90 kVA power converter from Cell 1is used as the power interface The specific setpoints used for each of the components in each cell arepresented in Table 4
Table 4 Power setpoints for hardware components for case study B
Area Component P (W) Q (Var)
Cell 1 Load Bank 1 minus14000 minus7900
Cell 215 kVA B2B Inverter 4500 minus3000
2 kVA Synchronous Generator 1000 0Load Bank 2 minus9000 minus3500
Cell 310 kVA Inverter 5200 0
Load Bank 3 minus9000 minus3500
Induction motor minus4700 minus3000
Initialization
The schematic of the PHIL interconnection within RSCAD is presented in Figure 6a The HUTemulates net consumption and so the measured current will have opposite direction to case A andwill be drawing power from the simulated power system (through the power interface) In order torepresent the 13080 MW and 7088 MVAR absorbed by Area 5 the hardware currents are scaled bymeans of a scaling factor The scaling factor in this case is set to k = 5 times 105
Energies 2018 11 x FOR PEER REVIEW 11 of 14
Table 4 Power setpoints for hardware components for case study B
Area Component P (W) Q (Var)
Cell 1 Load Bank 1 minus14000 minus7900
Cell 2
15 kVA B2B Inverter 4500 minus3000
2 kVA Synchronous Generator 1000 0
Load Bank 2 minus9000 minus3500
Cell 3 10 kVA Inverter 5200 0
Load Bank 3 minus9000 minus3500
Induction motor minus4700 minus3000
Initialization
The schematic of the PHIL interconnection within RSCAD is presented in Figure 6a The HUT
emulates net consumption and so the measured current will have opposite direction to case A and
will be drawing power from the simulated power system (through the power interface) In order to
represent the 13080 MW and 7088 MVAR absorbed by Area 5 the hardware currents are scaled by
means of a scaling factor The scaling factor in this case is set to k = 5 times 105
In this case the remainder of the GB power system (Areas 1ndash3 4 and 6) simulated within RSCAD
would initialize without Area 5 as there is enough generation to support the network unlike case A
but the frequency of the network would be above nominal (as no dispatching algorithm is
implemented) The value of the frequency deviation would depend upon the droop settings This is
again undesirable as this would activate any frequency control algorithms implemented within the
network There is of course an option to de-activate the control during the process of
synchronization However there might be hardware limitations on the value of frequency that can
be sustainedemulated within the laboratory To avoid such risks an auxiliary component should be
utilized to initialize the test network for PHIL simulations A dynamic load or a controlled current
source can be used for this purpose
The schematic for initialization and synchronization of PHIL at the RTDS with the current source
as the initialization and synchronization component is shown in Figure 6a The reference currents for
the auxiliary current source can be generated as presented in Section 41 A dynamic load could be
also used for the initialization however depending on the simulation software used this can have
different forms For example within Simulink simulation software the dynamic load is equivalent to
a current source hence the method would be equivalent to the current source method presented
before (and therefore can be utilized for case A and B) while within RSCAD (RTDS simulation
software tool) the dynamic load model does not allow for negative power set points (rendering it
unusable for case A)
(a) (b)
Figure 6 PHIL configuration for case study B affecting voltage and frequency during initialization
(a) with current source (b) with dynamic load Figure 6 PHIL configuration for case study B affecting voltage and frequency during initialization(a) with current source (b) with dynamic load
In this case the remainder of the GB power system (Areas 1ndash3 4 and 6) simulated withinRSCAD would initialize without Area 5 as there is enough generation to support the networkunlike case A but the frequency of the network would be above nominal (as no dispatching algorithmis implemented) The value of the frequency deviation would depend upon the droop settings
Energies 2018 11 1087 12 of 14
This is again undesirable as this would activate any frequency control algorithms implementedwithin the network There is of course an option to de-activate the control during the process ofsynchronization However there might be hardware limitations on the value of frequency that canbe sustainedemulated within the laboratory To avoid such risks an auxiliary component should beutilized to initialize the test network for PHIL simulations A dynamic load or a controlled currentsource can be used for this purpose
The schematic for initialization and synchronization of PHIL at the RTDS with the current sourceas the initialization and synchronization component is shown in Figure 6a The reference currents forthe auxiliary current source can be generated as presented in Case A Initialization A dynamic loadcould be also used for the initialization however depending on the simulation software used this canhave different forms For example within Simulink simulation software the dynamic load is equivalentto a current source hence the method would be equivalent to the current source method presentedbefore (and therefore can be utilized for case A and B) while within RSCAD (RTDS simulation softwaretool) the dynamic load model does not allow for negative power set points (rendering it unusable forcase A)
Synchronization
If the current sources are used for the initialization the same process of synchronization aspresented in Case A Synchronization is used In this case the dynamic load model could also beutilized indistinctly However if a dynamic load is being utilized instead of using current set pointsactive and reactive power set points are required (as presented in Figure 5b) and these can becalculated as
PSP_dynamic = Pre f minus PHW (5)
QSP_dynamic = Qre f minusQHW (6)
where PHW and QHW are the active and reactive power drawn by the hardware respectively and canbe calculated as
PHW = Va Ia1 + Vb Ib1 + Vc Ic1 (7)
QHW =1radic3(Va(Ib1 minus Ic1) + Vb(Ic1 minus Ia1) + Vc(Ia1 minus Ib1)) (8)
where Vabc are the three phase voltages at PCC and Iabc1 are the currents measured at the PCC after theincrement factor
For this scenario the current source model has been implemented It can be observed fromFigure 7 that by initializing and synchronizing the PHIL implementation with the current sourcesthe frequency and voltage at the PCC remain at the same steady state levels as before the connectionwith the HUT Also due to the nature of the hardware used and the real measurement deviceswhich can introduce some noise into the signals the frequency and voltage waveforms show morerealistic dynamics in comparison with a pure simulation
Energies 2018 11 1087 13 of 14
Energies 2018 11 x FOR PEER REVIEW 12 of 14
Synchronization
If the current sources are used for the initialization the same process of synchronization as
presented in Section 42 is used In this case the dynamic load model could also be utilized
indistinctly However if a dynamic load is being utilized instead of using current set points active
and reactive power set points are required (as presented in Figure 5b) and these can be calculated as
HWrefdynamicSP PPP _ (5)
HWrefdynamicSP QQQ _ (6)
where PHW and QHW are the active and reactive power drawn by the hardware respectively and can
be calculated as
111 ccbbaaHW IVIVIVP (7)
))()()((3
1111111 bacacbcbaHW IIVIIVIIVQ (8)
where Vabc are the three phase voltages at PCC and Iabc1 are the currents measured at the PCC after the
increment factor
For this scenario the current source model has been implemented It can be observed from
Figure 7 that by initializing and synchronizing the PHIL implementation with the current sources
the frequency and voltage at the PCC remain at the same steady state levels as before the connection
with the HUT Also due to the nature of the hardware used and the real measurement devices which
can introduce some noise into the signals the frequency and voltage waveforms show more realistic
dynamics in comparison with a pure simulation
(a)
(b)
Figure 7 Results for case B affecting voltage and frequency during initialization (a) Frequency
variation (b) voltage variation
5 Conclusions
PHIL simulations can be complex to initialize and synchronize depending on the HUT and its
significance to the dynamic behaviour and stability of the overall study system This then represents
a limiting factor on the range of scenarios for which PHIL can be applied This paper presents a range
of possible methodologies for enabling the initialization and synchronization of such scenarios The
investigation of these alternatives has led to the identification of a recommended approach that uses
current sources for initialization and symmetrical ramping rates for synchronization of PHIL
simulations The resulting improved performance and extended range of feasible scenarios that can
be studied have been validated by experimentation of two different and realistic scenarios for the GB
power system This will allow for safer and more stable PHIL simulations and permit validation of
Figure 7 Results for case B affecting voltage and frequency during initialization (a) Frequencyvariation (b) voltage variation
5 Conclusions
PHIL simulations can be complex to initialize and synchronize depending on the HUT and itssignificance to the dynamic behaviour and stability of the overall study system This then representsa limiting factor on the range of scenarios for which PHIL can be applied This paper presents arange of possible methodologies for enabling the initialization and synchronization of such scenariosThe investigation of these alternatives has led to the identification of a recommended approach thatuses current sources for initialization and symmetrical ramping rates for synchronization of PHILsimulations The resulting improved performance and extended range of feasible scenarios that canbe studied have been validated by experimentation of two different and realistic scenarios for theGB power system This will allow for safer and more stable PHIL simulations and permit validationof a wider range of realistic simulations through PHIL to the betterment of new controllers andpower components
Author Contributions EG-S and MHS conceived the research idea performed the experiments and wrote thepaper AJR and GMB oversaw the work and proofread the paper
Acknowledgments This work was partly supported by the European Communityrsquos Horizon 2020 Program(H20202014ndash2020) under the project ldquoERIGrid European Research Infrastructure supporting Smart Grid SystemsTechnology Development Validation and Roll Outrdquo (Grant No 654113) and from the European Union SeventhFramework Programme (FP7) under the project ELECTRA IRP (Grant No 609687)
Conflicts of Interest The authors declare no conflict of interest
References
1 Strasser T Andreacuten FP Lauss G Bruumlndlinger R Brunner H Moyo C Seitl C Rohjans S Lehnhoff SPalensky P et al e amp i Elektrotechnik und Informationstechnik Springer Vienna Austria 2017 Volume 134pp 71ndash77
2 Kotsampopoulos PC Lehfuss F Lauss GF Bletterie B Hatziargyriou ND The Limitations of DigitalSimulation and the Advantages of PHIL Testing in Studying Distributed Generation Provision of AncillaryServices IEEE Trans Ind Electron 2015 62 5502ndash5515 [CrossRef]
3 Edrington CS Steurer M Langston J El-Mezyani T Schoder K Role of Power Hardware in the Loopin Modeling and Simulation for Experimentation in Power and Energy Systems Proc IEEE 2015 1032401ndash2409 [CrossRef]
4 Kotsampopoulos P Kleftakis V Messinis G Hatziargyriou N Design development and operation ofa PHIL environment for Distributed Energy Resources In Proceedings of the IECON 2012mdash38th AnnualConference on IEEE Industrial Electronics Society Montreal QC Canada 25ndash28 October 2012 pp 4765ndash4770
5 Ren W Steurer M Woodruff S Applying Controller and Power Hardware-in-the-Loop Simulation inDesigning and Prototyping Apparatuses for Future All Electric Ship In Proceedings of the 2007 IEEE ElectricShip Technologies Symposium Arlington VA USA 21ndash23 May 2007 pp 443ndash448
Energies 2018 11 1087 14 of 14
6 Langston J Schoder K Steurer M Faruque O Hauer J Bogdan F Bravo R Mather B Katiraei FPower hardware-in-the-loop testing of a 500 kW photovoltaic array inverter In Proceedings of the IECON2012mdash38th Annual Conference on IEEE Industrial Electronics Society Montreal QC Canada 25ndash28 October2012 pp 4797ndash4802
7 Naeckel O Langston J Steurer M Fleming F Paran S Edrington C Noe M PowerHardware-in-the-Loop Testing of an Air Coil Superconducting Fault Current Limiter DemonstratorIEEE Trans Appl Superconduct 2015 25 1ndash7 [CrossRef]
8 Kotsampopoulos P Hatziargyriou N Bletterie B Lauss G Strasser T Introduction of advanced testingprocedures including PHIL for DG providing ancillary services In Proceedings of the IECON 2013mdash39thAnnual Conference of the IEEE Industrial Electronics Society Vienna Austria 10ndash13 November 2013pp 5398ndash5404
9 Zhu K Chenine M Nordstrom L ICT Architecture Impact on Wide Area Monitoring and Control SystemsrsquoReliability IEEE Trans Power Deliv 2011 26 2801ndash2808 [CrossRef]
10 Lauss GF Faruque MO Schoder K Dufour C Viehweider A Langston J Characteristics and Designof Power Hardware-in-the-Loop Simulations for Electrical Power Systems IEEE Trans Ind Electron 201663 406ndash417 [CrossRef]
11 Ren W Steurer M Baldwin TL Improve the Stability and the Accuracy of Power Hardware-in-the-LoopSimulation by Selecting Appropriate Interface Algorithms IEEE Trans Ind Appl 2008 44 1286ndash1294[CrossRef]
12 Viehweider A Lauss G Felix L Stabilization of Power Hardware-in-the-Loop Simulations of ElectricEnergy Systems Simul Model Pract Theory 2011 19 1699ndash1708 [CrossRef]
13 Hatakeyama T Riccobono A Monti A Stability and accuracy analysis of power hardware in the loopsystem with different interface algorithms In Proceedings of the 2016 IEEE 17th Workshop on Control andModeling for Power Electronics (COMPEL) Trondheim Norway 27ndash30 June 2016 pp 1ndash8
14 Dargahi M Ghosh A Ledwich G Stability synthesis of power hardware-in-the-loop (PHIL) simulationIn Proceedings of the 2014 IEEE PES General Meeting | Conference amp Exposition National Harbor MDUSA 27ndash31 July 2014 pp 1ndash5
15 Brandl R Operational Range of Several Interface Algorithms for Different Power Hardware-In-The-LoopSetups Energies 2017 10 1946 [CrossRef]
16 Liegmann E Riccobono A Monti A Wideband identification of impedance to improve accuracy andstability of power-hardware-in-the-loop simulations In Proceedings of the 2016 IEEE International Workshopon Applied Measurements for Power Systems (AMPS) Aachen Germany 28ndash30 September 2016 pp 1ndash6
17 Lehfuss F Lauss G Strasser T Implementation of a multi-rating interface for Power-Hardware-in-the-Loopsimulations In Proceedings of the IECON 2012mdash38th Annual Conference on IEEE Industrial ElectronicsSociety Montreal QC Canada 25ndash28 October 2012 pp 4777ndash4782
18 Yu M Roscoe AJ Dysko A Booth CD Ierna R Zhu J Urdal H Instantaneous Penetration LevelLimits of Non-Synchronous Devices in the British Power System IET Renew Power Gener 2016 11 1211ndash1217[CrossRef]
19 National Grid Electricity Ten Year Statement 2016 National Grid Warwick UK 201620 Lentijo S DrsquoArco S Monti A Comparing the Dynamic Performances of Power Hardware-in-the-Loop
Interfaces IEEE Trans Ind Electron 2010 57 1195ndash1207 [CrossRef]21 De Jong E de Graff R Vassen P Crolla P Roscoe A Lefuss F Lauss G Kotsampopoulos P Gafaro F
European White Book on Real-Time Power Hardware in the Loop Testing DERlab Kassel Germany 201222 Guillo-Sansano E Roscoe AJ Burt GM Harmonic-by-harmonic time delay compensation method for
PHIL simulation of low impedance power systems In Proceedings of the 2015 International Symposiumon Smart Electric Distribution Systems and Technologies (EDST) Vienna Austria 8ndash11 September 2015pp 560ndash565
copy 2018 by the authors Licensee MDPI Basel Switzerland This article is an open accessarticle distributed under the terms and conditions of the Creative Commons Attribution(CC BY) license (httpcreativecommonsorglicensesby40)
- Introduction
- PHIL Initialization and Synchronization
-
- The Challenge
- Initialization of DRTS Simulation
- Synchronization
-
- Experimental Setup for PHIL
-
- GB Power System
- Power Interface
- HUT
- Time Delay Compensation
-
- Experimental Assessment and Validation
- Conclusions
- References
-
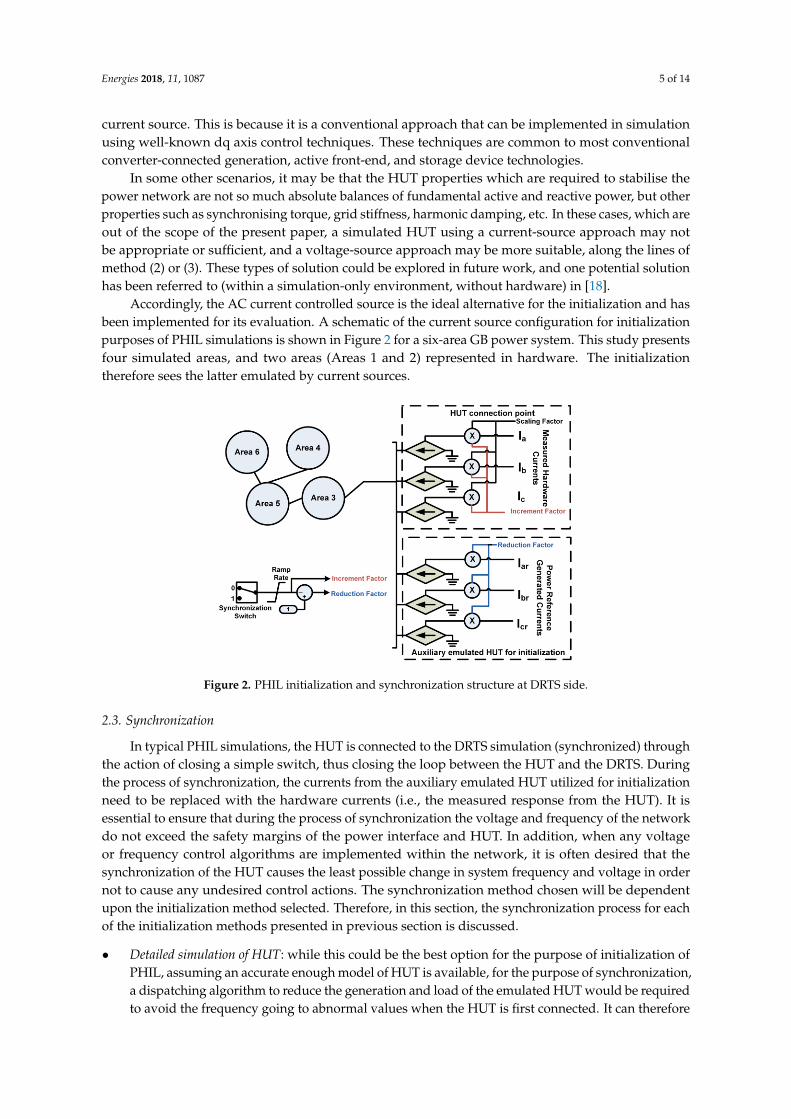
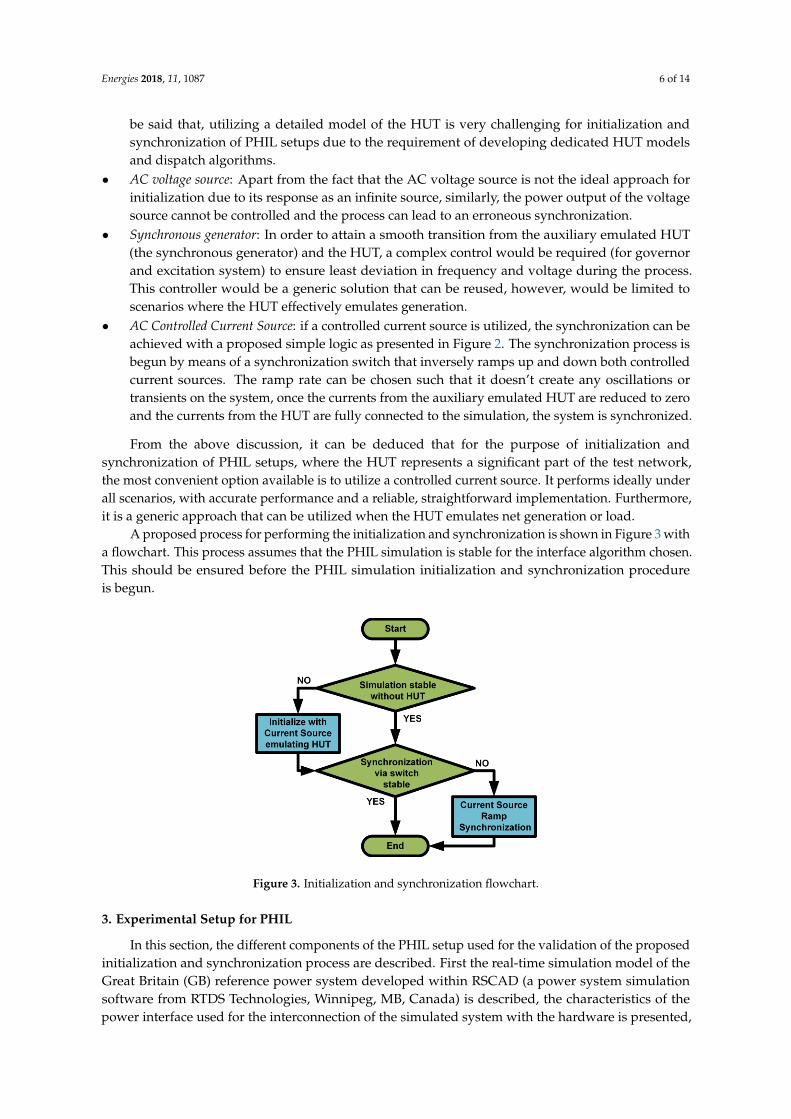
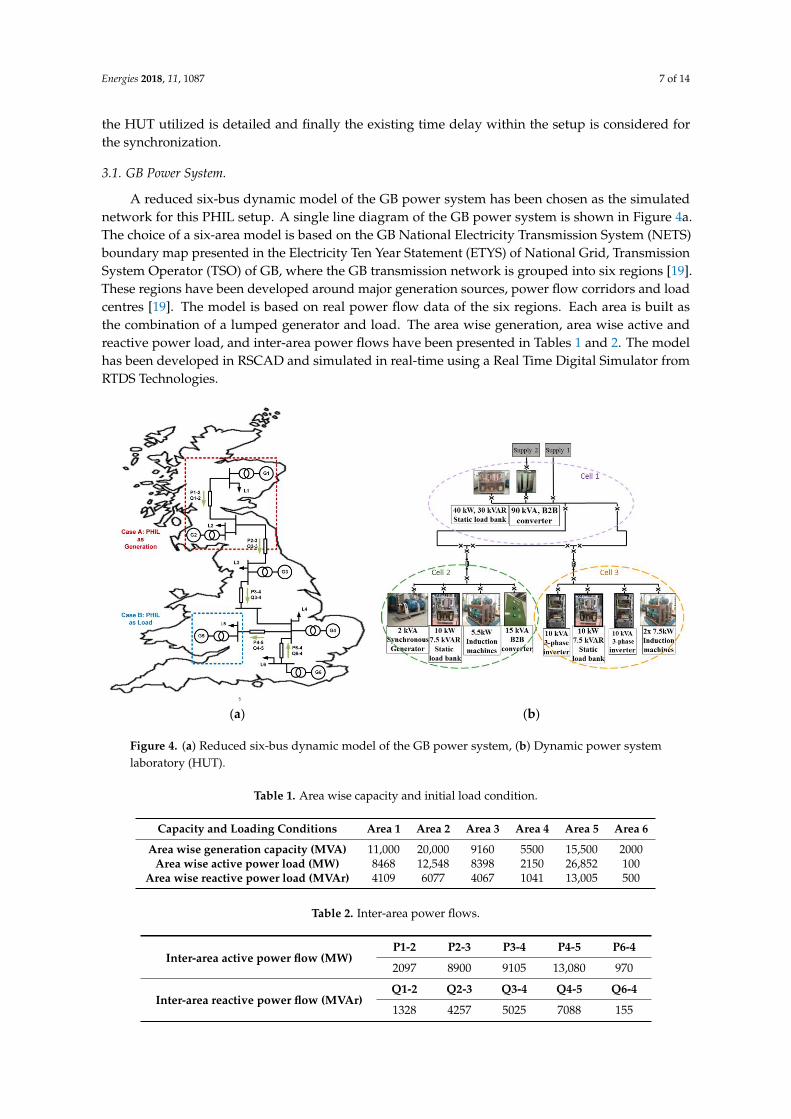
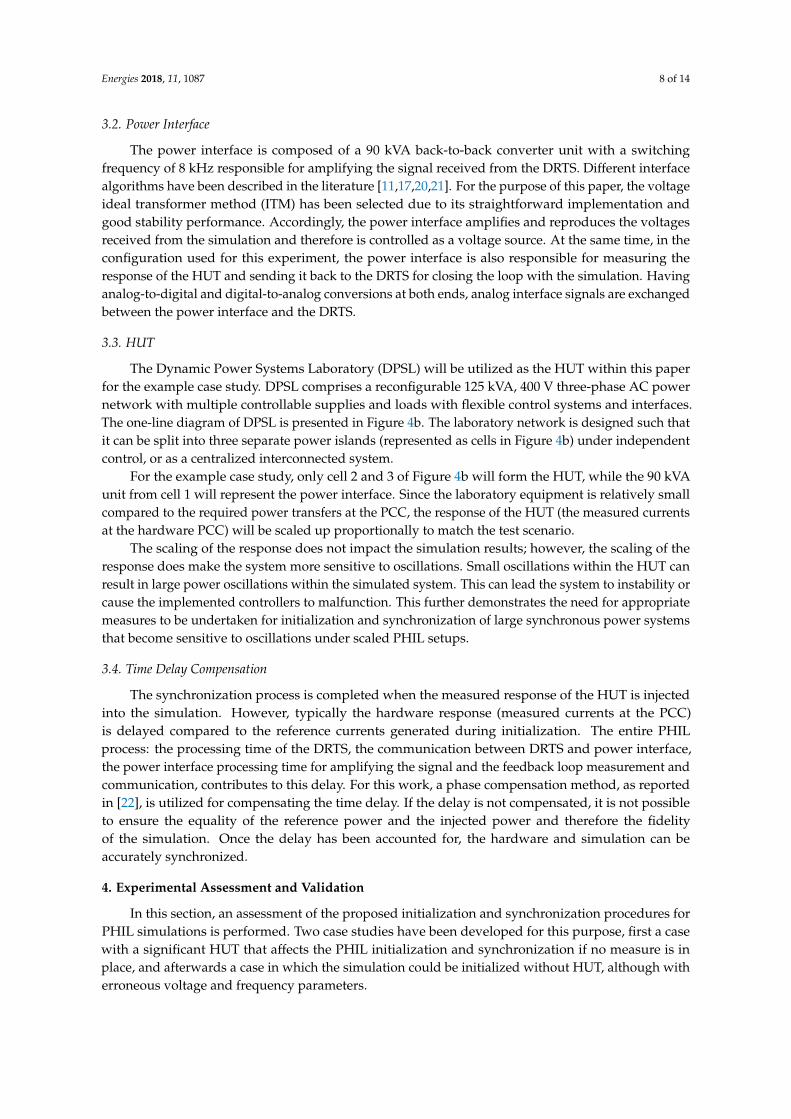
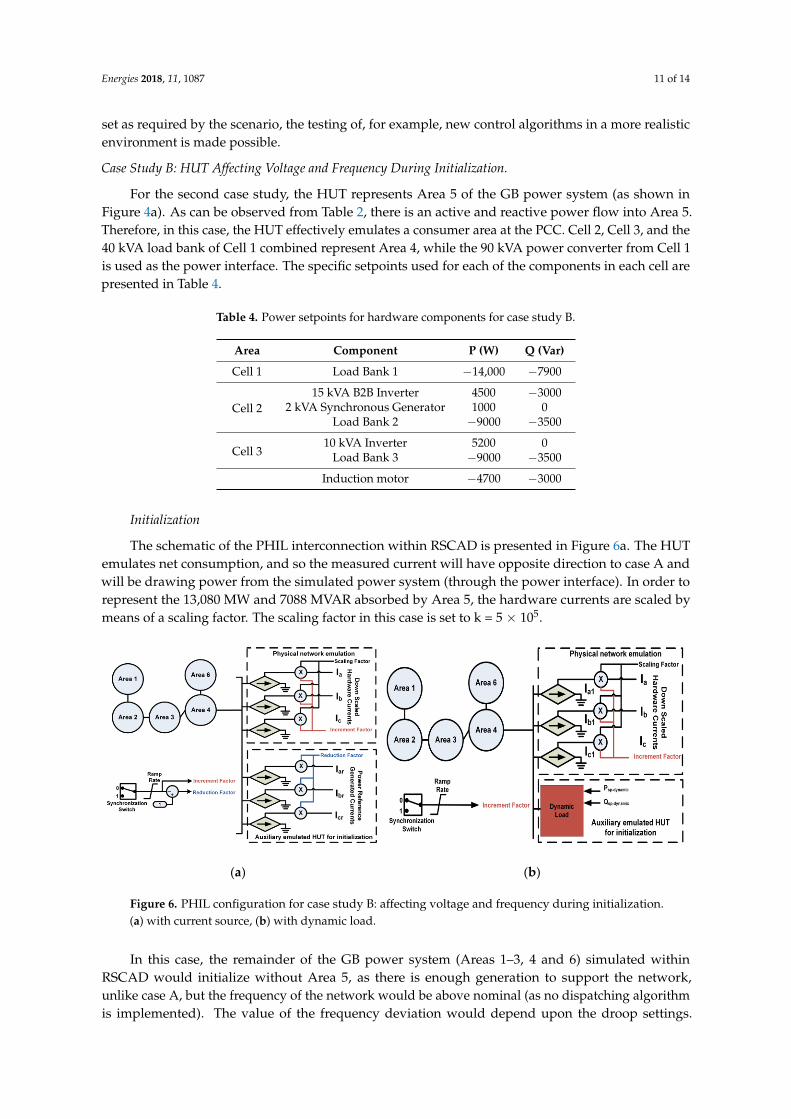
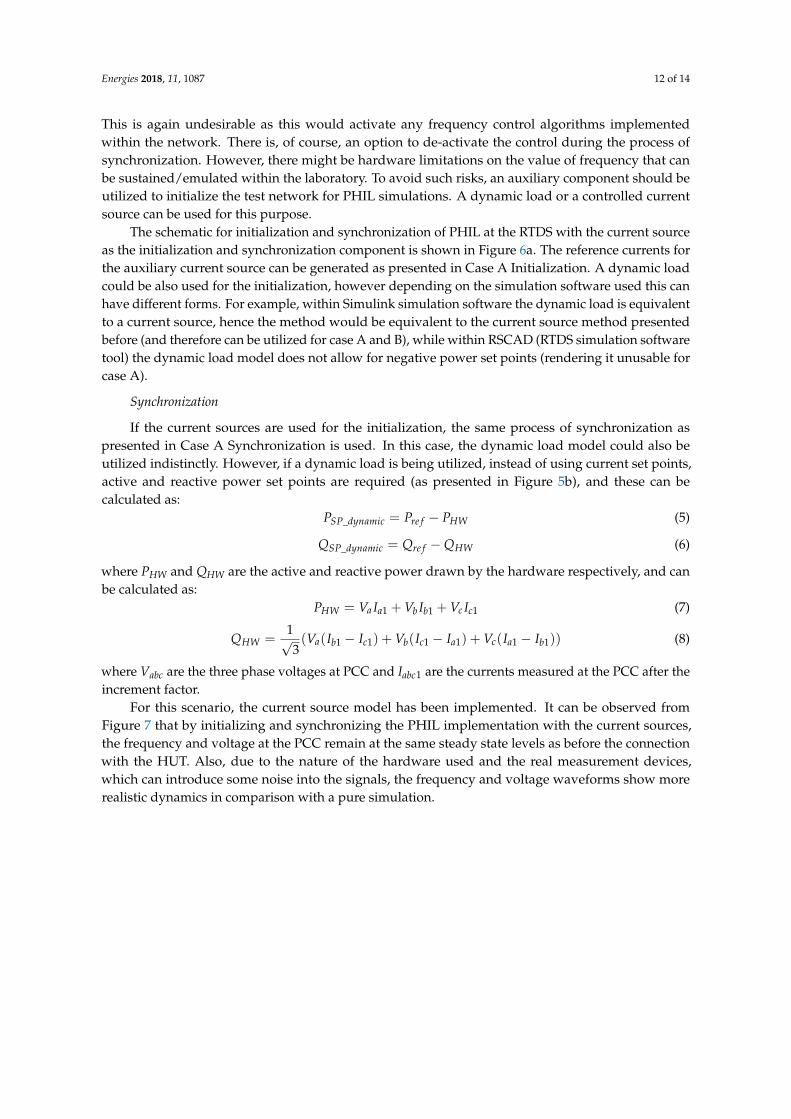