initiate at buy: vertically integrated float glass play ... · iqmethod sm - quality of earnings*...
TRANSCRIPT
This research report provides general information only. No part of this report may be used or reproduced or quoted in any manner whatsoever in Taiwan by the press or other persons without the express written consent of BofA Merrill Lynch. >> Employed by a non-US affiliate of MLPF&S and is not registered/qualified as a research analyst under the FINRA rules. Refer to "Other Important Disclosures" for information on certain BofA Merrill Lynch entities that take responsibility for this report in particular jurisdictions. BofA Merrill Lynch does and seeks to do business with issuers covered in its research reports. As a result, investors should be aware that the firm may have a conflict of interest that could affect the objectivity of this report. Investors should consider this report as only a single factor in making their investment decision. Refer to important disclosures on page 38 to 40. Analyst Certification on page 35. Price Objective Basis/Risk on page 35. 11808131
Xinyi Glass
Initiate at Buy: Vertically integrated float glass play; Growth with low valuation
Initiating Coverage: BUY | PO: 10.00 HKD | Price: 7.68 HKD Equity | 03 November 2017
Initiate at Buy with HK$10 PO; Attractive Valuation We initiate coverage on Xinyi Glass (XYG) with a Buy rating and PO of HK$10, based on SOTP with 10x FY18E P/E on its core business and its stake in Xinyi Solar using BofAML’s valuation. XYG is China’s No.1 float glass producer with 10% market share and No.2 in low-emissivity (low-e) construction glass and the world’s largest supplier of automobile aftermarket glass (ARG) with 25% market share. We have XYG as our top pick in the China glass sector given our positive view on float glass industry, its focus on higher value-add products (>30%), healthy b/s (33% net gearing), and 18-20% 2017-20E earnings growth. XYG trades at just 6.7x our 18E P/E with 27% ROE and 7.4% div yield.
Key beneficiary of float glass supply-demand improvement We are positive on the supply/demand dynamics of the float glass industry given the upcoming cold-repair cycle in 2018-19E (c.13% of capacity to go offline for 9-12 months), which will likely reduce the effective capacity by c.5%. The float glass industry is also likely to enter another round of consolidation– we expect effective capacity to remain flat at 46mntpa while demand is likely to grow at 2% pa until 2020.
Volume growth, driven by strategic expansion overseas XYG plans to increase its float glass capacity by 50% by 2020E, led by growth overseas in Malaysia/Canada. We expect GP% to improve from 36% in 2016 to 38% in 2020E – Malaysia GP margin is c.10ppt higher vs domestic, thanks to cheaper gas /higher ASP. With expansion in Canada, XYG could gain share in the low-e and ARG markets in the US.
Potential margin improvement from soda ash cost decline XYG uses gas as its major fuel, sourced mostly directly from upstream suppliers at a discount to benchmark non-residential prices. We expect gas price to decline long term as the govt is targeting to encourage gas consumption. We also highlight XYG has secured 30% of its 2018E soda ash requirement from overseas supplier at c.RMB1,700/t (20% lower vs. spot). Risks:large hike in soda ash/ gas px; large drop in property demand Estimates (Dec) (HK$) 2015A 2016A 2017E 2018E 2019E Net Income (Adjusted - mn) 2,141 3,242 3,787 4,528 5,428 EPS 0.524 0.805 0.947 1.13 1.36 EPS Change (YoY) 55.1% 53.5% 17.7% 19.5% 19.9% Dividend / Share 0.263 0.418 0.473 0.566 0.679 Free Cash Flow / Share 0.136 0.572 0.391 0.456 0.713
Valuation (Dec) 2015A 2016A 2017E 2018E 2019E P/E 14.65x 9.54x 8.11x 6.78x 5.66x Dividend Yield 3.43% 5.44% 6.17% 7.37% 8.84% EV / EBITDA* 12.46x 8.59x 7.44x 6.23x 5.21x Free Cash Flow Yield* 1.73% 7.21% 5.08% 5.93% 9.27% * For full definitions of iQmethod SM measures, see page 37.
David Ching, CFA >> Research Analyst Merrill Lynch (Hong Kong) +852 3508 3905 [email protected] Ming Hsun Lee, CFA >> Research Analyst Merrill Lynch (Taiwan) [email protected] Matty Zhao >> Research Analyst Merrill Lynch (Hong Kong) [email protected] Stock Data
Price 7.68 HKD Price Objective 10.00 HKD Date Established 3-Nov-2017 Investment Opinion C-1-7 52-Week Range 5.31 HKD-8.52 HKD Mrkt Val / Shares Out (mn) 3,945 USD / 4,007.3 Market Value (mn) 30,776 HKD Average Daily Value (mn) 10.42 USD Free Float 45.8% BofAML Ticker / Exchange XYIGF / HKG Bloomberg / Reuters 868 HK / 0868.HK ROE (2017E) 26.8% Net Dbt to Eqty (Dec-2016A) 37.1%
Timestamp: 02 November 2017 04:30PM EDT
Una
utho
rized
red
istr
ibut
ion
of th
is r
epor
t is
proh
ibite
d. T
his
repo
rt is
inte
nded
for
mar
tinzz
heng
@ha
ngse
ng.c
om
2 Xinyi Glass | 03 November 2017
iQprofile SM
Xinyi Glass
Company Sector
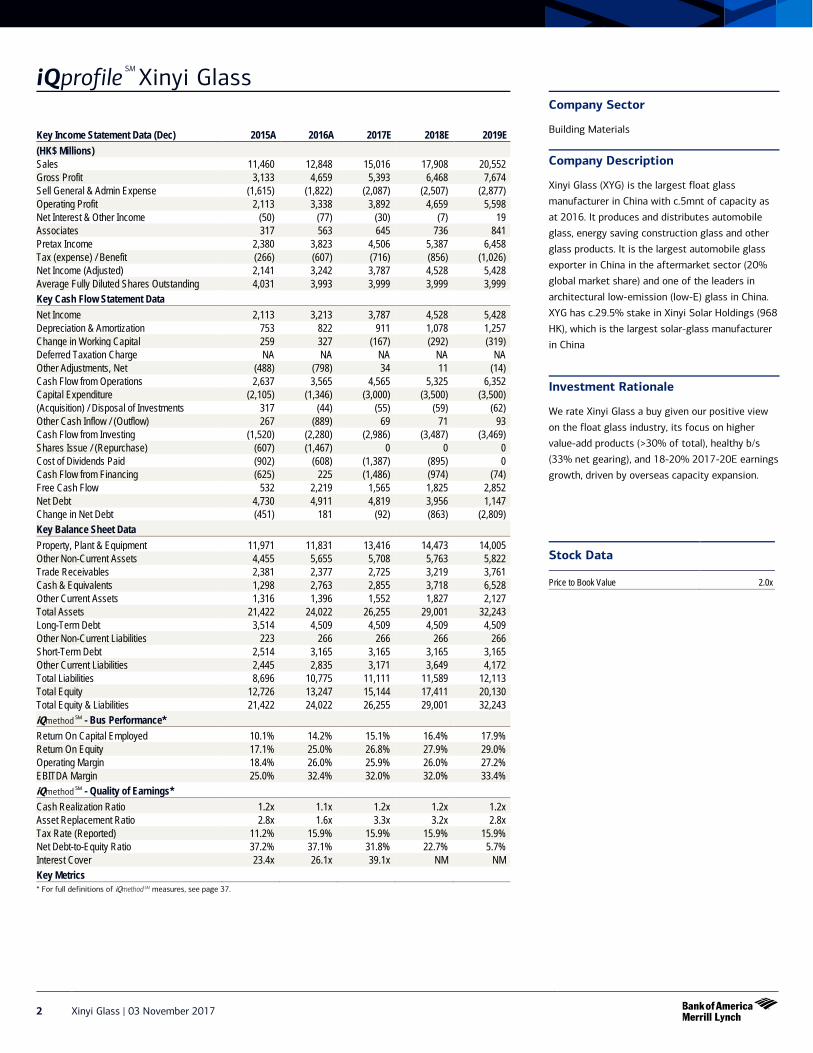
Building Materials Company Description
Xinyi Glass (XYG) is the largest float glass
manufacturer in China with c.5mnt of capacity as
at 2016. It produces and distributes automobile
glass, energy saving construction glass and other
glass products. It is the largest automobile glass
exporter in China in the aftermarket sector (20%
global market share) and one of the leaders in
architectural low-emission (low-E) glass in China.
XYG has c.29.5% stake in Xinyi Solar Holdings (968
HK), which is the largest solar-glass manufacturer
in China
Investment Rationale
We rate Xinyi Glass a buy given our positive view
on the float glass industry, its focus on higher
value-add products (>30% of total), healthy b/s
(33% net gearing), and 18-20% 2017-20E earnings
growth, driven by overseas capacity expansion. Stock Data
Price to Book Value 2.0x
Key Income Statement Data (Dec) 2015A 2016A 2017E 2018E 2019E (HK$ Millions) Sales 11,460 12,848 15,016 17,908 20,552 Gross Profit 3,133 4,659 5,393 6,468 7,674 Sell General & Admin Expense (1,615) (1,822) (2,087) (2,507) (2,877) Operating Profit 2,113 3,338 3,892 4,659 5,598 Net Interest & Other Income (50) (77) (30) (7) 19 Associates 317 563 645 736 841 Pretax Income 2,380 3,823 4,506 5,387 6,458 Tax (expense) / Benefit (266) (607) (716) (856) (1,026) Net Income (Adjusted) 2,141 3,242 3,787 4,528 5,428 Average Fully Diluted Shares Outstanding 4,031 3,993 3,999 3,999 3,999 Key Cash Flow Statement Data Net Income 2,113 3,213 3,787 4,528 5,428 Depreciation & Amortization 753 822 911 1,078 1,257 Change in Working Capital 259 327 (167) (292) (319) Deferred Taxation Charge NA NA NA NA NA Other Adjustments, Net (488) (798) 34 11 (14) Cash Flow from Operations 2,637 3,565 4,565 5,325 6,352 Capital Expenditure (2,105) (1,346) (3,000) (3,500) (3,500) (Acquisition) / Disposal of Investments 317 (44) (55) (59) (62) Other Cash Inflow / (Outflow) 267 (889) 69 71 93 Cash Flow from Investing (1,520) (2,280) (2,986) (3,487) (3,469) Shares Issue / (Repurchase) (607) (1,467) 0 0 0 Cost of Dividends Paid (902) (608) (1,387) (895) 0 Cash Flow from Financing (625) 225 (1,486) (974) (74) Free Cash Flow 532 2,219 1,565 1,825 2,852 Net Debt 4,730 4,911 4,819 3,956 1,147 Change in Net Debt (451) 181 (92) (863) (2,809) Key Balance Sheet Data Property, Plant & Equipment 11,971 11,831 13,416 14,473 14,005 Other Non-Current Assets 4,455 5,655 5,708 5,763 5,822 Trade Receivables 2,381 2,377 2,725 3,219 3,761 Cash & Equivalents 1,298 2,763 2,855 3,718 6,528 Other Current Assets 1,316 1,396 1,552 1,827 2,127 Total Assets 21,422 24,022 26,255 29,001 32,243 Long-Term Debt 3,514 4,509 4,509 4,509 4,509 Other Non-Current Liabilities 223 266 266 266 266 Short-Term Debt 2,514 3,165 3,165 3,165 3,165 Other Current Liabilities 2,445 2,835 3,171 3,649 4,172 Total Liabilities 8,696 10,775 11,111 11,589 12,113 Total Equity 12,726 13,247 15,144 17,411 20,130 Total Equity & Liabilities 21,422 24,022 26,255 29,001 32,243 iQmethod SM - Bus Performance* Return On Capital Employed 10.1% 14.2% 15.1% 16.4% 17.9% Return On Equity 17.1% 25.0% 26.8% 27.9% 29.0% Operating Margin 18.4% 26.0% 25.9% 26.0% 27.2% EBITDA Margin 25.0% 32.4% 32.0% 32.0% 33.4% iQmethod SM - Quality of Earnings* Cash Realization Ratio 1.2x 1.1x 1.2x 1.2x 1.2x Asset Replacement Ratio 2.8x 1.6x 3.3x 3.2x 2.8x Tax Rate (Reported) 11.2% 15.9% 15.9% 15.9% 15.9% Net Debt-to-Equity Ratio 37.2% 37.1% 31.8% 22.7% 5.7% Interest Cover 23.4x 26.1x 39.1x NM NM Key Metrics * For full definitions of iQmethod SM measures, see page 37.
Xinyi Glass | 03 November 2017 3
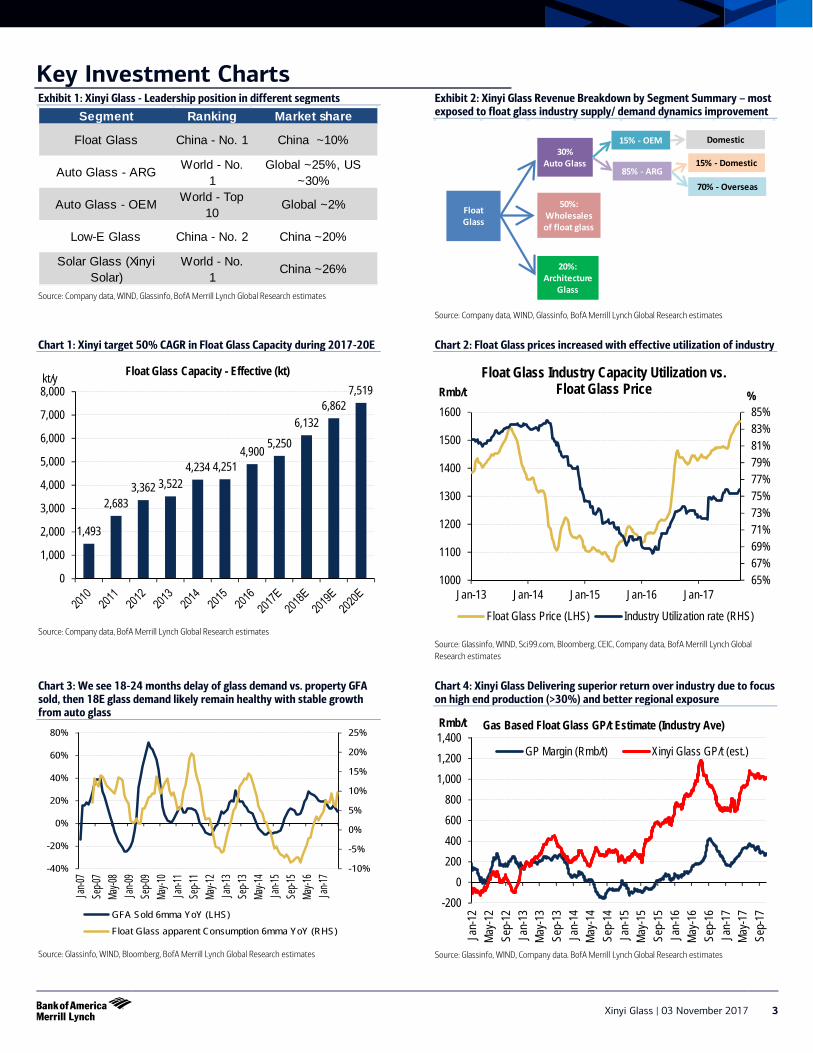
Key Investment Charts Exhibit 1: Xinyi Glass - Leadership position in different segments
Source: Company data, WIND, Glassinfo, BofA Merrill Lynch Global Research estimates
Exhibit 2: Xinyi Glass Revenue Breakdown by Segment Summary – most exposed to float glass industry supply/ demand dynamics improvement
Source: Company data, WIND, Glassinfo, BofA Merrill Lynch Global Research estimates
Chart 1: Xinyi target 50% CAGR in Float Glass Capacity during 2017-20E
Source: Company data, BofA Merrill Lynch Global Research estimates
Chart 2: Float Glass prices increased with effective utilization of industry
Source: Glassinfo, WIND, Sci99.com, Bloomberg, CEIC, Company data, BofA Merrill Lynch Global Research estimates
Chart 3: We see 18-24 months delay of glass demand vs. property GFA sold, then 18E glass demand likely remain healthy with stable growth from auto glass
Source: Glassinfo, WIND, Bloomberg, BofA Merrill Lynch Global Research estimates
Chart 4: Xinyi Glass Delivering superior return over industry due to focus on high end production (>30%) and better regional exposure
Source: Glassinfo, WIND, Company data. BofA Merrill Lynch Global Research estimates
Segment Ranking Market share
Float Glass China - No. 1 China ~10%
Auto Glass - ARG World - No. 1
Global ~25%, US ~30%
Auto Glass - OEM World - Top 10
Global ~2%
Low-E Glass China - No. 2 China ~20%
Solar Glass (Xinyi Solar)
World - No. 1
China ~26%
FloatGlass
20%: Architecture
Glass
50%:Wholesalesof float glass
30%Auto Glass
15% - OEM
85% - ARG
Domestic
70% - Overseas
15% - Domestic
1,493
2,683 3,362 3,522
4,234 4,251 4,900 5,250
6,132 6,862
7,519
0
1,000
2,000
3,000
4,000
5,000
6,000
7,000
8,000kt/y Float Glass Capacity - Effective (kt)
65%67%69%71%73%75%77%79%81%83%85%
1000
1100
1200
1300
1400
1500
1600
Jan-13 Jan-14 Jan-15 Jan-16 Jan-17
% Rmb/t Float Glass Industry Capacity Utilization vs.
Float Glass Price
Float Glass Price (LHS) Industry Utilization rate (RHS)
-10%
-5%
0%
5%
10%
15%
20%
25%
-40%
-20%
0%
20%
40%
60%
80%
Jan-07
Sep-0
7Ma
y-08
Jan-09
Sep-0
9Ma
y-10
Jan-11
Sep-1
1Ma
y-12
Jan-13
Sep-1
3Ma
y-14
Jan-15
Sep-1
5Ma
y-16
Jan-17
GFA Sold 6mma YoY (LHS)
Float Glass apparent Consumption 6mma YoY (RHS)
-2000
200400600800
1,0001,2001,400
Jan-
12Ma
y-12
Sep-
12Ja
n-13
May-1
3Se
p-13
Jan-
14Ma
y-14
Sep-
14Ja
n-15
May-1
5Se
p-15
Jan-
16Ma
y-16
Sep-
16Ja
n-17
May-1
7Se
p-17
Rmb/t Gas Based Float Glass GP/t Estimate (Industry Ave)
GP Margin (Rmb/t) Xinyi Glass GP/t (est.)
4 Xinyi Glass | 03 November 2017
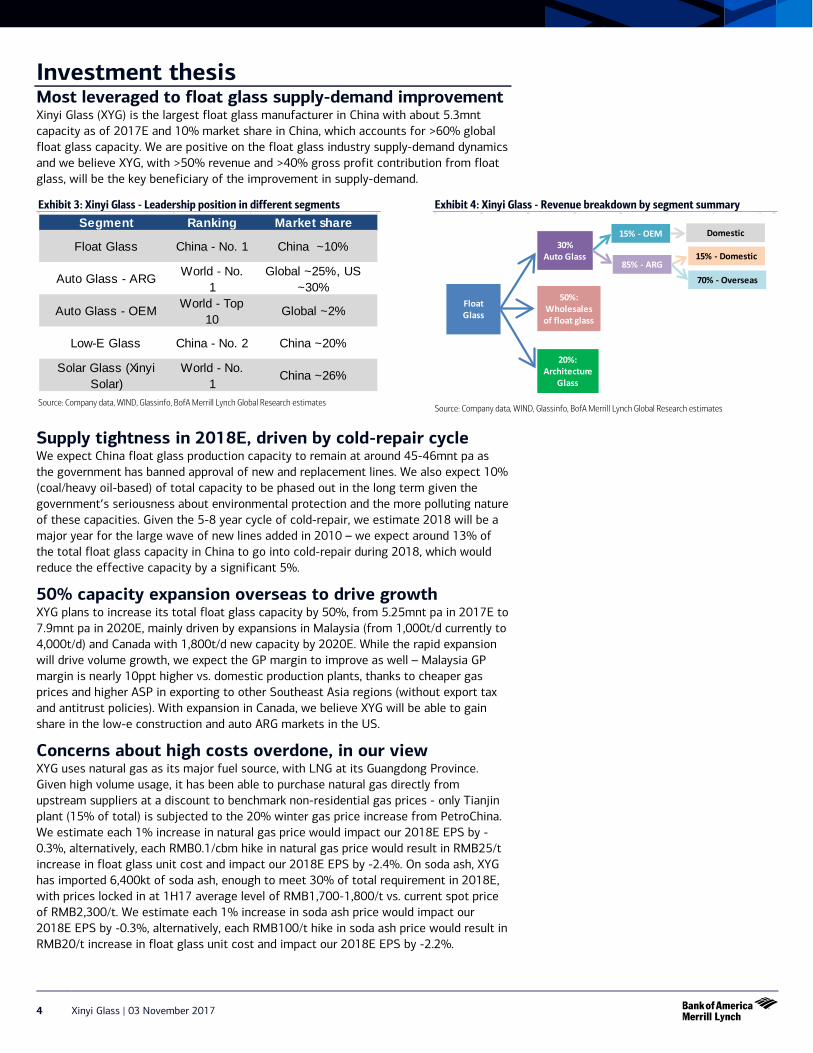
Investment thesis Most leveraged to float glass supply-demand improvement Xinyi Glass (XYG) is the largest float glass manufacturer in China with about 5.3mnt capacity as of 2017E and 10% market share in China, which accounts for >60% global float glass capacity. We are positive on the float glass industry supply-demand dynamics and we believe XYG, with >50% revenue and >40% gross profit contribution from float glass, will be the key beneficiary of the improvement in supply-demand.
Exhibit 3: Xinyi Glass - Leadership position in different segments
Source: Company data, WIND, Glassinfo, BofA Merrill Lynch Global Research estimates
Exhibit 4: Xinyi Glass - Revenue breakdown by segment summary
Source: Company data, WIND, Glassinfo, BofA Merrill Lynch Global Research estimates
Supply tightness in 2018E, driven by cold-repair cycle We expect China float glass production capacity to remain at around 45-46mnt pa as the government has banned approval of new and replacement lines. We also expect 10% (coal/heavy oil-based) of total capacity to be phased out in the long term given the government’s seriousness about environmental protection and the more polluting nature of these capacities. Given the 5-8 year cycle of cold-repair, we estimate 2018 will be a major year for the large wave of new lines added in 2010 – we expect around 13% of the total float glass capacity in China to go into cold-repair during 2018, which would reduce the effective capacity by a significant 5%.
50% capacity expansion overseas to drive growth XYG plans to increase its total float glass capacity by 50%, from 5.25mnt pa in 2017E to 7.9mnt pa in 2020E, mainly driven by expansions in Malaysia (from 1,000t/d currently to 4,000t/d) and Canada with 1,800t/d new capacity by 2020E. While the rapid expansion will drive volume growth, we expect the GP margin to improve as well – Malaysia GP margin is nearly 10ppt higher vs. domestic production plants, thanks to cheaper gas prices and higher ASP in exporting to other Southeast Asia regions (without export tax and antitrust policies). With expansion in Canada, we believe XYG will be able to gain share in the low-e construction and auto ARG markets in the US.
Concerns about high costs overdone, in our view XYG uses natural gas as its major fuel source, with LNG at its Guangdong Province. Given high volume usage, it has been able to purchase natural gas directly from upstream suppliers at a discount to benchmark non-residential gas prices - only Tianjin plant (15% of total) is subjected to the 20% winter gas price increase from PetroChina. We estimate each 1% increase in natural gas price would impact our 2018E EPS by -0.3%, alternatively, each RMB0.1/cbm hike in natural gas price would result in RMB25/t increase in float glass unit cost and impact our 2018E EPS by -2.4%. On soda ash, XYG has imported 6,400kt of soda ash, enough to meet 30% of total requirement in 2018E, with prices locked in at 1H17 average level of RMB1,700-1,800/t vs. current spot price of RMB2,300/t. We estimate each 1% increase in soda ash price would impact our 2018E EPS by -0.3%, alternatively, each RMB100/t hike in soda ash price would result in RMB20/t increase in float glass unit cost and impact our 2018E EPS by -2.2%.
Segment Ranking Market share
Float Glass China - No. 1 China ~10%
Auto Glass - ARG World - No. 1
Global ~25%, US ~30%
Auto Glass - OEM World - Top 10
Global ~2%
Low-E Glass China - No. 2 China ~20%
Solar Glass (Xinyi Solar)
World - No. 1
China ~26%
FloatGlass
20%: Architecture
Glass
50%:Wholesalesof float glass
30%Auto Glass
15% - OEM
85% - ARG
Domestic
70% - Overseas
15% - Domestic
Xinyi Glass | 03 November 2017 5
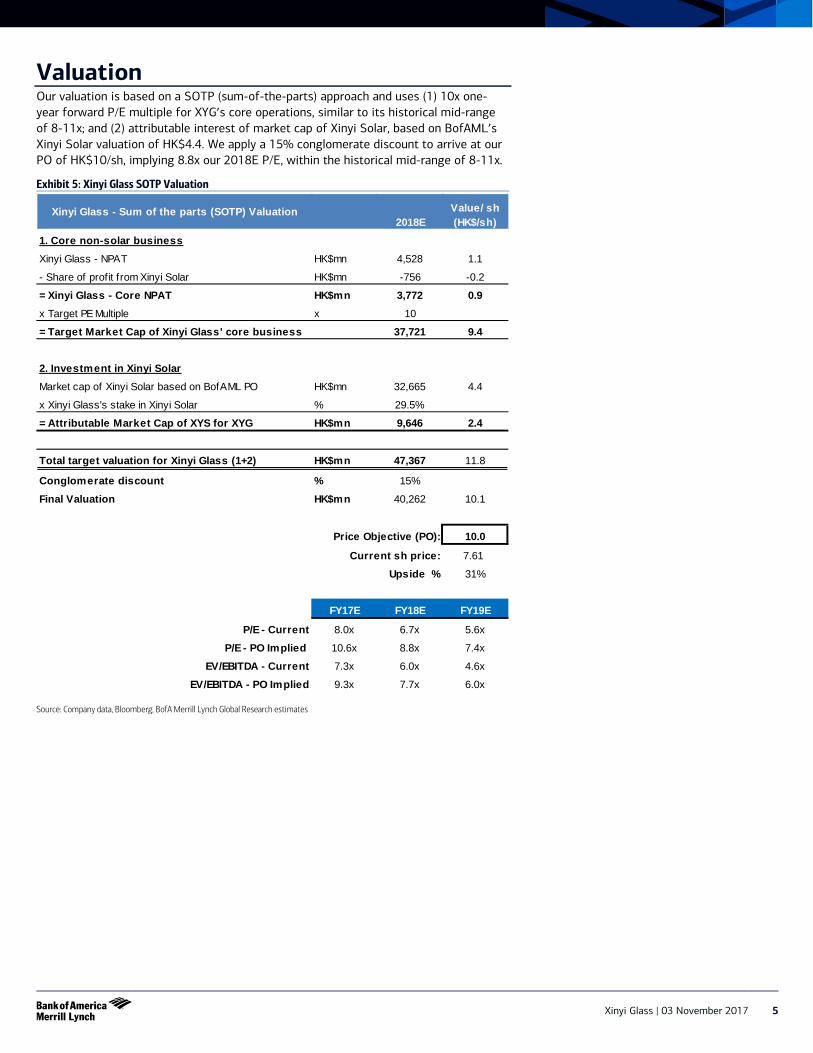
Valuation Our valuation is based on a SOTP (sum-of-the-parts) approach and uses (1) 10x one-year forward P/E multiple for XYG’s core operations, similar to its historical mid-range of 8-11x; and (2) attributable interest of market cap of Xinyi Solar, based on BofAML’s Xinyi Solar valuation of HK$4.4. We apply a 15% conglomerate discount to arrive at our PO of HK$10/sh, implying 8.8x our 2018E P/E, within the historical mid-range of 8-11x.
Exhibit 5: Xinyi Glass SOTP Valuation
Source: Company data, Bloomberg, BofA Merrill Lynch Global Research estimates
Xinyi Glass - Sum of the parts (SOTP) Valuation2018E
Value/ sh (HK$/sh)
1. Core non-solar businessXinyi Glass - NPAT HK$mn 4,528 1.1
- Share of profit from Xinyi Solar HK$mn -756 -0.2
= Xinyi Glass - Core NPAT HK$mn 3,772 0.9x Target PE Multiple x 10
= Target Market Cap of Xinyi Glass' core business 37,721 9.4
2. Investment in Xinyi SolarMarket cap of Xinyi Solar based on BofAML PO HK$mn 32,665 4.4
x Xinyi Glass's stake in Xinyi Solar % 29.5%
= Attributable Market Cap of XYS for XYG HK$mn 9,646 2.4
Total target valuation for Xinyi Glass (1+2) HK$mn 47,367 11.8
Conglomerate discount % 15%
Final Valuation HK$mn 40,262 10.1
Price Objective (PO): 10.0
Current sh price: 7.61
Upside % 31%
FY17E FY18E FY19E
P/E - Current 8.0x 6.7x 5.6x
P/E - PO Implied 10.6x 8.8x 7.4x
EV/EBITDA - Current 7.3x 6.0x 4.6x
EV/EBITDA - PO Implied 9.3x 7.7x 6.0x
6 Xinyi Glass | 03 November 2017
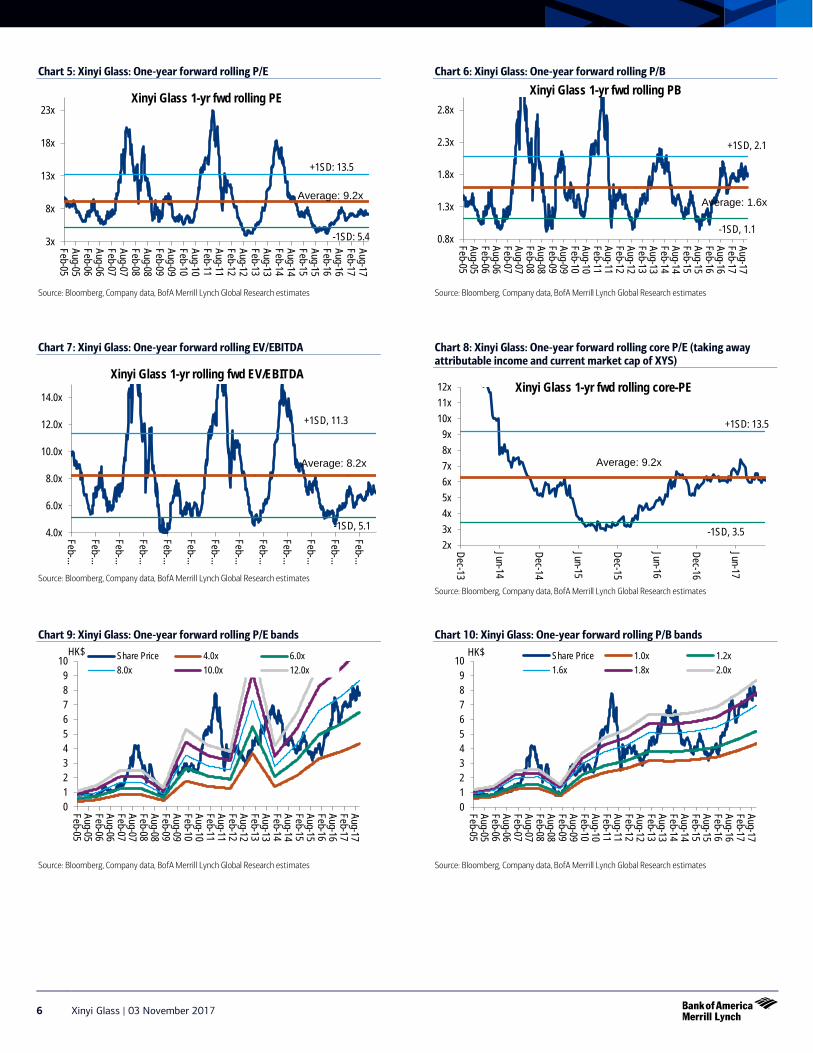
Chart 5: Xinyi Glass: One-year forward rolling P/E
Source: Bloomberg, Company data, BofA Merrill Lynch Global Research estimates
Chart 6: Xinyi Glass: One-year forward rolling P/B
Source: Bloomberg, Company data, BofA Merrill Lynch Global Research estimates
Chart 7: Xinyi Glass: One-year forward rolling EV/EBITDA
Source: Bloomberg, Company data, BofA Merrill Lynch Global Research estimates
Chart 8: Xinyi Glass: One-year forward rolling core P/E (taking away attributable income and current market cap of XYS)
Source: Bloomberg, Company data, BofA Merrill Lynch Global Research estimates
Chart 9: Xinyi Glass: One-year forward rolling P/E bands
Source: Bloomberg, Company data, BofA Merrill Lynch Global Research estimates
Chart 10: Xinyi Glass: One-year forward rolling P/B bands
Source: Bloomberg, Company data, BofA Merrill Lynch Global Research estimates
-1SD: 5.4
+1SD: 13.5
3x
8x
13x
18x
23x
Feb-05Aug-05Feb-06Aug-06Feb-07Aug-07Feb-08Aug-08Feb-09Aug-09Feb-10Aug-10Feb-11Aug-11Feb-12Aug-12Feb-13Aug-13Feb-14Aug-14Feb-15Aug-15Feb-16Aug-16Feb-17Aug-17
Xinyi Glass 1-yr fwd rolling PE
Average: 9.2x
-1SD, 1.1
+1SD, 2.1
0.8x
1.3x
1.8x
2.3x
2.8x
Feb-05Aug-05Feb-06Aug-06Feb-07Aug-07Feb-08Aug-08Feb-09Aug-09Feb-10Aug-10Feb-11Aug-11Feb-12Aug-12Feb-13Aug-13Feb-14Aug-14Feb-15Aug-15Feb-16Aug-16Feb-17Aug-17
Xinyi Glass 1-yr fwd rolling PB
Average: 1.6x
-1SD, 5.1
+1SD, 11.3
4.0x
6.0x
8.0x
10.0x
12.0x
14.0x
Feb-…
Feb-…
Feb-…
Feb-…
Feb-…
Feb-…
Feb-…
Feb-…
Feb-…
Feb-…
Feb-…
Feb-…
Feb-…
Xinyi Glass 1-yr rolling fwd EV/EBITDA
Average: 8.2x
-1SD, 3.5
+1SD: 13.5
2x3x4x5x6x7x8x9x
10x11x12x
Dec-13
Jun-14
Dec-14
Jun-15
Dec-15
Jun-16
Dec-16
Jun-17
Xinyi Glass 1-yr fwd rolling core-PE
Average: 9.2x
0123456789
10
Feb-05Aug-05Feb-06Aug-06Feb-07Aug-07Feb-08Aug-08Feb-09Aug-09Feb-10Aug-10Feb-11Aug-11Feb-12Aug-12Feb-13Aug-13Feb-14Aug-14Feb-15Aug-15Feb-16Aug-16Feb-17Aug-17
Share Price 4.0x 6.0x8.0x 10.0x 12.0x
HK$
0123456789
10
Feb-05Aug-05Feb-06Aug-06Feb-07Aug-07Feb-08Aug-08Feb-09Aug-09Feb-10Aug-10Feb-11Aug-11Feb-12Aug-12Feb-13Aug-13Feb-14Aug-14Feb-15Aug-15Feb-16Aug-16Feb-17Aug-17
Share Price 1.0x 1.2x1.6x 1.8x 2.0x
HK$
Xinyi Glass | 03 November 2017 7
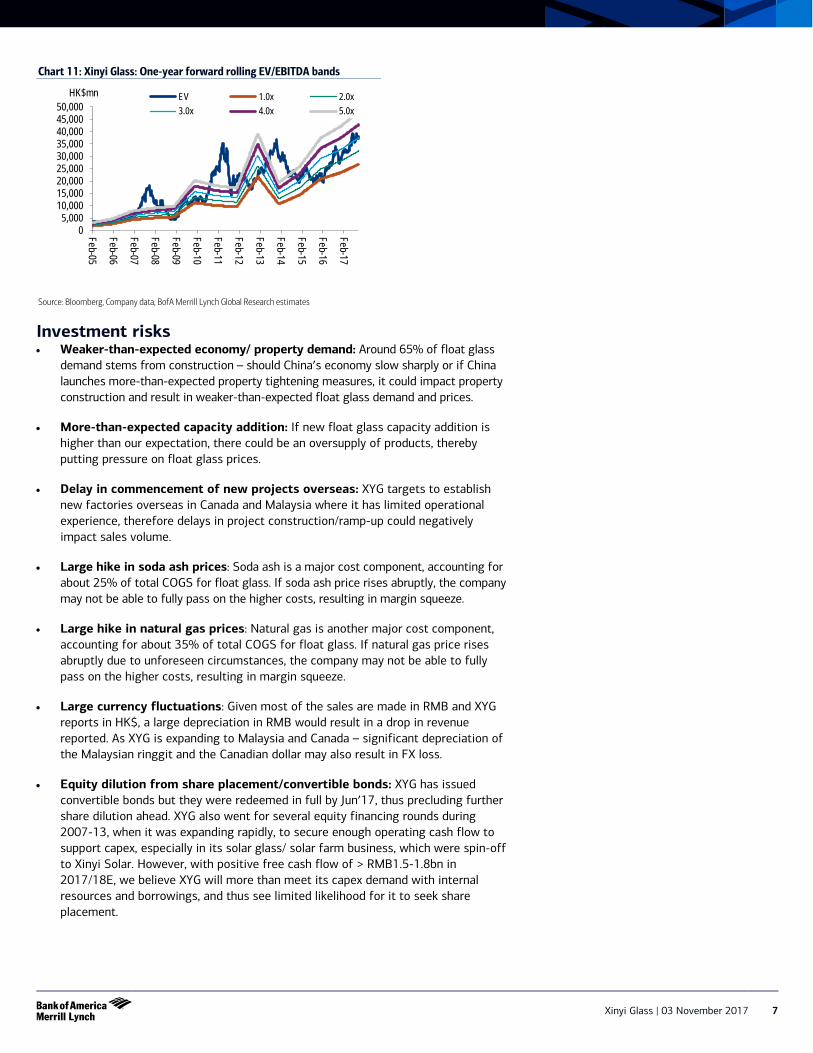
Chart 11: Xinyi Glass: One-year forward rolling EV/EBITDA bands
Source: Bloomberg, Company data, BofA Merrill Lynch Global Research estimates
Investment risks • Weaker-than-expected economy/ property demand: Around 65% of float glass
demand stems from construction – should China’s economy slow sharply or if China launches more-than-expected property tightening measures, it could impact property construction and result in weaker-than-expected float glass demand and prices.
• More-than-expected capacity addition: If new float glass capacity addition is higher than our expectation, there could be an oversupply of products, thereby putting pressure on float glass prices.
• Delay in commencement of new projects overseas: XYG targets to establish new factories overseas in Canada and Malaysia where it has limited operational experience, therefore delays in project construction/ramp-up could negatively impact sales volume.
• Large hike in soda ash prices: Soda ash is a major cost component, accounting for about 25% of total COGS for float glass. If soda ash price rises abruptly, the company may not be able to fully pass on the higher costs, resulting in margin squeeze.
• Large hike in natural gas prices: Natural gas is another major cost component, accounting for about 35% of total COGS for float glass. If natural gas price rises abruptly due to unforeseen circumstances, the company may not be able to fully pass on the higher costs, resulting in margin squeeze.
• Large currency fluctuations: Given most of the sales are made in RMB and XYG reports in HK$, a large depreciation in RMB would result in a drop in revenue reported. As XYG is expanding to Malaysia and Canada – significant depreciation of the Malaysian ringgit and the Canadian dollar may also result in FX loss.
• Equity dilution from share placement/convertible bonds: XYG has issued convertible bonds but they were redeemed in full by Jun’17, thus precluding further share dilution ahead. XYG also went for several equity financing rounds during 2007-13, when it was expanding rapidly, to secure enough operating cash flow to support capex, especially in its solar glass/ solar farm business, which were spin-off to Xinyi Solar. However, with positive free cash flow of > RMB1.5-1.8bn in 2017/18E, we believe XYG will more than meet its capex demand with internal resources and borrowings, and thus see limited likelihood for it to seek share placement.
05,000
10,00015,00020,00025,00030,00035,00040,00045,00050,000
Feb-05
Feb-06
Feb-07
Feb-08
Feb-09
Feb-10
Feb-11
Feb-12
Feb-13
Feb-14
Feb-15
Feb-16
Feb-17
EV 1.0x 2.0x3.0x 4.0x 5.0x
HK$mn
8 Xinyi Glass | 03 November 2017
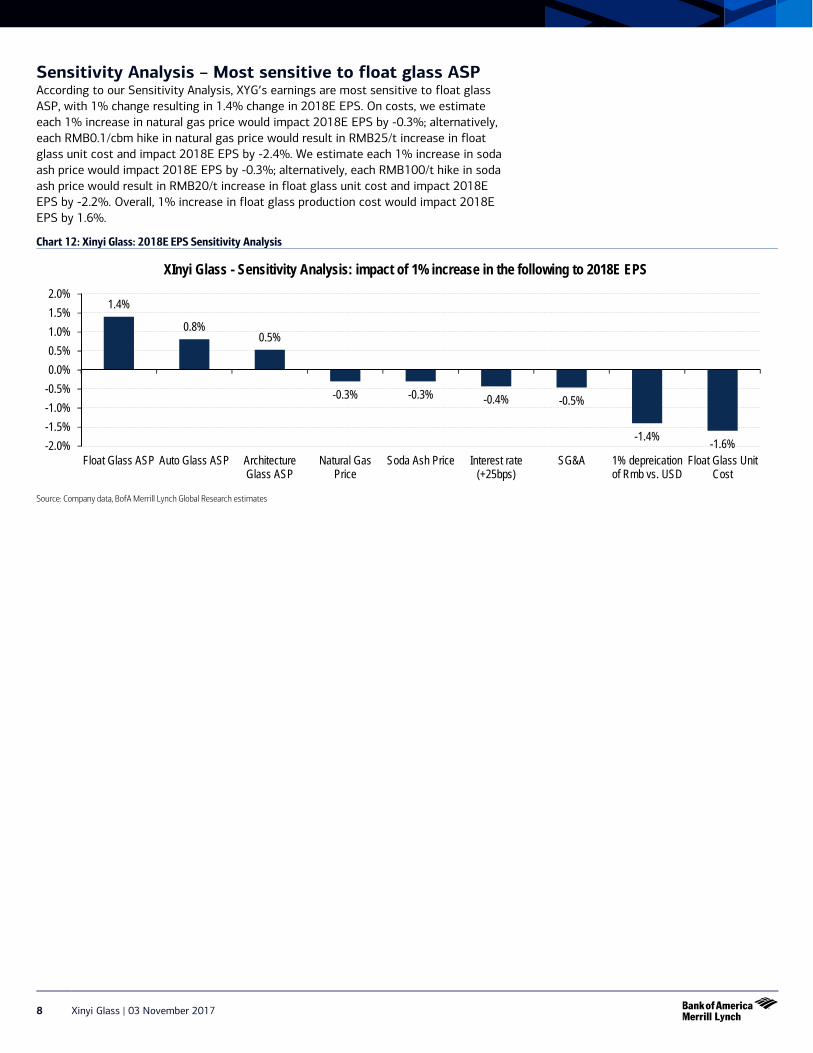
Sensitivity Analysis – Most sensitive to float glass ASP According to our Sensitivity Analysis, XYG’s earnings are most sensitive to float glass ASP, with 1% change resulting in 1.4% change in 2018E EPS. On costs, we estimate each 1% increase in natural gas price would impact 2018E EPS by -0.3%; alternatively, each RMB0.1/cbm hike in natural gas price would result in RMB25/t increase in float glass unit cost and impact 2018E EPS by -2.4%. We estimate each 1% increase in soda ash price would impact 2018E EPS by -0.3%; alternatively, each RMB100/t hike in soda ash price would result in RMB20/t increase in float glass unit cost and impact 2018E EPS by -2.2%. Overall, 1% increase in float glass production cost would impact 2018E EPS by 1.6%.
Chart 12: Xinyi Glass: 2018E EPS Sensitivity Analysis
Source: Company data, BofA Merrill Lynch Global Research estimates
1.4%
0.8% 0.5%
-0.3% -0.3% -0.4% -0.5%
-1.4% -1.6% -2.0%-1.5%-1.0%-0.5%0.0%0.5%1.0%1.5%2.0%
Float Glass ASP Auto Glass ASP ArchitectureGlass ASP
Natural GasPrice
Soda Ash Price Interest rate(+25bps)
SG&A 1% depreicationof Rmb vs. USD
Float Glass UnitCost
XInyi Glass - Sensitivity Analysis: impact of 1% increase in the following to 2018E EPS
Xinyi Glass | 03 November 2017 9
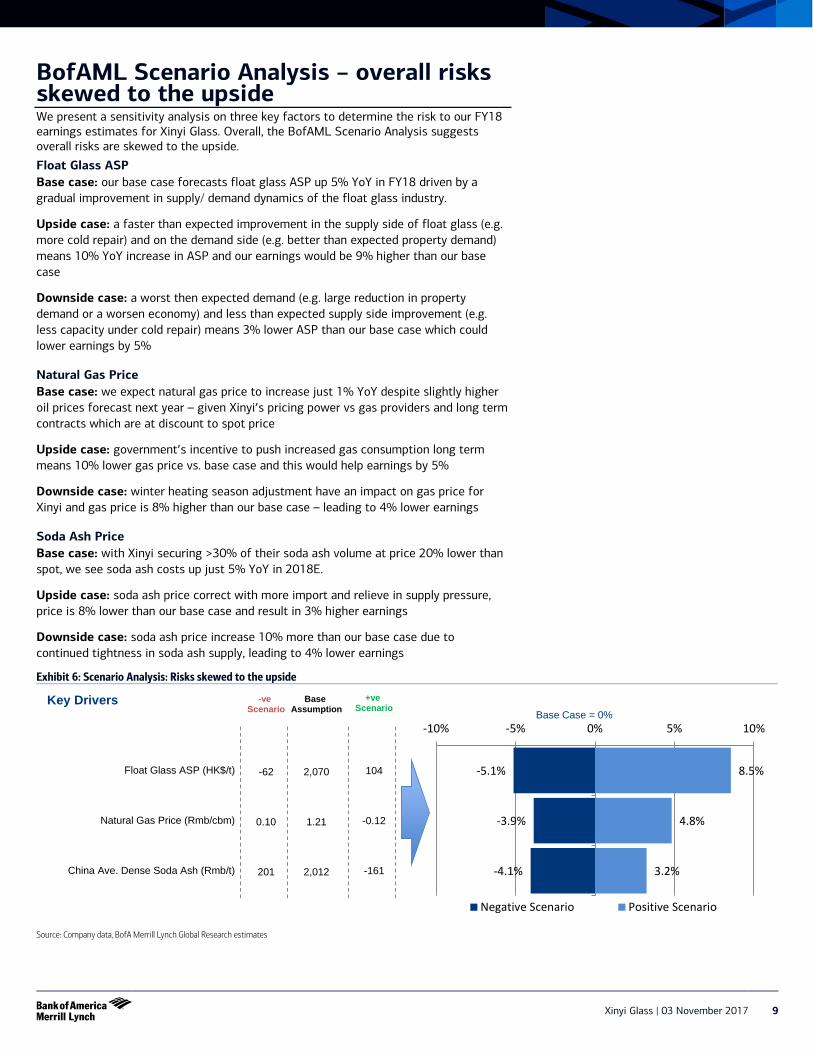
BofAML Scenario Analysis – overall risks skewed to the upside We present a sensitivity analysis on three key factors to determine the risk to our FY18 earnings estimates for Xinyi Glass. Overall, the BofAML Scenario Analysis suggests overall risks are skewed to the upside.
Float Glass ASP Base case: our base case forecasts float glass ASP up 5% YoY in FY18 driven by a gradual improvement in supply/ demand dynamics of the float glass industry.
Upside case: a faster than expected improvement in the supply side of float glass (e.g. more cold repair) and on the demand side (e.g. better than expected property demand) means 10% YoY increase in ASP and our earnings would be 9% higher than our base case
Downside case: a worst then expected demand (e.g. large reduction in property demand or a worsen economy) and less than expected supply side improvement (e.g. less capacity under cold repair) means 3% lower ASP than our base case which could lower earnings by 5%
Natural Gas Price Base case: we expect natural gas price to increase just 1% YoY despite slightly higher oil prices forecast next year – given Xinyi’s pricing power vs gas providers and long term contracts which are at discount to spot price
Upside case: government’s incentive to push increased gas consumption long term means 10% lower gas price vs. base case and this would help earnings by 5%
Downside case: winter heating season adjustment have an impact on gas price for Xinyi and gas price is 8% higher than our base case – leading to 4% lower earnings
Soda Ash Price Base case: with Xinyi securing >30% of their soda ash volume at price 20% lower than spot, we see soda ash costs up just 5% YoY in 2018E.
Upside case: soda ash price correct with more import and relieve in supply pressure, price is 8% lower than our base case and result in 3% higher earnings
Downside case: soda ash price increase 10% more than our base case due to continued tightness in soda ash supply, leading to 4% lower earnings
Exhibit 6: Scenario Analysis: Risks skewed to the upside
Source: Company data, BofA Merrill Lynch Global Research estimates
-5.1%
-3.9%
-4.1%
8.5%
4.8%
3.2%
-10% -5% 0% 5% 10%
Float Glass ASP (HK$/t)
Natural Gas Price (Rmb/cbm)
China Ave. Dense Soda Ash (Rmb/t)
Negative Scenario Positive Scenario
Base Case = 0%Key Drivers
2,070
1.21
2,012
Base Assumption
-62
0.10
201
-ve Scenario
+ve Scenario
104
-0.12
-161
10 Xinyi Glass | 03 November 2017
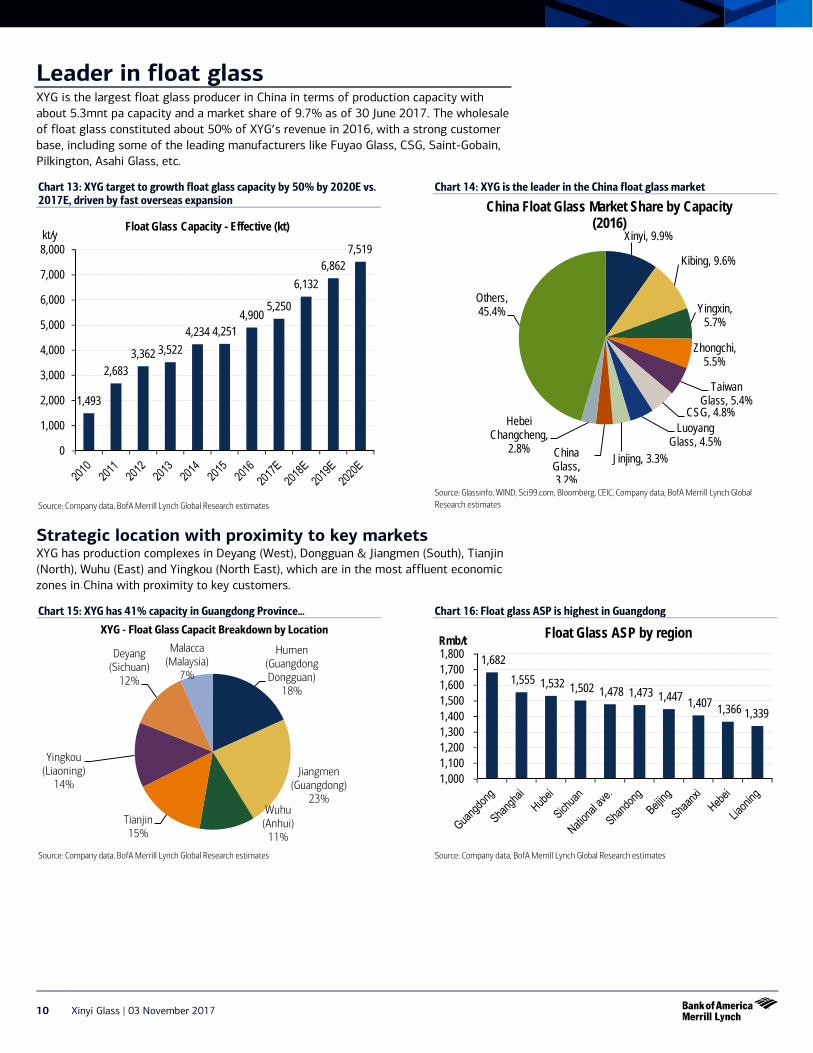
Leader in float glass XYG is the largest float glass producer in China in terms of production capacity with about 5.3mnt pa capacity and a market share of 9.7% as of 30 June 2017. The wholesale of float glass constituted about 50% of XYG’s revenue in 2016, with a strong customer base, including some of the leading manufacturers like Fuyao Glass, CSG, Saint-Gobain, Pilkington, Asahi Glass, etc.
Chart 13: XYG target to growth float glass capacity by 50% by 2020E vs. 2017E, driven by fast overseas expansion
Source: Company data, BofA Merrill Lynch Global Research estimates
Chart 14: XYG is the leader in the China float glass market
Source: Glassinfo, WIND, Sci99.com, Bloomberg, CEIC, Company data, BofA Merrill Lynch Global Research estimates
Strategic location with proximity to key markets XYG has production complexes in Deyang (West), Dongguan & Jiangmen (South), Tianjin (North), Wuhu (East) and Yingkou (North East), which are in the most affluent economic zones in China with proximity to key customers.
Chart 15: XYG has 41% capacity in Guangdong Province…
Source: Company data, BofA Merrill Lynch Global Research estimates
Chart 16: Float glass ASP is highest in Guangdong
Source: Company data, BofA Merrill Lynch Global Research estimates
1,493
2,683 3,362 3,522
4,234 4,251 4,900
5,250
6,132 6,862
7,519
0
1,000
2,000
3,000
4,000
5,000
6,000
7,000
8,000kt/y
Float Glass Capacity - Effective (kt) Xinyi, 9.9%
Kibing, 9.6%
Yingxin, 5.7%
Zhongchi, 5.5%
Taiwan Glass, 5.4%
CSG, 4.8% Luoyang
Glass, 4.5% Jinjing, 3.3% China
Glass, 3.2%
Hebei Changcheng,
2.8%
Others, 45.4%
China Float Glass Market Share by Capacity (2016)
Humen (Guangdong Dongguan)
18%
Jiangmen (Guangdong)
23% Wuhu
(Anhui) 11%
Tianjin 15%
Yingkou (Liaoning)
14%
Deyang (Sichuan)
12%
Malacca (Malaysia)
7%
XYG - Float Glass Capacit Breakdown by Location
1,682 1,555 1,532 1,502 1,478 1,473 1,447 1,407 1,366 1,339
1,000 1,100 1,200 1,300 1,400 1,500 1,600 1,700 1,800Rmb/t Float Glass ASP by region
Xinyi Glass | 03 November 2017 11
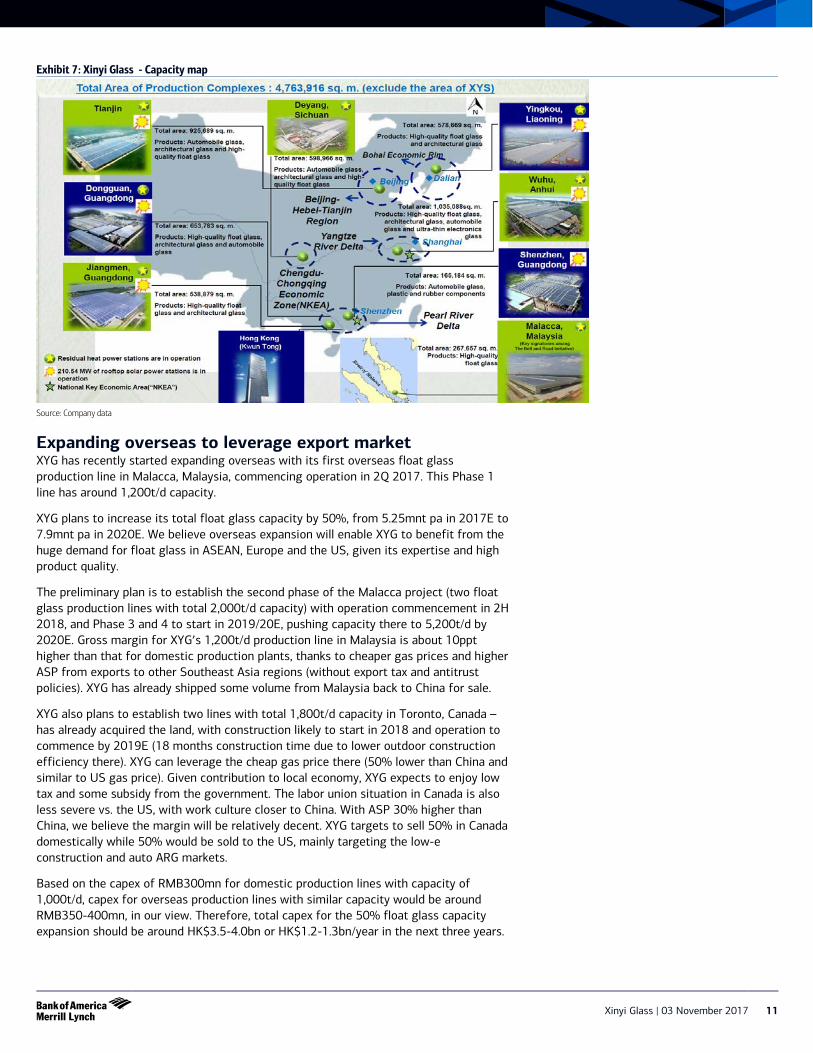
Exhibit 7: Xinyi Glass - Capacity map
Source: Company data
Expanding overseas to leverage export market XYG has recently started expanding overseas with its first overseas float glass production line in Malacca, Malaysia, commencing operation in 2Q 2017. This Phase 1 line has around 1,200t/d capacity.
XYG plans to increase its total float glass capacity by 50%, from 5.25mnt pa in 2017E to 7.9mnt pa in 2020E. We believe overseas expansion will enable XYG to benefit from the huge demand for float glass in ASEAN, Europe and the US, given its expertise and high product quality.
The preliminary plan is to establish the second phase of the Malacca project (two float glass production lines with total 2,000t/d capacity) with operation commencement in 2H 2018, and Phase 3 and 4 to start in 2019/20E, pushing capacity there to 5,200t/d by 2020E. Gross margin for XYG’s 1,200t/d production line in Malaysia is about 10ppt higher than that for domestic production plants, thanks to cheaper gas prices and higher ASP from exports to other Southeast Asia regions (without export tax and antitrust policies). XYG has already shipped some volume from Malaysia back to China for sale.
XYG also plans to establish two lines with total 1,800t/d capacity in Toronto, Canada –has already acquired the land, with construction likely to start in 2018 and operation to commence by 2019E (18 months construction time due to lower outdoor construction efficiency there). XYG can leverage the cheap gas price there (50% lower than China and similar to US gas price). Given contribution to local economy, XYG expects to enjoy low tax and some subsidy from the government. The labor union situation in Canada is also less severe vs. the US, with work culture closer to China. With ASP 30% higher than China, we believe the margin will be relatively decent. XYG targets to sell 50% in Canada domestically while 50% would be sold to the US, mainly targeting the low-e construction and auto ARG markets.
Based on the capex of RMB300mn for domestic production lines with capacity of 1,000t/d, capex for overseas production lines with similar capacity would be around RMB350-400mn, in our view. Therefore, total capex for the 50% float glass capacity expansion should be around HK$3.5-4.0bn or HK$1.2-1.3bn/year in the next three years.
12 Xinyi Glass | 03 November 2017
We expect XYG is to generate around HK$5-6bn operating cash flow in 2017-19, so it seems to be fully capable to finance the above-mentioned capacity additions in the coming few years with its internal resources and bank borrowings. Given healthy net debt to equity ratio at about 30-40%, equity financing is unlikely. XYG also has no intention to raise equity financing either in the near future either.
Increasing proportion of high-end float glass products XYG’s float glass is highly competitive not only due to its high yield at over 90% (vs. industry average of 80%) and high quality with superior-grade products accounting for 80% of output, but also its ability to manufacture high-end differentiated products such as ultra-thin, ultra-clear, and tinted glass is also key, which account for 30% of its total sales.
Given their scale, XYG has production lines dedicated for these special types of glass (unlike other smaller players that frequently shift production lines between products), which ensures stable quality and colors, and thus improves customer stickiness. As such, while XYG’s domestic float glass market share is c.10%, it has a far more dominant leadership positive in the high-end segment with up to 40-50% share, according to management.
XYG’s product quality and large volume endow it with strong pricing power to enjoy a 10-20% ASP premium over industry average for the same type of products. Its exposure to high-end products, which account for around 30% of volume, further lifts its blended ASP – which we estimate is around 50-80% over industry average ASP. Moreover, high-end products also have much better profit margin than regular float glass, where ASP can be more than doubled at less than 10% extra cost.

Xinyi Glass | 03 November 2017 13
Chart 17: China float glass capacity utilization rate at around 65-70%
Source: Glassinfo, WIND, SCI99.com, CEIC, NBS, BofA Merrill Lynch Global Research estimates
Chart 18: China float glass apparent demand remaining stop at +6.2% YTD YoY
Source: Glassinfo, WIND, SCI99.com, CEIC, NBS, BofA Merrill Lynch Global Research estimates
Chart 19: China float glass inventory remains healthy at 32.1mn weight case of 12.5 inventory days, below historical average of 13.2 days
Source: Glassinfo, WIND, SCI99.com, CEIC, NBS, BofA Merrill Lynch Global Research estimates
Chart 20: China national average float glass prices up 9% YTD to around RMB1,570/t yet still 78% below 2011 peak at almost RMB2,000/t
Source: Glassinfo, WIND, SCI99.com, CEIC, NBS, BofA Merrill Lynch Global Research estimates
Chart 21: Float glass prices and inventory have an inverse relationship
Source: Glassinfo, WIND, SCI99.com, CEIC, NBS, BofA Merrill Lynch Global Research estimates
Chart 22: Industry utilization is a good leading indicator of float glass prices
Source: Glassinfo, WIND, SCI99.com, CEIC, NBS, BofA Merrill Lynch Global Research estimates
020406080100120140160180
60.0
70.0
80.0
90.0
100.0kt/d % Effective Capacity Utilization Rate
-20%
-10%
0%
10%
20%
30%
40%
0
20
40
60
80
% mn weight case
Monthly Output YoY
10.0
12.0
14.0
16.0
26
30
34
Mar-1
3Ju
n-13
Sep-
13De
c-13
Mar-1
4Ju
n-14
Sep-
14De
c-14
Mar-1
5Ju
n-15
Sep-
15De
c-15
Mar-1
6Ju
n-16
Sep-
16De
c-16
Mar-1
7Ju
n-17
Sep-
17
days mn weight case
Inventory Inventory Days
1,0001,1001,2001,3001,4001,5001,6001,7001,8001,9002,000
Jan-
10Ju
l-10
Jan-
11Ju
l-11
Jan-
12Ju
l-12
Jan-
13Ju
l-13
Jan-
14Ju
l-14
Jan-
15Ju
l-15
Jan-
16Ju
l-16
Jan-
17Ju
l-17
Rmb/t National Ave. Float Glass Price
26.0
28.0
30.0
32.0
34.0
36.0
1000
1100
1200
1300
1400
1500
1600
Jan-13 Jan-14 Jan-15 Jan-16 Jan-17
mn wt. case Rmb/t
China Float Glass Inventory vs. Float Glass Price
Float Glass Price (LHS) Inventory (RHS)
65%
70%
75%
80%
85%
1000
1100
1200
1300
1400
1500
1600
Jan-13 Jan-14 Jan-15 Jan-16 Jan-17
% Rmb/t Float Glass Industry Capacity Utilization vs.
Float Glass Price
Float Glass Price (LHS) Industry Utilization rate (RHS)
14 Xinyi Glass | 03 November 2017
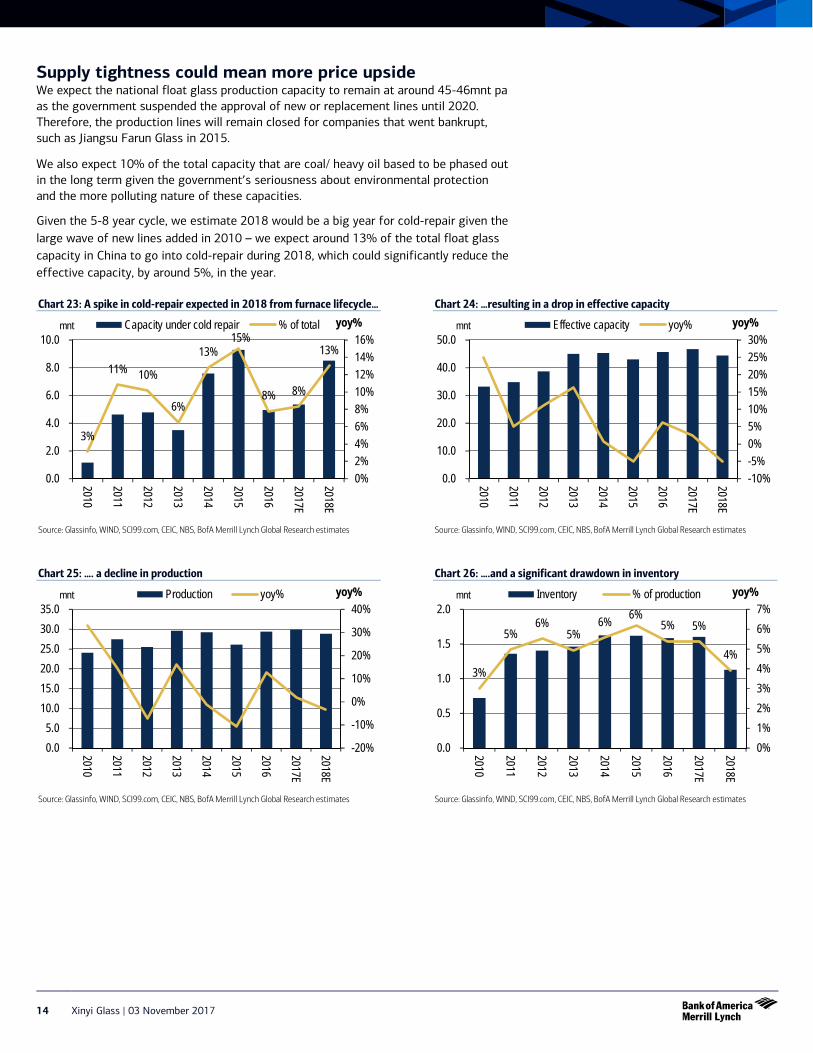
Supply tightness could mean more price upside We expect the national float glass production capacity to remain at around 45-46mnt pa as the government suspended the approval of new or replacement lines until 2020. Therefore, the production lines will remain closed for companies that went bankrupt, such as Jiangsu Farun Glass in 2015.
We also expect 10% of the total capacity that are coal/ heavy oil based to be phased out in the long term given the government’s seriousness about environmental protection and the more polluting nature of these capacities.
Given the 5-8 year cycle, we estimate 2018 would be a big year for cold-repair given the large wave of new lines added in 2010 – we expect around 13% of the total float glass capacity in China to go into cold-repair during 2018, which could significantly reduce the effective capacity, by around 5%, in the year.
Chart 23: A spike in cold-repair expected in 2018 from furnace lifecycle…
Source: Glassinfo, WIND, SCI99.com, CEIC, NBS, BofA Merrill Lynch Global Research estimates
Chart 24: …resulting in a drop in effective capacity
Source: Glassinfo, WIND, SCI99.com, CEIC, NBS, BofA Merrill Lynch Global Research estimates
Chart 25: …. a decline in production
Source: Glassinfo, WIND, SCI99.com, CEIC, NBS, BofA Merrill Lynch Global Research estimates
Chart 26: ….and a significant drawdown in inventory
Source: Glassinfo, WIND, SCI99.com, CEIC, NBS, BofA Merrill Lynch Global Research estimates
3%
11% 10%
6%
13% 15%
8% 8%
13%
0%2%4%6%8%10%12%14%16%
0.0
2.0
4.0
6.0
8.0
10.0
2010
2011
2012
2013
2014
2015
2016
2017E
2018E
yoy% Capacity under cold repair % of totalmnt
-10%-5%0%5%10%15%20%25%30%
0.0
10.0
20.0
30.0
40.0
50.02010
2011
2012
2013
2014
2015
2016
2017E
2018E
yoy% Effective capacity yoy%mnt
-20%
-10%
0%
10%
20%
30%
40%
0.05.0
10.015.020.025.030.035.0
2010
2011
2012
2013
2014
2015
2016
2017E
2018E
yoy% Production yoy%mnt
3%
5% 6%
5% 6% 6%
5% 5%
4%
0%1%2%3%4%5%6%7%
0.0
0.5
1.0
1.5
2.0
2010
2011
2012
2013
2014
2015
2016
2017E
2018E
yoy% Inventory % of productionmnt
Xinyi Glass | 03 November 2017 15
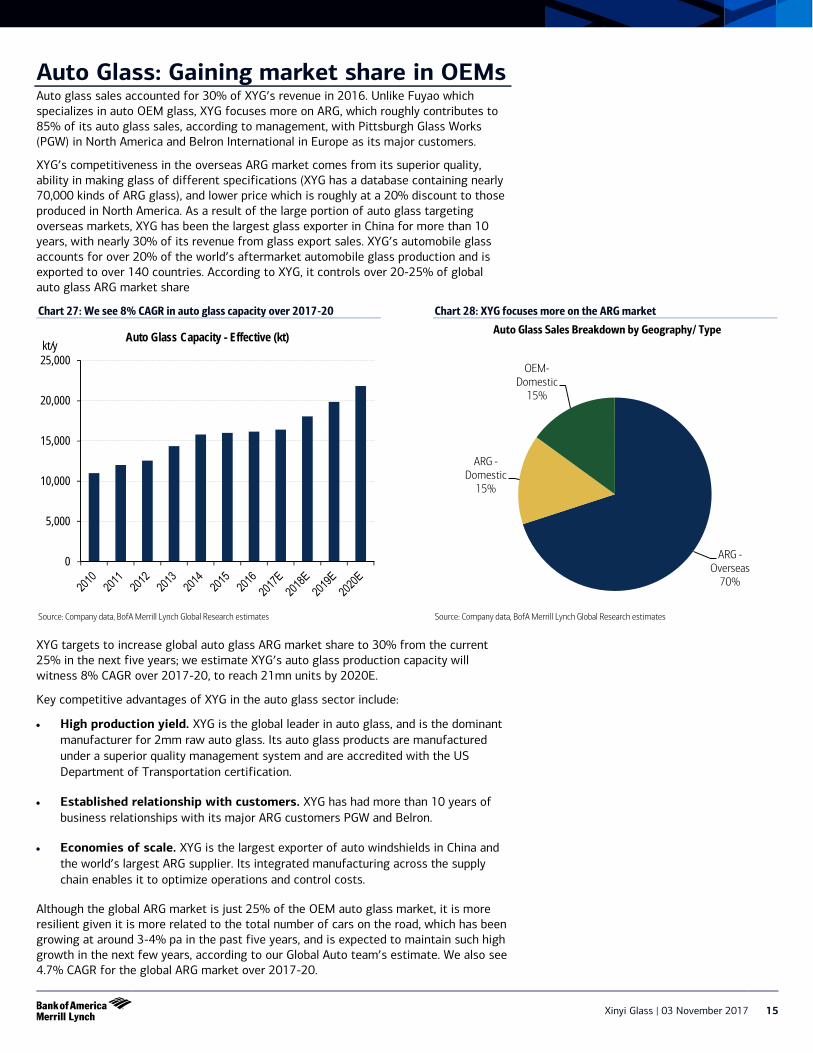
Auto Glass: Gaining market share in OEMs Auto glass sales accounted for 30% of XYG’s revenue in 2016. Unlike Fuyao which specializes in auto OEM glass, XYG focuses more on ARG, which roughly contributes to 85% of its auto glass sales, according to management, with Pittsburgh Glass Works (PGW) in North America and Belron International in Europe as its major customers.
XYG’s competitiveness in the overseas ARG market comes from its superior quality, ability in making glass of different specifications (XYG has a database containing nearly 70,000 kinds of ARG glass), and lower price which is roughly at a 20% discount to those produced in North America. As a result of the large portion of auto glass targeting overseas markets, XYG has been the largest glass exporter in China for more than 10 years, with nearly 30% of its revenue from glass export sales. XYG’s automobile glass accounts for over 20% of the world’s aftermarket automobile glass production and is exported to over 140 countries. According to XYG, it controls over 20-25% of global auto glass ARG market share
Chart 27: We see 8% CAGR in auto glass capacity over 2017-20
Source: Company data, BofA Merrill Lynch Global Research estimates
Chart 28: XYG focuses more on the ARG market
Source: Company data, BofA Merrill Lynch Global Research estimates
XYG targets to increase global auto glass ARG market share to 30% from the current 25% in the next five years; we estimate XYG’s auto glass production capacity will witness 8% CAGR over 2017-20, to reach 21mn units by 2020E.
Key competitive advantages of XYG in the auto glass sector include:
• High production yield. XYG is the global leader in auto glass, and is the dominant manufacturer for 2mm raw auto glass. Its auto glass products are manufactured under a superior quality management system and are accredited with the US Department of Transportation certification.
• Established relationship with customers. XYG has had more than 10 years of business relationships with its major ARG customers PGW and Belron.
• Economies of scale. XYG is the largest exporter of auto windshields in China and the world’s largest ARG supplier. Its integrated manufacturing across the supply chain enables it to optimize operations and control costs.
Although the global ARG market is just 25% of the OEM auto glass market, it is more resilient given it is more related to the total number of cars on the road, which has been growing at around 3-4% pa in the past five years, and is expected to maintain such high growth in the next few years, according to our Global Auto team’s estimate. We also see 4.7% CAGR for the global ARG market over 2017-20.
0
5,000
10,000
15,000
20,000
25,000kt/y
Auto Glass Capacity - Effective (kt)
ARG - Overseas
70%
ARG - Domestic
15%
OEM- Domestic
15%
Auto Glass Sales Breakdown by Geography/ Type
16 Xinyi Glass | 03 November 2017
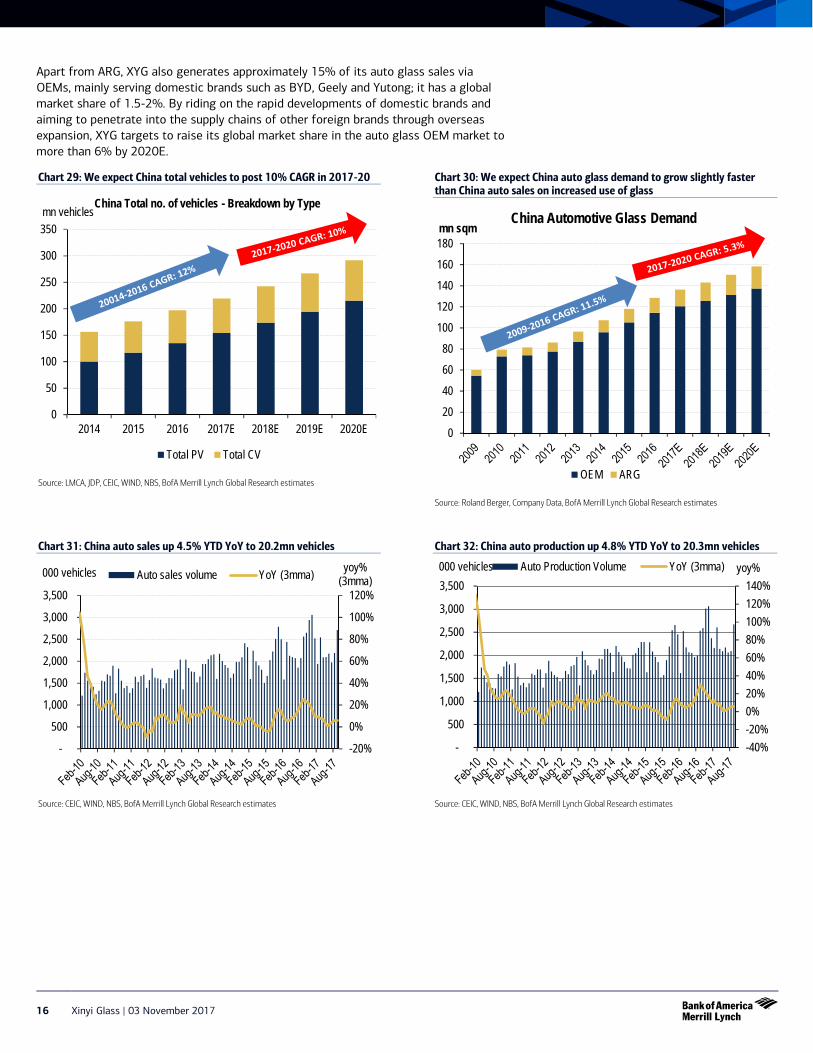
Apart from ARG, XYG also generates approximately 15% of its auto glass sales via OEMs, mainly serving domestic brands such as BYD, Geely and Yutong; it has a global market share of 1.5-2%. By riding on the rapid developments of domestic brands and aiming to penetrate into the supply chains of other foreign brands through overseas expansion, XYG targets to raise its global market share in the auto glass OEM market to more than 6% by 2020E.
Chart 29: We expect China total vehicles to post 10% CAGR in 2017-20
Source: LMCA, JDP, CEIC, WIND, NBS, BofA Merrill Lynch Global Research estimates
Chart 30: We expect China auto glass demand to grow slightly faster than China auto sales on increased use of glass
Source: Roland Berger, Company Data, BofA Merrill Lynch Global Research estimates
Chart 31: China auto sales up 4.5% YTD YoY to 20.2mn vehicles
Source: CEIC, WIND, NBS, BofA Merrill Lynch Global Research estimates
Chart 32: China auto production up 4.8% YTD YoY to 20.3mn vehicles
Source: CEIC, WIND, NBS, BofA Merrill Lynch Global Research estimates
0
50
100
150
200
250
300
350
2014 2015 2016 2017E 2018E 2019E 2020E
mn vehicles China Total no. of vehicles - Breakdown by Type
Total PV Total CV
0
20
40
60
80
100
120
140
160
180mn sqm
China Automotive Glass Demand
OEM ARG
-20%
0%
20%
40%
60%
80%
100%
120%
-
500
1,000
1,500
2,000
2,500
3,000
3,500
yoy% (3mma)
000 vehicles Auto sales volume YoY (3mma)
-40%-20%0%20%40%60%80%100%120%140%
-
500
1,000
1,500
2,000
2,500
3,000
3,500yoy% 000 vehicles Auto Production Volume YoY (3mma)
Xinyi Glass | 03 November 2017 17
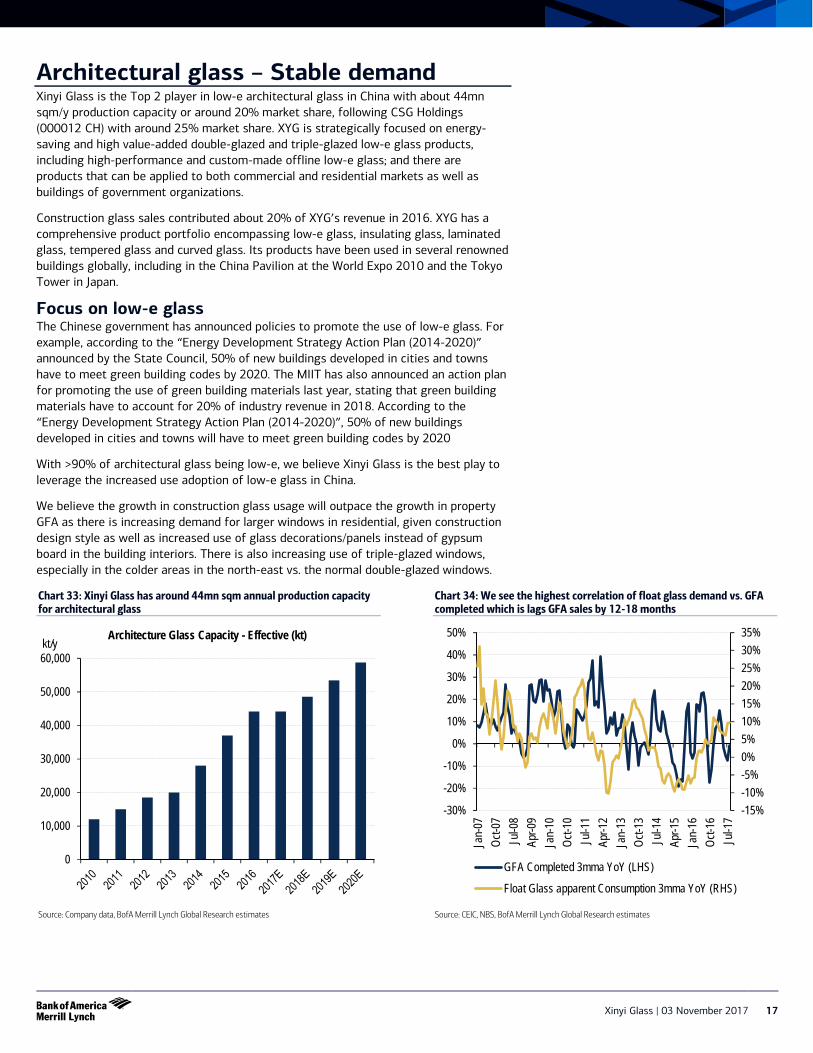
Architectural glass – Stable demand Xinyi Glass is the Top 2 player in low-e architectural glass in China with about 44mn sqm/y production capacity or around 20% market share, following CSG Holdings (000012 CH) with around 25% market share. XYG is strategically focused on energy-saving and high value-added double-glazed and triple-glazed low-e glass products, including high-performance and custom-made offline low-e glass; and there are products that can be applied to both commercial and residential markets as well as buildings of government organizations.
Construction glass sales contributed about 20% of XYG’s revenue in 2016. XYG has a comprehensive product portfolio encompassing low-e glass, insulating glass, laminated glass, tempered glass and curved glass. Its products have been used in several renowned buildings globally, including in the China Pavilion at the World Expo 2010 and the Tokyo Tower in Japan.
Focus on low-e glass The Chinese government has announced policies to promote the use of low-e glass. For example, according to the “Energy Development Strategy Action Plan (2014-2020)” announced by the State Council, 50% of new buildings developed in cities and towns have to meet green building codes by 2020. The MIIT has also announced an action plan for promoting the use of green building materials last year, stating that green building materials have to account for 20% of industry revenue in 2018. According to the “Energy Development Strategy Action Plan (2014-2020)”, 50% of new buildings developed in cities and towns will have to meet green building codes by 2020
With >90% of architectural glass being low-e, we believe Xinyi Glass is the best play to leverage the increased use adoption of low-e glass in China.
We believe the growth in construction glass usage will outpace the growth in property GFA as there is increasing demand for larger windows in residential, given construction design style as well as increased use of glass decorations/panels instead of gypsum board in the building interiors. There is also increasing use of triple-glazed windows, especially in the colder areas in the north-east vs. the normal double-glazed windows.
Chart 33: Xinyi Glass has around 44mn sqm annual production capacity for architectural glass
Source: Company data, BofA Merrill Lynch Global Research estimates
Chart 34: We see the highest correlation of float glass demand vs. GFA completed which is lags GFA sales by 12-18 months
Source: CEIC, NBS, BofA Merrill Lynch Global Research estimates
0
10,000
20,000
30,000
40,000
50,000
60,000kt/y
Architecture Glass Capacity - Effective (kt)
-15%-10%-5%0%5%10%15%20%25%30%35%
-30%
-20%
-10%
0%
10%
20%
30%
40%
50%
Jan-
07Oc
t-07
Jul-0
8Ap
r-09
Jan-
10Oc
t-10
Jul-1
1Ap
r-12
Jan-
13Oc
t-13
Jul-1
4Ap
r-15
Jan-
16Oc
t-16
Jul-1
7
GFA Completed 3mma YoY (LHS)
Float Glass apparent Consumption 3mma YoY (RHS)
18 Xinyi Glass | 03 November 2017
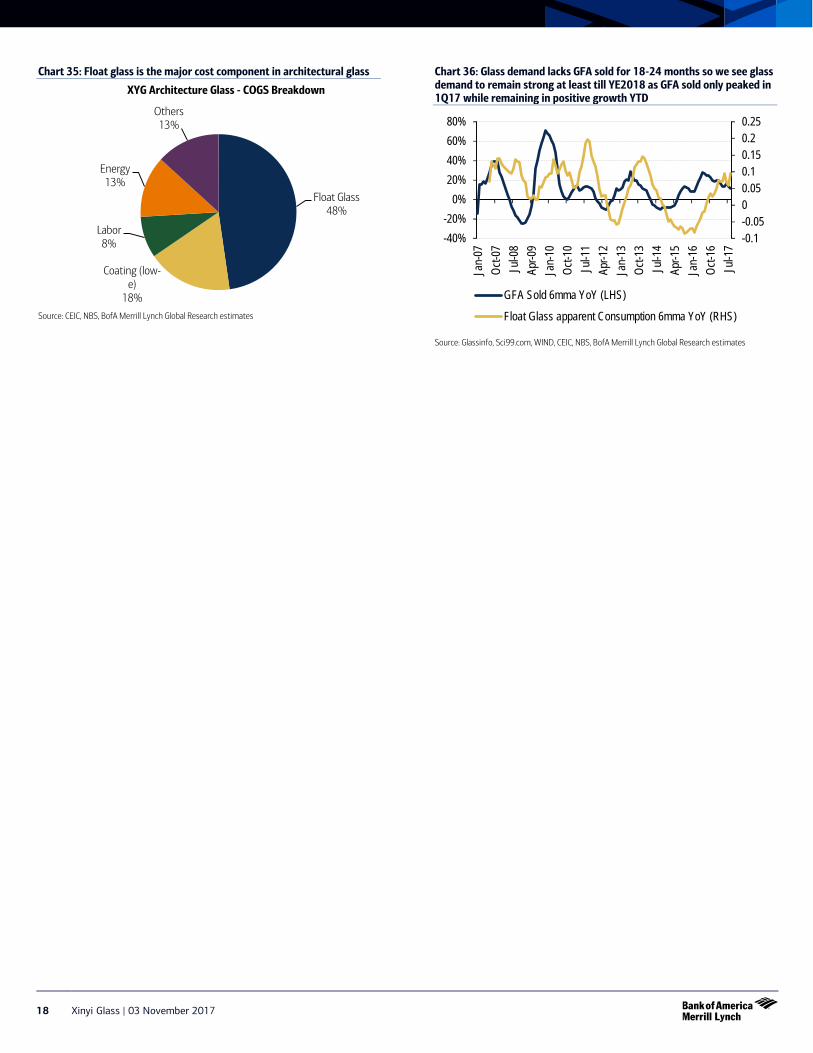
Chart 35: Float glass is the major cost component in architectural glass
Source: CEIC, NBS, BofA Merrill Lynch Global Research estimates
Chart 36: Glass demand lacks GFA sold for 18-24 months so we see glass demand to remain strong at least till YE2018 as GFA sold only peaked in 1Q17 while remaining in positive growth YTD
Source: Glassinfo, Sci99.com, WIND, CEIC, NBS, BofA Merrill Lynch Global Research estimates
Float Glass 48%
Coating (low-e)
18%
Labor 8%
Energy 13%
Others 13%
XYG Architecture Glass - COGS Breakdown
-0.1-0.0500.050.10.150.20.25
-40%-20%
0%20%40%60%80%
Jan-
07Oc
t-07
Jul-0
8Ap
r-09
Jan-
10Oc
t-10
Jul-1
1Ap
r-12
Jan-
13Oc
t-13
Jul-1
4Ap
r-15
Jan-
16Oc
t-16
Jul-1
7
GFA Sold 6mma YoY (LHS)
Float Glass apparent Consumption 6mma YoY (RHS)
Xinyi Glass | 03 November 2017 19
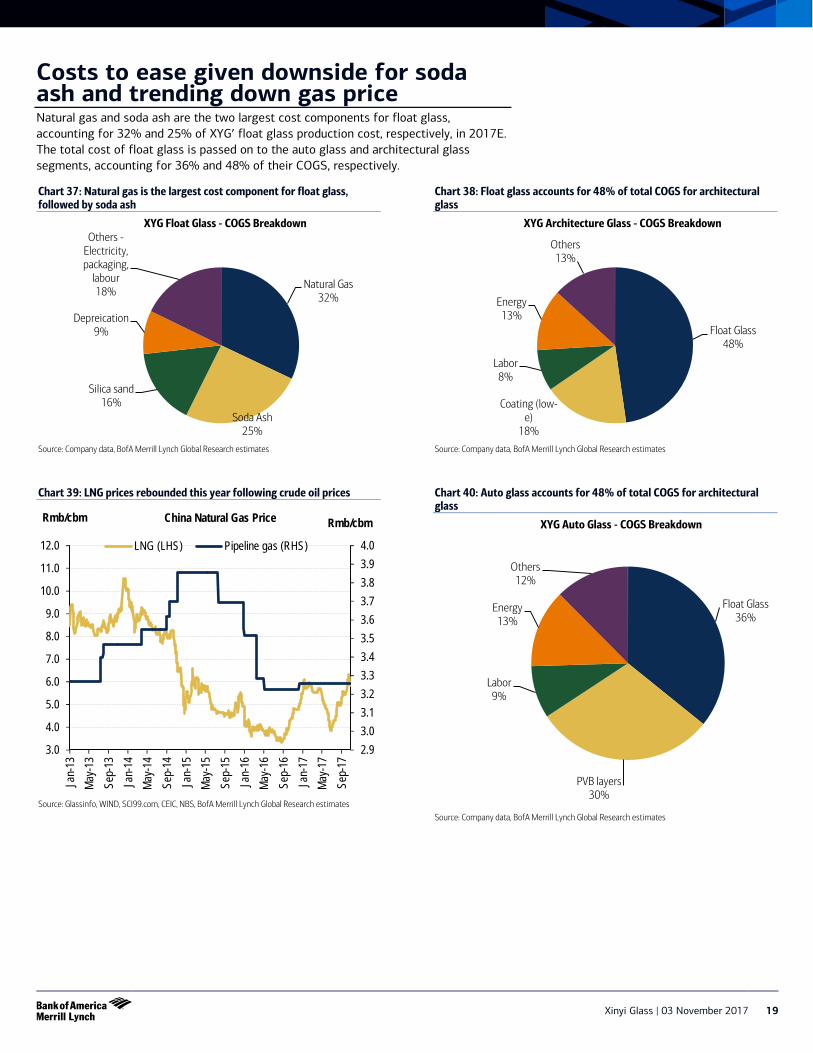
Costs to ease given downside for soda ash and trending down gas price Natural gas and soda ash are the two largest cost components for float glass, accounting for 32% and 25% of XYG’ float glass production cost, respectively, in 2017E. The total cost of float glass is passed on to the auto glass and architectural glass segments, accounting for 36% and 48% of their COGS, respectively.
Chart 37: Natural gas is the largest cost component for float glass, followed by soda ash
Source: Company data, BofA Merrill Lynch Global Research estimates
Chart 38: Float glass accounts for 48% of total COGS for architectural glass
Source: Company data, BofA Merrill Lynch Global Research estimates
Chart 39: LNG prices rebounded this year following crude oil prices
Source: Glassinfo, WIND, SCI99.com, CEIC, NBS, BofA Merrill Lynch Global Research estimates
Chart 40: Auto glass accounts for 48% of total COGS for architectural glass
Source: Company data, BofA Merrill Lynch Global Research estimates
Natural Gas 32%
Soda Ash 25%
Silica sand 16%
Depreication 9%
Others - Electricity, packaging,
labour 18%
XYG Float Glass - COGS Breakdown
Float Glass 48%
Coating (low-e)
18%
Labor 8%
Energy 13%
Others 13%
XYG Architecture Glass - COGS Breakdown
2.93.03.13.23.33.43.53.63.73.83.94.0
3.0
4.0
5.0
6.0
7.0
8.0
9.0
10.0
11.0
12.0
Jan-
13Ma
y-13
Sep-
13Ja
n-14
May-1
4Se
p-14
Jan-
15Ma
y-15
Sep-
15Ja
n-16
May-1
6Se
p-16
Jan-
17Ma
y-17
Sep-
17
Rmb/cbm Rmb/cbm China Natural Gas Price
LNG (LHS) Pipeline gas (RHS)
Float Glass 36%
PVB layers 30%
Labor 9%
Energy 13%
Others 12%
XYG Auto Glass - COGS Breakdown
20 Xinyi Glass | 03 November 2017
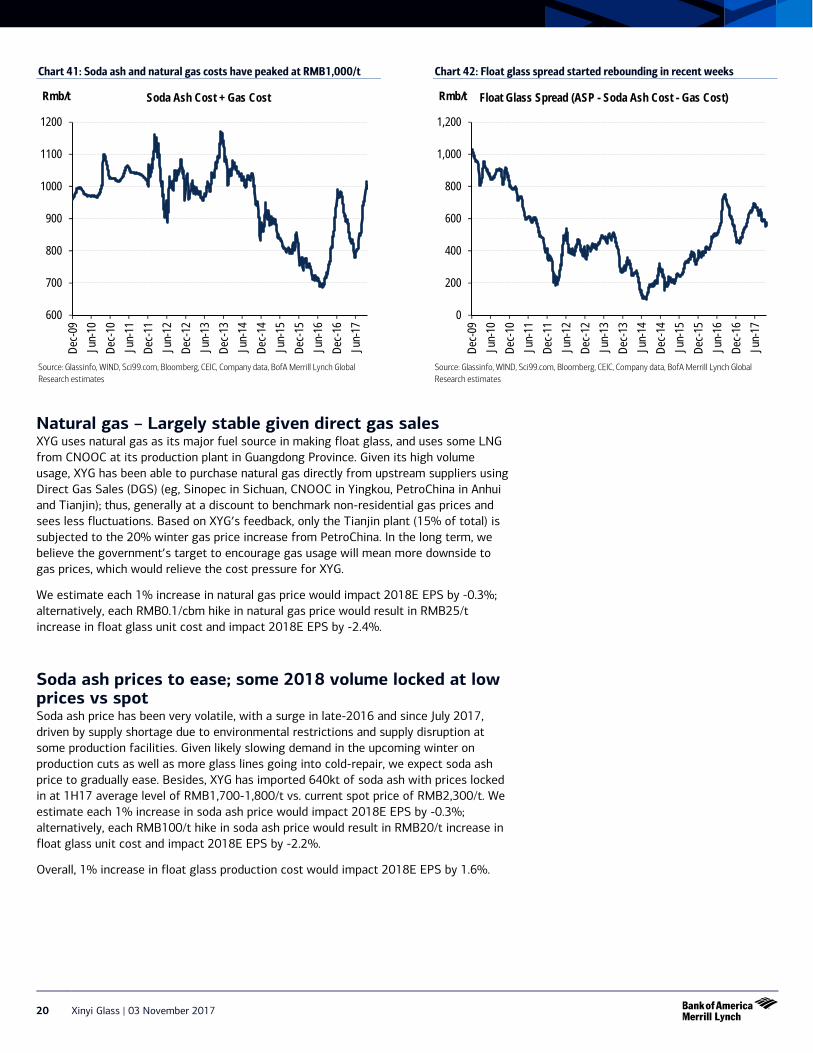
Chart 41: Soda ash and natural gas costs have peaked at RMB1,000/t
Source: Glassinfo, WIND, Sci99.com, Bloomberg, CEIC, Company data, BofA Merrill Lynch Global Research estimates
Chart 42: Float glass spread started rebounding in recent weeks
Source: Glassinfo, WIND, Sci99.com, Bloomberg, CEIC, Company data, BofA Merrill Lynch Global Research estimates
Natural gas – Largely stable given direct gas sales XYG uses natural gas as its major fuel source in making float glass, and uses some LNG from CNOOC at its production plant in Guangdong Province. Given its high volume usage, XYG has been able to purchase natural gas directly from upstream suppliers using Direct Gas Sales (DGS) (eg, Sinopec in Sichuan, CNOOC in Yingkou, PetroChina in Anhui and Tianjin); thus, generally at a discount to benchmark non-residential gas prices and sees less fluctuations. Based on XYG’s feedback, only the Tianjin plant (15% of total) is subjected to the 20% winter gas price increase from PetroChina. In the long term, we believe the government’s target to encourage gas usage will mean more downside to gas prices, which would relieve the cost pressure for XYG.
We estimate each 1% increase in natural gas price would impact 2018E EPS by -0.3%; alternatively, each RMB0.1/cbm hike in natural gas price would result in RMB25/t increase in float glass unit cost and impact 2018E EPS by -2.4%.
Soda ash prices to ease; some 2018 volume locked at low prices vs spot Soda ash price has been very volatile, with a surge in late-2016 and since July 2017, driven by supply shortage due to environmental restrictions and supply disruption at some production facilities. Given likely slowing demand in the upcoming winter on production cuts as well as more glass lines going into cold-repair, we expect soda ash price to gradually ease. Besides, XYG has imported 640kt of soda ash with prices locked in at 1H17 average level of RMB1,700-1,800/t vs. current spot price of RMB2,300/t. We estimate each 1% increase in soda ash price would impact 2018E EPS by -0.3%; alternatively, each RMB100/t hike in soda ash price would result in RMB20/t increase in float glass unit cost and impact 2018E EPS by -2.2%.
Overall, 1% increase in float glass production cost would impact 2018E EPS by 1.6%.
600
700
800
900
1000
1100
1200
Dec-0
9Ju
n-10
Dec-1
0Ju
n-11
Dec-1
1Ju
n-12
Dec-1
2Ju
n-13
Dec-1
3Ju
n-14
Dec-1
4Ju
n-15
Dec-1
5Ju
n-16
Dec-1
6Ju
n-17
Rmb/t Soda Ash Cost + Gas Cost
0
200
400
600
800
1,000
1,200
Dec-0
9Ju
n-10
Dec-1
0Ju
n-11
Dec-1
1Ju
n-12
Dec-1
2Ju
n-13
Dec-1
3Ju
n-14
Dec-1
4Ju
n-15
Dec-1
5Ju
n-16
Dec-1
6Ju
n-17
Rmb/t Float Glass Spread (ASP - Soda Ash Cost - Gas Cost)
Xinyi Glass | 03 November 2017 21
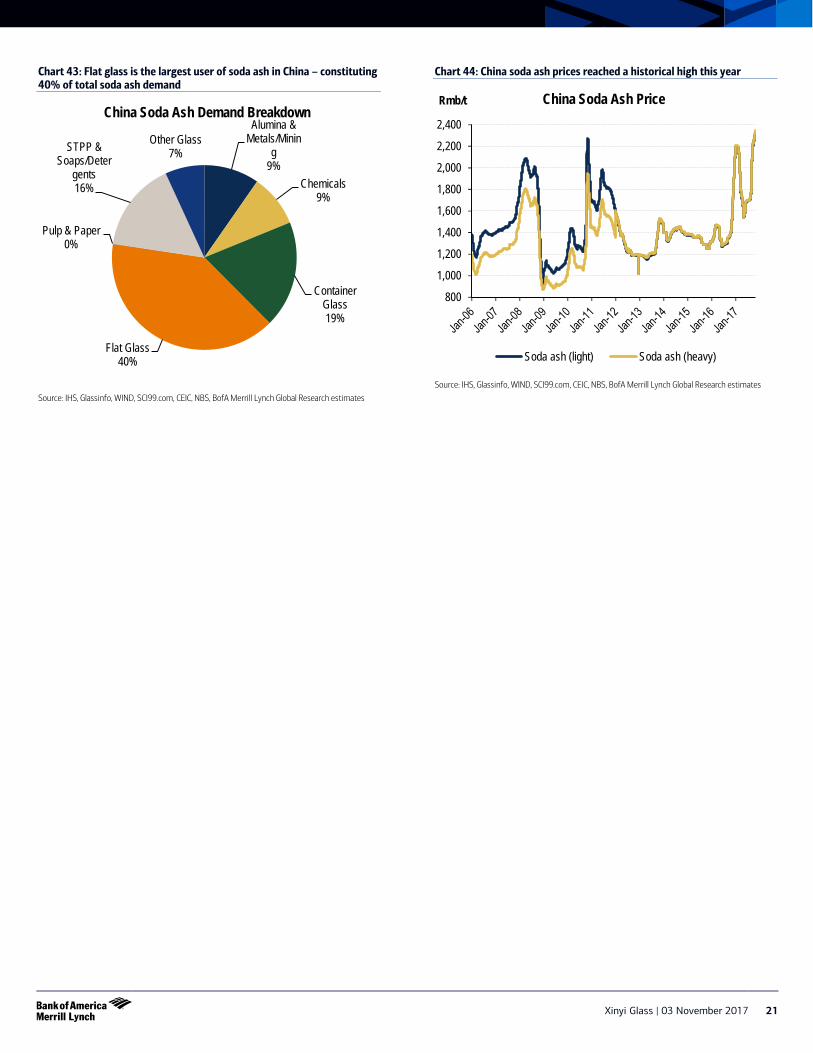
Chart 43: Flat glass is the largest user of soda ash in China – constituting 40% of total soda ash demand
Source: IHS, Glassinfo, WIND, SCI99.com, CEIC, NBS, BofA Merrill Lynch Global Research estimates
Chart 44: China soda ash prices reached a historical high this year
Source: IHS, Glassinfo, WIND, SCI99.com, CEIC, NBS, BofA Merrill Lynch Global Research estimates
Alumina & Metals/Minin
g 9%
Chemicals 9%
Container Glass 19%
Flat Glass 40%
Pulp & Paper 0%
STPP & Soaps/Deter
gents 16%
Other Glass 7%
China Soda Ash Demand Breakdown
800
1,000
1,200
1,400
1,600
1,800
2,000
2,200
2,400
Rmb/t China Soda Ash Price
Soda ash (light) Soda ash (heavy)
22 Xinyi Glass | 03 November 2017
Xinyi Solar spin-off as associate XYG first started the solar glass business in 2006 and spun off the solar glass division Xinyi Solar Holdings Limited (968-HK, XYS) for separate listing on the main board of the Hong Kong Stock Exchange (HKEx) on 12 December 2013. XYG is still the single-largest shareholder of Xinyi Solar with 29.53% stake as of June’17, and profit from XYS is consolidated as income from associate in XYG’s statements.
XYS is the largest solar glass manufacturer in China and the world. It is expanding into the solar farm segment rapidly in China. As of June 2017, it had installed capacity of 6,300t/d ultra-clear PV Raw Glass. The company has 26% share of the solar glass market in China, which accounts for about 90% of the global capacity. It has also started its solar farm business in 2014 – XYS has installed total capacity of 1,584MW, mainly in the Anhui, Fujian, Tianjin, Henan and Hubei provinces.
Our Utilities Analyst Angello Chan covers XYS with a Buy rating, mainly on its rapid expansion in solar farm development. The current feed-in tariff (FiT) and subsidy regime in China are in favor of strong returns for solar farms, an area where XYS can earn fixed tariff for 20 years. Moreover, XYS can leverage its expertise in solar glass for expansion into solar farm to ensure better system quality and lower degradation risk. For details, see Chan’s report: Xinyi Solar: 17% RoIC, 6-7x EV/EBITDA, 10% EPS CAGR; Gas sector reform beneficiary; Buy.
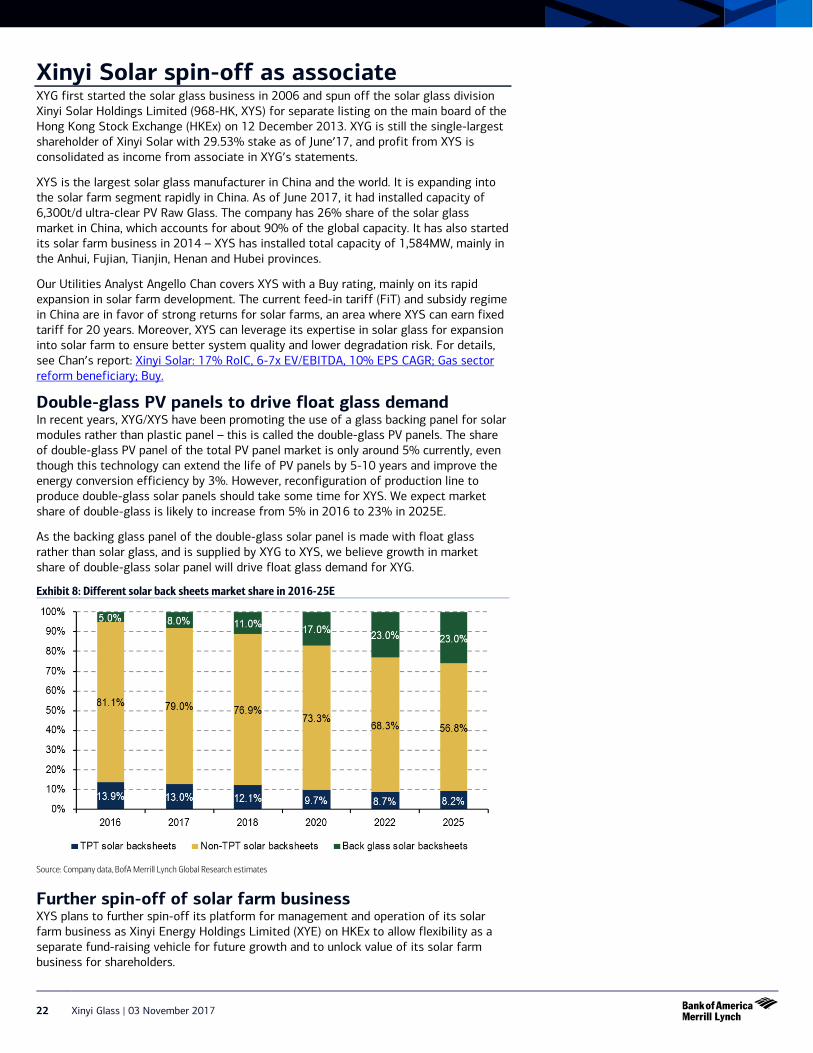
Double-glass PV panels to drive float glass demand In recent years, XYG/XYS have been promoting the use of a glass backing panel for solar modules rather than plastic panel – this is called the double-glass PV panels. The share of double-glass PV panel of the total PV panel market is only around 5% currently, even though this technology can extend the life of PV panels by 5-10 years and improve the energy conversion efficiency by 3%. However, reconfiguration of production line to produce double-glass solar panels should take some time for XYS. We expect market share of double-glass is likely to increase from 5% in 2016 to 23% in 2025E.
As the backing glass panel of the double-glass solar panel is made with float glass rather than solar glass, and is supplied by XYG to XYS, we believe growth in market share of double-glass solar panel will drive float glass demand for XYG.
Exhibit 8: Different solar back sheets market share in 2016-25E
Source: Company data, BofA Merrill Lynch Global Research estimates
Further spin-off of solar farm business XYS plans to further spin-off its platform for management and operation of its solar farm business as Xinyi Energy Holdings Limited (XYE) on HKEx to allow flexibility as a separate fund-raising vehicle for future growth and to unlock value of its solar farm business for shareholders.
Xinyi Glass | 03 November 2017 23
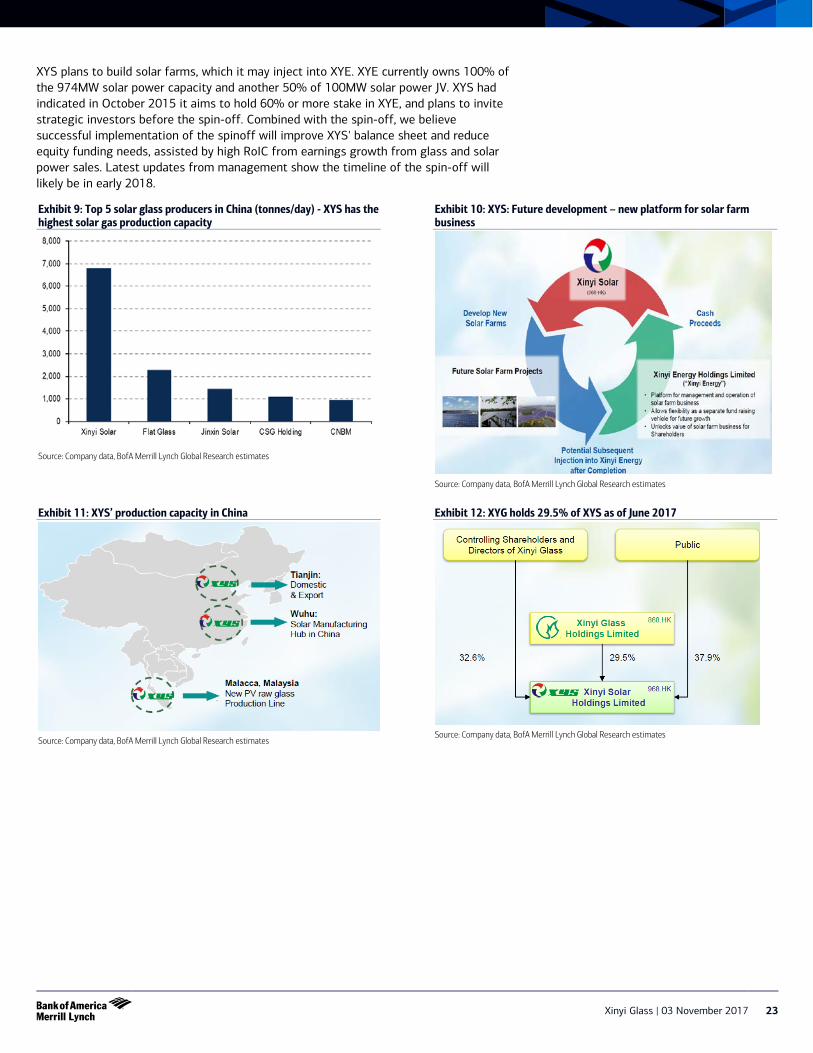
XYS plans to build solar farms, which it may inject into XYE. XYE currently owns 100% of the 974MW solar power capacity and another 50% of 100MW solar power JV. XYS had indicated in October 2015 it aims to hold 60% or more stake in XYE, and plans to invite strategic investors before the spin-off. Combined with the spin-off, we believe successful implementation of the spinoff will improve XYS' balance sheet and reduce equity funding needs, assisted by high RoIC from earnings growth from glass and solar power sales. Latest updates from management show the timeline of the spin-off will likely be in early 2018.
Exhibit 9: Top 5 solar glass producers in China (tonnes/day) - XYS has the highest solar gas production capacity
Source: Company data, BofA Merrill Lynch Global Research estimates
Exhibit 10: XYS: Future development – new platform for solar farm business
Source: Company data, BofA Merrill Lynch Global Research estimates
Exhibit 11: XYS’ production capacity in China
Source: Company data, BofA Merrill Lynch Global Research estimates
Exhibit 12: XYG holds 29.5% of XYS as of June 2017
Source: Company data, BofA Merrill Lynch Global Research estimates
24 Xinyi Glass | 03 November 2017
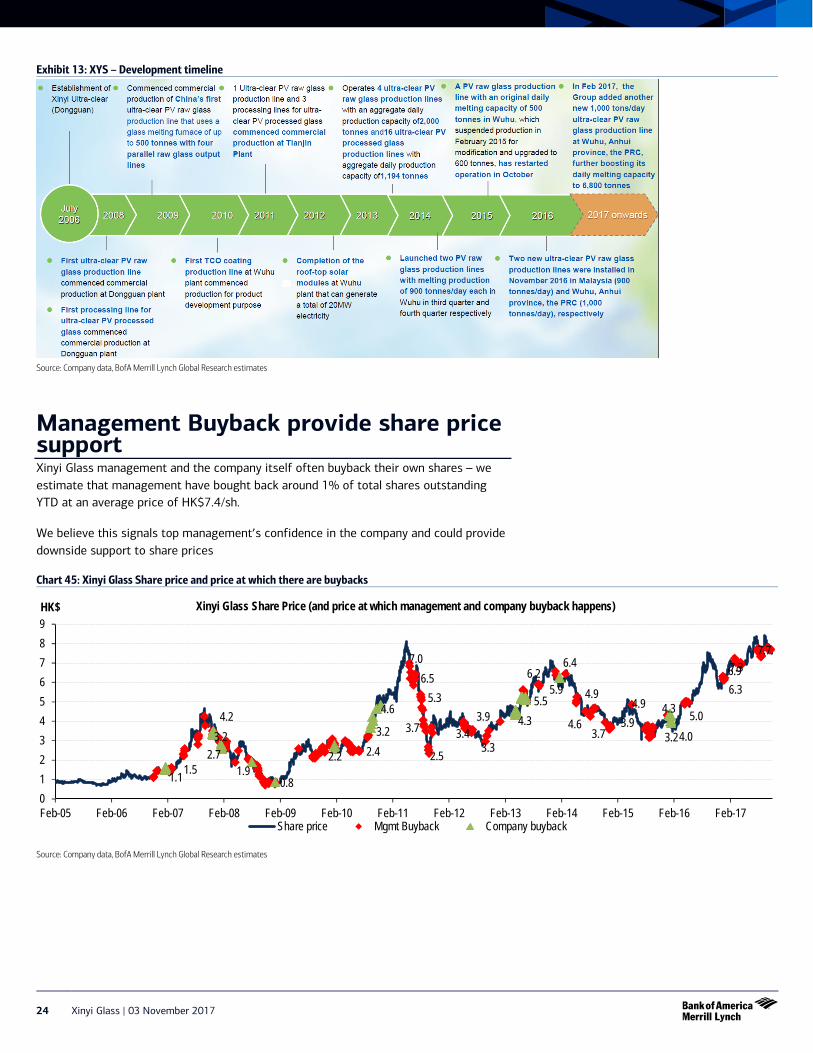
Exhibit 13: XYS – Development timeline
Source: Company data, BofA Merrill Lynch Global Research estimates
Management Buyback provide share price support Xinyi Glass management and the company itself often buyback their own shares – we estimate that management have bought back around 1% of total shares outstanding YTD at an average price of HK$7.4/sh.
We believe this signals top management’s confidence in the company and could provide downside support to share prices
Chart 45: Xinyi Glass Share price and price at which there are buybacks
Source: Company data, BofA Merrill Lynch Global Research estimates
1.1 1.5
3.2 4.2
2.7 1.9
0.8
2.2 2.4 3.2
7.0 6.5
5.3
3.7
2.5
3.9 3.4
3.3
5.5 5.9
6.4
4.9
4.6 3.9 3.7
4.9
3.2
4.3 5.0
6.3 6.9 7.3
7.7
4.6 4.3
6.2
4.0
0123456789
Feb-05 Feb-06 Feb-07 Feb-08 Feb-09 Feb-10 Feb-11 Feb-12 Feb-13 Feb-14 Feb-15 Feb-16 Feb-17
HK$ Xinyi Glass Share Price (and price at which management and company buyback happens)
Share price Mgmt Buyback Company buyback
Xinyi Glass | 03 November 2017 25
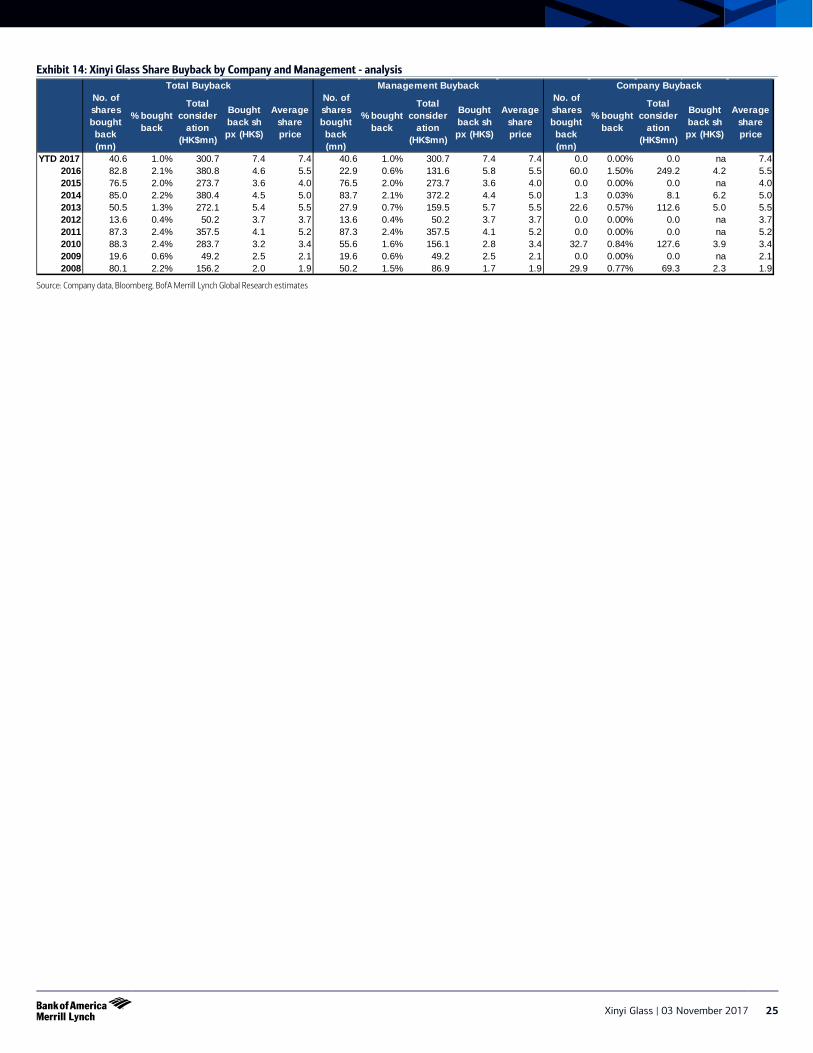
Exhibit 14: Xinyi Glass Share Buyback by Company and Management - analysis
Source: Company data, Bloomberg, BofA Merrill Lynch Global Research estimates
No. of shares bought back (mn)
% bought back
Total consider
ation (HK$mn)
Bought back sh px (HK$)
Average share price
No. of shares bought back (mn)
% bought back
Total consider
ation (HK$mn)
Bought back sh px (HK$)
Average share price
No. of shares bought back (mn)
% bought back
Total consider
ation (HK$mn)
Bought back sh px (HK$)
Average share price
YTD 2017 40.6 1.0% 300.7 7.4 7.4 40.6 1.0% 300.7 7.4 7.4 0.0 0.00% 0.0 na 7.42016 82.8 2.1% 380.8 4.6 5.5 22.9 0.6% 131.6 5.8 5.5 60.0 1.50% 249.2 4.2 5.52015 76.5 2.0% 273.7 3.6 4.0 76.5 2.0% 273.7 3.6 4.0 0.0 0.00% 0.0 na 4.02014 85.0 2.2% 380.4 4.5 5.0 83.7 2.1% 372.2 4.4 5.0 1.3 0.03% 8.1 6.2 5.02013 50.5 1.3% 272.1 5.4 5.5 27.9 0.7% 159.5 5.7 5.5 22.6 0.57% 112.6 5.0 5.52012 13.6 0.4% 50.2 3.7 3.7 13.6 0.4% 50.2 3.7 3.7 0.0 0.00% 0.0 na 3.72011 87.3 2.4% 357.5 4.1 5.2 87.3 2.4% 357.5 4.1 5.2 0.0 0.00% 0.0 na 5.22010 88.3 2.4% 283.7 3.2 3.4 55.6 1.6% 156.1 2.8 3.4 32.7 0.84% 127.6 3.9 3.42009 19.6 0.6% 49.2 2.5 2.1 19.6 0.6% 49.2 2.5 2.1 0.0 0.00% 0.0 na 2.12008 80.1 2.2% 156.2 2.0 1.9 50.2 1.5% 86.9 1.7 1.9 29.9 0.77% 69.3 2.3 1.9
Management Buyback Company BuybackTotal Buyback
26 Xinyi Glass | 03 November 2017
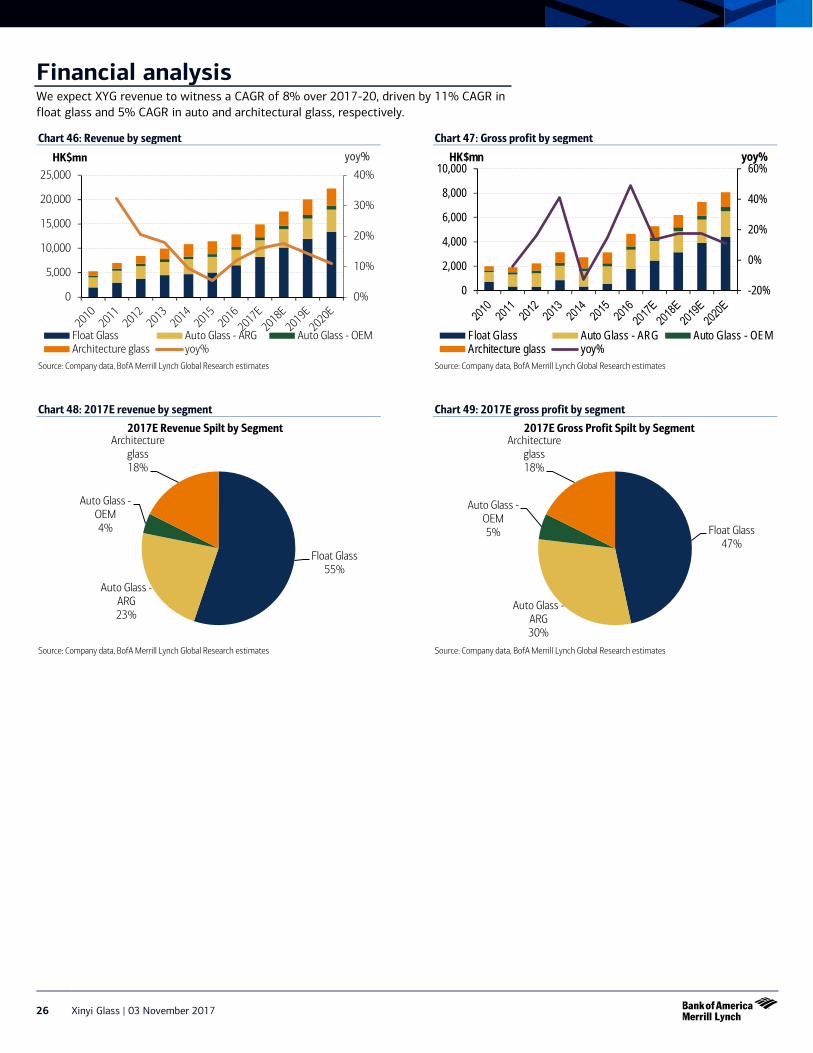
Financial analysis We expect XYG revenue to witness a CAGR of 8% over 2017-20, driven by 11% CAGR in float glass and 5% CAGR in auto and architectural glass, respectively.
Chart 46: Revenue by segment
Source: Company data, BofA Merrill Lynch Global Research estimates
Chart 47: Gross profit by segment
Source: Company data, BofA Merrill Lynch Global Research estimates
Chart 48: 2017E revenue by segment
Source: Company data, BofA Merrill Lynch Global Research estimates
Chart 49: 2017E gross profit by segment
Source: Company data, BofA Merrill Lynch Global Research estimates
0%
10%
20%
30%
40%
0
5,000
10,000
15,000
20,000
25,000
yoy% HK$mn
Float Glass Auto Glass - ARG Auto Glass - OEMArchitecture glass yoy%
-20%
0%
20%
40%
60%
0
2,000
4,000
6,000
8,000
10,000yoy% HK$mn
Float Glass Auto Glass - ARG Auto Glass - OEMArchitecture glass yoy%
Float Glass 55%
Auto Glass - ARG 23%
Auto Glass - OEM 4%
Architecture glass 18%
2017E Revenue Spilt by Segment
Float Glass 47%
Auto Glass - ARG 30%
Auto Glass - OEM 5%
Architecture glass 18%
2017E Gross Profit Spilt by Segment
Xinyi Glass | 03 November 2017 27
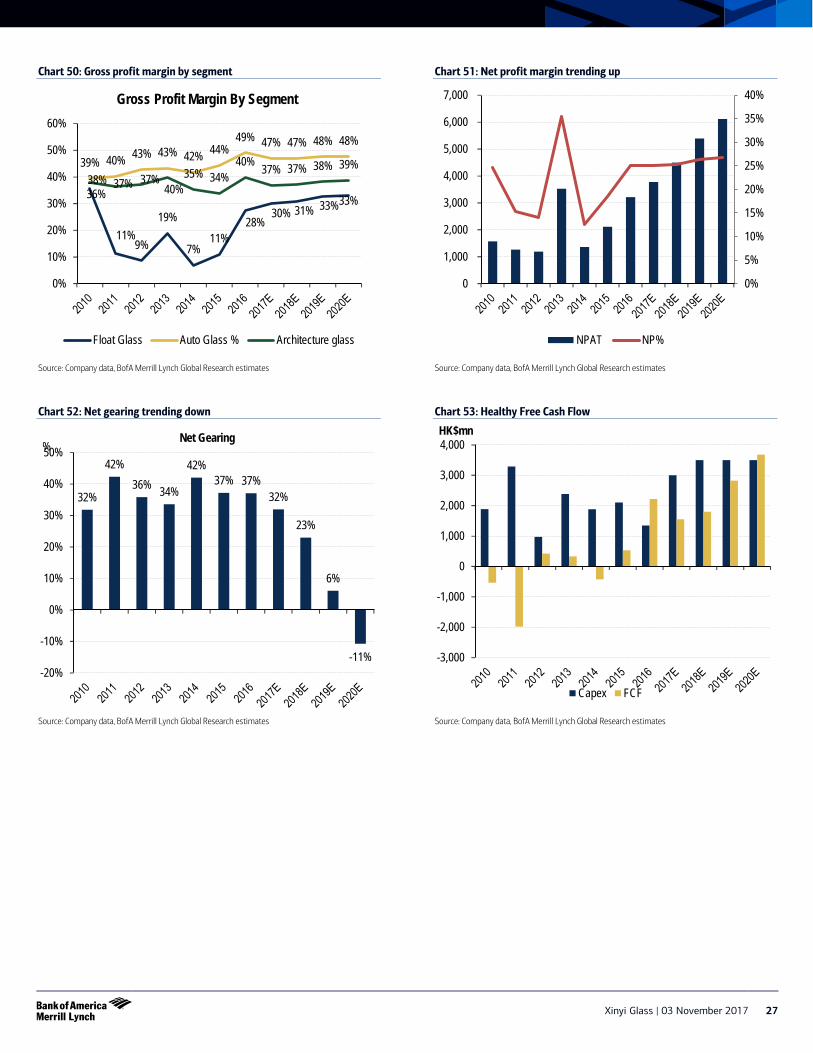
Chart 50: Gross profit margin by segment
Source: Company data, BofA Merrill Lynch Global Research estimates
Chart 51: Net profit margin trending up
Source: Company data, BofA Merrill Lynch Global Research estimates
Chart 52: Net gearing trending down
Source: Company data, BofA Merrill Lynch Global Research estimates
Chart 53: Healthy Free Cash Flow
Source: Company data, BofA Merrill Lynch Global Research estimates
36%
11% 9%
19%
7% 11%
28% 30% 31% 33% 33%
39% 40% 43% 43% 42% 44% 49% 47% 47% 48% 48%
38% 37% 37% 40%
35% 34% 40% 37% 37% 38% 39%
0%
10%
20%
30%
40%
50%
60%
Gross Profit Margin By Segment
Float Glass Auto Glass % Architecture glass
0%
5%
10%
15%
20%
25%
30%
35%
40%
0
1,000
2,000
3,000
4,000
5,000
6,000
7,000
NPAT NP%
32%
42% 36% 34%
42% 37% 37%
32%
23%
6%
-11% -20%
-10%
0%
10%
20%
30%
40%
50%% Net Gearing
-3,000
-2,000
-1,000
0
1,000
2,000
3,000
4,000HK$mn
Capex FCF
28 Xinyi Glass | 03 November 2017
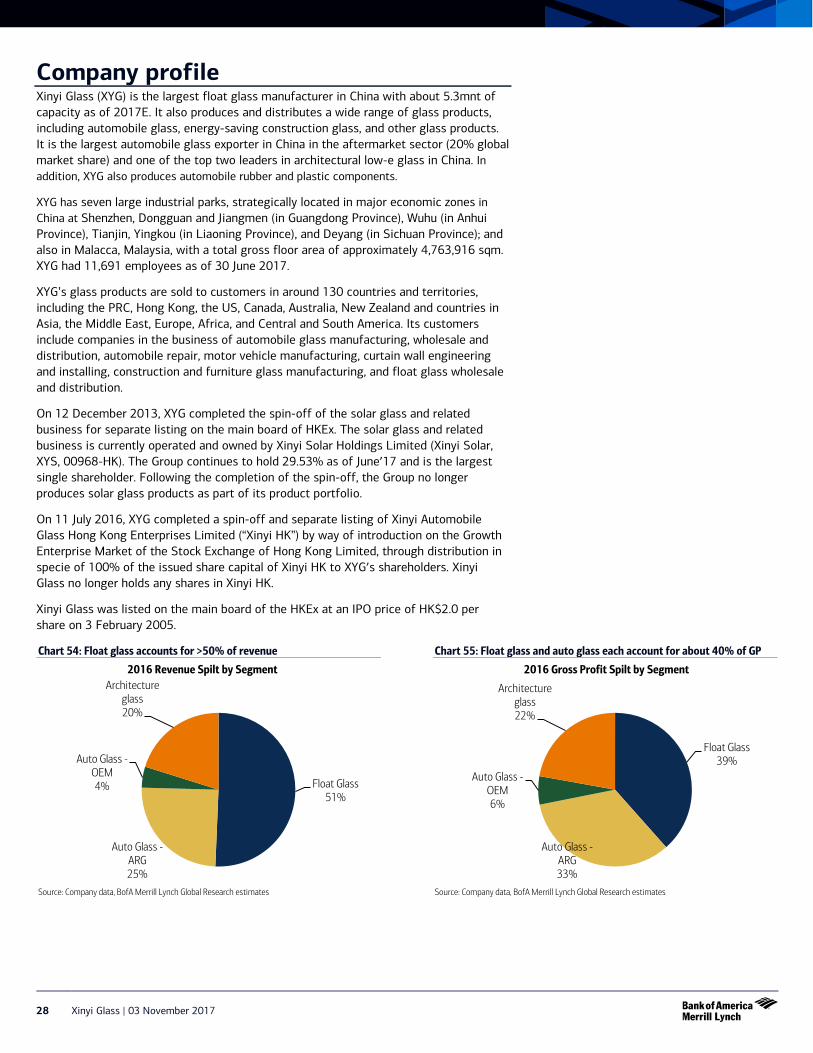
Company profile Xinyi Glass (XYG) is the largest float glass manufacturer in China with about 5.3mnt of capacity as of 2017E. It also produces and distributes a wide range of glass products, including automobile glass, energy-saving construction glass, and other glass products. It is the largest automobile glass exporter in China in the aftermarket sector (20% global market share) and one of the top two leaders in architectural low-e glass in China. In addition, XYG also produces automobile rubber and plastic components.
XYG has seven large industrial parks, strategically located in major economic zones in China at Shenzhen, Dongguan and Jiangmen (in Guangdong Province), Wuhu (in Anhui Province), Tianjin, Yingkou (in Liaoning Province), and Deyang (in Sichuan Province); and also in Malacca, Malaysia, with a total gross floor area of approximately 4,763,916 sqm. XYG had 11,691 employees as of 30 June 2017.
XYG’s glass products are sold to customers in around 130 countries and territories, including the PRC, Hong Kong, the US, Canada, Australia, New Zealand and countries in Asia, the Middle East, Europe, Africa, and Central and South America. Its customers include companies in the business of automobile glass manufacturing, wholesale and distribution, automobile repair, motor vehicle manufacturing, curtain wall engineering and installing, construction and furniture glass manufacturing, and float glass wholesale and distribution.
On 12 December 2013, XYG completed the spin-off of the solar glass and related business for separate listing on the main board of HKEx. The solar glass and related business is currently operated and owned by Xinyi Solar Holdings Limited (Xinyi Solar, XYS, 00968-HK). The Group continues to hold 29.53% as of June’17 and is the largest single shareholder. Following the completion of the spin-off, the Group no longer produces solar glass products as part of its product portfolio.
On 11 July 2016, XYG completed a spin-off and separate listing of Xinyi Automobile Glass Hong Kong Enterprises Limited (“Xinyi HK”) by way of introduction on the Growth Enterprise Market of the Stock Exchange of Hong Kong Limited, through distribution in specie of 100% of the issued share capital of Xinyi HK to XYG’s shareholders. Xinyi Glass no longer holds any shares in Xinyi HK.
Xinyi Glass was listed on the main board of the HKEx at an IPO price of HK$2.0 per share on 3 February 2005.
Chart 54: Float glass accounts for >50% of revenue
Source: Company data, BofA Merrill Lynch Global Research estimates
Chart 55: Float glass and auto glass each account for about 40% of GP
Source: Company data, BofA Merrill Lynch Global Research estimates
Float Glass 51%
Auto Glass - ARG 25%
Auto Glass - OEM 4%
Architecture glass 20%
2016 Revenue Spilt by Segment
Float Glass 39%
Auto Glass - ARG 33%
Auto Glass - OEM 6%
Architecture glass 22%
2016 Gross Profit Spilt by Segment
Xinyi Glass | 03 November 2017 29
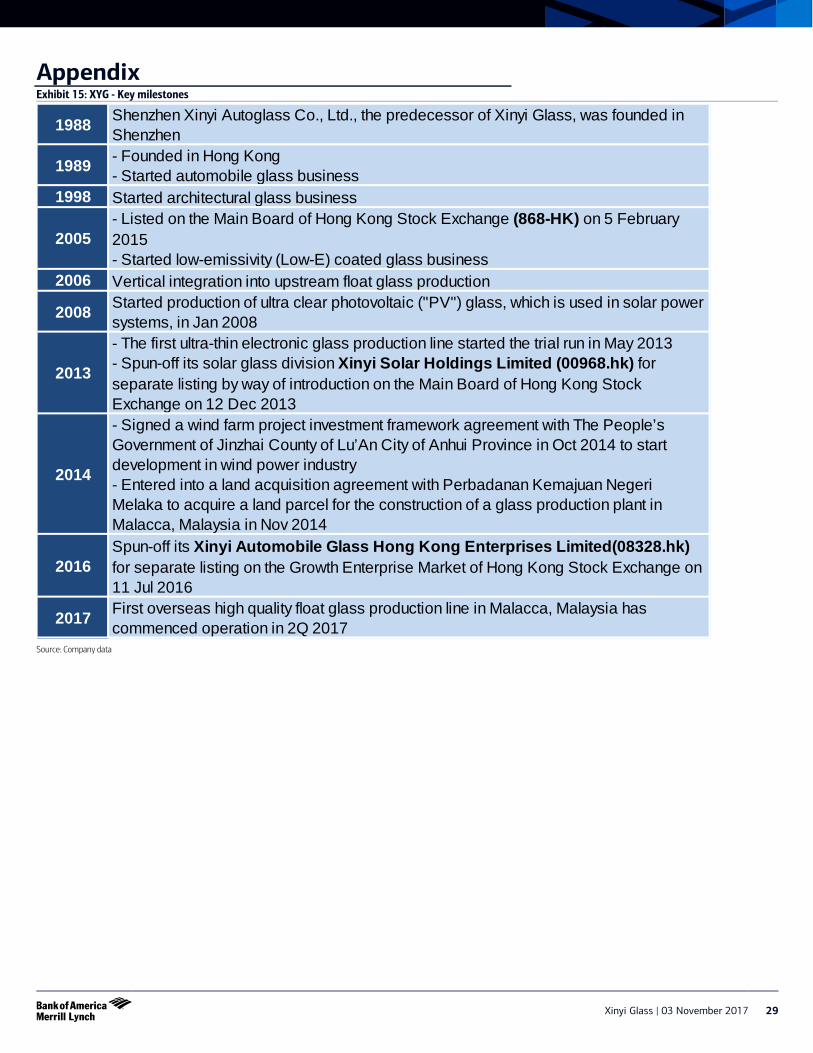
Appendix Exhibit 15: XYG - Key milestones
Source: Company data
1988 Shenzhen Xinyi Autoglass Co., Ltd., the predecessor of Xinyi Glass, was founded in Shenzhen
1989 - Founded in Hong Kong- Started automobile glass business
1998 Started architectural glass business
2005- Listed on the Main Board of Hong Kong Stock Exchange (868-HK) on 5 February 2015- Started low-emissivity (Low-E) coated glass business
2006 Vertical integration into upstream float glass production
2008 Started production of ultra clear photovoltaic ("PV") glass, which is used in solar power systems, in Jan 2008
2013
- The first ultra-thin electronic glass production line started the trial run in May 2013- Spun-off its solar glass division Xinyi Solar Holdings Limited (00968.hk) for separate listing by way of introduction on the Main Board of Hong Kong Stock Exchange on 12 Dec 2013
2014
- Signed a wind farm project investment framework agreement with The People’s Government of Jinzhai County of Lu’An City of Anhui Province in Oct 2014 to start development in wind power industry- Entered into a land acquisition agreement with Perbadanan Kemajuan Negeri Melaka to acquire a land parcel for the construction of a glass production plant in Malacca, Malaysia in Nov 2014
2016Spun-off its Xinyi Automobile Glass Hong Kong Enterprises Limited(08328.hk) for separate listing on the Growth Enterprise Market of Hong Kong Stock Exchange on 11 Jul 2016
2017 First overseas high quality float glass production line in Malacca, Malaysia has commenced operation in 2Q 2017
30 Xinyi Glass | 03 November 2017
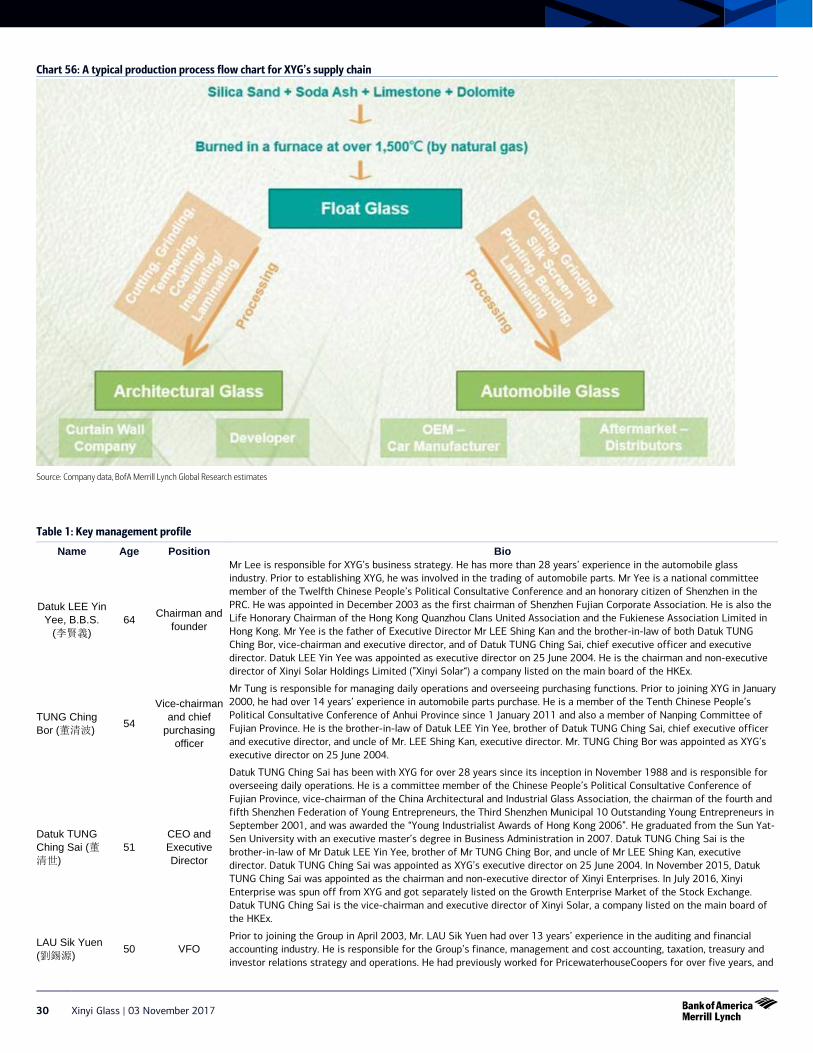
Chart 56: A typical production process flow chart for XYG’s supply chain
Source: Company data, BofA Merrill Lynch Global Research estimates
Table 1: Key management profile
Name Age Position Bio
Datuk LEE Yin Yee, B.B.S.
(李賢義) 64 Chairman and
founder
Mr Lee is responsible for XYG’s business strategy. He has more than 28 years’ experience in the automobile glass industry. Prior to establishing XYG, he was involved in the trading of automobile parts. Mr Yee is a national committee member of the Twelfth Chinese People’s Political Consultative Conference and an honorary citizen of Shenzhen in the PRC. He was appointed in December 2003 as the first chairman of Shenzhen Fujian Corporate Association. He is also the Life Honorary Chairman of the Hong Kong Quanzhou Clans United Association and the Fukienese Association Limited in Hong Kong. Mr Yee is the father of Executive Director Mr LEE Shing Kan and the brother-in-law of both Datuk TUNG Ching Bor, vice-chairman and executive director, and of Datuk TUNG Ching Sai, chief executive officer and executive director. Datuk LEE Yin Yee was appointed as executive director on 25 June 2004. He is the chairman and non-executive director of Xinyi Solar Holdings Limited (”Xinyi Solar“) a company listed on the main board of the HKEx.
TUNG Ching Bor (董清波) 54
Vice-chairman and chief
purchasing officer
Mr Tung is responsible for managing daily operations and overseeing purchasing functions. Prior to joining XYG in January 2000, he had over 14 years’ experience in automobile parts purchase. He is a member of the Tenth Chinese People’s Political Consultative Conference of Anhui Province since 1 January 2011 and also a member of Nanping Committee of Fujian Province. He is the brother-in-law of Datuk LEE Yin Yee, brother of Datuk TUNG Ching Sai, chief executive officer and executive director, and uncle of Mr. LEE Shing Kan, executive director. Mr. TUNG Ching Bor was appointed as XYG’s executive director on 25 June 2004.
Datuk TUNG Ching Sai (董清世)
51 CEO and Executive Director
Datuk TUNG Ching Sai has been with XYG for over 28 years since its inception in November 1988 and is responsible for overseeing daily operations. He is a committee member of the Chinese People’s Political Consultative Conference of Fujian Province, vice-chairman of the China Architectural and Industrial Glass Association, the chairman of the fourth and fifth Shenzhen Federation of Young Entrepreneurs, the Third Shenzhen Municipal 10 Outstanding Young Entrepreneurs in September 2001, and was awarded the “Young Industrialist Awards of Hong Kong 2006”. He graduated from the Sun Yat-Sen University with an executive master’s degree in Business Administration in 2007. Datuk TUNG Ching Sai is the brother-in-law of Mr Datuk LEE Yin Yee, brother of Mr TUNG Ching Bor, and uncle of Mr LEE Shing Kan, executive director. Datuk TUNG Ching Sai was appointed as XYG’s executive director on 25 June 2004. In November 2015, Datuk TUNG Ching Sai was appointed as the chairman and non-executive director of Xinyi Enterprises. In July 2016, Xinyi Enterprise was spun off from XYG and got separately listed on the Growth Enterprise Market of the Stock Exchange. Datuk TUNG Ching Sai is the vice-chairman and executive director of Xinyi Solar, a company listed on the main board of the HKEx.
LAU Sik Yuen (劉錫源) 50 VFO
Prior to joining the Group in April 2003, Mr. LAU Sik Yuen had over 13 years’ experience in the auditing and financial accounting industry. He is responsible for the Group’s finance, management and cost accounting, taxation, treasury and investor relations strategy and operations. He had previously worked for PricewaterhouseCoopers for over five years, and
Xinyi Glass | 03 November 2017 31
Table 1: Key management profile
Name Age Position Bio had been the financial controller of a subsidiary of a company listed on the main board of the HKEx for over three years. He is a fellow member of the Hong Kong Institute of Certified Public Accountants and a member of the American Institute of Certified Public Accountants.
LEE Shing Kan (李聖根) 37 Executive
Director
Mr Lee is responsible for overseeing the overseas automobile glass operation and the general manager of Xinyi Automobile Glass (Shenzhen) Company Limited. He joined the company in January 2005. He holds a bachelor’s degree in Commerce from the University of Melbourne, Australia, and a master’s degree in Applied Finance from the Monash University, Australia. He is the member of the Fujian Province Committee of Chinese People’s Political Consultative Conference. Mr. LEE Shing Kan was the director (2012/2014) of Tung Wah Group of Hospitals. He is the son of Mr Datuk LEE Yin Yee, nephew of Mr TUNG Ching Bor and Mr Datuk TUNG Ching Sai. Mr. LEE Shing Kan was appointed as XYG’s executive director on 15 October 2008.
LI Ching Wai (李清懷) 59 Non-executive
Director Has been with XYG since April 2001. Prior to joining XYG, Mr. LI Ching Wai had worked in the trading of automobile parts industry. He was appointed as XYG’s non-executive director on 25 June 2004.
LI Ching Wai (李清懷) 59 Non-executive
Director Has been with XYG since April 2001. Prior to joining XYG, Mr. LI Ching Wai had worked in the trading of automobile parts industry. Mr. LI Ching Wai was appointed as XYG’s non-executive director on 25 June 2004.
SZE Nang Sze (施能獅) 59 Non-executive
Director Has been with XYG since April 2001. Prior to joining XYG, Mr. SZE Nang Sze had worked in the trading of automobile parts industry. He was appointed as XYG’s non-executive director on 25 June 2004.
LI Ching Leung (李清
涼) 60 Non-executive
Director
Joined XYG in August 2004. Mr. LI Ching Leung was the assistant general manager of XYG’s Wuhu production complex. Prior to joining XYG, he had worked in the trading of automobile parts industry, manufacturing of plastic products and mold industry, and manufacturing of leather products industry. Mr. LI Ching Leung was appointed as XYG’s executive director on 25 August 2004 and was re-designated as non-executive director on 14 September 2005.
NG Ngan Ho (吳銀河) 52 Non-executive
Director
Joined XYG in August 2003. Mr. NG Ngan Ho was responsible for overseeing the financial and purchasing matters of XYG’s Dongguan production complex. He was appointed as XYG’s executive director on 25 June 2004 and was re-designated as non-executive director on 1 July 2007.
Source: Company data, BofA Merrill Lynch Global Research estimates
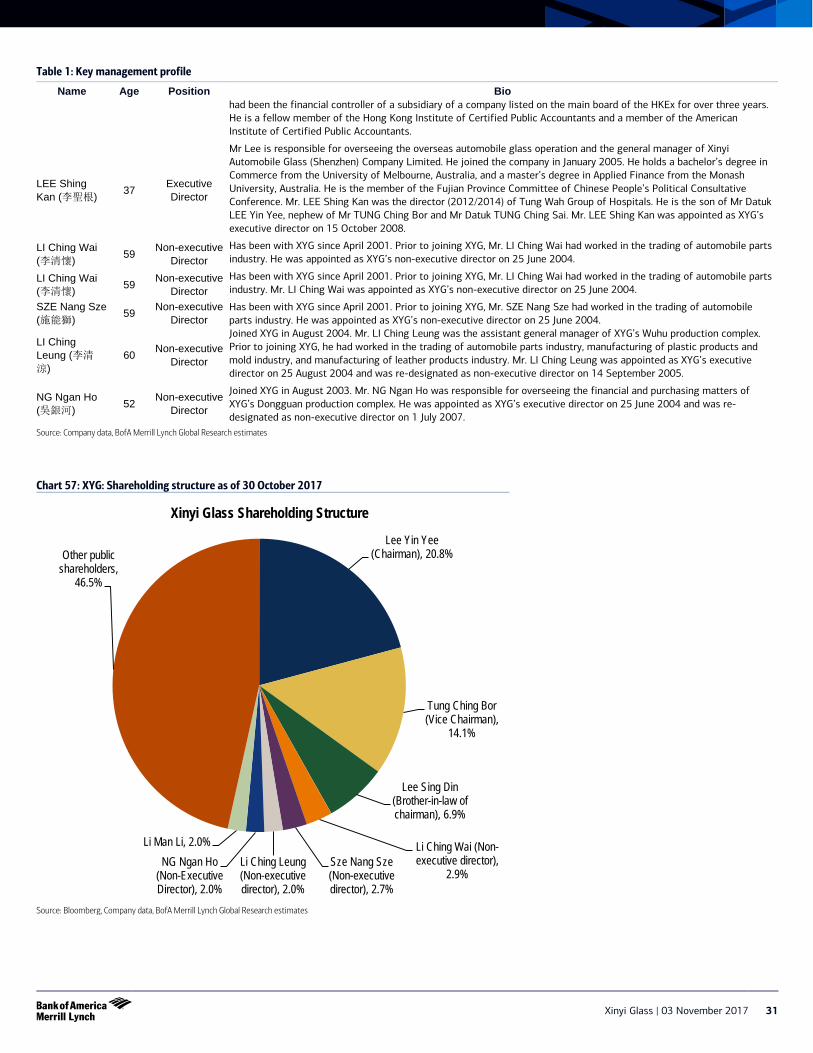
Chart 57: XYG: Shareholding structure as of 30 October 2017
Source: Bloomberg, Company data, BofA Merrill Lynch Global Research estimates
Lee Yin Yee (Chairman), 20.8%
Tung Ching Bor (Vice Chairman),
14.1%
Lee Sing Din (Brother-in-law of chairman), 6.9%
Li Ching Wai (Non-executive director),
2.9% Sze Nang Sze (Non-executive director), 2.7%
Li Ching Leung (Non-executive director), 2.0%
NG Ngan Ho (Non-Executive Director), 2.0%
Li Man Li, 2.0%
Other public shareholders,
46.5%
Xinyi Glass Shareholding Structure
32 Xinyi Glass | 03 November 2017
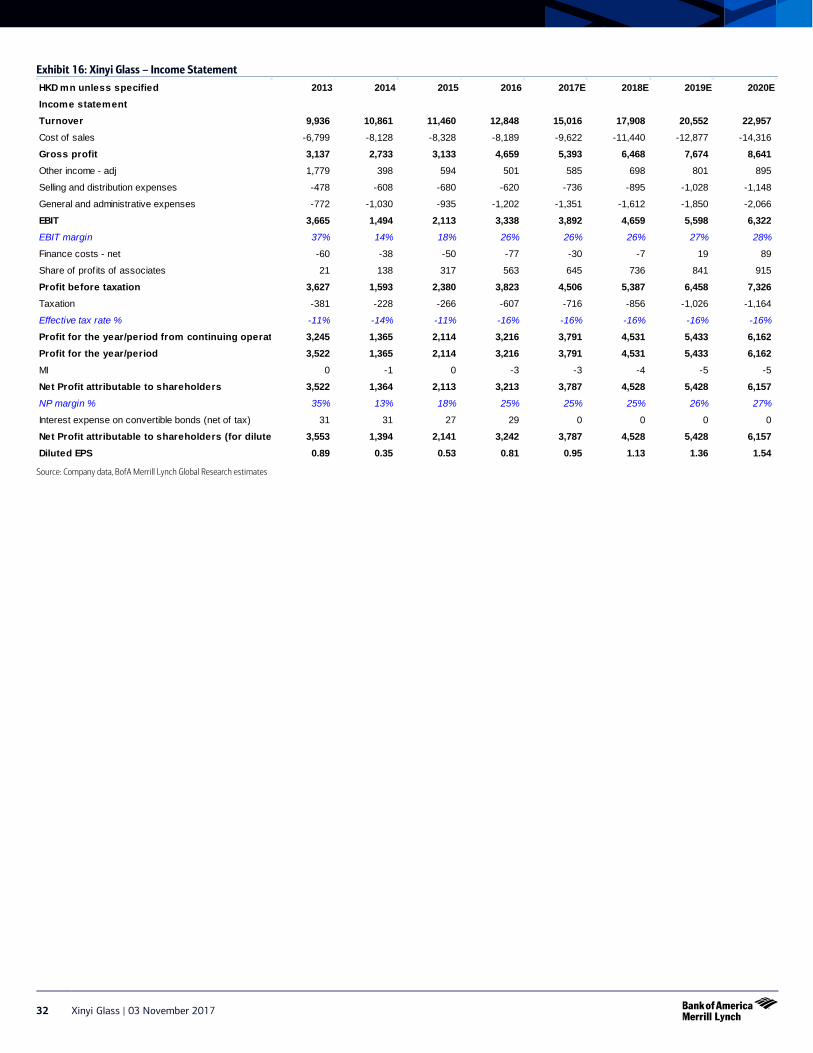
Exhibit 16: Xinyi Glass – Income Statement
Source: Company data, BofA Merrill Lynch Global Research estimates
HKD mn unless specified 2013 2014 2015 2016 2017E 2018E 2019E 2020EIncome statementTurnover 9,936 10,861 11,460 12,848 15,016 17,908 20,552 22,957Cost of sales -6,799 -8,128 -8,328 -8,189 -9,622 -11,440 -12,877 -14,316
Gross profit 3,137 2,733 3,133 4,659 5,393 6,468 7,674 8,641Other income - adj 1,779 398 594 501 585 698 801 895
Selling and distribution expenses -478 -608 -680 -620 -736 -895 -1,028 -1,148
General and administrative expenses -772 -1,030 -935 -1,202 -1,351 -1,612 -1,850 -2,066
EBIT 3,665 1,494 2,113 3,338 3,892 4,659 5,598 6,322EBIT margin 37% 14% 18% 26% 26% 26% 27% 28%
Finance costs - net -60 -38 -50 -77 -30 -7 19 89
Share of profits of associates 21 138 317 563 645 736 841 915
Profit before taxation 3,627 1,593 2,380 3,823 4,506 5,387 6,458 7,326Taxation -381 -228 -266 -607 -716 -856 -1,026 -1,164
Effective tax rate % -11% -14% -11% -16% -16% -16% -16% -16%
Profit for the year/period from continuing operat 3,245 1,365 2,114 3,216 3,791 4,531 5,433 6,162Profit for the year/period 3,522 1,365 2,114 3,216 3,791 4,531 5,433 6,162MI 0 -1 0 -3 -3 -4 -5 -5
Net Profit attributable to shareholders 3,522 1,364 2,113 3,213 3,787 4,528 5,428 6,157NP margin % 35% 13% 18% 25% 25% 25% 26% 27%
Interest expense on convertible bonds (net of tax) 31 31 27 29 0 0 0 0
Net Profit attributable to shareholders (for dilute 3,553 1,394 2,141 3,242 3,787 4,528 5,428 6,157Diluted EPS 0.89 0.35 0.53 0.81 0.95 1.13 1.36 1.54
Xinyi Glass | 03 November 2017 33
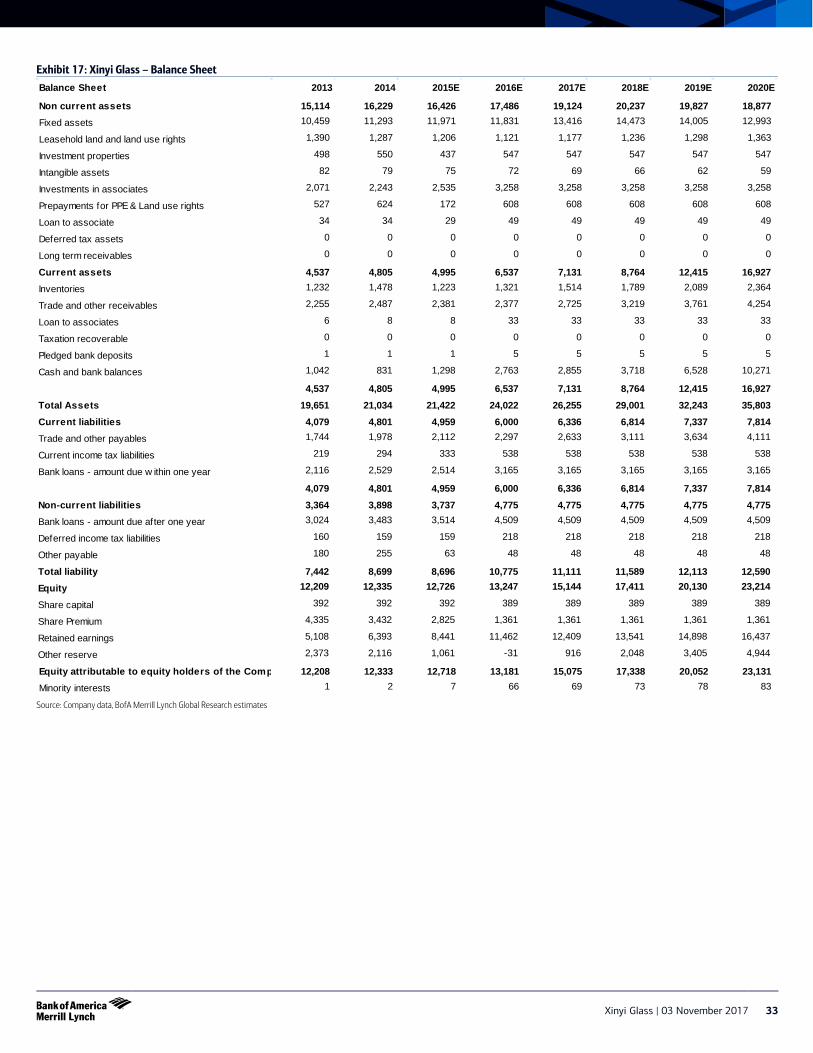
Exhibit 17: Xinyi Glass – Balance Sheet
Source: Company data, BofA Merrill Lynch Global Research estimates
Balance Sheet 2013 2014 2015E 2016E 2017E 2018E 2019E 2020E
Non current assets 15,114 16,229 16,426 17,486 19,124 20,237 19,827 18,877Fixed assets 10,459 11,293 11,971 11,831 13,416 14,473 14,005 12,993
Leasehold land and land use rights 1,390 1,287 1,206 1,121 1,177 1,236 1,298 1,363
Investment properties 498 550 437 547 547 547 547 547
Intangible assets 82 79 75 72 69 66 62 59
Investments in associates 2,071 2,243 2,535 3,258 3,258 3,258 3,258 3,258
Prepayments for PPE & Land use rights 527 624 172 608 608 608 608 608
Loan to associate 34 34 29 49 49 49 49 49
Deferred tax assets 0 0 0 0 0 0 0 0
Long term receivables 0 0 0 0 0 0 0 0
Current assets 4,537 4,805 4,995 6,537 7,131 8,764 12,415 16,927Inventories 1,232 1,478 1,223 1,321 1,514 1,789 2,089 2,364
Trade and other receivables 2,255 2,487 2,381 2,377 2,725 3,219 3,761 4,254
Loan to associates 6 8 8 33 33 33 33 33
Taxation recoverable 0 0 0 0 0 0 0 0
Pledged bank deposits 1 1 1 5 5 5 5 5
Cash and bank balances 1,042 831 1,298 2,763 2,855 3,718 6,528 10,271
4,537 4,805 4,995 6,537 7,131 8,764 12,415 16,927Total Assets 19,651 21,034 21,422 24,022 26,255 29,001 32,243 35,803Current liabilities 4,079 4,801 4,959 6,000 6,336 6,814 7,337 7,814Trade and other payables 1,744 1,978 2,112 2,297 2,633 3,111 3,634 4,111
Current income tax liabilities 219 294 333 538 538 538 538 538
Bank loans - amount due w ithin one year 2,116 2,529 2,514 3,165 3,165 3,165 3,165 3,165
4,079 4,801 4,959 6,000 6,336 6,814 7,337 7,814Non-current liabilities 3,364 3,898 3,737 4,775 4,775 4,775 4,775 4,775Bank loans - amount due after one year 3,024 3,483 3,514 4,509 4,509 4,509 4,509 4,509
Deferred income tax liabilities 160 159 159 218 218 218 218 218
Other payable 180 255 63 48 48 48 48 48
Total liability 7,442 8,699 8,696 10,775 11,111 11,589 12,113 12,590Equity 12,209 12,335 12,726 13,247 15,144 17,411 20,130 23,214
Share capital 392 392 392 389 389 389 389 389
Share Premium 4,335 3,432 2,825 1,361 1,361 1,361 1,361 1,361
Retained earnings 5,108 6,393 8,441 11,462 12,409 13,541 14,898 16,437
Other reserve 2,373 2,116 1,061 -31 916 2,048 3,405 4,944
Equity attributable to equity holders of the Comp 12,208 12,333 12,718 13,181 15,075 17,338 20,052 23,131Minority interests 1 2 7 66 69 73 78 83
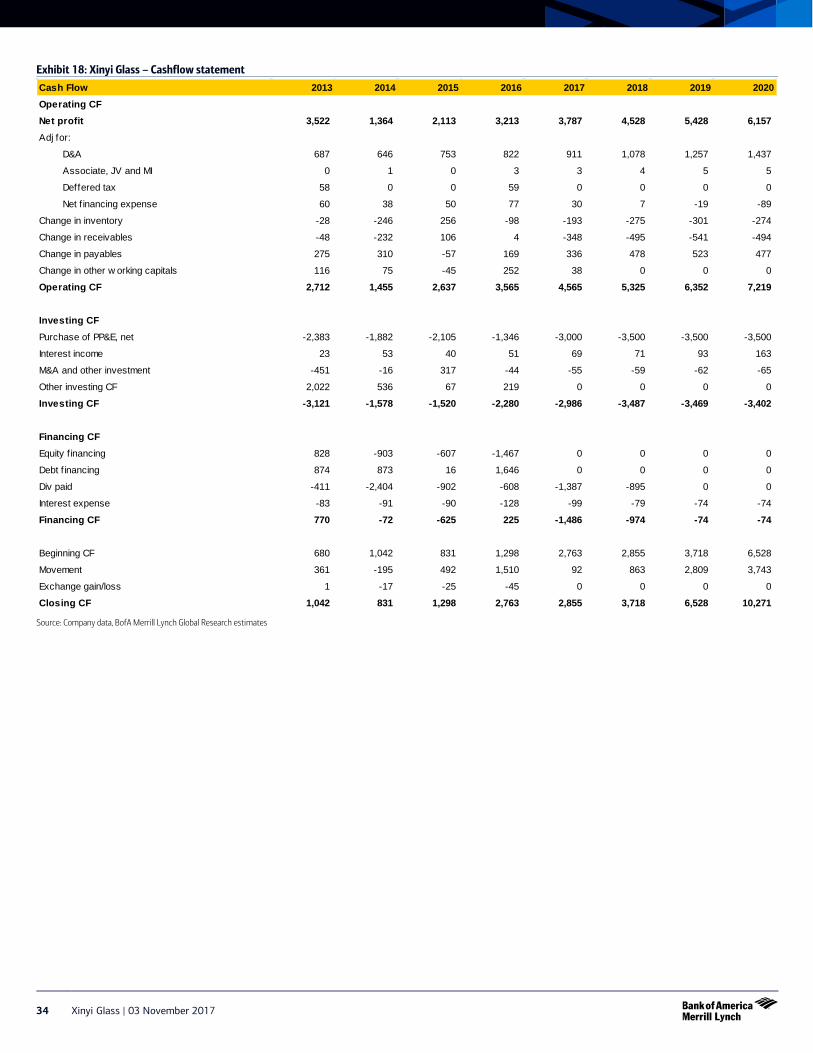
34 Xinyi Glass | 03 November 2017
Exhibit 18: Xinyi Glass – Cashflow statement
Source: Company data, BofA Merrill Lynch Global Research estimates
Cash Flow 2013 2014 2015 2016 2017 2018 2019 2020Operating CFNet profit 3,522 1,364 2,113 3,213 3,787 4,528 5,428 6,157Adj for:
D&A 687 646 753 822 911 1,078 1,257 1,437
Associate, JV and MI 0 1 0 3 3 4 5 5
Deffered tax 58 0 0 59 0 0 0 0
Net f inancing expense 60 38 50 77 30 7 -19 -89
Change in inventory -28 -246 256 -98 -193 -275 -301 -274
Change in receivables -48 -232 106 4 -348 -495 -541 -494
Change in payables 275 310 -57 169 336 478 523 477
Change in other w orking capitals 116 75 -45 252 38 0 0 0
Operating CF 2,712 1,455 2,637 3,565 4,565 5,325 6,352 7,219
Investing CFPurchase of PP&E, net -2,383 -1,882 -2,105 -1,346 -3,000 -3,500 -3,500 -3,500
Interest income 23 53 40 51 69 71 93 163
M&A and other investment -451 -16 317 -44 -55 -59 -62 -65
Other investing CF 2,022 536 67 219 0 0 0 0
Investing CF -3,121 -1,578 -1,520 -2,280 -2,986 -3,487 -3,469 -3,402
Financing CFEquity f inancing 828 -903 -607 -1,467 0 0 0 0
Debt f inancing 874 873 16 1,646 0 0 0 0
Div paid -411 -2,404 -902 -608 -1,387 -895 0 0
Interest expense -83 -91 -90 -128 -99 -79 -74 -74
Financing CF 770 -72 -625 225 -1,486 -974 -74 -74
Beginning CF 680 1,042 831 1,298 2,763 2,855 3,718 6,528
Movement 361 -195 492 1,510 92 863 2,809 3,743
Exchange gain/loss 1 -17 -25 -45 0 0 0 0
Closing CF 1,042 831 1,298 2,763 2,855 3,718 6,528 10,271
Xinyi Glass | 03 November 2017 35
Price objective basis & risk Xinyi Glass (XYIGF) Our PO of HK$10 is based on a SOTP (sum-of-the-parts) approach and uses (1) 10x one-year forward P/E multiple for XYG's core operations, similar to its historical mid-range of 8-11x, and (2) attributable interest of market cap of Xinyi Solar, based on BofAML's Xinyi Solar valuation of HK$4.4. We apply a 15% conglomerate discount to arrive at our PO of HK$10/sh, implying 8.8x 2018E P/E, within the historical mid-range of 8-11x. Downside risks: 1) weaker than expected property demand, 2) more than expected industry capacity addition, 3) delay in overseas expansion, 4) large hike in soda ash/ gas price, 5) large currency fluctuations, 6) equity dilution Upside risks: 1) better than expected demand, 2) more than expected industry capacity closure/ cold repair, 3) lower than expected gas/ soda ash prices, 4) higher than expected ASP Analyst Certification I, David Ching, CFA, hereby certify that the views expressed in this research report accurately reflect my personal views about the subject securities and issuers. I also certify that no part of my compensation was, is, or will be, directly or indirectly, related to the specific recommendations or view expressed in this research report. Special Disclosures Information on securities which are listed on the exchanges where ML Securities (Taiwan) Limited is not permitted to trade or solicit trades for clients is for informational purposes only and is not a recommendation or a solicitation to trade such securities. ML Securities (Taiwan) Limited will not execute transactions for nor accept orders from clients to trade such securities. Foreign investment in Taiwan securities is regulated and restricted. Currently, foreign investment in Taiwan securities is permitted by investment through: (1) global depository receipts, (2) convertible bonds, (3) mutual funds issued offshore of Taiwan, and (4) a special foreign institutional investors (FINIs) and foreign individual investors (FIDIs) program supervised by the Taiwan SFB whereunder FINIs/FIDIs may apply for investment ID to invest in Taiwan securities by registration with Taiwan Stock Exchange. FINIs will additionally need consent from the foreign exchange authority, ie, the Central Bank of China. In addition to the limitations above, various industry-specific percentage-based limitations on foreign ownership of Taiwan companies (and in some cases prohibitions) may apply. Investments are subject to exchange rate and currency conversion restrictions and risks. Dividends and interest earned by foreign investors' Taiwan securities/instruments are generally subject to a 20% withholding tax. Ordinary shares are not available to ML private client accounts in the U.S.
This report is distributed in the Republic of China by Merrill Lynch Securities (Taiwan) Limited, which is regulated by the SFB of the Republic of China.
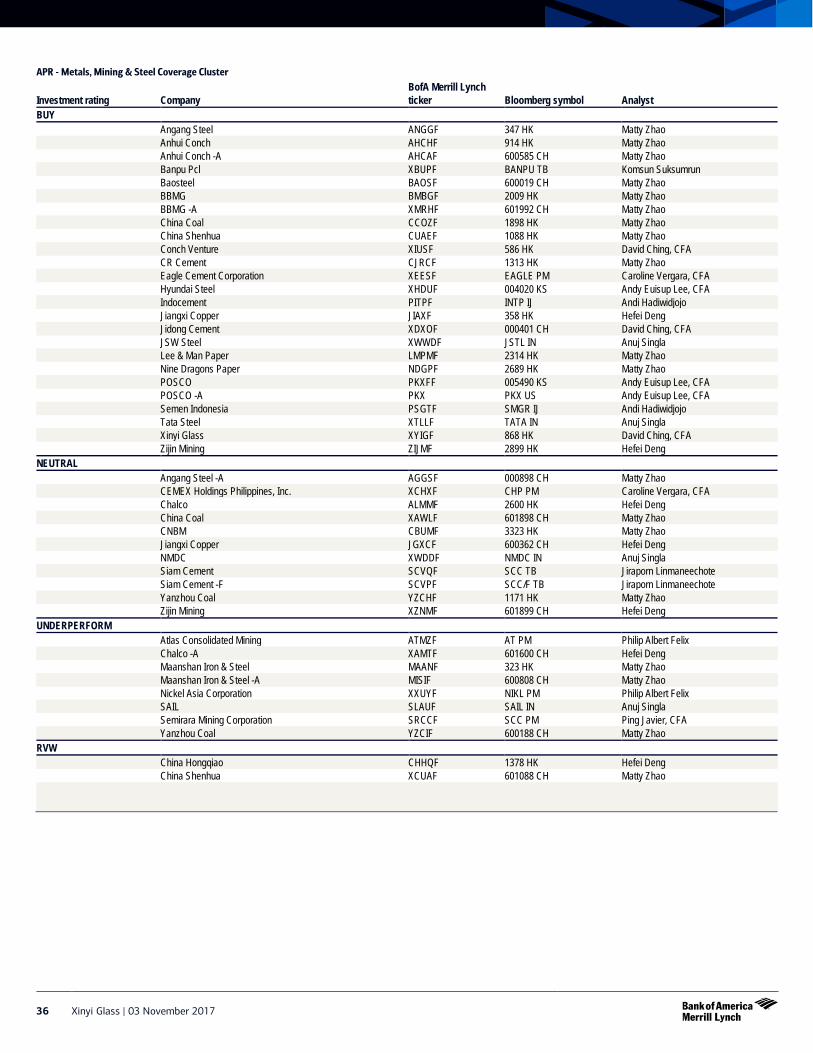
36 Xinyi Glass | 03 November 2017
APR - Metals, Mining & Steel Coverage Cluster
Investment rating Company BofA Merrill Lynch ticker Bloomberg symbol Analyst
BUY Angang Steel ANGGF 347 HK Matty Zhao Anhui Conch AHCHF 914 HK Matty Zhao Anhui Conch -A AHCAF 600585 CH Matty Zhao Banpu Pcl XBUPF BANPU TB Komsun Suksumrun Baosteel BAOSF 600019 CH Matty Zhao BBMG BMBGF 2009 HK Matty Zhao BBMG -A XMRHF 601992 CH Matty Zhao China Coal CCOZF 1898 HK Matty Zhao China Shenhua CUAEF 1088 HK Matty Zhao Conch Venture XIUSF 586 HK David Ching, CFA CR Cement CJRCF 1313 HK Matty Zhao Eagle Cement Corporation XEESF EAGLE PM Caroline Vergara, CFA Hyundai Steel XHDUF 004020 KS Andy Euisup Lee, CFA Indocement PITPF INTP IJ Andi Hadiwidjojo Jiangxi Copper JIAXF 358 HK Hefei Deng Jidong Cement XDXOF 000401 CH David Ching, CFA JSW Steel XWWDF JSTL IN Anuj Singla Lee & Man Paper LMPMF 2314 HK Matty Zhao Nine Dragons Paper NDGPF 2689 HK Matty Zhao POSCO PKXFF 005490 KS Andy Euisup Lee, CFA POSCO -A PKX PKX US Andy Euisup Lee, CFA Semen Indonesia PSGTF SMGR IJ Andi Hadiwidjojo Tata Steel XTLLF TATA IN Anuj Singla Xinyi Glass XYIGF 868 HK David Ching, CFA Zijin Mining ZIJMF 2899 HK Hefei Deng NEUTRAL Angang Steel -A AGGSF 000898 CH Matty Zhao CEMEX Holdings Philippines, Inc. XCHXF CHP PM Caroline Vergara, CFA Chalco ALMMF 2600 HK Hefei Deng China Coal XAWLF 601898 CH Matty Zhao CNBM CBUMF 3323 HK Matty Zhao Jiangxi Copper JGXCF 600362 CH Hefei Deng NMDC XWDDF NMDC IN Anuj Singla Siam Cement SCVQF SCC TB Jiraporn Linmaneechote Siam Cement -F SCVPF SCC/F TB Jiraporn Linmaneechote Yanzhou Coal YZCHF 1171 HK Matty Zhao Zijin Mining XZNMF 601899 CH Hefei Deng UNDERPERFORM Atlas Consolidated Mining ATMZF AT PM Philip Albert Felix Chalco -A XAMTF 601600 CH Hefei Deng Maanshan Iron & Steel MAANF 323 HK Matty Zhao Maanshan Iron & Steel -A MISIF 600808 CH Matty Zhao Nickel Asia Corporation XXUYF NIKL PM Philip Albert Felix SAIL SLAUF SAIL IN Anuj Singla Semirara Mining Corporation SRCCF SCC PM Ping Javier, CFA Yanzhou Coal YZCIF 600188 CH Matty Zhao RVW China Hongqiao CHHQF 1378 HK Hefei Deng China Shenhua XCUAF 601088 CH Matty Zhao
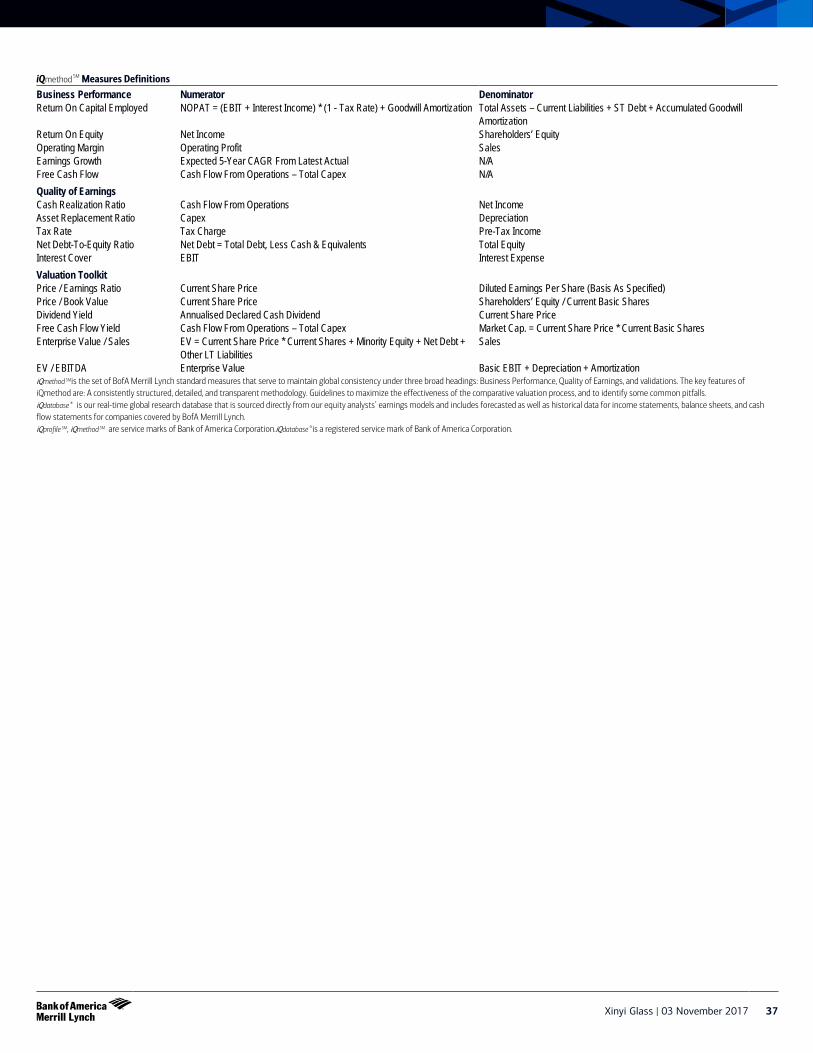
Xinyi Glass | 03 November 2017 37
iQmethod SM Measures Definitions Business Performance Numerator Denominator Return On Capital Employed NOPAT = (EBIT + Interest Income) * (1 - Tax Rate) + Goodwill Amortization Total Assets – Current Liabilities + ST Debt + Accumulated Goodwill
Amortization Return On Equity Net Income Shareholders’ Equity Operating Margin Operating Profit Sales Earnings Growth Expected 5-Year CAGR From Latest Actual N/A Free Cash Flow Cash Flow From Operations – Total Capex N/A Quality of Earnings Cash Realization Ratio Cash Flow From Operations Net Income Asset Replacement Ratio Capex Depreciation Tax Rate Tax Charge Pre-Tax Income Net Debt-To-Equity Ratio Net Debt = Total Debt, Less Cash & Equivalents Total Equity Interest Cover EBIT Interest Expense Valuation Toolkit Price / Earnings Ratio Current Share Price Diluted Earnings Per Share (Basis As Specified) Price / Book Value Current Share Price Shareholders’ Equity / Current Basic Shares Dividend Yield Annualised Declared Cash Dividend Current Share Price Free Cash Flow Yield Cash Flow From Operations – Total Capex Market Cap. = Current Share Price * Current Basic Shares Enterprise Value / Sales EV = Current Share Price * Current Shares + Minority Equity + Net Debt +
Other LT Liabilities Sales
EV / EBITDA Enterprise Value Basic EBIT + Depreciation + Amortization
iQmethod SMis the set of BofA Merrill Lynch standard measures that serve to maintain global consistency under three broad headings: Business Performance, Quality of Earnings, and validations. The key features of iQmethod are: A consistently structured, detailed, and transparent methodology. Guidelines to maximize the effectiveness of the comparative valuation process, and to identify some common pitfalls. iQdatabase ® is our real-time global research database that is sourced directly from our equity analysts’ earnings models and includes forecasted as well as historical data for income statements, balance sheets, and cash flow statements for companies covered by BofA Merrill Lynch. iQprofile SM, iQmethod SM are service marks of Bank of America Corporation.iQdatabase ®is a registered service mark of Bank of America Corporation.
38 Xinyi Glass | 03 November 2017
Disclosures Important Disclosures Equity Investment Rating Distribution: Building Group (as of 30 Sep 2017) Coverage Universe Count Percent Inv. Banking Relationships* Count Percent Buy 39 50.00% Buy 22 56.41% Hold 21 26.92% Hold 12 57.14% Sell 18 23.08% Sell 8 44.44% Equity Investment Rating Distribution: Global Group (as of 30 Sep 2017) Coverage Universe Count Percent Inv. Banking Relationships* Count Percent Buy 1513 51.82% Buy 956 63.19% Hold 646 22.12% Hold 396 61.30% Sell 761 26.06% Sell 359 47.17% * Issuers that were investment banking clients of BofA Merrill Lynch or one of its affiliates within the past 12 months. For purposes of this Investment Rating Distribution, the coverage universe includes only stocks. A stock rated Neutral is included as a Hold, and a stock rated Underperform is included as a Sell.
FUNDAMENTAL EQUITY OPINION KEY: Opinions include a Volatility Risk Rating, an Investment Rating and an Income Rating. VOLATILITY RISK RATINGS, indicators of potential price fluctuation, are: A - Low, B - Medium and C - High. INVESTMENT RATINGS reflect the analyst’s assessment of a stock’s: (i) absolute total return potential and (ii) attractiveness for investment relative to other stocks within its Coverage Cluster (defined below). There are three investment ratings: 1 - Buy stocks are expected to have a total return of at least 10% and are the most attractive stocks in the coverage cluster; 2 - Neutral stocks are expected to remain flat or increase in value and are less attractive than Buy rated stocks and 3 - Underperform stocks are the least attractive stocks in a coverage cluster. Analysts assign investment ratings considering, among other things, the 0-12 month total return expectation for a stock and the firm’s guidelines for ratings dispersions (shown in the table below). The current price objective for a stock should be referenced to better understand the total return expectation at any given time. The price objective reflects the analyst’s view of the potential price appreciation (depreciation). Investment rating Total return expectation (within 12-month period of date of initial rating) Ratings dispersion guidelines for coverage cluster*
Buy ≥ 10% ≤ 70% Neutral ≥ 0% ≤ 30%
Underperform N/A ≥ 20% * Ratings dispersions may vary from time to time where BofA Merrill Lynch Research believes it better reflects the investment prospects of stocks in a Coverage Cluster.
INCOME RATINGS, indicators of potential cash dividends, are: 7 - same/higher (dividend considered to be secure), 8 - same/lower (dividend not considered to be secure) and 9 - pays no cash dividend. Coverage Cluster is comprised of stocks covered by a single analyst or two or more analysts sharing a common industry, sector, region or other classification(s). A stock’s coverage cluster is included in the most recent BofA Merrill Lynch report referencing the stock. Price charts for the securities referenced in this research report are available at http://pricecharts.baml.com, or call 1-800-MERRILL to have them mailed. In the US, retail sales and/or distribution of this report may be made only in states where these securities are exempt from registration or have been qualified for sale: Xinyi Glass. BofA Merrill Lynch Research Personnel (including the analyst(s) responsible for this report) receive compensation based upon, among other factors, the overall profitability of Bank of America Corporation, including profits derived from investment banking. The analyst(s) responsible for this report may also receive compensation based upon, among other factors, the overall profitability of the Bank’s sales and trading businesses relating to the class of securities or financial instruments for which such analyst is responsible.
Other Important Disclosures From time to time research analysts conduct site visits of covered issuers. BofA Merrill Lynch policies prohibit research analysts from accepting payment or reimbursement for travel expenses from the issuer for such visits. Prices are indicative and for information purposes only. Except as otherwise stated in the report, for the purpose of any recommendation in relation to: (i) an equity security, the price referenced is the publicly traded price of the security as of close of business on the day prior to the date of the report or, if the report is published during intraday trading, the price referenced is indicative of the traded price as of the date and time of the report; or (ii) a debt security (including equity preferred and CDS), prices are indicative as of the date and time of the report and are from various sources including Bank of America Merrill Lynch trading desks. The date and time of completion of the production of any recommendation in this report shall be the date and time of dissemination of this report as recorded in the report timestamp. Officers of MLPF&S or one or more of its affiliates (other than research analysts) may have a financial interest in securities of the issuer(s) or in related investments. BofA Merrill Lynch Global Research policies relating to conflicts of interest are described at http://go.bofa.com/coi. "BofA Merrill Lynch" includes Merrill Lynch, Pierce, Fenner & Smith Incorporated ("MLPF&S") and its affiliates. Investors should contact their BofA Merrill Lynch representative or Merrill Lynch Global Wealth Management financial advisor if they have questions concerning this report. "BofA Merrill Lynch" and "Merrill Lynch" are each global brands for BofA Merrill Lynch Global Research. Information relating to Non-US affiliates of BofA Merrill Lynch and Distribution of Affiliate Research Reports: MLPF&S distributes, or may in the future distribute, research reports of the following non-US affiliates in the US (short name: legal name, regulator): Merrill Lynch (South Africa): Merrill Lynch South Africa (Pty) Ltd., regulated by The Financial Service Board; MLI (UK): Merrill Lynch International, regulated by the Financial Conduct Authority (FCA) and the Prudential Regulation Authority (PRA); Merrill Lynch (Australia): Merrill Lynch Equities (Australia) Limited, regulated by the Australian Securities and Investments Commission; Merrill Lynch (Hong Kong): Merrill Lynch (Asia Pacific) Limited, regulated by the Hong Kong Securities and Futures Commission (HKSFC); Merrill Lynch (Singapore): Merrill Lynch (Singapore) Pte Ltd, regulated by the Monetary Authority of Singapore (MAS); Merrill Lynch (Canada): Merrill Lynch Canada Inc, regulated by the Investment Industry Regulatory Organization of Canada; Merrill Lynch (Mexico): Merrill Lynch Mexico, SA de CV, Casa de Bolsa, regulated by the Comisión Nacional Bancaria y de Valores; Merrill Lynch (Argentina): Merrill Lynch Argentina SA, regulated by Comisión Nacional de Valores; Merrill Lynch (Japan): Merrill Lynch Japan Securities Co., Ltd., regulated by the Financial Services Agency; Merrill Lynch (Seoul): Merrill Lynch International Incorporated (Seoul Branch) regulated by the Financial Supervisory Service; Merrill Lynch (Taiwan): Merrill Lynch Securities (Taiwan) Ltd., regulated by the Securities and Futures Bureau; DSP Merrill Lynch (India): DSP Merrill Lynch Limited, regulated by the Securities and Exchange Board of India; Merrill Lynch (Indonesia): PT Merrill Lynch Sekuritas Indonesia, regulated by Otoritas Jasa Keuangan (OJK); Merrill Lynch (Israel): Merrill Lynch Israel Limited, regulated by Israel Securities Authority; Merrill Lynch (Russia): OOO Merrill Lynch Securities, Moscow, regulated by the Central Bank of the Russian Federation; Merrill Lynch (DIFC): Merrill Lynch International (DIFC Branch), regulated by the Dubai Financial Services Authority (DFSA); Merrill Lynch (Spain): Merrill Lynch Capital Markets Espana, S.A.S.V., regulated by Comisión Nacional del Mercado De Valores; Merrill Lynch (Brazil): Bank of America Merrill Lynch Banco Multiplo S.A., regulated by Comissão de Valores Mobiliários; Merrill Lynch KSA Company, Merrill Lynch Kingdom of Saudi Arabia Company, regulated by the Capital Market Authority. This research report: has been approved for publication and is distributed in the United Kingdom (UK) to professional clients and eligible counterparties (as each is defined in the rules of the FCA and the PRA) by MLI (UK) and Bank of America Merrill Lynch International Limited, which are authorized by the PRA and regulated by the FCA and the PRA, and is distributed in the UK to retail clients (as defined in the rules of the FCA and the PRA) by Merrill Lynch International Bank Limited, London Branch, which is authorized by the Central Bank of Ireland and subject to
Xinyi Glass | 03 November 2017 39
limited regulation by the FCA and PRA - details about the extent of our regulation by the FCA and PRA are available from us on request; has been considered and distributed in Japan by Merrill Lynch (Japan), a registered securities dealer under the Financial Instruments and Exchange Act in Japan; is issued and distributed in Hong Kong by Merrill Lynch (Hong Kong) which is regulated by HKSFC is issued and distributed in Taiwan by Merrill Lynch (Taiwan); is issued and distributed in India by DSP Merrill Lynch (India); and is issued and distributed in Singapore to institutional investors and/or accredited investors (each as defined under the Financial Advisers Regulations) by Merrill Lynch International Bank Limited (Merchant Bank) (MLIBLMB) and Merrill Lynch (Singapore) (Company Registration Nos F 06872E and 198602883D respectively). MLIBLMB and Merrill Lynch (Singapore) are regulated by MAS. Bank of America N.A., Australian Branch (ARBN 064 874 531), AFS License 412901 (BANA Australia) and Merrill Lynch Equities (Australia) Limited (ABN 65 006 276 795), AFS License 235132 (MLEA) distribute this report in Australia only to 'Wholesale' clients as defined by s.761G of the Corporations Act 2001. With the exception of BANA Australia, neither MLEA nor any of its affiliates involved in preparing this research report is an Authorised Deposit-Taking Institution under the Banking Act 1959 nor regulated by the Australian Prudential Regulation Authority. No approval is required for publication or distribution of this report in Brazil and its local distribution is by Merrill Lynch (Brazil) in accordance with applicable regulations. Merrill Lynch (DIFC) is authorized and regulated by the DFSA. Research reports prepared and issued by Merrill Lynch (DIFC) are done so in accordance with the requirements of the DFSA conduct of business rules. Bank of America Merrill Lynch International Limited, Frankfurt Branch (BAMLI Frankfurt) distributes this report in Germany and is regulated by BaFin. This research report has been prepared and issued by MLPF&S and/or one or more of its non-US affiliates. MLPF&S is the distributor of this research report in the US and accepts full responsibility for research reports of its non-US affiliates distributed to MLPF&S clients in the US. Any US person receiving this research report and wishing to effect any transaction in any security discussed in the report should do so through MLPF&S and not such foreign affiliates. Hong Kong recipients of this research report should contact Merrill Lynch (Asia Pacific) Limited in respect of any matters relating to dealing in securities or provision of specific advice on securities or any other matters arising from, or in connection with, this report. Singapore recipients of this research report should contact Merrill Lynch International Bank Limited (Merchant Bank) and/or Merrill Lynch (Singapore) Pte Ltd in respect of any matters arising from, or in connection with, this research report. General Investment Related Disclosures: Taiwan Readers: Neither the information nor any opinion expressed herein constitutes an offer or a solicitation of an offer to transact in any securities or other financial instrument. No part of this report may be used or reproduced or quoted in any manner whatsoever in Taiwan by the press or any other person without the express written consent of BofA Merrill Lynch. This research report provides general information only, and has been prepared for, and is intended for general distribution to, BofA Merrill Lynch clients. Neither the information nor any opinion expressed constitutes an offer or an invitation to make an offer, to buy or sell any securities or other financial instrument or any derivative related to such securities or instruments (e.g., options, futures, warrants, and contracts for differences). This report is not intended to provide personal investment advice and it does not take into account the specific investment objectives, financial situation and the particular needs of, and is not directed to, any specific person(s). This report and its content do not constitute, and should not be considered to constitute, investment advice for purposes of ERISA, the US tax code, the Investment Advisers Act or otherwise. Investors should seek financial advice regarding the appropriateness of investing in financial instruments and implementing investment strategies discussed or recommended in this report and should understand that statements regarding future prospects may not be realized. Any decision to purchase or subscribe for securities in any offering must be based solely on existing public information on such security or the information in the prospectus or other offering document issued in connection with such offering, and not on this report. Securities and other financial instruments discussed in this report, or recommended, offered or sold by Merrill Lynch, are not insured by the Federal Deposit Insurance Corporation and are not deposits or other obligations of any insured depository institution (including, Bank of America, N.A.). Investments in general and, derivatives, in particular, involve numerous risks, including, among others, market risk, counterparty default risk and liquidity risk. No security, financial instrument or derivative is suitable for all investors. In some cases, securities and other financial instruments may be difficult to value or sell and reliable information about the value or risks related to the security or financial instrument may be difficult to obtain. Investors should note that income from such securities and other financial instruments, if any, may fluctuate and that price or value of such securities and instruments may rise or fall and, in some cases, investors may lose their entire principal investment. Past performance is not necessarily a guide to future performance. Levels and basis for taxation may change. This report may contain a short-term trading idea or recommendation, which highlights a specific near-term catalyst or event impacting the issuer or the market that is anticipated to have a short-term price impact on the equity securities of the issuer. Short-term trading ideas and recommendations are different from and do not affect a stock's fundamental equity rating, which reflects both a longer term total return expectation and attractiveness for investment relative to other stocks within its Coverage Cluster. Short-term trading ideas and recommendations may be more or less positive than a stock's fundamental equity rating. BofA Merrill Lynch is aware that the implementation of the ideas expressed in this report may depend upon an investor's ability to "short" securities or other financial instruments and that such action may be limited by regulations prohibiting or restricting "shortselling" in many jurisdictions. Investors are urged to seek advice regarding the applicability of such regulations prior to executing any short idea contained in this report. Foreign currency rates of exchange may adversely affect the value, price or income of any security or financial instrument mentioned in this report. Investors in such securities and instruments, including ADRs, effectively assume currency risk. UK Readers: The protections provided by the U.K. regulatory regime, including the Financial Services Scheme, do not apply in general to business coordinated by BofA Merrill Lynch entities located outside of the United Kingdom. BofA Merrill Lynch Global Research policies relating to conflicts of interest are described at http://go.bofa.com/coi. MLPF&S or one of its affiliates is a regular issuer of traded financial instruments linked to securities that may have been recommended in this report. MLPF&S or one of its affiliates may, at any time, hold a trading position (long or short) in the securities and financial instruments discussed in this report. BofA Merrill Lynch, through business units other than BofA Merrill Lynch Global Research, may have issued and may in the future issue trading ideas or recommendations that are inconsistent with, and reach different conclusions from, the information presented in this report. Such ideas or recommendations reflect the different time frames, assumptions, views and analytical methods of the persons who prepared them, and BofA Merrill Lynch is under no obligation to ensure that such other trading ideas or recommendations are brought to the attention of any recipient of this report. In the event that the recipient received this report pursuant to a contract between the recipient and MLPF&S for the provision of research services for a separate fee, and in connection therewith MLPF&S may be deemed to be acting as an investment adviser, such status relates, if at all, solely to the person with whom MLPF&S has contracted directly and does not extend beyond the delivery of this report (unless otherwise agreed specifically in writing by MLPF&S). If such recipient uses the services of MLPF&S in connection with the sale or purchase of a security referred to herein, MLPF&S may act as principal for its own account or as agent for another person. MLPF&S is and continues to act solely as a broker-dealer in connection with the execution of any transactions, including transactions in any securities mentioned in this report. Copyright and General Information regarding Research Reports: Copyright 2017 Bank of America Corporation. All rights reserved. iQmethod, iQmethod 2.0, iQprofile, iQtoolkit, iQworks are service marks of Bank of America Corporation. iQanalytics®, iQcustom®, iQdatabase® are registered service marks of Bank of America Corporation. This research report is prepared for the use of BofA Merrill Lynch clients and may not be redistributed, retransmitted or disclosed, in whole or in part, or in any form or manner, without the express written consent of BofA Merrill Lynch. BofA Merrill Lynch Global Research reports are distributed simultaneously to internal and client websites and other portals by BofA Merrill Lynch and are not publicly-available materials. Any unauthorized use or disclosure is prohibited. Receipt and review of this research report constitutes your agreement not to redistribute, retransmit, or disclose to others the contents, opinions, conclusion, or information contained in this report (including any investment recommendations, estimates or price targets) without first obtaining expressed permission from an authorized officer of BofA Merrill Lynch. Materials prepared by BofA Merrill Lynch Global Research personnel are based on public information. Facts and views presented in this material have not been reviewed by, and may not reflect information known to, professionals in other business areas of BofA Merrill Lynch, including investment banking personnel. BofA Merrill Lynch has established information barriers between BofA Merrill Lynch Global Research and certain business groups. As a result, BofA Merrill Lynch does not disclose certain client relationships with, or compensation received from, such issuers in research reports. To the extent this report discusses any legal proceeding or issues, it has not been prepared as nor is it intended to express any legal conclusion, opinion or advice. Investors should consult their own legal advisers as to issues of law relating to the subject matter of this report. BofA Merrill Lynch Global Research personnel’s knowledge of legal proceedings in which any BofA Merrill Lynch entity and/or its directors, officers and employees may be plaintiffs, defendants, co-defendants or co-plaintiffs with or involving issuers mentioned in this report is based on public information. Facts and views presented in this material that relate to any such proceedings have not been reviewed by, discussed with, and may not reflect information known to, professionals in other business areas of BofA Merrill Lynch in connection with the legal proceedings or matters relevant to such proceedings. This report has been prepared independently of any issuer of securities mentioned herein and not in connection with any proposed offering of securities or as agent of any issuer of any securities. None of MLPF&S, any of its affiliates or their research analysts has any authority whatsoever to make any representation or warranty on behalf of the issuer(s). BofA Merrill Lynch Global Research policy prohibits research personnel from disclosing a recommendation, investment rating, or investment thesis for review by an issuer prior to the publication of a research report containing such rating, recommendation or investment thesis. Any information relating to the tax status of financial instruments discussed herein is not intended to provide tax advice or to be used by anyone to provide tax advice. Investors are urged to seek tax advice based on their particular circumstances from an independent tax professional.
40 Xinyi Glass | 03 November 2017
The information herein (other than disclosure information relating to BofA Merrill Lynch and its affiliates) was obtained from various sources and we do not guarantee its accuracy. This report may contain links to third-party websites. BofA Merrill Lynch is not responsible for the content of any third-party website or any linked content contained in a third-party website. Content contained on such third-party websites is not part of this report and is not incorporated by reference into this report. The inclusion of a link in this report does not imply any endorsement by or any affiliation with BofA Merrill Lynch. Access to any third-party website is at your own risk, and you should always review the terms and privacy policies at third-party websites before submitting any personal information to them. BofA Merrill Lynch is not responsible for such terms and privacy policies and expressly disclaims any liability for them. Subject to the quiet period applicable under laws of the various jurisdictions in which we distribute research reports and other legal and BofA Merrill Lynch policy-related restrictions on the publication of research reports, fundamental equity reports are produced on a regular basis as necessary to keep the investment recommendation current. Certain outstanding reports may contain discussions and/or investment opinions relating to securities, financial instruments and/or issuers that are no longer current. Always refer to the most recent research report relating to an issuer prior to making an investment decision. In some cases, an issuer may be classified as Restricted or may be Under Review or Extended Review. In each case, investors should consider any investment opinion relating to such issuer (or its security and/or financial instruments) to be suspended or withdrawn and should not rely on the analyses and investment opinion(s) pertaining to such issuer (or its securities and/or financial instruments) nor should the analyses or opinion(s) be considered a solicitation of any kind. Sales persons and financial advisors affiliated with MLPF&S or any of its affiliates may not solicit purchases of securities or financial instruments that are Restricted or Under Review and may only solicit securities under Extended Review in accordance with firm policies. Neither BofA Merrill Lynch nor any officer or employee of BofA Merrill Lynch accepts any liability whatsoever for any direct, indirect or consequential damages or losses arising from any use of this report or its contents.