initiating coverage march 8, 2017 rating matrix trent ltd...
TRANSCRIPT

March 8, 2017
ICICI Securities Ltd | Retail Equity Research
Renewed focus on accelerated rack expansion! Trent, a leading retailer with a presence across various consumer categories, is gearing up for rapid growth driven by aggressive store addition. Accelerated store addition in the Westside format, reduction of losses in Landmark would lead to improved margins in the standalone business. Restructuring Star Bazaar store formats to smaller sizes coupled with consistent growth in Zara are further expected to accelerate Trent’s consolidated financial performance. Execution of its strategy would position Trent at an inflection point, resulting in revenue, EBITDA CAGR of 24%, 40%, respectively, in FY16-19E. We initiate coverage on the stock with a BUY recommendation. Ramp-up in store additions to accelerate future growth… Trent has charted an aggressive store addition strategy wherein it is expected to accelerate store additions under Westside banner. With 95 stores as on FY16, Westside is expected to be scaled up to 144 stores in FY19E. Furthermore, change in strategy to focus on small format stores (SFOs) (3500-10000 sq ft) under Star banner would result in higher SFOs across multiple locations/geographies. The strategy is expected to lead to additional area coverage of 2.2 mn sq ft (20% CAGR) in FY16-19E. Subsequently, consolidated number of stores in our estimated period is expected to grow at 26% CAGR (vs. earlier 11% in FY10-16) to 286 stores. Inclusive growth, Landmark restructuring to bode well for margins… The standalone business, which contributes 65% of consolidated revenue mainly including Westside, is expected to continue on its high growth phase aided by accelerated store addition. Subsequently, we expect standalone revenues to grow at 19% CAGR to | 2545 crore in FY16-19E. High proportion of private fashion labels in Westside coupled with closure/restructuring of Landmark stores is expected to result in a 300 bps margin expansion in standalone business, resulting in EBITDA, PAT growing at a CAGR of 30% each. Aggressive SFOs would lead Trent Hypermarket’s revenue momentum, which is expected to grow at 35% CAGR in FY16-19E with losses narrowing down to break-even levels. Zara, the fast fashion brand, is expected to leverage on improving discretionary spending and facilitate higher like-to-like sales growth with 25% CAGR each for revenue and PAT. Strong franchise, consistent LTL growth; strong case for BUY… Expansion of high RoCE Westside stores, closure of loss making Landmark stores and rightsizing of Star would significantly improve the financial performance of Trent. High quality franchisee and strong control over product, price and point of sale comfort our LTL assumptions and growth estimates. We value Westside, Star, Zara at 2.5x, 1x, 2.7x EV/sales, respectively, arriving at a target price of | 290 with BUY rating.
Exhibit 1: Financial Performance (|Crore) FY15 FY16 FY17E FY18E FY19E
Net Sales 2284 2397 3141 3832 4557
EBITDA 72 137 250 324 397
EBITDA Margin (%) 3.2 5.7 8.0 8.4 8.7
Net Profit 129.6 65.5 141.9 183.2 238.9
Net Profit Margin (%) 5.7 2.7 4.5 4.8 5.2
EPS (|) (annualised) 39.0 1.9 4.3 5.5 7.2
ROCE(%) 12.4 7.7 15.0 18.0 20.3
ROE(%) 9.1 4.5 10.1 12.4 14.4
Source: Company, ICICIdirect.com Research
Trent Ltd (TRENT)| 240
Rating Matrix
Rating : BuyTarget : | 290Target Period : 12 monthsPotential Upside : 21%
YoY Growth (%)
(| Crore) FY16 FY17E FY18E FY19E
Net Sales 2,397 3,141 3,832 4,557
EBITDA 137 250 324 397 Net Profit 65 142 183 239
EPS (|) 1.9 4.3 5.5 7.2
Valuation Summary FY16 FY17E FY18E FY19E
EV/Sales 3.5 2.6 2.2 1.8
Target EV/Sales 4.2 3.1 2.6 2.1
EV / EBITDA 61.9 33.1 25.7 20.7
P/BV 5.7 5.8 5.5 4.9
RoNW (%) 4.5 10.1 12.4 14.4
RoCE (%) 7.7 15.0 18.0 20.3
Stock Data
Particular Amount
Market Capitalisation (| Crore) 8,200.0 Total Debt (Mar-16) (| Crore) 391.5
Cash and Investment (Mar-16) (| Crore) 63.0 EV (| Crore) 8,528.5
52 week H/L (adjusted) 270 / 140 Equity Capital (| Crore) 33.2
Face Value (|) 1.0 MF Holding (%) 12.2
FII Holding (%) 29.8
Comparative return matrix (%) 1M 3M 6M 12M
Trent -1.0 22.5 1.2 60.5Shoppers St. 10.9 10.2 -16.8 -3.4Aditya Bir. Fas. 2.4 10.2 -0.3 0.4
Price movement
0
50
100
150
200
250
300
Mar-17Jul-16Dec-15May-15Sep-14Feb-14
2,0003,0004,0005,0006,0007,0008,0009,000
10,000
Price (R.H.S) Nifty (L.H.S)
Research Analysts
Bharat Chhoda [email protected]
Ankit Panchmatia [email protected]
Cheragh Sidhwa [email protected]
Initiating Coverage

Page 2ICICI Securities Ltd | Retail Equity Research
Company background Trent is a leading organised retail player in India operating various chains of stores like Westside, Star Bazaar (JV), Landmark and Zara (JV). Trent, incorporated in 1998, operates 144 stores as on FY16, generating a consolidated operating income of ~| 2397 crore.
Exhibit 2: Trent story: Fashioned to succeed
Source: Company, ICICIdirect.com Research
Westside Westside is the biggest contributor to Trent’s overall business. It offers a wide array of assorted merchandise, including apparel, footwear, cosmetics, perfumes, home furnishing & accessories. Westside’s sourcing/store model includes active control across the business value chain. The activities span right from design to shelf, with intermediary activities like branding, sourcing, logistics, distribution, pricing, display and promotion. Trent primarily focuses on private labels targeting mid to premium end customers. Almost 90% of its total revenues accrue from higher margin private label brands, the highest in the industry. Subsequently, in-house exclusive brand apparels contribute 80% of its total revenues. This business model has a proven track record with healthy like-to-like (LTL) sales growth of >6% over the past five years. As on FY16, Westside operates 93 stores across 58 cities in India.
Exhibit 3: Trent business model break-up (FY16)
Source: Company, ICICIdirect.com Research
1997 Tata sells Lakme to Unilever &
acquires Littlewoods
1998 Launches first Westside
store in Bangalore2005 Trent acquires76% stake in Landmark
2008 Tesco enters India in cash & carry business & Ties-up with Star Bazaar
2009 Trent & Inditex formJV to bring Zara to India
2014 Trent & Tesco enter in a 50:50 JV for Trent Hypermarket Ltd
2004 Opens first Star Bazaar Store in Ahmedabad
Shareholding pattern
(in %) Dec-15 Mar-16 Jun-16 Sep-16 Dec-16Promoter 32.6 32.6 32.6 32.6 32.6FII 20.2 23.7 25.7 27.1 29.8DII 22.1 19.1 17.3 15.5 12.1Others 25.0 24.6 24.4 24.8 25.5
FII & DII holding trend (%)
42.4 42.8 43.0 42.641.9
35.0
40.0
45.0
Q3FY16 Q4FY16 Q1FY17 Q2FY17 Q3FY17FII & DII Holding

Page 3ICICI Securities Ltd | Retail Equity Research
Alongside the Westside product offering, the stores also offer gourmet food under the banner “Gourmet West”, which operates across 10 key Westside stores through a shop-in-shop (SIS) format. Besides a unique shopping experience, through Gourmet West, Westside aims to offer a premium food & beverages experience. Hence, the one-stop solution for shopping requirements enables Westside to get higher walk-ins and loyal members.
Exhibit 4: Walk-ins grow at CAGR of 4% in FY12-16
20.36 20.16
24.33 24.57 25.15
0
5
10
15
20
25
30
FY12 FY13 FY14 FY15 FY16
(No.
in m
n)
Walkins
Source: Company, ICICIdirect.com Research
Exhibit 5: Clubwest members grow at CAGR of 19% in FY12-16
1.39 1.47 1.53
2.11
2.76
0
0.5
1
1.5
2
2.5
3
FY12 FY13 FY14 FY15 FY16
(No.
in m
n)
Clubwest members
Source: Company, ICICIdirect.com Research
With a presence across major cities like Mumbai, Ahmedabad, Bangalore, Baroda, Hyderabad, Chandigarh and Surat, Westside continues to remain a preferred shopping destination for a majority of the urban population. Landmark Landmark is in the business of retailing books, music, stationery, games, toys, etc. The chain earlier focused on books and music. It was acquired by Trent in 2005. Since then, it has evolved into an entertainment format offering an additional range of products including toys and sports merchandise. However, over a period of time, due to a muted performance, it had gone through a significant restructuring process, including rationalisation of the stores portfolio. As on FY16, its total store count was five, a substantial reduction from 26 in FY11.
Fiora Hypermarket (FHL) FHL is a subsidiary company of Westside, comprising two stores of Star Bazaar in Gujarat and Tamil Nadu. It was separated from Trent Hypermarket (THL) to adhere to the approved FDI guidelines in India. FHL also pursues a grocery online portal www.my247market.com, on a limited trial basis, to explore the online grocery retailing opportunity in the proximity of select Star banner stores. Star Bazaar Star Bazaar is the hypermarket and convenience store chain of Trent Ltd focusing on categories like groceries, foods, home care, apparel, home décor, health and beauty products. Trent Hypermarket (THL) operates in a 50:50 JV between Trent Ltd & Tesco Plc UK. Recently, it started rolling out a new version of compact supermarket & neighbourhood Star Banner stores of various sizes like Star Market and Star Daily. As on FY16, Trent Hypermarket operated 26 Star banner stores in India, concentrated in states of Mumbai, Pune and Bangalore.
Zara Zara is a leading global Spanish fashion apparel brand, focusing on customers at the premium end. Trent operates Zara stores in a joint venture (JV) with the Inditex group of Spain with a shareholding of: Inditex - 51% and Trent - 49%. As on FY16, the JV operated 18 stores across top cities in India. Trent also has a JV with Inditex for the brand Massimo Dutti, a sister brand of Zara. For FY16, Massimo Dutti commenced operations with its maiden store in Delhi.

Page 4ICICI Securities Ltd | Retail Equity Research
Investment Rationale Accelerated store addition to aid future consolidated growth… Consolidated revenues are expected to grow at 24% CAGR over FY16-19E to | 4557 crore compared to its historical average growth of 14% in FY10-16. Store expansion under Westside is expected to contribute the most to revenue growth. Moreover, Zara, which focuses on high value fashion, is expected to generate higher LTL (>15%) resulting in revenue CAGR of 24% to | 820 crore. Albeit on a lower base, THL’s enhanced coverage across cities with new small format stores would treble its revenues to | 1054 crore.
Exhibit 6: Segment wise revenue growth (THL, Trent Inditex numbers as per Trent stake in JV)
936 1209 1358 1501 1851 2185 2546781815 374 395
620833
1054
198284
345431
539
676
820
217171
193127
136
144
144
500100015002000250030003500400045005000
FY13 FY14 FY15 FY16 FY17E FY18E FY19E
| cr
ore
Westside Trent Hypermaket Ltd Trent Inditex Ltd Subsidaries
CAGR
19%
4%
24%
39%
Source: Company, ICICIdirect.com Research
Since inception till FY10, Westside adopted a conservative store addition strategy with store count of 43 by FY10, implying addition of a mere three to four stores per annum. The conservative approach towards store additions evolved around establishing the viability of the retail format in the initial phase with a limited portfolio of stores prior to rapid expansion. Post the initial phase, in the last five years, Westside accelerated the store additions to eight to 10 stores per year with a final tally of 95 stores by FY16. The management now plans to increase its presence in Tier II, III cities through franchise route, which currently comprises ~10% of overall stores. We expect the aggressive store expansion to further accelerate to 144 stores by FY19E. In addition to the same, given the shift of focus from large box Star Bazaar format to medium-small box format stores like Star Daily and Star market, total stores under the Star banner are expected to quadruple to 105 stores by FY19 vs. current 26 store. Zara net store addition is expected at five stores each year. Subsequently, total stores are expected to nearly double (26% CAGR) to 286 stores by FY19E compared to current 144 stores.
Exhibit 7: Store additions to remain robust…
5467 70
80 8595
110127
144
11 15 15 16 10 10 16 196
46
66
115
3 8 9 13 16 181311
26
5 102023
28 33
0
20
40
60
80
100
120
140
160
FY11 FY12 FY13 FY14 FY15 FY16 FY17E FY18E FY19E
Tota
l Sto
res
500
1500
2500
3500
4500
5500
Reve
nue
(|Cr
)
Westside Star Bazaar Star Daily Star Market Zara Revenue
Store addition to pick up with addition of 49 Westside stores FY16-19E
Source: Company, ICICIdirect.com Research

Page 5ICICI Securities Ltd | Retail Equity Research
Newer stores, favourable dynamics to enable better realisations… Westside remains one of the most successful franchises in the apparel retail space. The established store dynamics have enabled Westside to deliver industry best LTL growth of ~10% for three consecutive years. The average area per sq ft for Westside is 20000 sq ft, which yields ~| 7750 per/sq ft. Star Bazaar, which was earlier categorised as hypermarket, having ~50000 sq ft has ventured in small format stores (SFOs) like Star Daily and Star Market encompassing an average area of 3500 sq ft and 10000 sq ft. Zara continues to offer one-stop-shop fashion solutions to the higher-middle and upper class families. Given the size of offerings, Zara’s average store size is expected at 30000 sq ft.
Exhibit 8: Average store size across formats…
20000
50000
3500
10000
30000
0
10000
20000
30000
40000
50000
60000
Westside Star Bazaar Star Daily Star Market Zara
mn
sq.ft
Average store size (FY16)
Renewed focus on store expansion under the
small box format
Source: Company, ICICIdirect.com Research
Exhibit 9: Expected yield per sq ft across store formats…
7777
14946 15300 15000 14957
0
2000
4000
6000
8000
10000
12000
14000
16000
18000
Westside Star Bazaar Star Daily Star Market Zara
mn
sq.ft
Average revenue/sq.ft (FY16)
Source: Company, ICICIdirect.com Research

Page 6ICICI Securities Ltd | Retail Equity Research
Westside – Anchoring consolidated growth… Westside is planning to accelerate store expansion (currently at 95 stores across 58 cities in India) in the coming years by focusing broadly on two formats: flagship stores - the prominent full offer stores and the curated smaller stores in non-metros/emerging micro-markets. Westside would continue to explore strategic properties in Tier I cities. However, the major focus would be on opportunities in Tier II and Tier II markets. We expect additions in the range of 15-20 stores per year for Westside in FY16-19E. Exhibit 10: Westside store additions…
8 7 11 13 7 10 8 10 15 17 17
3643
5467 70
8595
110
127
144
80
0
2
4
6
8
10
12
14
16
18
FY09 FY10 FY11 FY12 FY13 FY14 FY15 FY16 FY17E FY18E FY19E
No.
of s
tore
s
0
20
40
60
80
100
120
140
160
New stores Cumulative new stores
Source: Company, ICICIdirect.com Research
Westside revenues grew at 17% CAGR to | 819 crore during its expansion phase in FY09-12, post which revenues grew at 18.5% CAGR in FY13-16 to | 1478 crore. We expect the recent store addition spree to further accelerate revenues thereby enabling 18% CAGR in FY16-19E to | 2578 crore.
Exhibit 11: Westside revenues trend…
4,557
2397
1045
659
389 67
FY16 Westside Star Bazaar Zara Others Total
| crore
Westside expected to contribute ~50% of the
overall incremental growth
Source: Company, ICICIdirect.com Research

Page 7ICICI Securities Ltd | Retail Equity Research
Consistent LTL growth and bill size – Signs of successful franchisee… Westside is considered to be one of the most successful and established franchises in the women’s wear category. On the one hand, with a consistent improvement in same store sales growth and increase in average transaction size, Westside has shown steady 18% CAGR in revenue in FY10-16. The strategy of conservative store opening has led Westside to post industry best gross margins of ~50% and consistent LTL growth of >8%. Enhanced cross-offerings from higher ticket size categories like footwear, cosmetics, etc, have enabled Westside to improve its same stores sales growth (SSG) and improve average bill size.
Exhibit 12: Westside revenue & LTL growth trend
4354
67 7080 85
9511%
8%
1%
6%
7% 9%11%
0
20
40
60
80
100
FY10 FY11 FY12 FY13 FY14 FY15 FY16
Wes
tsid
e St
ores
0%
2%
4%
6%
8%
10%
12%
Sam
e St
ores
Gro
wth
Westside Same Store sales growth
Source: Company, ICICIdirect.com Research
Exhibit 13: Average bill size increasing at 8% CAGR over FY12-16
1116 12101421
15431701
1860
13618.4 8.6
9.3
12.5
4.4
10.2
0
500
1000
1500
2000
FY10 FY11 FY12 FY13 FY14 FY15 FY16Av
erag
e Tr
ansa
ctio
n Si
ze
0
2
4
6
8
10
12
14
% G
row
th in
ATS
Transaction Size Growth(%)
Source: Company, ICICIdirect.com Research
Westside ahead of curve with focus on private labels Apparel contributes around 80% of overall Westside revenues, comprising exclusively of private labels. Overall 90% of total Westside revenue is from private labels. Since its inception, Westside had formulated a model focusing only on private labels. In-house brands offer higher margins to retailers as they allow them to have complete control across the value chain right from designing merchandise, branding, sourcing, logistics, distribution, promotion, display, fixing price points and retail margins. A higher share of private labels helps retailers combat aggressive discounting by brands. Private labels mainly tend to succeed in categories where shoppers perceive minimal difference between private labels & manufactured brands. Around 15% of overall sales in Westside comprise discounted sales. Apart from this, it also allows them to receive first-hand feedback and get customer response to launch of new trending designer products. Globally, private labels are considered to be relatively less sensitive to economic cycles compared to mainstream brands.
Exhibit 14: Private label share (%) of total sales of leading retailers
90
17
52
70
0102030405060708090
100
Westside Shoppers Stop Pantaloon Reliance Trends
%
Approximate share of private Labels in FY16
Source: Company, ICICIdirect.com Research
For FY16, Trent launched new in-house brands like Wunderlove (lingerie), Sassy Soda (fashion for young curvier woman) and StudioWest (cosmetics)

Page 8ICICI Securities Ltd | Retail Equity Research
Star Bazaar growth to be driven by new compact sized store additions Over the years, THL has been searching for the right strategy, which can be a perfect fit for the Indian food & grocery market. The hypermarket retail segment is a highly capital intensive & low margin business facing huge competition from the unorganised small food & grocery retailers in India. Subsequently, THL is focusing on supermarket model, which entails smaller formats generating higher revenue per sq ft. The company has aggressive expansion plans to reinvent its business model from large format supermarket stores to smaller convenience stores mainly located on high streets, which can help improve its profitability. The new strategy involves aggressive scaling up of small format stores (SFOs) under the banner Star Daily & Star Market with higher focus on smaller cities. The strategy would facilitate higher profitability driven by lower rentals and other operating expenses.
Exhibit 15: Trend in total space with revenue per square feet
0.8 0.8
0.5 0.6
0.8
1.1
1.4
0.5
0.7
0.9
1.1
1.3
1.5
FY13 FY14 FY15 FY16 FY17E FY18E FY19E
4000
8000
12000
16000
20000
Total Space Revenue per Sqft
4 Star Bazaar stores in non FDI approved states of Gujarat & Tamil Nadu were transferred to a FHL Ltd
Source: Company, ICICIdirect.com Research
Exhibit 16: Trend in segment wise stores with total space
15 15 1610 10 13 16 19
611
26
46
66
15
1015
20
0
10
20
30
40
50
60
70
FY12 FY13 FY14 FY15 FY16 FY17E FY18E FY19E
0.5
0.8
1.0
1.3
1.5
(Mn
Sqft)
Star Bazaar Star Daily Star Market Total Space
Higher focus on small box format stores - Star daily and Star market
Source: Company, ICICIdirect.com Research
As the store size reduces, we expect THL’s revenue per square feet (sq ft) to grow marginally by at a CAGR of 2% from current | 14970 to | 15900 in FY19E. However, the growth would be mainly driven by higher number of store openings, which are expected at 105 stores across all formats. Subsequently, THL’s revenues are likely to grow at a CAGR of 35% to | 2200 crore in FY19E. Exhibit 17: THL revenues to grow at CAGR of 35% over FY16-19E
790
991
1244
1507
59142
256375
75153
234318
0
200
400
600
800
1000
1200
1400
1600
FY16 FY17E FY18E FY19E
| cr
ore
Star Bazaar Star Daily Star Market
Source: Company, ICICIdirect.com Research

Page 9ICICI Securities Ltd | Retail Equity Research
Zara - Jewel in crown Zara has been the most consistent retail segment within Trent. Since its inception, its revenue has grown at a CAGR of ~45% in FY11-16, which makes it one of the fastest growing retail companies in India. Zara revenues were at | 880 crore compared to | 156 crore in FY11. Zara stores are completely operated by a separate Inditex team. The incremental store openings for Zara continues to be lower compared to other store formats due to unavailability of high quality retail space. Subsequently, majority of growth is realised through higher LTL growth. Trent plans to target major cities to open a few more Zara stores over the next three to four years. In addition to Zara, Trent in FY16 opened maiden store under the brand of Massimo Dutti.
Exhibit 18: Incremental store expansion…
5
1
4
3
2
5 5 5
0
1
2
3
4
5
6
FY12 FY13 FY14 FY15 FY16 FY17E FY18E FY19EIncremental stores
Source: Company, ICICIdirect.com Research
We estimate store additions of five each over FY16-19E. We also expect LTL growth of 10% for Zara. Consequently, the total number of store as on FY19 would be at 33 in FY19E. This would entail a revenue CAGR of 24% to | 1674 crore in FY16-19E. Exhibit 19: Zara revenue and store expansion
156272
430607
736880
1,100
1,379
1,674
3
8 9
1316
18
23
28
33
0
200
400
600
800
1,000
1,200
1,400
1,600
1,800
FY11 FY12 FY13 FY14 FY15 FY16 FY17E FY18E FY19E
| cr
ore
0
5
10
15
20
25
30
35
Revenues Stores
Source: Company, ICICIdirect.com Research
According to the management, investments in Zara remain a financial investment. This indicates the company’s/JV’s reluctance to enter into a long term strategic commitment. However, the JV in FY16 has launched Massimo Dutti – brand owned by Inditex in India. It plans to further scale them up.

Page 10ICICI Securities Ltd | Retail Equity Research
Restructuring of Landmark to boost standalone margins, going forward…
Landmark revenues, which were at | 75 crore as on FY16 now contributes 5% of overall standalone revenues (3% of the consolidated sales) compared to | 228 crore, 39% of the overall standalone revenues in FY10. Landmark, which was primarily a music & books retail format, had been undergoing constant restructuring due to increased threats from the internet, which resulted in a decline in book sales. The music segment was especially impacted by free digital downloads, which further gained momentum through growth of smart phones. Exhibit 20: Landmark revenue & stores
228250
223200
175
10175 70 60 60
0
50
100
150
200
250
300
FY10 FY11 FY12 FY13 FY14 FY15 FY16 FY17E FY18E FY19E
Reve
nue
(| C
r)
FY10 FY11 FY12 FY13 FY14 FY15 FY16 FY17E FY18E FY19E
Ramp down in revenues following the closure of loss
Source: Company, ICICIdirect.com Research
As the restructuring would take some time to pan out, Landmark revenues are expected to remain flattish at | 60 crore in FY19E.
Key steps undertaken for Landmark restructuring:
A) Reduction in number of stores Landmark’s business model turned unviable due to accumulated losses over a period of time. Subsequently, over the past five years, Trent has been reducing the number of its loss making Landmark stores. The number of stores as on FY16 was at five compared to 27 in FY10. Exhibit 21: Landmark revenue & stores
27 26
19 19
15
6 5 5 4 4
0
5
10
15
20
25
30
FY10 FY11 FY12 FY13 FY14 FY15 FY16 FY17E FY18E FY19E
Reve
nue
(| C
r)
FY10 FY11 FY12 FY13 FY14 FY15 FY16 FY17E FY18E FY19E
Constant reduction in number of loss making
Source: Company, ICICIdirect.com Research
We expect closure of one store over our estimated period of FY16-19E, with the total store count maintained at four stores.

Page 11ICICI Securities Ltd | Retail Equity Research
B) Change in product-mix The refreshed focus has been on reinventing itself to a family home entertainment store with a rejuvenated product mix. The earlier product portfolio, which comprised books, gifts, toys, sports merchandise, stationery & technology gaming products are getting replaced by a new product portfolio, mainly dominated by gifts, toys & games. Landmark will also commence shop-in-shop outlets within Westside stores enabling an enhance retail presence.
Exhibit 22: Product mix in FY11
Gift,Toys & Stationery
38%
Home & Others, 18%
Books, 27%
Music, 5%
Gaming & Sports , 12%
Source: Company, ICICIdirect.com Research
Exhibit 23: Renewed product mix in FY15
Gift,Toys & Stationery, 43%
Home & Others, 12%
Books, 25%
Music, 1%
Gaming & Sports , 19%
Source: Company, ICICIdirect.com Research
At the same time, the change in portfolio focusing on gift, toys and games resulted in improvement of revenue per store from | 8.4 crore in FY10 to | 15 crore in FY16 leading to a better operating performance. Trent has also tied up with Sonae SR, which operates a chain of sports shops in Portugal under the banner Sports Zone. Landmark is expected to offer sports utilities under this banner. Under this partnership, Trent foresees to the open 5 “Sport Zones” by the end of FY17.
C) Merger with Westside for tax benefits and hiving off low margin units Since April 2013, Landmark was merged with the standalone entity. At that point, Landmark had posted a loss of | 38.5 crore. Landmark had accumulated losses of | 72 crore. With a merged entity, standalone business would accrue benefits of loss write-backs. In addition to the same, Landmark has sold its entire stake in its non-core book publishing subsidiary Westland to Amazon, on a slump sale basis, for about | 9.5 crore, valuing the company at | 39.8 crore. Rationalisation of Landmark stores has aided a 400 bps improvement in standalone margins. The restructuring of Landmark would further narrow down losses for the standalone business. Enhanced offerings would enable Landmark to leverage its product portfolio optimally. We believe the focused approach towards weeding out the non-core, loss making business would further improve margins, going ahead, which are expected at 9.5% by FY19 compared to the current 6.2%. Exhibit 24: Standalone margin expansion post restructuring Landmark
5.0
2.2
4.0
6.2
8.99.5 9.7
2.0
4.0
6.0
8.0
10.0
12.0
FY13 FY14 FY15 FY16 FY17E FY18E FY19E
%
Landmark restructuring aiding the standalone margins
Source: Company, ICICIdirect.com Research
Page 12ICICI Securities Ltd | Retail Equity Research
Rising discretionary spend trend to benefit organised retail, including Trent...
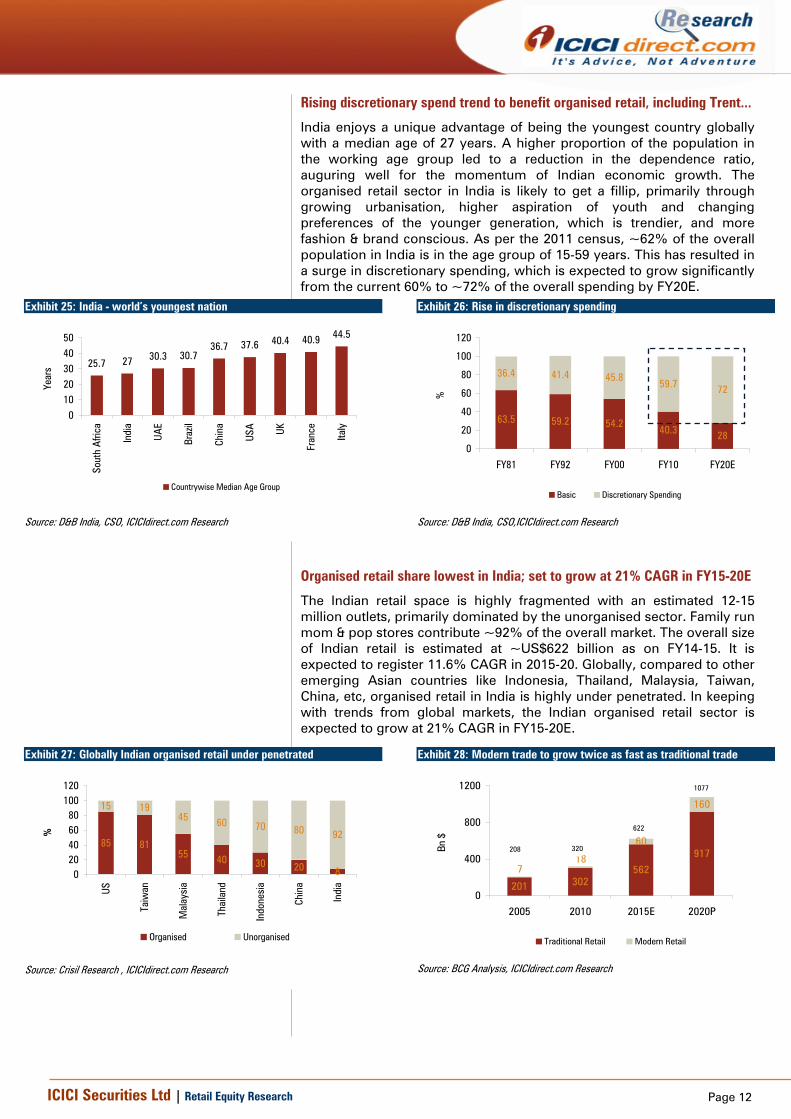
India enjoys a unique advantage of being the youngest country globally with a median age of 27 years. A higher proportion of the population in the working age group led to a reduction in the dependence ratio, auguring well for the momentum of Indian economic growth. The organised retail sector in India is likely to get a fillip, primarily through growing urbanisation, higher aspiration of youth and changing preferences of the younger generation, which is trendier, and more fashion & brand conscious. As per the 2011 census, ~62% of the overall population in India is in the age group of 15-59 years. This has resulted in a surge in discretionary spending, which is expected to grow significantly from the current 60% to ~72% of the overall spending by FY20E.
Exhibit 25: India - world’s youngest nation
25.7 27 30.3 30.736.7 37.6 40.4 40.9 44.5
01020304050
Sout
h Af
rica
Indi
a
UAE
Braz
il
Chin
a
USA
UK
Fran
ce
Italy
Year
s
Countrywise Median Age Group
Source: D&B India, CSO, ICICIdirect.com Research
Exhibit 26: Rise in discretionary spending
63.5 59.2 54.240.3 28
36.4 41.4 45.859.7 72
0
20
40
60
80
100
120
FY81 FY92 FY00 FY10 FY20E
%
Basic Discretionary Spending
Source: D&B India, CSO,ICICIdirect.com Research
Organised retail share lowest in India; set to grow at 21% CAGR in FY15-20E
The Indian retail space is highly fragmented with an estimated 12-15 million outlets, primarily dominated by the unorganised sector. Family run mom & pop stores contribute ~92% of the overall market. The overall size of Indian retail is estimated at ~US$622 billion as on FY14-15. It is expected to register 11.6% CAGR in 2015-20. Globally, compared to other emerging Asian countries like Indonesia, Thailand, Malaysia, Taiwan, China, etc, organised retail in India is highly under penetrated. In keeping with trends from global markets, the Indian organised retail sector is expected to grow at 21% CAGR in FY15-20E.
Exhibit 27: Globally Indian organised retail under penetrated
85 8155 40 30 20 8
15 1945 60 70 80 92
020406080
100120
US
Taiw
an
Mal
aysi
a
Thai
land
Indo
nesi
a
Chin
a
Indi
a
%
Organised Unorganised
Source: Crisil Research , ICICIdirect.com Research
Exhibit 28: Modern trade to grow twice as fast as traditional trade
201 302562
91760
160
718
0
400
800
1200
2005 2010 2015E 2020P
Bn $
Traditional Retail Modern Retail
1077
622
320208
Source: BCG Analysis, ICICIdirect.com Research

Page 13ICICI Securities Ltd | Retail Equity Research
Consumption expenditure of the lower income bracket, which comprises 50% of total consumption, is significantly skewed towards food and beverages. As per industry estimates, 69% of India’s population live in rural areas and contribute 54% of total retail consumption. Exhibit 29: Changing pattern of Indian consumption priorities
6.6 7.7 6.7 5.813.8 11.6 9.7 8
19.3 19.8 21.6 23.1
4032.6 27.2 22.3
8.915.7 20.7 25.1
3 3.2 3.7 4.25 4.8 5.6 6.53.4 4.6 4.8 5
0
20
40
60
80
100
FY05 FY10 FY15 FY20E
Misc. Goods & Services
Food,beverage & Tobbaco
Transport & Communication
Gross Rent,Fuel & Power
Clothing & Footwear
Furniture,Furnishings, Appliances& Services
Medical Care & Health Services
Recreation,Educational & CulturalServices
Source: CSO, D&B, ICICIdirect.com Research
The share of spending in basic discretionary goods like food & beverages is expected to decline substantially to 22.3% in FY20E from 27.2% as on FY15. In contrast, although clothing and footwear are expected to remain at similar levels, the shift from unorganised to organised segment is expected to lead to massive growth across the consumption basket.
Organised apparel market growth on strong footing Consumers in India are traditionally value driven. Hence, buyer’s interest in branded goods comprised a minor proportion of the overall market. Over the years, a rapid transformation is visible in the buying pattern and behaviour of Indian consumers. This has eventuated from the changing attitudes of Indian consumers, which are mainly driven by rising aspiration for branded products among youth. Strong penetration and the influence of visual media have led to a change in clothing trends in rural areas that have begun catching up with urban consumers. The share of the organised apparel market is expected to reach $45 billion (38% of the overall market of $116 billion) by FY25E vs. the current share of 20% of the overall apparel market of $50 billion.
Exhibit 30: Apparel market expected to grow at 9.9% CAGR in FY14-25E
4254.4
79.4
115.8
020
4060
80100
120140
2014 2017 2021 2025
USD(
Bn)
Indian Apparel Market (USD Bn)
Source: Company, ICICIdirect.com Research
Exhibit 31: Organised apparel segment to grow at 16.9% CAGR (FY14-25E)
8 11.220.7
44.7
32.838.4
51.6
71.1
01020304050607080
2014 2016 2020 2025
USD(
Bn)
Organised Apparel Market Unorganised Apparel Market
Source: Images Year Book 2014, ICICIdirect.com Research
Page 14ICICI Securities Ltd | Retail Equity Research
Financials Consolidated revenues likely to grow at 24% CAGR in FY16-19E Westside, which has gross margins >50%, is expected to lead the consolidated growth. Higher share of private labels coupled with revenue per square feet (sq ft) of ~| 8000 enables the stores to break-even faster at EBITDA levels. Better LTL growth in Zara coupled with higher store openings in Star would provide inclusive growth in Trent revenues. Consolidated revenues, driven by enhanced retail footprint on the back of renewed focus on store expansion, are expected to grow at average growth rate of 24% in FY16-19E to | 4557 crore compared to | 2397 crore in FY16.
Exhibit 32: Revenue to grow at 25% CAGR in FY15-19E…
21322333 2284 2397
3141
3832
4557
0
500
1000
1500
2000
2500
3000
3500
4000
4500
5000
FY13 FY14 FY15 FY16 FY17E FY18E FY19E
| cr
ore
Revenues
Source: Company, ICICIdirect.com Research
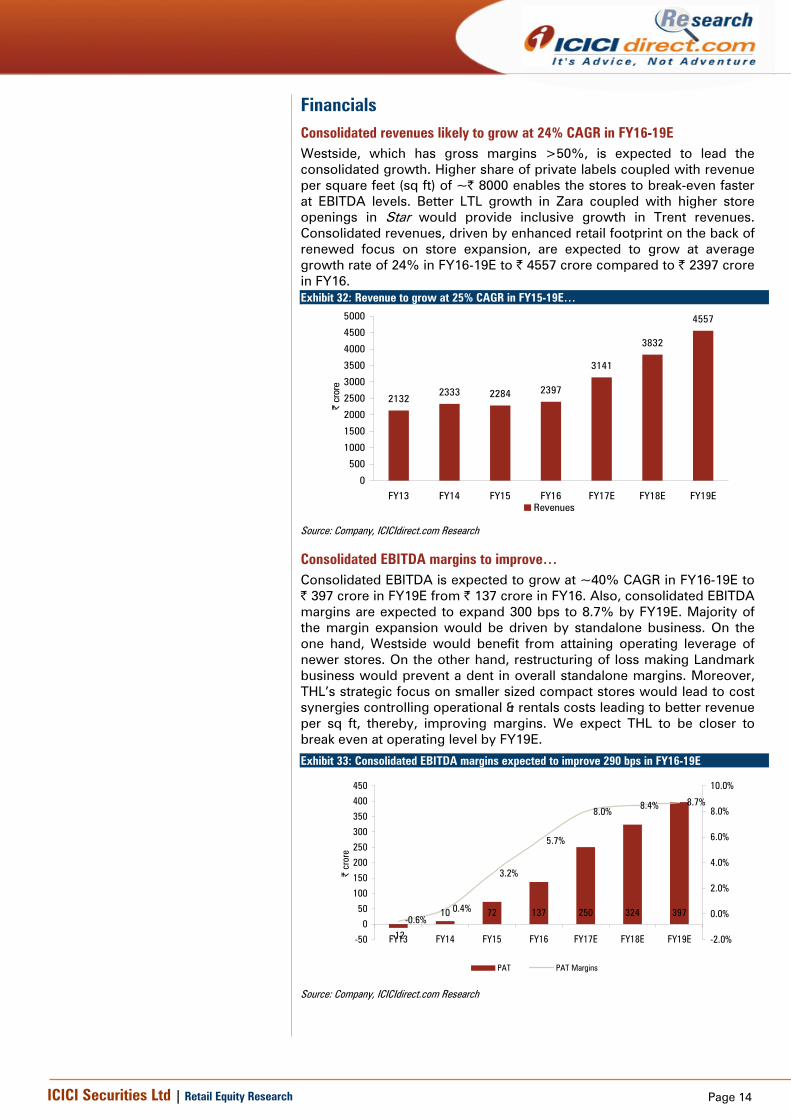
Consolidated EBITDA margins to improve… Consolidated EBITDA is expected to grow at ~40% CAGR in FY16-19E to | 397 crore in FY19E from | 137 crore in FY16. Also, consolidated EBITDA margins are expected to expand 300 bps to 8.7% by FY19E. Majority of the margin expansion would be driven by standalone business. On the one hand, Westside would benefit from attaining operating leverage of newer stores. On the other hand, restructuring of loss making Landmark business would prevent a dent in overall standalone margins. Moreover, THL’s strategic focus on smaller sized compact stores would lead to cost synergies controlling operational & rentals costs leading to better revenue per sq ft, thereby, improving margins. We expect THL to be closer to break even at operating level by FY19E.
Exhibit 33: Consolidated EBITDA margins expected to improve 290 bps in FY16-19E
10 72 137 250 324 397
-12
0.4%
3.2%
5.7%
8.0%8.4% 8.7%
-0.6%
-50
0
50
100
150
200
250
300
350
400
450
FY13 FY14 FY15 FY16 FY17E FY18E FY19E
| cr
ore
-2.0%
0.0%
2.0%
4.0%
6.0%
8.0%
10.0%
PAT PAT Margins
Source: Company, ICICIdirect.com Research

Page 15ICICI Securities Ltd | Retail Equity Research
PAT growth driven by better operating performance Consolidated PAT of Trent is expected to reach ~| 239 crore by FY19E from | 65 crore (excluding exceptional income) in FY16. Westside and Star are likely play a key role in propelling the overall profitability of Trent Ltd. Margin expansion on the back of renewed focus on aggressive store addition, along with change in product mix would propel the store profitability deriving better synergies per square feet. Exhibit 34: Consolidated PAT & PAT margins
130
65
142
183
239
-38 -18
-1.8%-0.8%
5.7%
2.7%
4.5% 4.8%5.2%
-50
0
50
100
150
200
250
300
FY13 FY14 FY15 FY16 FY17E FY18E FY19E
| cr
ore
-2.0%
0.0%
2.0%
4.0%
6.0%
8.0%
PAT PAT Margins
Source: Company, ICICIdirect.com Research
Return ratio expected to ramp up on improving financials An improved operational performance would lead to higher free cash flows, assisting expansion plans through internal accruals. In addition to the same, adopting the asset light model for expansion through franchisee route would further aid the expansion in return ratios. Higher emphasis on small box format stores would yield superior revenue per square feet for Trent. We expect return ratios RoE, RoCE to more than double from current 5%, 8% to 14%, 20%, respectively, by FY19E. Exhibit 35: Return ratios trend
-3.1-1.9
9.1
4.5
10.112.4
14.4
0.3 1.1
12.4
7.7
15.018.0
20.3
-5.0
0.0
5.0
10.0
15.0
20.0
25.0
FY13 FY14 FY15 FY16 FY17E FY18E FY19E
ROE ROCE
Source: Company, ICICIdirect.com Research

Page 16ICICI Securities Ltd | Retail Equity Research
Risk & Concerns Regulatory overhang concerning FDI in retail… Trent HyperCity growth and expansion plans are highly sensitive to any changes in government policy towards 51% FDI in multi-brand retail. In November 2011, the previous UPA government had approved 51% FDI in multi-brand retail, subject to stringent conditions imposed by Government of India. A key condition was allowing 51% FDI in multi-brand retail and giving discretion to states. So far, Maharashtra, Karnataka, Andhra Pradesh, Assam, Haryana, J&K, Rajasthan, Uttarakhand and Delhi have approved 51% FDI in multi-brand retail. There had also been a criterion of 30% local sourcing with minimum investment of $100 million and at least 50% total investment concentrated in backend infrastructure.
Exhibit 36: Favourable FDI policy encouraging sector Investments…
Source: Company, ICICIdirect.com Research
Currently, THL only operates in two states, Maharashtra and Karnataka. Any change in the policy framework related to FDI limits either by states or the Centre can affect the growth prospects of THL.
Newer peers on the block - re-rating risks… Our revenue projections are mainly driven by expectation of aggressive store expansion across segments. However, listing of newer peers may lead to a sector re-rating that is an upside risk to our allocated multiples that can significantly affect overall market capitalisation estimates.
Escalation in rental cost Rental is a very key cost component mainly in the organised retail industry. A steep rise in rentals for quality retail real estate with strategic locations attracting high footfalls can adversely affect overall viability, forcing retailers to tweak their business plans and go slow. Rental as a cost comprises ~9% of overall consolidated revenues of Trent Ltd. In our projections, we have built in 2% growth in rent per square feet for each year FY17, FY18 and FY19. However, the sensitivity given below reflects the change in Trent margins on every 5% change in rental expenses.
Exhibit 37: Rental cost sensitivity to Trent margins
-10.0% -5.0% 0% 5.0% 10.0%
FY17E 8.9 8.5 8.1 7.6 7.2 FY18E 10.3 9.5 8.7 7.9 6.9 FY18E 11.4 10.3 9.1 7.8 6.4
Change in Rent per sq.ft
EBITDA margins
Source: Company, ICICIdirect.com Research
Government approved 51% FDI in multi-brand retail and increased FDI limit to 100% (from 51%) in single brand retail
1991 1997 2006 2008 2012 2015 2016
FDI of up to 51% allowed with prior government approval in single-brand retail
Liberalisation: FDI of up to 51% allowed under the automatic route in select priority sectors
FDI of up to 100% allowed under the automatic route in cash & carry (wholesale)
Government proposed introducing FDI in multi-brand retail (2008); follows up in 2012 by approving a plan to raise the FDI limit to 51%
With a view to improve the ease of doing business, the government has aligned the foreign direct investment policy with NIC code
As per DIPP, FDI equity inflows in Indian retail trading totalled $537.61 million during April 2000-March 2016

Page 17ICICI Securities Ltd | Retail Equity Research
Valuations We expect the expansion benefit of high RoCE Westside stores, closure of loss making Landmark stores and rightsizing of Star to significantly improve the financial performance in FY16-19E. These opportunities place Trent at an inflection point. We believe that execution of these strategies would lead to improvement in Trent’s financials, resulting in its re-rating. We assign EV/sales multiple of 2.5x to Westside business arriving at a targeted market capitalisation of ~| 6200 crore. The multiple assigned to Westside reflects its leadership position among the country’s women’s wear player like Fabindia (FY16 revenues - | 1000 crore) and Biba (FY16 revenues - | 385 crore). Some of the recent deals in the industry include Premji Invest buying 8% stake in Fabindia for nearly | 360 crore, valuing the transaction at 4.5x sales. Moreover, Tesco Plc had invested | 1000 crore in Trent for 50% stake, valuing THL at an EV of | 2000 crore. However, as the JV would take some time to turnaround, we apply a 50% discount to its valuation and assign an EV/sales multiple of 1x, arriving at a targeted market capitalisation of | 896 crore. Ubiquitous presence of kirana stores would lose their competitiveness to organised retailers post implementation of GST. The immense opportunity and likely exponential growth rates affirm our targeted multiple of 1x, compared to global peers (average of 0.5x) as the latter operates in much matured market. In addition to Westside and THL, Zara is expected to benefit from increasingly brand conscious Indian market. The sheer opportunity has led a slew of single brand apparel retailers like H&M, GAP, and Aeropostale, among others; to chart out ambitious Indian expansion plans. We value Trent Inditex at 2.7x FY19E EV/sales, applying 30% discount to its JV partner Inditex FY19E EV/Sales multiple of 3.4x. The Indian retail industry continues to remain predominantly unorganised. Post demonetisation and GST, the shift in consumption pattern would largely favour organised brick-and-mortar retailers like Trent. We value Trent Ltd on a sum of total parts (SOTP) valuing Westside, Star, Zara at 2.5x, 1x, 2.7x FY19E EV/sales, respectively, arriving at a target price of | 290. We initiate coverage on Trent with a BUY recommendation.
Exhibit 38: Valuation - SOTP
FinancialFY19E (| cr) Target Multiple EV
(| cr)Cash Debt
Targeted Mcap (| cr)
Westside Standalone Sales 2546 2.5x EV/Sales 6340 85 225 6200
Trent Hypermarket Ltd Sales 1054 1x EV/Sales 1054 41 200 896
Trent -Inditex (Zara) Sales 820 2.7x EV/Sales 2215 359 0 2574
Target Market Cap. (| cr) 9670
Target Price (|) 290Source: Company, ICICIdirect.com Research
Exhibit 39: Peer comparison - Valuation Metrics FY16 EV/SalesParticulars Market Cap Sales EBITDA Margin PAT FY16 FY17E FY18E FY19ETrent Ltd 8050 2397.3 136.9 5.7% 65.4 3.5 2.6 2.2 1.8ABFRL 11500 6017.8 397.7 6.6% (104.1) 2.1 1.9 1.7 1.5 Shoppers Stop 2690 4770.1 198.2 4.2% (89.0) 0.9 0.6 0.6 0.5
Source: Bloomberg, Company, ICICIdirect.com Research
THL global peer comparison… Company Name EV / RevenueTesco PLC 0.41
WM Morrison Supermarkets PLC 0.41
Carrefour SA 0.39
Koninklijke Ahold Delhaize NV 0.44
J Sainsbury PLC 0.24
Casino Guichard Perrachon SA 0.41
Ocado Group PLC 1.23
Distribuidora Internacional de Alimentacion SA 0.42 Source: Reuters, ICICIdirect.com Research
Zara global peer comparison… Company Name EV / RevenueIndustria de Diseno Textil SA (Inditex) 3.56
H & M Hennes & Mauritz AB 1.61
Marks and Spencer Group PLC 0.72
Next PLC 1.64
Kingfisher PLC 0.57
adidas AG 1.47
Associated British Foods PLC 1.38
Luxottica Group SpA 2.54
Source: Reuters, ICICIdirect.com Research

Page 18ICICI Securities Ltd | Retail Equity Research
Annexure Westside - Sharp focus on high growth women’s segment… Over the years, Westside has been sharpening its focus on fast moving value fashion targeted towards women. Industry, per se kidswear and women’s wear apparel segment are expected to outperform overall apparel growth. The overall apparel growth for the next decade is expected at 10% CAGR of which the women and kidswear category are expected to grow faster at 11% each over the same period.
Exhibit 40: Segment wise apparel growth (US$ billion)
17.2 15.68.2
41.045.3 45.8
24.5
115.6
0.0
20.0
40.0
60.0
80.0
100.0
120.0
140.0
Menswear Womenswear Kidswear Total
2014 2025E
Source: Company, Technopak Analysis,ICICIdirect.com Research
Growing fashion consciousness, mainly influenced by media & western culture, has made the women’s western wear segment a highly lucrative and evolving market. Within the overall women’s wear category, it has been the fastest growing segment. Westside, through its private labels like Wardrobe, Gia, Lov, Sassy and Soda have been cashing in on this opportunity with a significant presence in this segment.
Exhibit 41: Apparel brand portfolio of Westside
Women Ethinic Women Innerwear Kids & Teens Wear Men's Wear Women Western
Source: Company, ICICIdirect.com Research
India’s ethnic wear market has been largely populated by unorganised players. It is a space mainly dominated by local retailers and tailors, which have traditionally flourished due to the Indian culture of ethnic wear in weddings, festivals & religious occasions. There has been a huge vacuum of pan-India national brands in this segment. Westside, through its in-house brands like Zuba, Bombay Paisley, Westside Mix and Match & Westside SKD has endeavoured to capture this opportunity. Apart from this, to extend and fill the gap in existing offerings in the women’s wear space, it has also recently launched its innerwear brand Wunder Love.

Page 19ICICI Securities Ltd | Retail Equity Research
Exhibit 42: Westside leading retailer in women’s wear category
53
22
5
20
42
35
914
20
35
9
36
0
10
20
30
40
50
60
Women Men Kids Non-Apparel%
Westside Pantaloon Shoppers Stop
Source: Company, ICICIdirect.com Research
In the kidswear segment, Trent had launched brands like HOP, which caters to all kinds of wardrobe requirements of the junior age group of two to six years while Young & Free (Y&F) has been developed for young teens in the age group of 12-16 years. Menswear comprises Ascot, which is its premium lifestyle brand while its casual fashion collection includes brands like Nuon, ETA, Oak & Keel and Westsport. Weststreet is a formal brand dedicated to officewear.
One-stop-shop solution: Footwear, Studio West, Westside Home The overall market size of the Indian home furnishing & furniture industry is currently estimated at ~$20 billion. It is likely to reach $30 billion by 2020E. The footwear and fragrances industry is estimated at $3.5 billion and $300 million, respectively. It is expected to grow 15-20%. Apart from its core apparel portfolio of products, Westside has been steadily extending its product line by venturing into new fast growing consumption based categories that include cosmetic, bathing products, fragrances, home furnishing and furniture & footwear. The average ticket/bill size for these products is expected to be higher compared to apparel, which yields better realisation per square feet.
Exhibit 43: Non apparel businesses
Studio West
Cosmetics Bath & Beyond Frangrances
Source: Company, ICICIdirect.com Research
The unique attribute of this initiative is that unlike other retailers, its prime focus continues on building its own brands that play a vital role in long term sustainability of the business. However, despite high growth on a relatively smaller base, as per management, share of non apparel segment is unlikely to grow in the overall revenue pie in the foreseeable future.
Category wise break-up of women’s ethnic wear
Saree, 50%Salwar Kameez
Dress, 41%
Others, 9%
Total market Size $11.3Bn as on FY14
Source: Technopak Analysis, ICICIdirect.com research

Page 20ICICI Securities Ltd | Retail Equity Research
Global JVs to assist creating sustainable retail model… Tesco Trent Hypermarket (THL) is the only Indian retailer to have a foreign joint venture in the multi-brand organised retail sector in India, which aims to leverage the collective strength of brands Tata & Tesco to provide customers convenient modern retailing solutions. Tesco Plc is a British multinational grocery & general merchandise retailer. Globally, it is the third largest retailer in terms of revenue. Its overall global sales in 2016 were at £54.4 billion, mainly concentrated in the UK and Europe.
It has a presence across 11 countries in Europe and Asia, including the UK, Ireland, Hungary, Czech Republic, Slovakia, Poland, Turkey, Malaysia, Thailand, China and India. THL, which is a 50:50 JV between Trent & Tesco Plc, operates around 26 stores in India, including five Star Hyper, 11 Star Daily and five Star Market stores.
Exhibit 45: Formats under JV…
Average Store size (mn.ft) 50000 3500 10000
Products offeredFood, grocery & other merchandise
Groceries, meat, dairy, bakery and ready to eat with health & beauty
products
Ready to eat products, groceries, fresh perishable food products, dairy and
health & beauty products
Bath & Beyond Frangrances
Store formats under THL
Store Format
Source: Company, ICICIdirect.com Research
Exhibit 44: Global revenue trend of Tesco Plc
56.9
60.5
63.9 63.4 63.662.3
54.4
48
50
52
54
56
58
60
62
64
66
FY10 FY11 FY12 FY13 FY14 FY15 FY16
Billi
on p
ound
s
Revenue
Source: Company, ICICIdirect.com Research
Market penetration of organised food retail 2014
Unorganized Food Retail
98%
Organized Food Retail
2%
Source: Technopak Analysis, ICICIdirect.com Research
Tesco global region wise revenue
UK71%
Europe14%
Asia15%
Source: Tesco Plc, ICICIdirect.com Research

Page 21ICICI Securities Ltd | Retail Equity Research
Inditex Zara, a leading fast fashion Spanish brand, is one of the largest, most profitable brands globally with a presence across 88 markets and managing close to 7013 outlets. Across the globe, Zara adopts one of the most competent supply chain systems, which focuses on ensuring production traceability across ~1600 suppliers globally. Zara is renowned for its ability to deliver new clothes to its stores quickly in small batches. The strategy involves active ordering by store managers and inventory turnover twice a week. Exhibit 46: Trend of Inditex revenue & EBITDA margin (In million €)
Europe, 44%
Spain, 23%
Asia & ROW, 18%
Americas, 15%
Source: Company, ICICIdirect.com Research
Trent India operates a JV with the Inditex group that owns the Zara and Massimo Dutti brand. Trent’s holding in the JV is 49% while Inditex controls the majority 51% stake. Inditex has a unique business wherein it moderates the complete apparel value chain. Inditex has a strong presence and controls all activities of the apparel production, which spans across designing, manufacturing, logistics to distribution. Owing to this, Inditex revenues grew at a CAGR of 16.5% to €20.9 billion in FY10-16. It is considered one of the fastest growing apparel brands globally.
Exhibit 47: Trend of Inditex revenue & EBITDA margin (In million €)
11.112.5
13.815.9 16.7
18.1
20.9
21
24 24
25
2423 23
0.0
5.0
10.0
15.0
20.0
25.0
2010 2011 2012 2013 2014 2015 2016
Euro
bn
19
20
21
22
23
24
25
26
Revenues EBITDA Margins(%)
Source: Company, ICICIdirect.com Research
In India, within five years of its inception, Zara became the first apparel brand to touch revenues of $100 million. Zara stores are completely operated by a separate Inditex team.

Page 22ICICI Securities Ltd | Retail Equity Research
Financials Summary (Consolidated)
Exhibit 48: Profit & Loss (Year-end March) FY15 FY16 FY17E FY18E FY19ETotal operating Income 2,284.3 2,397.3 3,140.5 3,831.6 4,557.0Growth (%) -2.1 4.9 31.0 22.0 18.9Cost of Goods Sold 1,329.0 1,319.8 1,736.7 2,118.9 2,520.0Gross Margin (%) 41.8 44.9 44.7 44.7 44.7Employee Expenses 207.9 212.1 266.9 306.5 364.6Operating & Other Expenses 675.2 728.5 886.4 1,082.5 1,275.3Total Operating Expenditure 2,212.1 2,260.4 2,890.1 3,508.0 4,160.0EBITDA 72.3 136.9 250.5 323.7 397.1Growth (%) 642.9 89.4 83.0 29.2 22.7Depreciation 74.3 67.5 95.6 111.2 126.8Interest 10.7 35.5 46.3 65.6 65.6Other Income 97.2 66.2 94.2 114.9 136.7PBT 199.6 105.9 202.8 261.8 341.4Total Tax 70.1 40.5 60.8 78.6 102.4PAT 129.5 65.4 142.0 183.3 239.0Minority Interest -0.1 -0.1 0.0 0.1 0.1PAT (after minority interest) 129.6 65.5 141.9 183.2 238.9Growth (%) LP -51.4 125.1 29.1 30.4EPS (|) (after minority interest) 39.0 1.9 4.3 5.5 7.2
Source: Company, ICICIdirect.com Research
Exhibit 49: Balance Sheet (Year-end March) FY15 FY16 FY17E FY18E FY19ELiabilitiesEquity Capital 33.2 33.2 33.2 33.2 33.2Reserve and Surplus 1,388.8 1,404.9 1,378.3 1,439.9 1,623.5Total Shareholders funds 1,422.0 1,438.1 1,411.5 1,473.1 1,656.7Total Debt 266.9 391.5 231.5 328.0 328.0Other LT Liabilities 11.1 7.3 7.7 8.1 8.5Deferred Tax Liability 0.0 0.0 0.0 0.0 0.0Minority Interest / Others 2.6 10.3 10.3 10.3 10.3Total Liabilities 1,702.5 1,847.2 1,661.0 1,819.5 2,003.5Assets 475.1 587.4Gross Block 950.4 1,037.8 1,225.9 1,425.6 1,625.2Less: Acc Depreciation 282.2 315.1 410.7 521.9 648.7Capital WIP 92.1 110.3 0.0 0.0 0.0Total Fixed Assets 760.4 833.0 815.2 903.7 976.6Investments 739.7 726.6 690.3 724.8 761.0Other Non-current Assets 0.0 0.0 0.0 0.0 0.0Goodwill on Consolidation 0.0 0.0 0.0 0.0 0.0Deferred Tax Asset 2.1 2.2 2.3 2.4 2.5Inventory 329.9 355.3 503.8 548.7 641.5Debtors 17.7 19.0 16.4 21.5 26.2Loans and Advances 295.0 296.5 302.4 347.8 400.0Cash 55.5 63.0 88.4 147.8 236.5Other Current Assets 6.0 3.4 5.1 7.6 11.4Total Current Assets 704.0 737.2 916.1 1,073.4 1,315.7Creditors 221.3 241.6 285.5 348.3 414.3Other Current Liab. & Prov. 282.5 210.1 477.4 536.4 638.0Total Current Liabilities 503.7 451.7 762.9 884.7 1,052.2Net Current Assets 200.3 285.5 153.3 188.7 263.4Application of Funds 1,702.5 1,847.2 1,661.0 1,819.5 2,003.5
Source: Company, ICICIdirect.com Research

Page 23ICICI Securities Ltd | Retail Equity Research
Exhibit 50: Cash Flow
(Year-end March) FY15 FY16 FY17E FY18E FY19EProfit before Tax 199.6 105.9 202.8 261.8 341.4Add: Depreciation 74.3 67.5 95.6 111.2 126.8(Inc)/dec in Current Assets 43.1 -28.3 -151.8 -95.3 -149.8Inc/(dec) in CL and Provisions -98.4 -52.0 311.2 121.9 167.5Taxes Paid -70.1 -40.5 -60.8 -78.6 -102.4Others 10.7 35.5 46.3 65.6 65.6CF from operating activities 159.3 88.1 443.2 386.6 449.1(Inc)/dec in Investments -439.4 13.1 36.3 -34.5 -36.2(Inc)/dec in Fixed Assets 40.9 -105.6 -77.8 -199.7 -199.7Others -50.0 -40.0 -157.1 -117.1 -117.1CF from investing activities -448.5 -132.5 -198.5 -351.3 -353.0Issue/(Buy back) of Equity 0.0 0.0 0.0 0.0 0.0Inc/(dec) in loan funds -64.7 124.6 -160.0 96.5 0.0Dividend paid & dividend tax 40.0 42.9 44.3 57.2 74.5Others 307.4 -115.7 -103.5 -129.6 -82.0CF from financing activities 282.7 51.8 -219.3 24.1 -7.4Net Cash flow -6.5 7.4 25.4 59.4 88.7Opening Cash 61.9 55.5 63.0 88.4 147.8Closing Cash 55.5 63.0 88.4 147.8 236.5
Source: Company, ICICIdirect.com Research
Exhibit 51: Ratios
(Year-end March) FY15 FY16 FY17E FY18E FY19EPer share data (|) (annualised)EPS 39.0 1.9 4.3 5.5 7.2Cash EPS 61.4 3.9 7.1 8.9 11.0BV 427.9 43.3 42.5 44.3 49.9DPS 10.0 1.1 1.1 1.4 1.9Cash Per Share 16.7 1.9 2.7 4.4 7.1Operating RatiosEBITDA Margin (%) 3.2 5.7 8.0 8.4 8.7PBT Margin (%) 12.3 6.6 10.2 11.3 12.8PAT Margin (%) 5.7 2.6 4.5 4.8 5.2Inventory days 52.7 54.1 58.6 52.3 51.4Debtor days 2.8 2.9 1.9 2.0 2.1Creditor days 52.4 59.8 48.5 47.8 47.8Return Ratios (%)RoE 9.1 4.5 10.1 12.4 14.4RoCE 12.4 7.7 15.0 18.0 20.3RoIC -0.3 7.5 17.9 22.9 27.4Valuation Ratios (x) (annualised)P/E 6.3 124.5 57.4 44.4 34.1EV / EBITDA 115.6 61.9 33.1 25.7 20.7EV / Net Sales 3.7 3.5 2.6 2.2 1.8Market Cap / Sales 3.6 3.4 2.6 2.1 1.8Price to Book Value 0.6 5.7 5.8 5.5 4.9Solvency RatiosDebt/EBITDA 3.7 2.9 0.9 1.0 0.8Debt / Equity 0.2 0.3 0.2 0.2 0.2Current Ratio 1.3 1.5 1.1 1.0 1.0Quick Ratio 0.6 0.7 0.4 0.4 0.4
Source: Company, ICICIdirect.com Research

Page 24ICICI Securities Ltd | Retail Equity Research
RATING RATIONALE ICICIdirect.com endeavours to provide objective opinions and recommendations. ICICIdirect.com assigns ratings to its stocks according to their notional target price vs. current market price and then categorises them as Strong Buy, Buy, Hold and Sell. The performance horizon is two years unless specified and the notional target price is defined as the analysts' valuation for a stock. Strong Buy: >15%/20% for large caps/midcaps, respectively, with high conviction; Buy: >10%/15% for large caps/midcaps, respectively; Hold: Up to +/-10%; Sell: -10% or more;
Pankaj Pandey Head – Research [email protected]
ICICIdirect.com Research Desk, ICICI Securities Limited, 1st Floor, Akruti Trade Centre, Road No 7, MIDC, Andheri (East) Mumbai – 400 093

Page 25ICICI Securities Ltd | Retail Equity Research
ANALYST CERTIFICATION We /I, Bharat Chhoda, MBA, Ankit Panchmatia, PGDBM (Finance), Cheragh Sidhwa, MBA Research Analysts, authors and the names subscribed to this report, hereby certify that all of the views expressed in this research report accurately reflect our views about the subject issuer(s) or securities. We also certify that no part of our compensation was, is, or will be directly or indirectly related to the specific recommendation(s) or view(s) in this report.
Terms & conditions and other disclosures: ICICI Securities Limited (ICICI Securities) is a full-service, integrated investment banking and is, inter alia, engaged in the business of stock brokering and distribution of financial products. ICICI Securities Limited is a Sebi registered Research Analyst with Sebi Registration Number – INH000000990. ICICI Securities is a wholly-owned subsidiary of ICICI Bank which is India’s largest private sector bank and has its various subsidiaries engaged in businesses of housing finance, asset management, life insurance, general insurance, venture capital fund management, etc. (“associates”), the details in respect of which are available on www.icicibank.com. ICICI Securities is one of the leading merchant bankers/ underwriters of securities and participate in virtually all securities trading markets in India. We and our associates might have investment banking and other business relationship with a significant percentage of companies covered by our Investment Research Department. ICICI Securities generally prohibits its analysts, persons reporting to analysts and their relatives from maintaining a financial interest in the securities or derivatives of any companies that the analysts cover. The information and opinions in this report have been prepared by ICICI Securities and are subject to change without any notice. The report and information contained herein is strictly confidential and meant solely for the selected recipient and may not be altered in any way, transmitted to, copied or distributed, in part or in whole, to any other person or to the media or reproduced in any form, without prior written consent of ICICI Securities. While we would endeavour to update the information herein on a reasonable basis, ICICI Securities is under no obligation to update or keep the information current. Also, there may be regulatory, compliance or other reasons that may prevent ICICI Securities from doing so. Non-rated securities indicate that rating on a particular security has been suspended temporarily and such suspension is in compliance with applicable regulations and/or ICICI Securities policies, in circumstances where ICICI Securities might be acting in an advisory capacity to this company, or in certain other circumstances. This report is based on information obtained from public sources and sources believed to be reliable, but no independent verification has been made nor is its accuracy or completeness guaranteed. This report and information herein is solely for informational purpose and shall not be used or considered as an offer document or solicitation of offer to buy or sell or subscribe for securities or other financial instruments. Though disseminated to all the customers simultaneously, not all customers may receive this report at the same time. ICICI Securities will not treat recipients as customers by virtue of their receiving this report. Nothing in this report constitutes investment, legal, accounting and tax advice or a representation that any investment or strategy is suitable or appropriate to your specific circumstances. The securities discussed and opinions expressed in this report may not be suitable for all investors, who must make their own investment decisions, based on their own investment objectives, financial positions and needs of specific recipient. This may not be taken in substitution for the exercise of independent judgment by any recipient. The recipient should independently evaluate the investment risks. The value and return on investment may vary because of changes in interest rates, foreign exchange rates or any other reason. ICICI Securities accepts no liabilities whatsoever for any loss or damage of any kind arising out of the use of this report. Past performance is not necessarily a guide to future performance. Investors are advised to see Risk Disclosure Document to understand the risks associated before investing in the securities markets. Actual results may differ materially from those set forth in projections. Forward-looking statements are not predictions and may be subject to change without notice. ICICI Securities or its associates might have managed or co-managed public offering of securities for the subject company or might have been mandated by the subject company for any other assignment in the past twelve months. ICICI Securities or its associates might have received any compensation from the companies mentioned in the report during the period preceding twelve months from the date of this report for services in respect of managing or co-managing public offerings, corporate finance, investment banking or merchant banking, brokerage services or other advisory service in a merger or specific transaction.
ICICI Securities or its associates might have received any compensation for products or services other than investment banking or merchant banking or brokerage services from the companies mentioned in the report in the past twelve months. ICICI Securities encourages independence in research report preparation and strives to minimize conflict in preparation of research report. ICICI Securities or its associates or its analysts did not receive any compensation or other benefits from the companies mentioned in the report or third party in connection with preparation of the research report. Accordingly, neither ICICI Securities nor Research Analysts and their relatives have any material conflict of interest at the time of publication of this report. It is confirmed that Bhupendra Bharat Chhoda, MBA, Ankit Panchmatia, PGDBM (Finance), Cheragh Sidhwa, MBA Research Analysts of this report have not received any compensation from the companies mentioned in the report in the preceding twelve months. Compensation of our Research Analysts is not based on any specific merchant banking, investment banking or brokerage service transactions. ICICI Securities or its subsidiaries collectively or Research Analysts or their relatives do not own 1% or more of the equity securities of the Company mentioned in the report as of the last day of the month preceding the publication of the research report. Since associates of ICICI Securities are engaged in various financial service businesses, they might have financial interests or beneficial ownership in various companies including the subject company/companies mentioned in this report. It is confirmed that Bharat Chhoda, MBA, Ankit Panchmatia, PGDBM (Finance), Cheragh Sidhwa, MBA, Research Analysts do not serve as an officer, director or employee of the companies mentioned in the report. ICICI Securities may have issued other reports that are inconsistent with and reach different conclusion from the information presented in this report. Neither the Research Analysts nor ICICI Securities have been engaged in market making activity for the companies mentioned in the report. We submit that no material disciplinary action has been taken on ICICI Securities by any Regulatory Authority impacting Equity Research Analysis activities. This report is not directed or intended for distribution to, or use by, any person or entity who is a citizen or resident of or located in any locality, state, country or other jurisdiction, where such distribution, publication, availability or use would be contrary to law, regulation or which would subject ICICI Securities and affiliates to any registration or licensing requirement within such jurisdiction. The securities described herein may or may not be eligible for sale in all jurisdictions or to certain category of investors. Persons in whose possession this document may come are required to inform themselves of and to observe such restriction.