initiation of ferroresonant oscillations in series ... · pdf fileinitiation of ferroresonant...
TRANSCRIPT
European Journal of Scientific Research
ISSN 1450-216X / 1450-202X Vol. 146 No 4 August, 2017, pp.346 - 362
http://www. europeanjournalofscientificresearch.com
Initiation of Ferroresonant Oscillations in Series
Capacitors of Power System
Ataollah Abbasi
Amirkabir University of Technology
Tehran, Iran, 15875-4413
S. Hamid Fathi
Corresponding Author, Amirkabir University of Technology
Tehran, Iran, 15875-4413
Abstract
Ferroresonance can cause severe overvoltages and heavy currents resulting in
damage to power system equipment and customer installations.Ferroresonance is a
complex phenomenon that occurs in power system. This can create thermal and insulation
problems for power system equipments.It can also cause subharmonic oscillations in power
system. This paper, discusses about ferroresonance in series compensation of power lines.
Series capacitors can increase the power carrying capacity of subtransmission and
distribution lines by reducing voltage regulation. When considering Series capacitor
compensation of distribution lines and subtransmission lines careful consideration needs to
be given to capacitor location. Ferroresonance, ohmic reactive value, transient behavior,
short circuit withstand and capacitor protection conventional design approaches include
shunt connected resistors, spark gaps, metal oxide visitors, thyristor controlled reactors and
bypass switches.A small scale nonlinear single phase Ferroresonant circuit was modeled
with realistic per unit component value. Both 3rd
and 2nd
subharmonicFerroresonance modes
were predicted by modeling.
Index Terms: Series Capacitors, Nonlinear Components, subharmonic Ferroresonance,
power transformer
I. Introduction Ferroresonance is an electrical complex nonlinear phenomenon which can causes thermal and
insulation failure in transmission and distribution systems. Ferroresonance may be initiated by
contingency switching operation, lightning, routine switching, no load conditions, series compensation,
load shedding or capacitor banks connection to the secondary transformer involving a high voltage
transmission line[1], [2].
This phenomenon consist of multiple modes with different frequencies such as: fundamental
frequency, sub harmonic, quasi periodic and chaotic[3]–[5]. The abrupt transition or jump from one
steady state to another is triggered by a disturbance, switching action or a gradual change in values of a
parameter.Ferroresonance causes distortional over voltages and over currents in power network which
not only causes damages to transformer but also causes damages to network instruments like surge
arresters and series capacitances[6]–[8].
Initiation of Ferroresonant Oscillations in Series Capacitors of Power System 347
Unlike resonance, which occurs in RLC circuits by linear capacitances and linear inductances
for a particular frequency, ferroresonance is created by nonlinear inductance due to the core of
transformer. Magnetic core of voltage transformer can be considered as a nonlinear inductance and
Composition of line to line and line to earth capacitances and grading capacitors of circuit breaker can
be considered as a linear capacitance[9], [10].
The ferroresonant oscillations is dependent not only on frequency but also on other factors such
as voltage magnitude of the system, initial magnetic flux condition of transformer iron core, total core
loss in the ferroresonant circuit and moment of switching.
Because of nonlinear nature of ferroresonance, ferroresonant systems are considered to be
nonlinear dynamic systems and linear methods can’t be used to analyze them. Thus, investigation and
analysis of this behavior is performed by more complex numerical methods. Analytical approaches
based on graphical solutions were proposed to show bifurcations in single-phase ferroresonant
circuits[11], [12].In ferroresonance,because of nonlinear characteristics of circuit elements the number
of fixed points is more than one. Thus by variation of system parameters fixed points lose their stability
and regain accordingly.
Bifurcation theory is a useful method for identifying system parameters conducive to
ferroresonance[13], [14]. It enables us to describe and analyze qualitative properties of the solutions
i.e., fixed points, when system parameters change. Studying ferroresonance using bifurcation theory
has been performed. Although study of ferroresonance exists in the recent literature, they demand
relatively high computational resources and are only valid for limited cases. Some of these methods are
valid only in limited cases while creating a bifurcation diagram by a continuation method can be more
systematic and save computational effort[13].
Capacitors have been used for the series compensation of transmission and distribution lines for
many years. Series capacitor installations have been described in the literature as far back as 1954[15].
Pioneer power system engineers were seriously examining the merits and demerits of series capacitors
and analyzing the subharmonicferroresonance phenomena in the 1930's.Series capacitors are now in
common use at the transmission level with hundreds of units in service throughout the world. Although
series capacitors have been in use for a long time they have not found widespread acceptance as a
viable economic power system component at the distribution level[16].
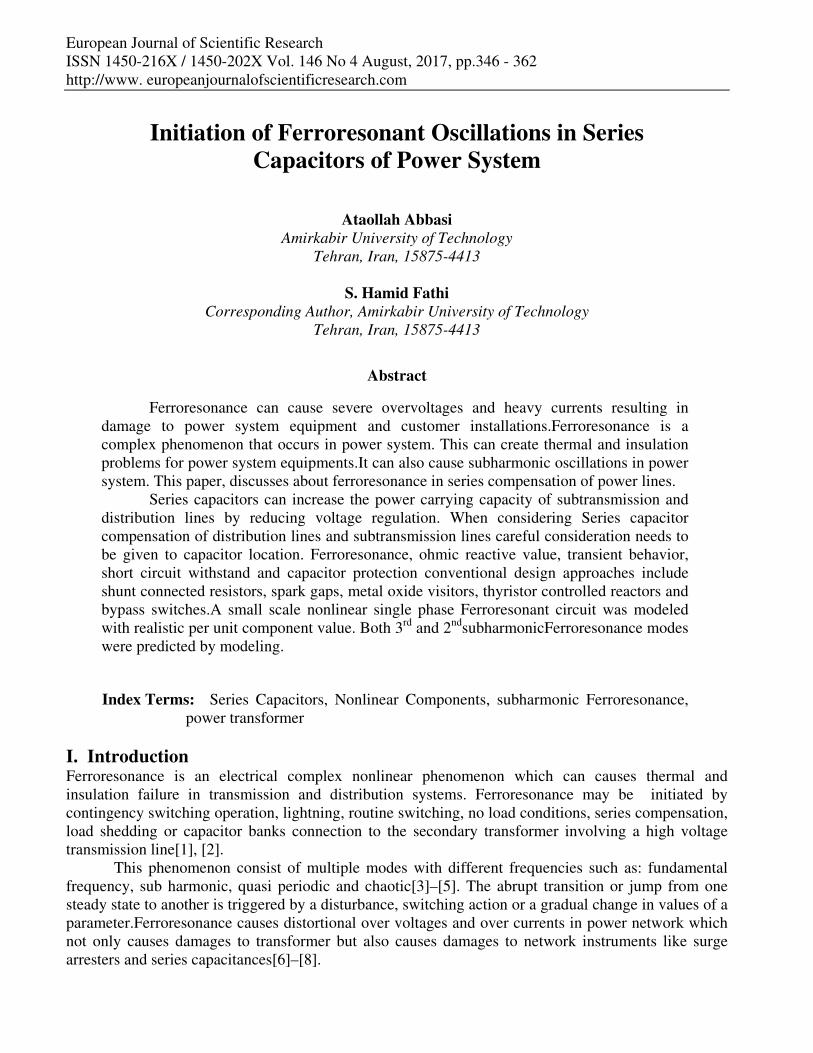
Figure 1 shows the typical voltage profile of a very weak distribution line with a lumped load at
the end. The line resistance and reactance is distributed along the line. As the load varies from light
load to full load there is a substantial voltage difference seen by customers. It is the difference between
light load and full load voltage that in many cases limits the capacity of the line.
Figure 1: Voltage profile of a weak distribution line
Distributed line R & L
L lo
ad
R lo
ad
1.0 1.0
1.11.1
0.9 0.9
Light load
I
Full loadLin
e vo
ltag
e P
.U.
0.80.8
348 Ataollah Abbasi and S. Hamid Fathi
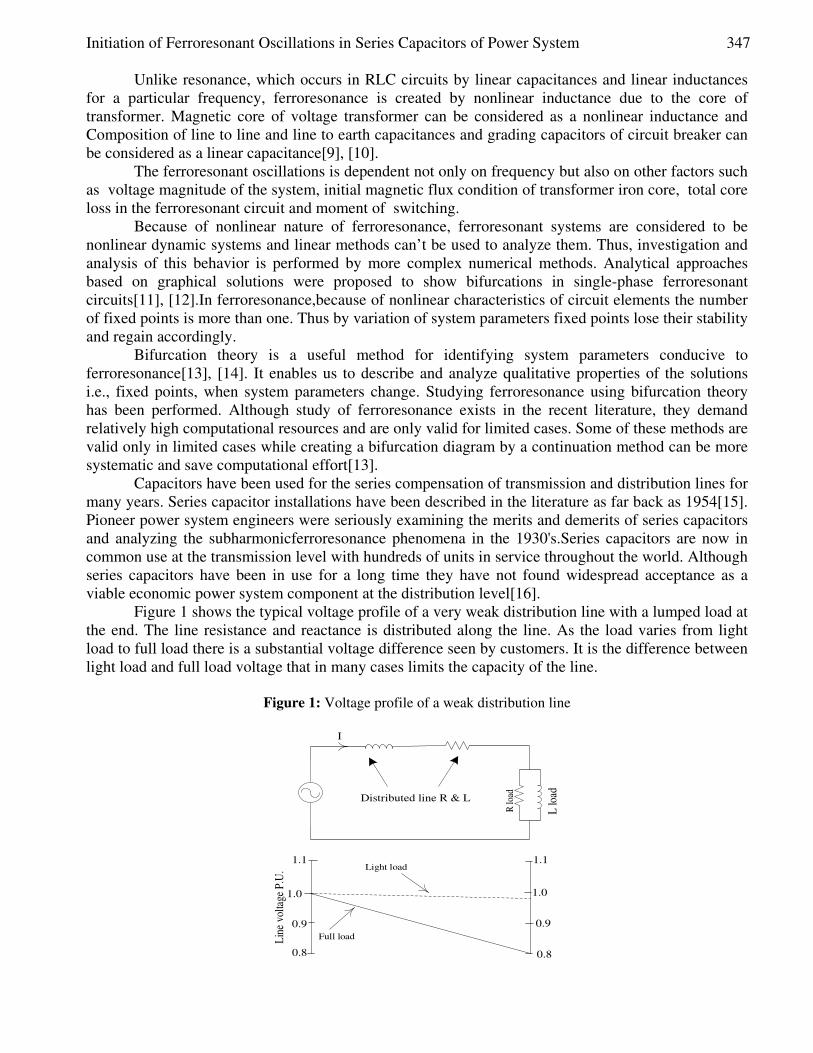
Figure 2 shows the effect of series capacitor compensation on the same line. The power line
supplying the transformer is represented by distributed linear inductance and resistance. The circuit
contains a series capacitor to tune out the effects of the line inductance. When used for series
compensation, the capacitance will normally be chosen so as to tune out all or most of the line
inductance at the power frequency.
Figure 2: Voltage profile of a weak distribution line with series capacitor compensation
C
Distributed line R & L
L l
oad
R l
oad
1.0 1.0
1.051.05
0.95 0.95
Light load
I
Full load
Lin
e v
olt
age
P.U
.
The fundamental issues concerning series capacitors are the same today as they were in the
pioneering days of 1930' s. Series capacitors offer the potential to tune out all or part of the series
inductance of lines at the power frequency. This can result in reduced voltage regulation, enhanced
power transfer capability and improved system stability. Series capacitors are particularly attractive in
controlling voltage fluctuations associated with rapidly varying loads. With such significant potential
for enhanced power transfer capability the question arises as to why series capacitors have not found
widespread use and acceptance at the distribution level.
Series capacitors are not in widespread use at the distribution level because of the generation of
ferroresonantover voltages, fault level problems, problems associated with capacitor withstand of
heavy through fault currents and high cost.
Series capacitors can produce subhannonicferroresonantovervoltage and currents. This
phenomenon is generally not well understood by power system engineers with the result that a series
capacitor installation is considered a high risk option or simply not considered at all. The possibility of
serious damage to capacitors, transformers and customer installations by ferroresonance is of real
concern and requires careful management. The modelling work performed in the course of this paper
has highlighted how destructive ferroresonance can be[17].
Effective solutions to the problems offerroresonance and capacitor protection are of great
potential benefit. Analysis of most large power system distribution networks will identify locations of
high voltage regulation where voltage conditions could be improved by series compensation.
A. Improved Voltage Control with Series Capacitors
Voltage control in electric power systems is of fundamental importance in achieving desired power
flows and maintaining voltage levels within specified limits.
Great engineering effort and capital expenditure is invested in power systems to provide
sufficient "system strength" to maintain voltage levels within the required margins. Distribution lines
are normally limited in their load carrying capacity by either thermal current rating considerations or
excessive voltage drop. In general terms distribution systems supplying high load density areas such as
Commercial Business Districts and areas of high density housing development tend to be current rating
limited. Regions of low load density such as rural areas and regional towns tend to be supplied by
distributionsystems that are voltage drop limited.

Initiation of Ferroresonant Oscillations in Series Capacitors of Power System 349
High voltage regulation in distribution feeders is not the main limitation in itself. It is the
voltage variation between light load and full load that limits the maximum feeder loads that can be
accommodated. With off circuit transformer taps on distribution transformers, the voltage variation in
the high voltage distribution feeder is directly reflected on to low voltage customers. Australian
Standard AS2926 sets maximum voltage variation at +5% to -5% or 0.95 p.u. to 1.05 p.u. in a system.
There are many engineering approaches to overcoming problems of excessive voltage
regulation including augmentation of lines, construction of additional lines, shunt capacitors, voltage
regulators (on load tap changing auto transformers), on load tap changing transformers and
construction of newsubstations. These approaches often involve large capital costs in areas where there
are low load densities. Development of a low cost series compensation arrangement for distribution
systems could provide significant advantages in selected situations[18].
B. Improved System Stability with Series Capacitors
Series capacitors can increase the stability of power systems by reducing the effective impedance of
lines. Reduced line impedance has the effect of increasing system fault levels and increasing the
strength of interconnection of a distributed network of generators.Of course, there are cases
thatcapacitor installation disrupts the stability of system, which can be referred to as:
1. Ferroresonance:Ferroresonance is a well-documented hazard of series capacitors in distribution
networks. Ferroresonance can result in severe overvoltages in capacitors, distribution
transformers and customer installations.
2. Subsynchronous Resonance: Subsynchronous resonance is a potential hazard with series
capacitors. Subsynchronous resonance involves a low frequency exchange of energy between a
series capacitor and a generator. Subsynchronous resonance can cause the mechanical failure of
generator shafts.
3. Asynchronous Resonance: Asynchronous resonance is another potential problem whereby
motors can lock onto subharmonic frequencies on starting and consume abnormally high
currents[19].
In first section of this paper, use of capacitor in transmission and distribution lines is
investigated and its advantages and disadvantages completelyare explained, as we have seen, one of the
disadvantages of series capacitors is creating of ferroresonance in the circuit.
In second section of this paper a small scale nonlinear single phase Ferroresonant circuit was
modeled with realistic per unit component value.
II. Circuit Description and Modeling Figure 3 shows the standard series ferroresonant circuit where the linear LRC circuit elements are in
series with a saturable transformer. Inorder to gain a basic understanding of ferroresonancebehavior the
transformer can be considered as an open circuit when it is not saturated and a short circuit when it is
saturated. The transformer no load case is being considered. The transformer flux linkage is governed
by equation (1).
(1)
When the transformer is not saturated the current flow is near zero with the result that the
capacitor cannot charge or discharge and hence the capacitor stays at near constant voltage. The
voltage applied to the transformer is the source voltage plus a contribution from the capacitor voltage.
This voltage after a short period of time causes the transformer to saturate. Transformer saturation
results in an effective short circuit across the primary transformer terminals (Vp = 0) and the supply
voltage is suddenly applied across the series LRC elements. The capacitor will charge up toward the
applied supply voltage.
pv dtλ = ∫

350 Ataollah Abbasi and S. Hamid Fathi
Figure 3: Series ferroresonant circuit
LV
V(t)
L R C
RVCV
PV
The rate at which the capacitor voltage can change to form a repetitive pattern of transformer
saturation is a critical factor in determining the possibility offerroresonance. During any ferroresonance
the transformer can only remain in saturation for part of a full cycle. If the circuit is capable of
changing the capacitor voltage by a significant amount (in the order of 5% of the supply voltage)
during part of a cycle then ferroresonance is possible.
In order to predict the possibility of ferroresonance it is useful to examine the ratio of the
natural circuit frequency to the power frequency as defined by equation 2.
(2)
(3)
(4)
(5)
The other key indicator is the X/R ratio of the circuit.Equation 4 shows that the X/R ratio is a
direct measure of the ratio of the decay time constant of the natural circuit behavior (tc) to the power
frequency period (T).
The nonlinear nature of ferroresonance makes it a difficult and complex task to predict.
Computer modelling is the most common way of predicting the possibility of ferroresonance in a
particular circuit.Modelling has shown that the frequency ratio and X/R ratio can provide a simple
method of determining by inspection the possibility offerroresonant states. Table 1 below has proved to
be a good predictor as to how these two simple ratios influence the risk of ferroresonance. The table
and comments below relate to typical power system conditions where a small but significant line
resistance is in the ferroresonant circuit and the transformeris operating near its design voltage and
hence close to saturation[20], [21].
A. Influence of the Frequency Ratio on Ferroresonance Behavior
For the establishment of sustained ferroresonance the circuit must be capable of significantly changing
the capacitor voltage by charging through the seriesinductance on resistance over a small part of a
cycle. For example if the power frequency is 50 hertz the capacitor voltage must be able to change its
voltage by a significant amount in a period much less than 0.02 seconds. The frequency ratio is a key
indicator as to the capability of the circuit to exhibit ferroresonantbahavior.
Table 1: Predictor of Ferroresonance
fr<<1 fr≈ 1 fr>>1
X/R << 1 No Ferroresonance No Ferroresonance No Ferroresonance
X/R ≈ 1 No Ferroresonance Ferroresonance Possible Ferroresonance Possible
X/R >> 1 No Ferroresonance Ferroresonance Possible Ferroresonance Possible
rfβ
ω=
2c
Lt
R=
2
C CC
t tX Lf t
R R T
ω πωπ= = = =
21
2
R
L c Lβ
= −

Initiation of Ferroresonant Oscillations in Series Capacitors of Power System 351
Case1 fr<<1: Due to the inherent low natural frequency of the circuit the capacitor voltage of
the ferroresonant circuit can change by only a very small amount during any interval the transformer is
in saturation. Under these conditions ferroresonance is not possible.
Case2fr≈1: Under these conditions the capacitor voltage will change by a significant but limited
amount during any interval the transformer is in saturation. Under these conditionsferroresonant states
are possible. Because of the limited change in capacitor voltage at each point of transformer saturation,
the capacitor voltage tends to change in steps that can generate repeating wave forms with subharmonic
fundamentals. Ferroresonance is possible.
Case3 fr>>1: Under these conditions the capacitor voltage can change rapidly and track the
supply voltage during any interval the transformer is in saturation. Under these conditions
ferroresonant states are possible.
(6)
B. Influence of the X/R Ratio on Ferroresonance Behavior
The X/R ratio is a measure of the transient damping characteristic of circuit. A high line resistance
results in a highly damped system with a small X/R ratio.
Case1 X/R<< 1: Where the X/R ratio is much less than 1 the circuit is highly damped by the
line resistance and the generation offerroresonance is not possible.
Case2 X/R ≈1: Under these conditions the circuit is moderately damped and if ferroresonance
establishes it is likely to produce steady state repeating waveforms.
Case3 X/R >> 1: Under these conditions the circuit is veryunderdamped. Where ferroresonance
establishes with a large X/R the circuit may create either repeating or non-repeating
waveforms.Non repeating chaotic circuit behavior is possible.
When analysing series compensated circuits it is very useful to calculate the frequency ratio and
the time constant ratio to gain an understanding of the ferroresonance possibilities.
In the case of series compensation, the series capacitor will normally be chosen so as to tune
out all or most of the line inductance at the power frequency. This means that the frequency ratio fr will
typically be unity or slightly less than unity.
For distribution lines, typical X/R ratios are in the range of 0.1 for small diameter steel
conductor lines to 3 for high capacity lines with bundled conductors.
Modelling has shown that in series single phase compensated distribution lines with typical
ranges of frequency ratio and X/R ratio, the most common type of ferroresonance is the subharmonic
fundamental type with stable repeating waveforms.
Another major source of ferroresonance in power systems is the result of single phase switching
where there is naturally occurring phase to earth capacitance. In general the phase to earth capacitance
is small creating a frequency ratio fr much greater than unity.
Generation of chaotic ferroresonance in power systems is rare but has been identified as
possible in the literature. The generation of chaotic ferroresonance has been reported in an
Electronic circuit by Deane and Hamill. The resonance was generated with a square wave
voltage generator operating at high frequency.
III. Simulation Results A. Circuit Modeling
In order to investigatethe ferroresonant models, a series compensated circuit was modeled with the
component values as shown in Figure 4. The series capacitor was selected to tune out the line
inductance at 50 Hz and demonstrate the generation of both odd and even subharmonics. The
transformer was modelled with no load by equation (6).
50.1 0.892i λ λ= +

352 Ataollah Abbasi and S. Hamid Fathi
Figure 4: Series ferroresonant circuit
V(t)
L= 0.02H
R= 1.55 Ω
C= 507µF
PV
i
The transformer losses were modelled by a 14400Ω resistance across the primary transformer
terminals. The supply frequency is 50 Hz. The transformer used is a single phase 11KV/400V rated at
3MVA. The 400 volt transformer winding is used in the circuit with no connected load. The supply
voltage was sinusoidal. The resulting transformer magnetizing curve is shown in Figure 5.
Circuit represents the series compensation of a distribution line with approximately 11% line
voltage drop at full transformer load. The circuit characterises the compensation of a very high
impedance line. Deviation from standard per unit distribution line values were used to produce the
desired range of ferroresonant conditions.
Fundamental mode of circuit behavior is not unusual and simply reflectsincreasing transformer
magnetizing current with increasing applied voltage.
Figure 5: transformer model magnetizing curve
With running and repeating of simulation in over a range of supply voltages, the 3rd
subharmonic mode is sustainable only over a range of supply voltages from 0.84 to 1.3p.u. Figures 6
and 7 show the Time Domain Modelled voltage, current and flux
Waveformsat a supply voltage of 0.84p.u.
Figure 6: 3rd
subharmonicferroresonance – voltage waveforms
-8 -6 -4 -2 0 2 4 6 8-1.5
-1
-0.5
0
0.5
1
1.5transformer model magnetizing curve
current(A)
flux(w
eb)
0 0.05 0.1 0.15 0.2 0.25 0.3 0.35 0.4 0.45 0.5-400
-300
-200
-100
0
100
200
300
400
time(s)
ma
gn
itu
de
(vo
lt)
Vs=120 v rms
capacitore voltage
supply voltage
transformer voltage
Initiation of Ferroresonant Oscillations in Series Capacitors of Power System 353
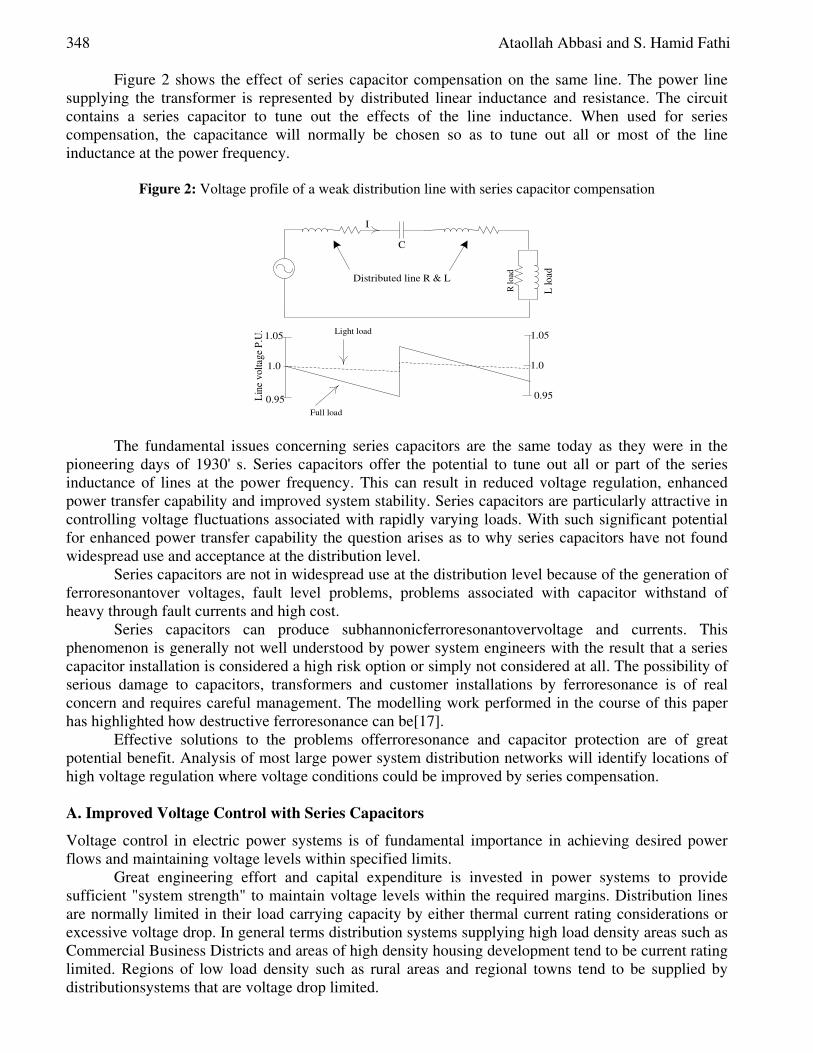
Figure 7: 3
rdsubharmonicferroresonance – current and transformer flux waveforms
The waveforms show perfect symmetry and hence the absence of any even harmonics. The
graphs show that the transformer saturates twice on the positive side followed by twice on the negative
side. After transient state (0.22 s), pattern repeats every 3 cycles hence the generation of the 3rd
subharmonic fundamental waveform of 16.6 Hz.
When the transformer is being driven into saturation the transformer voltage falls to near zero
causing the source voltage to be applied to the other circuit elements, namely the series LRC. At the
beginning of the cycle, the capacitor voltage is large and negative. The capacitor voltage combined
with the supply voltage result in a high positive transformer voltage peaking at 0.25 cycle time. This
causes a high d
dt
λ which is the cause of the transformer going into saturation.
The transformer voltage falls to low values again when saturation occurs. At this time the
source voltage is effectively applied across the series LRC elements forcing the capacitor with a large
negative voltage to a smaller negative voltage. The change in capacitor voltage is determined by the
natural frequency of the Land C which in this case is 50 Hz. the damping effect of R, the shape of the
transformer (i)λ curve and the time the transformer remains saturated.
When the transformer comes out of saturation, the transformer offers a high impedance to the
circuit and allows minimal current flow. During this part of the cycle the capacitor voltage remains
nearly constant. The small negative capacitor voltage combined with the supply voltage result in a high
positive transformer voltage which forces the transformer into heavy positive saturation.
During the second positive saturation phase, the capacitor charges rapidly and attains a large
positive voltage peaking. The large positive capacitor voltage combined with the supply voltage result
in a large negative transformer voltage which forces the transformer into saturation in the negative
direction.This process repeats over 3 complete 50 Hz cycles and hence the resulting waveform has a
3rd subharmonic fundamental (16.7 Hz) with higher order odd harmonics (e.g. 50 Hz, 83.3 Hz, 116.7
Hz etc.)[22].
The phase plane analysis is a graphical method, in which the time behaviour of a system is
represented by the movement of state variables of the system in state space coordinates. As time
elapses, the states position move on a trajectory. If the trajectory is a single closed line, then the system
is periodic. In a chaotic system, however, the trajectory will never close on itself as the cycles are
completed.Three state variables are required to describe behavior of the series compensated circuits.
These can be selected as:
• line current
• capacitor voltage
• transformer primary current
The transformer current and the line current are almost identical with the small difference being
due to the effect of the 1500 ohm resistor used to represent the transformer no load losses. Based on the
0 0.05 0.1 0.15 0.2 0.25 0.3 0.35 0.4 0.45 0.5-3
-2
-1
0
1
2
3
4
time(s)
magnitude(A
,Web)
Vs=120 v rms
line current
flux linkage
354 Ataollah Abbasi and S. Hamid Fathi
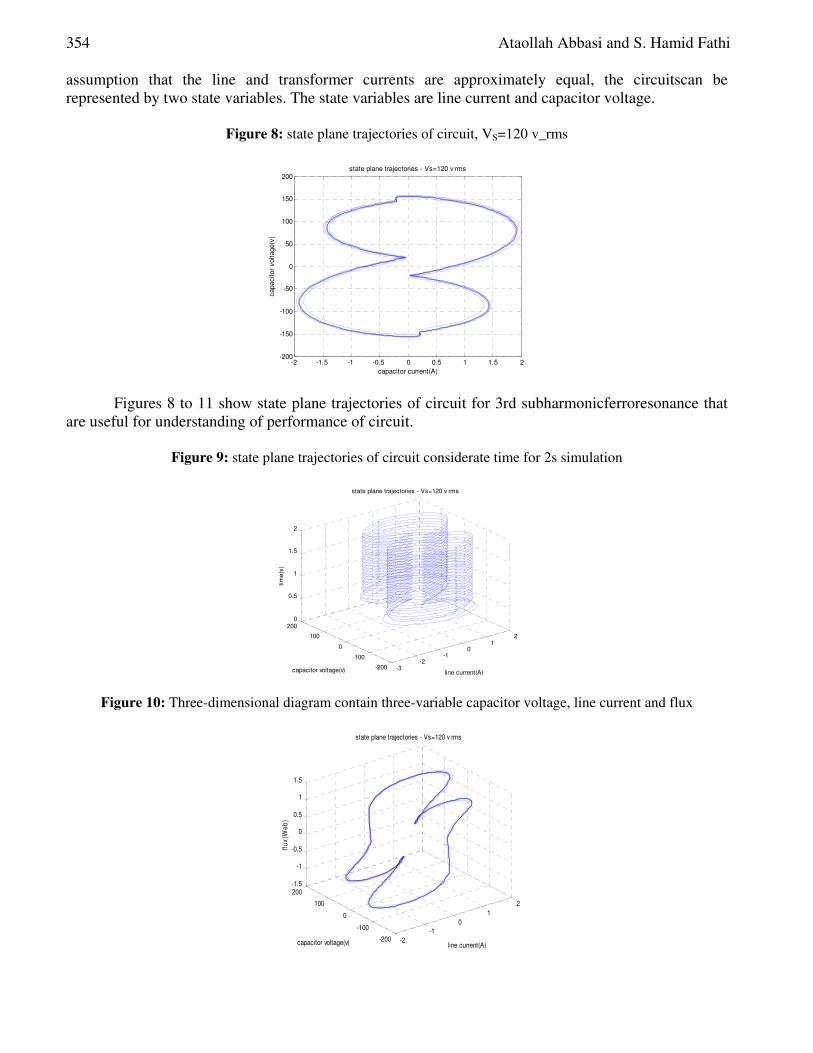
assumption that the line and transformer currents are approximately equal, the circuitscan be
represented by two state variables. The state variables are line current and capacitor voltage.
Figure 8: state plane trajectories of circuit, VS=120 v_rms
Figures 8 to 11 show state plane trajectories of circuit for 3rd subharmonicferroresonance that
are useful for understanding of performance of circuit.
Figure 9: state plane trajectories of circuit considerate time for 2s simulation
Figure 10: Three-dimensional diagram contain three-variable capacitor voltage, line current and flux
-2 -1.5 -1 -0.5 0 0.5 1 1.5 2-200
-150
-100
-50
0
50
100
150
200state plane trajectories - Vs=120 v rms
capacitor current(A)
capacitor
voltage(v
)
-3-2
-10
12
-200
-100
0
100
2000
0.5
1
1.5
2
line current(A)
state plane trajectories - Vs=120 v rms
capacitor voltage(v)
tim
e(s
)
-2
-1
0
1
2
-200
-100
0
100
200-1.5
-1
-0.5
0
0.5
1
1.5
line current(A)
state plane trajectories - Vs=120 v rms
capacitor voltage(v)
flu
x(W
eb
)

Initiation of Ferroresonant Oscillations in Series Capacitors of Power System 355
Figure 11: state plane diagram(flux – current)
Figure 8 shows the phase plane trajectories of circuit at a supply voltage of 0.84per unit. The
shows are the 50Hz trajectory, 3rd subharmonic trajectory from the time domain model.
The ferroresonant circuit also demonstrated the ability to generate 2nd subharmonic voltages,
currents and fluxes. In power systems, the linearity of most system components and the symmetry of
the transformer B-H loops normally dictates that even harmonics cannot occur.
With running and repeating of simulation in over a range of supply voltages, the 2rd
subharmonic mode is sustainable only over a range of supply voltages from 1.4 to 1.68 p.u. Figures 12
and 13 show the Time Domain Modelled voltage, current and flux waveforms at a supply voltage of
1.45 p.u.
Figure: 122
rdsubharmonicferroresonance – voltage waveforms
The key feature of the 2nd subharmonicferroresonant state is that the transformer goes into
"light" saturation twice in one direction followed by one "heavy" saturation in the opposite direction.
This process repeats over 2 complete 50 Hz cycles and hence the resulting waveform has a 2nd
subharmonic fundamental (25 Hz) with higher order harmonics both odd and even (e.g. 50 Hz, 75 Hz,
100 Hz etc.)[23].
-2.5 -2 -1.5 -1 -0.5 0 0.5 1 1.5 2-1.5
-1
-0.5
0
0.5
1
1.5state plane trajectories - Vs=120 v rms
line current(A)
flux(W
eb)
0 0.05 0.1 0.15 0.2 0.25 0.3 0.35 0.4 0.45 0.5-800
-600
-400
-200
0
200
400
600
time(s)
magnitude(v
olt)
Vs=215 v rms
capacitore voltage
supply voltage
transformer voltage
356 Ataollah Abbasi and S. Hamid Fathi
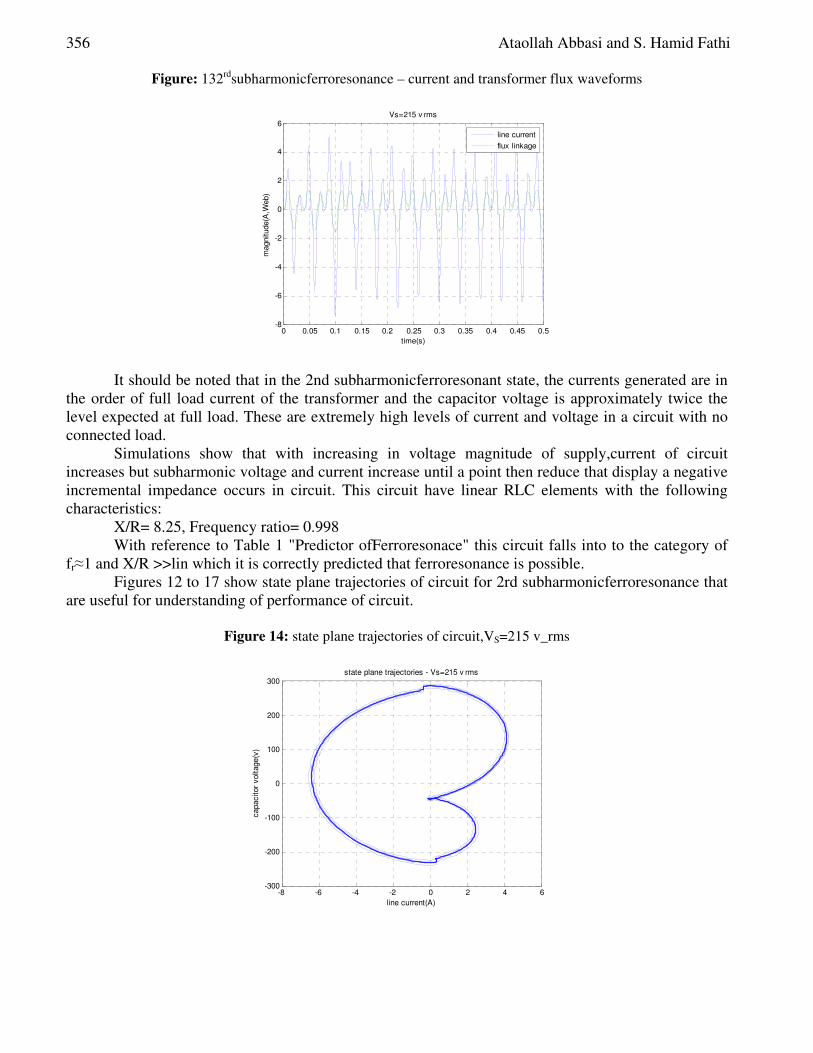
Figure: 132
rdsubharmonicferroresonance – current and transformer flux waveforms
It should be noted that in the 2nd subharmonicferroresonant state, the currents generated are in
the order of full load current of the transformer and the capacitor voltage is approximately twice the
level expected at full load. These are extremely high levels of current and voltage in a circuit with no
connected load.
Simulations show that with increasing in voltage magnitude of supply,current of circuit
increases but subharmonic voltage and current increase until a point then reduce that display a negative
incremental impedance occurs in circuit. This circuit have linear RLC elements with the following
characteristics:
X/R= 8.25, Frequency ratio= 0.998
With reference to Table 1 "Predictor ofFerroresonace" this circuit falls into to the category of
fr≈1 and X/R >>lin which it is correctly predicted that ferroresonance is possible.
Figures 12 to 17 show state plane trajectories of circuit for 2rd subharmonicferroresonance that
are useful for understanding of performance of circuit.
Figure 14: state plane trajectories of circuit,VS=215 v_rms
0 0.05 0.1 0.15 0.2 0.25 0.3 0.35 0.4 0.45 0.5-8
-6
-4
-2
0
2
4
6
time(s)
magnitude(A
,Web)
Vs=215 v rms
line current
flux linkage
-8 -6 -4 -2 0 2 4 6-300
-200
-100
0
100
200
300state plane trajectories - Vs=215 v rms
line current(A)
capacitor
voltage(v
)
Initiation of Ferroresonant Oscillations in Series Capacitors of Power System 357
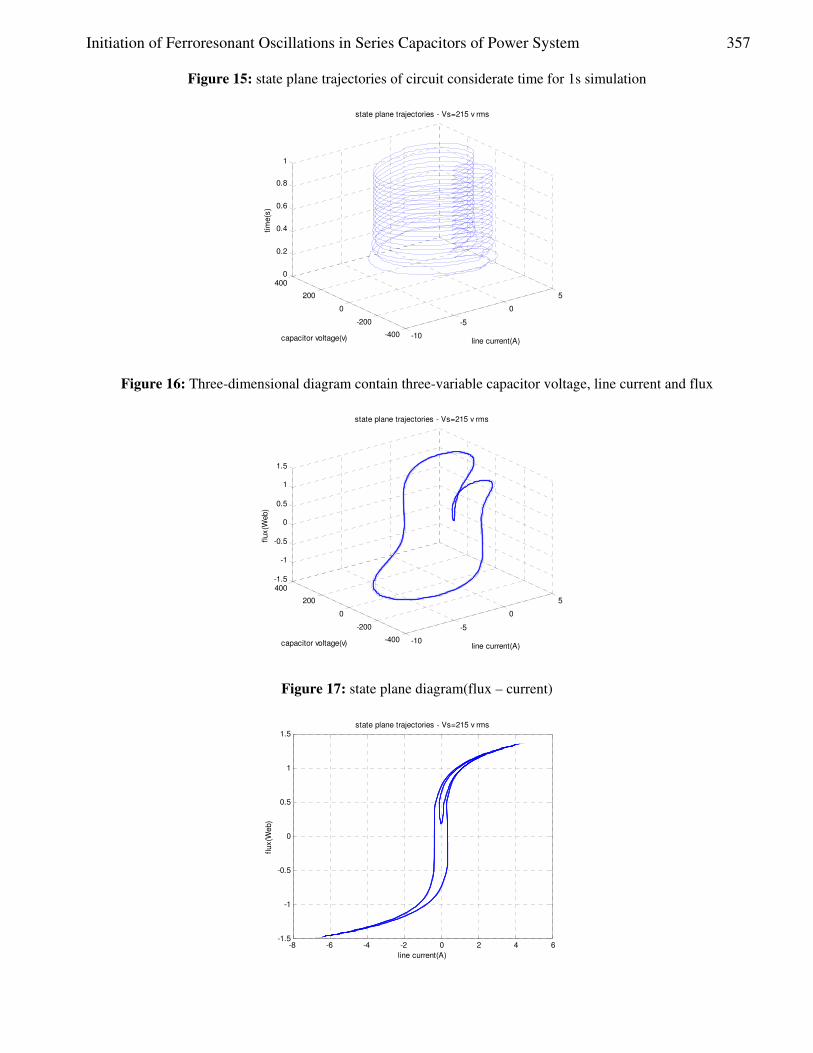
Figure 15: state plane trajectories of circuit considerate time for 1s simulation
Figure 16: Three-dimensional diagram contain three-variable capacitor voltage, line current and flux
Figure 17: state plane diagram(flux – current)
-10
-5
0
5
-400
-200
0
200
4000
0.2
0.4
0.6
0.8
1
line current(A)
state plane trajectories - Vs=215 v rms
capacitor voltage(v)
tim
e(s
)
-10
-5
0
5
-400
-200
0
200
400-1.5
-1
-0.5
0
0.5
1
1.5
line current(A)
state plane trajectories - Vs=215 v rms
capacitor voltage(v)
flux(W
eb)
-8 -6 -4 -2 0 2 4 6-1.5
-1
-0.5
0
0.5
1
1.5state plane trajectories - Vs=215 v rms
line current(A)
flux(W
eb)

358 Ataollah Abbasi and S. Hamid Fathi
Figure 18 shows the variation in capacitor voltage over a range of applied source voltages
i.e.showsthe impact ofchanges inthesupply voltageontheFerroresonance.With running and repeating of
simulation in over a range of supply voltages, the 3rd subharmonic mode is sustainable only over a
range of supply voltages from 0.84 to 1.3 p.u and the 2rd subharmonic mode is sustainable only over a
range of supply voltages from 1.4 to 1.68 p.u.
Figure 18: Bifurcation diagram Ferroresonant capacitor voltage
B. Impact of Core Hysteresis of Transformer on the Ferroresonance in Series Capacitors
Magnetic hysteresis phenomenon also plays an important role in the behavior of a transformer
ferroresonance, however, most transformermodels available for analysis Ferroresonance, hysteresis
effects ignore or consider the main loop. This modeling not reflect real physical behavior of the
magnetic core with respect Ferroresonancephenomenon[24].
Recent studiesshow that providing non-linear areas offerro magnetic iron core such as
saturation, hysteresis, eddycurrentsare importantin Ferroresonance phenomenon. Structure of
hysteresis significantly in Ferroresonance stability especially for chaosand sub-harmonics modes
inmodels of transformer core has an effect. Common approximation to approximate the core non-linear
area with single-valued function without hysteresis like a piece of linear, polynomial, and exponential
has proven to be in adequate for studies about the Ferroresonance in transformers[25].
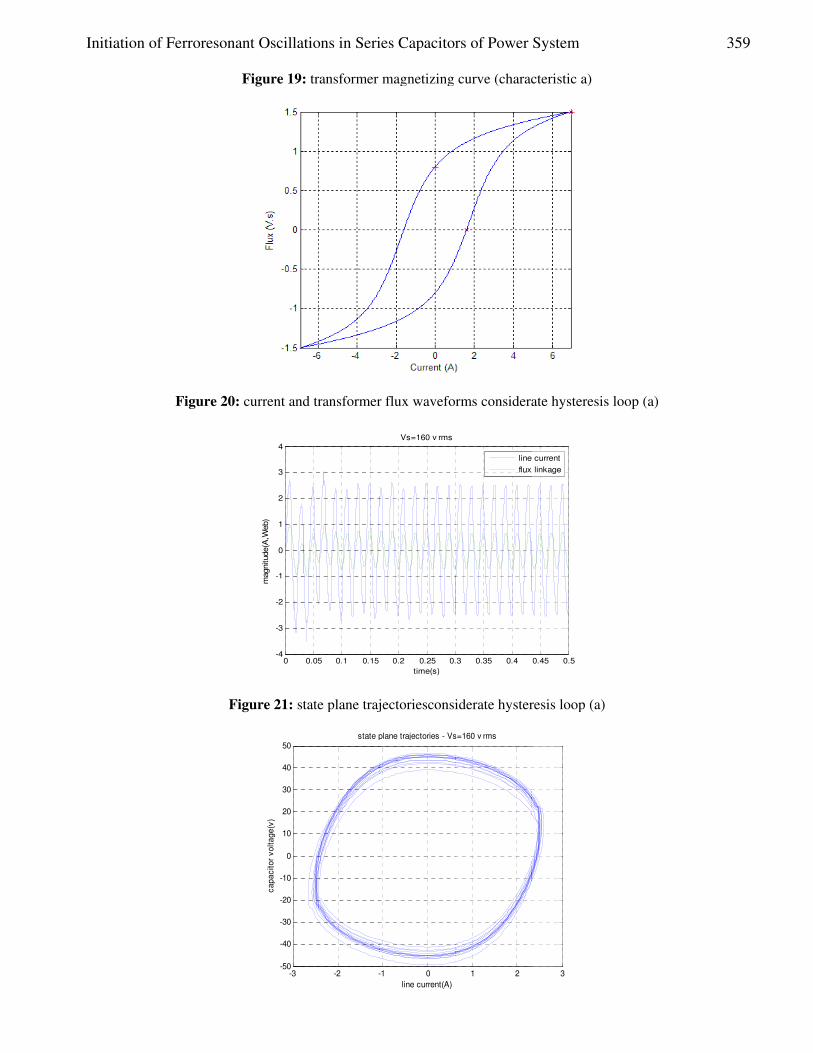
In the circuitof figure 4 was used from themagnetic curve of figure 5 tosimulate the behavior
ofthe transformer core. In the following is used formfigure 19 (characteristic a)formodeling the
behavior ofthetransformer corethatis closertoreality.
After the simulation and observe wave form sand frequency spectrum can understand that the
hysteresis loop has positive role for damping of Ferroresonance. Figures 20 and 21 show thatsub-
harmonic Ferroresonance completely is eliminated that depending on the width of the loop andit's slope
will be differentthe amount of limiting and capacitor currentand voltage significantly are decreased.
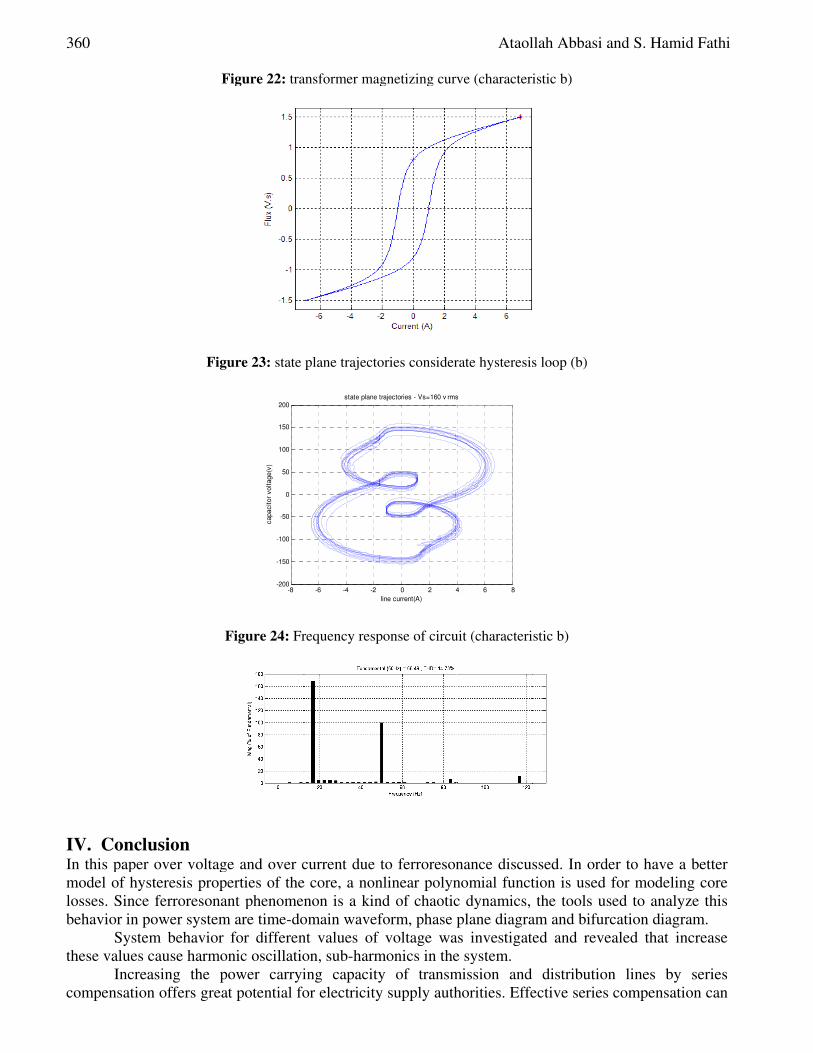
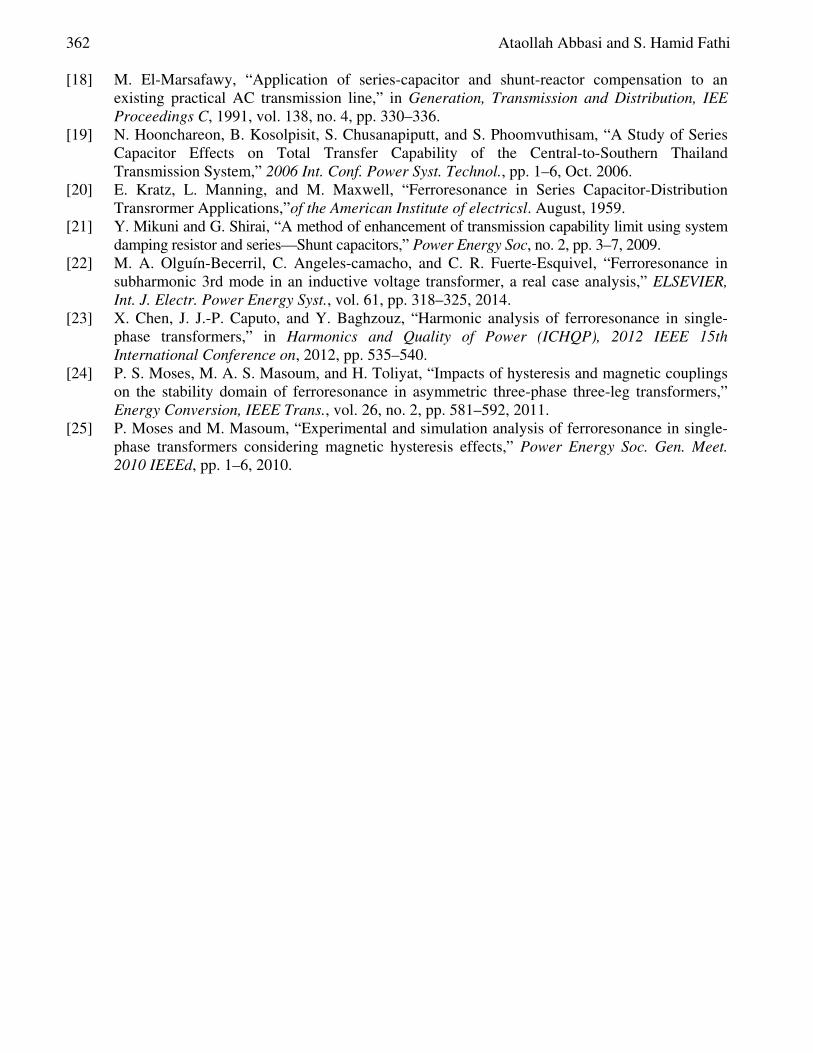
If we use from figure 22 (characteristic b) for transformer characteristicas is observable in
figures 23 and 24 (state plane trajectories and frequency spectrum respectively), due to increase in the
slope of the characteristicand to become thinner hysteresis loop in to characteristic (a), Ferroreson
anceoccurs.
Initiation of Ferroresonant Oscillations in Series
Initiation of Ferroresonant Oscillations in Series
Figure 20
Initiation of Ferroresonant Oscillations in Series
Figure 19:
20: current and transformer flux waveforms considerate hysteresis loop (a)
Figure 21: state plane trajectoriesconsiderate hysteresis loop (a)
0-4
-3
-2
-1
0
1
2
3
4
magnitude(A
,Web)
-3-50
-40
-30
-20
-10
0
10
20
30
40
50
cap
acit
or
volt
age
(v)
Initiation of Ferroresonant Oscillations in Series
: transformer magnetizing curve (characteristic a)
current and transformer flux waveforms considerate hysteresis loop (a)
state plane trajectoriesconsiderate hysteresis loop (a)
0.05 0.1 0.15
-2 -1
state plane trajectories - Vs=160 v rms
Initiation of Ferroresonant Oscillations in Series Capacitors of Power System
transformer magnetizing curve (characteristic a)
current and transformer flux waveforms considerate hysteresis loop (a)
state plane trajectoriesconsiderate hysteresis loop (a)
0.2 0.25 0.3
time(s)
Vs=160 v rms
-1 0
state plane trajectories - Vs=160 v rms
line current(A)
Capacitors of Power System
transformer magnetizing curve (characteristic a)
current and transformer flux waveforms considerate hysteresis loop (a)
state plane trajectoriesconsiderate hysteresis loop (a)
0.3 0.35 0.4
line current
flux linkage
1 2
state plane trajectories - Vs=160 v rms
Capacitors of Power System
transformer magnetizing curve (characteristic a)
current and transformer flux waveforms considerate hysteresis loop (a)
state plane trajectoriesconsiderate hysteresis loop (a)
0.45 0.5
line current
flux linkage
3
current and transformer flux waveforms considerate hysteresis loop (a)
359
360
IV. In this paper over voltage and over curren
model of hysteresis properties of the core, a nonlinear polynomial function is used for modeling core
losses. Since ferroresonant phenomenon is a kind of chaotic dynamics,
behavi
these values cause harmonic oscillation, sub
compensation offers great potential for electricity supply authorities. Effective series compensation can
360
IV. ConclusionIn this paper over voltage and over curren
model of hysteresis properties of the core, a nonlinear polynomial function is used for modeling core
losses. Since ferroresonant phenomenon is a kind of chaotic dynamics,
behavior in power system are time
System behavior for diffe
these values cause harmonic oscillation, sub
Increasing the power carrying capacity of transmission and distribution lines by series
compensation offers great potential for electricity supply authorities. Effective series compensation can
Fig
Figure
Fig
Conclusion In this paper over voltage and over curren
model of hysteresis properties of the core, a nonlinear polynomial function is used for modeling core
losses. Since ferroresonant phenomenon is a kind of chaotic dynamics,
or in power system are time
System behavior for diffe
these values cause harmonic oscillation, sub
easing the power carrying capacity of transmission and distribution lines by series
compensation offers great potential for electricity supply authorities. Effective series compensation can
Figure 22: transformer magnetizing curve (characteristic b)
ure 23: state plane trajectories
Figure 24: Frequency response of circuit (characteristic b)
In this paper over voltage and over curren
model of hysteresis properties of the core, a nonlinear polynomial function is used for modeling core
losses. Since ferroresonant phenomenon is a kind of chaotic dynamics,
or in power system are time-domain waveform, phase plane diagram and bifurcation diagram.
System behavior for different values of voltage
these values cause harmonic oscillation, sub
easing the power carrying capacity of transmission and distribution lines by series
compensation offers great potential for electricity supply authorities. Effective series compensation can
-8-200
-150
-100
-50
0
50
100
150
200
capacitor
voltage(v
)
ransformer magnetizing curve (characteristic b)
state plane trajectories
Frequency response of circuit (characteristic b)
In this paper over voltage and over current due to ferro
model of hysteresis properties of the core, a nonlinear polynomial function is used for modeling core
losses. Since ferroresonant phenomenon is a kind of chaotic dynamics,
domain waveform, phase plane diagram and bifurcation diagram.
rent values of voltage
these values cause harmonic oscillation, sub-harmonics in the system.
easing the power carrying capacity of transmission and distribution lines by series
compensation offers great potential for electricity supply authorities. Effective series compensation can
-6 -4 -2
state plane trajectories - Vs=160 v rms
ransformer magnetizing curve (characteristic b)
state plane trajectories considerate hysteresis loop (b)
Frequency response of circuit (characteristic b)
t due to ferroresonance
model of hysteresis properties of the core, a nonlinear polynomial function is used for modeling core
losses. Since ferroresonant phenomenon is a kind of chaotic dynamics,
domain waveform, phase plane diagram and bifurcation diagram.
rent values of voltage was investigated and revealed that increase
harmonics in the system.
easing the power carrying capacity of transmission and distribution lines by series
compensation offers great potential for electricity supply authorities. Effective series compensation can
0 2 4
state plane trajectories - Vs=160 v rms
line current(A)
Ataollah Abbasi and S. Hamid Fathi
ransformer magnetizing curve (characteristic b)
considerate hysteresis loop (b)
Frequency response of circuit (characteristic b)
resonance discussed. In order to have a better
model of hysteresis properties of the core, a nonlinear polynomial function is used for modeling core
losses. Since ferroresonant phenomenon is a kind of chaotic dynamics,
domain waveform, phase plane diagram and bifurcation diagram.
was investigated and revealed that increase
harmonics in the system.
easing the power carrying capacity of transmission and distribution lines by series
compensation offers great potential for electricity supply authorities. Effective series compensation can
4 6 8
state plane trajectories - Vs=160 v rms
Ataollah Abbasi and S. Hamid Fathi
ransformer magnetizing curve (characteristic b)
considerate hysteresis loop (b)
Frequency response of circuit (characteristic b)
discussed. In order to have a better
model of hysteresis properties of the core, a nonlinear polynomial function is used for modeling core
losses. Since ferroresonant phenomenon is a kind of chaotic dynamics, the tools used to analyze this
domain waveform, phase plane diagram and bifurcation diagram.
was investigated and revealed that increase
easing the power carrying capacity of transmission and distribution lines by series
compensation offers great potential for electricity supply authorities. Effective series compensation can
Ataollah Abbasi and S. Hamid Fathi
discussed. In order to have a better
model of hysteresis properties of the core, a nonlinear polynomial function is used for modeling core
he tools used to analyze this
domain waveform, phase plane diagram and bifurcation diagram.
was investigated and revealed that increase
easing the power carrying capacity of transmission and distribution lines by series
compensation offers great potential for electricity supply authorities. Effective series compensation can

Initiation of Ferroresonant Oscillations in Series Capacitors of Power System 361
reduce voltage regulation in distribution and transmission systems and provide an effective
countermeasure to voltage dips caused by load fluctuations.
A thorough understanding of the possible ferroresonant modes of bahavior is essential when
considering series compensation of distribution and subtransmission lines.
Simulationsshowedthatthehysteresisloop has positive effectonreducing theFerroresonancebutit
should bethat if theloopiswiderandless steep, it increaseinfluence,butwideloopincreases loss andwarmin
the transformerandcreate cost problem in generation.
Refrences [1] M. V. Escudero, I. Dudurych, and M. Redfem, “Understanding ferroresonance,” in Universities
Power Engineering Conference, 2004. UPEC 2004. 39th International, 2004, vol. 3, pp. 1262–1266.
[2] M. R. Iravani, I. E. Hassan, A. J. F. Keri, K. C. Lee, J. A. Martinez, A. S. Morched, B. Mork, M.
Parniani, D. Shirmohammadi, and R. Walling, “Modeling and analysis guidelines for slow transients.
III. The study of ferroresonance,” Power Deliv. IEEE Trans., vol. 15, no. 1, pp. 255–265, 2000.
[3] D. Jacobson, “Examples of ferroresonance in a high voltage power system,” Power Eng. Soc.
Gen. Meet., pp. 1–7, 2003.
[4] R. Dugan, “Examples of ferroresonance in distribution systems,” IEEE Power Eng. Soc. Gen.
Meet., pp. 1–3, 2003.
[5] P. Ferracci, “Ferroresonance,” in Cahier technique Schneider Electric, no. 190, 1998, pp. 1–28.
[6] S.-J. Huang and C.-H. Hsieh, “Relation analysis for ferroresonance of bus potential transformer
and circuit breaker grading capacitance,” ELSEVIER, Int. J. Electr. Power Energy Syst., vol.
51, pp. 61–70, 2013.
[7] R. Rüdenberg, Transient performance of electric power systems: phenomena in lumped
networks. McGraw-Hill, 1950.
[8] A. L. I. Erbay, Parameter study of ferro-resonance with harmonic balance method. 2012.
[9] J. R. Marti and a. C. Soudack, “Ferroresonance in power systems: Fundamental solutions,” IEE
Proc. C Gener. Transm. Distrib., vol. 138, no. 4, p. 321, 1991.
[10] J. Lacerda Ribas, E. M. Lourenco, J. Leite, and N. Batistela, “Modeling Ferroresonance
Phenomena With a Flux-Current Jiles-Atherton Hysteresis Approach,” IEEE Trans. Magn., vol.
49, no. 5, pp. 1797–1800, May 2013.
[11] C. Kieny, “Application of the bifurcation theory in studying and understanding the global
behavior of a ferroresonant electric power circuit,” Power Deliv. IEEE Trans., vol. 6, no. 2, pp.
866–872, 1991.
[12] F. Wörnle, D. K. Harrison, and C. Zhou, “Analysis of a ferroresonant circuit using bifurcation
theory and continuation techniques,” Power Deliv. IEEE Trans., vol. 20, no. 1, pp. 191–196, 2005.
[13] H. R. Abbasi Fordoei, A. Gholami, S. H. Fathi, and A. Abbasi, “Chaotic oscillations control in
the voltage transformer including nonlinear core loss model by a nonlinear robust adaptive
controller,” Int. J. Electr. Power Energy Syst., vol. 47, pp. 280–294, May 2013.
[14] P. Sakarung, A. O. Differential, and E. Model, “Bifurcation diagram with Electromagnetic
Transient Program (EMTP) for ferroresonance analysis,” in Electrical Engineering/Electronics
Computer Telecommunications and Information Technology (ECTI-CON), 2010 International
Conference on, 2010, pp. 289–292.
[15] J. S. J. Hedin and L. H. L. Paulsson, “Application and evaluation of a new concept for compact
series compensation for distribution networks,” in Electricity Distribution, 1993. CIRED. 12th
International Conference on, 1993, pp. 1–22.
[16] A. A. A. Razavi and H. Samet, “A protection scheme for series capacitor compensated
transmission lines that uses DC component of line current,” in Electrical Engineering (ICEE),
2013 21st Iranian Conference on, 2013, pp. 1–6.
[17] S. Das and D. Das, “Series capacitor compensation for radial distribution networks,”
ISGT2011-India, pp. 178–182, Dec. 2011.
362 Ataollah Abbasi and S. Hamid Fathi
[18] M. El-Marsafawy, “Application of series-capacitor and shunt-reactor compensation to an
existing practical AC transmission line,” in Generation, Transmission and Distribution, IEE
Proceedings C, 1991, vol. 138, no. 4, pp. 330–336.
[19] N. Hoonchareon, B. Kosolpisit, S. Chusanapiputt, and S. Phoomvuthisam, “A Study of Series
Capacitor Effects on Total Transfer Capability of the Central-to-Southern Thailand
Transmission System,” 2006 Int. Conf. Power Syst. Technol., pp. 1–6, Oct. 2006.
[20] E. Kratz, L. Manning, and M. Maxwell, “Ferroresonance in Series Capacitor-Distribution
Transrormer Applications,”of the American Institute of electricsl. August, 1959.
[21] Y. Mikuni and G. Shirai, “A method of enhancement of transmission capability limit using system
damping resistor and series—Shunt capacitors,” Power Energy Soc, no. 2, pp. 3–7, 2009.
[22] M. A. Olguín-Becerril, C. Angeles-camacho, and C. R. Fuerte-Esquivel, “Ferroresonance in
subharmonic 3rd mode in an inductive voltage transformer, a real case analysis,” ELSEVIER,
Int. J. Electr. Power Energy Syst., vol. 61, pp. 318–325, 2014.
[23] X. Chen, J. J.-P. Caputo, and Y. Baghzouz, “Harmonic analysis of ferroresonance in single-
phase transformers,” in Harmonics and Quality of Power (ICHQP), 2012 IEEE 15th
International Conference on, 2012, pp. 535–540.
[24] P. S. Moses, M. A. S. Masoum, and H. Toliyat, “Impacts of hysteresis and magnetic couplings
on the stability domain of ferroresonance in asymmetric three-phase three-leg transformers,”
Energy Conversion, IEEE Trans., vol. 26, no. 2, pp. 581–592, 2011.
[25] P. Moses and M. Masoum, “Experimental and simulation analysis of ferroresonance in single-
phase transformers considering magnetic hysteresis effects,” Power Energy Soc. Gen. Meet.
2010 IEEEd, pp. 1–6, 2010.