influence of sea surface temperature on the intraseasonal … · 2013-05-08 · western north...
TRANSCRIPT
Influence of sea surface temperature on the intraseasonalvariability of the South China Sea summer monsoon
Mathew Roxy • Youichi Tanimoto
Received: 1 March 2011 / Accepted: 1 June 2011 / Published online: 16 June 2011
� Springer-Verlag 2011
Abstract The objective of this study is to examine, based
on recently available high resolution satellite and obser-
vational data, the evolution and role of sea surface tem-
perature (SST) in influencing the intraseasonal variability
of the South China Sea (SCS) summer monsoon (SM). The
study focuses on the 30–60 day timescale when the north-
ward propagating anomalies are dominant over the SCS.
Composite analysis of the SST maximum events during
SCS SM shows that increased SST anomalies over the SCS
are significantly influenced by the downward shortwave
radiation flux anomalies, with the suppressed surface latent
heat flux anomalies supplementing to it. A thermal damp-
ing of the positive SST anomalies induces positive upward
heat fluxes, which then destabilize the lower atmosphere
between 1,000 and 700 hPa. The positive SST anomalies
lead the positive precipitation anomalies over the SCS by
10 days, with a significant correlation (r = 0.44) between
the SST-precipitation anomalies. The new findings here
indicate an ocean-to-atmosphere effect over the SCS,
where underlying SST anomalies tend to form a favorable
condition for convective activity and sustain enhanced
precipitation during the SCS SM. It is also argued, based
on our observations, that the negative sea level pressure
anomalies induced by the positive SST anomalies play a
role in enhancing the northward propagation of the intra-
seasonal anomalies over the SCS.
Keywords South China Sea � Asian monsoon �Ocean atmosphere interaction � Intraseasonal variablity
1 Introduction
The South China Sea (SCS), the largest marginal sea in the
western North Pacific Ocean, is overlaid by a pronounced
monsoon surface wind. The Indian and East Asian mon-
soon systems interact over the SCS region (Chen and Chen
1995; Lau et al. 1998; Mao and Chan 2005). In addition,
the onset of the SCS summer monsoon (SM) indicates the
onset of the East Asian summer monsoon (Tao and Chen
1987; Murakami and Matsumoto 1994; Wu and Wang
2000, 2001) and hence it is of significant interest to
understand the intraseasonal variability of the SCS SM.
Intraseasonal variability of the SCS SM involves two
intraseasonal time scales in the periods ranging from 10 to
20 days (Krishnamurti and Ardanuy 1980) and 30–60 days
(Murakami et al. 1984; Krishnamurti and Subrahmanyam
1982; Lau and Peng 1987). The 10–20 day time scale is
observed to exhibit dominant westward propagation while
the 30–60 day time scale is observed to exhibit dominant
northward propagation (Chen and Chen 1993; Chen and
Chen 1995). An examination of the intraseasonal vari-
ability based on the data from South China Sea Monsoon
This paper is a contribution to the special issue on Global Monsoon
Climate, a product of the Global Monsoon Working Group of the Past
Global Changes (PAGES) project, coordinated by Pinxian Wang, Bin
Wang, and Thorsten Kiefer.
M. Roxy (&)
Centre for Climate Change Research,
Indian Institute of Tropical Meteorology,
Pune 411008, India
e-mail: [email protected]
M. Roxy � Y. Tanimoto
Faculty of Environmental Earth Science and Graduate School
of Environmental Science, Hokkaido University, Sapporo,
Hokkaido, Japan
Y. Tanimoto
Research Institute for Global Change,
JAMSTEC, Yokohama, Kanagawa, Japan
123
Clim Dyn (2012) 39:1209–1218
DOI 10.1007/s00382-011-1118-x

Experiment (SCSMEX), showed that these two intrasea-
sonal time scale influence the maintenance and break of the
SCS SM (Chan et al. 2002). Mao and Chan (2005), using
NCEP-NCAR reanalysis data, found that both of the time
scales are distinct, that they do not always exist simulta-
neously in a particular year, and their contributions to the
overall variations differ among different years. They also
found that for the years when both time scales are present, the
SCS SM activities are basically controlled by the 30–60 day
time scale, though modified by the 10–20 day time scale.
Isoguchi and Kawamura (2006) observed significantly large
covariance in the SST anomalies and a 30–60 day intrasea-
sonal variability index based on zonal winds and outgoing
longwave radiation over the western SCS.
Several of the studies dealing with the SCS SM have
explored the atmospheric variability involved in the intra-
seasonal variability and its northward propagation charac-
teristics, but only a handful of studies have examined the role
of the underlying SST on it (e.g., Xie et al. 2007; Wu 2010).
Understanding the SST-precipitation relationship and the
ocean-to-atmosphere processes involved in it is crucial for
evaluating and rectifying model forecasts (Wu et al. 2006,
2008). For example, Wu et al. (2008) using local SST-pre-
cipitation relationship found out discrepancy between an
ocean-to-atmosphere coupled model and observations with
the SST lag time longer in the model than in observations.
This was attributed to a slower SST response to atmospheric
changes in the model, as compared to observations.
Kemball-Cook and Wang (2001) attempted to evaluate
the processes involved in the northward propagating in-
traseasonal anomalies over Indian Ocean and western
tropical Pacific. They suggested that, over these regions,
the negative latent heat flux (upward negative) anomalies
enhance the northward propagating convective anomalies
through an increase in the moist static energy. A study on
the thermodynamics involved in the northward propagating
anomalies over the Indian Ocean was carried out by Roxy
and Tanimoto (2007) using satellite data based on the
Tropical Rainfall Measuring Mission (TRMM). They
found that, over the off-equatorial regions, the underlying
SST anomalies induce unstable conditions in the lower
atmosphere and enhance the northward propagating pre-
cipitation anomalies. The climatological features of the
SCS region are comparable to that of the north Indian
Ocean. During the summer monsoon, surface winds over
the SCS region are southwesterly (Fig. 1a) as over the
Indian Ocean. Also, the mean SST during this period is
above 27�C (Fig. 1a), which is conducive for enhanced
convective precipitation (Lau et al. 1997). Sengupta et al.
(2001) showed that SST intraseasonal variability over the
SCS is among the highest over the tropics. Hence under-
standing the ocean-to-atmosphere interactions involving
SST during the SCS SM on intraseasonal timescales is of
paramount importance.
Fu et al. (2008), using ensemble forecasts from five
different lower boundary conditions, by changing the
coupling between the atmosphere and ocean, pointed out
that positive intraseasonal SST anomalies in the western
Pacific Ocean trigger convective disturbances by moisten-
ing and warming up the atmospheric boundary layer. The
role of intraseasonal SST anomalies in assisting the con-
vection, particularly for the SCS SM onset, was examined
by Wu (2010) by analyzing satellite observations along
with reanalysis data. Their study indicated that the north-
ward propagation of these SCS SM intraseasonal anomalies
is related to the ocean-to-atmosphere interaction, involving
the wind-evaporation and cloud-radiation effects on SST as
well as SST impacts on lower-level convergence over the
equatorial western Pacific and atmospheric instability over
the Philippine Sea and the South China Sea. Zeng and
Wang (2009) estimated latent heat flux anomalies from
TRMM satellite SST, wind speed and total precipitable
water, and revealed northward propagation of latent heat
flux anomalies over the SCS, which they attributed as a
response to the northward propagating intraseasonal
anomalies within the 30–60 day timescales.
Fig. 1 a Climatology of SST
(colors; unit �C) and surface
winds (vectors) over SCS during
April–July (1998–2009).
Scaling of vectors (unit ms-1) is
given on top of the figure.
b Standard deviation of
intraseasonal variability of SST
(unit �C) during the same
period. Shading conventions are
represented at the side of the
figures
1210 M. Roxy, Y. Tanimoto: Influence of SST on the ISV of theSCS summer monsoon
123

Wu (2010) focuses on the onset of the SCS SM, and
consider both the 10–20 and 30–60 day intraseasonal time
scales together in their analysis. Studies, however, show
that the propagation and evolution of monsoon intrasea-
sonal signals are distinct and that they undergo different
ocean-to-atmosphere interaction due to their contrasting
temporal evolutions (Kajikawa and Yasunari 2005; Mao
and Chan 2005; Zheng et al. 2004). Due to the crucial part
played by the SCS SM intraseasonal anomalies in the East
Asian summer monsoon, it is imperative that a role of
ocean in influencing the northward propagating monsoon
intraseasonal anomalies, that is in the 30–60 day time
scales, during the whole period of the SCS SM is investi-
gated. Examining this role, and providing a step by step
process of the ocean-to-atmosphere interaction involved, is
the primary objective of the present work. Also, the earlier
studies which established some observational evidence for
the role of ocean on intraseasonal monsoon anomalies
(Roxy and Tanimoto 2007; Wu 2010), depend heavily on
the NCEP Reanalysis II for the surface variables such as
the heat fluxes, winds and air temperature. This model-
dependence will essentially cause an over-matching rela-
tionship among these variables and possibly over-estimate
the local ocean atmosphere relationship to a large degree.
In the present study we use real observation based latent
heat and shortwave fluxes, and surface satellite winds, thus,
considerably improving the quality of the analysis.
Wang and Wu (1997a) showed that, from May to July,
the intraseasonal variability of SCS SM is primarily asso-
ciated with a northward propagation of the intraseasonal
anomalies from the equator to 25�N. Recent studies (e.g.,
Wu 2010) indicates the occurrence of intraseasonal
anomalies along with the monsoon onset, in April also.
Hence, we examine the intraseasonal SCS SM variability
during April–July over the SCS domain 5�S–25�N,
105–125�E, where the northward propagating intraseasonal
anomalies are most significant.
2 Data and analysis methods
This study examines a suite of new high resolution satellite
observations of SST, sea surface wind, and precipitation
and objective analysis of latent heat and shortwave fluxes.
The fact that these high quality datasets are available for
the last 12 years (since the year 1998) helps us in analyzing
significantly large number of intraseasonal events,
improving the confidence in the present results.
The 3 day running mean SST and precipitation based on
the TRMM Microwave Imager (TMI) on 0.25� grid, from
the year 1998 to 2009 is used in this study. Using micro-
wave sensors, TMI measures SST and surface wind speed
nearly free of cloud influence over the tropical-extra
tropical regions within 38�N/S, with a spatial resolution of
0.25�and temporal resolution of 2–3 days (Wentz et al.
2000). This substantially improves the sampling of SST
over cloudy regions like SCS during summer (Xie et al.
2001). Many studies have used outgoing longwave radia-
tion (OLR) values to examine the development of SCS SM
(e.g., Mao and Chan 2005) while an improvement in the
present study is that the TMI precipitation is used.
Sea surface winds are obtained from the microwave
scatterometer on the QuikSCAT satellite which measures
surface wind velocity over the world ocean on a daily basis
on a 0.25� grid (Liu et al. 2000). The QuikSCAT obser-
vations are available from August 1999 only. The Euro-
pean Remote Sensing (ERS) scatterometer, though at a
coarser resolution (1� grid), provides surface wind obser-
vations for a longer period, and hence is blended to make a
daily surface wind dataset for the years 1998–2009 for
consistency with the other datasets.
The surface latent heat flux (SLHF) data is obtained
from the Objectively Analyzed Air–Sea Fluxes (OAFlux)
project (Yu et al. 2008), an optimal blending of multi-
platform satellite retrievals and numerical weather predic-
tion reanalyses and the downward shortwave radiation flux
(DSWRF) is obtained from the International Satellite
Cloud Climatology Project (ISCCP), both at 1� grid with a
temporal resolution of 1 day. The satellite and observed
fields are supplemented with daily air temperature, specific
humidity and sea level pressure (SLP) at 1.5� grid based on
the European Centre for Medium- Range Weather Fore-
casts (ECMWF) Interim (ERA-Interim) reanalysis. The
lower tropospheric air temperature and specific humidity is
used to derive the equivalent potential temperature (he),
which is a useful parameter in understanding the atmo-
spheric stability. The lower tropospheric stability is esti-
mated as a difference in he between 1,000 and 700 hPa,
following Roxy and Tanimoto (2007).
Data of SST and precipitation between April 1 and July
31 from 1998 to 2009 are interpolated to daily for com-
patibility among variables. Anomalies are obtained for all
variables by removing the seasonal means for each of
individual years. These anomalies are band pass filtered for
30–60 days to retain the northward propagating intrasea-
sonal anomalies over the SCS. These intraseasonally fil-
tered anomalies are used in the present study.
3 Results
3.1 Intraseasonal variability and SST-precipitation
relationship in the SCS
To analyze the regional characteristics of intraseasonal
variability over the SCS, we plot the summertime standard
M. Roxy, Y. Tanimoto: Influence of SST on the ISV of theSCS summer monsoon 1211
123
deviations (April–July) of intraseasonal SST variability in
Fig. 1b. Large standard deviations of the intraseasonal
variability emerge over the central-western SCS
(107–114�E, 9–12�N). The significantly large standard
deviation over this region can be attributed to the upwelling
over this region due to the strong monsoon winds during
boreal summer (Xie et al. 2003). This is similar to the
region of large covariance observed by Isoguchi and
Kawamura (2006; 109–114�E, 9–12�N) at periods of
30–60 days during June–September. In the present study,
we observe standard deviations of similar magnitude over
the northeastern SCS also. Due to its pivotal position, we
utilize the central part of SCS with large SST variability in
the inset rectangle over 109–114�E, 9–12�N (Fig. 1b), to
examine the development and sustenance of intraseasonal
SST and precipitation over SCS SM. This will help in
getting a better perspective of the intraseasonal anomalies
along with the evolution and degeneration of the SST
anomalies, and any associated propagation of the intra-
seasonal anomalies from south to north.
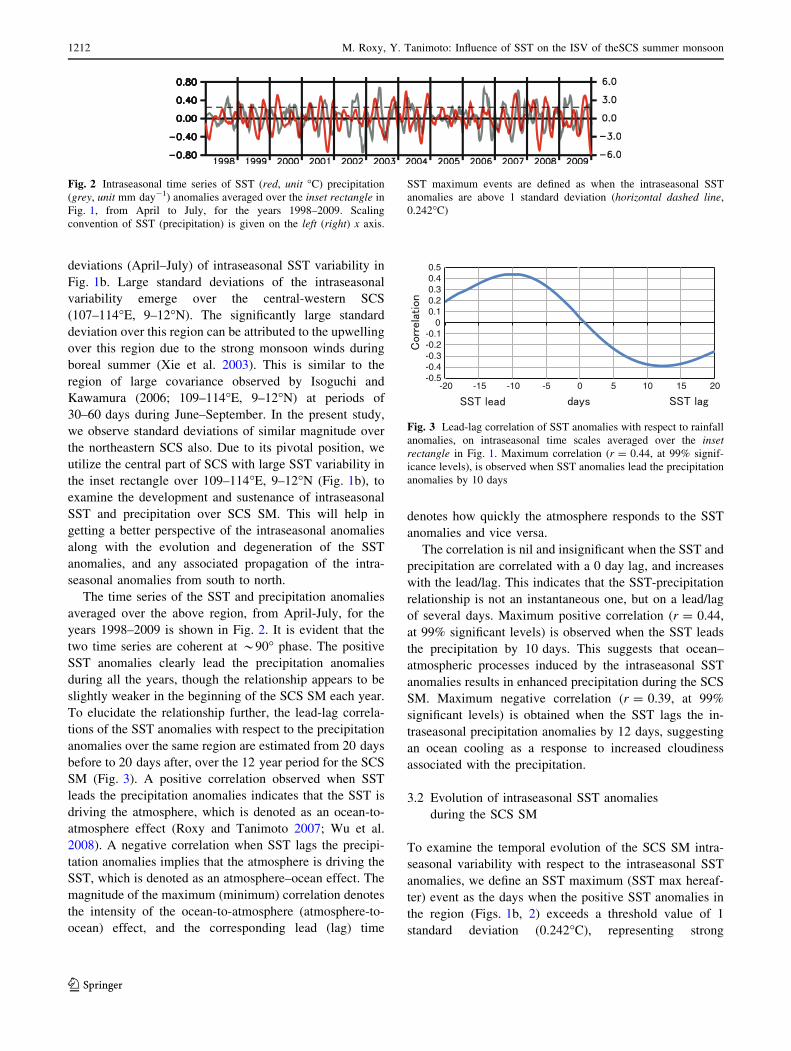
The time series of the SST and precipitation anomalies
averaged over the above region, from April-July, for the
years 1998–2009 is shown in Fig. 2. It is evident that the
two time series are coherent at *90� phase. The positive
SST anomalies clearly lead the precipitation anomalies
during all the years, though the relationship appears to be
slightly weaker in the beginning of the SCS SM each year.
To elucidate the relationship further, the lead-lag correla-
tions of the SST anomalies with respect to the precipitation
anomalies over the same region are estimated from 20 days
before to 20 days after, over the 12 year period for the SCS
SM (Fig. 3). A positive correlation observed when SST
leads the precipitation anomalies indicates that the SST is
driving the atmosphere, which is denoted as an ocean-to-
atmosphere effect (Roxy and Tanimoto 2007; Wu et al.
2008). A negative correlation when SST lags the precipi-
tation anomalies implies that the atmosphere is driving the
SST, which is denoted as an atmosphere–ocean effect. The
magnitude of the maximum (minimum) correlation denotes
the intensity of the ocean-to-atmosphere (atmosphere-to-
ocean) effect, and the corresponding lead (lag) time
denotes how quickly the atmosphere responds to the SST
anomalies and vice versa.
The correlation is nil and insignificant when the SST and
precipitation are correlated with a 0 day lag, and increases
with the lead/lag. This indicates that the SST-precipitation
relationship is not an instantaneous one, but on a lead/lag
of several days. Maximum positive correlation (r = 0.44,
at 99% significant levels) is observed when the SST leads
the precipitation by 10 days. This suggests that ocean–
atmospheric processes induced by the intraseasonal SST
anomalies results in enhanced precipitation during the SCS
SM. Maximum negative correlation (r = 0.39, at 99%
significant levels) is obtained when the SST lags the in-
traseasonal precipitation anomalies by 12 days, suggesting
an ocean cooling as a response to increased cloudiness
associated with the precipitation.
3.2 Evolution of intraseasonal SST anomalies
during the SCS SM
To examine the temporal evolution of the SCS SM intra-
seasonal variability with respect to the intraseasonal SST
anomalies, we define an SST maximum (SST max hereaf-
ter) event as the days when the positive SST anomalies in
the region (Figs. 1b, 2) exceeds a threshold value of 1
standard deviation (0.242�C), representing strong
Fig. 2 Intraseasonal time series of SST (red, unit �C) precipitation
(grey, unit mm day-1) anomalies averaged over the inset rectangle in
Fig. 1, from April to July, for the years 1998–2009. Scaling
convention of SST (precipitation) is given on the left (right) x axis.
SST maximum events are defined as when the intraseasonal SST
anomalies are above 1 standard deviation (horizontal dashed line,
0.242�C)
-0.5-0.4-0.3-0.2-0.1
00.10.20.30.40.5
-20 -15 -10 -5 0 5 10 15 20
Fig. 3 Lead-lag correlation of SST anomalies with respect to rainfall
anomalies, on intraseasonal time scales averaged over the insetrectangle in Fig. 1. Maximum correlation (r = 0.44, at 99% signif-
icance levels), is observed when SST anomalies lead the precipitation
anomalies by 10 days
1212 M. Roxy, Y. Tanimoto: Influence of SST on the ISV of theSCS summer monsoon
123

anomalous intraseasonal variability. Most of the SST max
events sustain for an average duration of *12 days. Eigh-
teen events of SST max are identified during 1998–2009.
Composites of all variables, for all the ±20 days with
respect to the SST max are prepared. This period (41 days)
roughly includes the evolution and sustenance of the posi-
tive SST anomalies (12? days) and the processes leading to
the positive precipitation anomalies (10 days).
Latitude-time plots of daily composite variables aver-
aged over the region of 105–125�E are shown in Fig. 4.
Coherent northward migrations of the anomalies over the
SCS are observed from the equator towards the northern
SCS, up to 25�N. The average propagation speed of the
anomalies, from 0� to 20�N, is about 1.0� latitude per day
(20�/20 days). Fig. 4a–d shows the variables and processes
involved in the evolution of positive SST anomalies. It is
observed that the anomalous easterly surface winds
(Fig. 4a) which oppose the climatological southwesterlies
(Fig. 1a) induce reduced evaporative cooling as shown by
positive SLHF anomalies (Fig. 4b, *10 W m-2 and
downward positive). Positive DSWRF anomalies (Fig. 4c,
*14 W m-2) appear at the same time, with intensity
greater than the SLHF anomalies, warming the ocean
surface. The positive DSWRF anomalies are as a result of a
clearer sky, indicated by the negative precipitation anom-
alies in Fig. 4h. On comparison, the SLHF anomalies are
less prominent over the off-equatorial regions, and do not
exhibit considerable northward propagation. Positive sen-
sible heat net flux and net longwave radiation flux anom-
alies were also observed to be in phase with the other
(a) (b) (c) (d)
(h)(g)(f)(e)
Fig. 4 Hovmoller plots of intraseasonal anomalies of (a) surface
zonal wind (colors; unit ms-1), (b) surface latent heat flux (colors;
unit W m-2), (c) downward shortwave radiation flux (colors; unitW m-2), (d) meridional sea level pressure gradient (colors; unit hPa/�latitude), (e) surface air temperature (colors; unit �C), (f) he at
1,000 hPa (colors; unit K) (g) Dhe (colors; unit K) and (h) precipi-
tation (colors; unit mm day-1) over the SCS (105–125�E), with
respect to the SST maximum at day = 0. Contour lines of SST
anomalies (interval: 0.1�C) are superimposed, with negative values
dashed. Coloring convention is represented at the side of each panel
M. Roxy, Y. Tanimoto: Influence of SST on the ISV of theSCS summer monsoon 1213
123
surface heat fluxes but they are too small in comparison
and hence not shown here. This suggests that DSWRF and
SLHF anomalies contribute to the evolution of positive
SST anomalies (*0.4�C, contours in Fig. 4) with the
DSWRF anomalies playing significant role over the off-
equatorial region. The SST anomalies appear to show a
comparatively slower propagation with respect to the
winds and other intraseasonal anomalies. This can be
attributed to the fact that, other than the DSWRF anomalies
with prominent northward propagation, the SLHF anoma-
lies with a slower northward propagation also contribute to
the formation of SST anomalies.
The extent to which the surface heat flux anomalies can
account for the observed intraseasonal variations of SST
were examined using the SST tendency equation
oTs
ot¼ Ftot
qcph
where Ts is the SST, Ftot is the total heat flux, q is density
of water, cp is the specific heat of water at constant pres-
sure, and h is the mixed layer depth (MLD). The thickness
of the MLD is a key factor influencing SST. In the nearby
western Pacific warm pool, where MLD is deep, water
upwelled from the subsurface is not very much different in
temperature from the surface water, and as a result, ocean
dynamics has little effect on the surface thermal structure
(Qu et al. 1997). However, this does not seem to be the
case in the SCS, where MLD is shallow and upwelling
occurs intermittently throughout the year (Chao et al.
1996). As a result, over the SCS, MLD may reach up to
60 m in winter and shoal down to about 30 m during
summer (Qu 2001). In the present study, we use the MLD
averaged at 30 m for the SCS SM during April–July. With
the MLD defined as above, the observed SST tendency
varied coherently with those derived from the surface heat
fluxes, both in amplitude and phase, indicating that the
surface heat flux anomalies account for the observed SST
variability. For instance, with an Ftot of 28 W m-2, h of
30 m and standard values of q (1.024 g cm-3) and cp
(3.898 J g-1�C-1), the heat flux forcing estimated is in the
order of 0.023�C day-1. This is comparable to the SST
variability of 0.027�C day-1, estimated for an SST change
of 0.8�C in 30 days.
3.3 Ocean-to-atmosphere effect over the SCS
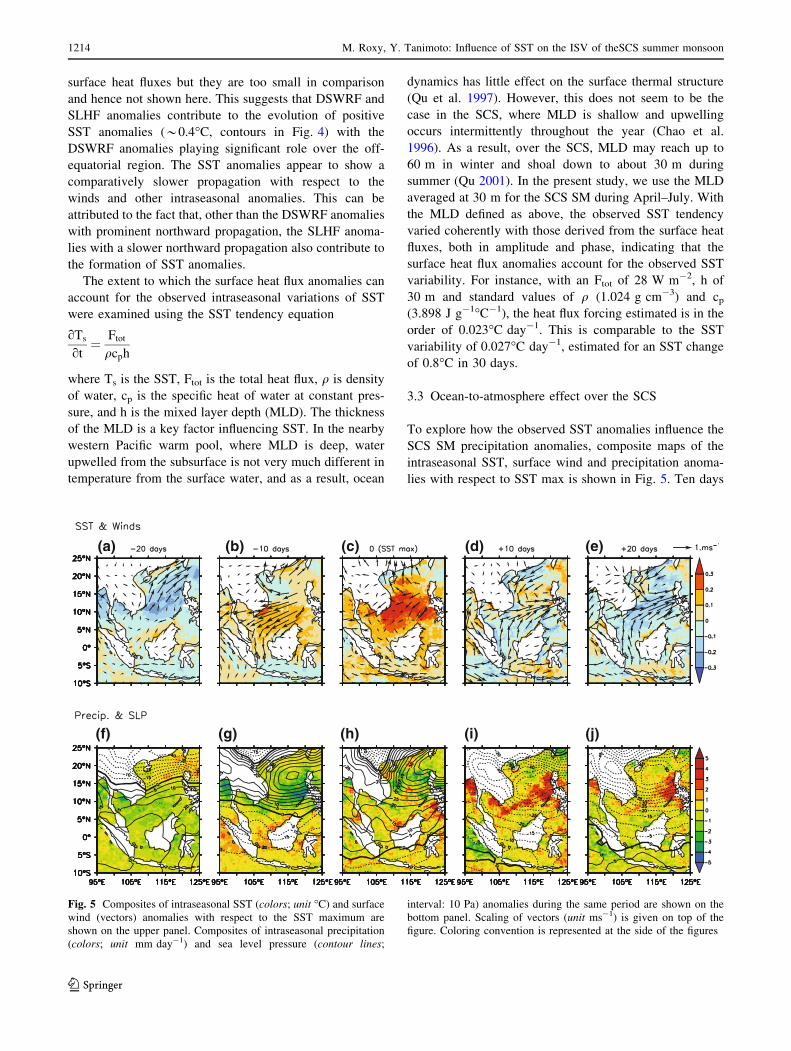
To explore how the observed SST anomalies influence the
SCS SM precipitation anomalies, composite maps of the
intraseasonal SST, surface wind and precipitation anoma-
lies with respect to SST max is shown in Fig. 5. Ten days
(a) (b) (c) (d) (e)
(j)(i)(h)(g)(f)
Fig. 5 Composites of intraseasonal SST (colors; unit �C) and surface
wind (vectors) anomalies with respect to the SST maximum are
shown on the upper panel. Composites of intraseasonal precipitation
(colors; unit mm day-1) and sea level pressure (contour lines;
interval: 10 Pa) anomalies during the same period are shown on the
bottom panel. Scaling of vectors (unit ms-1) is given on top of the
figure. Coloring convention is represented at the side of the figures
1214 M. Roxy, Y. Tanimoto: Influence of SST on the ISV of theSCS summer monsoon
123

before the SST max (Fig. 5g), weakly positive anomalies
(*2 mm day-1) of precipitation are found in the south of
the SCS. These precipitation anomalies propagate north-
ward and begin to intensify (above 6 mm day-1), eventu-
ally triggering enhanced precipitation over the central SCS
(Fig. 5i), 10 days after the SST max.
In the region of the enhanced precipitation anomalies, an
anomalous convergence of surface winds is observed in the
10–15�N zonal band (Fig. 5d). Increased precipitation from
10 to 20 days after SST max is associated with the inten-
sification of the surface convergence indicated by Fig. 5d,
e. The intraseasonal surface wind anomalies over the
central SCS during the prior to SST max are northeasterlies
(*1 ms-1), which results in reduced wind speed as the
seasonal mean winds are southwesterly. This weak wind
speed causes the positive SST anomalies by the reduced
heat release from the ocean. At the same time, as a result of
a clearer sky indicated by the negative precipitation
anomalies during SST max, the incoming shortwave radi-
ation also increases, supplementing to the SST anomalies
(*0.4�C) over the same region, forming a meridional
gradient with positive (negative) SST anomalies in the
center (south) of the SCS (Fig. 5b). This is followed by the
strengthening of the anomalous southwesterlies (*2 ms-1)
in the central SCS (Fig. 5d).
Figure 4e–h shows the latitude-time plots of intrasea-
sonal anomalies involved in the SST-precipitation rela-
tionship. Coherent northward migrations of the anomalies
over the SCS are observed at a phase speed of 1�/day, from
equator to about 25�N. The local SST maximum leads
relative to the northward-migrating enhanced precipitation,
indicating that a warm ocean surface induced by weak
wind speed and increased solar radiation may contribute to
a favorable condition of the convective activity as like in
the tropics (Fig. 4h). The positive SST anomalies
(0.2–0.4�C) lead the positive precipitation anomalies
(4–6 mm day-1) by about 10 days (Figs. 2, 4, and 5).
Though less intensive, the negative SST and precipitation
anomalies follow the positive anomalies, making an in-
traseasonal cycle of 40–50 days. For simplicity, we will
focus on the positive precipitation associated with the SST
maximum.
During the SST maximum, both the SST and SAT
anomalies are positive and exhibit northward propagation
simultaneously (Fig. 4e). In addition, upward heat flux
anomalies act as a thermal damping of the positive SST,
indicating an ocean-to-atmosphere effect. Such an ocean-
to-atmosphere effect induce the positive anomalies in Dhe
(0.2�C) over the same region (Fig. 4g), a condition favor-
ing convective activity. Indeed, he1,000 anomalies were
observed to be similar to the SAT anomalies (Fig. 4f). The
positive Dhe anomalies render adequate unstable condition
before the precipitation maximum. The destabilization of
the lower atmosphere may provide the uplift of the mois-
ture content from the lower atmosphere and the consequent
condensation resulting in positive cloud liquid water
anomalies (not shown here), giving rise to enhanced pre-
cipitation. The positive precipitation anomalies lag SST by
10 days and coincide with the unstable condition in the
lower atmosphere. These findings suggest an ocean-to-
atmosphere effect, where SST anomalies enhance the
convective clouds through changes in the vertical struc-
tures of the lower-tropospheric temperature and moisture
content. The suggested ocean-to-atmosphere effect appears
to work effectively over the central SCS, where the intra-
seasonal SST anomalies are significant.
4 Discussion and concluding remarks
Using observed SST, precipitation, surface wind, SLHF,
DSWRF, SAT, SLP and equivalent potential temperature,
we have analyzed the relationship between the northward
propagating intraseasonal SST and precipitation during
SCS SM. Coherent northward propagation of the anomalies
are observed over the SCS at a phase speed of 1�/day, from
the equator to 25�N. The anomalous surface easterlies
against the mean westerly flow result in positive SLHF
anomalies. The positive DSWRF anomalies and positive
SLHF induced by reduced wind are observed to contribute
to the evolution of positive SST anomalies. The DSWRF
anomalies are more significant in inducing the observed
SST variability over the off-equatorial regions of SCS.
Meanwhile, a similar study of the ocean-to-atmosphere
effect over the Indian Ocean during the Indian summer
monsoon (Roxy and Tanimoto 2007) have shown that
SLHF anomalies are more significant at similar latitudes.
The comparatively shallow mixed layer depth of about
30 m supplement to the observed SST variability during
the SCS SM.
The northward propagating positive SST anomalies are
found to induce an ocean-to-atmosphere effect near the sea
surface, through a thermal damping of the positive SST.
The positive SST anomalies are followed by the positive
Dhe anomalies, suggesting the active role of SST anomalies
in inducing unstable conditions over the lower atmosphere,
which results in enhanced precipitation over the SCS at a
lag of 10 days. Thus, the results presented herein suggest
that SST anomalies over the SCS are significant in locally
enhancing the northward propagating precipitation anom-
alies during the SCS SM. Even though the focus of the
present study is only on the active (positive) phase of the
intraseasonal cycle, it is found that the break (negative)
phase also follows a similar process. The negative SST and
precipitation anomalies follow the positive anomalies (not
shown), making an intraseasonal cycle of 40–50 days.
M. Roxy, Y. Tanimoto: Influence of SST on the ISV of theSCS summer monsoon 1215
123

Though the present study has dealt with the mechanism
involving the ocean-to-atmosphere processes involved in
enhancing the precipitation anomalies, one of the factors
left unexplained is the change of the surface wind anom-
alies from easterlies to westerlies and vice versa. Previous
studies (Matsuno 1966; Gill 1980; Wang and Wu 1997b)
have examined the wind response to topical convective
activity and have suggested possible mechanisms. These
studies suggest that surface westerly anomalies are nega-
tively correlated with OLR anomalies as a response of
tropical atmosphere to convective heating. This is observed
in the anomalous westerlies during the precipitation max-
imum (Fig. 5d, i; 10 days after SST max). Similarly, the
suppressed convective activity during the precipitation
minimum (Fig. 5b, g; 10 days before SST max) results in
anomalous easterlies. However, the processes involved in
the reversal of the surface wind anomalies require further
investigation with respect to the present study. With the
hypotheses and propositions provided here, a comprehen-
sive picture of the active—break intraseasonal cycle of
precipitation over the SCS is illustrated in Fig. 6.
An additional role of the ocean, in enhancing the
northward propagation observed in the anomalies, is fur-
ther examined. The precipitation bands associated with the
Asian monsoon migrate from its mean winter location
slightly south of equator to the mean summer location
near 20�N, in association with the seasonal migration of
the rising branch of the Hadley cell known as the inter-
tropical convergence zone (Rao 1976; Sikka and Gadgil
1980). The northward propagation observed in the intra-
seasonal anomalies is super-imposed on this seasonal
northward migration. Several studies have looked into the
dynamics involved in this propagation over the Asian
monsoon region (Goswami and Shukla 1984; Hsu et al.
2004; Jiang et al. 2004; Goswami 2005; Bellon and Sobel
2008; Chou and Hsueh 2010). In general, the origin of the
northward propagation of the anomalies is associated with
low-level convergence a few degrees north of the con-
vection maximum. This low-level convergence could be
caused by barotropic vorticity in the overlying atmosphere
(Goswami 2005). Jiang et al. (2004) and Bellon and Sobel
(2008) proposed different mechanisms for the low-level
convergence associated with the barotropic vorticity.
These studies indicate the predominant atmospheric vari-
ability associated with the northward propagating intra-
seasonal anomalies. Though, the atmospheric variability
may directly govern the essential dynamical process in the
northward propagation, it is possible that the northward
propagating anomalies are modulated by the ocean sur-
face. Hence, it would be interesting to discuss the possi-
bilities of a role of ocean, based on the results presented in
this study.
Fig. 6 A schematic figure of
the active (red shades)–break
(blue shades) intraseasonal
cycle of precipitation over the
SCS
1216 M. Roxy, Y. Tanimoto: Influence of SST on the ISV of theSCS summer monsoon
123

Xie and Philander (1994) proposed a mechanism
whereby a positive feedback of wind speed, evaporation
and SST influence the meridional propagation of the
anomalies over the tropics, with implications over the
extra tropics (Xie and Tanimoto 1998). Similar to these
studies, a role of the ocean in enhancing the northward
propagation is observed in the anomalies, and is hypoth-
esized as follows. The positive (negative) SST anomalies
over the north (south) of SCS results in a meridional
pressure gradient (Fig. 4d) as both are proportional, fol-
lowing Lindzen and Nigam (1987). The positive SST
anomalies over the SCS are observed to create a region of
negative SLP anomalies (Fig. 5j). North (south) of the
SLP anomaly center, anomalous northeasterlies (south-
westerlies) are observed. Under climatological southwes-
terlies, anomalous surface winds induce reduced
(enhanced) upward SLHF towards the north (south) of
SST and SLP anomaly centers. This anomalous SLHF
leads positive (negative) SST tendency north (south) of
the SST and SLP anomaly centers, resulting in an
enhancement of the northward propagation. However, it is
important to note that a boundary layer model (e.g.,
Lindzen and Nigam 1987) run with the observed SST
changes does not reproduce the observed wind velocity
changes. This inconsistency is generally owing to the
problems in the representation of physics, especially those
for the marine atmospheric boundary layer (Song et al.
2009). Hence, further improvement of the boundary layer
in the model is necessary to elucidate whether the SST
anomalies have an essential role in the northward propa-
gation of the precipitation anomalies or a supportive role
in the ‘‘enhancement’’ of the propagation through the
modification of convective activity in the overlying
atmosphere.
Acknowledgments Constructive suggestions and comments from
two anonymous reviewers have helped in improving the manuscript.
NASA/GSFC is thankfully acknowledged for TMI/QuickScat satellite
data. The latent heat flux data is obtained from the WHOI OAFlux
Project and the downward shortwave radiation flux data from
the International Satellite Cloud Climatology Project (ISCCP). The
authors are thankful to the Centre for Climate Change Research at the
Indian Institute of Tropical Meteorology, Ministry of Earth Sciences,
India, for facilitating the study. This work was supported in part by
the Global Environment Research Fund (S-5) of the Ministry of the
Environment, Japan, Grand-In-Aid for Scientific Research defrayed
by the Ministry of Education, Culture, Sports, Science and Technol-
ogy of Japan (22340132, 22340135, 22106007).
References
Bellon G, Sobel AH (2008) Instability of the axisymmetric monsoon
flow and intraseasonal oscillation. J Geophys Res 113:D07109
Chan JCL, Wi WX, Xu JJ (2002) Mechanisms responsible for the
maintenance of the 1998 South China Sea summer monsoon.
J Meteorol Soc Jpn 80(5):1103–1113
Chao SY, Shaw PT, Wu SY (1996) Deep water ventilation in the
South China Sea. Deep Sea Res Part I-Oceanogr Res Pap
43(4):445–466
Chen TC, Chen JM (1993) The 10–20 day mode of the 1979 Indian
monsoon: its relation with the time-variation of monsoon
rainfall. Mon Weather Rev 121(9):2465–2482
Chen TC, Chen JR (1995) An observational study of the South China
Sea monsoon during the 1979 summer: onset and life-cycle. Mon
Weather Rev 123(8):2295–2318
Chou C, Hsueh YC (2010) Mechanisms of northward propagating
intraseasonal oscillation: a comparison between the Indian
Ocean and the western north Pacific. J Clim 23:6624–6640
Fu X, Yang B, Bao Q, Wang B (2008) Sea surface temperature feedback
extends the predictability of tropical intraseasonal oscillation.
Mon Weather Rev 136(2):577–597. doi:10.1175/2007
MWR2172.1
Gill AE (1980) Some simple solutions for heat-induced tropical
circulation, vol 106. Wiley, USA. doi:10.1002/qj.49710644905
Goswami BN (2005) South Asian monsoon. In: Lau KM, Waliser D
(eds) Intraseasonal variability in the atmosphere–ocean climate
system. Springer, Berlin, pp 19–61. doi:10.1007/354027250x_2
Goswami BN, Shukla J (1984) Quasi-periodic oscillations in a
symmetric general circulation model. J Atmos Sci 41(1):20–37
Hsu HH, Weng CH, Wu CH (2004) Contrasting characteristics
between the northward and eastward propagation of the intra-
seasonal oscillation during the boreal summer. J Clim
17(4):727–743
Isoguchi O, Kawamura H (2006) MJO-related summer cooling and
phytoplankton blooms in the South China Sea in recent years.
Geophys Res Lett 33(16):L16615. doi:10.1029/2006gl027046
Jiang XN, Li T, Wang B (2004) Structures and mechanisms of the
northward propagating boreal summer intraseasonal oscillation.
J Clim 17(5):1022–1039
Kajikawa Y, Yasunari T (2005) Interannual variability of the 10–25
and 30–60 day variation over the South China Sea during boreal
summer. Geophys Res Lett 32:L04710
Kemball-Cook S, Wang B (2001) Equatorial waves and air-sea
interaction in the boreal summer intraseasonal oscillation. J Clim
14(13):2923–2942
Krishnamurti TN, Ardanuy P (1980) The 10–20 day westward
propagating mode and breaks in the monsoons. Tellus 32:15–26
Krishnamurti TN, Subrahmanyam D (1982) The 30–50 day mode at
850 mb during MONEX. J Atmos Sci 39:2088–2095
Lau KM, Peng L (1987) Origin of low-frequency (intraseasonal)
oscillations in the tropical atmosphere. Part I: basic theory.
J Atmos Sci 44:950–972
Lau KM, Wu HT, Bony S (1997) The role of large-scale atmospheric
circulation in the relationship between tropical convection and
sea surface temperature. J Clim 10(3):381–392
Lau KM, Wu HT, Yang S (1998) Hydrologic processes associated
with the first transition of the Asian summer monsoon: a pilot
satellite study. Bull Am Meteorol Soc 79(9):1871–1882
Lindzen RS, Nigam S (1987) On the role of Sea surface temperature
gradients in forcing low-level winds and convergence in the
tropics. J Atmos Sci 44(17):2418–2436
Liu TW, Xie X, Polito PS, Xie S, Ping HashizumeH (2000)
Atmospheric manifestation of tropical instability wave observed
by QuikSCAT and tropical rain measuring mission. Geophys Res
Lett 27(16):2545–2548. doi:10.1029/2000gl011545
Mao JY, Chan JCL (2005) Intraseasonal variability of the South
China Sea summer monsoon. J Clim 18(13):2388–2402
Matsuno T (1966) Quasi-geostrophic motions in the equatorial area.
J Meteor Soc Jpn 44(1):25–42
Murakami T, Matsumoto J (1994) Summer monsoon over the Asian
continent and western North Pacific. Hosei University, Depart-
ment of Geography, Tokyo
M. Roxy, Y. Tanimoto: Influence of SST on the ISV of theSCS summer monsoon 1217
123

Murakami T, Nakazawa T, He J (1984) On the 40–50 day oscillations
during the 1979 northern hemisphere summer. I: phase propa-
gation. J Meteorol Soc Jpn 62:440–468
Qu TD (2001) Role of ocean dynamics in determining the mean
seasonal cycle of the South China Sea surface temperature.
J Geophys Res Ocean 106(C4):6943–6955
Qu TD, Meyers G, Godfrey JS, Hu DX (1997) Upper ocean dynamics
and its role in maintaining the annual mean western Pacific warm
pool in a global GCM. Int J Climatol 17(7):711–724
Rao YP (1976) Southwest monsoon. Meteorological monograph.
India Meteorological Department, New Delhi
Roxy M, Tanimoto Y (2007) Role of SST over the Indian Ocean in
influencing the intraseasonal variability of the Indian summer
monsoon. J Meteorol Soc Jpn 85(3):349–358. doi:10.2151/jmsj.
85.349
Sengupta D, Goswami BN, Senan R (2001) Coherent intraseasonal
oscillations of ocean and atmosphere during the Asian summer
monsoon. Geophys Res Lett 28(21):4127–4130
Sikka DR, Gadgil S (1980) On the maximum cloud zone and the
ITCZ over Indian longitudes during the southwest monsoon.
Mon Weather Rev 108:1840–1853
Song Q, Chelton DB, Esbensen SK, Thum N, O’Neill LW (2009)
Coupling between sea surface temperature and low-level winds
in mesoscale numerical models. J Clim 22(1):146–164
Tao SY, Chen LX (1987) A review of recent research on the East
Asian summer monsoon in China. Monsoon meteorology.
Oxford University Press, Oxford
Wang B, Wu R (1997a) Peculiar temporal structure of the South
China Sea summer monsoon. Adv Atmos Sci 14(2):177–192
Wang B, Wu R (1997b) Peculiar temporal structure of the South
China Sea summer monsoon. Adv Atmos Sci 14(2):177–194.
doi:10.1007/s00376-997-0018-9
Wentz FJ, Gentemann C, Smith D, Chelton D (2000) Satellite
measurements of Sea surface temperature through clouds.
Science 288(5467):847–850. doi:10.1126/science.288.5467.847
Wu R (2010) Subseasonal variability during the South China Sea
summer monsoon onset. Clim Dyn 34(5):629–642. doi:10.1007/
s00382-009-0679-4
Wu R, Wang B (2000) Interannual variability of summer monsoon
onset over the western North Pacific and the underlying
processes. J Clim 13(14):2483–2501
Wu R, Wang B (2001) Multi-stage onset of the summer monsoon
over the western North Pacific. Clim Dyn 17(4):277–289
Wu R, Kirtman BP, Pegion K (2006) Local air–sea relationship in
observations and model simulations. J Clim 19(19):4914–4932.
doi:10.1175/JCLI3904.1
Wu R, Kirtman BP, Pegion K (2008) Local rainfall-SST relationship
on subseasonal time scales in satellite observations and CFS.
Geophys Res Lett 35(22):L22706. doi:10.1029/2008gl035883
Xie S-P, Philander SGH (1994) A coupled Ocean atmosphere model
of relevance to the ITCZ in the eastern Pacific. Tellus A
46(4):340–350
Xie S-P, Tanimoto Y (1998) A pan Atlantic decadal climate
oscillation. Geophys Res Lett 25(12):2185–2188
Xie S-P, Liu WT, Liu Q, Nonaka M (2001) Far-reaching effects of the
Hawaiian Islands on the Pacific Ocean–atmosphere system.
Science 292(5524):2057–2060. doi:10.1126/science.1059781
Xie S-P, Xie Q, Wang D, Liu WT (2003) Summer upwelling in the
South China Sea and its role in regional climate variations.
J Geophys Res 108(C8):3261
Xie S-P, Chang C-H, Xie Q, Wang D (2007) Intraseasonal variability
in the summer South China Sea: wind jet, cold filament, and
recirculations. J Geophys Res 112(C10):C10008. doi:
10.1029/2007jc004238
Yu L, Jin X, Weller RA (2008) Multidecade global flux datasets from
the objectively analyzed air–sea fluxes (OAFlux). Project: latent
and sensible heat fluxes, ocean evaporation, and related surface
meteorological variables, vol OA-2008–01. Woods Hole Ocean-
ographic Institution, USA
Zeng L, Wang D (2009) Intraseasonal variability of latent-heat flux in
the South China Sea. Theor Appl Climatol 97(1):53–64. doi:
10.1007/s00704-009-0131-z
Zheng Y, Waliser DE, Stern WF, Jones C (2004) The role of coupled
sea surface temperatures in the simulation of the tropical
intraseasonal oscillation. J Clim 17(21):4109–4134
1218 M. Roxy, Y. Tanimoto: Influence of SST on the ISV of theSCS summer monsoon
123