injuries on speial boat operators - ullman dynamics
TRANSCRIPT
NAVAL HEALTH RESEARCH CENTER
A SURVEY OF SELF-REPORTED INJURIESAMONG SPECIAL BOAT OPERATORS
Wayne EnsignJames A. HodgdonW. Keith Prusaczyk
Steven AhlersDave Shapiro
Michael Lipton
Technical Report 00-48
Approved for public release, distribution unlimited
NAVAL HEALTH RESEARCH CENTERP.O. BOX 85122
SAN DIEGO, CA 92186-5122
BUREAU OF MEDICINE AND SURGERY (MED-02)2300 E STREET, NW
WASHINGTON, DC 20372-5300
A SURVEY OF SELF-REPORTED INJURIES AMONG SPECIAL BOATOPERATORS
Wayne Ensign1
James A. Hodgdon1
W. Keith Prusaczyk1
Steven Ahlers1
Dave Shapiro2
Michael Lipton3
1Human Performance DepartmentNaval Health Research Center
P.O. Box 85122San Diego, CA 92186-5122
2Medical DepartmentSpecial Boat Squadron ONE
4300 Tarawa RoadSan Diego, CA 92155-5176
3Medical DepartmentSpecial Boat Squadron TWO
2220 Schofield Road, Suite 100Norfolk, VA 23512-2845
Human subjects participated in this study after giving their free and informedconsent. This research has been conducted in compliance with all applicableFederal Regulations governing the Protection of Human Subjects in Research
Report No. 00-48, supported by the Office of Naval Research, Arlington, VA under work unit62233NMM33P30.6801. The views expressed in this paper are those of the authors and do notreflect the official policy or position of the Department of the Navy, the Department of Defense,or the U.S. Government. Approved for public release; distribution unlimited.
TABLE OF CONTENTS
Table of Contents . . . . . . . . . . . . . . . . . . . . . . . . . . . . . . . . . . . . . . . . . . . . . . . . . . . . . . . . .2Abstract . . . . . . . . . . . . . . . . . . . . . . . . . . . . . . . . . . . . . . . . . . . . . . . . . . . . . . . . . . . . . . . .3Introduction . . . . . . . . . . . . . . . . . . . . . . . . . . . . . . . . . . . . . . . . . . . . . . . . . . . . . . . . . . . . .4Methods . . . . . . . . . . . . . . . . . . . . . . . . . . . . . . . . . . . . . . . . . . . . . . . . . . . . . . . . . . . . . . . .4Analysis . . . . . . . . . . . . . . . . . . . . . . . . . . . . . . . . . . . . . . . . . . . . . . . . . . . . . . . . . . . . . . .5
Results . . . . . . . . . . . . . . . . . . . . . . . . . . . . . . . . . . . . . . . . . . . . . . . . . . . . . . . . . . . . . . . . .6Prevalence of Injury . . . . . . . . . . . . . . . . . . . . . . . . . . . . . . . . . . . . . . . . . . . . . . . . . . . . . .6Seeking Medical Treatment . . . . . . . . . . . . . . . . . . . . . . . . . . . . . . . . . . . . . . . . . . . . . . . . .7Medical Treatment Sites and Personnel . . . . . . . . . . . . . . . . . . . . . . . . . . . . . . . . . . . . . . . .7
Health care providers . . . . . . . . . . . . . . . . . . . . . . . . . . . . . . . . . . . . . . . . . . . . . . . . . . .8Medical Treatment Sites . . . . . . . . . . . . . . . . . . . . . . . . . . . . . . . . . . . . . . . . . . . . . . . . .8
Impact of Injury . . . . . . . . . . . . . . . . . . . . . . . . . . . . . . . . . . . . . . . . . . . . . . . . . . . . . . . . .8Predictors of Injury . . . . . . . . . . . . . . . . . . . . . . . . . . . . . . . . . . . . . . . . . . . . . . . . . . . . . .11
Discussion . . . . . . . . . . . . . . . . . . . . . . . . . . . . . . . . . . . . . . . . . . . . . . . . . . . . . . . . . . . . .12Conclusion and Recommendations . . . . . . . . . . . . . . . . . . . . . . . . . . . . . . . . . . . . . . . . . . .15References . . . . . . . . . . . . . . . . . . . . . . . . . . . . . . . . . . . . . . . . . . . . . . . . . . . . . . . . . . . . .16Special Boat Unit Injury Survey . . . . . . . . . . . . . . . . . . . . . . . . . . . . . . . . . . . . . . . . . . . . .17
2
ABSTRACT
Special Operations place great physical demands on personnel. In most Navy settings,greater physical demands are associated with greater musculoskeletal injury rates. Within theSpecial Operations community, Special Boat operators have a unique set of risks. Small boatsoperating in the open ocean are subject to large shock and vibration forces. Exposure to suchforces can lead to discomfort, injury and performance degradation. In an effort to begin assess-ing the prevalence of injuries related to operations in small Special Operations craft, a self-report survey of injuries (SBUIS) was administered to 154 operator personnel drawn fromSpecial Boat Units 12,20 and 22. Sample mean age was 32.0 ± 5.9 yr., mean years of militaryservice was 12.0 ± 5.5, and mean time in Special Boats was 4.7 ± 3.0 yr. The SBUIS obtaineddemographic information, unit assignment and role information, past general pain levels, detailsabout up to three specific injuries, and exercise history information. Specific injury informationincluded type and location of injury, and type and duration of care for that injury. Of therespondents, 95 reported one injury event, 11 reported 2, and 5 reported 3. The 121 injuryevents resulted in 153 separate injuries. The most prevalent type of injury was sprains andstrains (49.3%) followed by disc problems (7.9%) and trauma (7.9%). The most prevalentinjury sites were the lower back (33.6%), knee (21.5) and shoulder (14.1%). Most injuries(94.8%) occurred on the job. The population sample represented 722 person-years of SpecialBoat Unit exposure. In this sample, injuries resulted in 145 days of hospitalization, 929 days ofsick leave, 4,223 days of limited duty, 4,218 days of limited job/mission performance, 2,294days of lost mission training time, and 4,089 days of lost physical conditioning time. It waspossible to compare hospitalization rates for this sample with rates for the Navy as a whole.Hospitalization incidence for the survey respondents was 2,687 per 100,000 person-years expo-sure. The overall Navy rate for the combination of injuries reported in this sample was 479 per100,000 person-years. Only constructionmen (CN), seamen (SN), firemen (FN), and airmen(AN) had greater hospitalization rates than SBU respondents. We conclude that SBU personnelare at greater than average risk of injury associated with SBU training and operations. Thesefindings need to be confirmed. If confirmed, methods to reduce the injury risk must be identi-fied and implemented.
3
INTRODUCTIONSpecial Operations place great physical demands on personnel.1 In most Navy settings,
greater physical demands are associated with greater musculoskeletal injury rates.2,3Therefore, one would expect that Special Operations personnel would have a relatively largeinjury rate. While it is known that the injury rate associated with Special Operations training islarge,4 little is known about the injury rate for Special Operations personnel.
Special Boat Operators represent a unique subset of Special Operations forces. They areresponsible for the operation of Special Operations boats. Their missions include providingingress and egress for Sea, Air, and Land (SEAL) team members and patrolling of hostilewaterways. While these missions may not seem as physically demanding as those of someother SEAL operators, Special Operations craft pose a unique risk to health.
Small fast boats operating in the open ocean can generate high shock and vibration impulsesto their occupants, particularly in high sea states. The shock impulses are due to boats becom-ing airborne or partially airborne after cresting a wave and slamming down into the water priorto cresting the next wave. Vibration is, for the most part, due to the boat engines. Shockimpulses are greater in the vertical axis than in longitudinal or transverse axes. The shockimpulses are also greater for lighter boats than heavier boats, and increase with increasingvelocity in the ocean water. Vertical acceleration forces between 2 and 10g have been recordedduring operations of some older types of Special Operations craft.5
Exposure to shock and vibration such as that experienced in Special Operations Craft canlead to discomfort, injury and performance degradation.5,6 Examples of such effects includeannoyance, fatigue, sleepiness, discomfort, anxiety, nausea, loss of visual acuity and hand-eyecoordination, abdominal pain or discomfort, testicular pain, headache and other head symptoms,chest pain, back pain, sprains, torn ligaments, broken ankles and legs, damaged vertebrae, anddamage to internal organs.
Naval Special Warfare, Special Boat Units have recently expressed concern about the occur-rence of such injuries.7 Anecdotal evidence suggests that Special Boat Unit personnel showinjury symptoms consistent with the shock associated with small boat operations (MedicalOfficer, Special Boat Squadron ONE, personal communication), but further data need to begathered.
The study presented here describes the beginning of an effort to assess the prevalence ofinjuries related to operations in small Special Operations craft. In this study, a self-report sur-vey of injuries among Special Boat Unit (SBU) personnel was conducted. Meyer and cowork-ers8 have shown that the use of such a survey can be effective to determine injury prevalenceamong Special Operations personnel, and a survey questionnaire, modeled after the one devel-oped by Meyer et al., was developed for SBU personnel. This report presents the survey usedand an analysis of responses to that survey.
METHODS
The participants in this study were SBU operational personnel, drawn from SBU-12, SBU-20 and SBU-22. Participants were volunteers from groups of SBU personnel attending aGeneral Military Training (GMT) lecture at their Units. One hundred and fifty four SBU per-sonnel participated in this study. They all had the Special Boat Naval Enlistment Codes: (NEC)
4
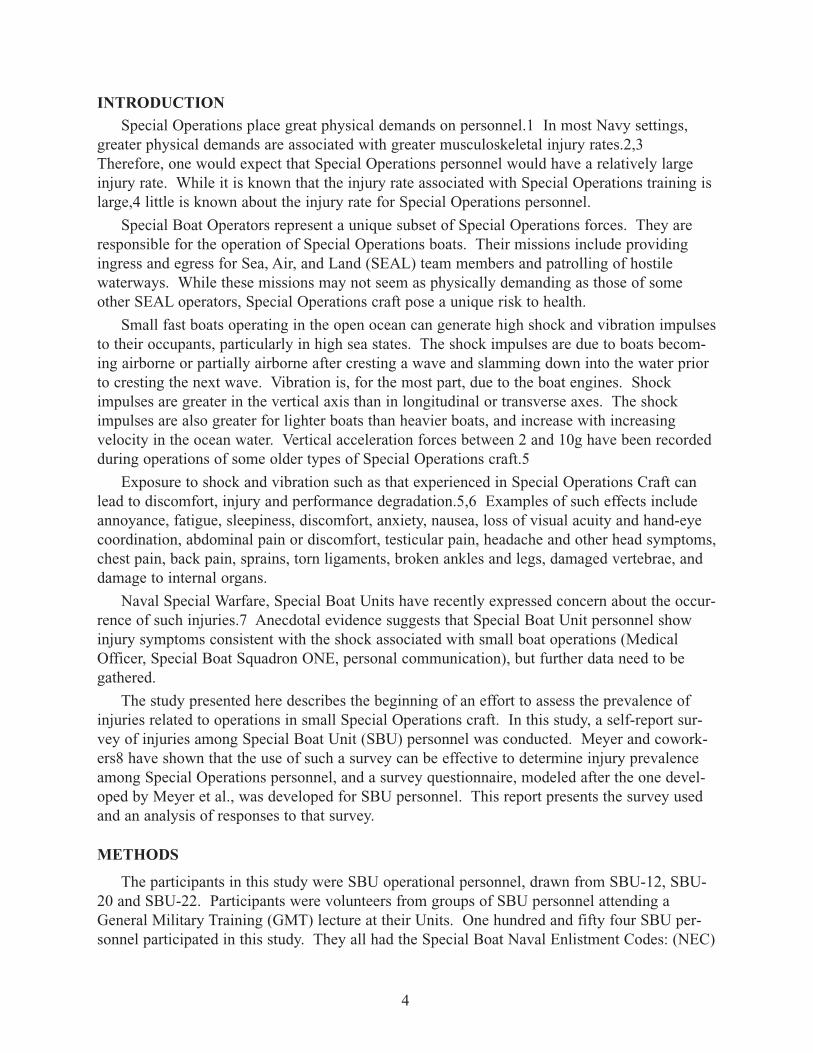
5350 (Special Warfare Combatant Crewman [SWCC] basic), 5351 (SWCC Intermediate), or5352 (SWCC advanced). The participant characteristics are provided in Table 1. Significantdifferences (p < 0.05) were found for age and years of military service across SBUs. Membersof SBU-22 were younger, on average, than members of SBU-12 or SBU-20. Members of SBU-22 had fewer years of military service, on average, than members of SBU-20.
The approximate median operator manning levels for these SBUs are: SBU-12, 202.5;SBU-20, 200; and SBU-22, 107.5. Therefore these samples of opportunity represent approxi-mately 41%, 22% and 26% of the populations of SBU-12, SBU-20 and SBU-22, respectively,and about 32% of the estimated SBU operator population across all 3 units.
The participants completed the study by filling out an anonymous questionnaire, the SpecialBoat Unit Injury Survey (SBUIS). The SBUIS is attached as Appendix A. The first section ofthe SBUIS consisted of the Information to the Participants, a description of the study goals andprocedures and a Privacy Act Statement. The first data section contained questions about gen-eral demographic information. A second data section contained questions related to the partici-pant’s unit assignment (e.g. position and responsibilities, crew assignment, type of craft operat-ed). A third data section covered general pain levels associated with past injuries. Questions inthis section were based on similar patient examination items used by the Quebec Task Force ofSpinal Disorders9 and the Agency for Health Care Policy and Research.10 The fourth data sec-tion solicited details about specific past injuries, and a fifth data section covered current physi-cal activity information. This report will focus on the specific past injuries.
As can be seen, the SBUIS allows reporting of three specific injuries. Review of theresponses revealed that several of the respondents indicated multiple sites, and sometimes mul-tiple types of injuries in one specific injury report. To facilitate investigation of injury type bylocation, the specific injury listed was separated into individual injuries whenever multipleinjuries were reported as one specific injury. From this point forward, the information providedin one of the three specific injury reporting sections will be referred to as an “injury event,” andthe individual components of the injury as “injuries.”
Analysis
The data were analyzed by categorizing elements of the data set and reporting frequencies
5
Table 1. Participant Characteristics1
SBU-12 SBU-20 SBU-22 Total
N 83 43 28 154
Age 32.2 – 6.1 33.3 – 4.7 29.5 – 6.02 32.0 – 5.9Stature (in) 70.6 – 2.8 70.5 – 2.8 71.4 – 2.4 70.7 – 2.7Weight (lb) 186.1 – 21.8 186.3 – 23.7 195.1 – 22.8 187.8 – 22.7
BMI (kg m-2) 26.3 – 2.5 26.4 – 2.5 27.0 – 2.8 26.4 – 2.5Years in Military 11.7 – 5.7 13.8 – 4.7 10.0 – 5.13 12.0 – 5.5Years in SBU 4.5 – 3.2 5.1 – 2.7 4.7 – 2.9 4.7 – 3.0
1Values shown are means – std. dev.2Differs significantly (p < 0.05) from SBU-12 and SBU-20 values.3Differs significantly (p < 0.05) from SBU-20 value.
of occurrence of these categories. In addition, relationships between variables in the data setand the occurrence or absence of injury were explored using t-tests for independent means, cor-relational analyses and logistic regression. All procedures were carried out using SPSS forWindows, release 10.0.5 (27 Nov 1999; SPSS Inc., Chicago, IL).
RESULTS
Prevalence of Injury
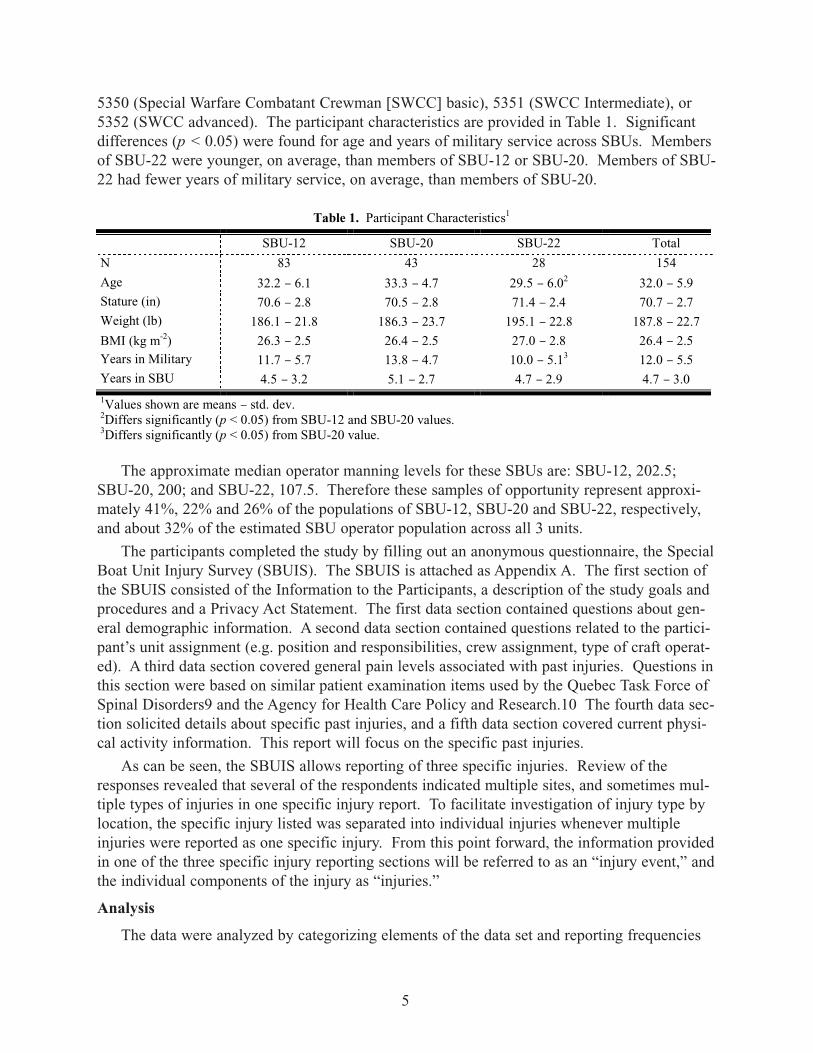
Of the 154 operators surveyed 100 (64.9%) reported at least one injury event. Of those 100,11 reported two injury events, and 5 reported three injury events, for a total of 121 injuryevents. Table 2 shows the distribution of those reporting an injury across boat units. The preva-lence of injury events did not differ significantly among the three SBUs (2 = 1.88, df = 2, p =0.39).
The responses to questions abouttype of craft operated and position inthe boat crew were varied. Somerespondents appeared to list their cur-rent craft and position, others listed allcraft types and positions they had held.Because of these differences inresponse style, it was not possible toinvestigate the distribution of injuriesby boat type or crew position.
The 121 injury events resulted in a total of 153 injuries. Table 3 provides the distribution ofinjuries by general type of injury. The most prevalent injury classification shown in Table 3 issprains and strains (49.3% of the injuries), followed by disc problems and trauma (7.9%). Thetotal number of reported injury types and the total number of reported locations are not equalbecause it was not always possible to match the reported symptoms with a location or locationwith reported symptoms. The “mechanical problem” listed in Table 3 was a foot arch problem.
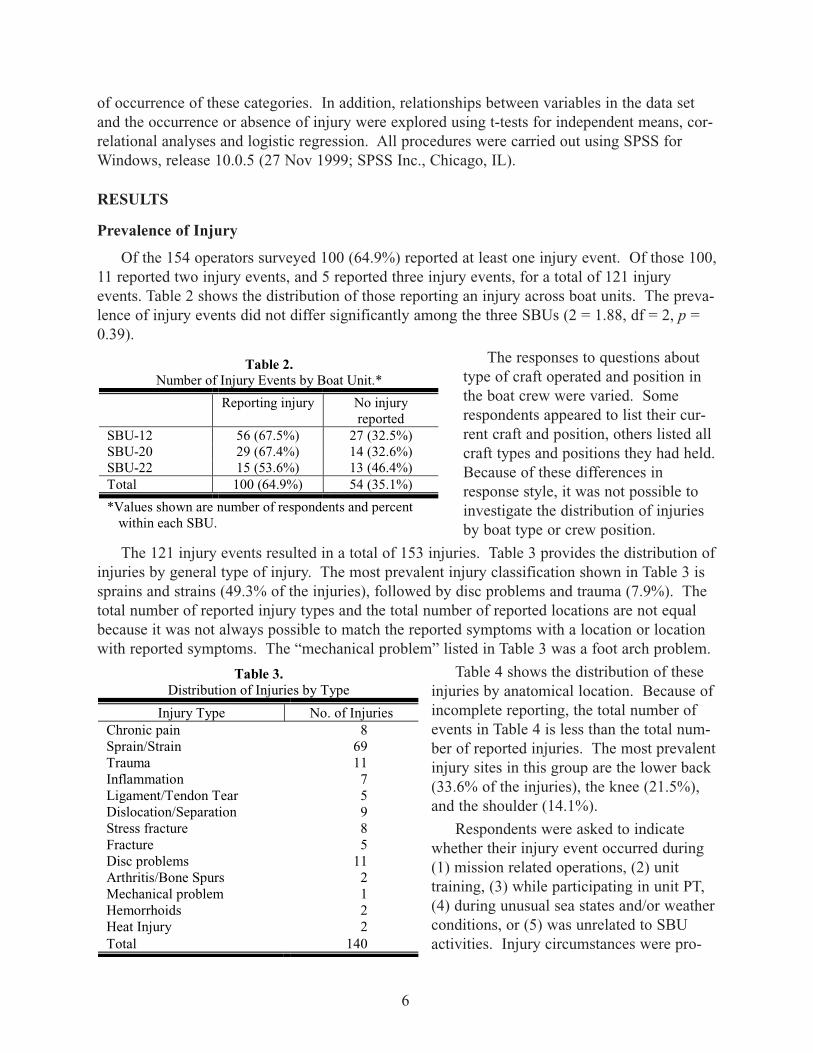
Table 4 shows the distribution of theseinjuries by anatomical location. Because ofincomplete reporting, the total number ofevents in Table 4 is less than the total num-ber of reported injuries. The most prevalentinjury sites in this group are the lower back(33.6% of the injuries), the knee (21.5%),and the shoulder (14.1%).
Respondents were asked to indicatewhether their injury event occurred during(1) mission related operations, (2) unittraining, (3) while participating in unit PT,(4) during unusual sea states and/or weatherconditions, or (5) was unrelated to SBUactivities. Injury circumstances were pro-
6
Table 2. Number of Injury Events by Boat Unit.*
Reporting injury No injuryreported
SBU-12 56 (67.5%) 27 (32.5%)SBU-20 29 (67.4%) 14 (32.6%)SBU-22 15 (53.6%) 13 (46.4%)Total 100 (64.9%) 54 (35.1%)
*Values shown are number of respondents and percentwithin each SBU.
Table 3. Distribution of Injuries by Type
Injury Type No. of InjuriesChronic pain 8Sprain/Strain 69Trauma 11Inflammation 7Ligament/Tendon Tear 5Dislocation/Separation 9Stress fracture 8Fracture 5Disc problems 11Arthritis/Bone Spurs 2Mechanical problem 1Hemorrhoids 2Heat Injury 2Total 140
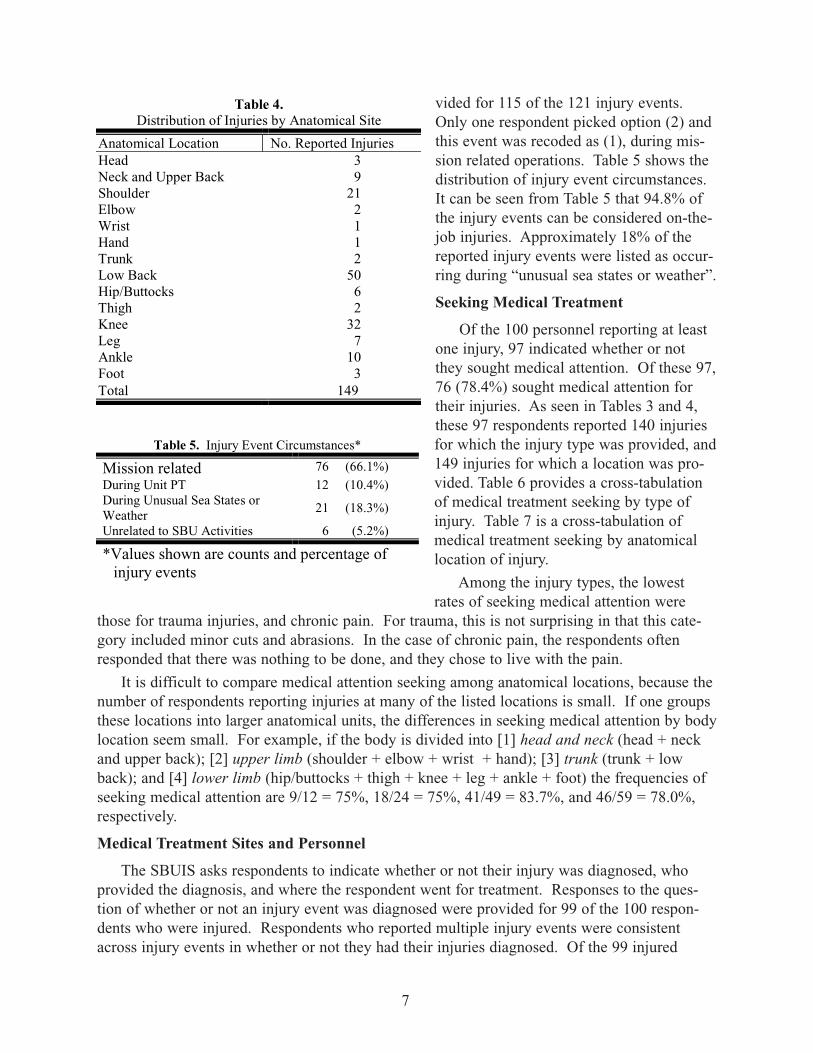
vided for 115 of the 121 injury events.Only one respondent picked option (2) andthis event was recoded as (1), during mis-sion related operations. Table 5 shows thedistribution of injury event circumstances.It can be seen from Table 5 that 94.8% ofthe injury events can be considered on-the-job injuries. Approximately 18% of thereported injury events were listed as occur-ring during “unusual sea states or weather”.
Seeking Medical Treatment
Of the 100 personnel reporting at leastone injury, 97 indicated whether or notthey sought medical attention. Of these 97,76 (78.4%) sought medical attention fortheir injuries. As seen in Tables 3 and 4,these 97 respondents reported 140 injuriesfor which the injury type was provided, and149 injuries for which a location was pro-vided. Table 6 provides a cross-tabulationof medical treatment seeking by type ofinjury. Table 7 is a cross-tabulation ofmedical treatment seeking by anatomicallocation of injury.
Among the injury types, the lowestrates of seeking medical attention were
those for trauma injuries, and chronic pain. For trauma, this is not surprising in that this cate-gory included minor cuts and abrasions. In the case of chronic pain, the respondents oftenresponded that there was nothing to be done, and they chose to live with the pain.
It is difficult to compare medical attention seeking among anatomical locations, because thenumber of respondents reporting injuries at many of the listed locations is small. If one groupsthese locations into larger anatomical units, the differences in seeking medical attention by bodylocation seem small. For example, if the body is divided into [1] head and neck (head + neckand upper back); [2] upper limb (shoulder + elbow + wrist + hand); [3] trunk (trunk + lowback); and [4] lower limb (hip/buttocks + thigh + knee + leg + ankle + foot) the frequencies ofseeking medical attention are 9/12 = 75%, 18/24 = 75%, 41/49 = 83.7%, and 46/59 = 78.0%,respectively.
Medical Treatment Sites and Personnel
The SBUIS asks respondents to indicate whether or not their injury was diagnosed, whoprovided the diagnosis, and where the respondent went for treatment. Responses to the ques-tion of whether or not an injury event was diagnosed were provided for 99 of the 100 respon-dents who were injured. Respondents who reported multiple injury events were consistentacross injury events in whether or not they had their injuries diagnosed. Of the 99 injured
7
Table 4.Distribution of Injuries by Anatomical Site
Anatomical Location No. Reported InjuriesHead 3Neck and Upper Back 9Shoulder 21Elbow 2Wrist 1Hand 1Trunk 2Low Back 50Hip/Buttocks 6Thigh 2Knee 32Leg 7Ankle 10Foot 3Total 149
Table 5. Injury Event Circumstances*
Mission related 76 (66.1%)During Unit PT 12 (10.4%)During Unusual Sea States orWeather
21 (18.3%)
Unrelated to SBU Activities 6 (5.2%)
*Values shown are counts and percentage ofinjury events
respondents, 83 (83.8%) had their injuriesdiagnosed, 16 did not.
Health care providers
Figure 1 provides the distribution ofdiagnoses by type of health care provider.This distribution is based on a sample of116 (of 121) injury events for which thisinformation was provided. As can be seenfrom Figure 1, the most common careprovider was the corpsman (42 instances),followed by physician (26 instances).
Medical Treatment Sites
The distribution of health care treat-ment sites is provided in Figure 2. Themost common treatment facility was theNaval Hospital (34 reports), followed bytreatment in the field (the combination ofthe platoon corpsman, and the commandIndependent Duty Corpsman, 25 reports).In this sample, 16 respondents indicatedthat they either needed no treatment orthat they treated themselves.
Impact of Injury
Survey respondents were askedwhether or not their injuries led to limitedduty, sick leave, hospitalization, limitedtheir professional or personal trainingtime, or affected their mission perform-ance. Results of the responses to thosequestions are provided in this section. Inorder to provide a conservative estimateof the time needed to recover from injury,the value of 121 total injury events wasused as the denominator for frequency
and mean value calculations. Missing values for any of the impact times listed above were setto a value of zero for those who reported an injury event, but did not indicate the presence orabsence of recovery, limited duty, or any of the other impact times.
Figure 3 shows the distribution of hospitalization days due to an injury event.Hospitalization periods ranged from 0 to 65 days. One can see from Figure 3 that only 16% ofthe injury events resulted in hospitalizations. In this sample, a total of 145 man-days were lostdue to hospitalization. This value represents an average value of 1.2 days of hospitalization perinjury event, or 7.25 days for those events (N = 20) requiring hospitalization.
8
Table 6. Medical Attention Frequency* by Injury Type
Injury TypeSought Medical
Attention?Yes No
Chronic pain 3 (50%) 3 (50%)Sprain/Strain 51 (75%) 17 (25%)Trauma 5 (45%) 6 (55%)Inflammation 6 (86%) 1 (14%)Ligament/Tendon Tear 5 (100%) 0Dislocation/Separation 8 (89%) 1 (11%)Stress fracture 7 (88%) 1 (12%)Fracture 4 (100%) 0Disc problems 11 (100%) 0Arthritis/Bone Spurs 1 (100%) 0Mechanical problem 1 (100%) 0Hemorrhoids 3 (100%) 0Heat Injury 2 (100%) 0
* Number of respondents (row percentage)
Table 7. Medical Attention Frequency* by InjuryLocation
Anatomical Location Sought Medical Attention?Yes No
Head 3 (100%) 0Neck and Upper Back 6 (67%) 3 (33%)Shoulder 15 (75%) 5 (25%)Elbow 1 (50%) 1 (50%)Wrist 1 (100%) 0Hand 1 (100%) 0Trunk 1 (100%) 0Low Back 40 (83%) 8 (17%)Hip/Buttocks 6 (100%) 0Thigh 1 (50%) 1 (50%)Knee 24 (75%) 8 (25%)Leg 5 (71%) 2 (29%)Ankle 9 (99%) 1 (11%)Foot 1 (50%) 1 (50%)
* Number of respondents (row percentage)
Figure 4 shows the distributionof number of days of sick leave(presumably “sick in quarters”)following an injury event. Thenumber of sick days ranged from0 to 365 days. The total numberof man-days lost due to sick inquarters time was 929. Again,only a minority of the injuryevents resulted in sick leave (N =17). The average sick leave was7.7 days per injury event overall,and 54.6 days for those injuryevents resulting in sick leave.
Figure 5 shows the distributionof the number of days of limitedduty reported for injury events.Almost half of the injury eventsresulted in one or more days onlimited duty status. The numberof limited duty days ranged from 0to 455 for a single injury event,with a total of 4,223 limited dutydays for this sample. The averagenumber of limited duty days was34.9 for all injury events, and 79.7for those injury events for whichlimited duty was prescribed.
The SBUIS asked respondentsto indicate whether or not aninjury event limited their job ormission performance, and if it did,for how many days. Figure 6shows the distribution of respons-es to this question. The number ofdays of limited job/mission per-formance ranged from 0 to 455.Limited performance days werereported for approximately onethird of the sample of injury events(N = 40). There were a total of4,218 days of limited job/missionperformance reported for this sam-ple. This represents an average of
9
14.7%
36.2%
4.3%
1.7%
20.7%
22.4%
Self-diagnosed
Corpsman
Physical Therapist
Chiropractor
Orthopedist
Medical Doctor
Figure 1. Distribution of diagnoses by healthprovider. N = 116 reports.
13.8%13.8%
12.9%
8.6% 11.2%
29.3%
4.3%
6.0%
No Treatment/Self-Medication
Platoon Corpsman
Command IDC
SPECWAR Facility
Other Naval Facility
Naval Hospital
Civilian Practitioner
Other
84%
12%
3%
1%
No hospitalization
1 week or less
1 - 2 weeks
Longer than 2 weeks
Figure 2. Distribution of diagnoses by treatment facility.N = 116 reports.
Figure 3. Distribution of hospitalization periods followinginjury.
86%
4%7% 3%
No sick leave taken
0 - 1 month
1 - 2 months
Greater than 2 months
Figure 4. Distribution of number of days "Sick inQuarters".
34.9 days per injury event, or105.5 days for each injury eventresulting in limited performancedays.
SBUIS respondents also indi-cated the number of job/missiontraining days lost due to eachinjury event, as well as the numberof personal training days lost.Figure 7 shows the distribution ofmission training days lost due to aninjury event. The number of dayslost ranged from 0 to 365, with atotal of 2,294 days lost for the sam-ple. A total of 36 respondents indi-cated that they had lost missiontraining time. The average numberof training days lost was 19.0 forall injury events, and 63.7 for thoseinjury events resulting in lost train-ing time.
Figure 8 shows the distributionof personal training time lost due tothe occurrence of an injury event.The total number of days lost was4,089 (approximately twice that formission training), and ranged from0 to 365 for an injury event. Atotal of 51 injury events resulted inlost personal training time. Theaverage time lost was 33.8 days forall injury events, and 80.2 days forthose events resulting in lost per-sonal training time.
In general, the majority ofrespondents sustaining an injuryevent reported that no time was lostfor each of various types of impactdays. However, of the 121 injuryevents, only 33 (27.3%) resulted inno time lost of any type. Sixty-three (52.1%) resulted in no lost
time due to medical consequences of the injury (hospitalization, sick leave, or limited dutytime).
10
56%
17%
10% 9%8% No limited duty
0 - 1 month
1 - 2 month
2 - 6 months
Greater than 6 months
Figure 5. Distribution of number of limited duty daysassociated with injury events.
67%
10% 12% 5%
6%Mission performance not limited
0 - 1 month
1 - 4 months
4 - 8 months
Greater than 8 months
Figure 6. Distribution of periods of mission perform-ance limitation following injury events.
70%
13% 10% 6%
1%No lost mission training time
0 - 1 month
1 - 4 months
4 - 8 months
Greater than 8 months
Figure 7. Distribution of lost mission-training timefollowing an injury event.
No lost personal training time
0 - 1 month
1 - 4 months
4 - 8 months
Greater than 8 months58%
16%12% 12%
2%
Figure 8. Distribution of lost personal training timefollowing an injury event.
Predictors of Injury
The demographic variables were investigated as predictors of injury during duty with theSBUs. Questionnaire respondents were classified as either injured or not, based on theirresponses to the specific injury section of the questionnaire. Table 8 shows the mean values ofsome demographic variables for the injured and non-injured groups, as well as the correlationbetween the variable and injury status.
As can be seen from Table 8, significant difference in mean values and a significant correla-tion coefficient was found only for number of years in the SBUs. The association between timein the SBUs and injury status is illustrated in Figure 9. The bars in Figure 9 represent respon-dents in this survey grouped by the number of years they have been assigned to SBUs. Thebars are divided to indicate the proportions of each group that reported or did not report aninjury event. The greatest proportion of those not reporting an injury event are in the groups
“less than 1 year” or between 1and 2 years in the SBUs.
An effort was made to modelthe risk associated with timeassigned to a SBU, and to deter-mine whether or not other demo-graphic variables might be associ-ated with the risk of injury oncethe variance attributable to yearsof SBU service had been takeninto account. A forward, likeli-hood ratio, logistic regressionanalysis with injury status as theindependent variable was carriedout using the demographic vari-ables. The resulting model isprovided as equation.1 As wouldbe expected from the resultsshown in Table 8, number of
11
Table 8. Demographic Variables and Injury Status
VariableInjured Group
(N = 100)Non-Injured Group
(N = 54)CorrelationCoefficient
Age (yr.) 32.5 (5.2) 31.2 (6.9) 0.11Height (cm) 180.2 (6.5) 178.4 (7.5) 0.13Weight (kg) 86.2 (10.5) 83.4 (9.7) 0.13BMI (kg·m-2) 26.5 (2.6) 26.2 (2.3) 0.06Years Military Svc. 12.5 (4.7) 10.9 (6.6) 0.14Years in SBUs 5.5 (2.9) 3.1 (2.5)* 0.39**
Values shown are means (1 std. dev.)* Means differ significantly (P < 0.05)** Correlation coefficient significant (P < 0.05)
Time in Special Boat Units
13 to 14 yr
12 to 13 yr
11 to 12 yr
10 to 11 yr
9 to 10 yr
8 to 9 yr
7 to 8 yr
6 to 7 yr
5 to 6 yr
4 to 5 yr
3 to 4 yr
2 to 3 yr
1 to 2 yr
less than 1 yr
Nu
mb
er o
f Res
po
nd
ents
40
35
30
25
20
15
10
5
0
Report Injury
yes
no
Figure 9. Distribution of injury status by time in SpecialBoat Units.
years of SBU service was one of the predictors. Stature also entered as a significant (p < 0.05)predictor.
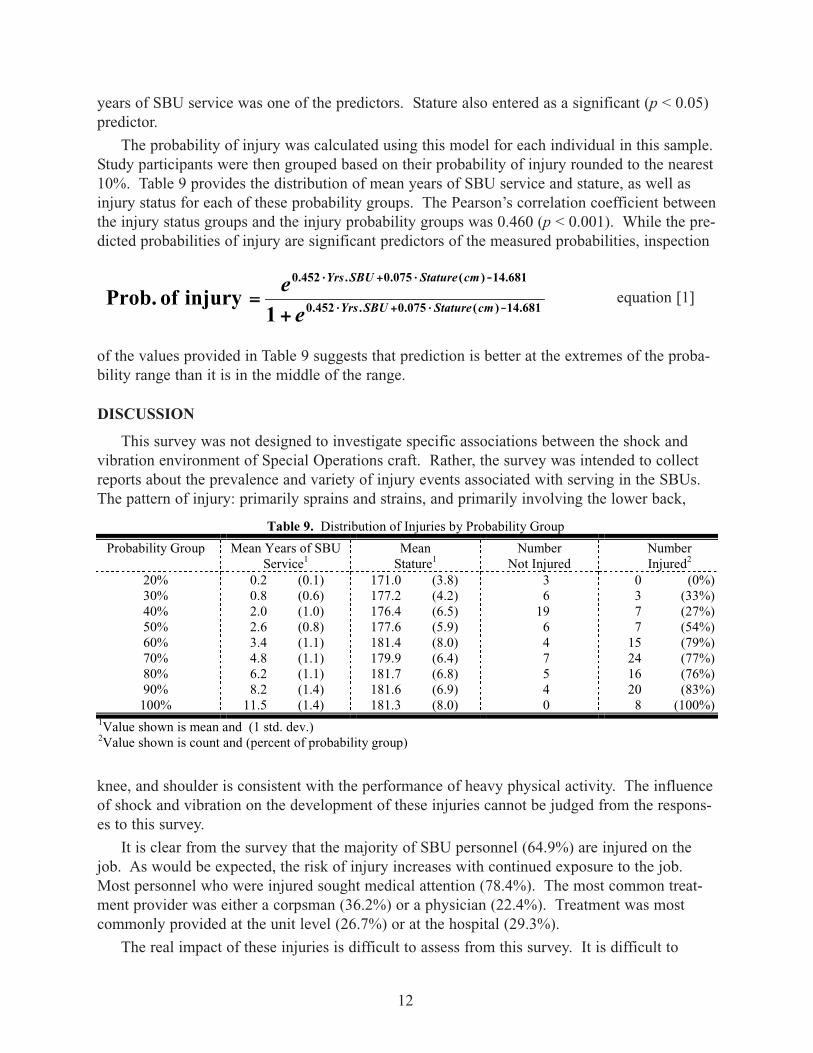
The probability of injury was calculated using this model for each individual in this sample.Study participants were then grouped based on their probability of injury rounded to the nearest10%. Table 9 provides the distribution of mean years of SBU service and stature, as well asinjury status for each of these probability groups. The Pearson’s correlation coefficient betweenthe injury status groups and the injury probability groups was 0.460 (p < 0.001). While the pre-dicted probabilities of injury are significant predictors of the measured probabilities, inspection
of the values provided in Table 9 suggests that prediction is better at the extremes of the proba-bility range than it is in the middle of the range.
DISCUSSION
This survey was not designed to investigate specific associations between the shock andvibration environment of Special Operations craft. Rather, the survey was intended to collectreports about the prevalence and variety of injury events associated with serving in the SBUs.The pattern of injury: primarily sprains and strains, and primarily involving the lower back,
knee, and shoulder is consistent with the performance of heavy physical activity. The influenceof shock and vibration on the development of these injuries cannot be judged from the respons-es to this survey.
It is clear from the survey that the majority of SBU personnel (64.9%) are injured on thejob. As would be expected, the risk of injury increases with continued exposure to the job.Most personnel who were injured sought medical attention (78.4%). The most common treat-ment provider was either a corpsman (36.2%) or a physician (22.4%). Treatment was mostcommonly provided at the unit level (26.7%) or at the hospital (29.3%).
The real impact of these injuries is difficult to assess from this survey. It is difficult to
12
681.14)(075.0.452.0
681.14)(075.0.452.0
1injury of Prob.
--··++··
--··++··
++==
cmStatureSBUYrs
cmStatureSBUYrs
e
eequation [1]
Table 9. Distribution of Injuries by Probability Group
Probability Group Mean Years of SBUService1
MeanStature1
NumberNot Injured
NumberInjured2
20% 0.2 (0.1) 171.0 (3.8) 3 0 (0%)30% 0.8 (0.6) 177.2 (4.2) 6 3 (33%)40% 2.0 (1.0) 176.4 (6.5) 19 7 (27%)50% 2.6 (0.8) 177.6 (5.9) 6 7 (54%)60% 3.4 (1.1) 181.4 (8.0) 4 15 (79%)70% 4.8 (1.1) 179.9 (6.4) 7 24 (77%)80% 6.2 (1.1) 181.7 (6.8) 5 16 (76%)90% 8.2 (1.4) 181.6 (6.9) 4 20 (83%)
100% 11.5 (1.4) 181.3 (8.0) 0 8 (100%)1Value shown is mean and (1 std. dev.)2Value shown is count and (percent of probability group)
know how to evaluate the effects of lost personal and mission training time on readiness. If oneis conservative and assumes that the times reported for medical treatment (hospitalization, sickleave, and limited duty time) overlap, the estimate of days lost associated with medical treat-ment is 4,223 days (the time reported for limited duty days). As pointed out earlier, this repre-sents an average of a little more than a month of “non-effective time” following an injury event.The total reported years of service in the SBUs for this sample is 722. The 4,223 days of med-ical treatments represent an average treatment rate of 5.85 days per person-year for the SBUpopulation. Similarly, the 121 injury events represent an incidence rate of 0.16 injury eventsper person-year.
Nineteen of the 121 injury events resulted in hospitalization. The hospitalization incidencerate is, therefore, 19 ÷ 722 = 0.02632 hospitalizations per year or 2,632 per 100,000 exposureyears (95% confidence interval = 1,568 to 4,050) (12, p186). To provide a reference frame forthis number, an analysis was carried out using the Epidemiological Interactive System(EPISYS) software and database developed at the Naval Health Research Center.11 EPISYSconsists of a database of inpatient hospitalization, demographic and career history records forall Navy enlisted personnel on active duty between 01 January 1980 and 30 September 1997,and software to access, analyze, and summarize these data.
Since EPISYS only contains enlisted records, the comparison was adjusted to include onlythose hospitalizations reported by enlisted SBUIS respondents. The number of hospitalizationswas unchanged, but the denominator value of 722 person-years had to be adjusted to 707 per-son-years served in SBU by the enlisted respondents.
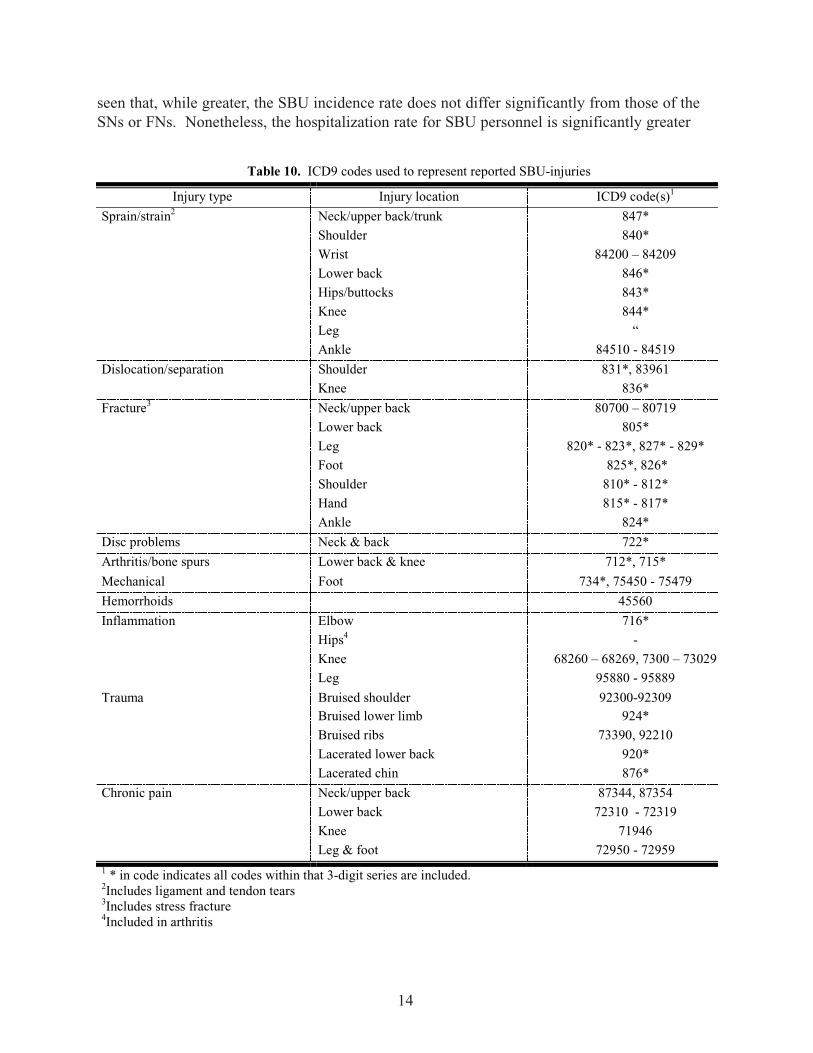
EPISYS allows queries of the database to be constructed using specific InternationalClassification of Diseases (ICD9) codes.13 The lists of injury types and locations werereviewed and a list of ICD9 codes representing the injuries reported by the SBUIS respondentswas developed. These codes were used in EPISYS to determine the incidence of hospitaliza-tion due to these injuries and conditions in the Navy population at large. Hospitalization inci-dence values were broken out by NEC to allow comparisons with specific Navy occupations.EPISYS was created before the particular NECs used to select participants in this study werecreated. Therefore, we cannot use EPISYS to validate the hospitalization rates developed fromthe data collected in the SBUIS. The specific ICD9 codes used to construct the hospitalizationincidence rates are provided in Table 10.
The overall hospitalization incidence attributable to the ICD9 diagnoses listed in Table 10was 479 per 100,000 person-years exposure (95% confidence interval = 475 - 486). The adjust-ed incidence rate for the SBUIS enlisted respondents was 2,687 (1,619 - 4,164), over 5.5 timesthe overall Navy rate. EPISYS provides 83 NEC categories. When the hospitalization inci-dence denominator is calculated as the total number of person-years served in the Navy, ratherthan just in the SBUs, the value is 1,718 person-years, and the incidence rate becomes 1,106per 100,000 person-years exposure (685 – 1,177). Table 11 lists the 10 greatest hospitalizationincidence rates and their associated Navy ratings.
One can see in Table 11 that there are 4 ratings with clearly greater hospitalization incidencerates than the remaining ratings: CN, SN, FN, and AN. The hospitalization incidence for SBUpersonnel based on time in the SBU is greater than that of all of the ratings shown in the tableexcept the CNs. The value for CNs differs significantly (p < 0.05) from that of the SBU per-sonnel. From the 95% confidence interval for the incidence rate of SBU personnel, it can be
13
seen that, while greater, the SBU incidence rate does not differ significantly from those of theSNs or FNs. Nonetheless, the hospitalization rate for SBU personnel is significantly greater
14
Table 10. ICD9 codes used to represent reported SBU-injuries
Injury type Injury location ICD9 code(s)1
Sprain/strain2 Neck/upper back/trunk 847*Shoulder 840*Wrist 84200 – 84209Lower back 846*Hips/buttocks 843*Knee 844*Leg “Ankle 84510 - 84519
Dislocation/separation Shoulder 831*, 83961Knee 836*
Fracture3 Neck/upper back 80700 – 80719Lower back 805*Leg 820* - 823*, 827* - 829*Foot 825*, 826*Shoulder 810* - 812*Hand 815* - 817*Ankle 824*
Disc problems Neck & back 722*
Arthritis/bone spurs Lower back & knee 712*, 715*
Mechanical Foot 734*, 75450 - 75479
Hemorrhoids 45560
Inflammation Elbow 716*Hips4 -Knee 68260 – 68269, 7300 – 73029Leg 95880 - 95889
Trauma Bruised shoulder 92300-92309Bruised lower limb 924*Bruised ribs 73390, 92210Lacerated lower back 920*Lacerated chin 876*
Chronic pain Neck/upper back 87344, 87354Lower back 72310 - 72319Knee 71946Leg & foot 72950 - 72959
1 * in code indicates all codes within that 3-digit series are included.2Includes ligament and tendon tears3Includes stress fracture4Included in arthritis
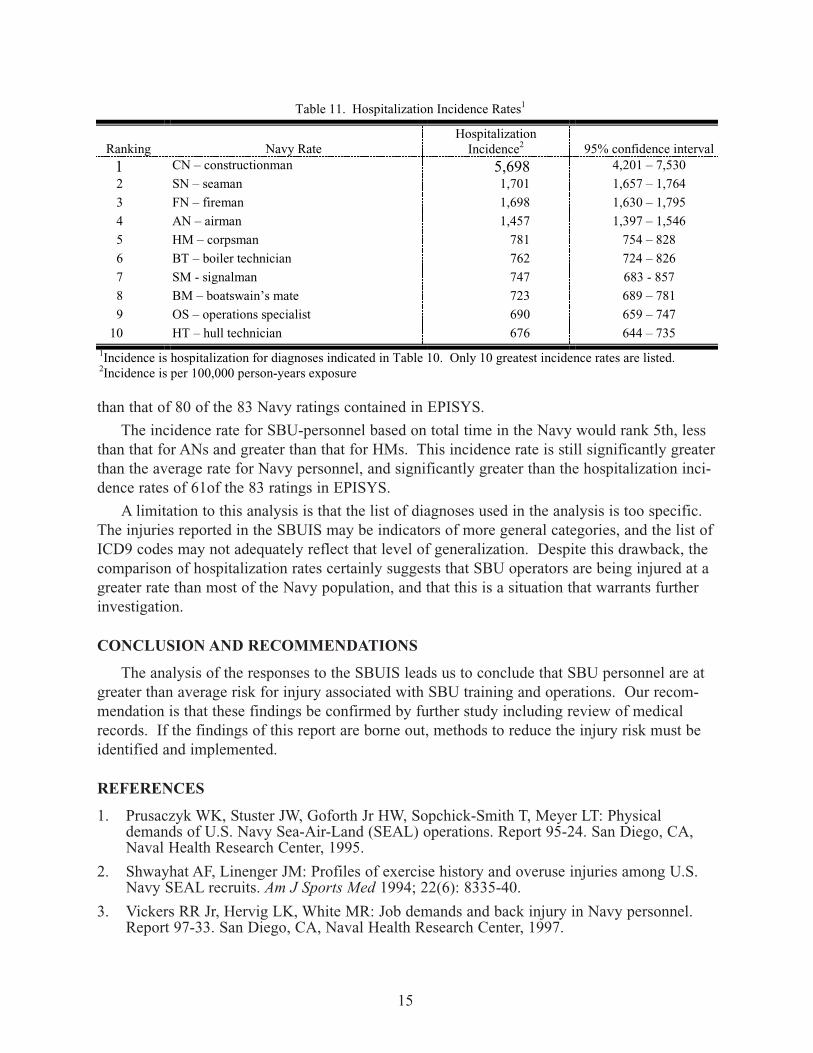
than that of 80 of the 83 Navy ratings contained in EPISYS.
The incidence rate for SBU-personnel based on total time in the Navy would rank 5th, lessthan that for ANs and greater than that for HMs. This incidence rate is still significantly greaterthan the average rate for Navy personnel, and significantly greater than the hospitalization inci-dence rates of 61of the 83 ratings in EPISYS.
A limitation to this analysis is that the list of diagnoses used in the analysis is too specific.The injuries reported in the SBUIS may be indicators of more general categories, and the list ofICD9 codes may not adequately reflect that level of generalization. Despite this drawback, thecomparison of hospitalization rates certainly suggests that SBU operators are being injured at agreater rate than most of the Navy population, and that this is a situation that warrants furtherinvestigation.
CONCLUSION AND RECOMMENDATIONS
The analysis of the responses to the SBUIS leads us to conclude that SBU personnel are atgreater than average risk for injury associated with SBU training and operations. Our recom-mendation is that these findings be confirmed by further study including review of medicalrecords. If the findings of this report are borne out, methods to reduce the injury risk must beidentified and implemented.
REFERENCES
1. Prusaczyk WK, Stuster JW, Goforth Jr HW, Sopchick-Smith T, Meyer LT: Physicaldemands of U.S. Navy Sea-Air-Land (SEAL) operations. Report 95-24. San Diego, CA,Naval Health Research Center, 1995.
2. Shwayhat AF, Linenger JM: Profiles of exercise history and overuse injuries among U.S.Navy SEAL recruits. Am J Sports Med 1994; 22(6): 8335-40.
3. Vickers RR Jr, Hervig LK, White MR: Job demands and back injury in Navy personnel.Report 97-33. San Diego, CA, Naval Health Research Center, 1997.
15
Table 11. Hospitalization Incidence Rates1
Ranking Navy RateHospitalization
Incidence2 95% confidence interval1 CN – constructionman 5,698 4,201 – 7,5302 SN – seaman 1,701 1,657 – 1,7643 FN – fireman 1,698 1,630 – 1,7954 AN – airman 1,457 1,397 – 1,5465 HM – corpsman 781 754 – 8286 BT – boiler technician 762 724 – 8267 SM - signalman 747 683 - 8578 BM – boatswain’s mate 723 689 – 7819 OS – operations specialist 690 659 – 747
10 HT – hull technician 676 644 – 7351Incidence is hospitalization for diagnoses indicated in Table 10. Only 10 greatest incidence rates are listed.2Incidence is per 100,000 person-years exposure
4. Vickers RR Jr, Hervig LK: Occupational physical demands and hospitalization rates in U.S.Navy personnel. Report 98-32. San Diego, CA, Naval Health Research Center, 1998.
5. Gollwitzer RM, Peterson RS: Repeated water entry shocks on high-speed planing boats.Report CSS/TR-96/27. Panama City, FL, Coastal Systems Station, 1995.
6. Griffith MJ: Human Vibration Handbook. New York, NY, Academic Press, 1990.
7. Commander, Naval Special Boat Squadron TWELVE: Letter to Naval Health ResearchCenter, 6500 Ser 01/074 of 23 Feb 95; Endorsement by Commander, Special BoatSquadron ONE, 6500 Ser 04/151 of 27 Mar 95.
8. Meyer LT, Moore J, Sopchick-Smith T, Friedlander AL: Naval Special Warfare SportsMedicine Conference Proceedings. Technical Document 94-4D. San Diego, CA, NavalHealth Research Center, 1995.
9. Quebec Task Force on Spinal Disorders: Scientific approach to the assessment and man-agement of activity-related spinal disorders. A monograph for clinicians. Spine 1987; 12(7Suppl): S1-59.
10. Bigos SJ, Bowyer O, Braen G, et al: Acute Low Back Problems in Adults. Quick ReferenceGuide Number 14. AHCRP Pub. No. 95-0643. Rockville, MD, U.S. Department of Healthand Human Services, Public Health Service, Agency for Health Care Policy and Research,1994.
11. Jaeger JA, White MR, Show IT: EPISYS (Epidemiological Interactive System), User’sGuide, Version 1.0. Technical Document 97-1A. San Diego, CA, Naval Health ResearchCenter, 1996.
12. Diem K (ed): Scientific Tables, 6th edition. Ardsley, NY, Geigy Phamaceuticals, 1962.
13. Council on Clinical Classifications Task Force. International Classification of Diseases, 9threvision, clinical modification, volumes 1 & 2. Salt Lake City, UT, Medicode, Inc, 1991.
16
SPECIAL BOAT UNIT INJURY SURVEY
Introduction
The nature of special operations requires Naval Special Warfare Personnel (NSW) to perform athigh levels of their physical capacity for extended periods of time. In many cases, NSW mis-sions are conducted under extreme environmental conditions that can compromise human per-formance. Because of the high physical, mental, and environmental demands required to con-duct these missions, intense physical conditioning is a necessary component of SOF operationaltraining. The operational tempo, coupled with the training requirements necessary to performmissions, place SOF personnel at risk for musculoskeletal injury.
Injuries related to the activities of special boat unit operations has become a concern of thecommand at the Special Boat Squadrons. For this reason, a study is currently underway todetermine factors related to injuries among Special Boat Unit (SBU) personnel. The initial goalof the study is to determine the extent of injuries among SBU operators so that effective coun-termeasures can be integrated into SBU training and craft design to reduce the risk of injury andsustain optimal performance. The integration of injury prevention countermeasures will alsoserve to enhance the health and safety of SBU personnel during their naval careers.
Questionnaire Instructions
The Special Boat Unit Injury Survey is designed to obtain information on the prevalence ofmusculoskeletal injuries among existing SBU personnel. Your participation in the survey isvoluntary and anonymous. Please do not place any identifying marks on the survey forms. Thesurvey questionnaire consists of five parts: The first section asks for certain demographic data,the second part asks for job-related information, the third section attempts to obtain generalinjury information, and the fourth section seeks more specific injury information for each injurysustained during your affiliation with the special boat units. The last section focuses on yourphysical fitness training practices. Please answer all questions HONESTLY and DIRECTLY.If asked to provide an explanation for your response, please do so to the best of your ability. Ifany of the questions are unclear, please ask the survey administrator for clarification. Theinformation you provide will impact on the health and well-being of current and future SBUpersonnel. Thank you for your cooperation by participating in this survey.
17
1. DemographicsAge _________ Height _______Weight _______ Job (NEC) designator __________Rank/pay grade __________Years of military service _________Years in special boat unit __________
2. Job-related InformationCurrent Unit Assignment Craft Type Crew Position____________________ 1. 24’ RIB 1. Pilot
2. I-RIB 2. Coxswain3. PB MKIII/IV 3. Engineer4. MK V SOC 4. Throttleman5. HSB 5. Navigator6. Other (specify) 6. Other (specify)
_______________________ ________________________
3. General Injury InformationHave you ever been injured during an SBU operation, including training?
NO Go to section 5. YES How many times have you been injured during your affiliation with
a special boat unit? __________________If injured more than once, which of the following statements most correctly characterizes those injuries.
1. reinjury of previous existing injury2. my injuries are unrelated (i.e. distinct)3. reinjury of a previous injury and sustained an additional injury
Approximately how long (in months) were you in a special boat unit before you received yourfirst injury? _____________________
Do you experience chronic pain associated with your injury?NO YES Location ___________________________________________
Frequency ___________________________________________Type of pain ___________________________________________
Do you experience chronic pain in general?NO YES Location ___________________________________________
Frequency ___________________________________________Type of pain ___________________________________________
18
4. Specific Injury InformationInjury number 1 (Please provide information for each injury)
Please indicate the type of injury sustained (stress fracture, shoulder separation, etc.)?
_____________________________________________________________________
Was your injury diagnosed by a clinician? NO YES please specify (Corpsman, Physical Therapist, Orthopedist, etc.)
_____________________________________________________________________
Where (bodily location) did you sustain the injury?
_____________________________________________________________________
What were the circumstances that resulted in your injury? 1. mission related operations2. during unit training3. while participating in unit PT4. unusual sea states and/or weather conditions5. my injury was unrelated to SBU-activities
Did you seek medical attention for your injury?NO Please indicate why
_____________________________________________________________________
YES Please indicate where____ Platoon (corpsman)____ Command IDC____ Specwar Medical Facility, specify ______________________________ BUD/S medical____ Naval Medical Hospital____ Other Naval facility, specify __________________________________ Civilian Practitioner, specify __________________________________ Other, specify ___________________________________________
Did the injury result in any of the following?____ Hospitalization, number of days _________________ Sick Leave, number of days _________________ Limited duty, number of days _________________ Lost training time, number of days _________________ Limitations in your personal training, number of days _________________ Limited job/mission performance, number of days _____________
19

4. Specific Injury Information (continued)Injury number 2
Please indicate the type of injury sustained (stress fracture, shoulder separation, etc.)?
_____________________________________________________________________
Was your injury diagnosed by a clinician? NO YES please specify (Corpsman, Physical Therapist, Orthopedist, etc.)
_____________________________________________________________________
Where (bodily location) did you sustain the injury?
_____________________________________________________________________
What were the circumstances that resulted in your injury? 1. mission related operations2. during unit training3. while participating in unit PT4. unusual sea states and/or weather conditions5. my injury was unrelated to SBU activities
Did you seek medical attention for your injury?NO Please indicate why.
_____________________________________________________________________
YES Please indicate where____ Platoon (corpsman)____ Command IDC____ Specwar Medical Facility, specify ______________________________ BUD/S medical____ Naval Medical Hospital____ Other Naval facility, specify __________________________________ Civilian Practitioner, specify __________________________________ Other, specify ___________________________________________
Did the injury result in any of the following?____ Hospitalization, number of days _________________ Sick Leave, number of days _________________ Limited duty, number of days _________________ Lost training time, number of days _________________ Limitations in your personal training, number of days _________________ Limited job/mission performance, number of days _____________
20
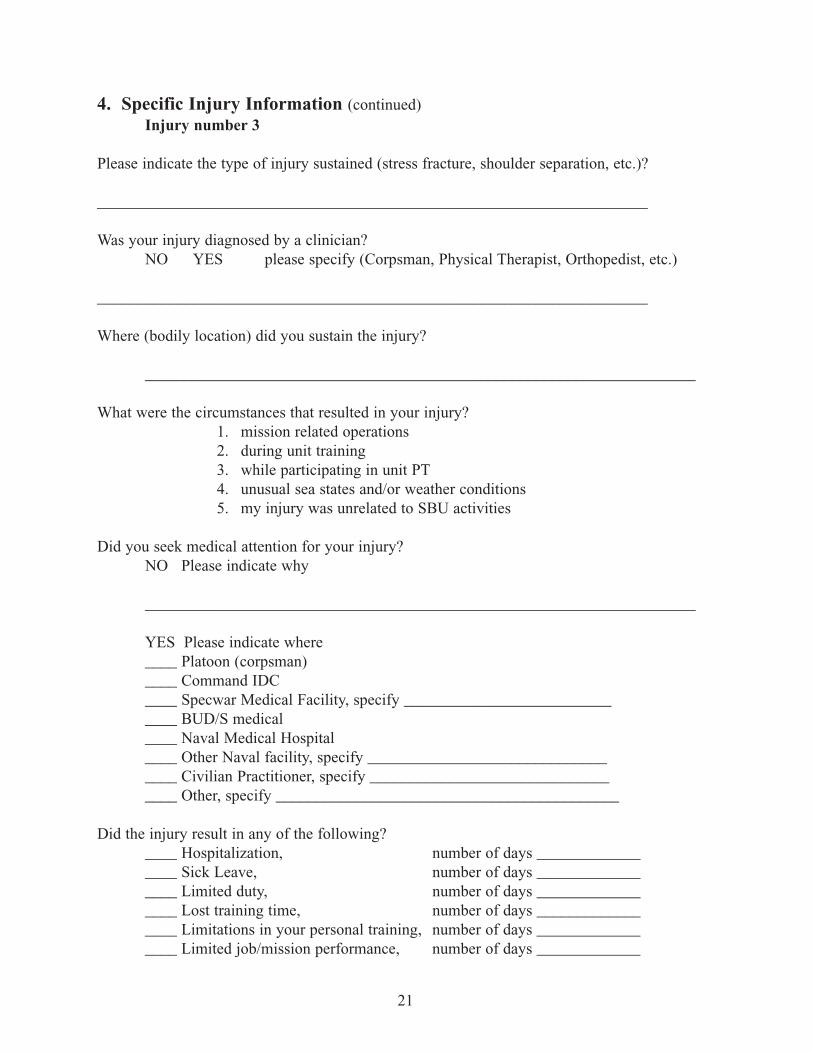
4. Specific Injury Information (continued)Injury number 3
Please indicate the type of injury sustained (stress fracture, shoulder separation, etc.)?
_____________________________________________________________________
Was your injury diagnosed by a clinician? NO YES please specify (Corpsman, Physical Therapist, Orthopedist, etc.)
_____________________________________________________________________
Where (bodily location) did you sustain the injury?
_____________________________________________________________________
What were the circumstances that resulted in your injury? 1. mission related operations2. during unit training3. while participating in unit PT4. unusual sea states and/or weather conditions5. my injury was unrelated to SBU activities
Did you seek medical attention for your injury?NO Please indicate why
_____________________________________________________________________
YES Please indicate where____ Platoon (corpsman)____ Command IDC____ Specwar Medical Facility, specify ______________________________ BUD/S medical____ Naval Medical Hospital____ Other Naval facility, specify __________________________________ Civilian Practitioner, specify __________________________________ Other, specify ___________________________________________
Did the injury result in any of the following?____ Hospitalization, number of days _________________ Sick Leave, number of days _________________ Limited duty, number of days _________________ Lost training time, number of days _________________ Limitations in your personal training, number of days _________________ Limited job/mission performance, number of days _____________
21
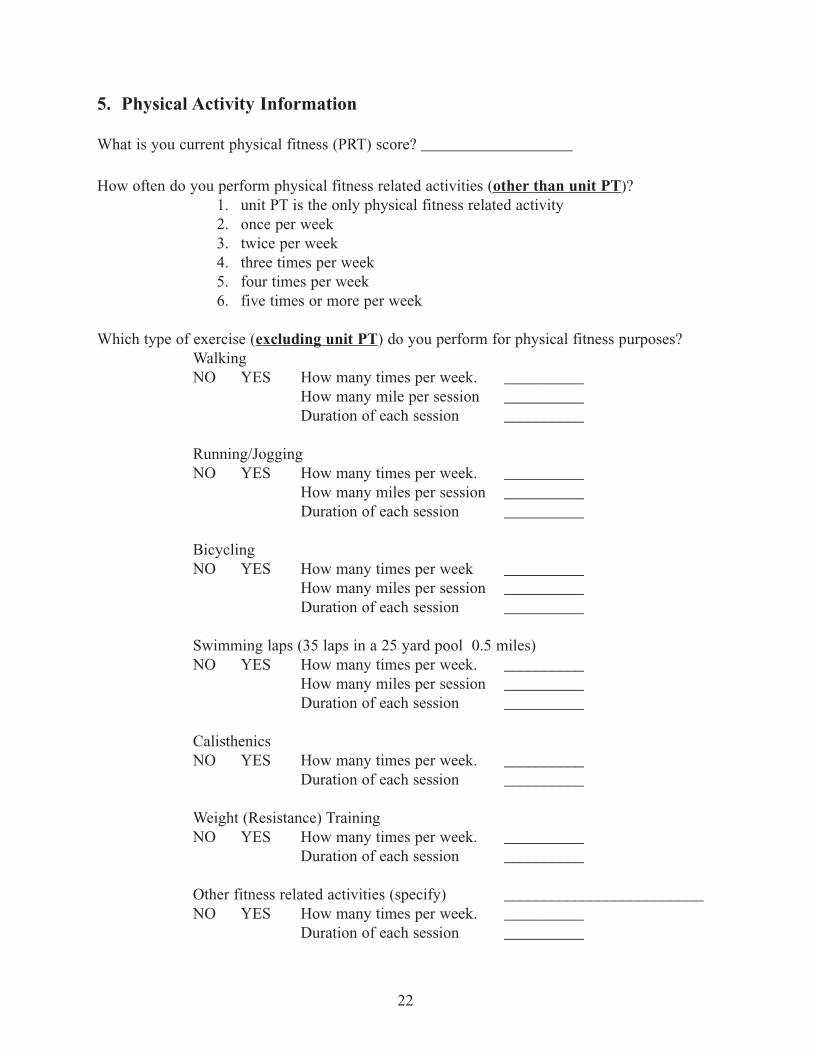
5. Physical Activity Information
What is you current physical fitness (PRT) score? ___________________
How often do you perform physical fitness related activities (other than unit PT)?1. unit PT is the only physical fitness related activity2. once per week3. twice per week4. three times per week5. four times per week6. five times or more per week
Which type of exercise (excluding unit PT) do you perform for physical fitness purposes?WalkingNO YES How many times per week. __________
How many mile per session __________Duration of each session __________
Running/JoggingNO YES How many times per week. __________
How many miles per session __________Duration of each session __________
BicyclingNO YES How many times per week __________
How many miles per session __________Duration of each session __________
Swimming laps (35 laps in a 25 yard pool 0.5 miles)NO YES How many times per week. __________
How many miles per session __________Duration of each session __________
CalisthenicsNO YES How many times per week. __________
Duration of each session __________
Weight (Resistance) TrainingNO YES How many times per week. __________
Duration of each session __________
Other fitness related activities (specify) _________________________NO YES How many times per week. __________
Duration of each session __________
22
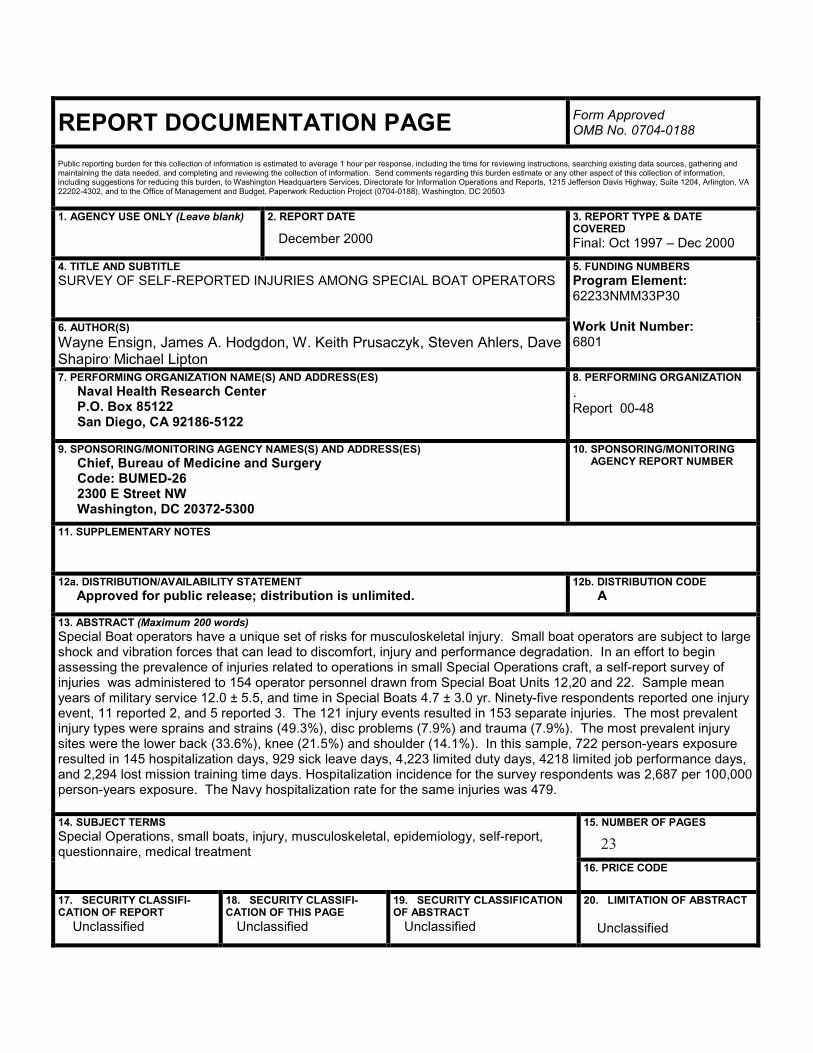
REPORT DOCUMENTATION PAGE Form ApprovedOMB No. 0704-0188
Public reporting burden for this collection of information is estimated to average 1 hour per response, including the time for reviewing instructions, searching existing data sources, gathering andmaintaining the data needed, and completing and reviewing the collection of information. Send comments regarding this burden estimate or any other aspect of this collection of information,including suggestions for reducing this burden, to Washington Headquarters Services, Directorate for Information Operations and Reports, 1215 Jefferson Davis Highway, Suite 1204, Arlington, VA22202-4302, and to the Office of Management and Budget, Paperwork Reduction Project (0704-0188), Washington, DC 20503
1. AGENCY USE ONLY (Leave blank) 2. REPORT DATE
December 2000
3. REPORT TYPE & DATECOVEREDFinal: Oct 1997 – Dec 2000
4. TITLE AND SUBTITLESURVEY OF SELF-REPORTED INJURIES AMONG SPECIAL BOAT OPERATORS
6. AUTHOR(S)
Wayne Ensign, James A. Hodgdon, W. Keith Prusaczyk, Steven Ahlers, DaveShapiro, Michael Lipton
5. FUNDING NUMBERSProgram Element:62233NMM33P30
Work Unit Number:6801
7. PERFORMING ORGANIZATION NAME(S) AND ADDRESS(ES)Naval Health Research CenterP.O. Box 85122San Diego, CA 92186-5122
8. PERFORMING ORGANIZATION
.Report 00-48
9. SPONSORING/MONITORING AGENCY NAMES(S) AND ADDRESS(ES)Chief, Bureau of Medicine and SurgeryCode: BUMED-262300 E Street NWWashington, DC 20372-5300
10. SPONSORING/MONITORING AGENCY REPORT NUMBER
11. SUPPLEMENTARY NOTES
12a. DISTRIBUTION/AVAILABILITY STATEMENT Approved for public release; distribution is unlimited.
12b. DISTRIBUTION CODE A
13. ABSTRACT (Maximum 200 words)Special Boat operators have a unique set of risks for musculoskeletal injury. Small boat operators are subject to largeshock and vibration forces that can lead to discomfort, injury and performance degradation. In an effort to beginassessing the prevalence of injuries related to operations in small Special Operations craft, a self-report survey ofinjuries was administered to 154 operator personnel drawn from Special Boat Units 12,20 and 22. Sample meanyears of military service 12.0 ± 5.5, and time in Special Boats 4.7 ± 3.0 yr. Ninety-five respondents reported one injuryevent, 11 reported 2, and 5 reported 3. The 121 injury events resulted in 153 separate injuries. The most prevalentinjury types were sprains and strains (49.3%), disc problems (7.9%) and trauma (7.9%). The most prevalent injurysites were the lower back (33.6%), knee (21.5%) and shoulder (14.1%). In this sample, 722 person-years exposureresulted in 145 hospitalization days, 929 sick leave days, 4,223 limited duty days, 4218 limited job performance days,and 2,294 lost mission training time days. Hospitalization incidence for the survey respondents was 2,687 per 100,000person-years exposure. The Navy hospitalization rate for the same injuries was 479.
15. NUMBER OF PAGES14. SUBJECT TERMSSpecial Operations, small boats, injury, musculoskeletal, epidemiology, self-report,questionnaire, medical treatment
16. PRICE CODE
17. SECURITY CLASSIFI-CATION OF REPORT Unclassified
18. SECURITY CLASSIFI-CATION OF THIS PAGE Unclassified
19. SECURITY CLASSIFICATIONOF ABSTRACT Unclassified
20. LIMITATION OF ABSTRACT
Unclassified
23