inline refractometer
TRANSCRIPT
Please note all file contents are Copyright © 2021 Battenkill Communications, Inc. All Rights Reserved.This file is for the buyer’s personal use only. It’s unlawful to share or distribute this file to others in any way
including e-mailing it, posting it online, or sharing printed copies with others.
®
the best of
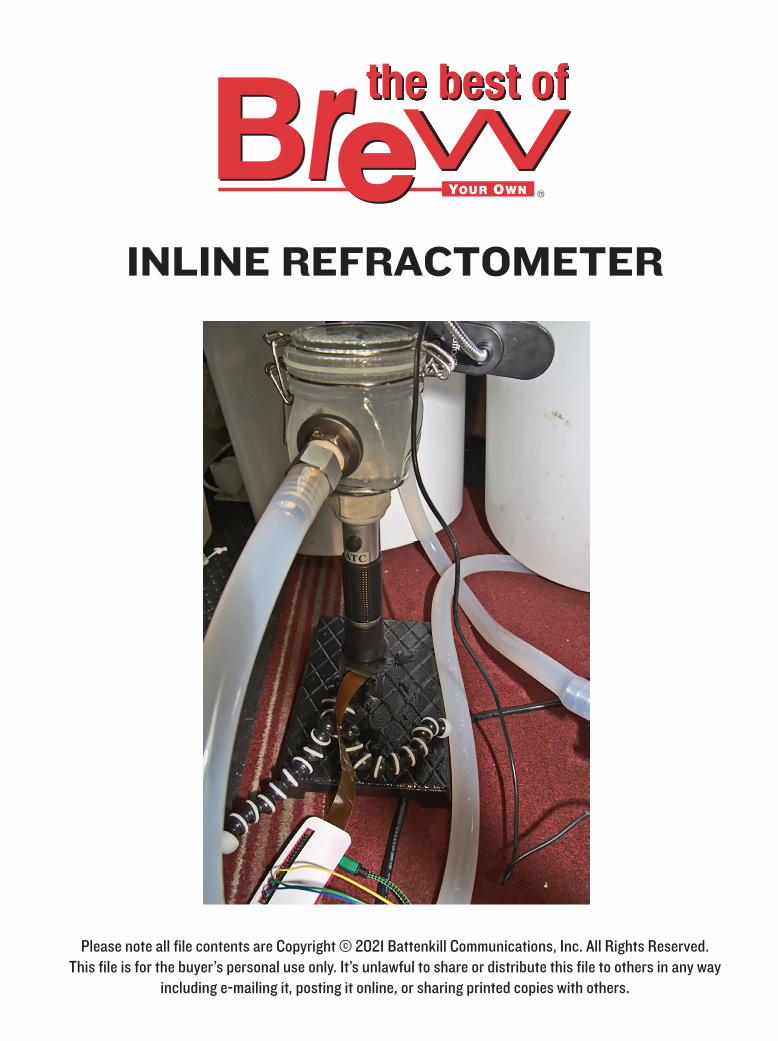
INLINE REFRACTOMETER
© Battenkill Communications, Inc. All Rights ReservedBest of Brew Your Own Magazine1
T he idea of this project was to measure the Brix of a wort inline during recirculations and transfer during the various processes of a
brew day. For example it could be used as part of the sparging process, so that the sparge can be stopped when the standard gravity (SG) approaches 1.008 (2.1 °Brix) to prevent the extraction of tannins. I can measure the mash’s first running’s to be able to see if the conver-sion efficiency was higher or lower than expected. Additionally, the principle could also be utilized during fermenta-tion assuming appropriate formulae are utilized to account for the presence of alcohol. That one is still in theoretical phase though.
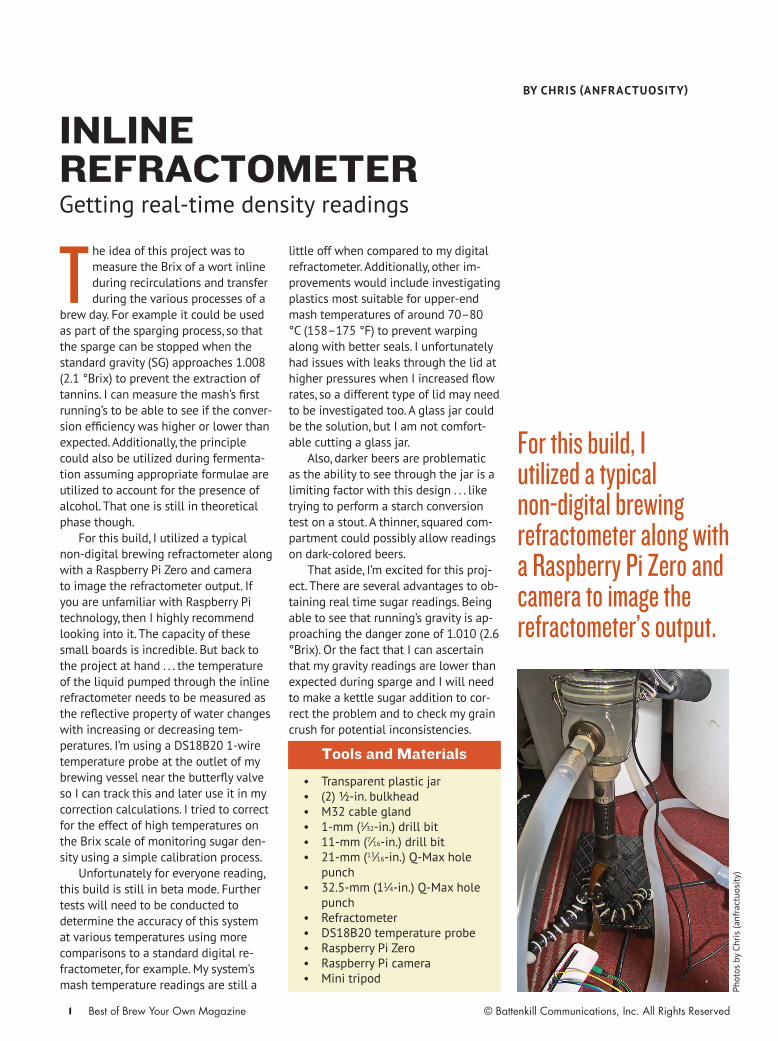
For this build, I utilized a typical non-digital brewing refractometer along with a Raspberry Pi Zero and camera to image the refractometer output. If you are unfamiliar with Raspberry Pi technology, then I highly recommend looking into it. The capacity of these small boards is incredible. But back to the project at hand . . . the temperature of the liquid pumped through the inline refractometer needs to be measured as the reflective property of water changes with increasing or decreasing tem-peratures. I’m using a DS18B20 1-wire temperature probe at the outlet of my brewing vessel near the butterfly valve so I can track this and later use it in my correction calculations. I tried to correct for the effect of high temperatures on the Brix scale of monitoring sugar den-sity using a simple calibration process.
Unfortunately for everyone reading, this build is still in beta mode. Further tests will need to be conducted to determine the accuracy of this system at various temperatures using more comparisons to a standard digital re-fractometer, for example. My system’s mash temperature readings are still a
little off when compared to my digital refractometer. Additionally, other im-provements would include investigating plastics most suitable for upper-end mash temperatures of around 70–80 °C (158–175 °F) to prevent warping along with better seals. I unfortunately had issues with leaks through the lid at higher pressures when I increased flow rates, so a different type of lid may need to be investigated too. A glass jar could be the solution, but I am not comfort-able cutting a glass jar.
Also, darker beers are problematic as the ability to see through the jar is a limiting factor with this design . . . like trying to perform a starch conversion test on a stout. A thinner, squared com-partment could possibly allow readings on dark-colored beers.
That aside, I’m excited for this proj-ect. There are several advantages to ob-taining real time sugar readings. Being able to see that running’s gravity is ap-proaching the danger zone of 1.010 (2.6 °Brix). Or the fact that I can ascertain that my gravity readings are lower than expected during sparge and I will need to make a kettle sugar addition to cor-rect the problem and to check my grain crush for potential inconsistencies.
Getting real-time density readings
INLINE REFRACTOMETER
For this build, I utilized a typical non-digital brewing refractometer along with a Raspberry Pi Zero and camera to image the refractometer’s output.
• Transparent plastic jar• (2) ½-in. bulkhead • M32 cable gland• 1-mm (1⁄32-in.) drill bit• 11-mm (7⁄16-in.) drill bit• 21-mm (13⁄16-in.) Q-Max hole
punch• 32.5-mm (11⁄4-in.) Q-Max hole
punch• Refractometer • DS18B20 temperature probe• Raspberry Pi Zero• Raspberry Pi camera• Mini tripod
Tools and Materials
BY CHRIS (ANFRACTUOSITY)
Phot
os b
y Ch
ris (a
nfra
ctuo
sity
)
© Battenkill Communications, Inc. All Rights ReservedBest of Brew Your Own Magazine2
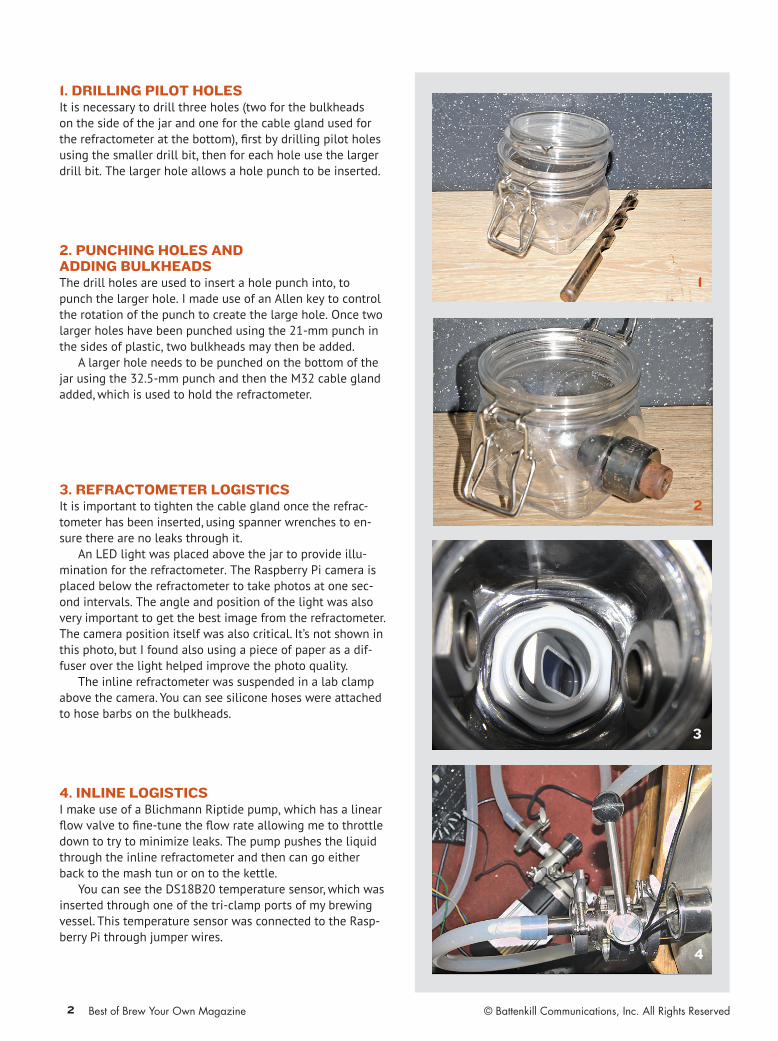
3. REFRACTOMETER LOGISTICSIt is important to tighten the cable gland once the refrac-tometer has been inserted, using spanner wrenches to en-sure there are no leaks through it.
An LED light was placed above the jar to provide illu-mination for the refractometer. The Raspberry Pi camera is placed below the refractometer to take photos at one sec-ond intervals. The angle and position of the light was also very important to get the best image from the refractometer. The camera position itself was also critical. It’s not shown in this photo, but I found also using a piece of paper as a dif-fuser over the light helped improve the photo quality.
The inline refractometer was suspended in a lab clamp above the camera. You can see silicone hoses were attached to hose barbs on the bulkheads.
2. PUNCHING HOLES AND ADDING BULKHEADSThe drill holes are used to insert a hole punch into, to punch the larger hole. I made use of an Allen key to control the rotation of the punch to create the large hole. Once two larger holes have been punched using the 21-mm punch in the sides of plastic, two bulkheads may then be added.
A larger hole needs to be punched on the bottom of the jar using the 32.5-mm punch and then the M32 cable gland added, which is used to hold the refractometer.
1. DRILLING PILOT HOLESIt is necessary to drill three holes (two for the bulkheads on the side of the jar and one for the cable gland used for the refractometer at the bottom), first by drilling pilot holes using the smaller drill bit, then for each hole use the larger drill bit. The larger hole allows a hole punch to be inserted.
4. INLINE LOGISTICSI make use of a Blichmann Riptide pump, which has a linear flow valve to fine-tune the flow rate allowing me to throttle down to try to minimize leaks. The pump pushes the liquid through the inline refractometer and then can go either back to the mash tun or on to the kettle.
You can see the DS18B20 temperature sensor, which was inserted through one of the tri-clamp ports of my brewing vessel. This temperature sensor was connected to the Rasp-berry Pi through jumper wires.
1
2
4
3
© Battenkill Communications, Inc. All Rights ReservedBest of Brew Your Own Magazine3
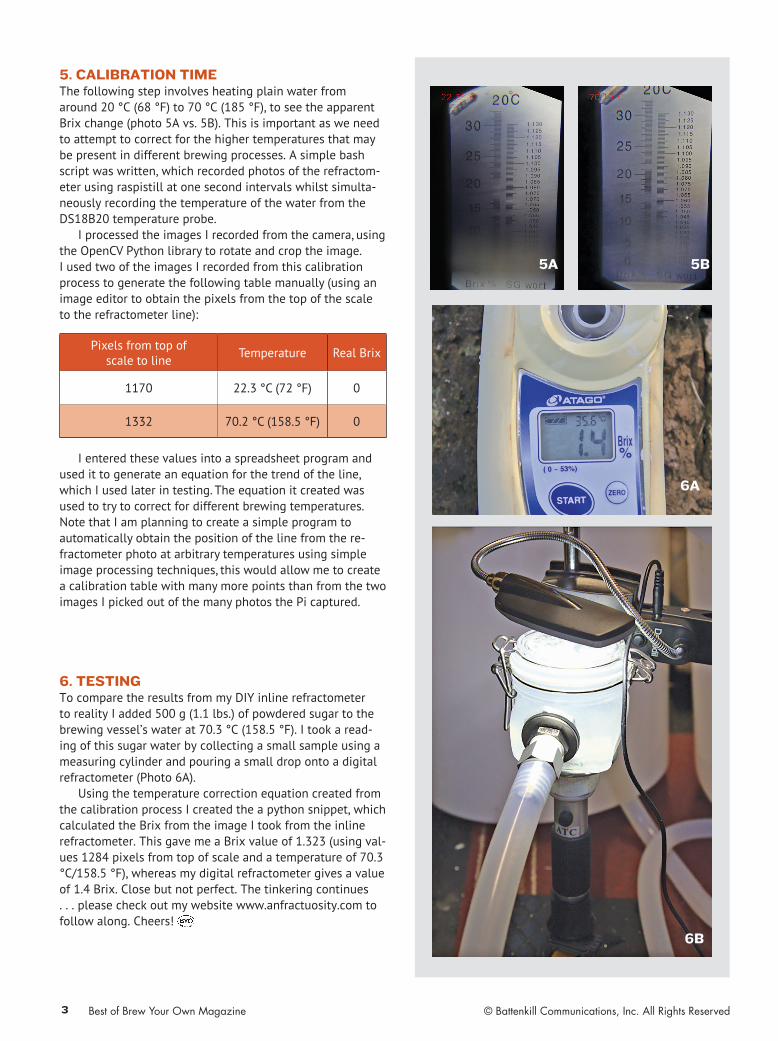
6. TESTINGTo compare the results from my DIY inline refractometer to reality I added 500 g (1.1 lbs.) of powdered sugar to the brewing vessel’s water at 70.3 °C (158.5 °F). I took a read-ing of this sugar water by collecting a small sample using a measuring cylinder and pouring a small drop onto a digital refractometer (Photo 6A).
Using the temperature correction equation created from the calibration process I created the a python snippet, which calculated the Brix from the image I took from the inline refractometer. This gave me a Brix value of 1.323 (using val-ues 1284 pixels from top of scale and a temperature of 70.3 °C/158.5 °F), whereas my digital refractometer gives a value of 1.4 Brix. Close but not perfect. The tinkering continues . . . please check out my website www.anfractuosity.com to follow along. Cheers!
5. CALIBRATION TIMEThe following step involves heating plain water from around 20 °C (68 °F) to 70 °C (185 °F), to see the apparent Brix change (photo 5A vs. 5B). This is important as we need to attempt to correct for the higher temperatures that may be present in different brewing processes. A simple bash script was written, which recorded photos of the refractom-eter using raspistill at one second intervals whilst simulta-neously recording the temperature of the water from the DS18B20 temperature probe.
I processed the images I recorded from the camera, using the OpenCV Python library to rotate and crop the image. I used two of the images I recorded from this calibration process to generate the following table manually (using an image editor to obtain the pixels from the top of the scale to the refractometer line):
I entered these values into a spreadsheet program and used it to generate an equation for the trend of the line, which I used later in testing. The equation it created was used to try to correct for different brewing temperatures. Note that I am planning to create a simple program to automatically obtain the position of the line from the re-fractometer photo at arbitrary temperatures using simple image processing techniques, this would allow me to create a calibration table with many more points than from the two images I picked out of the many photos the Pi captured.
5B5A
6B
Pixels from top of scale to line Temperature Real Brix
1170 22.3 °C (72 °F) 0
1332 70.2 °C (158.5 °F) 0
6A