inman, cf; murray, tz; bailey, m; cose, s (2012) most b...
TRANSCRIPT

Inman, CF; Murray, TZ; Bailey, M; Cose, S (2012) Most B cells innon-lymphoid tissues are nave. Immunology and cell biology, 90 (2).pp. 235-42. ISSN 0818-9641 DOI: https://doi.org/10.1038/icb.2011.35
Downloaded from: http://researchonline.lshtm.ac.uk/710/
DOI: 10.1038/icb.2011.35
Usage Guidelines
Please refer to usage guidelines at http://researchonline.lshtm.ac.uk/policies.html or alterna-tively contact [email protected].
Available under license: http://creativecommons.org/licenses/by-nc-nd/2.5/

Supplementary figure 1.
Lymphocytes were isolated from the indicated organs of perfused, uninfected mice and stained
with antibodies to B220, IgM and IgD. (A) Representative plots are gated (B220+) B cells.
Numbers within each plot represent the percentage of gated B cells falling into each indicated
quadrant. (B) Collated data show the percent of B cells within the whole lymphocyte population
(open bars) and the proportion of those B cells co-expressing IgM and IgD (closed bars). n = 5-9
different experiments, with 2-4 organs combined per experiment for lung, liver and LP. Error
bars represent the SD.
Supplementary figure 2.
Lymphocytes were isolated from various organs and stained with antibodies to CD19, IgD and
the indicated markers in table S1, which have been shown to be upregulated on memory B cells.
Representative flow cytometry histograms show the gating strategy and the expression of the
molecules in Table S1 on B cells from the indicated tissues.
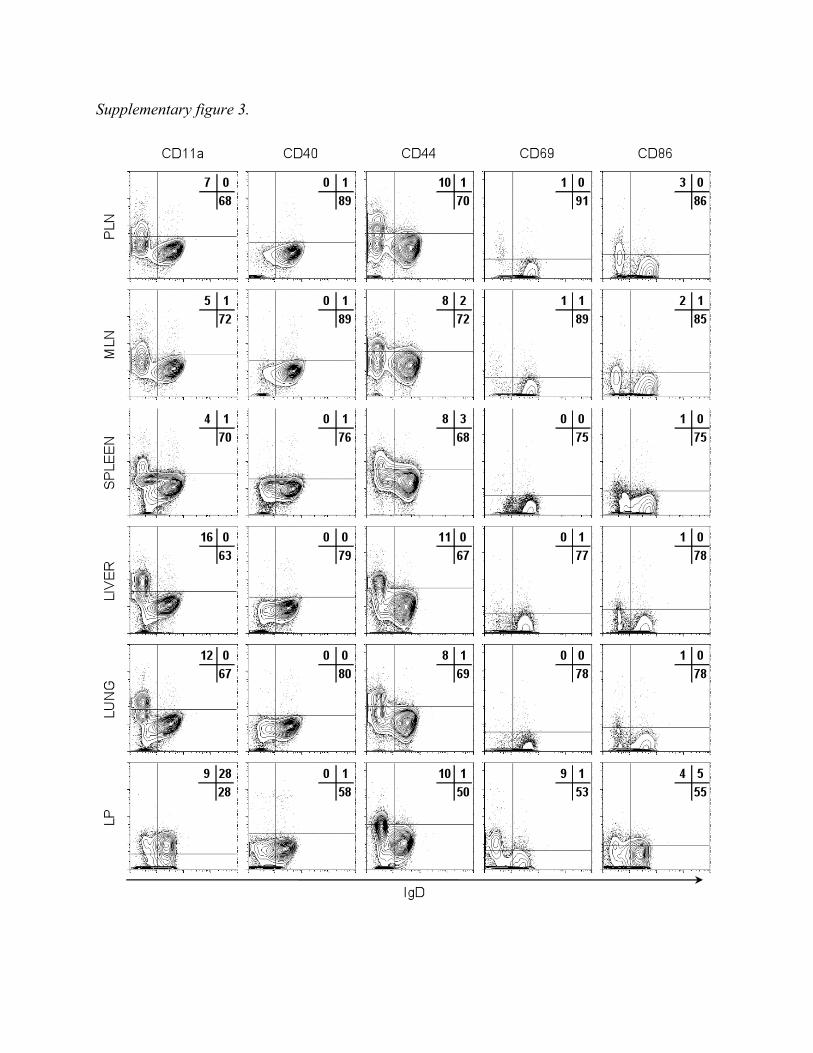
Supplementary figure 3.
Lymphocytes were isolated from various organs and stained with antibodies to CD19, IgD and
the indicated markers in table S2, which have been shown to be upregulated upon activation.
Representative flow cytometry histograms show the expression of the molecules in table S2 on B
cells from the indicated tissues.
Supplementary figure 4.
Expression pattern of surface molecules on activated B cells. In order to ensure that the markers
shown in table S2 were upregulated on activation, splenocytes (2x10⁶) were stimulated with
(open histograms) or without (shaded histograms) LPS (O55:B5, 10 µg/ml; Sigma) in 2ml RPMI

for 24 hours. Gated B220+ B cells are shown. Data are representative of two individual
experiments.
Supplementary figure 5.
In order to visualise naïve B cells in the parenchyma of the tissues, organs from perfused mice
were snap frozen and stained with antibodies against B220 (red) and IgD (green) and
counterstained with DAPI (blue). (A) Images show B220+IgD+ B cells (arrows) within the
parenchymal tissues of the indicated organs. Scale bar in the top left hand corner represents
10µm. (B) Quantitative immunohistology on tissues stained with antibodies against B220, IgD
and CD31 (Figure 2A) showed that the observed B220+/IgD+ area away from CD31+ blood
vessels was significantly greater than the expected area in all tissues (observed
B220+/IgD+/CD31- co-localization, black diamonds; Expected B220+/IgD+/CD31- co-
localization, open triangles). Data were tested using a Wilcoxon Signed Ranks test. SPL *
p=0.05x10⁻⁵; LUNG * p=0.02 x10⁻³; LIV * p=0.05 x10⁻⁶; LP * p=0.07 x10⁻³. Each data point
represents data from 1 image (40 images from SPL and LIV, 25 images from LUNG and 35
images from LP). SPL, LIV and LP taken from 4 mice. LUNG taken from 3 mice. Images were
captured using a Leica DMR-A microscope with a Hamamatsu Orca-ER camera (Hamamatsu)
and Q-fluoro software (Leica) with a x40 objective. Prior to thresholding, the analysis was
carried out on unmanipulated images.
Supplementary Figure 6.
A series of four images from intestinal mucosa stained with antibodies against B220 (red), IgD
(green) and CD31 (blue). For each image, the individual colour channels (R, red; G, green; B,
blue), the composite image (RGB) and the image after identification of regions of interest and
thresholding for quantitative pixel area analysis (post-threshold) are shown.
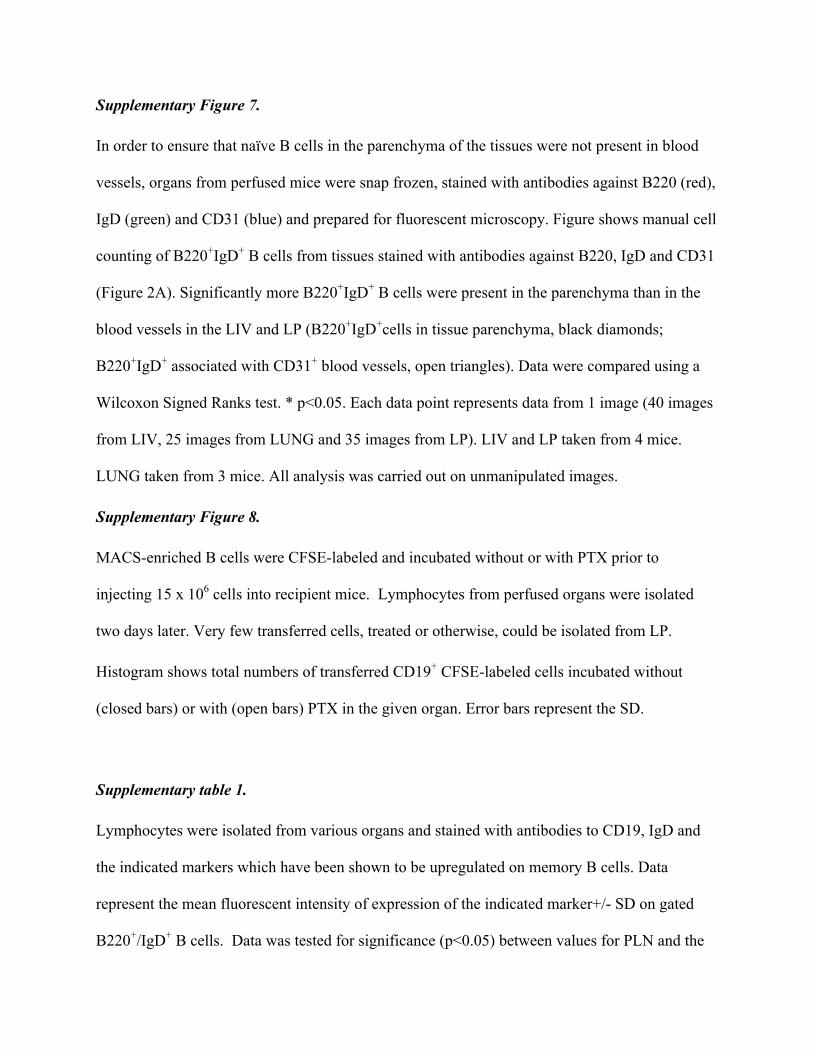
Supplementary Figure 7.
In order to ensure that naïve B cells in the parenchyma of the tissues were not present in blood
vessels, organs from perfused mice were snap frozen, stained with antibodies against B220 (red),
IgD (green) and CD31 (blue) and prepared for fluorescent microscopy. Figure shows manual cell
counting of B220+IgD+ B cells from tissues stained with antibodies against B220, IgD and CD31
(Figure 2A). Significantly more B220+IgD+ B cells were present in the parenchyma than in the
blood vessels in the LIV and LP (B220+IgD+cells in tissue parenchyma, black diamonds;
B220+IgD+ associated with CD31+ blood vessels, open triangles). Data were compared using a
Wilcoxon Signed Ranks test. * p<0.05. Each data point represents data from 1 image (40 images
from LIV, 25 images from LUNG and 35 images from LP). LIV and LP taken from 4 mice.
LUNG taken from 3 mice. All analysis was carried out on unmanipulated images.
Supplementary Figure 8.
MACS-enriched B cells were CFSE-labeled and incubated without or with PTX prior to
injecting 15 x 106 cells into recipient mice. Lymphocytes from perfused organs were isolated
two days later. Very few transferred cells, treated or otherwise, could be isolated from LP.
Histogram shows total numbers of transferred CD19+ CFSE-labeled cells incubated without
(closed bars) or with (open bars) PTX in the given organ. Error bars represent the SD.
Supplementary table 1.
Lymphocytes were isolated from various organs and stained with antibodies to CD19, IgD and
the indicated markers which have been shown to be upregulated on memory B cells. Data
represent the mean fluorescent intensity of expression of the indicated marker+/- SD on gated
B220+/IgD+ B cells. Data was tested for significance (p<0.05) between values for PLN and the

rest of the tissues using ANOVA after an F-test to test for normal distribution. Data in bold
represents a significant difference between that tissue and PLN. n = 4-9 individual experiments,
with 2-4 mice combined per experiment for LIV, LUNG and LP.
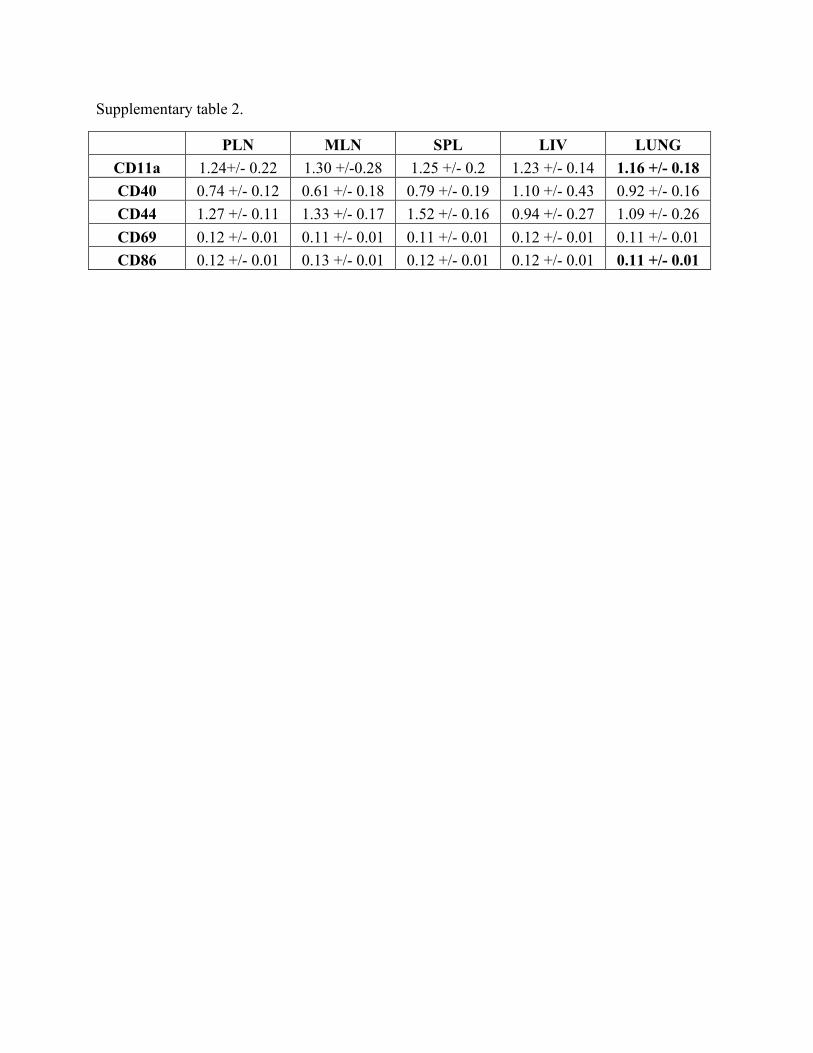
Supplementary Table 2.
Lymphocytes were isolated from various organs and stained with antibodies to CD19, IgD and
the indicated markers which have been shown to be upregulated upon activation. Data represent
the mean fluorescent intensity of expression of the indicated marker +/- SD on gated B220+/IgD+
B cells. Data was tested for significance (p<0.05) between values for PLN and the rest of the
tissues using ANOVA after an F-test to test for normal distribution. Data in bold represents a
significant difference between that tissue and PLN. n = 4-9 individual experiments, with 2-4
mice combined per experiment for LIV, LUNG and LP.

Supplementary figure 1.

Supplementary figure 2.
Supplementary figure 3.

Supplementary figure 4.

Supplementary figure 5.

Supplementary figure 6.

Supplementary figure 7.

Supplementary figure 8.

Supplementary table 1.
PLN MLN SPL LIV LUNG LP MHC II
15.41+/-1.92 18.38+/-2.44 14.16+/-1.66 15.36+/-1.21 13.88+/1.03 17.14+/-9.73
CD62L 1.20+/-0.30 1.09+/-0.38 0.70+/-0.23 0.27+/-0.04 1.23+/-0.09 0.24+/-0.10 CD73 0.12+/-0.01 0.12+/-0.01 0.12+/-0.01 0.12+/-0.01 0.11+/-0 0.15+/-0.02 CD80 0.12+/-0.01 0.12+/-0.01 0.12+/-0.01 0.11+/-0.01 0.11+/-0 0.13+/-0.01 CD95 0.13+/-0.01 0.13+/-0.01 0.13+/-0.01 0.12+/-0.01 0.12+/-0.01 0.14+/-0.02
Supplementary table 2.
PLN MLN SPL LIV LUNG CD11a 1.24+/- 0.22 1.30 +/-0.28 1.25 +/- 0.2 1.23 +/- 0.14 1.16 +/- 0.18 CD40 0.74 +/- 0.12 0.61 +/- 0.18 0.79 +/- 0.19 1.10 +/- 0.43 0.92 +/- 0.16 CD44 1.27 +/- 0.11 1.33 +/- 0.17 1.52 +/- 0.16 0.94 +/- 0.27 1.09 +/- 0.26 CD69 0.12 +/- 0.01 0.11 +/- 0.01 0.11 +/- 0.01 0.12 +/- 0.01 0.11 +/- 0.01 CD86 0.12 +/- 0.01 0.13 +/- 0.01 0.12 +/- 0.01 0.12 +/- 0.01 0.11 +/- 0.01