innovation accounting - the conference board 1204… · innovation accounting carol a. corrado, the...
TRANSCRIPT

EEccoonnoomm iiccss PPrrooggrraamm WWoorrkkiinngg PPaapp eerr SSeerr iieess
Innovation Accounting
Carol Corrado and Charles Hulten
The Conference Board
October 2012
EEPPWWPP ##1122 -- 0044
Economics Program
845 Third Avenue
New York, NY 10022-6679
Tel. 212-759-0900
www.conference-board .org/ economics

INNOVATION ACCOUNTING
Carol A. Corrado, The Conference Board, New York,
and Georgetown University Center for Business and Public Policy
Charles R. Hulten, The University of Maryland and NBER
July 25, 2012
(Revised, October 8, 2012)
Paper prepared for the NBER-CRIW conference, “Measuring Economic Progress and
Economic Sustainability,” Cambridge, Massachusetts, August 6-8, 2012.

INNOVATION ACCOUNTING
Carol A. Corrado and Charles R. Hulten
“We will be more likely to promote innovative activity if we are able to measure it more effectively and document its role in economic growth”
U.S. Federal Reserve Chairman Ben S. Bernanke, May 2011.*
The national income and product accounts are one of the most important achievements
of the field of economics. They provide a time series record of the volume of economic
activity and its major complements, one that is reasonably consistent over time. The
NIPAs thus provide a quantitative framework for understanding the magnitude and
sources of past economic growth and a framework for diagnosing current economic
problems. It is hard to imagine the formulation of recent economic policy without the
information contained in the national accounts.
This is precisely what policymakers had to confront during the Great Depression.
Nascent GDP estimates first rose to prominence during WWII where they played a
critical role in resource planning. First published in the late 1940s, the U.S. NIPAs
have evolved to include dozens of tables that incorporate a vast quantity of data from a
large number of sources.
For all this impressive effort, the national accounting system has come under criticism
from a number of directions. It is essentially an account of the sources and uses of the
nation's productive capacity as represented by its market activity. While such data are
of great importance for addressing critical economic issues and trends, they do not
address all such issues. For example, they omit important nonmarket activities, like
those arising in the household sector of the economy, and more generally, the various
activities associated with the use of time. The effect upon the environment is also an
area in which the national accounts have traditionally had little to say. Finally, there is
dissatisfaction with the use of gross domestic product as the summary statistic for total
economic activity. This concept is said to be too easily confused with economic
* Quote from keynote address at an international conference on intangibles held at Georgetown
University in Washington, D.C. in May 2011.

2
well-being, perhaps even with happiness, which depends among other things on the way
GDP is distributed among people and on the choices people make about non-market
uses of time.
These issues provide the subject matter of much of this conference and proceedings.
Our contribution takes a different look at the problem of GDP as a market concept.
Within the general framework of the sources and uses of a nation’s productive capacity
as presented in the accounts, we ask whether GDP as currently measured provides a
sufficient account of the forces causing GDP to grow over time. Our focus is on the
processes of innovation that have both greatly affected the growth and composition of
U.S. GDP in recent decades and been a persistent long-run driver of rising living
standards. Our previous work (Corrado, Hulten, and Sichel 2005, 2009; Corrado and
Hulten 2010) on this topic focused solely on how much of an economy’s aggregate
resources is directed to innovation.
One of the most important purposes of the national accounts is to provide a long-term
historical record against which to judge trends in economic growth, and present data
with which to explain these trends. Table 1.1.6 of the U.S. national accounts, for
example, indicates that real GDP in 2005 stood at $976 billion in 1929, the first year for
which GDP data is available, and that this figure rose to $2 trillion in 1950 and then to
$13.3 trillion in 2011. These estimates imply an average annual growth rate of more
than 3.2% over the 1929-2011 period as a whole. When viewed against the backdrop of
these estimates, the 1.6 percent rate of growth since 2000 and 0.2% growth rate since
2007 are particularly weak. The financial crisis, great recession, and weak recovery to
date could be said to “explain” this. But what do we infer from the accompanying
slowdown in productivity growth? The usual footprints of a prolonged and deep
recession—or the economy’s innovation processes grinding to a halt?
Accounting practice has traditionally linked inputs of capital and labor to the output of
consumption, investment, net exports, and government output in the context of the
circular flow of products and payments. No explicit account was taken of the
innovations in technology and the organization of production that led either to a greater

3
quantity of output from a given base of inputs or improvements in the quality of the
inputs and outputs. This situation has changed dramatically with the System of National
Accounts 2008 (SNA 2008) decision to capitalize certain types of research and
development expenditure in the national accounts framework. R&D is unquestionably
an important part of the innovation process, but it is by no means the only part or even
the most important part. We have found, in our previous research, that a very broad
definition of innovation investment—commonly referred to as “intangibles”—has been
the largest systematic driver of economic growth in business sector output over the last
50 years (Corrado and Hulten 2010), and that U.S. businesses currently invest more in
intangibles than they do in traditional fixed assets (figure 1). Most of these intangibles
are currently omitted from both national and financial accounting practice.
This paper describes some of the steps involved in building a more comprehensive
national innovation account as a satellite to the main national accounting framework. A
complete national innovation account would necessarily span intangible investments by
businesses, households, and government. Our previous work has been almost entirely
on the first category and the bulk of our comments here will continue to be directed at
business intangible capital and its measurement. Broad issues confronting intangibles
developed in the household sector (in the areas of education and health) and by
governments (basic research, standard-setting, and infrastructure) are only touched
upon.
We also discuss the importance of the quality (or productivity) dimension of intangible
investment, an issue that has largely been absent from the intangibles literature. Our
most recent work places this issue in the foreground of intangibles analysis (Hulten
2010, 2012; Corrado, Goodridge, and Haskel 2011).

4
Source: Update for this paper using methods originally set out in Corrado, Hulten, and Sichel (2005)
modified to include BEA’s estimates of performer R&D (Moylan and Robbins 2007), Soloviechek’s estimates of entertainment and artistic originals (Soloveichek 2010), and the new method for estimating
investment in new financial products in Corrado, Haskel, Jona-Lasinio, and Iommi (2012). Note: Figures
for recent years are preliminary estimates; revision forthcoming January 2013.
1. Expanding the Existing Accounts
National income and product accounting is a familiar and well-established field of
economics, as is growth accounting. Innovation accounting is not, though the SNA
2003 decision to capitalize software and artistic originals followed by, as previously
mentioned, the same move for R&D in SNA 2008 are important steps in that direction.
There are, of course, many innovation metrics in the innovation literature (e.g., value
and number of angel and venture deals, number of patents—more on this below), but
they are not integrated into an internally consistent framework linked to a common
.03
.05
.07
.09
.11
.13
.15
.17
.19
1977 1980 1983 1986 1989 1992 1995 1998 2001 2004 2007 2010
Figure 1. U.S. Business Investment Rates, 1977-2010 (ratio to business output adjusted to include new intangibles)
Intangible Tangible

5
performance measure. Because economic innovation is valued in large part because of
its effects on income and wealth, embedding an innovation account within the larger
GDP and growth accounting framework makes sense. A natural way to proceed
therefore is to ask how the existing product, wealth, and growth accounts might be
supplemented or expanded to accommodate this objective.
The growth accounting model already contains a rudimentary innovation account in the
form of total factor productivity (TFP). TFP is generally associated with costless
“technical change,” which is one manifestation of innovation. The problem with this
approach to innovation accounting is that TFP is typically measured as a residual, a fact
that has earned it the name “the measure of our ignorance.” Moreover, because TFP is
a partial indicator of innovation outcomes, it is not a complete basis for innovation
accounting itself.
The TFP index developed by Solow (1957) and extended first by Jorgenson and
Griliches (1967) is nonetheless the starting point of the analysis that follows. In the
Solow-Jorgenson-Griliches model, production, tQ , takes place under constant returns
and Hicks’ neutral productivity change, tA :
(1.1) ( , )t t t tQ A K LF
Under the conditions of competitive equilibrium, the value of the marginal products of
labor and capital, and t tL K , equal corresponding factor prices and L K
t tP P , and the
GDP/GDI identity can be derived from the production function. Moreover, the growth
rate of output can be decomposed into the contributions of labor and capital, weighted
by their respective income shares, yielding the growth rate of the Hicksian efficiency
term:
(1.2) K L
t tt tt t t t
Q Qt t tt tt t t
Q P PK LK L A = + + .P PQ Q QK L A
Expressions with over-dots are rates of growth. The first two terms on the right-hand
side of (1.2) are the contributions of capital and labor to the growth in output,

6
interpreted as a movement along the production function, while the last term in the
output growth occurring as a result of productivity change, interpreted as a shift in the
function.
In the following subsections, we will consider the modifications and additions needed to
expand the basic growth accounting framework to be a more comprehensive and
explicit framework for measuring innovation. This involves four general steps, some of
which have already been undertaken (in part or in whole):
introducing innovation inputs such as R&D into the underlying model
making product quality change an explicit component of real GDP
making quality change in the inputs of labor and capital more explicit
making process improvements that lower unit costs and prices more explicit
We discuss each of these topics and then turn our attention to measurement.
1.1. Capitalizing intangibles reveals investments in innovation
The link between productivity, intangible investments and innovation has roots in
numerous literatures. R&D has been part of neoclassical growth accounting since the
1970s (Griliches 1973, 1979) and innovation was made explicit in endogenous growth
models beginning in the 1990s (e.g., Romer 1990, Aghion and Howitt 2007).
Corrado, Hulten, and Sichel (2005, 2009) examined the question of how the amount
spent on innovation in each year is represented in the current price GDP accounts. This
involves two separate adjustments, one for the amount spent in each year and the other
for the capitalized value of this spending as an output. R&D tops the list of items
included in the expanded accounts, but the list is in fact much longer, as emphasized in
our earlier work with Sichel as well as some preceding studies (e.g., Nakamura 2001).
In short, a broad concept of R&D is needed to fully represent the innovation process.
Innovation involves co-investments in marketing, worker training, and organizational
development. As noted in the introduction, the items on this longer list of innovation-
related expenditures have come to be called “intangible capital.”

7
Including intangible capital in the fundamental national accounting identity involves
adjustments to both GDP and gross domestic income, GDI. To keep things simple, we
examine the case in which a single intangible is capitalized and added to the national
accounting identity. The value of aggregate output is represented by Q
t tP Q , but now
nominal-price investment in the intangible, N
t tP N , is added to the other components of
final demand ( )C I
t t t tP C P I to obtain GDP. On the income/input side, the gross
income accruing to the stock of intangibles, R
t tP R , is treated as a component of GDI.
The expanded accounting identity now has the form:
(1.3) Q C I N L K R
t t t t t t t t t t t t t tP Q P C P I P N P L P K P R
The corresponding growth accounting equation then has the form
(1.4) ,K R L
t t tt t tt t t t t
Q Q Qt t t tt t tt t t t
Q P P PK R LK R L A = + + P P PQ Q Q QK R L A
where the output index now includes real investment in the intangible asset
(1.5) .C I L
tt ttt t t t t t
Q Q Qtt tt t tt t t t
Q P P PC NIC NI = P P PQ Q Q QC NI
The stock of intangible capital tR is the accumulated real intangible investment tN via
the perpetual inventory model (PIM): 1(1 )t t tR N R . The term is the rate of
decay of appropriable revenues from the conduct of commercial knowledge production.
The accounting algebra of intangible capital is relatively straightforward. The
interpretation, however, is less so.
Enter demand
First, unlike tangible capital and labor, intangible capital is not a direct input to
production, in the sense that an increase in R&D or marketing does not necessarily have
a direct impact on the production of the goods made for sale. This raises a question

8
about the interpretation of the share weights in equation (1.4). The literature has
generally adopted the position that intangible investment affects output indirectly via
the efficiency shift term, tA . This is a reasonable assumption for many types of
intangible capital, but not all types. Product R&D and marketing are not directed at
increasing the efficiency of production but, rather, to the design and sale of goods and
services. Hulten (2012) provides one solution to this problem by introducing demand-
side considerations into the growth accounting framework, and, following Nerlove and
Arrow (1962) interpreting the elasticity is accordingly. This approach implies that the
introduction of intangibles into the accounting framework involves a basic shift in the
perspective of growth accounting away from a pure production function foundation.
…. and market power
Models in which innovation is explicit model it as a source of market power, which also
introduces demand-side elements to the model. Romer (1990) assumed innovators
were, in effect, a separate sector of the economy (he called it the design sector) who
practiced monopoly pricing. In Romer the innovator’s price is given by P MC ,
where MC is the marginal cost of producing a new good and is the producer markup,
a function of the good’s price elasticity of demand (Romer 1990, un-numbered
equations at the top of page S87). Romer goes on to formulate the intertemporal zero-
profit constraint, whose solution equates the instantaneous excess of revenue over
marginal production cost as just sufficient to cover the interest cost of the innovation
investment (equations 6 and 6', page S87).
In a two-sector neoclassical growth model where the two sectors are a production sector
and a R&D sector, Romer’s solution for producers’ markups can be shown to be a
simple transform of the factor share of intangible capital (Corrado, Goodridge, and
Haskel 2011, p. 12). Let this ratio be denoted as Rs , which isR QP R P Q from above,
time subscripts ignored. When intangible investment is equated to Romer’s “innovation
investment” and variable production costs C are equated with marginal costs,1 Corrado
1 Variable production costs exclude the costs of R&D labs.

9
et al. (2011) showed that the Romer producer markup equals 1 (1 )Rs , i.e., that it must
be just sufficient to generate revenue that covers the “interest costs” of innovation .
The existence of market power in the innovation sector stems from a host of underlying
business dynamics that are suppressed for the sake of simplicity in an aggregate model.
Commercial knowledge is modeled as non-rival and appropriable in these models—but
in reality new products and processes constantly come and go, each with a finite period
of appropriability. Commercial knowledge may be thus represented as a single asset
being produced and “sold” at a monopoly price in all periods in these models, but the
underlying dynamics involve overlays of case after case of Romer’s intertemporal zero-
profit solution.
One implication of this solution is that value of own-produced intangibles includes an
innovator markup, 1 , that may be modeled as a multiple of the competitive factor
costs of the inputs used up in the innovation process. Variants of such a formulation
entered BEA’s R&D satellite account (Moylan and Robbins 20007), the calculations in
Hulten and Hao (2008), and Corrado et al. (2011)’s suggested method for calculating
R&D price deflators. Like Rs , in the latter model (un-numbered equation, p. 18), the
parameter is related to the price elasticity of demand, as the producer markup then
becomes 1 (1 )Rs .
Romer notes that the design sector can of course be in-house, consistent with the fact
that most business intangibles are produced and used within the confines of a firm and
therefore do not generate an externally observable price and quantity. This is not a
problem for theory, which can appeal to shadow prices in the place of market-
determined prices, but it poses serious problems for the measurement of these
intangibles. Measurement is discussed in a separate section below.
1.2. Real output includes a term in quality change
GDP is a measure of the volume of output flowing through markets, valued at current
market prices. This is a source of strength as well as a source of weakness. It is a
strength because market flows are observable by the statistician and market valuations

10
are an arms-length indicator of the value of the transaction to both seller and buyer.
GDP growth also has important implications for employment and personal incomes
(“don’t leave home without it”).
At the same time, much is left out standard measures. According to a new satellite
account for household production in the United States (Bridgman et al. 2012, p. 33), the
household production of consumption goods was 43 percent of GDP in 1965, falling to
28 percent in 2010. This omission is particularly important for innovation accounting
given the change that has occurred and the resources the transformation of household
production has released into the market place. Moreover, market GDP/GDI is an
aggregate and therefore does not address the question of how the gains from innovation
are shared in the population.
Nor is GDP an index of happiness, utility, or well-being. The “happiness” content of
each additional dollar of GDP is a separate issue from the purposes of this paper, which
focuses how innovation affected the supply-side constraints facing an economy. The
boundary between the producer and consumer is blurred when considering product-
oriented innovation, however. William Nordhaus (1997, pages 54-55) has argued in his
paper on the history of lighting that “official price and output data “may miss the most
important revolutions in history,” because they miss the really large (“tectonic”)
advances in technology.2 Tectonic breakthroughs in new goods originate on the supply-
side and can be thought of as the introduction of a new dimension in the supply-side
constraint (or, in some cases, as a shift in the constraint). The “size” of the innovation
cannot be measured with reference to the constraint alone, however, because it is a
matter of the impact of the innovation of the consumer.
2 The issues involved with output quality adjustment can be illustrated by the following example. There
are two countries, A and B, each with two workers who can produce one unit of output each (widgets).
Labor productivity in both countries is thus equal to one. Country A then deploys one worker is
employed in research aimed at increasing productivity while the other worker remains in production and
now produces three widgets. Labor productivity rises to 1.5. Country B does almost the same thing, but
its researcher is employed in improving the quality of widgets so that one new widget is the equivalent of
three old ones. If country B’s new widgets are not adjusted for quality, then measure labor productivity
will appear to have fallen to 0.5. On the other hand, if a quality adjustment is made, labor productivity in
B is the same as in country A. Failure to make a quality correction thus leads to a biased comparison of
growth in the two countries.

11
Indeed, in the hedonic price approach to measuring product improvements, it is the
implied shift in the supply-side constraint it determined by the interaction of the supply
and demand of the improved good. The quantity of the good received by the consumer
is measured in effectiveness units, while the quantity sold by the producer is measured
in transactions units (e.g., a personal computer measured in units of computing power
versus the physical computer sold). In this model, an increase in the effectiveness of a
good is measured in terms of the equivalent quantity of the older vintage of the good
needed achieve the same result. In other word, “better” is treated as “more.”
This approach can be put into the growth accounting framework in the following way.
Let output in effectiveness units be denoted by e
tQ and the corresponding transaction-
based quantity by tQ . The corresponding prices are e
tP and Pt . Because the total
amount spend on acquiring the good, Vt, is invariant to the units of measurement, we
have :
(1.6) , and /e e e e
t t t t t t t tV PQ P Q Q V P .
In the hedonic model, e
tQ is viewed as a bundle of characteristics (faster processor,
more memory, etc.), and an increase in e
tQ is seen as an increase in one or more of the
characteristics. The overall amount of the increase is determined by computing the
hedonic price of each characteristic using regression techniques, and using the results to
determine the implied e
tQ . This procedure makes e
tQ depend on the customers’
valuation of the innovation.
The implication for growth accounting is that the growth in output in effectiveness
units—that is, inclusive of product innovation—has two components: a pure production
quantity component and a quality component based on prices,
(1.7) e e
t t t t
e e
t t t t
Q Q p p
Q Q p p
.

12
There is a reasonable argument for both concepts of output as the appropriate argument
of the production function (1.1). This argument disappears in favor of e
tQ when
product-oriented R&D is made an explicit input in the production function as is implicit
in the previous section (after all, why would such funds be expended?).
Following Hulten (2010, 2012), the TFP residual then becomes
(1.8)
e e
t t t t
e e
t t t t
A A p p
A A p p
This algebra of product quality may be straightforward, but like the issues that arise
when analyzing intangibles as investments in innovation, the conceptual framework
requires a shift from a purely supply-side view of growth accounting to one in which
output is both produced and sold, and involves elements from the demand side. We will
discuss this issue in more detail in the measurement section.
1.3. Real inputs and quality change
The preceding formulation implicitly implies that quality change affects final goods and
services, i.e., output. An adjustment to this model is needed when quality change
occurs in investment goods because capital is also an input to the production process.
Quality change and capital goods
The capital services term that appears as an input into the production function must be
adjusted for the quality change embodied in the successive engages of investment that
comprise its underlying net stocks. Solow’s 1960 model of capital-bodied technical
change is one way to proceed. In this model, investment goods are measured in both
effectiveness and transaction units that are linked by an efficiency index: Ht = ΦtIt. As
with the consumption goods model, the efficiency index is equal to the price ratio
PIt/P
Ht. The capital stock in any year is built up using a perpetual inventory equation for
both the efficiency and transaction unit denominated stocks.
Hulten (1992) shows that the resulting efficiency stock (Solow’s “jelly” stock J t) is
proportional to the transaction-based stock, Kt: Jt = ΨtKt, that the factor of

13
proportionality, Ψt, is the weighted sum of the past efficiency indexes Φt, and that the
capital-embodied growth accounts expressed in terms of the non-quality corrected
output units have the form (in the case of equation 1.2):
(1.9) K L K I
t t t t tt t tt t t t t t
Q Q Q Qt t t t tt t t tt t t t t
Q P P P PK L K IK L A = + + .P P P PQ Q Q Q QK L A
As before, the correction for quality change involves additional terms in the growth
account. From a practical standpoint, the efficiency terms can be estimated using a
hedonic price model and the corresponding price equations are: Φt = PIt /P
Ht and Ψt =
PK
t /PJt . (Note that for simplicity’s sake, we show Q, not Q
e in this equation.)
Improvements in efficiency proceed at a constant rate in the “maximal”consumption
golden rule steady state, and capital income and investment shares are equal. The terms
in (1.9) that correct for quality change cancel out in this special case, including the
terms in intangible capital, not shown in (1.9) but which parallel those for tangible
capital. The shares for intangible capital are shown in Figure 2, which illustrates that
while these shares run close to one another, the term generally is a source of change.
.05
.10
.15
.20
1977 1980 1983 1986 1989 1992 1995 1998 2001 2004 2007 2010
Figure 2. Intangible Investment and Capital Income (ratio to business output adjusted to include new intangibles)
Investment Rate Income Share

14
The composition of labor input
The single labor term in the production function (1.1), Lt, assumes that labor is a
homogenous input. If there are N categories of workers, this single variable must be
must be replaced with the hours worked in each of the different categories (Hj,t). In this
case, the production function is assumed to have the form
(1.10) Qt = AtF(L(H1,t,…, HN,t),Kt)
where L(H1,t,…, HN,t) is an index of the different types of labor. If each type is paid the
value of its marginal product, the growth rate of the labor index is equal to the growth
rate of the hours worked by each type of labor, weighted by its share in the total wage
bill:
(1.11) .N
j,tj,t j,tt
t j j,t j,tj,tj=1
w H HL = wL H H
Following Jorgenson and Griliches (1967), the left-hand side of this equation can be
decomposed into two components, one representing total hours worked by all types of
worker, Ht = ∑i Hi,t, and another the share-weighted change in the relative composition
of hours worked:
(1.12) .N
i,ti,t i,tt t t
t t i i,t i,t ti,ti=1
w H HL H H wL H H H H
The first term on the right-hand side represents the change in total labor input during to
an increased in hours worked in all categories, while the second term measures the
increase in effective labor input as the composition of total hours shifts to higher
productivity (wage) categories. For this reason, the composition term is sometimes
associated with changes in labor “quality.” The Jorgenson-Griliches labor
decomposition (1.12) can be inserted into the growth accounting equation (1.4) to yield
yet another “effectiveness” correction.
The labor composition adjustment does not involve innovation per se. However,
practical applications of the model involve the education and worker occupation

15
dimensions. One important
finding in the literature is that
increases in an educational
attainment in the U. S. been a
significant contributor to the
growth in output per worker
over the last three decades.
Thus, while not innovation per
se, labor force composition is
generally thought to be an
important channel through
which innovation occurs. As
may be seen in the accompanying chart, when the growth in U.S. labor input is broken
down into just three skill-based categories, the contribution of the high-skilled labor
dominates the picture of the past 15 years.3
1.4. Prices, Costs and Process Change
Equation (1.8) is in effect a decomposition of productivity change into process and
product innovation, and of course productivity change is as much about process
innovation as it is about product innovation. The IT revolution, for example, has been
as much about general business process innovation through Internet engagement as it
has been about new electronic gizmos and digital information for consumers.
Moreover, competition has been particularly ruthless in ICT goods and digital
information markets themselves, and improvements in these production processes,
which are global, have lowered prices and costs and been an important source of change
in prices and consumer welfare. This highlights the importance of modeling an open
economy, an issue on which we have thus far been silent, and also how thinking about
innovation accounting in terms prices and variable production costs (rather than factor
quantities as we have been doing thus far) can be helpful.
3 Source for chart is authors own elaboration of the WIOD internationally-comparable data.
-4%
-2%
0%
2%
4%
1996 1998 2000 2002 2004 2006 2008
Figure 3. Labor Services Growth Rates
and Contributions, 1996 to 2009
Low-skilled Medium-skilled High-skilled

16
When industries in an economy viewed as integrated producers satisfying final demand,
the t tA A term in equation (1.8) is seen broadly as improvements in an economy’s
production and delivery systems that lower unit costs—from moving B2B to the
Internet, to adopting whole new systems for supply-chain and inventory management.
In a closed economy, the economy’s costs of production are its payments to domestic
factors of production (labor and tangible capital, L KP L P K ). In an open economy
payments for foreign-produced inputs ( )fM fP M also are included. The degree to which
domestic vs. foreign inputs are used in an economy is determined by the country’s
comparative relative prices.
Changes in variable costs of factors engaged in production can be represented in the
usual way. For a closed economy the cost element is a weighted average of the change
in domestic factor prices, denoted by D D
t tC C . In an open economy, the term is
(1.13) (1 )
f
f f
f
D MM Mt t tt tD M
t t t
C C Ps s
C C P
where fM
is is the economy’s share of imported intermediate inputs in total production
costs. Because total costs exceed domestic costs by the value of foreign-produced
inputs, the framework involves a slight change from the usual thinking, but it keeps all
forms of outsourcing (domestic or foreign) on the cost side as substitution effects. Then
via the price dual we have
(1.14) / /t t t t t tP P C C A A
which states that changes in transaction prices reflect cost change that has not been
offset by process innovation. (Cost change includes a producer markup, which from
section 1.1 covers the capitalized costs of investments in innovation.)
Given that wage rates equalize across industries in a competitive labor market (and of
course labor costs loom large in total costs), equations (1.13) and (1.14) illustrate how
the pressure on individual industries to improve business processes and lower costs is
relentless. Consider that hourly labor compensation in the U.S. business sector

17
increased 3.5 percent from 2000 to 2010, 4 percent in the first half of the decade and 3
percent in the second. In this light, the fact that average PC prices fell 4.9 percent
(annual rate) from 2000 to 20054 seems remarkable, as does the fact that the average
price of a cell phone fell 5.9 percent,5 and that the average consumer expenditure on a
new car rose just 1.1 percent per year during the same period (to be perfectly clear,
these are not quality-adjusted prices). In modern competitive economies, businesses in
services markets face equally intense pressures to differentiate offerings and improve
and invent new business models to offset increases in wages and other costs.
2. Implementation and Measurement
The theoretical problems of establishing an innovation accounting even in the limited
sense of this paper present many difficulties, but the issues of implementation present
equally great, or perhaps even greater, difficulties. A major problem arises from the
fact that much innovation occurs within the confines of the firm and the processes
giving rise to the innovation are hard to observe. Indeed, firms usually have a strong
interest in preventing them from being observed in order to protect intellectual property.
In some cases, these processes may be imperfectly seen or understood by the managers
of the firm (the financial crisis and the role of new financial instruments).
There are also many practical difficulties in measuring the changes in product quality
when a new variety of a good enters the market place, and even more so when a wholly
new good arrives. In this section we also examine the implications for innovation
accounting of some of the measurement issues that arise in these areas. We start first
with intangibles and then turn to the issue of quality measurement.
2.1. Extending the asset boundary
When questioned about the relevance of the existing asset boundary for intangibles in
national accounts more than six years ago, U.S. BEA Director Steve Landefeld
answered, “No one disagrees with [the capitalization of intangibles such as R&D]
4 Moulton and Wasshausen (2006) based on data from the Census Bureau’s (now discontinued) Current
Industrial Report. 5 As reported by the Telecommunications Industry Association.

18
conceptually. The problem is in the empirical measurement.”6 Since then researchers
and practitioners at national statistical offices and international organizations have done
much to remedy “the problem in empirical measurement”.7
The discussion and equation (3) above suggests that to estimate intangible capital and
analyze its role in economic growth as per equations (4) and (5), we need:
A list of intangible assets to be measured.
Magnitudes for the nominal investment flows N
t tP N for each asset type.
A means to separate these flows into price N
tP and quantity tN components.
Service lives of each asset to enable the compilation of net stocks tR .
A means to estimate R
tP .
We briefly review the state of measurement in these areas. Many more details are
found in Corrado et al. (2012).
Asset types anchor the framework
In broad terms, as of a March 2012 OECD expert meeting on the measurement of
intangibles, the list of intangible asset types proposed by Corrado, Hulten, and Sichel
(2005) remained the main framework for measurement (Table 1). By contrast, methods
used to estimate the nominal investment flows and develop and understanding of the
underlying innovation processes represented by intangible assets are evolving and
advancing. A major reason for the forward progress on measurement is intense interest
by The Conference Board, the European Commission, and the OECD (among others) to
better understand the macroeconomic impact and underlying nature of the innovation
investments needed for knowledge-based economies to continue to grow and compete
effectively in today’s global markets.
6 Reported on page 66 of “Unmasking the Economy,” Business Week (February 13, 2006, p. 62-70) by
Michael Mandel. 7 This section draws liberally from an elaboration and “harmonization” of what was learned from work
under two projects funded by the European Commission (COINVEST and INNODRIVE, which
concluded late 2010/early 2011, respectively) and the ongoing work on intangibles at The Conference
Board. See Corrado, Haskel, Jona-Lasinio, and Iommi (2012) at http://www.intan-invest.net/ for further
details.

19
We will not discuss table 1 here in detail except to mention that assets fall in three
broad categories: computerized information, innovative property, and economic
competencies, and that these categories are populated with nine asset types. The list is
surprisingly similar to that in the IRS guide for reporting the value of financial assets
following a corporate merger or acquisition.8 Tax practice has most assuredly
developed independent of the intangible capital literature (and vice versa). It is
8 The U.S. tax code specifies 12 intangible assets to be valued and listed as financial assets following a
merger or acquisitions, including the value of the business information base, the workforce in place,
know-how (listed along with patents and designs), and customer and supplier bases. (See U.S. IRS
Publication 535, Business Expenses, pp. 28-31).
Table 1. Knowledge-based capital of the firm (aka Intangibles) by Asset Type
Asset type
Included in National
Accounts? Computerized information
1. Software Yes
2. Databases ?1
Innovative property
3. Mineral exploration Yes
4. R&D (scientific) Satellite for some2
5. Entertainment and artistic originals EU-yes, US-no3
6. New product/systems in financial services No
7. Design and other new product/systems No
Economic competencies
8. Brand equity
a. Advertising No
b. Marketing and market research No
9. Firm-specific resources
a. Employer-provided training No
b. Organizational structure No
1. SNA 1993 recommended capitalizing computerized databases. The position of most national statistical offices is that databases are captured in current software estimates. 2. R&D satellite accounts are available, or under preparation many countries. Results for Finland, Netherlands, United Kingdom, and the United States are publically available. 3. The US BEA plans to include entertainment and artistic originals and R&D as investment in headline GDP in a revision in 2013. Source for table: Corrado et al. 2012, p. 13.

20
therefore notable that both embrace modern business realities and value assets whose
ownership is not typically protected by legal covenants.
Alternative approaches have common conceptual basis
There are at least two basic models for how to proceed to estimate nominal intangible
investment flows for each of the asset types in table 1, which we have already said a
few times in this paper are “data from deep within firms.” The first is to use a survey
instrument, such as the R&D surveys that are run in most industrialized countries.
Businesses are accustomed to this survey, and its long and successful history suggests
that a survey approach to measuring innovation costs for business functions that are
separate, identifiable departments with a company is a reasonable way to go. Note also
that these surveys distinguish between own company costs and purchased R&D
services, as well as license payments to and from other companies.
The second approach is to follow the “software” model, i.e., use data on purchases from
a regular industry survey (combined with information on exports and imports) and
estimate production on own-account using information on employment and wages in
relevant occupations. Both approaches thus boil down to the same idea, namely, that
one needs to obtain measures for both in-house and purchased components of intangible
investment. A general expression for estimating nominal intangible investment flows
was set out in Corrado et al. (2012) as:
(2.1)
In this equation, is first expressed as an aggregate of assets using terms set out
for the model of section 1.1 above (but here we of course include the intermediate
inputs used in the production of the intangible). A closed economy is assumed.
, , ,1
, , , ,1
, , , , , , , ,1 1
, ,
( )
( )
( ( ) )
(
JN L K M
t j j t j t j tj
J shadow L K M own account N purchased
j j t j t j t j j tj
J S shadow L K M own account N purchased
s j s j t s j t j t j s j tj s
shadow
s j s j
P N P L P K P M
P L P K P M P N
P L P K P M P N
OwnCost
, , , , ,1 1)
J S Indicator Indicator
s j t s j s j tj sPurchased
NP N J

21
The parameter is a measure of the degree of market power, the “innovator”
markup over competitive factor costs of inputs used up in the innovation process, also
introduced in section 1.1. This parameter varies of course across industries as it
depends on customers’ price elasticity of demand for an industry’s products.
The first line of equation (2.1) holds whether an economy’s intangibles are self-
produced or marketed purchases. What changes when investment moves from the
former to the latter is the origin of the innovator markup, namely, whether it is an
imputed “shadow” value or a factor embedded in transactions data (i.e., embedded in
). To underscore this equivalence, the second line of equation (2.1) expresses
intangible investment in terms of both sources of supply. The superscript “own-
account” denotes intangibles produced and consumed within the same firm.9
The third line is a more general expression where aggregation now is over a subset of
private domestic sectors (S). This line is conceptually equivalent to the first two lines in
the absence of public investments and international trade in intangibles and underscores
that, to date, most work on measuring intangibles has concentrated on private, not
public, investments.10
As to the internationalization of intangibles, very little is known
with the exception of R&D. As a practical matter, net international trade in R&D
remains relatively small for the United States but is consequential for other countries,
such as Finland. In general, trade in services, especially business and professional
services, is expanding rapidly (e.g., Jensen 2011), and the internationalization of
intangibles is an important topic for future work. Here we simply note that, in reality,
when intangibles are capitalized, the adjustments to production and gross domestic
capital formation need not be identical as implied by the discussion in section 1.1.
The variables and in the fourth line are time series
indicators of the actual in-house intangible production or purchased intangible assets in
each sector. The parameters and are sector- and asset-specific capitalization
9 Note that the own-account and purchased concepts in equation (2.1) are firm-based and do not
necessarily correspond to similarly-named terms in establishment-based national accounting. 10
An example of an exception is the van Ark and Jaeger (2010) study of public intangibles in the
Netherlands.
1
NP
, ,
Indicator
s j tOwnCost , ,
Indicator
s j tPurchased
,s j ,s j

22
factors that adjust the own cost and purchased indicators to benchmarks for each asset
and sector. As previously mentioned sector cost indicators could be derived from
employment surveys (or firm-level micro data as in Piekkola et al. 2011), and sector
purchased indicators could be obtained from input-output relationships, from which
historical time series can be derived.
Some advances in measurement of nominal flows
In terms of the measurement of intangible investment via equation (2.1), three recent
developments are especially noteworthy. First is the pioneering work on Japan (Fukao
et al. 2009) that disaggregated intangible investment according to manufacturing and
nonmanufacturing. Since then Japanese and researchers in other countries (Australia
and the U.K.) have experimented with industry-level estimates of intangibles, as such
disaggregation can be important for policy analysis.11
The box on next page highlights
some of the hurdles that need to be crossed to develop accurate data on intangibles by
industry for the United States.
Second is the emerging survey work on investment in intangible assets in the United
Kingdom (Awano, Franklin, Haskel, and Kastrinaki 2010). The UK survey goes
beyond R&D and asks companies for information on own-account expenses and
purchases of intangibles for five major categories of intangibles (software, R&D, new
product development expenses not reported as R&D, information on investments in
worker training, and likewise for organizational development). The approach relies on
firms being able to report spending in certain categories that lasts more than one year
and contrasts with the approach in innovation surveys (the “community innovation
surveys” popular in Europe and elsewhere) that require firms to know what innovation
is, which in turn requires defining innovation and assuming firms interpret the questions
and instructions in a consistent manner. We understand that Japanese and U.S. research
teams are adapting the U.K survey in hopes of gathering more information on intangible
investment in their countries (or sub-sectors of their countries).
11
e.g., Barnes (2010) and Dal Borgo, Goodridge, Haskel, and Pesole (2011).
23
Third is the research that has used detailed information of occupations and/or microdata
to study the link between intangibles and performance at the firm or industry level.
This research has yielded insights on the value of the parameters that appear in equation
(2.1), and it has identified new or improved sources for indicators used for components.
For example, an improved indicatorOwnCost for investments in new financial products
Industry analysis of intangibles a tough haul for the United States
Analysis of innovative activity with establishment-based industry data presents certain difficulties in the United States. With the implementation of the NAICS industry classification system beginning nearly 15 years ago in the United States, some of the country’s most innovative firms (Apple, Cisco, Nvidia and other so-called factory-less makers, including certain pharmaceutical companies) were regarded as resellers of imported goods (imagine!) and placed in the wholesale trade sector.* The headquarter operations of many companies (which may include marketing and IT departments) were placed in a separate sector (Management of Companies), and company-owned but separately-located R&D labs were lumped with independent producers of R&D services in the R&S services industry. Because BLS did not necessarily implement NAICS in the same way as did Census, industry-level productivity analysis, particularly for IT industries, has been hampered by the switch to NAICS ([CNSTAT report]).
The difficulty that arises in the analysis of intangibles is that the fruits of innovative activities (profits) cannot be easily linked to the costs of innovation in industry data with head offices and R&D labs sometimes (but not always) split off. This complicates what is already a difficult problem, which is the usual disconnect between company and establishment-based industry data systems. In the United States, the Statistics of Income provide data on advertising by industry, but this is on a company basis.
BEA worked to surmount the R&D lab location issue in developing its R&D satellite account, and the periodic Economic Census started to collect information on industries served for the Management of Companies sector in 2007 (no such data were available since 1997), suggesting that some of these hurdles are not insurmountable going forward. We speculate that such issues are less of a problem in countries where IT and Pharma production outsourcing has been less abrupt and/or prevalent and classification systems did not split head offices and R&D labs from operations until very recently.
* Obviously we do not have direct knowledge of how Census classifies any given firm, but they confirm that factory-less producers are placed in wholesale trade. For the R&D survey, which is conducted by the Census Bureau for the National Science Foundation (NSF), the NSF instructs Ce nsus to classify firms by the primary line of sales for the company as a whole (i.e., on a global basis) . In BLS surveys, firms more or less self-classify.
24
was developed, first, in the COINVEST project, and then by Corrado and Hao
(forthcoming) using a grouping of occupational codes identified for the analysis of
financial innovation; for further details and comparative results using this new indicator
for 27 European countries plus Norway and the US, see Corrado et al. (2012). The
move notably lowered estimates of investment in new financial products but did not
otherwise change the comparative analysis of saving and economic growth with
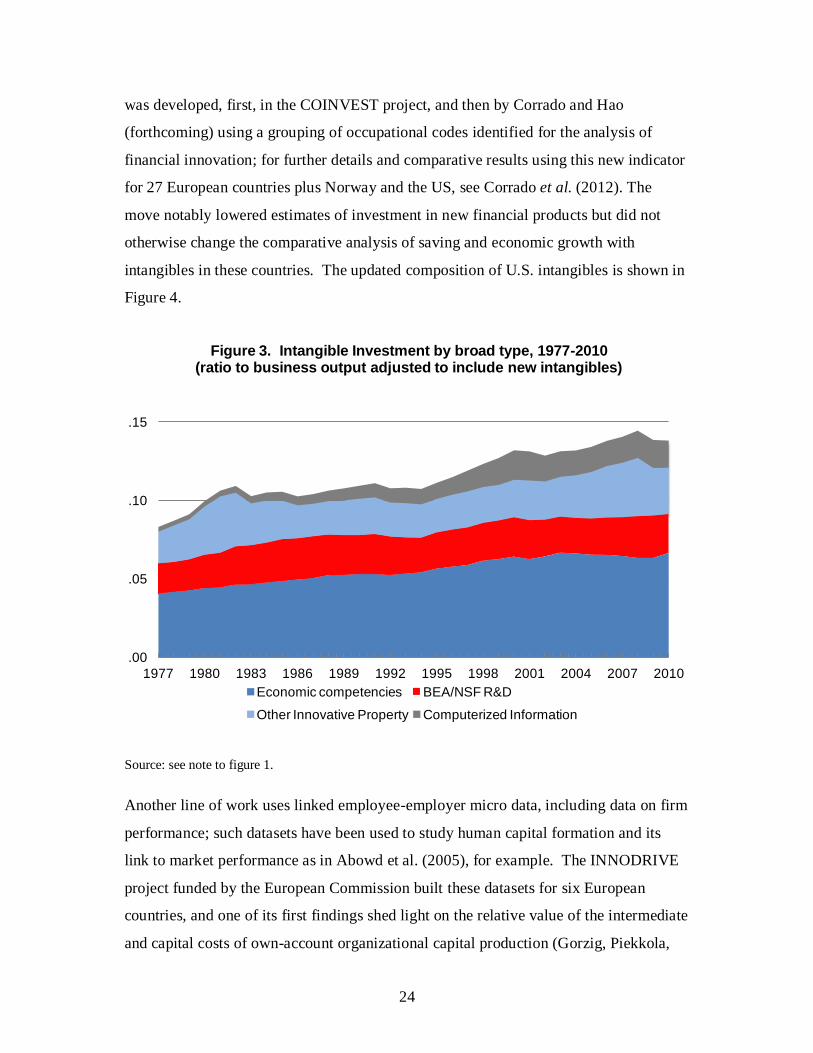
intangibles in these countries. The updated composition of U.S. intangibles is shown in
Figure 4.
Source: see note to figure 1.
Another line of work uses linked employee-employer micro data, including data on firm
performance; such datasets have been used to study human capital formation and its
link to market performance as in Abowd et al. (2005), for example. The INNODRIVE
project funded by the European Commission built these datasets for six European
countries, and one of its first findings shed light on the relative value of the intermediate
and capital costs of own-account organizational capital production (Gorzig, Piekkola,
.00
.05
.10
.15
1977 1980 1983 1986 1989 1992 1995 1998 2001 2004 2007 2010
Figure 3. Intangible Investment by broad type, 1977-2010 (ratio to business output adjusted to include new intangibles)
Economic competencies BEA/NSF R&D
Other Innovative Property Computerized Information

25
and Riley 2010), the M
j jP M and K
j jP K of equation (2.1). Their findings suggest these
costs are consequentially different from zero, the implicit assumption in CHS.
Piekkola (2012) then pointed out that, when allowing for imperfect competition and
markups, such datasets can be used to estimate both the marginal product and output
elasticity of an asset type. He used the Finnish dataset in an exercise that, among other
purposes, evaluated the 20 percent assumption embedded in the CHS estimates of own-
account organizational capital.12
On balance, Piekkola found that 21 percent of the
wage costs of those doing managing, marketing, and administrative work with a tertiary
education can be considered as investment in organizational capital. Organizational
capital is the core component of the CHS broad category, economic competencies, and
it is rather remarkable (and we don’t say this lightly) that a rigorous study confirms the
basic approach to its estimation.
Net stocks for intangibles have a sound conceptual basis and facts are slowly
accumulating
Given the unexpected nature of returns to certain investments in intangibles, it is natural
to question the plausibility of the perpetual inventory model (PIM) to calculate net stock
estimates for intangible capital (R). The task is complicated by several practical
theoretical factors, the most important of which is that intangibles are partially non-rival
and returns to investments in intangibles are not fully appropriable. Patent protection
and business secrecy give the innovator a degree of protection, but the value of the
investment to the innovator is limited to the returns on the investment that can be
captured, which in turn provides the conceptual basis for measuring depreciation and
calculating net stocks. The basis is set out in Pakes and Shankerman (1984).
A sound conceptual basis is a good starting point, but technical and data issues confront
the estimation of net stocks of intangibles using PIM nonetheless. Of these, the most
important is to recognize that a model of economic depreciation must capture two
distinct processes, discards and economic decay. This topic was discussed extensively
12
This refers to the assumption that managers devote roughly 20 percent of their time to strategic
functions, and therefore that 20 percent of managerial compensation can be used as an estimate of
organizational capital investments on own-account.

26
in Corrado et al. (2012) and, to borrow two examples, it boils down to the following: A
design might exhibit no “economic decay” (that is never “wear out” in a quantity sense)
but might be “discarded” as, for example, fashions change. The geometric depreciation
rate in the PIM must capture the net effect of both these terms.13
Similarly, worker
training may earn long-lasting returns to the firm making the investment, conditional of
course on the probability that the worker stays with the firm (the “survival” factor
again). The BLS reports that the average tenure of employees in the United States is
between 4 and 5 years and this forms the basis for setting a “service life” for employer-
provided training.
Table 2. Depreciation rates for Intangible Assets
Asset type
Depreciation Rate
Computerized information
1. Software .315
2. Databases .315
Innovative property
3. Mineral exploration .075
4. R&D (scientific) .150
5. Entertainment and artistic originals .200
6. New product/systems in financial services .200
7. Design and other new product/systems .200
Economic competencies
8. Brand equity
a. Advertising .550
b. Market research .550
9. Firm-specific resources
a. Employer-provided training .400
b. Organizational structure .400
Source for table: Corrado et al. (2012, p. 25)
Direct estimates of life lengths from surveys are a relatively new source of evidence.
Surveys conducted by the Israeli Statistical Bureau (Peleg 2008a, 2008b) and by
13
The geometric depreciation rate is given by d T where T is an estimate of the service life of an
asset and, intuitively, d is a parameter that reflects the degree of convexity (or curvature) of the age-
price profile. Higher values of d are associated with higher discards/lower survival rates.

27
Awano et al. (2010) with the UK Office of National Statistics. These surveys ask about
the “life length” of investments in R&D (by detailed industry in Israel) and intangible
assets (R&D plus 5 other asset types in the UK). The bottom line is that the Israeli
survey supports lengthening the service life for R&D (as does a good bit of the R&D
literature), while the UK survey confirms that the very fast depreciation rates CHS
assumed for economic competencies are about right. As a result, in terms of
depreciation rates, the main change that has thus far been made to the original CHS
rates is to use a depreciation rate of .15 for R&D (see table 2), which is the central
estimate of the depreciation rate for R&D adopted by BEA.
Prices for intangible investments and assets
Intangible investment in real terms—obtaining each Nj —is a particular challenge
because units of knowledge cannot be readily defined. Although price deflators for
certain intangibles (software, mineral exploration) are found in the national account,
generally speaking, output price measures for intangibles have escaped the price
collectors’ statistical net.
An exception is the emerging work on price measures for R&D. The U.S. BEA offered
an R&D-specific output price in its preliminary R&D satellite account (Moylan and
Robbins 2007; Copeland, Medeiros, and Robbins 2007; and Copeland and Fixler 2009).
A contrasting approach is in the recent paper by Corrado, Goodridge and Haskel (2011),
which casts the calculation of a price deflator for R&D in terms of estimating its
contribution to productivity. The solution hinges importantly on the decomposition of
productivity change, which depends on parameters such as the producer and innovator
markups discussed in section 1.1, the degree to which quality change is captured in
existing GDP (section 1.2), and the extent to which the current growth path deviates
from the “maximal” consumption path (illustrated in figure 2).
Applying their method to the United Kingdom yielded a price deflator for R&D that fell
at an average rate of 7-1/2 percent per year from 1995 to 2005—and thus implied that
real UK R&D rose 12 percent annually over the same period. This stands in sharp
contrast to both the science policy practice of using the GDP deflator to calculate real

28
R&D (the UK GDP deflator rises 3-3/4 percent per year in the comparable period) and
the results of applying the BEA method to the UK data (the UK BEA-style deflator
rises 2.1 percent on the same basis).
The link between the price of an investment good in any year, in this case our N
tP , to
the price of its corresponding capital services (user cost), in this case our R
tP , is a
forward-looking discounted expected value:
(2.2) ( )
R
N t
t
=1
(1 ) E PP =
(1+ r)
which brings to light several valuation issues relevant to intangible assets. One is that
expectations are not so easily reduced to an annual intertemporal valuation (and
revaluation) of an asset’s marginal product; in reality, the evaluation/revaluation often
takes place within a strategic planning cycle. And in some circumstances, investments
are made without specific expectations of a given use.
Intangible investments as firm strategic investments suggests that they derive value
from the options they may open or create (or do not rule out) down the road. It is
therefore unsurprising that a literature and practice of “real” options and risk-adjusted
R&D project evaluation has emerged. This literature, associated with Lenos Trigeorgis,
among others, e.g. Trigeorgis (1996), will not be reviewed or evaluated here in detail,
except to say that in the practice of capital budgeting by firms, only special
circumstances give rise to the situation in which the value of R&D is equal to
conventionally calculated net present value (NPV) based on expected cash flows.
NPV as conventionally calculated ignores the strategic value (that is, the option values)
of the flexibility of R&D assets to respond to changes in the marketplace or technology
outlook – and this implies returns to ordinary capital cannot be compared with returns to
R&D unless the option values of R&D are factored in.14
We cannot be sure of the size
14
A common approach that integrates real options and NPV for project evaluation was quantified by
Trigeorgis as: NPV of real asset investment = NPV of estimated cash flows + OptionValues. The usual

29
of the unobserved option values, of course, but it is not uncommon in case studies of
“medium” risk projects for real asset values to double after taking account of option
values (Boer 2002). These findings and line of work are an important topic for future
work on intangible investment prices (and thinking about the in (2.2) and the PIM).
The managerial flexibility offered by intangible capital also implies that current market
developments are unlikely to impact the present value calculation of all vintages
equally. In vintage capital models, e.g., Hall’s 1968 analysis of quality change in pick-
up trucks, this possibility and the identification problem it presents that, in turn,
prevents complete analysis is acknowledged. Not only must the same (and then some)
be said of intangible capital, but also the possibility that the same shocks may not affect
capital and wealth equally. The latter depends on the degree of financial
intermediation, the transparency of the intermediation process, and agents’ perceptions
of firm balance sheets. The valuation of wealth, tW , and of capital, I N
t t t tP K P R ,
occurs in different sectors with different agents, and a disconnect can arise when such
valuations diverge (and/or when measurements diverge from reality). When this
happens, we have
(2.3) I N
t t t t t tP K P R qW
where tq is Tobin’s average q ratio. This possibility (and the underlying reasons for it,
measurement or reality) is important for the study of innovation and its impact because
the rush of new products and processes in the financial sector has been implicated in the
recent financial crisis, and the q ratio did indeed fluctuate (Corrado and Hulten 2010).
2.2 Implications of extending the asset boundary
Table 1 showed that current national accounting systems in the United States and
European Union capitalize just some of the knowledge-based assets of firms. A more
complete list is needed to represent how modern business allocates revenue between
current expenditures and investments in future capacity.
neoclassicial growth accounting of R&D does not necessarily factor in OptionValues, and they therefore
appear in conventionally calculated ex post rates of return.

30
Table 3 shows results of capitalizing all of the investments listed in table 1 on the
sources of growth in output per hour in U.S. private industries. The results were
generated using estimates of intangible investment from BEA (R&D and entertainment
Table 3. Sources of Growth in Output per Hour including Intangible Assets,
Private Industries
1979-
2011
(1)
1979-
1990
(2)
1990-
2000
(3)
2000-
2007
(4)
2007-
2011
(5)
1. Output per hour 2.2 2.0 2.6 2.3 1.8
Contribution of:1
2. Capital deepening 1.3 1.1 1.4 1.5 1.4
3. Tangible2 .7 .6 .7 .6 .7
a. ICT equipment .3 .3 .5 .3 .2
b. Other capital .3 .2 .2 .3 .4
4. Intangible .7 .5 .7 .8 .8
a. Computerized information3 .2 .2 .2 .2 .2
b. Innovative property4 .2 .1 .2 .2 .3
c. Economic competencies5 .3 .2 .2 .4 .2
5. Labor composition .3 .3 .3 .2 .3
6. MFP .6 .6 .9 .6 .2
Memo: 7. Percent of line 1 explained by intangible capital deepening5 25.9 23.3 23.6 30.1 32.5 Note—Excludes private education, health, and real estate. Annual percent change for periods shown calculated from log differences. Components are independently rounded. Source—Authors own elaboration of output, hours, and fixed asset data from BEA; the labor composition index is from BLS. Estimates of intangibles not currently capitalized in the U.S. national accounts (see table 1) are based on data from BEA (R&D and entertainment and artistic originals) and our own prior work (all others). 1. Percentage points. 2. Excludes land and inventories. 3. Mainly software (see note 1, table 1). 4. Mineral exploration, R&D (scientific and nonscientific), entertainment and artistic originals, and design. 5. Marketing, branding, and other firm-specific strategic resources. 6. Calculated using period averages of lines 1 and 4.

31
and artistic originals) and our own prior work (Corrado, Hulten, and Sichel 2005, 2009;
Corrado and Hulten 2010). Table 4 shows comparably calculated results using the
current asset boundary. Periods shown correspond to periods between business cycle
peaks, except the last, which extends from the most recent peak to the most recent full
year of data (2011).
As in our prior work, one of the main results of extending the asset boundary to include
investments in innovation is that capital deepening becomes the dominant factor
explaining the growth of labor productivity, or output per hour (OPH). Not only is this
dominance rather substantial, but intangible capital deepening alone explains about 1/4
of the growth in OPH since 1979 and nearly 1/3 since 2000 (see memo item on table 3).
The growth of multifactor productivity decelerated from its average pace of .6 percent
per year to just .2 percent per year in the most recent period, a deceleration also seen in
the published data (table 4). The recent productivity results do not necessarily signal a
new underlying trend, although the results based on published data have been
Table 4. Sources of Growth in Output per Hour based on Published Data,
Private Industries
1979-
2011
(1)
1979-
1990
(2)
1990-
2000
(3)
2000-
2007
(4)
2007-
2011
(5)
1. Output per hour 2.2 1.9 2.5 2.3 1.8
Contribution of:1
2. Capital deepening .9 .8 1.0 .9 1.1
3. ICT .6 .5 .8 .5 .4
4. Non-ICT2 .3 .3 .3 .4 .7
5. Labor composition .3 .3 .4 .2 .4
6. MFP .9 .8 1.1 1.2 .4
Memos:
7. Output
8. Hours
2.8
.9
3.1
1.2
4.1
1.6
2.3
.0
-.1
-2.0
Note and sources—See table 3.

32
interpreted with much pessimism (e.g., Gordon 2012) despite the incomplete nature of
the economic recovery to date (see memo items on table 4). Absent from these
discussions, of course, are the trends shown in figure 1 (intangible investment did not
slow as sharply as did tangible investment in recent years) and figure 3 (spending on
industrial R&D remained relatively strong)—two reasons for a certain degree of
optimism about prospects for productivity in the medium-term.
2.3 Measuring quality change and accounting for business dynamics
Each term in (1.8) helps frame dimensions along which businesses innovate and
compete, and thus subsumes many phenomena addressed in the industrial economics,
consumer demand, and micro-productivity literatures. In what follows we make a
modest attempt to link innovation accounting via equation (1.8) to some of these
phenomena, and to do this we need to shift our focus to the industry level and discuss
the creation of consumer welfare and introduce certain aspects of price measurement.
Product innovation at the industry level
The output of each industry or sector in the economy is modeled as consisting of two
groups of products in a given period. The first group consists of the same products the
industry or sector produced in the previous period, and the second group consists of
products that are new to the market. The latter encompasses a wide range of
innovations of course, from the introduction of simple new varieties, to substantially
new designs, to “truly new” goods. Such distinctions will be consequential to our
analysis later, but for now we assume the new-to-the-market grouping of products is
homogeneous at the industry or sector level. We also assume no exiting products.
Let i be the i-th industry’s share of total revenue ( )iV originating from new-to-the-
market products in a period (time subscripts are ignored). Then effective price change
for an industry over the period can be expressed as a weighted average of price change
for its new products ( )new new
i iP P and price change for its continuing products which is
the simple change in unit value or transactions price ( ) :i iP P

33
(2.4) ( ) (1 )e new
new newi i ii ie new
i i i
P P Ps s
P P P .
new
is is the Divisia weight for new-to-the-market product price change, which equals
.5* i from the above. This equation yields an operational expression for the quality
component term on the right hand side of equation (1.8) of the previous section,
namely,
(2.5) e new
newi i i iie new
i i i i
P P P Ps
P P P P
This equation states that the quality component term for an industry is differential price
change between continuing and new products, weighted by (1/2) the revenue share of
new products.
If equations (2.4) and (2.5) refer to monthly price change, new
is for many new-to-the-
market products and services will in all likelihood be quite small.15
Because industries
that routinely innovate through introducing new products will have higher fractions of
total revenue originating from new products over longer periods of time, a business
cycle, five years, or even a decade, would appear to be a more informative period for
innovation accounting.
Using data on PC prices from 2000 to 2005 and assuming 1new
is , Moulton and
Wasshausen (2006) estimated the computer industry’s ongoing quality component term
using a procedure equivalent to equation (2.5). Their result—11.5 percent per year—
was not the full drop in quality-adjusted PC prices (16.4 percent) because unit prices for
PCs were found to have fallen nearly 5 percent per year. And because computer final
sales are but 0.8 percent of GDP in the United States, the contribution of quality change
15
For example, despite the immense success of Apple’s iPhone (it now accounts for nearly 60 percent of
the company’s revenue), in the quarter it was introduced (2007Q3), Apple’s revenues from sales of the
iPhone and related products and accessories was just 2-1/2 percent of its total sales.

34
for computers was calculated to be less than 0.1 percentage point of average annual real
GDP growth during the period they studied.
Product differentiation
Product differentiation is as much about the introduction of new varieties, product
replacement cycles, and the like as it is about the introduction of truly new goods and
services. Although both ends of the “newness” continuum can be associated with the
generation of gains in consumer welfare as per equation (2.5) it is sensible to make
some distinctions because the ends show up in statistics in different ways.
Statistical agencies have established generally accepted methods for dealing with the
model turnover/new variety phenomenon in many types of goods and services (for a
review, see Greenlees and McClelland 2008). High rates of item replacement and flat
price profiles for items priced are little-appreciated facts of life for price collectors in
dynamic economies. Non-comparability is in fact a pervasive issue even for
technologically stable goods such as packaged food (Greenlees and McClelland
2011).16
Some of this is of course the flip side to (or dual of) a large body of work that
has used Census microdata to study business entry and exit, productivity, and worker
dynamics (e.g., Dunne, Roberts, and Samuelson 1988; Davis, Haltiwanger, and Schuh
1996; and Foster, Haltiwanger, and Krizan 2001). Much quality change then (the
“garden variety” change) is therefore deeply embedded in our price statistics.
The term ( )new new
i iP P is not in the static choice set of the standard neoclassical growth
accounting model, but the micro-theoretic underpinnings of ( )new new
i iP P were set out by
Hicks in 1941 and can be used as a starting point. Because prices of new products in a
previous period are by definition nonexistent, an estimate of the “virtual” price—the
price that sets demand to zero in the previous period—must be used in the calculation of
16
Greenlees and McClelland (2011) use the characteristics data that have been collected along with CPI
price quotes since the early 2000s to analyze and evaluate how well BLS has fared in its monthly linking
of items that cannot be matched from one period to the next and find that, in the case of packaged food,
BLS likely has underestimated price change. Needless to say, this line of research is exceedingly
important and BLS seems to have the wherewithal to address it.

35
( )new new
i iP P . Various methods are available to generate such estimates, but to discuss
precise methods would be to digress.
Price change for new products, when measured accurately by whatever means, is equal
to the change in welfare due to the introduction of the new products (with, of course, a
reversal of sign). Equivalently, as shown by Hausman (1981), the welfare gain is the
change in expenditure that holds utility constant with the introduction of the new
product, otherwise known as the compensating variation (CV), or consumer surplus.
Hausman (1999) also showed that the CV from new goods can be approximated, in our
notation, as
(2.6) (.5* * ) /i i iCV V
where i is the own-price elasticity of demand for the i-th industry’s products. The
equation is a lower-bound linear approximation to the actual demand curve. Using it
only requires an estimate of the price elasticity of demand (PED) along with data on
revenue of new products for each industry (i.e., it does not require estimation of the
demand curve).
Equation (2.6) is useful for innovation accounting because it illustrates how new
products that gain significant demand ( )iV can lead to large measured gains in
productivity—and just how large depends on the own-price elasticity of demand (i ).
New goods that are very similar to existing ones (i.e., new varieties) will have high
own-PEDs, and thus their contribution to welfare change will be considerably smaller
than the contribution of products that have relatively low PEDs and experience high
demand.17
The former category may include a new model year car, whereas the latter
17
To fix this idea, assume innovation accounting is performed for a five-year period for an industry
whose change in unit costs is zero and whose product line completely turns over. In other words, after
five years, products being produced and sold are not the same as those at the end of the previous five
years, which implies 1i
. Now assume 10, 1000,i
V V and 2.5i
, where the latter is a
relatively high value for the price elasticity of demand (hereafter, PED)—a table of estimates for selected
products is is at http://en.wikipedia.org/wiki/Price_elasticity_of_demand . Equation (2.6) then states,
after taking into account the relative size of the example industry, that product innovation in the industry
contributes 0.2 percentage points per year to aggregate productivity change (recall we assumed the

36
category might include the first Statin drug, Lipitor, which was introduced in 1997 and
by 2003 became the best-selling pharmaceutical in history.18
The analysis of equation (2.6) also suggests that firms will exercise market power when
PEDS are low and demand is high, especially when the situation was created by a firm’s
own customer savvy, mastery of technology, and marketing. Nor should we be
surprised to see that firms that innovate on the variety margin must also compete on the
cost margin; high PEDs (and the availability of substitutes) are frequent in these
situations, and the demand for new “brands” often must be stimulated by lowering costs
or by advertising. This underscores that innovation accounting needs to acknowledge
the presence of imperfect competition (as per section 1.1)—and also that estimates of
intangible investment at the industry level are needed (as per “box” in section 2.1) so
that the dynamics of costs, prices, and intangible spending can be analyzed more fully.
The framework of equations (2.5) and (2.6), like equation (1.8) where we started, is still
about evaluating market transactions, whereas a full accounting for consumer welfare
change due to innovation would need to reckon with time use. Consider, for example,
the fact that the entire information sector (software, publishing, motion picture and
sound recording, broadcasting, telecom, and information and data processing services)
is about the same share of the economy as it was 25 years ago—about 4 percent on a
value added basis—yet we have access to more information than ever before
(Brynjolfsson and Saunders 2009). The increased access to information has had a direct
impact on worker productivity and measured quality change, but it also has altered
consumer time use and created value not necessarily captured in GDP.
3. Conclusion
Innovation accounting requires recognizing that innovation is not costless, that
innovation is a source of market power, and that innovation accounting requires a shift
change in unit costs to be zero). But if the PED was a much larger value, say 4, the contribution of
product innovation in this industry would be much smaller, less than 0.1 percentage point on an annual
basis (more or less equivalent to the Moulton and Wasshausen analysis). 18
Again, to be concrete, if the gain in demand were the same magnitude as the example in the previous
footnote and the PED was, say .5, the contribution of such product innovation would be estimated at
1 percentage point per year, which is very large indeed.

37
in thinking from the pure production model to one that factors in elements of demand.
In this paper, along with previous works, we took concrete steps in this direction.
The innovation accounting discussed here focuses mainly on business activity. But it
emphasized the utility of thinking about how innovation improves welfare through
increasing consumer surplus on the one hand, and growing income faster than price
change the other—issues related to the theme of this conference. The productivity
decomposition, analysis of innovation and its relationship to intangibles (and progress
report on intangibles measurement and updated productivity measures cum intangibles!)
are the main contributions of this paper.
A complete set of national accounts that include explicit time use, household, and
human capital components could be further expanded using elements introduced in this
paper. Linkages between the activities of business, including the benefits that flow to
consumers from innovation and the benefits that flow to business from education, seem
essential ingredients to forming strategies that promote economic growth and
competitiveness of advanced economies. Although these components exist in part or in
whole (Christian 2009, Bridgeman et al. 2012), building this larger ecosystem is a
complicated endeavor beyond the scope of this paper.

38
References
Abowd, John M., John Haltiwanger, Ron Jarmin, Julia Lane, Paul Lengermann, Kristin
McCue, Kevin McKinney, and Fristin Sandusky (2005). “The Relation among
Human Capital, Productivity, and Market Value: Building Up from Micro
Evidence.” In Measuring Capital in the New Economy, C. Corrado, J.
Haltiwanger, and D. Sichel, eds., Studies in Income and Wealth, Vol. 65, 153-
198. Chicago: The University of Chicago Press.
Aghion, Philippe and Peter Howitt (2007). “Capital, Innovation, and Growth
Accounting.” Oxford Review of Economic Policy, vol. 23:1, 79–93.
Aizcorbe, Ana M., Carol E. Moylan, and Carol A. Robbins (2009). “Toward Better
Measurement of Innovation and Intangibles” Survey of Current Business 89
(January): 10-23.
Awano G., Franklin M., Haskel J., Kastrinaki Z. (2010), “Investing in innovation,
Findings from the UK Investment and Intangible Asset Survey,” NESTA
Working paper (July).
Barnes, Paula (2010). “Investment in Intanagible Assets and Australia’s Productivity
Growth—Sectoral Estimates.” Productivity Commission Staff Working Paper.
Basu, Susanto, John Fernald, Nicholas Oulton, and Sally Srinivasan (2004). “The Case
of the Missing Productivity Growth: Or, Does Information Technology Explain
Why Productivity Accelerated in the United States but Not the United
Kingdom?” NBER Macroeconomics Annual 2003, M. Gertler and K. Rogoff,
eds., Cambridge, MA: The MIT Press.
Boer, F. Peter (2002). The Real Options Solution: Finding Total Value in a High-Risk
World New York, N.Y. John Wiley & Sons, Inc.
Bridgman, Benjamin, Andrew Dugan, Mikhael Lal, Matthew Osborne, and Shaunda
Villones (2012). “Accounting for Household Production in the National
Accounts, 1965–2010.” Survey of Current Business 92 (May): 23-36.
Brynjolfsson, Erik and Adam Saunders (2009). Wired for Innovation: How Information
Technology is Reshaping the Economy. Cambridge, Mass: MIT Press.
Christian, Michael S. (2009). “Human Capital Accounting in the Unites States, 1994 to
2006.” Available on the BEA web site.
Copeland, Adam M., Gabriel W. Medeiros, and Carol A. Robbins (2007). “Estimating
Prices for R&D Investment in the 2007 R&D Satellite Account.” BEA working
paper (November).
Copeland, Adam and Dennis Fixler (2009). “Measuring the Price of Research and
Development Output.” BEA working paper WP2009-2 (February).

39
Corrado, Carol, Charles Hulten, and Daniel Sichel (2005). “Measuring Capital and
Technology.” In Measuring Capital in the New Economy, C. Corrado, J.
Haltiwanger, and D. Sichel, eds., Studies in Income and Wealth, Vol. 65, 11-14.
Chicago: The University of Chicago Press.
Corrado, Carol, Charles Hulten and Daniel Sichel (2009). “Intangible Capital and US
Economic Growth.” The Review of Income and Wealth 55: 3 (September), 661-
685.
Corrado, Carol and Charles Hulten (2010). “How Do You Measure a ‘Technological
Revolution’?” American Economic Review 100:5 (May), 99-104.
Corrado, Carol and Charles R. Hulten (2010). “Connecting the Supply and Demand
Sides of the Economy: Productivity, Asset Valuation, and Tobin’s q”. Paper
presented at the CRIW conference, Wealth, Financial Intermediation, and the
Real Economy, Washington, D.C., November 12-13, 2010.
Corrado, Carol, Peter Goodridge, and Jonathan Haskel (2011). “Constructing a Price
Deflator for R&D: Estimating the Price of Knowledge as a Residual.” The
Conference Board Economics Program Working Paper EPWP #11-03 (August).
Corrado, Carol; Jonathan Haskel, Cecilia Jona-Lasinio and Massimiliano Iommi,
(2012), “Intangible Capital and Growth in Advanced Economies: Measurement
Methods and Comparative Results.” Working Paper (June), available
at http://www.intan-invest.net
Corrado, Carol and Janet X. Hao (forthcoming). “Innovative Labor in Business:
Measuring Intangible Investment at the Sectoral and Industry Level” paper to be
presented at the 2013 ASSA meetings.
Dal Borgo, Mariela, Peter Goodridge, Jonathan Haskel and Annarosa Pesole (2011).
Productivity and growth in UK industries: an intangible investment approach,
2011-06, Imperial College Business School working paper.
Davis, Steven J., John C. Haltiwanger, and Scott Schuh (1996). Job Creation and
Destruction, Cambridge, MIT Press.
Dunne, T., M. Roberts, and L. Samuelson (1989). “The Growth and Failure of U.S.
Manufacturing Plants.” Quarterly Journal of Economics 104: 671-98
Foster, L., J. Haltiwanger, and C.J. Krizan (2001). “Aggregate Productivity Growth:
Lessons from Microeconomic Evidence.” In New Developments in Productivity
Analysis, ed., E. Dean, M. Harper, and C. Hulten, 303-418. Chicago: The
University of Chicago Press.
Fukao, Kyoji, Tsutomu Miyagawa, Kentaro Mukai, Yukio Shinoda, and Konomi
Tonogi (2009). “Intangible Investment in Japan: Measurement and Contribution
to Growth” Review of Income and Wealth 55:3 (September), 717-736.

40
Görzig, B., Piekkola H., and R. Riley, “Production of own account intangible
investment: Methodology in Innodrive project,” Innodrive Working Paper No 1,
2010.
Greenlees, John S., and Robert McClelland. 2008. “Addressing Misconceptions about
the Consumer Price Index.” Monthly Labor Review (August), 3-19.
Greenlees, John S., and Robert McClelland. 2011. “Does Quality Adjustment Matter for
Technologically Stable Products? An Application to the CPI for
Food.” American Economic Review, 101(3): 200–205.
Griliches, Zvi (1973). “Research Expenditures and Growth Accounting.” In B.R.
Williams, ed., Science and Technology and Economic Growth. London:
MacMillan, pp. 59-95.
Griliches, Zvi (1979). “Issues in Assessing the Contribution of Research and
Development to Productivity Growth.” Bell Journal of Economics, vol. 10:1
(Spring), 92-116.
Hall, Robert E. (1968) “Technical Change and Capital From the Point of View of the
Dual.” Review of Economics Studies 35: 34-46.
Hausman, Jerry (1981), “Exact Consumer Surplus and Deadweight Loss,” American
Economic Review, 71, 662-676.
Hausman, Jerry (1996), “Valuation of New Goods Under Perfect and Imperfect
Competition,” in The Economics of New Products, eds. T. Bresnahan and R.
Gordon, Chicago: University of Chicago Press, 209-237.
Hausman, Jerry (1999), “Cellular Telephone, New Products, and the CPI.” Journal of
Business & Economic Statistics, 17: 2 (April), 188-194.
Hulten, Charles R. (1992). “Growth Accounting when Technological Change is
Embodied in Capital.” American Economic Review 82:4, 964-980.
Hulten, Charles R. and Janet X. Hao (2008). “What is a Company Really Worth?
Intangible Capital and the ‘Market to Book Value’ Puzzle” NBER working
paper No. 14548 (December).
Hulten, Charles R. (2010). Decoding Microsoft: Intangible Capital as a Source of
Company Growth,” NBER Working Paper 15799 (March).
Hulten, Charles R. (2012). "Intangible Capital, Product Innovation, and the Theory of
the Firm," University of Maryland, unpublished, June 2012
Jensen, J. Bradford (2011). Global Trade in Services: Fear, Facts, and Offshoring.
Washington, D.C.: Peterson Institute for International Economics.

41
Jorgenson, Dale, and Barbara Fraumeni (1989). “The Accumulation of Human and
Nonhuman Capital, 1948-84.” In Robert Lipsey and Helen Stone Tice, eds., The
Measurement of Saving, Investment, and Wealth (Chicago: University of
Chicago Press).
Jorgenson, Dale, and Barbara Fraumeni (1992). “The Output of the Education Sector.”
In Zvi Griliches, ed., Output Measurement in the Service Sectors (Chicago:
University of Chicago Press).
Jorgenson, Dale W. and Zvi Griliches (1967). “The Explanation of Productivity
Change,” Review of Economic Studies, Vol. 34 (July), 349-83.
Marrano, Mauro Giorgio, Jonathan Haskel and Gavin Wallis (2009): What happened to
the knowledge economy? ICT, intangible investment and Britain s productivity
record revisited. The Review of Income and Wealth 55: 3 (September), 686-716.
Moulton, Brent R. and Dave Wasshausen (2006). “The Role of Hedonic Methods in
Measuring Real GDP in the United States.” Paper presented at the 31st CEIES
Seminar, The Role of Hedonic Price Measurement on Productivity (October).
Available at http://www.bea.gov/papers/pdf/hedonicGDP.pdf
Moylan, Carol and Carol Robbins (2007). “Research and Development Satellite
Account Update” Survey of Current Business 87 (October): 49–92
Nakamura, Leonard. 2001. “What is the US Gross Investment in Intangibles? (At Least)
One Trillion Dollars a Year!” Federal Reserve Bank of Philadelphia Working
Paper No. 01-15, 2001.
Nerlove, Mark and Kenneth J. Arrow (1962). “Optimal Advertisting Policy under
Dynamic Conditions.” Economica 39, 129-142
Nordhaus, William D. 1997. “Do Real Output and Real Wage Measures Capture
Reality? The History of Lighting Suggests Not.” In The Economics of New
Goods, eds. Timothy Bresnahan and Robert J. Gordon, 29-66. Studies in
Income and Wealth, Vol. 58. Chicago: The University of Chicago Press.
Pakes, Ariel, and Mark Schankerman (1984). “The Rate of Obsolescence of Patents,
Research Gestation Lags, and the Private Rate of Return to Research
Resources.” In R&D, Patents, and Productivity, ed. Zvi Griliches, 73–88.
Chicago: University of Chicago Press.
Peleg S (2008a) ‘Service lives of R&D’, Central Bureau of Statistics, Israel.
Peleg S (2008b), reported in ‘Examples of surveys on service lives of R&D’, The
OECD Handbook on Deriving Capital Measures for Intellectual Property
Products (2010).
Piekkola, Hannu (2012). “Intangibles: Can They Explain the Unexplained?”
INNODRIVE working paper.

42
Romer, Paul M. (1990). “Endogenous Technological Change.” Journal of Political
Economy, Vol. 98:5 (October), Part 2: S71-S102.
Soloveichik, Rachel (2010). “Artistic Originals as a Capital Asset.” American
Economic Review 100:5 (May), 110-114.
Solow, Robert M. (1957). “Technical Change and the Aggregate Production Function.”
Review of Economics and Statistics 39:3 (August), 312-320.
Solow, Robert (1960), “Investment and Technical Progress”, in Arrow, Karlin and
Suppes (eds.), Mathematical Methods in the Social Sciences, Stanford
University Press.
System of National Accounts 2008. European Commission, International Monetary
Fund, OECD, United Nations, World Bank.
Trigeorgis, Lenos (1996). Real Options: Managerial Flexibility and Strategy in
Resource Allocation. Cambridge, Mass: MIT Press.
van Ark, Bart, Janet X. Hao, Carol A. Corrado, and Charles R. Hulten ( 2009).
“Measuring Intangible Capital and its Contribution to Economic Growth in
Europe.” European Investment Bank Papers, 14(1), 62–93.
van Ark, Bart and Kirsten Jaeger (2010). “Intangible Capital in Europe and its
Implications for Future Growth. The Conference Board.