innovation and institutional ownership - booth...
TRANSCRIPT
American Economic Review 2013, 103(1): 277–304 http://dx.doi.org/10.1257/aer.103.1.277
277
Innovation and Institutional Ownership†
By Philippe Aghion, John Van Reenen, and Luigi Zingales*
We find that greater institutional ownership is associated with more innovation. To explore the mechanism, we contrast the “lazy manager” hypothesis with a model where institutional owners increase innovation incentives through reducing career risks. The evidence favors career concerns. First, we find complementarity between institutional ownership and product market competition, whereas the lazy manager hypothesis predicts substitution. Second, CEOs are less likely to be fired in the face of profit downturns when institutional ownership is higher. Finally, using instrumental variables, policy changes, and disaggregating by type of institutional owner, we argue that the effect of institutions on innovation is causal. (JEL G23, G32, L25, M10, O31, O34)
Innovation is the main engine of growth, but what determines a firm’s ability to innovate? Publicly traded companies should have an advantage, since they can spread risk across a large mass of investors. Yet managerial agency problems might undermine this advantage. The pressure for quarterly results may induce a short-term focus (Porter 1992) and the risk of being fired (Kaplan and Minton 2006) might dis-suade risk-averse managers from innovating. Finally, innovation requires effort and “lazy” managers might not exert enough of it. Hence, it is important to study the governance of innovation in publicly traded companies, which account for a large share of private research and development (R&D) expenditure.
This paper studies the role of institutional investors in the governance of innova-tion. Did the rise in institutional ownership increase short-termism, undermining the innovation effort? Or did it reassure managers, making them more willing to “swing for the fences?” To answer these questions we assemble a rich and original panel dataset of over 800 major US firms over the 1990s containing time-varying information on patent citations, ownership, R&D, and governance. We show that there is a robust positive association between innovation and institutional owner-ship even after controlling for firm fixed effects and other confounding influences.
* Aghion: Department of Economics, Harvard University, Littauer Center, 1805 Cambridge Street, Cambridge, MA 02138, and CEPR (e-mail: [email protected]); Van Reenen: Centre for Economic Performance, London School of Economics, Houghton Street, London, WC2A 2AE, United Kingdom (e-mail: [email protected]); Zingales: Chicago Booth Business School, University of Chicago, 5807 South Woodlawn Avenue, Chicago, IL 60637, and NBER (e-mail: [email protected]). We would like to thank Tim Besley, Patrick Bolton, Florian Ederer, Oliver Hart, Mark Saunders, David Scharfstein, Jean Tirole, and participants in seminars at the New Orleans AEA, Chicago, CIAR, LSE, MIT/Harvard, NBER, Stanford, and ZEW Mannheim for helpful comments and assistance. Brian Bushee, Darin Clay, Adair Morse, and Ray Fisman have been extremely generous with their comments and helping us with their data. Van Reenen gratefully acknowledges the financial support of the ESRC through the Center for Economic Performance, and Zingales the Initiative on Global Markets and the Stigler Center at the University of Chicago.
† To view additional materials, visit the article page at http://dx.doi.org/10.1257/aer.103.1.277.
278 THE AMERICAN ECONOMIC REVIEW fEbRuARy 2013
Institutional owners have a small and positive impact on R&D, but a larger positive effect on the productivity of R&D (as measured by future cite-weighted patents per R&D dollar). This evidence is consistent with two widely used models. The first one is that managers prefer a quiet life (e.g., Hart 1983; Bertrand and Mullainathan 2003) and institutional investors force them to innovate (the lazy manager hypothesis). The alternative story is based on a career concern model, à la Holmström (1982): managers may dislike the risk innovation involves. If things go wrong for purely stochastic rea-sons, they risk being fired. If incentive contracts cannot fully overcome this problem, increased monitoring can improve incentives to innovate by “insulating” the man-ager against the reputational consequences of bad income realizations. To distinguish between these hypotheses, we build a model that nests the two, which yields different predictions on the interaction between institutional ownership and competition. The lazy manager hypothesis predicts that if competition is high then there is no need for intensive monitoring as the manager is disciplined by the threat of bankruptcy or take-over to work hard. In contrast, our career concern model predicts that more intense competition reinforces the positive effect of institutional investment on managerial incentives.
Consistent with the career concerns hypothesis, we find that the positive relation-ship between innovation and institutional ownership is stronger when product market competition is more intense and/or when CEOs are less “entrenched.” Furthermore, the decision to fire the CEO is less affected by a decline in profitability when insti-tutional investment is high, which is also consistent with the career concern model.
We also try to determine which institutions have the biggest impact on innovation by using the Bushee (1998) classification. We find that quasi-indexed institutions (to use Bushee’s labels) have no association with innovation, while other types of institutional owners have a positive association with innovation. Finally, we show that even the exogenous increase in institutional ownership that follows the addition of a stock to the Standard and Poor’s (S&P) 500 has a positive effect on innovation, suggesting that the correlation between institutional ownership and innovation is not primarily due to self-selection.
While there is a large literature on the effect of financing constraints on R&D, the impact of corporate governance on R&D has received less attention. Some papers have looked at the effect of long-term incentive contracts on innovation (Lerner and Wulf 2007), the governance index (Becker-Blease 2011), shareholders’ protection (Xiao 2010), takeover pressure (Sapra, Subramanian, and Subramanian 2008), and the identity of large individual investors (Tribo, Berrone, and Surroca 2007). There is very little on the relation between institutional ownership and innovation. That institutions, such as pension, venture funds, or private equity funds can ameliorate some of the asymmetric information problems connected to R&D is widely rec-ognized in the literature (e.g., Hall and Lerner 2009; Chemmanur and Tian 2011). Less well-studied is the role played by institutional investors in the R&D process of publicly traded firms.
The small existing empirical evidence suggests the impact of institutional inves-tors is positive. For example, Francis and Smith (1995) find a positive correlation between ownership concentration (which includes institutions) and R&D expendi-tures, and Eng and Shackell (2001) find a positive correlation of institutions with R&D. In a similar vein, Bushee (1998) finds that companies with greater institutional
279aghion et al.: innovation and institutional ownershipvol. 103 no. 1
ownership are less likely to cut R&D following poor earnings performance. Unlike all these papers, we focus on the actual productivity of the innovation process, rather than only on the quantity of innovative inputs (R&D expenses). In addition, our use of an instrument and policy changes allows us to examine the possibility that this relationship is due to institutions’ ability to select the most innovative firms. Finally, our model allows us to probe deeper into the fundamental agency problem underly-ing this relationship.
Theoretically, the possibility that institutional investors might impact positively on innovation has also been examined by other papers. Edmans (2009), for exam-ple, shows how institutional ability to sell improves the information embedded into prices and in so doing improves the incentives to innovate. We view our theoretical model as complementary to Edmans (2009), since we take his effect on prices as a given and explain how this effect impacts the CEO incentives to innovate. The main contribution of our model is to nest two plausible mechanisms linking institutional ownership and innovation in order to discriminate between them empirically.
We choose not to consider the full space of explicit contracts for two reasons. First, we are interested in studying the possible effects of institutional ownership on innovation. In a Maskin and Tirole (1999) world of complete contracts there is no role for ownership. Second, the contracts for top managers of publicly traded firms are typically very short-term and do not shield the managers from the long-term reputational effects of failed innovation. Nevertheless, we discuss the robustness of our results to a richer contract space in Section IV.
Our paper is organized as follows. Section I presents the data, Section II the econo-metric framework, and Section III the basic empirical finding. Section IV contains the model and its additional predictions are tested in Section V. Section VI discusses endogeneity, Section VII the possible omitted variable of market value, and Section VIII concludes. A detailed set of online Appendices contains additional results.
I. Data
We use firm-level data on innovation and institutional ownership from a variety of sources (see online Appendix A for details). Our starting point is Compustat, which contains accounting information for all US publicly listed firms since the mid-1950s. Fixed capital is the net stock of property, plant, and equipment; R&D capital is calcu-lated using a perpetual inventory method1 and market value is stock market value at the close of the year. We obtain patents data from the National Bureau of Economic Research match with the US Patent and Trademark Office data, which contains around three million US patents granted between 1963 and 1999 and all citations made to these patents between 1975 and 2002 (over 16 million).2 Since the value of these patents differs greatly, to capture their importance we weight them by the number of future citations.
For institutional ownership we use compact disclosure, where ownership data includes the number of institutional owners, the number of shares issued, and the
1 We follow inter alia Hall, Jaffe, and Trajtenberg (2005) in defining the R&D stock as G t = R t + (1 − δ) G t−1 where R is the R&D expenditure in year t and δ = 0.15, the private depreciation rate of knowledge.
2 See Hall, Jaffe, and Trajtenberg (2001).We used Hall’s update of the citation files, which runs through to 2002.
280 THE AMERICAN ECONOMIC REVIEW fEbRuARy 2013
percent of outstanding shares held by each institution.3 The ownership data covers 91,808 firm-year observations between 1991 and 2004. (Prior to 1991 there are some inconsistencies in the reporting of the ownership data, which is why this is our first year.) We then match these data with the classification of institutions in Bushee (1998), to investigate whether there are differential effects by the type of institutional owner. CEO firings and other managerial characteristics are from data constructed by Fisman, Khurana, and Rhodes-Kropf (2005) based on reading the financial press and the S&P ExecuComp database.
These datasets do not overlap perfectly, so our baseline regressions run between 1991, the first year of clean ownership data, and 1999, the last year when we can realistically construct citation-weighted patent counts. Although the exact number of observations depends on specific regression, the baseline sample for which we run the cite-weighted patents equation contains 6,208 observations on 803 firms.4
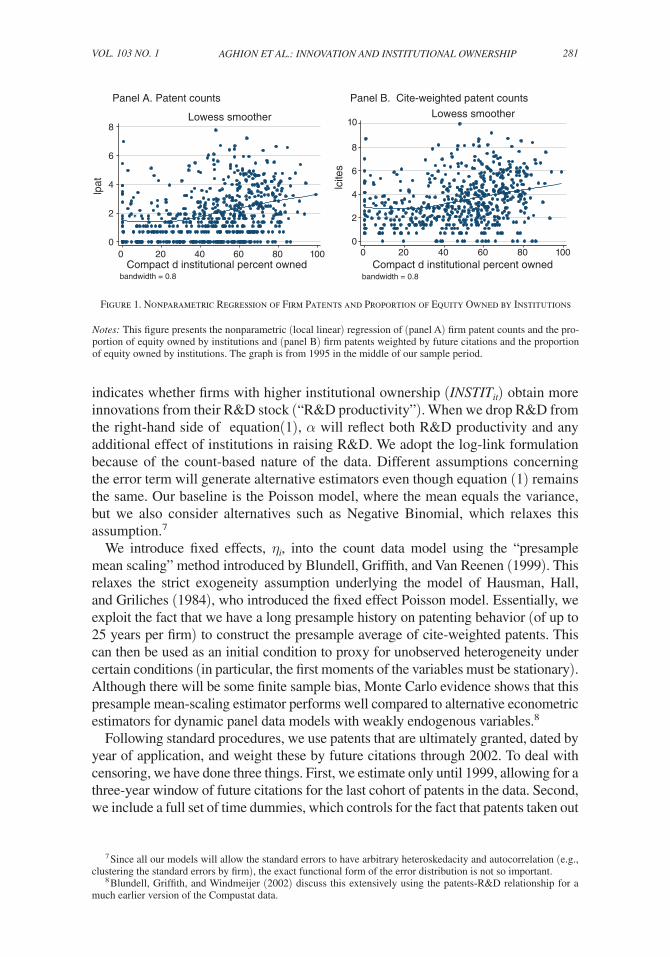
Descriptive statistics are in online Appendix, Table A1. Our firms are large (3,700 employees and $608 million in sales at the median). The citation and patents series are very skewed: the mean number of cite-weighted patents is 176, but the median is only 7. Panel A of Figure 1 presents the nonparametric relationship between the log of unweighted patent counts and the proportion of firm’s equity owned by institutions. Panel B presents the same graph but using our preferred future cita-tion-weighted patents measure. In both figures we show a line of the local linear regression estimated by the lowest smoother with a bandwidth of 0.8. There is clearly a positive correlation between innovation and institutional ownership that appears to be broadly monotonic, although the positive relation does not appear vis-ible until institutions own about a quarter of the equity.
II. Econometric Modeling Strategy
A. Modeling Innovation
Consider the first moment of the relationship between a count-based measure of innovation (i.e., future cite-weighted patents), CITE S it , of firm i in period t and our measure of institutional ownership (INSTI T it , the proportion of stock owned by institutions). The conditional expectation, E(· | ·) of this measure of innovation is5
(1) E(CITE S it | x it , η i , τ t ) = exp(αINSTI T it + β x it + η i + τ t ),
where x it are other control variables,6 η i is a firm fixed effect, and τ t are time dum-mies. When the R&D stock is included on the right hand side of equation (1), α
3 All institutional organizations, companies, universities, etc. are required to file a Form 13-F with the Securities and Exchange Commission (SEC) on a quarterly basis if they have greater than $100 million in equity assets under discretionary management. All common stock holdings of 10,000 or more shares or having a value of $200,000 or more must be reported. Throughout this paper an institutional owner is defined as an institution that files a 13-F.
4 The main restriction from the overall Compustat database is that in the fixed effects estimators we require a firm to have at one cited patent in the 1991–1999 period (see online Appendix A for more details).
5 See Blundell, Griffith, and Van Reenen (1999) and Hausman, Hall, and Griliches (1984) for discussions of count data models of innovation in firm panels.
6 We consider a range of control variables suggested by the existing literature on models of innovation and mod-els of institutional ownership. For example, we condition on size and the capital-labor ratio (see, inter alia, Hall, Jaffe, and Trajtenberg 2005, and Gompers and Metrick 2001).
281aghion et al.: innovation and institutional ownershipvol. 103 no. 1
indicates whether firms with higher institutional ownership (INSTI T it ) obtain more innovations from their R&D stock (“R&D productivity”). When we drop R&D from the right-hand side of equation(1), α will reflect both R&D productivity and any additional effect of institutions in raising R&D. We adopt the log-link formulation because of the count-based nature of the data. Different assumptions concerning the error term will generate alternative estimators even though equation (1) remains the same. Our baseline is the Poisson model, where the mean equals the variance, but we also consider alternatives such as Negative Binomial, which relaxes this assumption.7
We introduce fixed effects, η i , into the count data model using the “presample mean scaling” method introduced by Blundell, Griffith, and Van Reenen (1999). This relaxes the strict exogeneity assumption underlying the model of Hausman, Hall, and Griliches (1984), who introduced the fixed effect Poisson model. Essentially, we exploit the fact that we have a long presample history on patenting behavior (of up to 25 years per firm) to construct the presample average of cite-weighted patents. This can then be used as an initial condition to proxy for unobserved heterogeneity under certain conditions (in particular, the first moments of the variables must be stationary). Although there will be some finite sample bias, Monte Carlo evidence shows that this presample mean-scaling estimator performs well compared to alternative econometric estimators for dynamic panel data models with weakly endogenous variables.8
Following standard procedures, we use patents that are ultimately granted, dated by year of application, and weight these by future citations through 2002. To deal with censoring, we have done three things. First, we estimate only until 1999, allowing for a three-year window of future citations for the last cohort of patents in the data. Second, we include a full set of time dummies, which controls for the fact that patents taken out
7 Since all our models will allow the standard errors to have arbitrary heteroskedacity and autocorrelation (e.g., clustering the standard errors by firm), the exact functional form of the error distribution is not so important.
8 Blundell, Griffith, and Windmeijer (2002) discuss this extensively using the patents-R&D relationship for a much earlier version of the Compustat data.
Panel A. Patent counts
Panel B. Cite-weighted patent counts
0
2
4
6
8
0 20 40 60 80 100Compact d institutional percent owned
bandwidth = 0.8
Lowess smoother
0
2
4
6
8
10
lcite
s
0 20 40 60 80 100Compact d institutional percent owned
bandwidth = 0.8
Lowess smoother
lpat
Figure 1. Nonparametric Regression of Firm Patents and Proportion of Equity Owned by Institutions
Notes: This figure presents the nonparametric (local linear) regression of (panel A) firm patent counts and the pro-portion of equity owned by institutions and (panel B) firm patents weighted by future citations and the proportion of equity owned by institutions. The graph is from 1995 in the middle of our sample period.
282 THE AMERICAN ECONOMIC REVIEW fEbRuARy 2013
later in the panel have less time to be cited than patents taken out earlier in the panel.9 We also estimate on simple unweighted patent counts as a robustness check.
B. Selection Issues
The coefficient on institutional ownership may be biased if institutions select firms to invest in on the basis of characteristics that are observable to them but not to us. For example, institutions might invest in firms when they anticipate a surge in their innovation. A second problem is that our measure of institutional ownership might be noisy. Besides recording and classification mistakes, the main concern is that different institutions might behave in a very different way. By using the total amount of institutional ownership, rather than the amount of institutional ownership held by “active” institutions, we are likely to underestimate their effect.
We tackle these issues in a number of ways. First, the theory delivers additional predictions concerning the environments where institutions should have differential effects on innovation (and also predictions on the impact of firm profitability on CEO firing). Second, we bring additional data to bear on the breakdown of institu-tions by type of owner (e.g., that quasi-indexed funds should have a lower impact on innovation as they are likely to collect less information on senior managers). Third, we exploit the policy change in the American proxy rules, which after 1992 made it easier for different institutional owners to forge alliances, monitor CEOs, and coor-dinate more activist policies. If our model is correct then there should be a stronger effect of institutions after this policy change.
Fourth, we consider the inclusion of a firm in the S&P 500 as an instrumental variable for institutional ownership (see Clay 2001). An S&P 500 firm is more likely to be owned by institutions for several reasons. Managers of nonindexed funds are typically benchmarked against the S&P 500, so there is an incentive for them to weight their portfolio toward firms who are in the S&P 500. Moreover, fiduciary duty laws—such as the Employee Retirement Income Security Act—have been shown to influence portfolio selection through their implied endorsement of broad indexing.10 Furthermore, openly indexed funds that track the S&P 500 will be forced to invest in this company. The exclusion restriction is likely to be satisfied as stocks are added to the S&P because they represent well a certain sector, not because of their expected performance. Standard and Poor’s explicitly states that the deci-sion to include a company in the S&P 500 Index is not an opinion on that company’s investment potential.11 We present some tests of this identifying assumption using information on stock market returns in the run-up to joining the S&P 500. We imple-ment the instrumental variable estimator by using the control function approach (see Blundell and Powell 2004) as we use nonlinear count data models (which have a mass point at zero). We also consider two-stage least squares (2SLS) results as a robustness test. Econometric details are in online Appendix B.
9 We also experimented with renormalizing citations taking into account the year in which the patent was taken out (see Hall, Jaffe, and Trajtenberg 2005). These delivered similar results to the unadjusted citations results pre-sented here.
10 See Del Gurcio (1996); Pruitt and Wei (1989); or Froot, Scharfstein, and Stein (1992) for supportive evidence.11 http://www.standardandpoors.com/regulatory-affairs/indices/en/us.
283aghion et al.: innovation and institutional ownershipvol. 103 no. 1
Finally, even controlling for selection, we are still concerned that there may be bias from omitting firm value. This could influence innovation as well as being cor-related with institutional ownership (and possibly inclusion in the S&P 500 Index). We consider various strategies to deal with this issue in Section VII, built around the simple test of conditioning on the stock market value of the firm.
III. Basic Empirical Finding
A. Innovation and Institutional Ownership
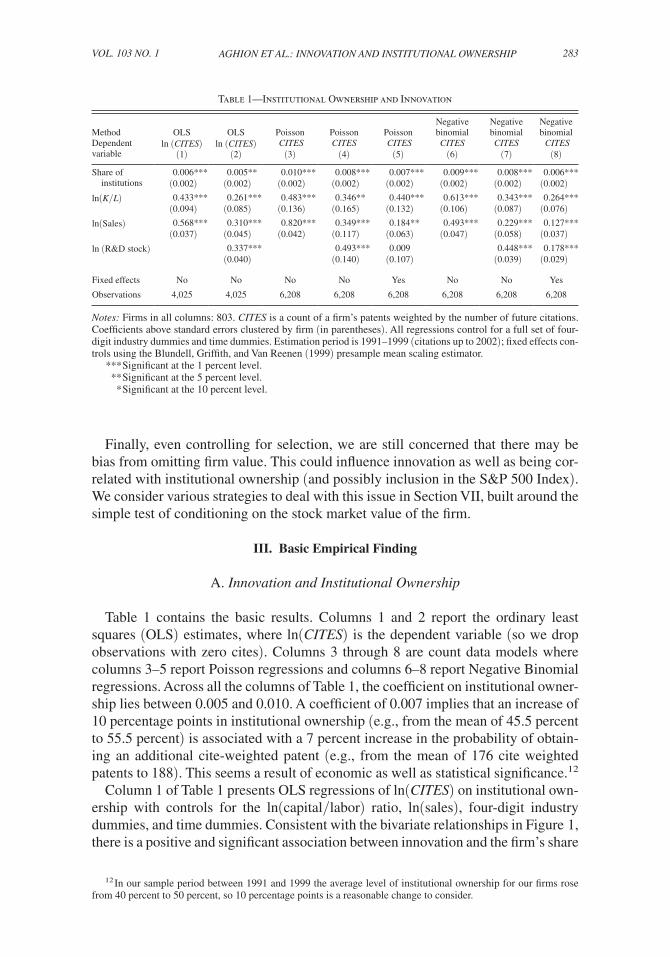
Table 1 contains the basic results. Columns 1 and 2 report the ordinary least squares (OLS) estimates, where ln(CITES) is the dependent variable (so we drop observations with zero cites). Columns 3 through 8 are count data models where columns 3–5 report Poisson regressions and columns 6–8 report Negative Binomial regressions. Across all the columns of Table 1, the coefficient on institutional owner-ship lies between 0.005 and 0.010. A coefficient of 0.007 implies that an increase of 10 percentage points in institutional ownership (e.g., from the mean of 45.5 percent to 55.5 percent) is associated with a 7 percent increase in the probability of obtain-ing an additional cite-weighted patent (e.g., from the mean of 176 cite weighted patents to 188). This seems a result of economic as well as statistical significance.12
Column 1 of Table 1 presents OLS regressions of ln(CITES) on institutional own-ership with controls for the ln(capital/labor) ratio, ln(sales), four-digit industry dummies, and time dummies. Consistent with the bivariate relationships in Figure 1, there is a positive and significant association between innovation and the firm’s share
12 In our sample period between 1991 and 1999 the average level of institutional ownership for our firms rose from 40 percent to 50 percent, so 10 percentage points is a reasonable change to consider.
Table 1—Institutional Ownership and Innovation
Method OLS OLS Poisson Poisson PoissonNegative binomial
Negative binomial
Negative binomial
Dependent ln (CITES) ln (CITES) CITES CITES CITES CITES CITES CITES variable (1) (2) (3) (4) (5) (6) (7) (8)
Share of 0.006*** 0.005** 0.010*** 0.008*** 0.007*** 0.009*** 0.008*** 0.006*** institutions (0.002) (0.002) (0.002) (0.002) (0.002) (0.002) (0.002) (0.002)ln(K/L) 0.433*** 0.261*** 0.483*** 0.346** 0.440*** 0.613*** 0.343*** 0.264***
(0.094) (0.085) (0.136) (0.165) (0.132) (0.106) (0.087) (0.076)ln(Sales) 0.568*** 0.310*** 0.820*** 0.349*** 0.184** 0.493*** 0.229*** 0.127***
(0.037) (0.045) (0.042) (0.117) (0.063) (0.047) (0.058) (0.037)ln (R&D stock) 0.337*** 0.493*** 0.009 0.448*** 0.178***
(0.040) (0.140) (0.107) (0.039) (0.029)
Fixed effects No No No No Yes No No Yes
Observations 4,025 4,025 6,208 6,208 6,208 6,208 6,208 6,208
Notes: Firms in all columns: 803. CITES is a count of a firm’s patents weighted by the number of future citations. Coefficients above standard errors clustered by firm (in parentheses). All regressions control for a full set of four-digit industry dummies and time dummies. Estimation period is 1991–1999 (citations up to 2002); fixed effects con-trols using the Blundell, Griffith, and Van Reenen (1999) presample mean scaling estimator.
*** Significant at the 1 percent level. ** Significant at the 5 percent level. * Significant at the 10 percent level.
284 THE AMERICAN ECONOMIC REVIEW fEbRuARy 2013
of equity owned by institutions. Column 2 includes the firm’s R&D stock, which, as expected, has a positive and significant association with patent citations (e.g., Hall, Jaffe, and Trajtenberg 2005). Conditioning on R&D slightly reduces the coefficient of institutional ownership (from 0.006 to 0.005), suggesting that the main effect of ownership is to alter quality and/or productivity of R&D rather than through simply stimulating more R&D.
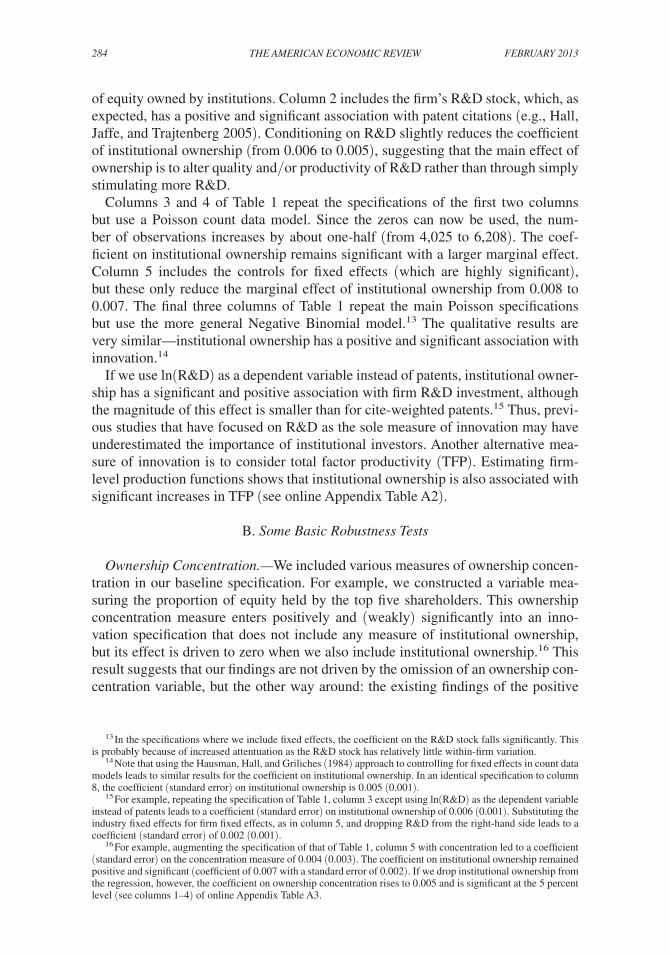
Columns 3 and 4 of Table 1 repeat the specifications of the first two columns but use a Poisson count data model. Since the zeros can now be used, the num-ber of observations increases by about one-half (from 4,025 to 6,208). The coef-ficient on institutional ownership remains significant with a larger marginal effect. Column 5 includes the controls for fixed effects (which are highly significant), but these only reduce the marginal effect of institutional ownership from 0.008 to 0.007. The final three columns of Table 1 repeat the main Poisson specifications but use the more general Negative Binomial model.13 The qualitative results are very similar—institutional ownership has a positive and significant association with innovation.14
If we use ln(R&D) as a dependent variable instead of patents, institutional owner-ship has a significant and positive association with firm R&D investment, although the magnitude of this effect is smaller than for cite-weighted patents.15 Thus, previ-ous studies that have focused on R&D as the sole measure of innovation may have underestimated the importance of institutional investors. Another alternative mea-sure of innovation is to consider total factor productivity (TFP). Estimating firm-level production functions shows that institutional ownership is also associated with significant increases in TFP (see online Appendix Table A2).
B. Some Basic Robustness Tests
Ownership Concentration.—We included various measures of ownership concen-tration in our baseline specification. For example, we constructed a variable mea-suring the proportion of equity held by the top five shareholders. This ownership concentration measure enters positively and (weakly) significantly into an inno-vation specification that does not include any measure of institutional ownership, but its effect is driven to zero when we also include institutional ownership.16 This result suggests that our findings are not driven by the omission of an ownership con-centration variable, but the other way around: the existing findings of the positive
13 In the specifications where we include fixed effects, the coefficient on the R&D stock falls significantly. This is probably because of increased attentuation as the R&D stock has relatively little within-firm variation.
14 Note that using the Hausman, Hall, and Griliches (1984) approach to controlling for fixed effects in count data models leads to similar results for the coefficient on institutional ownership. In an identical specification to column 8, the coefficient (standard error) on institutional ownership is 0.005 (0.001).
15 For example, repeating the specification of Table 1, column 3 except using ln(R&D) as the dependent variable instead of patents leads to a coefficient (standard error) on institutional ownership of 0.006 (0.001). Substituting the industry fixed effects for firm fixed effects, as in column 5, and dropping R&D from the right-hand side leads to a coefficient (standard error) of 0.002 (0.001).
16 For example, augmenting the specification of that of Table 1, column 5 with concentration led to a coefficient (standard error) on the concentration measure of 0.004 (0.003). The coefficient on institutional ownership remained positive and significant (coefficient of 0.007 with a standard error of 0.002). If we drop institutional ownership from the regression, however, the coefficient on ownership concentration rises to 0.005 and is significant at the 5 percent level (see columns 1–4) of online Appendix Table A3.
285aghion et al.: innovation and institutional ownershipvol. 103 no. 1
effects of ownership concentration may be due to the failure to distinguish between institutional and noninstitutional ownership. This is reasonable. If there are some fixed costs in setting up effective monitoring across firms, then institutions, which typically hold large blocks in several companies, can exploit these economies and monitor more effectively. Second, the market can more easily infer from the selling behavior of institutions, which have fewer liquidity reasons to sell, than from the trading of individuals.
Dot-Com Bubble.—The Internet bubble is conventionally dated 1995–2000.17 We reran our model only on the years 1991–1994, contrasting these with the 1995–1999 results (see columns 5 and 6 of online Appendix, Table A3). Institutional ownership is significant in all subperiods, with only a slightly higher coefficient of 0.008 in the later period compared with 0.007 in the earlier period.
More General Controls for R&D.—Our main control for R&D is a stock measure composed of a depreciated sum of past R&D expenditures. Although standard, it may disguise some of the effects of R&D. Consequently, we included just the R&D flow and longer distributed lags of R&D. The coefficient on institutional ownership remains significant, falling by only a small amount even in a specification with a sixth-order distributed lag of R&D (from 0.007 to 0.006).18
Patent Quality.—We weight our patent counts by future cites as is standard as a proxy for quality, but there may be concerns about this procedure (e.g., Alcácer, Gittelman, and Sampat 2008). Nothing hinges on the exact weighting technique, however. To illustrate this, we use raw patent counts and show that our results are robust (see online Appendix, Table A4).
Summary.—Overall, all these results point in the direction of a positive effect of institutional ownership on innovation. We now turn to the question of why this is the case.
IV. The Model
A. Basic Framework
Consider the following variant of the career concerns model in Holmstrom (1982). There are two periods, t = 1, 2. The firm is run by a manager with unknown ability θ ∈ { _ θ ,
_ θ }. The prior beliefs about θ are that
Pr
(θ =
_ θ ) = Pr
(θ = _ θ ) = 1/2.
For notational simplicity, we normalize _ θ at zero.At the beginning of period 1, the manager decides whether or not to innovate.
We denote the innovation decision by i ∈ {0, 1}. If the manager does not innovate
17 http://en.wikipedia.org/wiki/Dot-com_bubble.18 See columns 7–10 of online Appendix Table A3.
286 THE AMERICAN ECONOMIC REVIEW fEbRuARy 2013
(i = 0), then her project is assumed to be uninformative about her ability in the sense that the revenue realization in period 1 is uncorrelated with ability. We normalize this revenue at zero.
If the manager decides to innovate (i = 1), she must incur an innovation cost I. Then, if the manager is of high ability (that is with θ =
_ θ ), the period 1 revenue
realization will be equal to
y 1 = { 1 with probability p 0 with probability 1 − p
.
By contrast, if the manager is of low ability, the period 1 revenue realization will be equal to
y 1 = { 1 with probability α p 0 with probability 1 − α p
,
where (i) α < 1, so that a lower-ability manager is less successful at innovating than a higher-ability manager; and (ii) p = 1 − π, where π is the probability that the innovation is imitated. The parameter π measures the degree of (ex post) market competition, so when (ex post) competition is more intense, innovation is more likely to fail.19
B. A Career Concern Model
Xu (2009) shows that in recent years 60 percent of CEOs’ employment contracts were “at will.” The average time horizon of the remaining 40 percent was 2.65 years. Hence, most of a CEO’s payoff is determined not by the explicit contracts, but by the effect his reputation has on his ability to recontract. Thus, in this model we will assume that the manager is only concerned about the impact that her decision will have on the market perception about her ability, as in Holmstrom (1982). Gibbons and Murphy (1992) show that introducing (partial) contractibility (e.g., over first-period revenues) does not eliminate the role for career concerns. More importantly, in our model the presence of explicit incentives would not eliminate the role of institutional investors in acquiring information and insuring the manager against income risk. In the language of Manso (2011), the role of institutional investors is that of insuring the manager.
19 For the sake of simplicity, we modeled product market competition as a probability of imitation, as done, for example, by Grossman and Helpman (1991). As correctly pointed out by a referee, this modeling device has the implication that competition always reduces innovation incentives (for standard Schumpeterian reasons). In line with the referee’s comment, we could have alternatively modeled competition as directly affecting the ex post return upon innovating and not innovating. Typically, competition would increase the difference between ex post income conditional upon innovating and ex post income conditional upon not innovating. In this alternative model, we would also obtain that competition increases the reputational risk faced by the manager, which is all that we need for our empirical results, even though competition does not necessarily reduce the incentives to innovate (see Aghion et al. 2005)—it is a balance between the “escape competition” effect and the standard Schumpeterian effect.
287aghion et al.: innovation and institutional ownershipvol. 103 no. 1
Absent an institutional investor, the market infers the manager’s ability from observing the period 1 revenue realization. Thus, by innovating, the manager exposes herself to the risk of losing her job. This in turn limits her incentive to innovate in the first place. In the presence of an institutional investor who monitors (i.e., collects independent information about the quality of the manager), the market can infer the manager’s type also from the institutional investor’s action.
For simplicity, in the model we assume that the institutional investor’s action is to decide whether to keep the manager. In reality, things are more subtle. Unhappy institu-tional investors do not fire the manager directly (since generally they have no represen-tative on the board), but can pressure the board behind the scene to do so. Alternatively, they can exercise their exit option and sell, causing the stock price to drop and trigger-ing the board to act. Edmans (2009) models precisely this link between institutional investors’ exit option and more informative stock prices. Either way, informed insti-tutional investors’ actions reveals the manager’s type to the market independent from period 1 revenue realization. This is all we need for the theoretical results.20
The timing of moves is as follows: (i) the manager first decides whether to inno-vate (and pay I ); (ii) the institutional investor learns about the manager’s ability, provided she invests a monitoring cost K ; after gathering this additional informa-tion, the investor decides whether to have the manager fired; (iii) the first-period revenue is realized and based on that realization the market updates its assessment of the manager’s ability; (iv) the manager decides whether to stay with the firm, based on the comparison between her expected wage in period 2 if she remains inside the firm versus what she can expect if she reallocates to another sector.
To complete our description of the model, we make three assumptions:
ASSUMPTION 1: The market for managers is fully competitive, and the second period wage of a manager is equal to her expected ability conditional upon the information acquired in period 1. This assumption is identical to that made in Holmstrom (1982).
ASSUMPTION 2: The institutional investor acquires perfect information about the manager’s ability only if the manager innovates.
In the context of the model, this assumption is justified by the fact that only inno-vation reveals the manager’s ability, since it is only when the manager innovates that the revenue realization depends upon her ability. Implicit here is the notion that the investor can monitor the manager while she undertakes the innovative strategy and assess her ability independent of the revenue realization. If no innovative strategy is undertaken, there is no opportunity for the investor to learn whether the outcome is due to luck or skill. This assumption is in line with the view that more innovative
20 Adopting the Edmans approach would introduce an additional effect of product market competition: namely, that more intense competition could affect institutional investors’ behavior through influencing the stock price. If we believe, however, that investors who acquire positive information about the manager’s ability will tend to hold on to their shares, then the Edmans approach is also consistent with our empirical finding. Competition will increase the impact of bad information on stock prices. Thus, when an institutional investor finds out that the manager is good in spite of bad public information, he will be more willing to hold on to his shares, because he will expect a higher capital gain. Therefore, as in our model this will generate a positive interaction between institutional inves-tors and competition.
288 THE AMERICAN ECONOMIC REVIEW fEbRuARy 2013
activities require more initiative and talent from managers than more imitative or routine activities.21
ASSUMPTION 3: Managerial ability is sector-specific; thus, what happens on her current job is uncorrelated with the manager’s ability if she moves to another sec-tor.22 Moreover, a manager who reallocates to another sector incurs a switching cost equal to δ.
Assumption 3 implies that every time a manager is fired and reallocates to another sector she has a new draw of the distribution of talents, so that her expected utility equals to
_ w = 1 _ 2 _ θ − δ.
This is also the manager’s reservation wage on her current job.
C. Equilibrium Wage and Innovation without Institutional Investors
We first consider the benchmark case where no information is acquired by the institutional investor. We solve the model by backward induction. Suppose that the manager has decided to innovate. Then, based on the revenue realization in period 1, the market updates its beliefs about managerial ability using Bayes’ rule. Consequently, the manager’s wage in period 2 if she remains in the firm, is given by
w 2 ( y 1 ) = Pr
(θ =
_ θ / y 1 )
_ θ .
If y 1 = 1, then
Pr
(θ =
_ θ / y 1 = 1) = p
_ p + α p = 1 _ 1 + α .
We thus get
w 2 ( y 1 = 1) = _ θ _
1 + α .
Similarly,
w 2 ( y 1 = 0) = Pr
(θ =
_ θ / y 1 = 0)
_ θ = 1 − p
_ 2 − p − αp
_ θ .
21 We thus follow Holmstrom in assuming that innovation reveals managerial talent to a greater extent than not innovating. There are other models, such as Zwiebel (1995), that assume that innovation creates more noise and makes it harder to infer talent. Which assumption is more realistic is ultimately an empirical matter. There is evi-dence from several papers that the return to observable skills is higher in more innovative sectors (e.g., Bartel and Lichtenberg 1987) and more high-tech firms in general. Under the assumption that unobservable ability and observ-able skills are positively correlated, this result suggests that in more innovative environments talent is revealed earlier.
22 Our results carry over to the case where skills are only partially sector-specific, but not to the polar case where skills are fully nonsector-specific, as we show in online Appendix C. We regard the assumption that skills are par-tially sector-specific as realistic. For example, there is a large body of literature pointing to persistent interindustry wage differentials that cannot be fully rationalized by observed or unobserved general human capital (e.g., Krueger and Summers 1988 or Gibbons and Katz 1992).
289aghion et al.: innovation and institutional ownershipvol. 103 no. 1
ASSUMPTION 4:
_ θ _
1 + α > 1 _ 2 _ θ − δ = _ w > 1 − p
_ 2 − p − α p
_ θ .
This assumption implies that the manager will leave the firm whenever her first-period revenue performance is low. Note that we always have
1 _ 1 + α > 1 _
2 > 1 − p
_ 2 − p − α p ,
so there is a nonempty set of parameters (α, w, p) that satisfy Assumption 4.Now, moving back to the initial stage of the game, the manager will decide to
innovate if and only if
U(i = 0) < U(i = 1) − I,
where U(i = 0) = 1/2 _ θ is the ex ante utility conditional upon not innovating (no
information is revealed about the manager in that case, and we implicitly assume that the manager is then kept on the job in the same sector and paid her expected productivity), and
(2) U(i = 1) = ( 1 _ 2 p + 1 _
2 αp)
_ θ _
1 + α + [ 1 _ 2 (1 − p) + 1 _
2 (1 − α p)] _ w .
The first term on the right-hand side of U(i = 1) is the ex ante probability of a high revenue realization23 times the second-period wage conditional upon a high-revenue realization w 2 ( y 1 = 1). The second term is the ex ante probability of a low-revenue realization times the manager’s expected payoff from moving to another firm. Thus,
U(i = 1) = 1 _ 2 p
_ θ + 1 _
2 (2 − p − α p) _ w .
In particular, note U(i = 1) − I > U(i = 0) when I and π are not too large.
D. Institutional Investment and Innovation
We now introduce the institutional investor into the analysis. By learning the true managerial ability, the institutional investor avoids having to keep a low-ability
23 That is, the ex ante probability of θ = _ θ (i.e., 1 _
2 ) times the probability of a high revenue conditional upon
θ = _ θ (i.e., p) plus the probability of θ = _ θ (i.e., 1 _
2 ) times the probability of a high revenue conditional upon θ
= _ θ (i.e., α p).
290 THE AMERICAN ECONOMIC REVIEW fEbRuARy 2013
manager. Let Π denote the net expected gain from getting rid of a low-ability man-ager before the period 1 income realization.24
If the investor owns a fraction ψ of the firm’s shares,25 he will choose to pay the cost K of learning the manager’s ability whenever
ψ Π > K,
which in turn is more likely to hold the higher is the investor’s share of profits, ψ. In this case, the manager’s expected utility from innovating becomes26
U(i = 1 : monitor) = 1 _ 2 _ θ + 1 _
2 _ w .
We can establish
PROPOSITION 1: Monitoring by an institutional investor, which is more likely to occur the higher the investor’s share of the firm’s profits, increases the manager’s gain from innovating. This positive effect is larger the higher is product market competition π.
PROOF:We have
ΔU = U(i = 1 : monitor) − U(i = 1) = 1 _ 2 [
_ θ (1 − p) − (1 − p − α p)w].
That _ θ > w implies immediately that ΔU is positive. Furthermore,
d _ dπ (ΔU) = 1 _
2 [
_ θ − ( _ w + α _ w )]
is positive since Assumption 4 has _ θ _ 1 + α > _ w . This establishes the proposition.
24 This gain is equal to the wage saving in period 2 from identifying a bad manager beforehand. The correspond-ing ex ante gain is:
Π = 1 _ 2 α p w 2 ( y 1 = 1)
or
Π = 1 _ 2 α p(
_ θ _
1 + α ).
25 Our paper takes a partial equilibrium approach by taking the institutional investor’s share (ψ) as exogenously given. In practice, this share is endogenously determined by institutional investors’ trade-off between the costs (e.g., lack of diversification) and the benefits (e.g., closer monitoring of managers) of holding high ownership stakes. It is true that some fundamental factors that affect the choice of ownership share are likely to also affect managers’ choice whether to innovate. This is precisely what motivated our instrumental variable analysis, where we look at the experiment of institutional owners buying more shares in new S&P 500 firms. We show there that our results are robust to treating ownership shares as endogenous.
26 When the institutional investor monitors, the manager gets _ θ if she is found to be of high ability and _ w if she
is found to be of low ability.
291aghion et al.: innovation and institutional ownershipvol. 103 no. 1
COROLLARY 1: Innovation takes place for a larger range of innovation costs I when the manager is monitored by an institutional investor and this effect is stronger when competition is higher.
PROOF:This results follows immediately from the fact that innovation takes place
whenever
U(i = 1 : monitor) − U(i = 0) > I;
therefore, there are values of I such that
U(i = 1 : monitor) − U(i = 0) = 1 _ 2 w > I > 1 _
2 ( p − 1)
_ θ + 1 _
2 (2 − p − α p)w.
Thus, institutional investment stimulates managerial innovation by insulating the manager against the reputational risk from a bad revenue realization, and this effect is stronger when the degree of product market competition is higher (measured by the imitation probability π). Online Appendix C contains some remarks showing the robustness of these results to extensions of the basic model.
Thus far, we have not considered how explicit contracts can help motivate innova-tion. This task has been recently undertaken by Manso (2011), who studies the opti-mal contract to motivate innovation—in his terminology, “exploration” as opposed to “exploitation.” He shows that there is a positive role of an informed principal in inducing innovation by the agent through providing information feedback and pro-tection against negative shocks. Thus, we can interpret our institutional investors as Manso’s informed principal.
E. Contrasting Career Concerns with the “Lazy Manager” Story
An alternative explanation to that developed so far, inspired by Hart (1983), Schmidt (1997), and Bertrand and Mullainathan (2003), is that monitoring by insti-tutional investors, together with the managers’ fear of losing the private benefits of remaining on the job, would force the manager to innovate if they are a priori reluctant to do so.
To nest this idea into the same model, we assume that the manager draws private benefit B from remaining on the job, but that innovating entails a private cost I to her. Other than that, the manager does not respond to monetary incentives, whether explicit or implicit. Finally, we assume that the institutional investor will monitor with probability m (which is a function of the size of the stake it owns). When the investor monitors, it can observe whether the manager has innovated and can decide whether to fire her. As a result, the investor can use the firing threat to force the manager to innovate. The manager can also lose her job as the result of a copycat innovation, an event that happens with probability π. More specifically, the manager will choose to innovate whenever
B − I > B(1 − π)(1 − m).
292 THE AMERICAN ECONOMIC REVIEW fEbRuARy 2013
As in the career concern model, the higher m, the more likely it is that the man-ager will innovate. Now, however, a higher-imitation probability π will reduce the marginal effect of m on the manager’s net gain from innovating, namely [B − I − B(1 − π)(1 − m)]. Thus, unlike in Proposition 1, more competition on the product market will reduce the effect of institutional investment on managerial innovation.
In his model of lazy managers, Schmidt (1997) also introduces explicit incentive contracts. In the presence of explicit contracts, competition has two effects. On the one hand, higher competition reduces the monetary wage that can be paid to the manager of a continuing firm (less rents to be distributed), which in turn reduces the innovation-incentive effect of institutional ownership. On the other hand, there is the escape-bankruptcy effect emphasized by Hart (1983): more competition increases the probability of bankruptcy, pushing managers to work harder. Our model focuses only on the second channel. If the first one were prominent, we should not have observed that innovation increases with competition, as we did in Section II.
V. Testing the Predictions of the Model
A. Institutional Ownership and Product Market Competition
Section II documented a positive association between innovation and institutional ownership. Both the career concern model and the lazy manager story predict that institutional ownership encourages managers to innovate. Where the two approaches differ is in the interaction between institutional ownership and product market com-petition. In the career concern model, the two are complements (i.e., the positive effect of institutions on innovations should be stronger when competition is higher). By contrast, in the lazy manager story, competition and institutions are substitutes. Indeed, in highly competitive environments there should be little managerial slack and therefore little need for greater monitoring by institutions or other mechanisms.
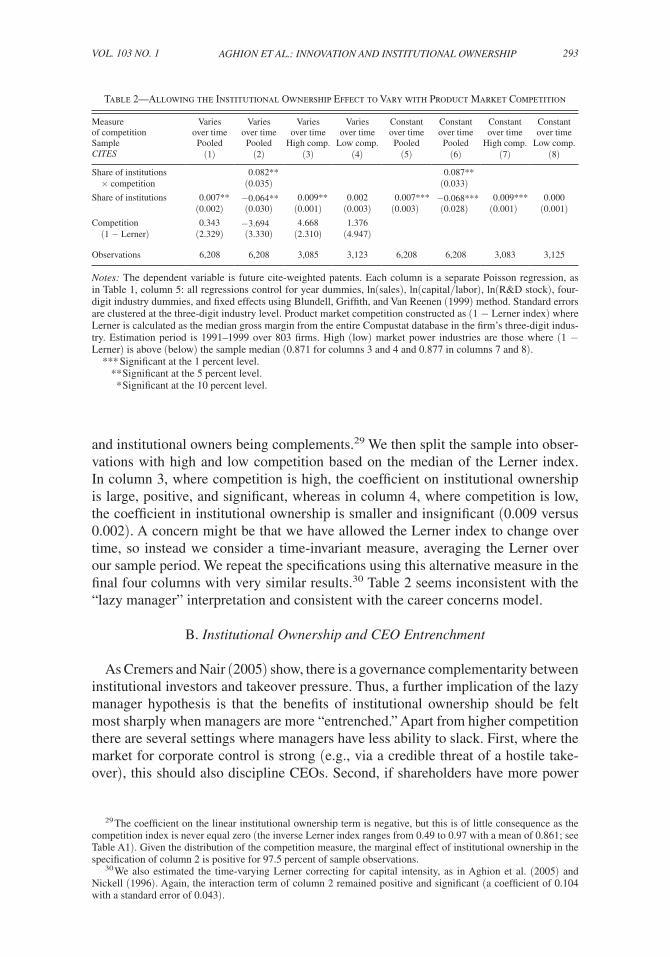
Table 2 analyzes the interaction between institutional ownership and product mar-ket competition. As a measure of product market competition we use (1—the Lerner index) in the firm’s three-digit industry.27 The first column reproduces our baseline fixed effects Poisson model of cite-weighted patents (column 5 of Table 1), includ-ing also our measure of product market competition. Competition has a positive association with innovation, although the effect is not significant, while the coef-ficient on institutional ownership remains positive and significant.28
Column 2 of Table 2 introduces an interaction term between institutional owner-ship and competition that is positive and significant, consistent with competition
27 There is no perfect measure of product market competition. Aghion et al. (2005) discuss why the inverse Lerner is appropriate in these kinds of models. We test for some alternative constructions of the Lerner as well as alternative measures of “managerial entrenchment” below.
28 As with Aghion et al. (2005), there is some (weak) evidence of an inverted U relationship between innovation and competition. If we include a term in the square of the (inverse) Lerner index, it is negative, whereas the linear term remains positive. This quadratic term is insignificant, however, with a coefficient of −6.852 and a standard error of 24.554.
293aghion et al.: innovation and institutional ownershipvol. 103 no. 1
and institutional owners being complements.29 We then split the sample into obser-vations with high and low competition based on the median of the Lerner index. In column 3, where competition is high, the coefficient on institutional ownership is large, positive, and significant, whereas in column 4, where competition is low, the coefficient in institutional ownership is smaller and insignificant (0.009 versus 0.002). A concern might be that we have allowed the Lerner index to change over time, so instead we consider a time-invariant measure, averaging the Lerner over our sample period. We repeat the specifications using this alternative measure in the final four columns with very similar results.30 Table 2 seems inconsistent with the “lazy manager” interpretation and consistent with the career concerns model.
B. Institutional Ownership and CEO Entrenchment
As Cremers and Nair (2005) show, there is a governance complementarity between institutional investors and takeover pressure. Thus, a further implication of the lazy manager hypothesis is that the benefits of institutional ownership should be felt most sharply when managers are more “entrenched.” Apart from higher competition there are several settings where managers have less ability to slack. First, where the market for corporate control is strong (e.g., via a credible threat of a hostile take-over), this should also discipline CEOs. Second, if shareholders have more power
29 The coefficient on the linear institutional ownership term is negative, but this is of little consequence as the competition index is never equal zero (the inverse Lerner index ranges from 0.49 to 0.97 with a mean of 0.861; see Table A1). Given the distribution of the competition measure, the marginal effect of institutional ownership in the specification of column 2 is positive for 97.5 percent of sample observations.
30 We also estimated the time-varying Lerner correcting for capital intensity, as in Aghion et al. (2005) and Nickell (1996). Again, the interaction term of column 2 remained positive and significant (a coefficient of 0.104 with a standard error of 0.043).
Table 2—Allowing the Institutional Ownership Effect to Vary with Product Market Competition
Measure of competition
Varies over time
Varies over time
Varies over time
Varies over time
Constant over time
Constant over time
Constant over time
Constant over time
Sample Pooled Pooled High comp. Low comp. Pooled Pooled High comp. Low comp.CITES (1) (2) (3) (4) (5) (6) (7) (8)
Share of institutions 0.082** 0.087** × competition (0.035) (0.033)Share of institutions 0.007** −0.064** 0.009** 0.002 0.007*** −0.068*** 0.009*** 0.000
(0.002) (0.030) (0.001) (0.003) (0.003) (0.028) (0.001) (0.001)Competition 0.343 −3.694 4.668 1.376 (1 − Lerner) (2.329) (3.330) (2.310) (4.947)
Observations 6,208 6,208 3,085 3,123 6,208 6,208 3,083 3,125
Notes: The dependent variable is future cite-weighted patents. Each column is a separate Poisson regression, as in Table 1, column 5: all regressions control for year dummies, ln(sales), ln(capital/labor), ln(R&D stock), four-digit industry dummies, and fixed effects using Blundell, Griffith, and Van Reenen (1999) method. Standard errors are clustered at the three-digit industry level. Product market competition constructed as (1 − Lerner index) where Lerner is calculated as the median gross margin from the entire Compustat database in the firm’s three-digit indus-try. Estimation period is 1991–1999 over 803 firms. High (low) market power industries are those where (1 − Lerner) is above (below) the sample median (0.871 for columns 3 and 4 and 0.877 in columns 7 and 8). *** Significant at the 1 percent level.
** Significant at the 5 percent level. * Significant at the 10 percent level.
294 THE AMERICAN ECONOMIC REVIEW fEbRuARy 2013
the CEO will be less entrenched. As before, under the lazy manager hypothesis insti-tutional ownership should have more of an effect when managers are entrenched, while under the career concern hypothesis the impact of institutional ownership on innovation should be weaker when managers are entrenched.
To measure the degree of entrenchment of CEOs, it has become standard to use the governance index introduced by Gompers, Ishi, and Metrick (2003), which is built upon the number of antitakeovers provision in place (including relevant state anti-takeover statues).31 In online Appendix, Table A5, we investigate the interac-tion between institutional ownership and managerial entrenchment as measured by the index for state takeover laws and the governance index of CEO power). We find evidence consistent with Table 2: contrary to the lazy manager hypothesis (and consistent with the career concerns model), the positive association of institutional ownership with innovation is stronger when CEOs are less entrenched. For example, replacing competition with the index of state legal protection against takeover in Table 2, column 2 generates a significantly negative coefficient on the interaction between institutional ownership entrenchment.32
C. Institutional Ownership and Managerial Turnover
A third prediction of the career concern model is that managerial turnover should be less sensitive to performance in the presence of institutional investors. By con-trast, under the lazy manager story, institutional ownership should not reduce the impact of bad realization of profits on the probability of managerial turnover. If any-thing, it should increase that impact because it makes it easy to resolve the collective action problem of firing the manager.
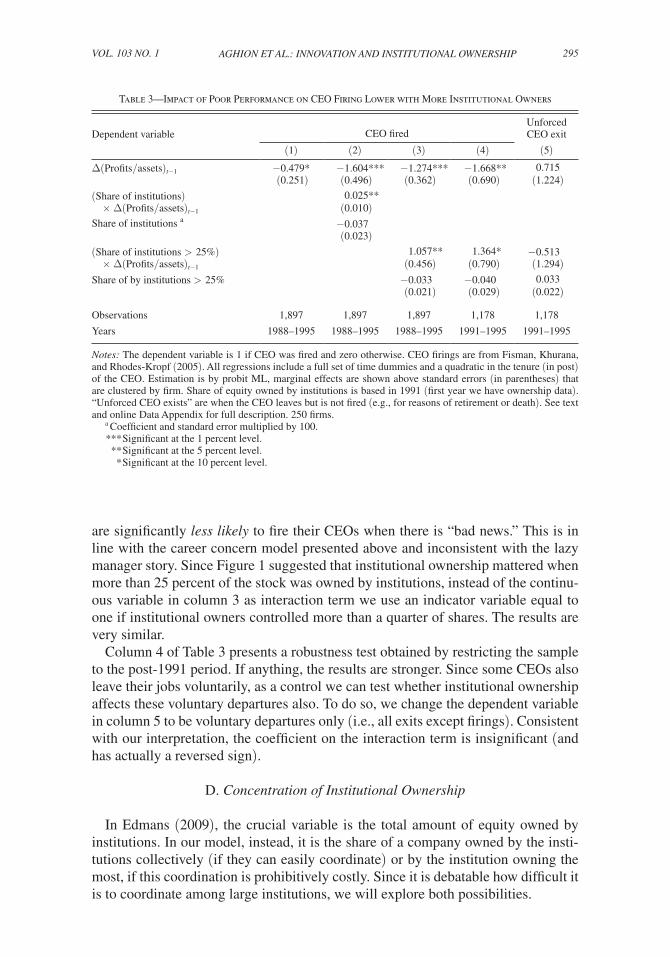
Table 3 presents evidence on the interaction between profitability changes and institutional ownership on forced managerial turnover. We use the data from Fisman, Khurana, and Rhodes-Kropf (2005), which has information on CEO firings con-structed from detailed readings of contemporary accounts in the financial press such as the Wall Street Journal. Since this covered only the larger S&P 500 firms until 1995, we have only a subsample (249 firms).33 The dependent variable is equal to unity if a CEO was fired and zero otherwise. In column 1 we regress whether the CEO was fired that year on the lagged change in profitability (profits normalized by assets). Like Fisman, Khurana, and Rhodes-Kropf (2005), we find that higher profitability growth is associated with a (weakly) significantly lower probability that the CEO will be fired. Column 2 interacts the profitability variable with the proportion of equity owned by institutions. The coefficient on this interaction is positive and significant and indicates that firms with greater institutional ownership
31 The shortcoming of this measure is that most of these devices were introduced in the late 1980s, when hostile takeovers were rampant, and became effectively useless with the demise of hostile takeovers. Nevertheless, that boards were willing to approve these statues provides an indication of the degree of control of the CEO over the board.
32 In online Appendix, Table A5, column 2, the coefficient (standard error) on the interaction is −0.0004 (0.0002) and 0.0174 (0.0052) on the linear term on state laws against hostile takeovers.
33 Given this much smaller sample size, we use ownership in the first year of our sample (1991). This enables us to use more of the CEO firing data. We assume ownership does not change much for the four years prior to 1991 and after 1991 and estimate on 1988–1995 in Table 3, column 1. We show our results are robust to using a shorter time window in column 4.
295aghion et al.: innovation and institutional ownershipvol. 103 no. 1
are significantly less likely to fire their CEOs when there is “bad news.” This is in line with the career concern model presented above and inconsistent with the lazy manager story. Since Figure 1 suggested that institutional ownership mattered when more than 25 percent of the stock was owned by institutions, instead of the continu-ous variable in column 3 as interaction term we use an indicator variable equal to one if institutional owners controlled more than a quarter of shares. The results are very similar.
Column 4 of Table 3 presents a robustness test obtained by restricting the sample to the post-1991 period. If anything, the results are stronger. Since some CEOs also leave their jobs voluntarily, as a control we can test whether institutional ownership affects these voluntary departures also. To do so, we change the dependent variable in column 5 to be voluntary departures only (i.e., all exits except firings). Consistent with our interpretation, the coefficient on the interaction term is insignificant (and has actually a reversed sign).
D. Concentration of Institutional Ownership
In Edmans (2009), the crucial variable is the total amount of equity owned by institutions. In our model, instead, it is the share of a company owned by the insti-tutions collectively (if they can easily coordinate) or by the institution owning the most, if this coordination is prohibitively costly. Since it is debatable how difficult it is to coordinate among large institutions, we will explore both possibilities.
Table 3—Impact of Poor Performance on CEO Firing Lower with More Institutional Owners
Dependent variable CEO firedUnforced CEO exit
(1) (2) (3) (4) (5)Δ(Profits/assets)t−1 −0.479* −1.604*** −1.274*** −1.668** 0.715
(0.251) (0.496) (0.362) (0.690) (1.224)(Share of institutions) 0.025** × Δ(Profits/assets)t−1 (0.010)Share of institutions a −0.037
(0.023)(Share of institutions > 25%) 1.057** 1.364* −0.513 × Δ(Profits/assets)t−1 (0.456) (0.790) (1.294)Share of by institutions > 25% −0.033 −0.040 0.033
(0.021) (0.029) (0.022)
Observations 1,897 1,897 1,897 1,178 1,178
Years 1988–1995 1988–1995 1988–1995 1991–1995 1991–1995
Notes: The dependent variable is 1 if CEO was fired and zero otherwise. CEO firings are from Fisman, Khurana, and Rhodes-Kropf (2005). All regressions include a full set of time dummies and a quadratic in the tenure (in post) of the CEO. Estimation is by probit ML, marginal effects are shown above standard errors (in parentheses) that are clustered by firm. Share of equity owned by institutions is based in 1991 (first year we have ownership data). “Unforced CEO exists” are when the CEO leaves but is not fired (e.g., for reasons of retirement or death). See text and online Data Appendix for full description. 250 firms.
a Coefficient and standard error multiplied by 100.*** Significant at the 1 percent level. ** Significant at the 5 percent level. * Significant at the 10 percent level.
296 THE AMERICAN ECONOMIC REVIEW fEbRuARy 2013
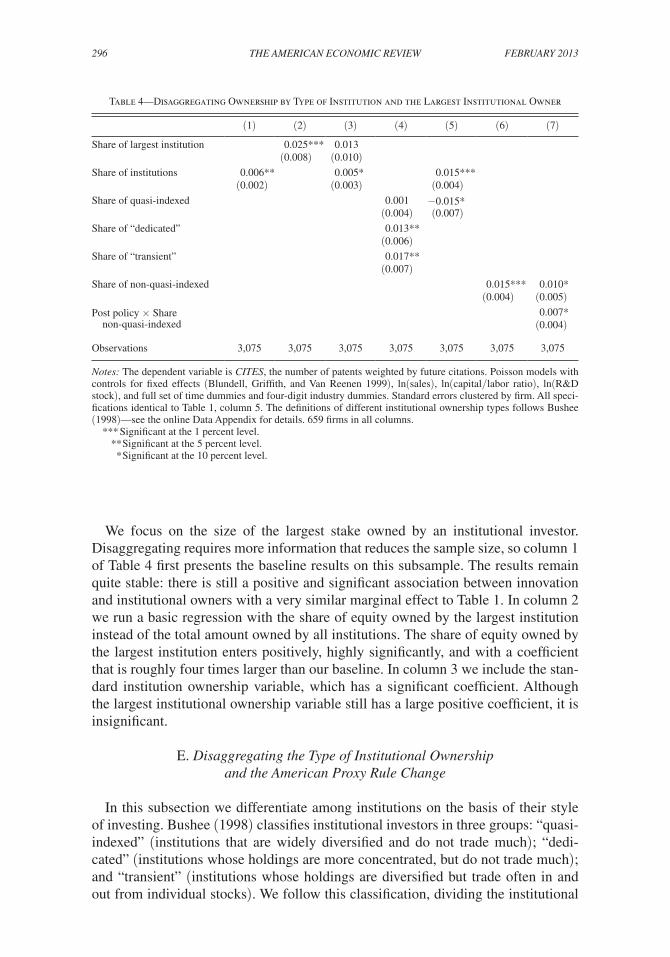
We focus on the size of the largest stake owned by an institutional investor. Disaggregating requires more information that reduces the sample size, so column 1 of Table 4 first presents the baseline results on this subsample. The results remain quite stable: there is still a positive and significant association between innovation and institutional owners with a very similar marginal effect to Table 1. In column 2 we run a basic regression with the share of equity owned by the largest institution instead of the total amount owned by all institutions. The share of equity owned by the largest institution enters positively, highly significantly, and with a coefficient that is roughly four times larger than our baseline. In column 3 we include the stan-dard institution ownership variable, which has a significant coefficient. Although the largest institutional ownership variable still has a large positive coefficient, it is insignificant.
E. Disaggregating the Type of Institutional Ownership and the American Proxy Rule Change
In this subsection we differentiate among institutions on the basis of their style of investing. Bushee (1998) classifies institutional investors in three groups: “quasi-indexed” (institutions that are widely diversified and do not trade much); “dedi-cated” (institutions whose holdings are more concentrated, but do not trade much); and “transient” (institutions whose holdings are diversified but trade often in and out from individual stocks). We follow this classification, dividing the institutional
Table 4—Disaggregating Ownership by Type of Institution and the Largest Institutional Owner
(1) (2) (3) (4) (5) (6) (7)
Share of largest institution 0.025*** 0.013(0.008) (0.010)
Share of institutions 0.006** 0.005* 0.015***(0.002) (0.003) (0.004)
Share of quasi-indexed 0.001 −0.015*(0.004) (0.007)
Share of “dedicated” 0.013**(0.006)
Share of “transient” 0.017**(0.007)
Share of non-quasi-indexed 0.015*** 0.010*(0.004) (0.005)
Post policy × Share 0.007* non-quasi-indexed (0.004)
Observations 3,075 3,075 3,075 3,075 3,075 3,075 3,075
Notes: The dependent variable is CITES, the number of patents weighted by future citations. Poisson models with controls for fixed effects (Blundell, Griffith, and Van Reenen 1999), ln(sales), ln(capital/labor ratio), ln(R&D stock), and full set of time dummies and four-digit industry dummies. Standard errors clustered by firm. All speci-fications identical to Table 1, column 5. The definitions of different institutional ownership types follows Bushee (1998)—see the online Data Appendix for details. 659 firms in all columns. *** Significant at the 1 percent level.
** Significant at the 5 percent level. * Significant at the 10 percent level.
297aghion et al.: innovation and institutional ownershipvol. 103 no. 1
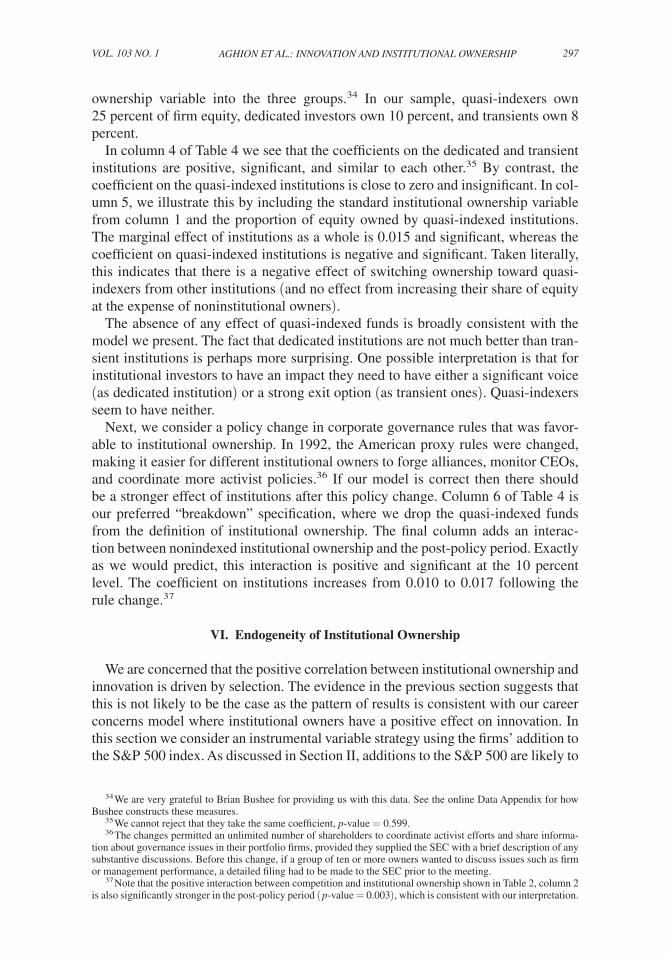
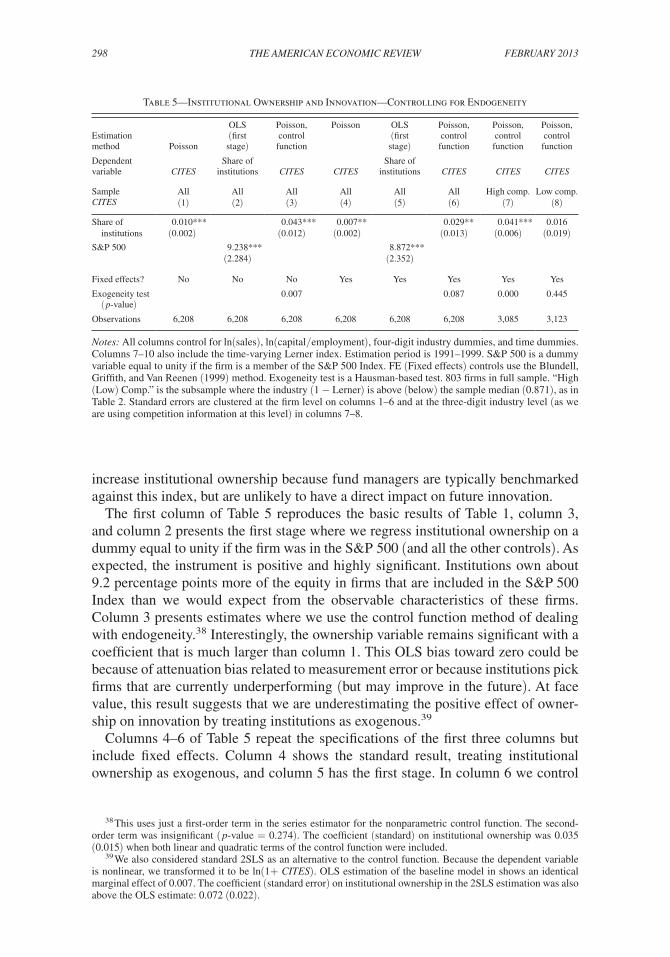
ownership variable into the three groups.34 In our sample, quasi-indexers own 25 percent of firm equity, dedicated investors own 10 percent, and transients own 8 percent.
In column 4 of Table 4 we see that the coefficients on the dedicated and transient institutions are positive, significant, and similar to each other.35 By contrast, the coefficient on the quasi-indexed institutions is close to zero and insignificant. In col-umn 5, we illustrate this by including the standard institutional ownership variable from column 1 and the proportion of equity owned by quasi-indexed institutions. The marginal effect of institutions as a whole is 0.015 and significant, whereas the coefficient on quasi-indexed institutions is negative and significant. Taken literally, this indicates that there is a negative effect of switching ownership toward quasi-indexers from other institutions (and no effect from increasing their share of equity at the expense of noninstitutional owners).
The absence of any effect of quasi-indexed funds is broadly consistent with the model we present. The fact that dedicated institutions are not much better than tran-sient institutions is perhaps more surprising. One possible interpretation is that for institutional investors to have an impact they need to have either a significant voice (as dedicated institution) or a strong exit option (as transient ones). Quasi-indexers seem to have neither.
Next, we consider a policy change in corporate governance rules that was favor-able to institutional ownership. In 1992, the American proxy rules were changed, making it easier for different institutional owners to forge alliances, monitor CEOs, and coordinate more activist policies.36 If our model is correct then there should be a stronger effect of institutions after this policy change. Column 6 of Table 4 is our preferred “breakdown” specification, where we drop the quasi-indexed funds from the definition of institutional ownership. The final column adds an interac-tion between nonindexed institutional ownership and the post-policy period. Exactly as we would predict, this interaction is positive and significant at the 10 percent level. The coefficient on institutions increases from 0.010 to 0.017 following the rule change.37
VI. Endogeneity of Institutional Ownership
We are concerned that the positive correlation between institutional ownership and innovation is driven by selection. The evidence in the previous section suggests that this is not likely to be the case as the pattern of results is consistent with our career concerns model where institutional owners have a positive effect on innovation. In this section we consider an instrumental variable strategy using the firms’ addition to the S&P 500 index. As discussed in Section II, additions to the S&P 500 are likely to
34 We are very grateful to Brian Bushee for providing us with this data. See the online Data Appendix for how Bushee constructs these measures.
35 We cannot reject that they take the same coefficient, p-value = 0.599.36 The changes permitted an unlimited number of shareholders to coordinate activist efforts and share informa-
tion about governance issues in their portfolio firms, provided they supplied the SEC with a brief description of any substantive discussions. Before this change, if a group of ten or more owners wanted to discuss issues such as firm or management performance, a detailed filing had to be made to the SEC prior to the meeting.
37 Note that the positive interaction between competition and institutional ownership shown in Table 2, column 2 is also significantly stronger in the post-policy period ( p-value = 0.003), which is consistent with our interpretation.
298 THE AMERICAN ECONOMIC REVIEW fEbRuARy 2013
increase institutional ownership because fund managers are typically benchmarked against this index, but are unlikely to have a direct impact on future innovation.
The first column of Table 5 reproduces the basic results of Table 1, column 3, and column 2 presents the first stage where we regress institutional ownership on a dummy equal to unity if the firm was in the S&P 500 (and all the other controls). As expected, the instrument is positive and highly significant. Institutions own about 9.2 percentage points more of the equity in firms that are included in the S&P 500 Index than we would expect from the observable characteristics of these firms. Column 3 presents estimates where we use the control function method of dealing with endogeneity.38 Interestingly, the ownership variable remains significant with a coefficient that is much larger than column 1. This OLS bias toward zero could be because of attenuation bias related to measurement error or because institutions pick firms that are currently underperforming (but may improve in the future). At face value, this result suggests that we are underestimating the positive effect of owner-ship on innovation by treating institutions as exogenous.39
Columns 4–6 of Table 5 repeat the specifications of the first three columns but include fixed effects. Column 4 shows the standard result, treating institutional ownership as exogenous, and column 5 has the first stage. In column 6 we control
38 This uses just a first-order term in the series estimator for the nonparametric control function. The second-order term was insignificant ( p-value = 0.274). The coefficient (standard) on institutional ownership was 0.035 (0.015) when both linear and quadratic terms of the control function were included.
39 We also considered standard 2SLS as an alternative to the control function. Because the dependent variable is nonlinear, we transformed it to be ln(1+ CITES). OLS estimation of the baseline model in shows an identical marginal effect of 0.007. The coefficient (standard error) on institutional ownership in the 2SLS estimation was also above the OLS estimate: 0.072 (0.022).
Table 5—Institutional Ownership and Innovation—Controlling for Endogeneity
Estimation method Poisson
OLS (first stage)
Poisson, control function
Poisson OLS (first stage)
Poisson, control function
Poisson, control function
Poisson, control function
Dependent variable CITES
Share of institutions CITES CITES
Share of institutions CITES CITES CITES
Sample All All All All All All High comp. Low comp.CITES (1) (2) (3) (4) (5) (6) (7) (8)
Share of 0.010*** 0.043*** 0.007** 0.029** 0.041*** 0.016 institutions (0.002) (0.012) (0.002) (0.013) (0.006) (0.019)S&P 500 9.238*** 8.872***
(2.284) (2.352)
Fixed effects? No No No Yes Yes Yes Yes Yes
Exogeneity test ( p-value)
0.007 0.087 0.000 0.445
Observations 6,208 6,208 6,208 6,208 6,208 6,208 3,085 3,123
Notes: All columns control for ln(sales), ln(capital/employment), four-digit industry dummies, and time dummies. Columns 7–10 also include the time-varying Lerner index. Estimation period is 1991–1999. S&P 500 is a dummy variable equal to unity if the firm is a member of the S&P 500 Index. FE (Fixed effects) controls use the Blundell, Griffith, and Van Reenen (1999) method. Exogeneity test is a Hausman-based test. 803 firms in full sample. “High (Low) Comp.” is the subsample where the industry (1 − Lerner) is above (below) the sample median (0.871), as in Table 2. Standard errors are clustered at the firm level on columns 1–6 and at the three-digit industry level (as we are using competition information at this level) in columns 7–8.
299aghion et al.: innovation and institutional ownershipvol. 103 no. 1
for the endogeneity, and again, the coefficient on ownership remains positive and significant with a higher marginal effect than column 4. Note, however, that exoge-neity is not rejected at the 5 percent level in column 6, whereas it is rejected at the 1 percent level in column 3. This suggests that the fixed effects deal with a substantial part of the endogeneity bias, and to the extent it is a problem the bias causes us to underestimate the importance of institutions.40 The two columns of Table 5 split the sample into industries with high and low competition, as in Table 2. Consistent with the earlier results, the coefficient on institutional ownership is large and significant only for firms facing high levels of product market competition (and the instrument is significant in both first stages).
A concern with this instrumental variable (IV) strategy in Table 5 is that the first stage could be driven solely by the quasi-indexers, which appear to have little asso-ciation with innovation. Running the first stage of Table 5, column 2 but replacing the dependent variable with just ownership of nonindexed institutions still gener-ates a positive and significant coefficient on the S&P 500 instrument (a coefficient of 2.731 with a standard error of 0.650). This is lower than for quasi-indexers, but is still significant.41 In the Poisson model equivalent of column 3, the coefficient (standard error) on nonindexed institutions is 0.083 (0.037). Thus, even this refined institutional ownership variable has a large and significant effect on innovation.
While the inclusion to the S&P 500 should be orthogonal to a firm’s future per-formance, it is not completely random. Standard and Poor’s wants to ensure that the index is representative and that it is relatively stable over time. Hence, it avoids choos-ing companies that are at serious risk of bankruptcy and prefers large companies with good past performance. Thus, in order to be included in the S&P 500 index, a com-pany must have been small in the past (which explains why it was not already in the index) and large today. Given these rules, it is not surprising that companies that are added experience, on average, large stock returns in the three years preceding their inclusion. As a result, the apparent effect of S&P 500 addition on innovation could be purely spurious, due to the fact that stock performance anticipates the rise in innova-tion. To test this, we control for the cumulative stock returns over the previous three years as an additional variable. Although the coefficient on the run-up is positive (a coefficient of 0.116 with a standard error or 0.023), the coefficient on institutional ownership remains significant (a coefficient of 0.008 with a standard error of 0.002).
To further validate the quality of the instrument, we perform a small event study on the change in institutional ownership and cite-weighted patents around the time a stock is added to the S&P 500 index. We use a window of seven years, three years prior to the year when the firm was added, the year itself, and three years after the firm was added (a similar story emerges from adding or subtracting an extra year to
40 A concern with this IV strategy is that the treatment firms (which joined the S&P 500) are not well matched with the rest of the sample (the implicit control group). To examine this, we use a propensity score matching tech-nique. We estimate the propensity to join the S&P 500 as a function of the exogenous firm characteristics (including fixed effects). Very few firms that are members of the S&P 500 have a predicted probability below 0.24 (roughly the sample median). Hence, we trim the sample below this threshold so that treatment and control have common support and reestimate the IV results on this subsample. The results (not reported) are very similar: we estimate a treatment effect of 0.026 (standard error = 0.013) on this subsample of 3,099 observations compared to 0.029 (standard error = 0.013) on the full sample of 6,028.
41 If we use quasi-indexers as the dependent variable in the first stage, the coefficient on the S&P 500 dummy is much larger: 8.446 with a standard error of 0.636.
300 THE AMERICAN ECONOMIC REVIEW fEbRuARy 2013
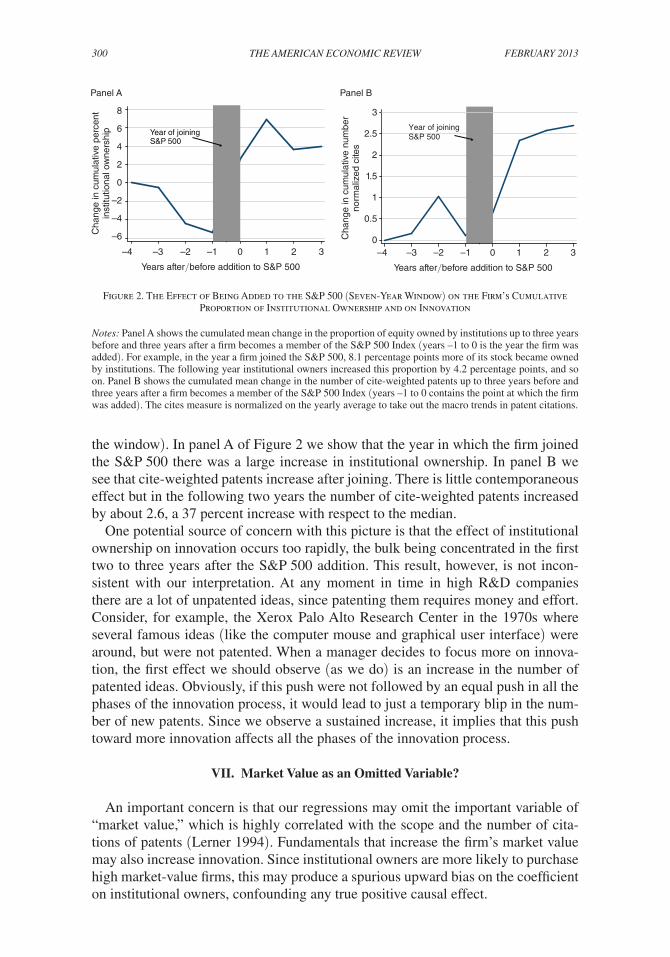
the window). In panel A of Figure 2 we show that the year in which the firm joined the S&P 500 there was a large increase in institutional ownership. In panel B we see that cite-weighted patents increase after joining. There is little contemporaneous effect but in the following two years the number of cite-weighted patents increased by about 2.6, a 37 percent increase with respect to the median.
One potential source of concern with this picture is that the effect of institutional ownership on innovation occurs too rapidly, the bulk being concentrated in the first two to three years after the S&P 500 addition. This result, however, is not incon-sistent with our interpretation. At any moment in time in high R&D companies there are a lot of unpatented ideas, since patenting them requires money and effort. Consider, for example, the Xerox Palo Alto Research Center in the 1970s where several famous ideas (like the computer mouse and graphical user interface) were around, but were not patented. When a manager decides to focus more on innova-tion, the first effect we should observe (as we do) is an increase in the number of patented ideas. Obviously, if this push were not followed by an equal push in all the phases of the innovation process, it would lead to just a temporary blip in the num-ber of new patents. Since we observe a sustained increase, it implies that this push toward more innovation affects all the phases of the innovation process.
VII. Market Value as an Omitted Variable?
An important concern is that our regressions may omit the important variable of “market value,” which is highly correlated with the scope and the number of cita-tions of patents (Lerner 1994). Fundamentals that increase the firm’s market value may also increase innovation. Since institutional owners are more likely to purchase high market-value firms, this may produce a spurious upward bias on the coefficient on institutional owners, confounding any true positive causal effect.
Year of joining S&P 500
8
6
4
2
0
–2
–4
–6
–4 –3 –2 –1 0 1 2 3
Years after/before addition to S&P 500
Cha
nge
in c
umul
ativ
e pe
rcen
t in
stitu
tiona
l ow
ners
hip Year of joining
S&P 500
3
2.5
2
1.5
1
0.5
0–4 –3 –2 –1 0 1 2 3
Cha
nge
in c
umul
ativ
e nu
mbe
r no
rmal
ized
cite
s
Years after/before addition to S&P 500
Panel A Panel B
Figure 2. The Effect of Being Added to the S&P 500 (Seven-Year Window) on the Firm’s Cumulative Proportion of Institutional Ownership and on Innovation
Notes: Panel A shows the cumulated mean change in the proportion of equity owned by institutions up to three years before and three years after a firm becomes a member of the S&P 500 Index (years –1 to 0 is the year the firm was added). For example, in the year a firm joined the S&P 500, 8.1 percentage points more of its stock became owned by institutions. The following year institutional owners increased this proportion by 4.2 percentage points, and so on. Panel B shows the cumulated mean change in the number of cite-weighted patents up to three years before and three years after a firm becomes a member of the S&P 500 Index (years –1 to 0 contains the point at which the firm was added). The cites measure is normalized on the yearly average to take out the macro trends in patent citations.

301aghion et al.: innovation and institutional ownershipvol. 103 no. 1
We try to control for this potential bias in several ways. First, our basic approach is to condition on many of the observables correlated with the firm’s value, such as sales, capital intensity, and fixed effects. Yet one could still object that this does not ade-quately control for the potentially omitted variable (firm value). Second, we explore explicitly conditioning on stock market–based proxies of firm value such as Tobin’s average q. This approach has the problem that since innovation (i.e., citations) tends to increase stock market value, then Tobin’s q will be endogenous in the regression and this will bias the coefficient on institutional ownership. Fortunately, this bias is in the opposite direction to the omitted variable bias, meaning that inclusion of Tobin’s average q will bias the coefficient on institutional ownership downward. So, to the extent that we have not sufficiently controlled for innovation-relevant market value, its inclusion should give us a lower bound for the effect of institutions.
Table 6 contains the results from this experiment. Column 1 contains the basic results when we include Tobin’s q. As expected, market value is positive and highly significant. The coefficient on institutional ownership declines only slightly from the baseline specification from (0.0074 to 0.0069). Columns 2 and 3 split the sample into high- and low-competition regimes and again show that institutional ownership is complementary with competition in stimulating innovation. Columns 4–6 repeat these specifications but also control for the endogeneity of institutional ownership by including the control function. Columns 7–9 repeat the specifications of the first three columns but use an alternative functional form for Tobin’s q by using just ln(stock market value) and not normalizing by capital. The pattern is qualitatively very similar to the earlier columns.42
42 We also conducted many other experiments such as including longer lags of Tobin’s q, simultaneously includ-ing current and lagged q, including higher-order terms in q, etc. The institutional ownership variable was robust
Table 6—Controlling for Firm Value
Estimation method Poisson Poisson Poisson
Poisson, control function
Poisson, control function
Poisson, control function Poisson Poisson Poisson
Dependent variable CITES CITES CITES CITES CITES CITES CITES CITES CITES
Sample All High comp. Low comp. All High comp. Low comp. All High comp. Low comp.(1) (2) (3) (4) (5) (6) (7) (8) (9)
Share of 0.007*** 0.009*** 0.002** 0.033** 0.054*** 0.021 0.005** 0.007*** 0.001 institutions (0.002) (0.001) (0.001) (0.014) (0.005) (0.021) (0.002) (0.001) (0.001)Tobin’s q 0.062*** 0.068*** 0.047** 0.041*** 0.025*** 0.036**
(0.010) (0.004) (0.022) (0.014) (0.004) (0.016)ln(Stock market 0.294*** 0.283*** 0.285** value) (0.050) (0.019) (0.119)
Exogeneity test ( p-value)
0.037 0.000 0.368
Observations 6,208 3,085 3,123 6,208 3,085 3,123 6,208 3,085 3,123
Notes: Dependent variable is CITES in all columns. Coefficients above standard errors (clustered by firm). All col-umns control for ln(sales), ln(capital/employment), four-digit industry dummies, time dummies, and fixed effects (using the Blundell, Griffith, and Van Reenen (1999) method). Columns 2, 3, 5, 6, 8, and 9 also include the time-varying Lerner index. Estimation period is 1991–1999. Exogeneity test is a Hausman-based test. 803 firms. Column 4 corresponds to the specification of Table 5, column 6 with additional control variables as indicated. Tobin’s q is the ratio of stock market value to fixed capital and ln(V) is the logarithm of stock market value. “High (Low) Comp.” is the subsample where the industry (1 − Lerner) is above (below) the sample median (0.871), as in Table 2. Standard errors are clustered at the firm level on columns 1, 4, and 7 and at the three-digit industry level (as we are using competition information at this level) in all other columns.
302 THE AMERICAN ECONOMIC REVIEW fEbRuARy 2013
An alternative approach to tackling this problem is to deal with it more directly. Assume that the potentially omitted variable is a higher valuation of the existing patents that simultaneously affects the value of the firm, the value (and thus cita-tions) of future patents, and the amount of institutional ownership. In this case we can control directly for the value of the stock of the existing patents by including on the right-hand side the future citations of the existing stock of patents, which differs from the future citations of the new patents (our dependent variable). Because we use only citations to the firm’s current patents, this should not be a major problem, but we can explicitly control for this issue by conditioning on the number of future citations to the firm’s lagged patent stock. We implement this idea by constructing a variable that is the future citations (from the current period onward to 2002, just as we have done for the dependent variable) to the lagged patent stock, defined as all of the firms’ patents from 1963 to the previous year. The coefficient on this variable is positive but insignificant and the key coefficient on institutional ownership falls only slightly from the baseline. For example, in a specification equivalent to column 1 of Table 6, the coefficient moves from 0.0074 to 0.0072.43
Taking Table 6 as a whole, institutional ownership seems to have a robust and positive effect on innovation across all the specifications (except sometimes in the low-competition subsample, as the theory would predict).
VIII. Conclusions
Given the importance of innovation for growth and the wealth of nations, it is par-amount to understand the incentives to innovate at the firm level. This paper tries to do so by studying the relationship between innovation and institutional ownership.
Contrary to the view that institutional ownership induces a short-term focus in managers, we find that their presence boosts innovation, even after accounting for an increase in R&D and the potential endogeneity of institutional ownership. This posi-tive impact could derive from the disciplinary effect of institutions on lazy managers or from the reassurance they provide to managers concerned about their careers. We develop a simple model that nests these two hypotheses, and are able to derive three implications to distinguish between them. In all three cases, the data seems to support the career concern model and reject the lazy manager one. Institutions are more impor-tant for innovation when product market competition is higher and when managers are less entrenched. Moreover, the probability of CEO firing after poor performance is reduced with more institutional ownership. The evidence from disaggregating institu-tional ownership, using policy changes and membership of the S&P 500 as an instru-ment, suggest that these relationships do not simply arise from endogenous selection.
These results suggest that risk considerations at the managerial level play an impor-tant role in preventing innovation. Given the positive externality that innovation entails (see Bloom, Schankerman, and Van Reenen 2007), it might be useful to think
to all these experiments. For example, repeating specifications (4)–(6) of Table 6 but allowing for endogeneity using the S&P 500 instrument (as in Table 5) led to coefficients(standard errors) on institutional ownership of 0.033 (0.017) in the pooled sample, 0.076 (0.009) in the high-competition sample, and 0.019 (0.022) in the low-competition sample.
43 A problem with using the stock back to 1963 is that citations to older patents may be rare, so we instead con-sidered citations to the patent stock defined as only those over the previous 15 years. Again, the results were similar.
303aghion et al.: innovation and institutional ownershipvol. 103 no. 1
about public policies able to reduce the innovation risk for managers of publicly traded companies, such as greater board representation of institutional investors.
Our work has implications for corporate governance. If career concerns, not the desire to live a quiet life or empire-build, are the main source of managerial agency problems, many of the public policy prescriptions change. For example, boards composed mostly of outsiders can jeopardize the ability of the board to separate luck from skill in CEO performance, increasing her risk aversion and jeopardizing innovation (Adams and Ferreira 2007).
There are many directions in which this research could be taken. One potentially important omission is that we abstracted from the impact of institutional owners on the design of contracts to overcome disincentives to innovate (and how this interacts with competition). This would be a fruitful line of future research currently pursued by Manso (2011) and Holden (2008).
REFERENCES
Adams, Renee B., and Daniel Ferreira. 2007. “A Theory of Friendly Boards.” Journal of Finance 62 (1): 217–50.
Aghion, Philippe, Nick Bloom, Richard Blundell, Rachel Griffith, and Peter Howitt. 2005. “Competi-tion and Innovation: An Inverted-U Relationship.” Quarterly Journal of Economics 120 (2): 701–28.
Aghion, Philippe, John Van Reenen, and Luigi Zingales. 2013. “Innovation and Institutional Owner-ship: Dataset.” American Economic Review. http://dx.doi.org/10.1257.aer.103.1.277.
Alcácer, Juan, Michelle Gittelman, and Bhaven Sampat. 2008. “Applicant and Examiner Citations in US Patents: An Overview and Analysis.” Harvard Business School Working Paper 09-016.
Bartel, Ann P., and Frank R. Lichtenberg. 1987. “The Comparative Advantage of Educated Workers in Implementing New Technology.” Review of Economics and Statistics 69 (1): 1–11.
Becker-Blease, John R. 2011. “Governance and Innovation.” Journal of Corporate Finance 17 (4): 947–58.
Bertrand, Marianne, and Sendhil Mullainathan. 2003. “Enjoying the Quiet Life? Corporate Gover-nance and Managerial Preferences.” Journal of Political Economy 111 (5): 1043–75.
Bloom, Nick, Mark Schankerman, and John Van Reenen. 2007. “Identifying Technology Spillovers and Product Market Rivalry.” National Bureau of Economic Research Working Paper 13060.
Blundell, Richard, Rachel Griffith, and John Van Reenen. 1999. “Market Share, Market Value and Innovation in a Panel of British Manufacturing Firms.” Review of Economic Studies 66 (3): 529–54.
Blundell, Richard, Rachel Griffith, and Frank Windmeijer. 2002. “Individual Effects and Dynamics in Count Data Models.” Journal of Econometrics 108 (1): 113–31.
Blundell, Richard W., and James L. Powell. 2004. “Endogeneity in Semiparametric Binary Response Models.” Review of Economic Studies 71 (3): 655–79.
Bushee, Brian J. 1998. “The Influence of Institutional Investors on Myopic R&D Investment Behav-ior.” Accounting Review 73 (3): 305–33.
Chemmanur, Thomas J., and Xuan Tian. 2011. “Peer Monitoring and Syndicate Formation: Theory and Evidence on Venture Capital Syndicates and the Dynamics of VC Interactions.” Unpublished.
Clay, Darin. 2001. “Institutional Ownership and Firm Value.” Unpublished.Compact Disclosure. Selected financial information found in the SEC filings of U.S. publicly traded
companies. http://www.library.hbs.edu/go/compactdisclosure.htm.Compustat. Standard and Poor’s company accounts dataset of US Publicly listed companies.
http://en.wikipedia.org/wiki/Compustat. Cremers, K. J. Martijn, and Vinay B. Nair. 2005. “Governance Mechanisms and Equity Prices.” Jour-
nal of Finance 60 (6): 2859–94.Del Guercio, Diane. 1996. “The Distorting Effect of the Prudent-Man Laws on Institutional Equity
Investments.” Journal of Financial Economics 40 (1): 31–62.Edmans, Alex. 2009. “Blockholder Trading, Market Efficiency, and Managerial Myopia.” Journal of
Finance 64 (6): 2481–2513.Eng, Li, and Margaret Shackell. 2001. “The Implications of Long-Term Performance Plans and Institu-
tional Ownership for Firms’ Research and Development (R&D) Investments.” Journal of Account-ing, Auditing and Finance 16 (2): 117–39.
304 THE AMERICAN ECONOMIC REVIEW fEbRuARy 2013
Execucomp. Details of the identity and remuneration packages of the top five executives in the Stan-dard and Poor’s Compustat company accounts dataset. http://www.compustat.com/products.aspx?id=2147492873.
Fisman, Ray, Rakesh Khurana, and Matthew Rhodes-Kropf. 2005. “Governance and CEO Turnover: Do Something or Do the Right Thing?” Unpublished.
Francis, Jennifer, and Abbie Smith. 1995. “Agency Costs and Innovation: Some Empirical Evidence.” Journal of Accounting and Economics 19 (2–3): 383–409.
Froot, Kenneth A., David S. Scharfstein, and Jeremy C. Stein. 1992. “Herd on the Street: Informa-tional Inefficiencies in a Market with Short-Term Speculation.” Journal of Finance 47 (4): 1461–84.
Gibbons, Robert, and Lawrence F. Katz. 1992. “Does Unmeasured Ability Explain Inter-Industry Wage Differentials?” Review of Economic Studies 59 (3): 515–35.
Gibbons, Robert, and Kevin J. Murphy. 1992. “Optimal Incentive Contracts in the Presence of Career Concerns: Theory and Evidence.” Journal of Political Economy 100 (3): 468–505.
Gompers, Paul A., and Andrew Metrick. 2001. “Institutional Investors and Equity Prices.” Quarterly Journal of Economics 116 (1): 229–59.
Gompers, Paul, Joy Ishii, and Andrew Metrick. 2003. “Corporate Governance and Equity Prices.” Quarterly Journal of Economics 118 (1): 107–55.
Grossman, Gene M., and Elhanan Helpman. 1991. “Quality Ladders and Product Cycles.” Quarterly Journal of Economics 106 (2): 557–86.
Hall, Bronwyn H., Adam B. Jaffe, and Manuel Trajtenberg. 2001. “The NBER Patent Citation Data File: Lessons, Insights and Methodological Tools.” National Bureau of Economic Research Work-ing Paper 8498.
Hall, Bronwyn H., Adam Jaffe, and Manuel Trajtenberg. 2005. “Market Value and Patent Citations.” RAND Journal of Economics 36 (1): 16–38.
Hall, Bronwyn H., and Josh Lerner. 2009. “The Financing of R&D and Innovation.” National Bureau of Economic Research Working Paper 15325.
Hart, Oliver D. 1983. “The Market Mechanism as an Incentive Scheme.” Bell Journal of Economics 14 (2): 366–82.
Hausman, Jerry, Bronwyn H. Hall, and Zvi Griliches. 1984. “Econometric Models for Count Data with an Application to the Patents-RD Relationship.” Econometrica 52 (4): 909–38.
Holden, Richard. 2008. “Does Competition Make Firms More Efficient?” Unpublished.Holmström, Bengt, ed. 1982. “Managerial Incentive Problems: A Dynamic Perspective.” In Essays in Eco-
nomics and Management in Honor of Lars Wahlbeck, 1–19. Helsinki: Swedish School of Economics.Kaplan, Steven, and Bernadette Minton. 2006. “How Has CEO Turnover Changed? Increasingly Per-
formance Sensitive Boards and Increasingly Uneasy CEOs.” Unpublished.Krueger, Alan B., and Lawrence H. Summers. 1988. “Efficiency Wages and the Inter-Industry Wage
Structure.” Econometrica 56 (2): 259–93.Lerner, Joshua. 1994. “The Importance of Patent Scope: An Empirical Analysis.” RAND Journal of
Economics 25 (2): 319–33.Lerner, Joshua, and Julie Wulf. 2007. “Innovation and Incentives: Evidence from Corporate R&D.”
Review of Economics and Statistics 89 (4): 634–44.Manso, Gustavo. 2011. “Motivating Innovation.” Journal of Finance 66 (5): 1823–60.Maskin, Eric, and Jean Tirole. 1999. “Unforeseen Contingencies and Incomplete Contracts.” Review
of Economic Studies 66 (1): 83–114.Nickell, Steven J. 1996. “Competition and Corporate Performance.” Journal of Political Economy 104
(4): 724–46.Porter, Michael. 1992. “Capital Disadvantage: America’s Failing Capital Investment System.” Harvard
Business Review 70 (5): 65–82.Pruitt, Stephen W., and K. C. John Wei. 1989. “Institutional Ownership and Changes in the S&P 500.”
Journal of Finance 44 (2): 509–13.Sapra, Haresh, Ajay Subramanian, and Krishnamurthy Subramanian. 2008. “Corporate Governance
and Innovation.” Unpublished.Schmidt, Klaus M. 1997. “Managerial Incentives and Product Market Competition.” Review of Eco-
nomic Studies 64 (2): 191–213.Tribo, Joseph A., Pascual Berrone, and Jordi Surroca. 2007. “Do the Type and Number of Blockhold-
ers Influence R&D Investments? New Evidence from Spain.” Corporate Governance: An Interna-tional Review 15 (5): 828–42.
Xiao, Gang. 2010. “International Corporate Governance and Firm Innovation.” Unpublished.Xu, Moqi. 2009. “CEO Employment Contract Horizon and Myopic Behavior.” INSEAD Working Paper.Zwiebel, Jeffrey. 1995. “Corporate Conservatism and Relative Compensation.” Journal of Political
Economy 103 (1): 1–25.
This article has been cited by:
1. Brian D. Bell,, John Van Reenen. 2013. Extreme Wage Inequality: Pay at the Very Top. AmericanEconomic Review 103:3, 153-157. [Abstract] [View PDF article] [PDF with links]