innovation in motion: electrification
TRANSCRIPT
INNOVATION IN MOTION:ELECTRIFICATION
Monday, June 28 | 8:30 AM EDT

FORWARD LOOKING STATEMENTS
This presentation, as well as other statements made by Aptiv PLC (the “Company”), contain forward-looking statements that reflect, when made, the Company’s current views with
respect to current events, certain investments and acquisitions and financial performance. Such forward-looking statements are subject to many risks, uncertainties and factors
relating to the Company’s operations and business environment, which may cause the actual results of the Company to be materially different from any future results. All
statements that address future operating, financial or business performance or the Company’s strategies or expectations are forward-looking statements. Factors that could cause
actual results to differ materially from these forward-looking statements include, but are not limited to, the following: global and regional economic conditions, including conditions
affecting the credit market; uncertainties posed by the novel coronavirus (COVID-19) pandemic and the difficulty in predicting its future course and its impact on the global
economy and the Company’s future operations; fluctuations in interest rates and foreign currency exchange rates; the cyclical nature of global automotive sales and production; the
potential disruptions in the supply of and changes in the competitive environment for raw material integral to the Company’s products; the Company’s ability to maintain contracts
that are critical to its operations; potential changes to beneficial free trade laws and regulations such as the United States-Mexico-Canada Agreement; the ability of the Company to
integrate and realize the expected benefits of recent transactions; the ability of the Company to attract, motivate and/or retain key executives; the ability of the company to avoid
or continue to operate during a strike, or potential work stoppage or slow down by any of its unionized employees or those of its principal customers; and the ability of the
Company to attract and retain customers. Additional factors are discussed under the captions “Risk Factors” and “Management’s Discussion and Analysis of Financial Condition and
Results of Operations” in the Company’s filings with the Securities and Exchange Commission. New risks and uncertainties arise from time to time, and it is impossible for us to
predict these events or how they may affect the Company. It should be remembered that the price of the ordinary shares and any income from them can go down as well as up. The
Company disclaims any intention or obligation to update or revise any forward-looking statements, whether as a result of new information, future events and/or otherwise, except
as may be required by law.

APTIV’S RIGHT TO PLAY
B I L L P R E S L E Y

APTIV PERFECTLY POSITIONED FOR GREATER VEHICLE ELECTRIFICATION
=
FULL SYSTEM-LEVEL CAPABILITIES100+YEARS OF AUTOMOTIVE ENGINEERING EXPERIENCE
+
UNIQUE TECHNOLOGY PORTFOLIO
NERVOUS SYSTEMSIGNAL & POWER SOLUTIONS (S&PS)
BRAINADVANCED SAFETY
& USER EXPERIENCE
(AS&UX)

SIGNAL & POWER SOLUTIONS
GLOBAL ARCHITECTURE AND COMPONENTS LEADER IN:
HIGH SPEED / FIDELITY DATA DISTRIBUTION
MULTI-VOLTAGE ELECTRICAL DISTRIBUTION
AUTOMOTIVE-GRADE INTERCONNECTS
ENGINEERED FASTENING SOLUTIONS


EXPANDING LEADERSHIP POSITION IN LOW AND HIGH POWER SOLUTIONS
LOW VOLTAGE
Unique design, systems integration, and optimization capabilities
Global footprint and quality manufacturing
CONTENT ON
1 OUT OF 3.5GLOBAL VEHICLES
HIGH VOLTAGE
Leveraging our global scale and capabilities in low voltage
Content and margin accretive to S&PS and total Aptiv
CONTENT ON
1 OUT OF 22020-2022 BEV VEHICLES

HIGH VOLTAGE BUSBARS
HIGH VOLTAGE CONNECTORS
INTERNAL BATTERY CONNECTIONS
CHARGING CABLE SETS AND INLETS
CHARGER
HIGH VOLTAGE CABLES
POWER DISTRIBUTION BOXES AND BATTERY DISCONNECT UNITS

BROADEST AND MOST RELEVANT PORTFOLIO OF HIGH VOLTAGE TECHNOLOGIES
ADDRESSABLE CPV*
LOW VOLTAGE
• Low Voltage Wiring
• Low Voltage Connectors
• Cable Management
DECREMENTAL CONTENT
– Engine Harness
– ICE Device Connector
HIGH VOLTAGE
+ High Voltage Cables
+ High Voltage Connectors
+ High Voltage Busbars
+ Battery Disconnect Units (BDU)
+ Power Distribution Boxes (PDB)
+ Charger & Charging Cable Set/Inlet
+ HV Cable Management Solutions
TOTAL NET CPV** Midpoint of total addressable content per vehicle (CPV).
+ $500
– $150
+ $850
= $1200
TRADITIONAL INTERNAL COMBUSTION ENGINE (ICE)
BATTERY ELECTRIC

PROVIDING END-TO-END SOLUTIONS THAT ENABLE A MORE EFFICIENT PATH TO VEHICLE ELECTRIFICATION
FULL SYSTEM-LEVEL CAPABILITIES TECHNOLOGY INNOVATION
ARCHITECTURE OPTIMIZATION
GLOBAL SCALE & MFG EXCELLENCE

INNOVATIONS SOLVING CUSTOMER CHALLENGES
CUSTOMER CHALLENGES
FASTER CHARGING RELIABILITY / PERFORMANCE PACKAGING / WEIGHT / COSTS SAFETY / SECURITY

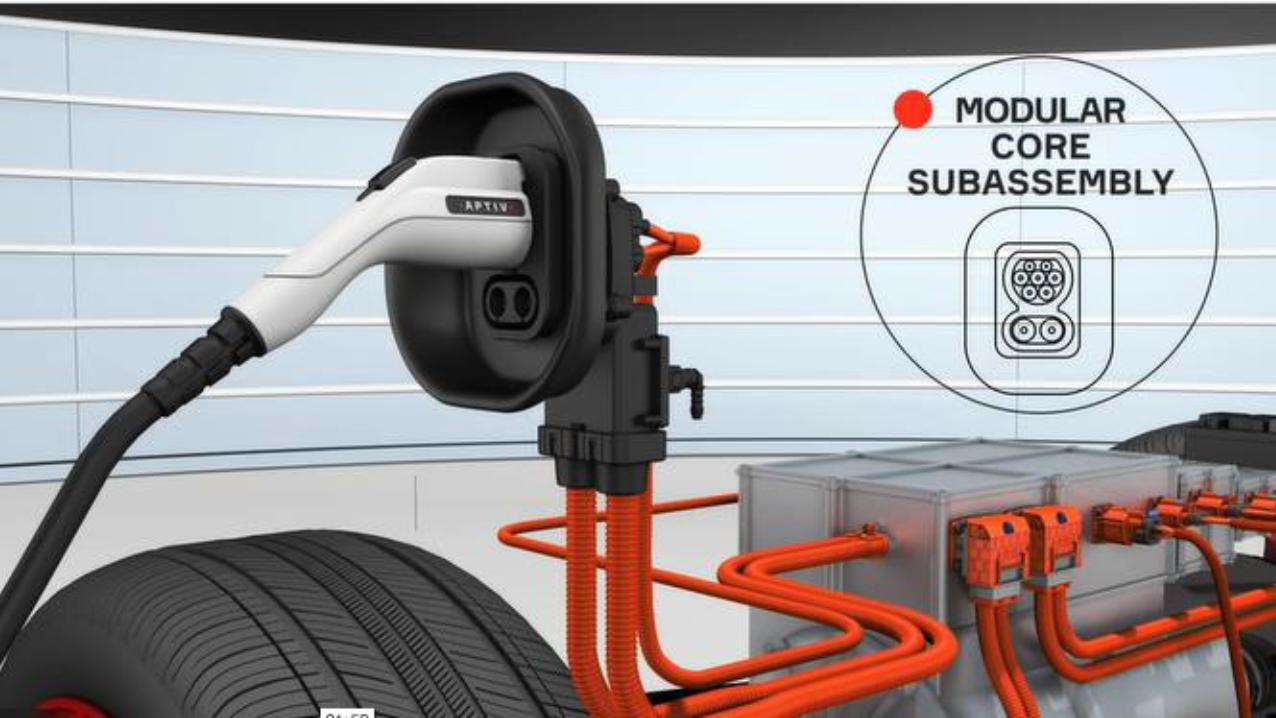


INNOVATIONS SOLVING CUSTOMER CHALLENGES
• 32 AMP CHARGER
• ACTIVE COOLED INLETS
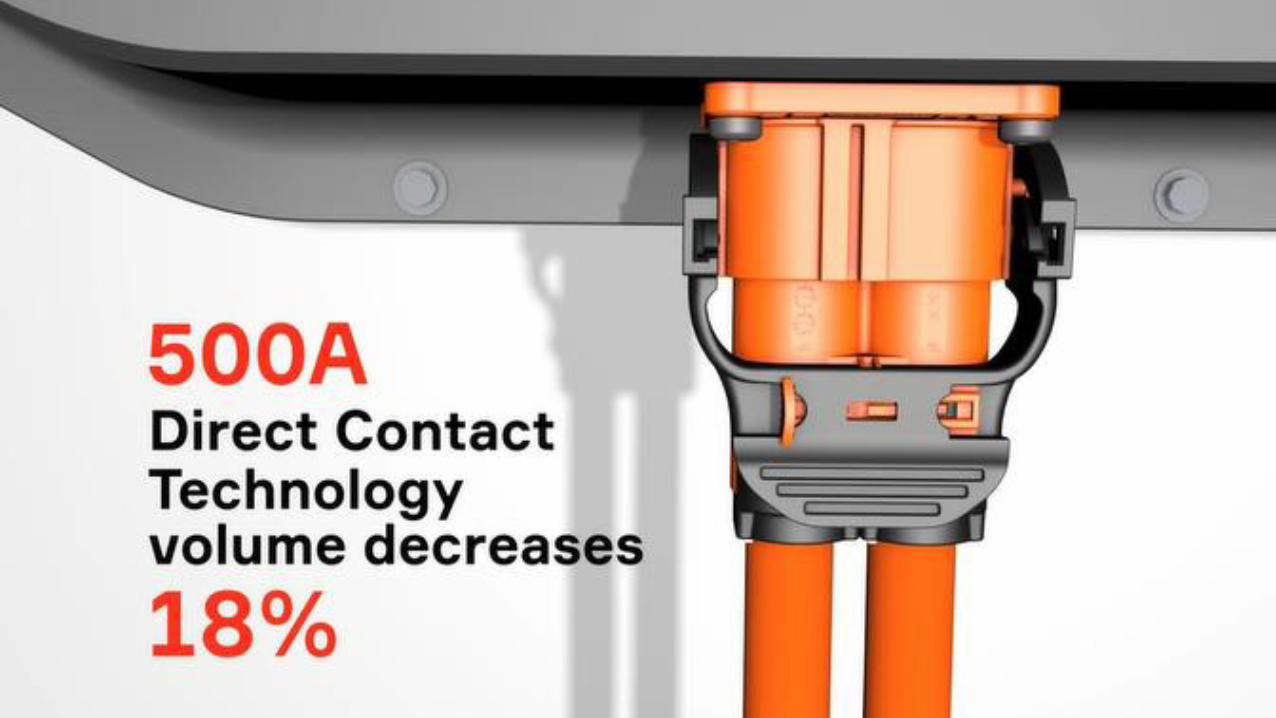
• 400 AMP INTERCONNECTS
• DIRECT CONTACT TECHNOLOGY
ENABLING ARCHITECTURE OPTIMIZATIONDESIGN FOR AUTOMATION VERTICAL INTEGRATION
CUSTOMER CHALLENGES
FASTER CHARGING RELIABILITY / PERFORMANCE PACKAGING / WEIGHT / COSTS SAFETY / SECURITY
APTIV SOLUTIONS
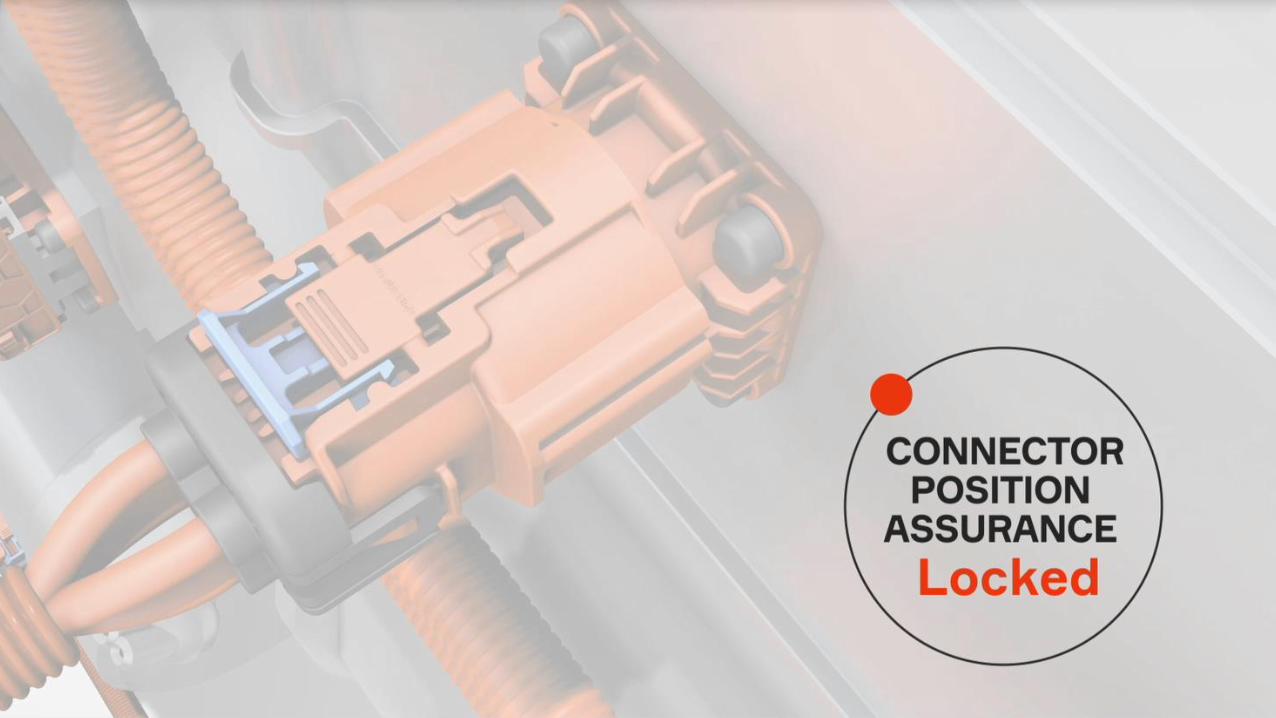
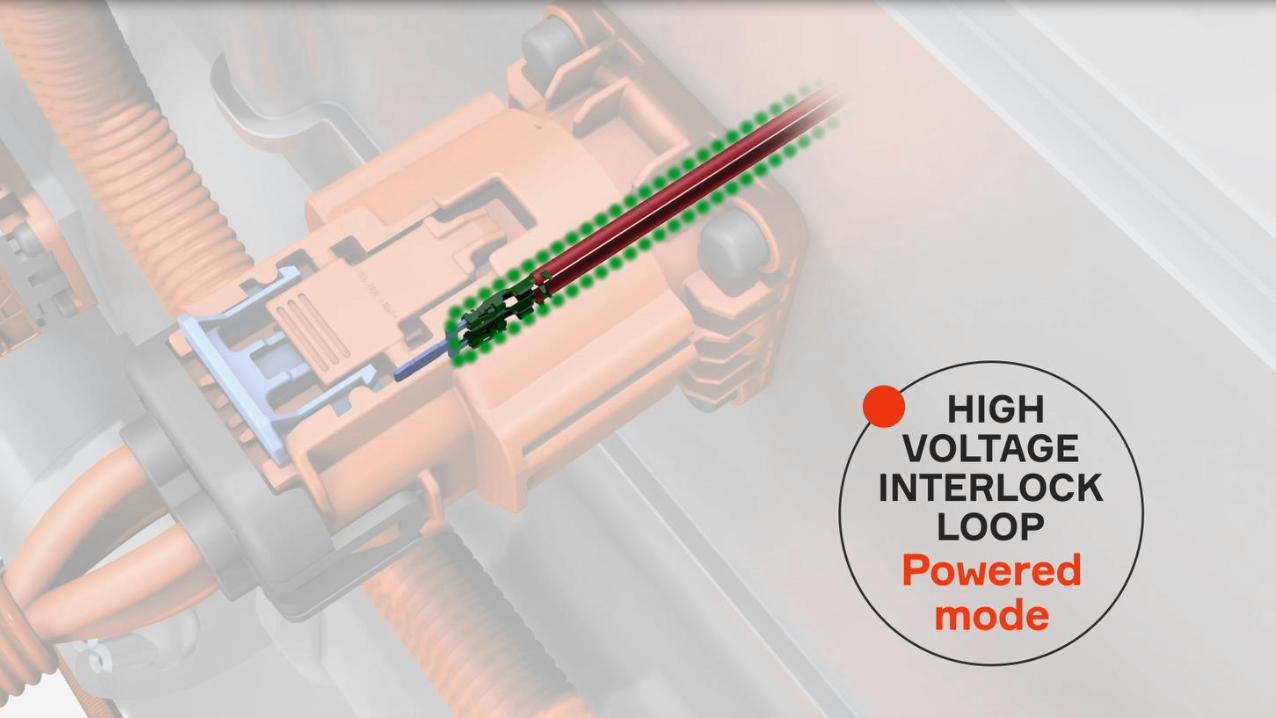
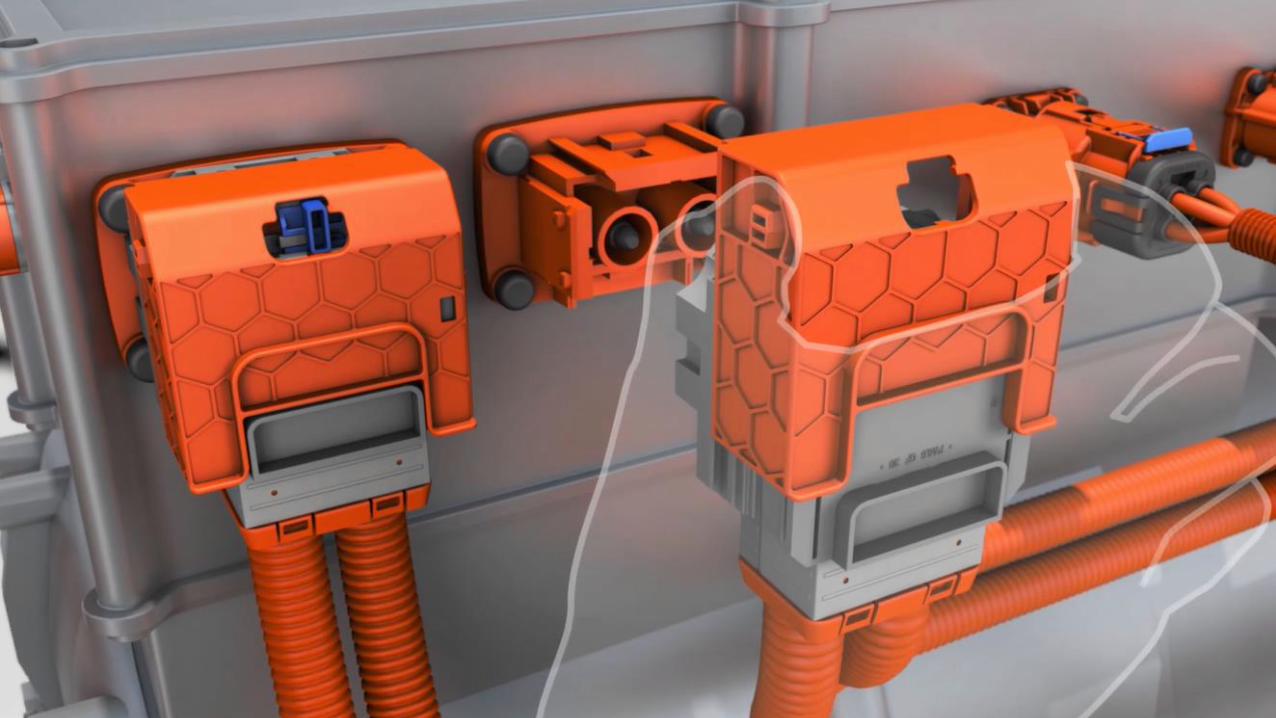
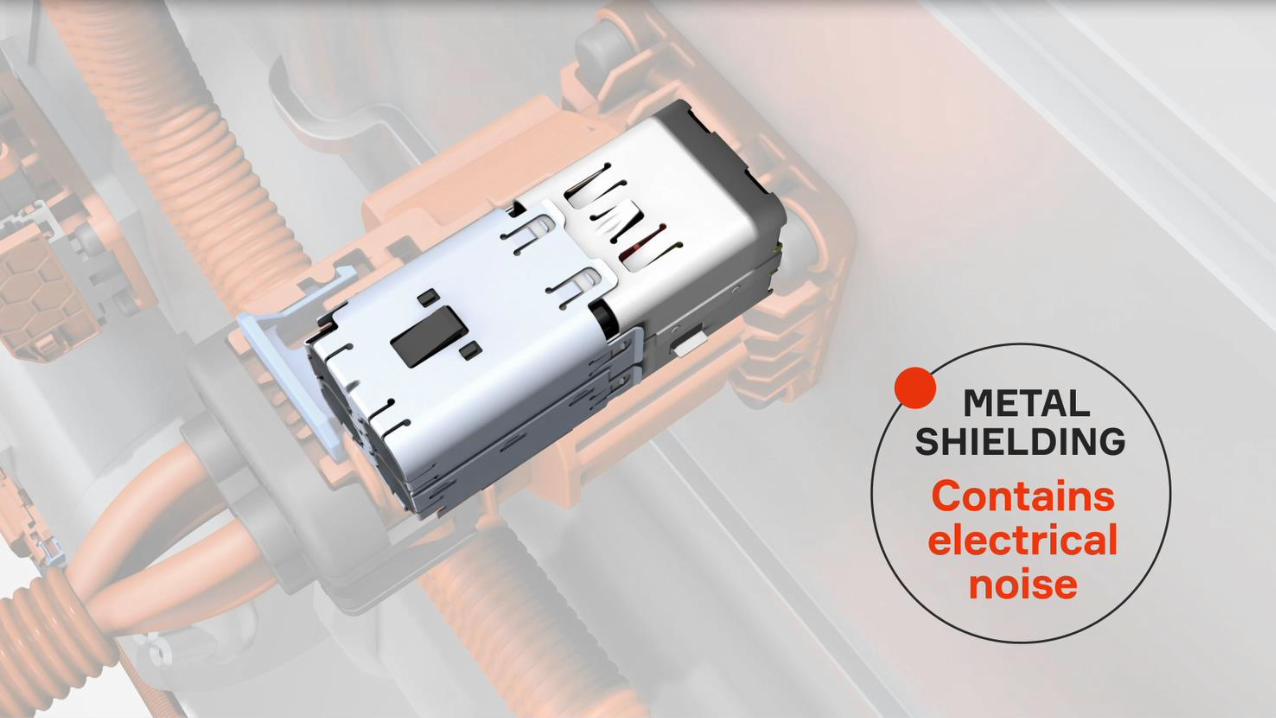
• SHIELDED SOLUTIONS
• SEALING AND ARC PROTECTION SOLUTIONS
• ERGONOMIC TECHNOLOGY
• HV INTERLOCK LOOP CIRCUITS
• APTIV SPLICE TECHNOLOGY
• BUSBARS
• CABLE MANAGEMENT
• ALUMINUM CABLE
• SMART CHARGINGINTERFACE CONTROLLER
• BATTERY DISCONNECT UNITS
• POWER DISTRIBUTION UNITS

ARCHITECTURE OPTIMIZATION
FULL-SYSTEM SOLUTIONS DELIVER UNPARALLELED SYSTEM OPTIMIZATION
E R I C R O W L A N D
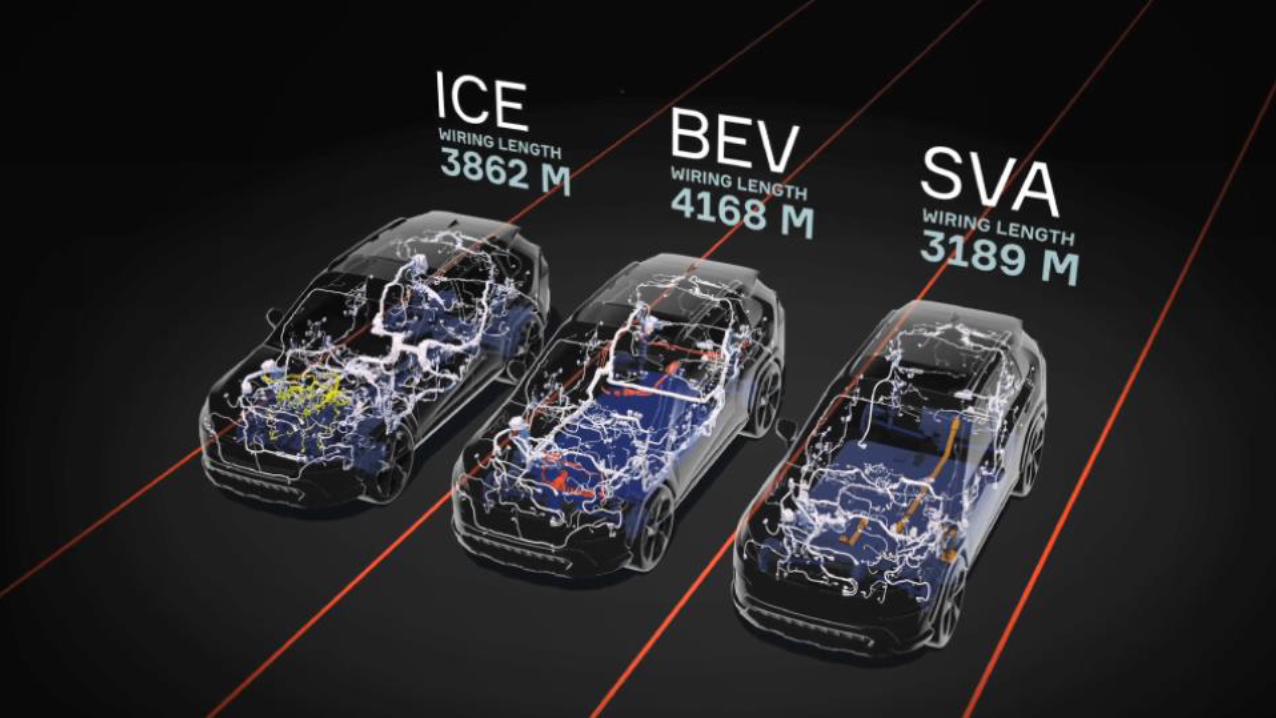
ICE → BEV
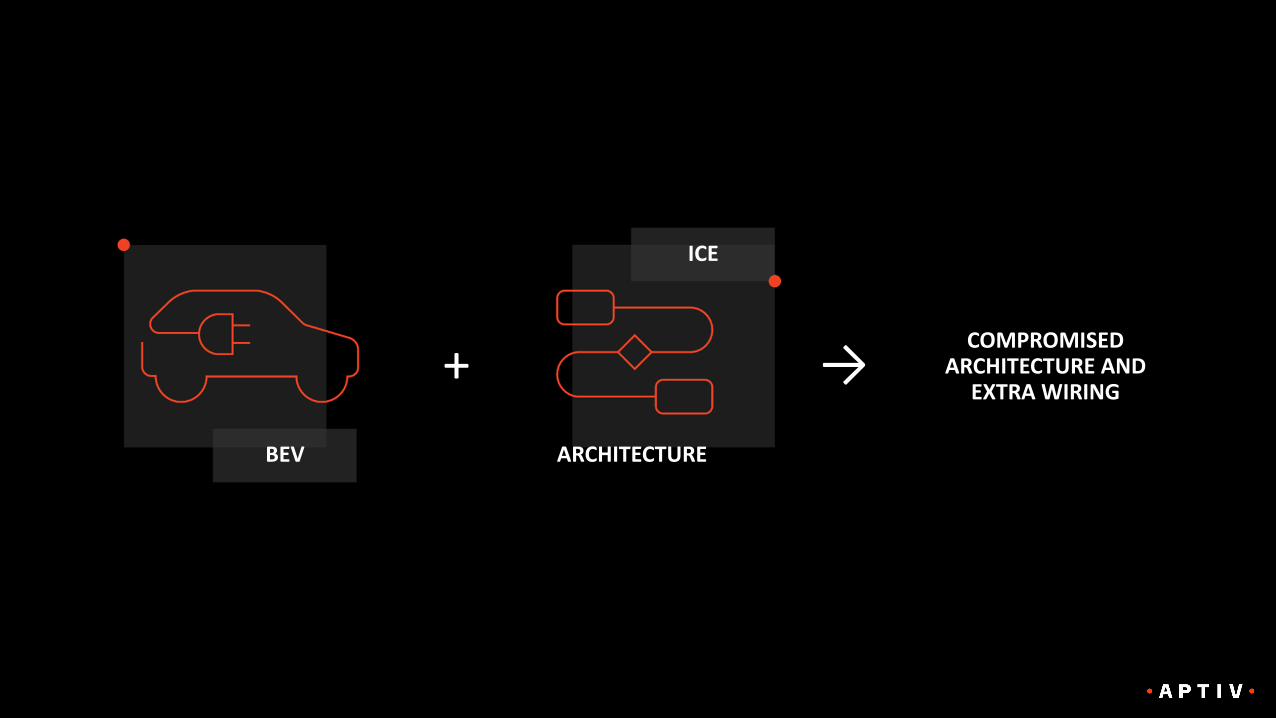
COMPROMISEDARCHITECTURE AND
EXTRA WIRING
BEV ARCHITECTURE
ICE
→+


ARCHITECTURE CREATION PROCESS

ARCHITECTURE CREATION PROCESS
LOADING OEM WIRING DATA

ARCHITECTURE CREATION PROCESS ENRICHING AND MODELINGARCHITECTURE CREATION PROCESS

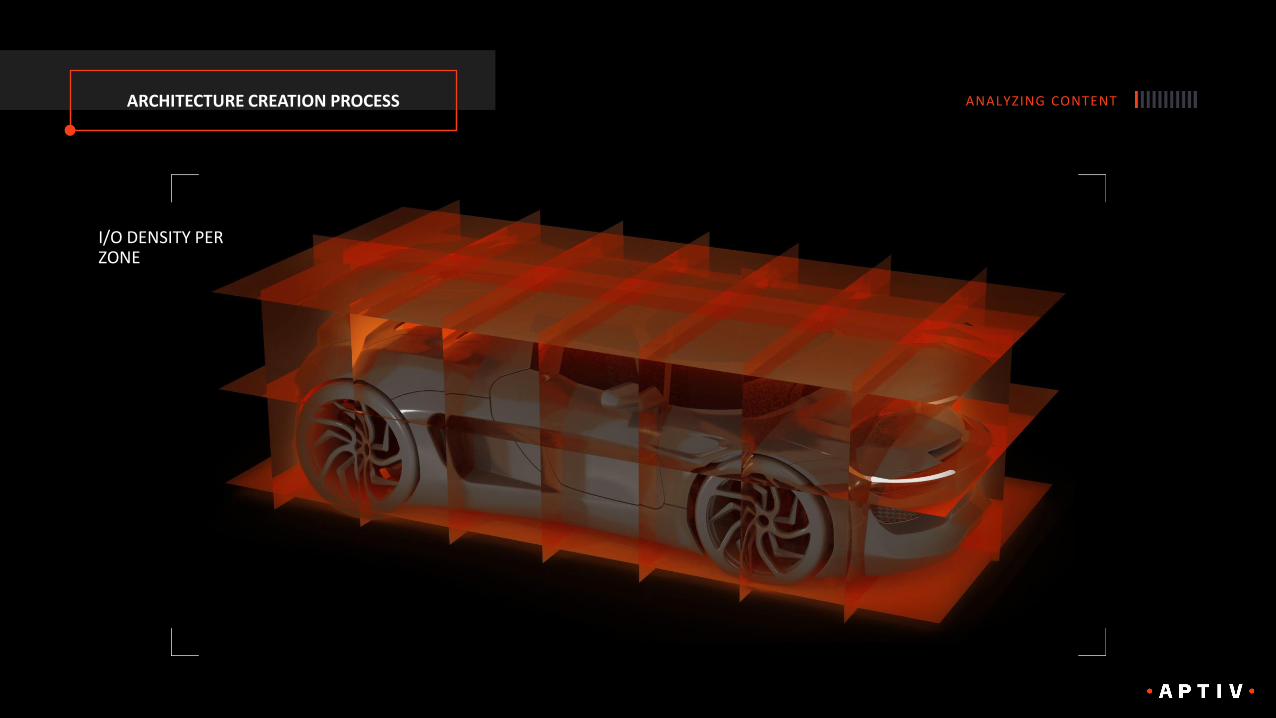
ARCHITECTURE CREATION PROCESS ANALYZING CONTENTARCHITECTURE CREATION PROCESS
I/O DENSITY PER ZONE
ARCHITECTURE CREATION PROCESS ANALYZING CONTENTARCHITECTURE CREATION PROCESS
I/O DENSITY PER ZONE
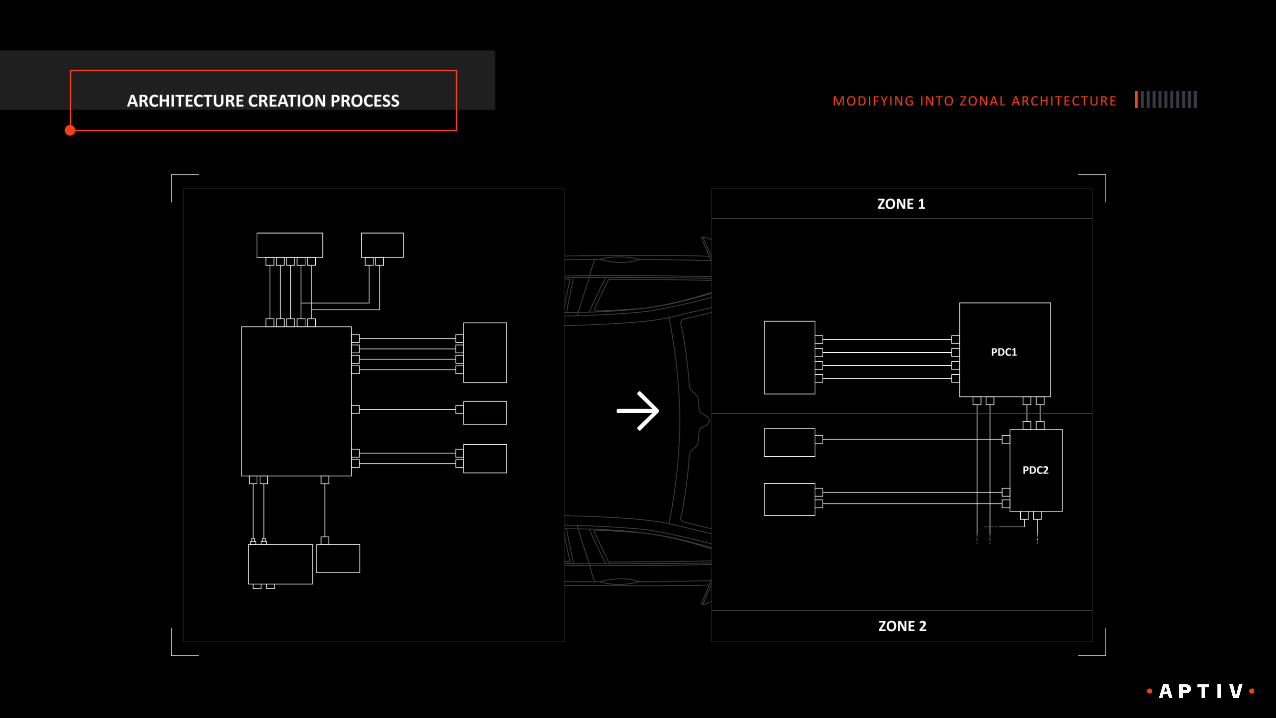
ARCHITECTURE CREATION PROCESS MODIFYING INTO ZONAL ARCHITECTURE
ZONE 2
ZONE 1
PDC1
PDC2
→

ARCHITECTURE CREATION PROCESS FINDING BEST VARIANT
CRITERION 3
CRITERION 2 CRITERION 4
CRITERION 1 CRITERION 5
CRITERION N
Ref mit G
Arch 1 mit G
EVALUATION METRICS FUNCTIONAL AVAILABILITY AFTER CRASH

ARCHITECTURE CREATION PROCESS RESULTS
PDC
CVC
OSP
PDC
PDC
SMART VEHICLE ARCHITECTURE

BENEFITS

BENEFITS REDUCED COMPLEXITY

BENEFITS FLEXIBLE AND SCALABLE IMPLEMENTATION
2025
FULL ZONALARCHITECTURE
20%+Wiring weight saving
2028+
FULL SVA™
30%+Wiring weight saving
2023
SMART ELECTRICAL CENTERS
10%+Wiring weight saving
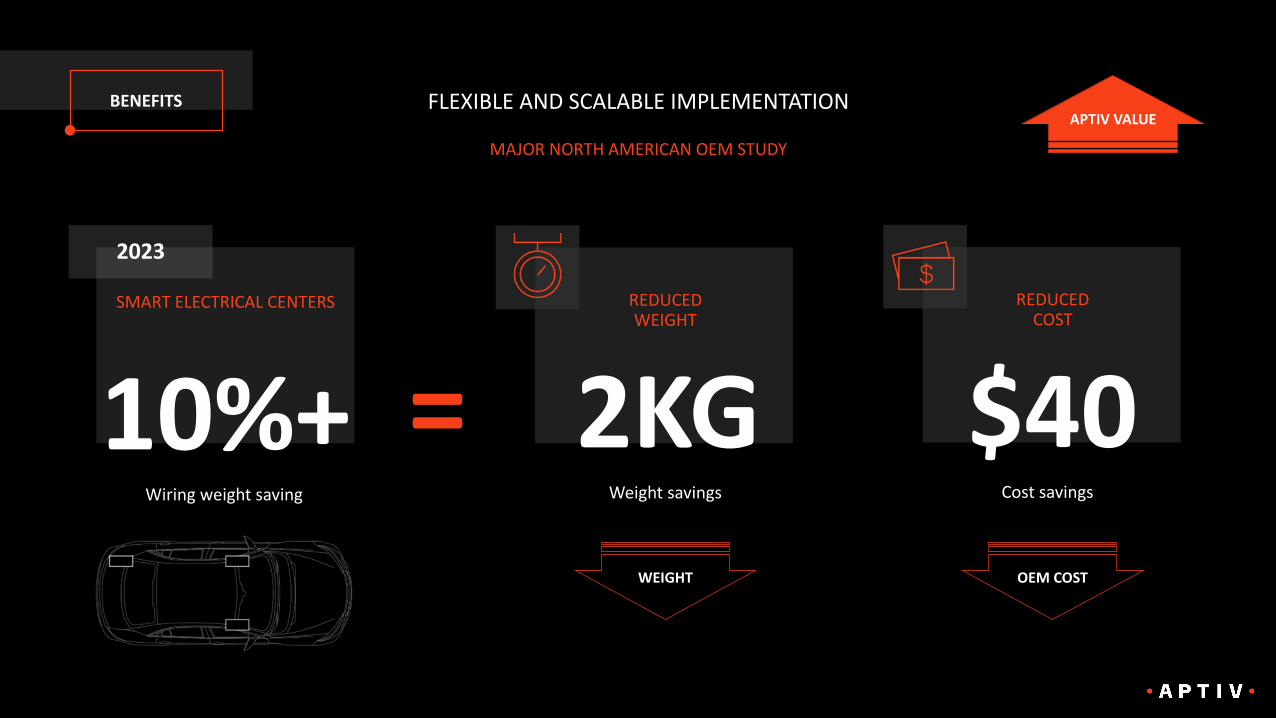
BENEFITS
MAJOR NORTH AMERICAN OEM STUDY
REDUCED COST
$40Cost savings
FLEXIBLE AND SCALABLE IMPLEMENTATION
=OEM COST
APTIV VALUE
REDUCED WEIGHT
2KGWeight savings
WEIGHT
2023
SMART ELECTRICAL CENTERS
10%+Wiring weight saving

BENEFITS
MAJOR EUROPEAN OEM STUDY
REDUCED COST
$55Cost savings
FLEXIBLE AND SCALABLE IMPLEMENTATION
= 8.5KG
REDUCED WEIGHT
Weight savings
2025
FULL ZONALARCHITECTURE
20%+Wiring weight saving
WEIGHT COST
APTIV VALUE
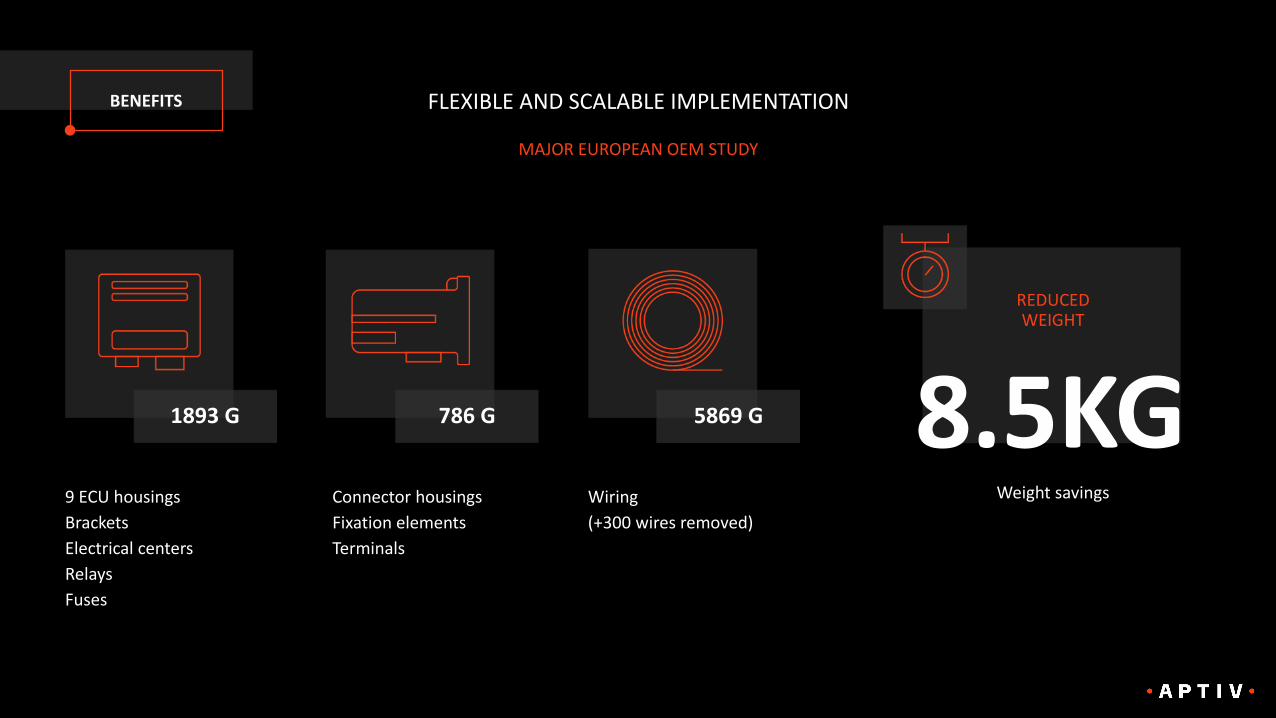
BENEFITS
MAJOR EUROPEAN OEM STUDY
REDUCED WEIGHT
8.5KGWeight savings
FLEXIBLE AND SCALABLE IMPLEMENTATION
9 ECU housings
Brackets
Electrical centers
Relays
Fuses
1893 G
Connector housings
Fixation elements
Terminals
786 G
Wiring
(+300 wires removed)
5869 G

BENEFITS
– Dock & Lock™ OEM Assembly automation
– Flat Backbone wiring
2028+
FULL SVA™
30%+Wiring weight saving
FLEXIBLE AND SCALABLE IMPLEMENTATION

BENEFITS
BENEFITS

BENEFITS

B I L L P R E S L E Y
GLOBAL SCALE & MANUFACTURING EXCELLENCE

TECHNICAL CENTERS34ENABLING APTIV TO DELIVER CONSISTENT PRODUCT AND SERVICE OFFERINGS IN ALL REGIONS
GLOBAL SCALE WITH INDUSTRY-LEADING CAPABILITIES
MANUFACTURING SITES GLOBALLY52

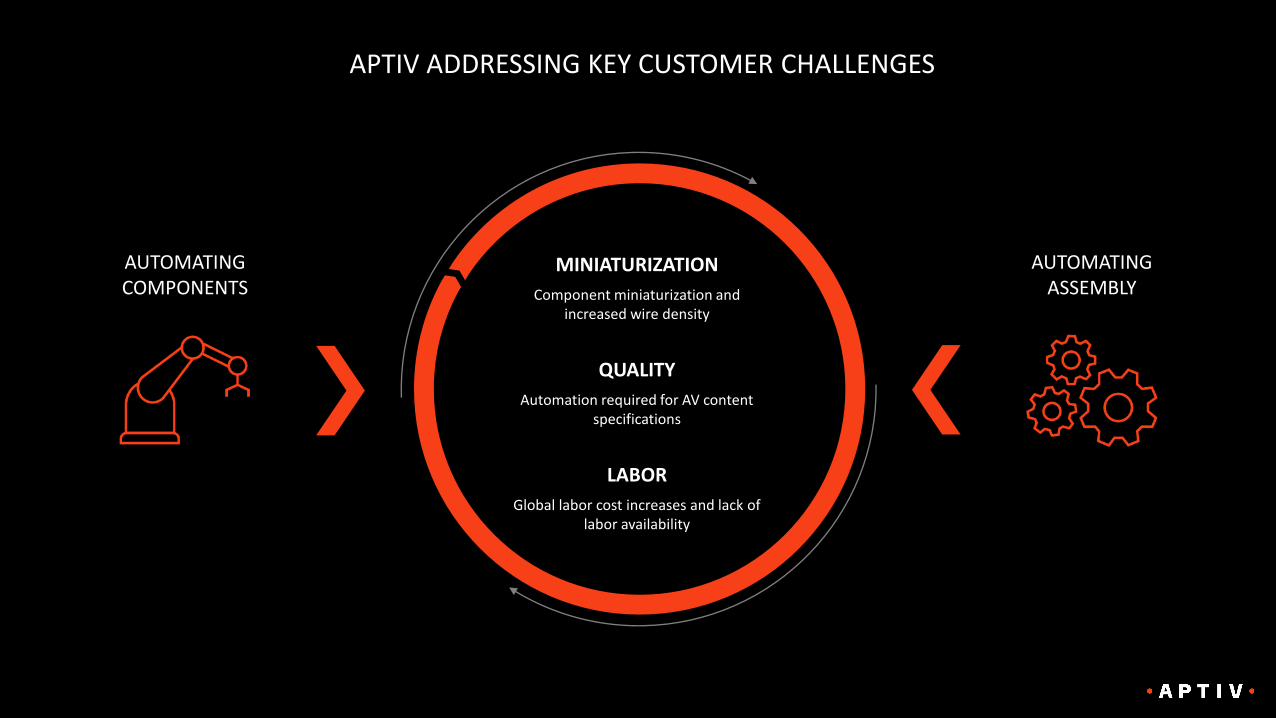
APTIV ADDRESSING KEY CUSTOMER CHALLENGES
AUTOMATING COMPONENTS
AUTOMATING ASSEMBLY
MINIATURIZATION
Component miniaturization and increased wire density
QUALITY
Automation required for AV content specifications
LABOR
Global labor cost increases and lack of labor availability

2XAUTOMATION
POTENTIAL
SVATM ARCHITECTURE
Simple connections
Short wires, other partitioning possible
40-80%Automation potential of wires
20-40%Automation potential of wires
Complex connections
Long wires, mega harness
DISTRIBUTED OR DOMAIN ORIENTED ARCHITECTURE
GREATER MANUFACTURING AUTOMATION


AUTOMATING COMPONENTS
AUTOMATING ASSEMBLY
BETTER QUALITY
IMPROVED RELIABILITYAND PERFORMANCE
ENHANCED PERFORMANCE
APTIV PROVIDING TANGIBLE CUSTOMER BENEFITS
SIGNIFICANT COST SAVINGS
PARTNER-OF-CHOICE
APTIV IS A TRUSTED PARTNER TO BOTH TRADITIONAL AND EMERGING EV PLAYERS
J O S I E A R C H E R
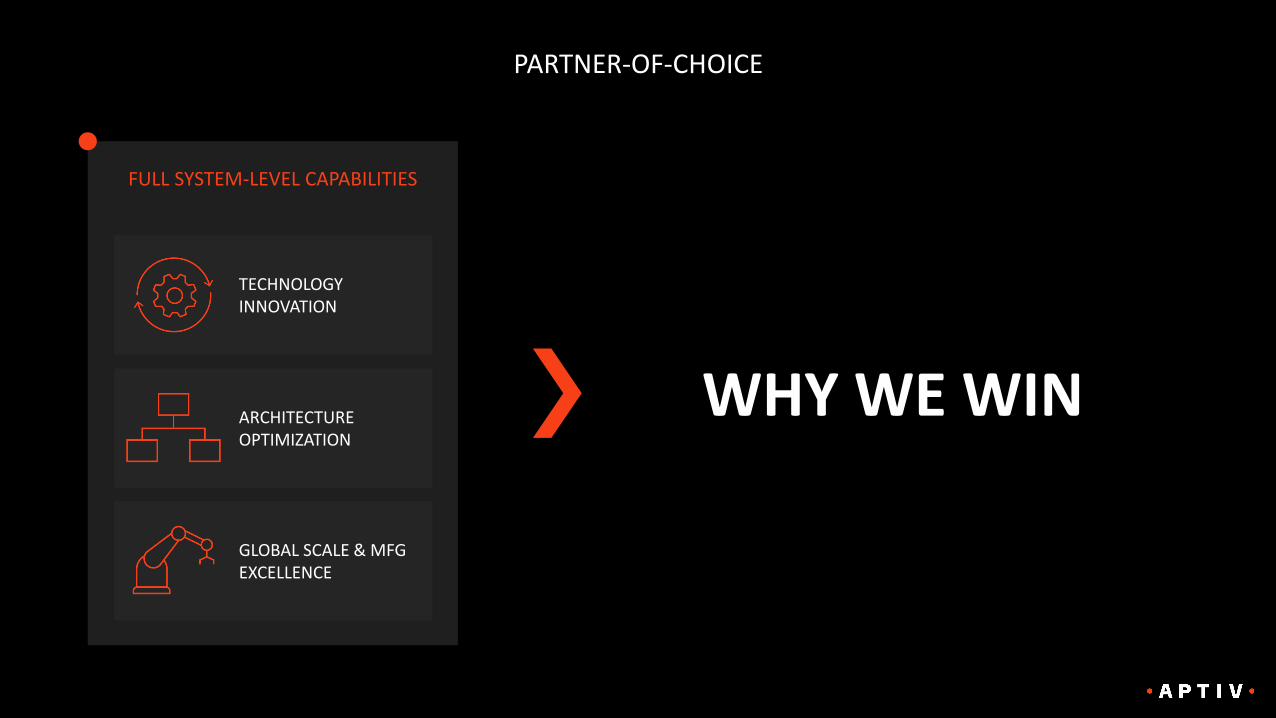
PARTNER-OF-CHOICE
WHY WE WIN
TECHNOLOGY INNOVATION
FULL SYSTEM-LEVEL CAPABILITIES
ARCHITECTURE OPTIMIZATION
GLOBAL SCALE & MFG EXCELLENCE
TECHNOLOGY INNOVATION
FULL SYSTEM-LEVEL CAPABILITIES
ARCHITECTURE OPTIMIZATION
GLOBAL SCALE & MFG EXCELLENCE
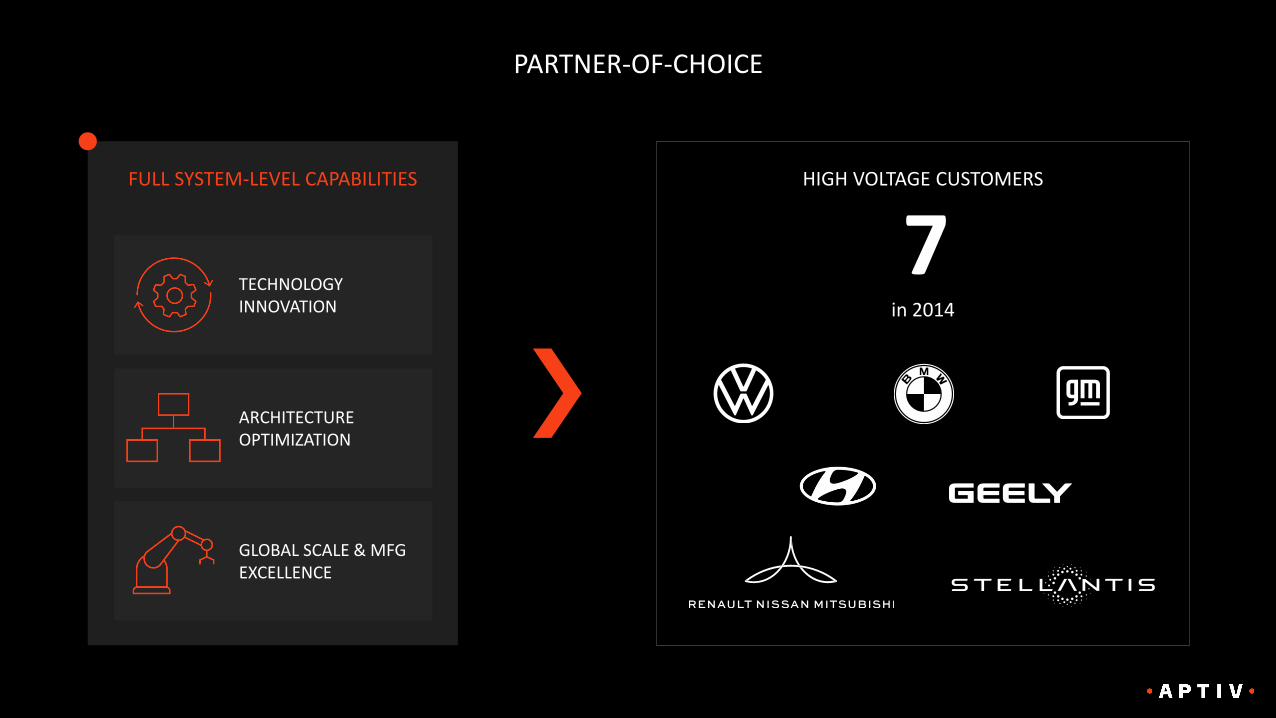
HIGH VOLTAGE CUSTOMERS
in 2014
7
PARTNER-OF-CHOICE
TECHNOLOGY INNOVATION
FULL SYSTEM-LEVEL CAPABILITIES
ARCHITECTURE OPTIMIZATION
GLOBAL SCALE & MFG EXCELLENCE
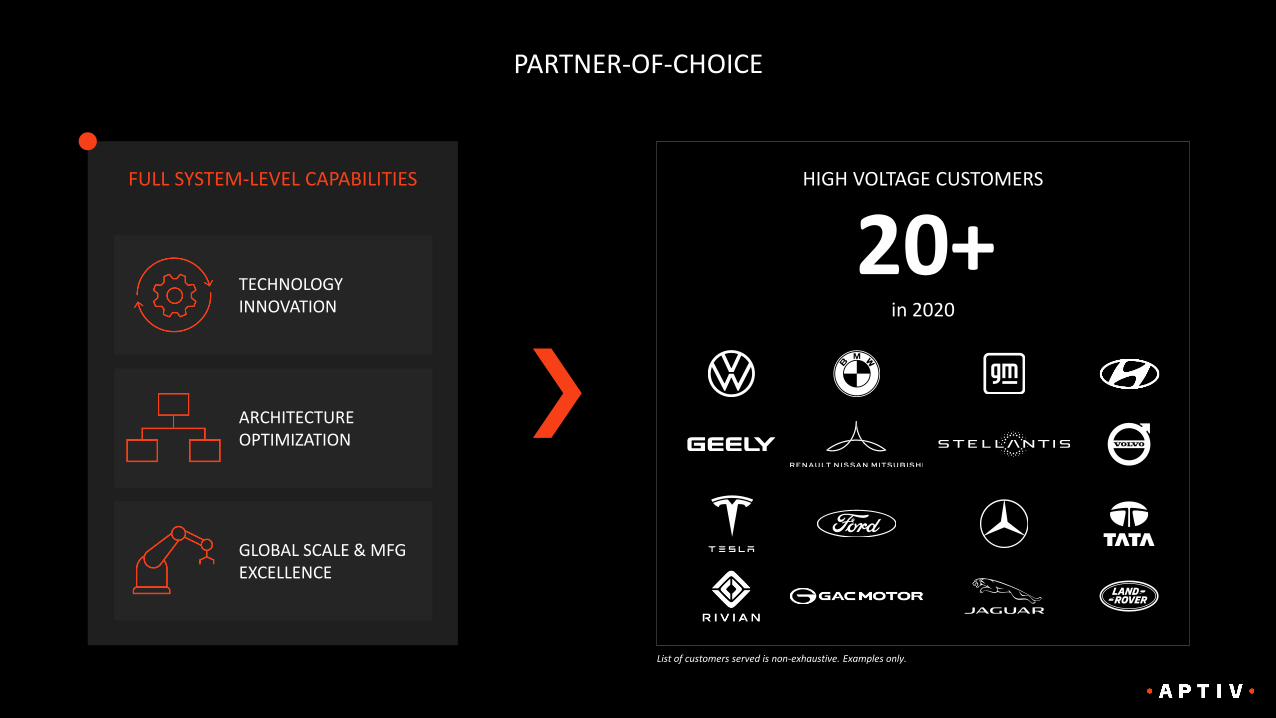
HIGH VOLTAGE CUSTOMERS
in 2020
20+
PARTNER-OF-CHOICE
List of customers served is non-exhaustive. Examples only.

TECHNOLOGY INNOVATION
FULL SYSTEM-LEVEL CAPABILITIES
ARCHITECTURE OPTIMIZATION
GLOBAL SCALE & MFG EXCELLENCE
HIGH VOLTAGE CUSTOMERS
in 2023
25+
PARTNER-OF-CHOICE
List of customers served is non-exhaustive. Examples only.
TECHNOLOGY INNOVATION
FULL SYSTEM-LEVEL CAPABILITIES
ARCHITECTURE OPTIMIZATION
GLOBAL SCALE & MFG EXCELLENCE
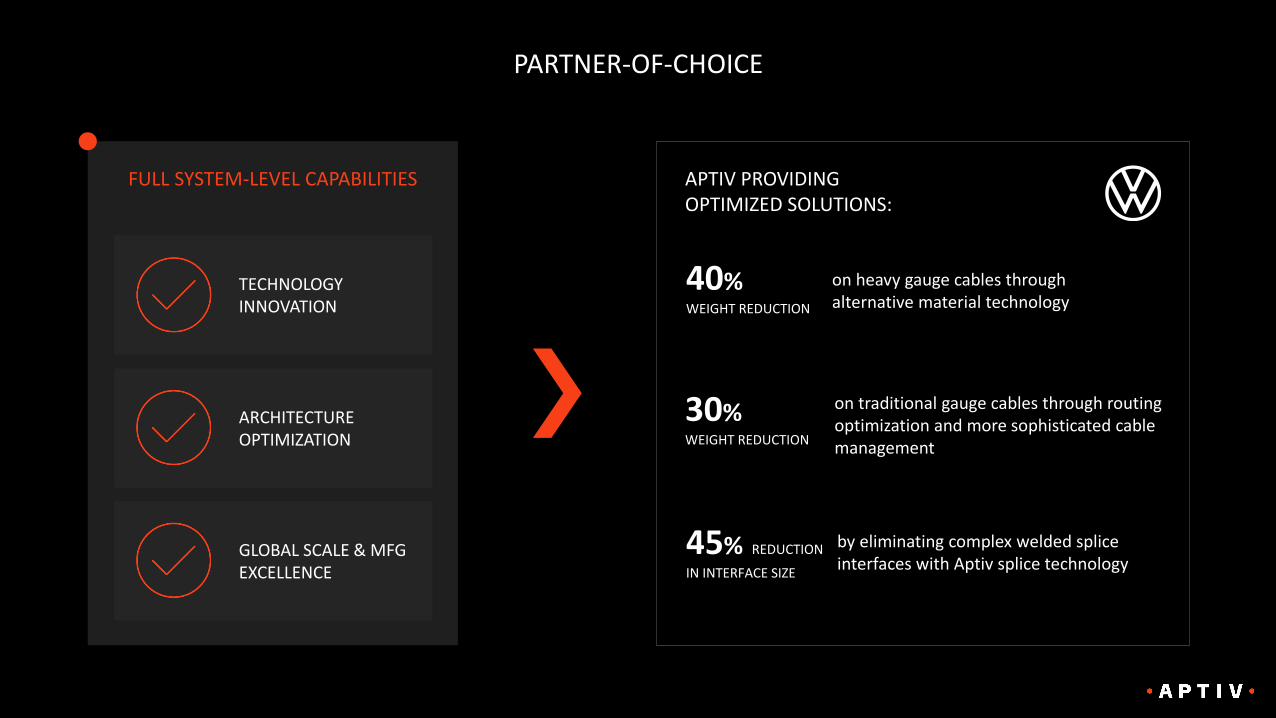
APTIV PROVIDING OPTIMIZED SOLUTIONS:
40%WEIGHT REDUCTION
on heavy gauge cables through alternative material technology
30%WEIGHT REDUCTION
on traditional gauge cables through routing optimization and more sophisticated cable management
45% REDUCTION
IN INTERFACE SIZE
by eliminating complex welded splice interfaces with Aptiv splice technology
PARTNER-OF-CHOICE

TECHNOLOGY INNOVATION
FULL SYSTEM-LEVEL CAPABILITIES
ARCHITECTURE OPTIMIZATION
GLOBAL SCALE & MFG EXCELLENCE
VW ID BUZZ LEADING TO FOLLOW-ON WINS
✓ ID.6 ✓ ID.BUZZ ✓ ID.VIZZION1
✓ ID.3 ✓ ID.4 ✓ ID.5
PARTNER-OF-CHOICE

TECHNOLOGY INNOVATION
FULL SYSTEM-LEVEL CAPABILITIES
ARCHITECTURE OPTIMIZATION
GLOBAL SCALE & MFG EXCELLENCE
EMERGING MOBILITY PLAYERS
APTIV ENABLING CUSTOMERS TO:
• Execute on their ambitious timelines
• Seamlessly expand their product offerings
• Grow their global operations
• Ramp up in high volume
PARTNER-OF-CHOICE

FACTORS ENABLING
APTIV’S SPEED TO MARKET:
• Comprehensive portfolio
• A modular approach
• Cable extrusion expertise
• Common engineering and MFG footprint
• In-house rapid prototyping capabilities
TECHNOLOGY INNOVATION
FULL SYSTEM-LEVEL CAPABILITIES
ARCHITECTURE OPTIMIZATION
GLOBAL SCALE & MFG EXCELLENCE
PARTNER-OF-CHOICE

APTIV HAS BEEN AWARDED HV CONTENT IN ALL CLASSES
ENABLING PATH TO SUSTAINABILITY
SedanSedan
CUV / SUVCUV / SUV
Pick-upPick-up
SCALABLE CAPABILITIES FOR ENTIRE EV SPACE
Commercial / Delivery VansCommercial / Delivery Vans
Semi-truck
Semi-truck

B I L L P R E S L E Y
POSITIONED FOR STRONG GROWTH
CUSTOMER INVESTMENT TRENDS ACCELERATING SHIFT TO EVS

Pulling ahead sales targets to achieve zero
emissions sooner
50%
100%
BEVs by 2025(as of Q2 2018)
BEVs by 2030(as of Q1 2021)
BEVs by 2025(as of Q2 2018)
BEVs by 2030(as of Q1 2021)
Accelerating pace and number of BEV
launches
20 launches by 2023 (as of Q4 2017)
30 launches by 2025 incl. pickups(as of Q4 2020)
Increasing investments to enable faster transition to EVs
€20B+ through 2030 (as of Q3 2017)
€30B* through 2022(as of Q3 2019)
$11B+ through 2022(as of Q1 2018)
$30B+ through 2025(as of Q2 2021)
OEMS ACCELERATING EV PLANS
*China JVs to invest an additional €15B over next few years
Source: Company press releases and investor presentations

1.9
3.3
5.4
7.7
8.7
12.9
3.3
11.1
15.8
13.2
20.8
24.7
0
5
10
15
20
25
2015 2016 2017 2018 2019 2020 2021 2022 2023 2024 2025 2026 2027 2028 2029 2030 2031 2032 2033
Jan ‘19
Jan ‘150.9
Jan ‘18
Jan ‘16
Jan ‘17
Jan ‘20
Feb ‘21
1.4
SINCE 2015, IHS HAS REVISED ITS BEV FORECASTS UP IN RESPONSE TO DECLINING COSTS, INCREASING REGULATIONS, AND WIDER AVAILABILITY
BEV Share (%)
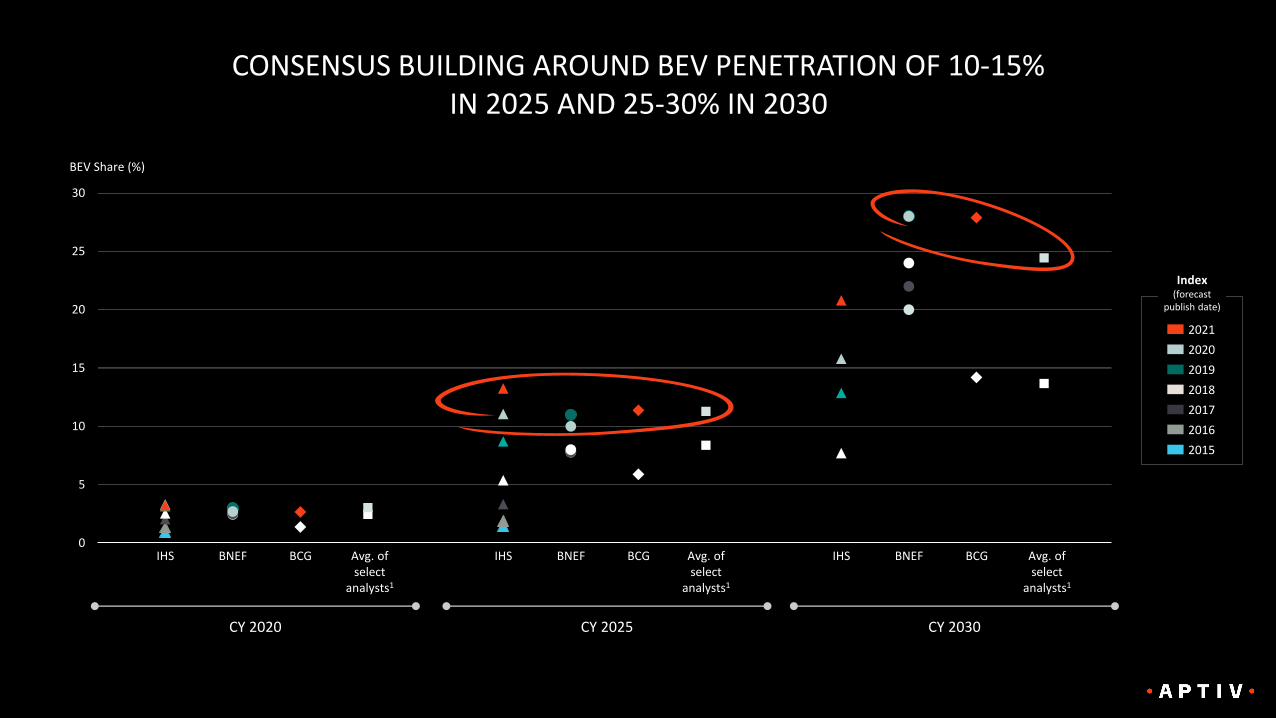
CONSENSUS BUILDING AROUND BEV PENETRATION OF 10-15% IN 2025 AND 25-30% IN 2030
0
5
10
15
20
25
30
BCGIHS Avg. of select
analysts1
BEV Share (%)
BNEF Avg. of select
analysts1
IHS BNEF BCG Avg. of select
analysts1
IHS BNEF BCG
CY 2020 CY 2025 CY 2030
2021
2020
2019
2018
2017
2016
2015
Index(forecast
publish date)
MARKET OUTLOOK & ELECTRIFICATION PENETRATION DRIVERS
A A K A S H A R O R A

JUN 28, 2021
EV Market Evolution

80 Copyri
ght
© 2
021 b
y B
ost
on C
onsu
ltin
g G
roup.
All r
ights
rese
rved.
Setting the stage | xEV penetration continues to riseDespite lower overall production volumes, additional 2.6M xEVs produced in 2020
0
80
40
60
100
2015 2016 2017 2019 2020
76%
xEV
Diesel
Gasoline
13%21%
2%
74
20182011
76%71%
Global vehicle
production (M)
2010 2012 2013
7477
81
76%
8487 89
93 95 94
89
1%
22%
2014
1%
23%
76%
2%
21%
77%
3%
20%
77%
3%
21%
77%
20%
76%
4%
19%
6%
18%
76%
8%
17%
75%
15%
3%
Note: xEV inclusive of: BEV = Battery electric; PHEV = plug-in hybrid electric; HEV = full hybrid electric; MHEV = mild hybrid electric Source: IHS Markit Alternative Propulsion Plus Data; IHS Markit LV sales (June 2021)
Year-over-year growth in % xEVs
80
100
60
0
40
20
HEV
Share of xEVs
by type (%)
2.4
(24%)
1.1
(11%)
2.9
(29%)
3.5
(36%)
2020
BEV
PHEV
MHEV
9.9M
33%28%34% 33% 36%
81 Copyri
ght
© 2
021 b
y B
ost
on C
onsu
ltin
g G
roup.
All r
ights
rese
rved.
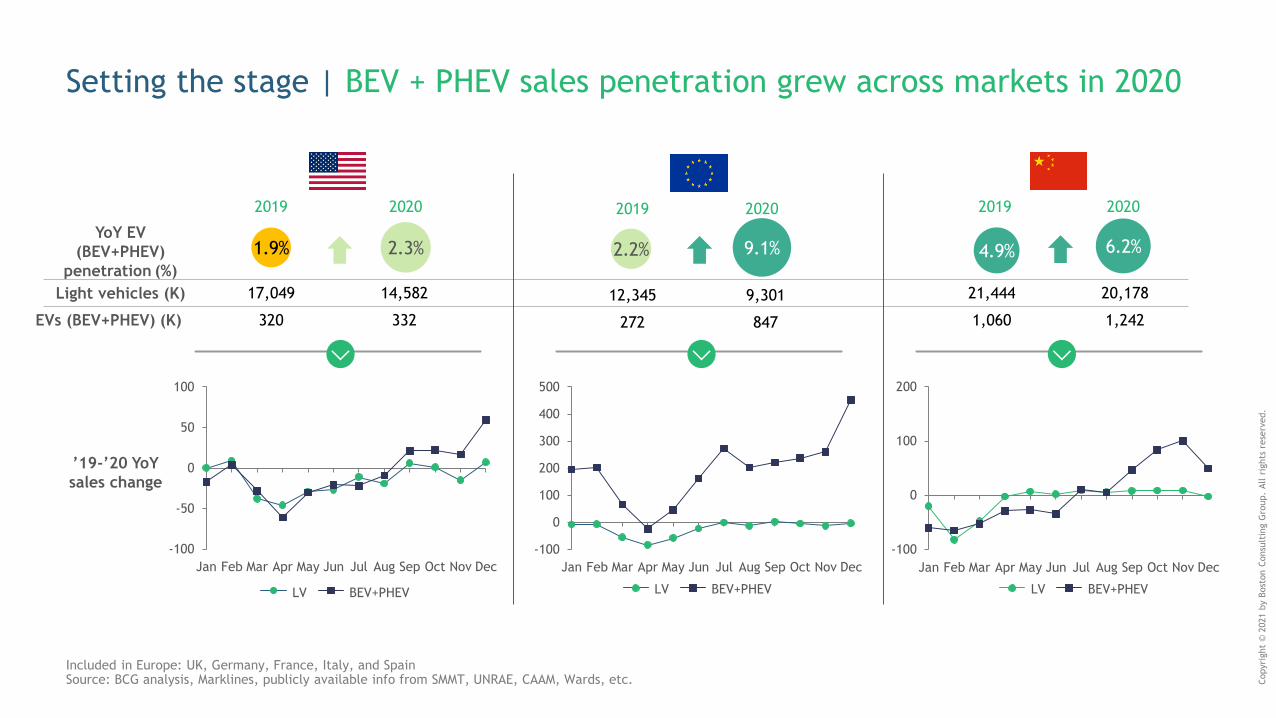
Setting the stage | BEV + PHEV sales penetration grew across markets in 2020
’19-’20 YoY
sales change
YoY EV
(BEV+PHEV)
penetration (%)
2019 2020 2019 2020 2019 2020
-100
-50
0
50
100
Jan Feb JunMar Apr May Jul Aug Sep Oct Nov Dec
LV BEV+PHEV
-100
0
100
200
300
400
500
FebJan JulMar Apr May Jun SepAug Oct Nov Dec
-100
0
100
200
Mar SepFeb JunJan MayApr Jul Aug Oct Nov Dec
LV BEV+PHEV LV BEV+PHEV
Light vehicles (K)
EVs (BEV+PHEV) (K)
Included in Europe: UK, Germany, France, Italy, and SpainSource: BCG analysis, Marklines, publicly available info from SMMT, UNRAE, CAAM, Wards, etc.
2.3%
17,049
320
1.9%
14,582
332
2.2%
12,345
272
9.1%
9,301
847
4.9%
21,444
1,060
20,178
1,242
6.2%
Copyri
ght
© 2
021 b
y B
ost
on C
onsu
ltin
g G
roup.
All r
ights
rese
rved.
82
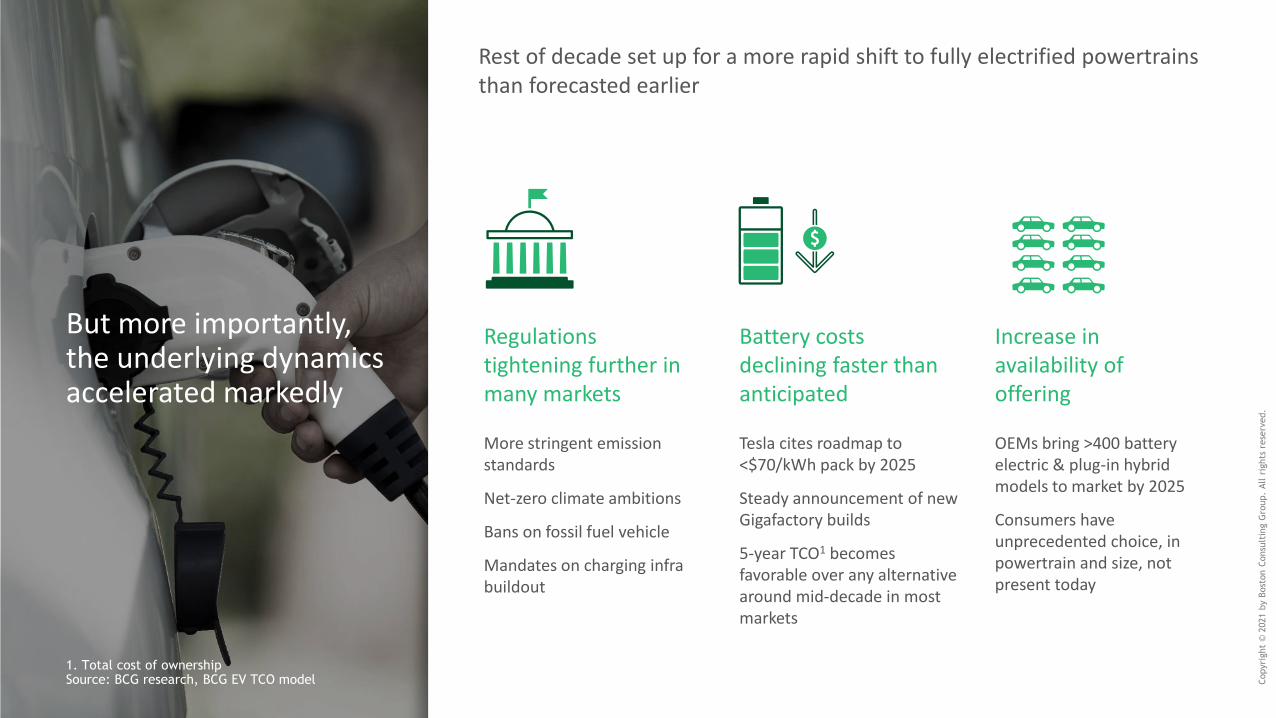
Battery costs declining faster than anticipated
Tesla cites roadmap to <$70/kWh pack by 2025
Steady announcement of new Gigafactory builds
5-year TCO1 becomes favorable over any alternative around mid-decade in most markets
Increase in availability of offering
OEMs bring >400 battery electric & plug-in hybrid models to market by 2025
Consumers have unprecedented choice, in powertrain and size, not present today
Regulationstightening further in many markets
More stringent emission standards
Net-zero climate ambitions
Bans on fossil fuel vehicle
Mandates on charging infra buildout
But more importantly, the underlying dynamics accelerated markedly
1. Total cost of ownershipSource: BCG research, BCG EV TCO model
Rest of decade set up for a more rapid shift to fully electrified powertrains than forecasted earlier

83 Copyri
ght
© 2
021 b
y B
ost
on C
onsu
ltin
g G
roup.
All r
ights
rese
rved.
Regulations continue to tighten across key markets
60
80
200
140
120
100
160
180
220
2510 1309 261916 2302 22
CO2 (g/km)
1500 01 0803 04 0605 07 11 12 14 17 18 20 2721 24 28 29 30
-3%
-7%
2025: 99
2030: 59
2025: 93
Biden Administration
indicating strong renewed
focus on more stringent
tailpipe emissions
Note: ZEV = Zero Emission Vehicles, PV = Passenger Vehicles, LCV = Light Commercial VehiclesSource: BCG analysis, ICCT (June 2019), NHTSA, ACEA
Average
2000-2020:
US EU China
Average
2020-2030:
USA: In Sep '20, CA banned non-ZEV
sale by '35, others expected to follow
China: Hainan to phase out sales of
new ICE PV, LCV by 2030
Italy: Rome to ban diesel vehicles in
2024 and gasoline vehicles in 2030
Sweden: All new sales must be ZEVs
by 2030
Denmark: New sales to be ZEV/ PHEV
in 2030, no PHEV sales after 2035
Spain: All new sales must be ZEVs by
2040
France: No new sales of gasoline or
diesel vehicles by 2040
Sample countries

84 Copyri
ght
© 2
021 b
y B
ost
on C
onsu
ltin
g G
roup.
All r
ights
rese
rved.
Advancements in battery costs continue to propel the industry
2020 2022 2024 2026 2028 2030
100
0
60
80
120
200
140
160
180
100
Nickel-rich battery pack cost ($/kWh)3
136
8795
120
110
63
75
61
BCG base case (2021) IHS Markit (2021)
BCG base case (2019)
Bloomberg NEF (2020)
JPMorgan (2021)
Tesla target
(2023-25)
Sources: BCG analysis and forecast; expert interviews; analyst reports (UBS, HSBC, Bloomberg New Energy Finance)
Approx. average
2020 pack cost:
~$145/kWh
~$20/kWh lower
than forecasted
in 2019 for
leading players
Pack cost varies by as
much as 30% for OEMs with
relatively smaller
procurement contracts
GM Ultium
(2022-23)
VW

85 Copyri
ght
© 2
021 b
y B
ost
on C
onsu
ltin
g G
roup.
All r
ights
rese
rved.
'Tipping point' right around the corner for midsized cars
Source: BCG analysis
2015
35
2020
30
202525
2030
40
45
Year
5-year TCO, C-segment car ($k)
ICE PHEVMHEV HEV BEV
By 2022, 5-year TCO parity is reached; purchasing a BEV is
more favorable than ICE over life of 5 years from 2022-2027
Traditional ICE more economical
BEV more economical
BEV total cost of ownership (TCO) increasingly competitive
Tippingpoint
2022

86 Copyri
ght
© 2
021 b
y B
ost
on C
onsu
ltin
g G
roup.
All r
ights
rese
rved.
In response, OEMs dramatically evolving their portfolios
Hundreds of NEVs to enter the market by 2025Major international OEMs’ NEV roll-out plans (not exhaustive)
Note: NEV = New Energy Vehicle (BEV, PHEV, or FCEV)Source: BCG analysis , IHS, CGIS Research, public announcements
9
20
34
2220
17
6
15
1013
60 5956
49
44
3533
29 2926
H/KToyota RNM VW PSA Daimler GM BMW Ford Audi
Current # of NEVs Targeted 2025 # of NEVs
Electrification will be a catalyst for a range of experiences, We
are excited and confident about the future of our electric and
autonomous vehicles."
-Mary Barra, CEO, January 2021 (at CES, after which shares jump to all-time high)
We are betting on the future…Every single survey we look at,
we’re seeing numbers, particularly in the (small) SUV segment,
30%, 40% of consumers say electric will be my next car.
-Scott Keogh, CEO of Americas, December 2020
We wanted to put emotion into electric vehicles. That’s why
we started with a Mustang.
-Jim Farley, CEO, December 2020
By middle of the decade, [I want] 70% of the group’s sales to
be electric or hybrid. Renault will sell its last combustion-
engine vehicle by 2035 or even sooner.
-Luca de Meo, January 2021
OEMs increasing commitment to electrificationSelected quotes
We are significantly increasing the number of electric vehicles.
Between 2021 and 2023, we will build a quarter of a million
more electric cars than originally planned.
-Oliver Zipse, January 2021

87 Copyri
ght
© 2
021 b
y B
ost
on C
onsu
ltin
g G
roup.
All r
ights
rese
rved.
Actuals
BCG market forecast to 2035—Global Share of electrified powertrains surpasses 50% in 2026
0
20
50
10
50
80
100
30
0
70
40
60
90
3%
11%6%
3%
10%
2018
14%
1%
15%
3%
2%
1%
2026
2%
2020
5%
8%
78%
2019
3%
5%
5%
1%
14%
2022
74%
5%
2%
12%
69%
2021
6%
<1%
2%
23%
11%
65%
7%20%
7%
9%
78%
59%
2023
2%
9%3%
9%
18%
37%
7%
53%
2024
11%4%
10%
21%
6%
6%
47%
2025
4%
5%
27%
Volume (M)
42%
17%
5%
12%15%
2030
25%
4%
2027
13%
26%
3%
32%
2028
24%
23%
27%
14%
2029
28%
6%
14%
28%
4%
45%
12%
26%
1%
2%
11%
2035
3%
3%
1%
14%
GasolineFCEV BEV HEVPHEV MHEV Diesel Electrification
(xEV share of market)
Regulation-driven TCO driven
Impact of broader mobility trends1
BEV = Battery electric; PHEV = plug-in hybrid electric; HEV = full hybrid electric; MHEV = mild hybrid electric; FCEV = fuel cell electricSource: BCG analysis
Supply-driven
Electrification (%)

88 Copyri
ght
© 2
021 b
y B
ost
on C
onsu
ltin
g G
roup.
All r
ights
rese
rved.
Europe and China to lead global electric vehicle adoption
US volume projections (M units)
5
0
15
10
20
17
14%
5%
14
2020
5%
9%
9%
37%
42%
18%
8%
8%3%
22%
9%
2025
<1%
43%
27%
6%
2030
62%
6%5%
23%
1%3%
2035
17 16
31%
15
5
10
20
0
14
6%
2020
0%
88%
2%
0%
29%
11%
3%
31%
4%
54%
3%
3%10%
2%
11%
22%
2%
53%
2025
10%
31%
1%
21%
2030
<1%
5%
2035
16 16 16
HEVFCEV BEV PHEV MHEV Diesel Gasoline
EU volume projections (M units) China volume projections (M units)
10
0
30
40
20
2030
18%
29
4%
40%1%
1%4%
4%
2020
4%
86%
27%
1%
37%
2025 2035
5%
19%
32%
0%4%
<1%
58%
3%
15%
23%
22
27
31
13%
FCEV+BEV+PHEV 49% 21% 10%
HEV + MHEV 40% 6% (2%)
Diesel + Gasoline (7%) (17%) (40%)
FCEV+BEV+PHEV 27% 16% 5%
HEV + MHEV 31% (2%) (13%)
Diesel + Gasoline (11%) (21%) (17%)
FCEV+BEV+PHEV 41% 17% 7%
HEV + MHEV 56% 7% (3%)
Diesel + Gasoline (12%) (34%) (100%)
Note: Forecast includes all light vehicles, except heavy vans
Source: BCG analysis
5-yr
CAGR

89 Copyri
ght
© 2
021 b
y B
ost
on C
onsu
ltin
g G
roup.
All r
ights
rese
rved.
Climate implications | Meeting US and EU climate targets will require even faster penetration
Source: BCG analysis, EU Commission, EEA
Targets & carbon budget
Parc emissions:
1,2321,137
616
871
2005
baseline
2020
baseline
2030 current
trajectory
2030
ambition
(50%) (29%)
Annual emissions from light duty vehicles (M tonne CO2e)
433 449
195
310
2030
ambition
1990
baseline
2020
baseline
2030 current
trajectory
(55%) (28%)

90 Copyri
ght
© 2
021 b
y B
ost
on C
onsu
ltin
g G
roup.
All r
ights
rese
rved.
Indicators point to growing consumer interest; ICE price parity likely to further boost purchase likelihood
Note: referencing different surveys with unique question languageSources: BCG analysis, publicly available survey data from IHS, NREL, Volvo, consumers report 2020, etc.
13% 13%19%
24%
33%
51%43%
52%
US consumer
purchase intent (%)
BEV PHEV
2010 2016 2019 2020
Consumer attitudes are improving
48
43
42
30
28
21
14
9
2
6
Lack of options currently on the market
Attributes holding back EV purchases
Nowhere to charge it at home
Not enough public charging stations
Don’t know enough about Es to buy one
Purchase price
Long charging times
Insufficient driving range
Higher state registration fees for EVs
Difficult to use technology
Other
Purchase price a key criteria for customer adoption
Copyri
ght
© 2
021 b
y B
ost
on C
onsu
ltin
g G
roup.
All r
ights
rese
rved.
91
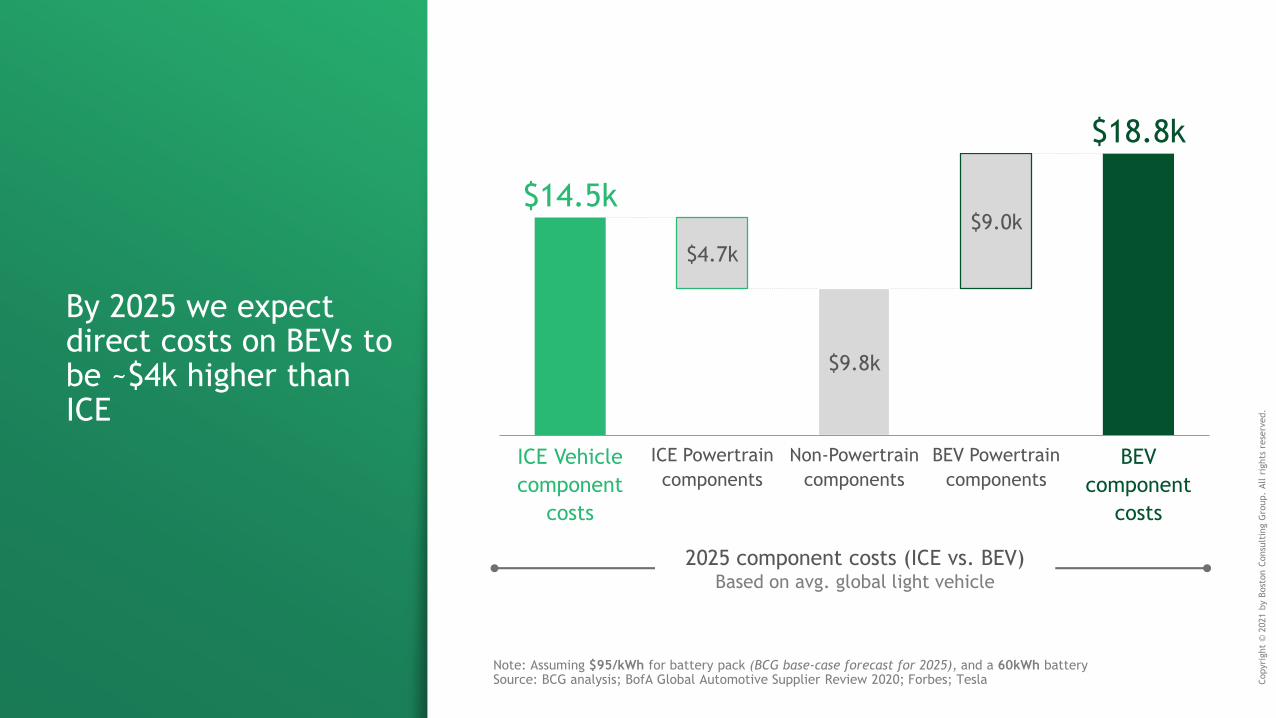
By 2025 we expect direct costs on BEVs to be ~$4k higher than ICE
$14.5k
$9.8k
$18.8k
$4.7k
$9.0k
ICE Vehicle
component
costs
ICE Powertrain
components
Non-Powertrain
components
BEV Powertrain
components
BEV
component
costs
Note: Assuming $95/kWh for battery pack (BCG base-case forecast for 2025), and a 60kWh batterySource: BCG analysis; BofA Global Automotive Supplier Review 2020; Forbes; Tesla
2025 component costs (ICE vs. BEV)Based on avg. global light vehicle

WHAT DOES THIS MEAN FOR APTIV?
B I L L P R E S L E Y

$0.5k
$4.5k
$8.1k
$1.2k$0.8k
$0.3k
$14.0k
$0.2k
$9.5k
$17.6kOther content
Aptiv content
$9.8k
$14.5k
$18.8k
INCREMENTAL S&PS CONTENT OPPORTUNITY IN BEVS ACROSS
• Wiring
• Busbars
• Connectors
• Charger
• PDB
• BDU
Source: BCG analysis
Non-Powertrain
components
ICE Vehicle component
costs
ICE Powertrain
components
BEV Powertrain
components
BEV component costs
APTIV ADDRESSABLE CONTENT IN BEVS EXPECTED TO BE 2-3X THE CONTENT IN ICE VEHICLES

2020 2025 2030 2020 2025 2030
88%
5%
73
24%
20%
10%
11%
92
99
4
14
27
28%
14%
25% BEV
PHEV
HEV
MHEV
ICE / OTHER
High
Voltage
45%
14%
7%
4%
6%
TOTAL ADDRESSABLE MARKETHigh Voltage Components TAM1 ($B)
MARKET PENETRATIONVolume (M units), Global Penetration %
28%
1. Addressable market across BEVs, FCEVs, PHEVs, HEVs, and MHEVs; Source: BCG, Internal Analysis
$25B+ ADDRESSABLE MARKET FOR APTIV HV CONTENT IN 2030

QUOTING ACTIVITY
2014 2021
100+
10
2018-2020Average
2021Target
BOOKINGSLifetime gross program revenues, $ Billions
TARGET$2.5+
$2.0
Q1 2021$0.9
1. Revenue growth excludes impact of foreign exchange, commodities and divestitures
$0.3 $0.3
$2.5+
2018 2019 2020 2021E 2025T
40%+
$0.9
$0.5
REVENUE$ Billions, Adj Growth CAGR1
APTIV HIGH VOLTAGE ELECTRIFICATION

PROVIDING END-TO-END SOLUTIONS THAT ENABLE A MORE EFFICIENT PATH TO VEHICLE ELECTRIFICATION
FULL SYSTEM-LEVEL CAPABILITIES TECHNOLOGY INNOVATION
ARCHITECTURE OPTIMIZATION
GLOBAL SCALE & MFG EXCELLENCE

SVA™ A SUSTAINABLE ARCHITECTURE
VALUE FOR CUSTOMERS
Improves reliability and system performance
Enables assembly automation
Lowers total system costs
VALUE FOR APTIV
Increasing addressable content value
Enables automation and improved reuse
Expands competitive moat
