innovation in the new reality - deloitte in the new reality ... walt disney & nbc & news...
TRANSCRIPT

Innovation in the New Reality
Dutch Oil & Gas Conference
Bart Cornelissen, Rotterdam, June 27th 2016

© 2016 Monitor Deloitte The Netherlands
• Innovation in Oil & Gas - A new reality?
• The challenge – Cost reduction & beyond
• Collaboration – The way forward
• Building effective ecosystems
Topics for discussion
2

© 2016 Monitor Deloitte The Netherlands
Duration of Oil Price Declines since 1986 (WTI, Peak to Trough – % of Peak Price)
We are currently experiencing the longest crisis in decades
A new reality
3
40%
100%
80%
60%
0%750
20%
700650250 400 4503502001000 500 600300 55050 150
# Days
Source: Federal Reserve Bank of St. Louis; Monitor Deloitte analysis
March '86
December '88
December '08
January '07
March '98 June '16 (ongoing)

© 2016 Monitor Deloitte The Netherlands
Spending on R&D ($m)
Cost-cutting in recent years resulted also in a reduction of R&D spend by IOCs as well as oil service companies
A new reality
4
Oil Service CompaniesInternational Oil Companies
Source: CapitalIQ, Monitor Deloitte analysis
1.260
750707
1.044
1.318 1.353
707663
971
1.222
1.068
601
418
1.0081.093
-20%
-15%
-41%
-17%
-3%
20142013 2015
588556
1.174
601627
1.217
487483
1.094
-13% -17%
-7%

© 2016 Monitor Deloitte The Netherlands
0
40
60
20
50
10
70
30
Oil Price ($/bbl)
19941992 200019901986 1996 19981988 2002
0
200
300
100
800
700
500
600
400
900
Index price ($)
European IOC Share Price* (indexed) vs Brent Oil Price
After 1986, oil prices stayed low and stable for 10 years, nevertheless IOCs performed strongly with relatively low volatility
The challenge
Note: Custom index contains equally weighted average returns from Royal Dutch Shell, BP, Total and Elf Aquitaine (rebased at 1986=100)Source: Bloomberg
Brent crude oil price
1986 oil pricecollapse
European IOC index
Low oil prices during 1987-97, but IOCs performed strongly

© 2016 Monitor Deloitte The Netherlands
Production and Finding Costs ($/boe; in real 1987 dollars)
A ‘cost-culture’ was established, finding 5-6% real-term cost savings each year during 1987-97
The challenge
6
3
15
12
9
6
0
1994199319911989
Finding costs -5.7%
19971995 199619921990198819871985 1986
Production costs -5.4%
CAGR (’87-’97)
Fundamental costreductions (1987-97):
-5 - 6% p/a
Quick wins:-30.2% p/a
Note: IOCs include Shell, BP, Total and Elf AquitaineSource: Morgan Stanley Research 2015

© 2016 Monitor Deloitte The Netherlands
240
200
160
80
120
0
40
20102008 20112006 2014201320122002 2007200420032001 20152000 2005 2009
Upstream Cost Indices vs Global CPI Inflation (Y2000=100) and Brent Oil Price ($/bbl)
Highly inflated upstream costs clearly establish a role for innovation to drive fundamental cost reductions
The challenge
7
Source: IHS, IMF
CPI inflationUpstream Capital Cost IndexUpstream Operating Cost IndexBrent Oil Price
Quick costdeclines follow oil price drops

© 2016 Monitor Deloitte The Netherlands
Besides cost reduction the longer-term themes of late-life/ decom-missioning and energy transition will drive the need for innovation
The challenge
8
Late-life / decommissioning
Challenges Innovative solutions
Decommissioning equipmentavailability
New methodologies /supply chain & logistics
improvements
Supplier lack of experience / capability gaps
New methodologies/ ecosystem thinking
Limited experience with successful collaboration
New business models /
ecosystem thinking
Opportunity: $18b market (2015-2025, North Sea)
Energy transition
Challenges Innovative solutions
Short-term reduction of CO2 emissions
Efficient production of natural gas
Increasing demand for lower carbon
energy
Scale up decarbonisation
technology (CCS)*/***
Long-term reduction of CO2 emissions
Efficient undergroundinjection / large scale
gas separationdevelopment**
Optimise zero net carbon (ZNC) fuel
technology***
Opportunity: growing demand for lower carbon energy / continued low oil prices
Source: * www.shell.com; ** www.epa.gov; *** www.carbonbrief.org; Monitor Deloitte analysis

© 2016 Monitor Deloitte The Netherlands
CPO Focus (% of Survey Respondents)
Supplier collaboration is one of the most important strategies CPOs focus on to deliver value
The way forward
9
14
17
21
25
29
30
31
32
39
43
Restructuring existing relationships
Reducing total life cycle/ownership costs
Restructuring the supply base
Specification improvement
Consolidating spend
Reducing transaction costs
Increasing level of supplier collaboration
Increasing competition
Reducing demand
Outsourcing of non-core procurement activities
Note: The survey combines the opinions of 324 procurement leaders from 33 countries across several industriesSource: The Deloitte Global CPO Survey

© 2016 Monitor Deloitte The Netherlands
Collaboration is an integral part of business (%) Successful collaboration efforts by company (2015)
In O&G there is a long tradition of collaboration, though we struggle to do this successfully
The way forward
10
90%
66%
Oil Field ServicesOperators
Less than 25%
25-49%
50-74%
75% or more17%
100%
28%
32%
30%
14%
Unsure
100%
19%
Operators Oil Field Services
22%
22%
5%
11%
Success rate
% o
f re
spondents
% o
f re
spondents
Source: Deloitte Survey of UKCS operators and oilfield services companies (August 2015)

© 2016 Monitor Deloitte The Netherlands
Percentage of surveyed CPOs that are actively driving innovation with suppliers
To turn this around we might want to learn from other industries…
The way forward
11
10
21
313536
46
59
77
Healthcare & life sciences
Financial services
Technology media &
communications
Manufacturing Energy &
resources
Consumer business
Business & professional
services
Government & public sector
Note: The survey combines the opinions of 324 procurement leaders from 33 countries across several industriesSource: The Deloitte Global CPO Survey
© 2016 Monitor Deloitte The Netherlands
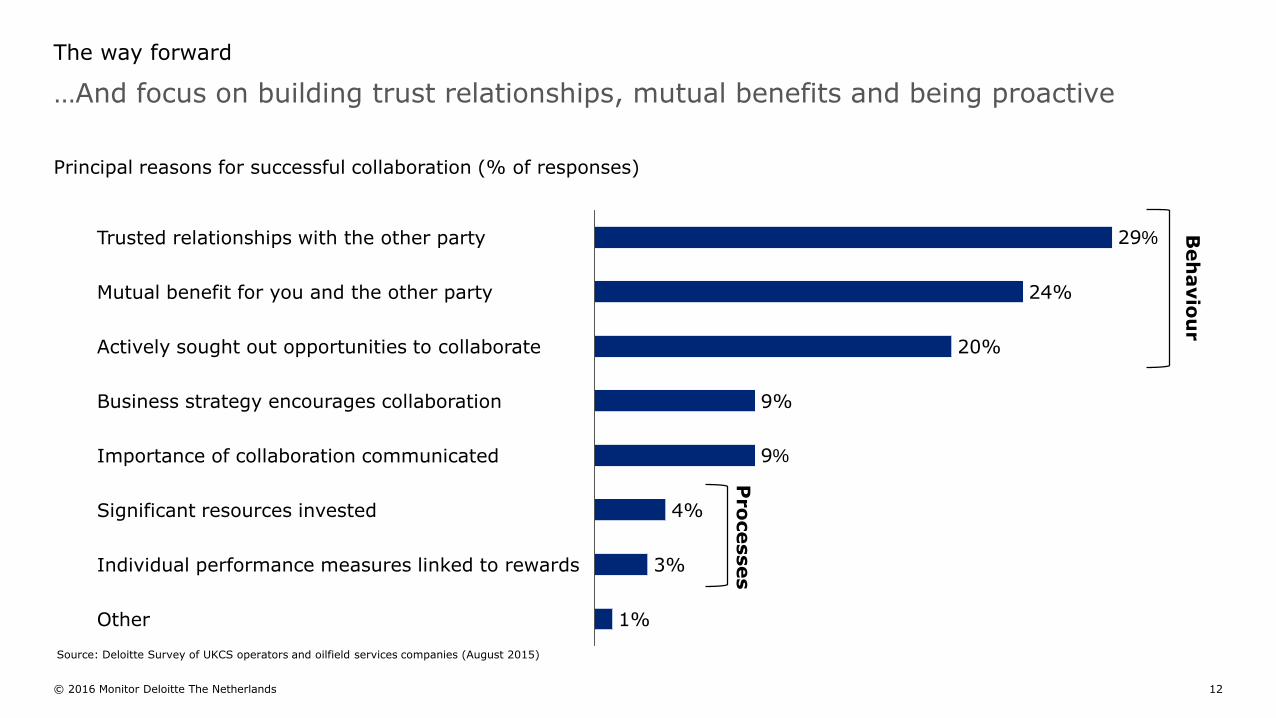
Principal reasons for successful collaboration (% of responses)
…And focus on building trust relationships, mutual benefits and being proactive
The way forward
12
Importance of collaboration communicated
9%
Actively sought out opportunities to collaborate 20%
1%
4%
29%
24%
Other
Individual performance measures linked to rewards
9%
3%
Business strategy encourages collaboration
Significant resources invested
Mutual benefit for you and the other party
Trusted relationships with the other party
Beh
avio
ur
Pro
cesses
Source: Deloitte Survey of UKCS operators and oilfield services companies (August 2015)

© 2016 Monitor Deloitte The Netherlands
We have seen some good examples of how collaboration may actually work to drive innovation
The way forward
1
Internet of Things (IoT)
Combination of semi-structured data from multiple
sources with advanced analytics algorithms
Use predictive analytics capabilities to spot business trends, gain new insights and
mine unexplored data
•Increased pump safety and decreased spills
•Improved critical decision making
Wh
at?
Wh
y?
Im
pact
www.pentaho.com
Advanced Materials
Collaboration of BP and four universities to perform
fundamental research on advanced materials
Combine complementary knowledge to become the market leader and be on the
forefront of emerging technologies
•Better performance in E&P•Improved knowledge on
carbon management, bioenergy, efficiency & storage
Wh
at?
Wh
y?
Im
pact
www.bp.com
New Business Models
Partnering based on a risk-based contract model for
deployment of FLNG technology
•Commercial alignment across the value chain
•Upside compensations (SLB)
• Improved cost structure / efficiency
•Provide a platform for further growth / collaboration with
other partners
Wh
at?
Wh
y?
Im
pact
www.slb.com / www.marketrealist.com

© 2016 Monitor Deloitte The Netherlands
Open partner platformsiPhone / App Store / Google Maps
External challengesP&G Connect & Develop / Netflix Prize
R&D / Technology brokeringGSD & ceeddTM / XETANOL & UTEK
Consortium / IncubatorUS Advanced Battery / IBM “Collaboraties” / Automotive
Value chain networkSABIC Innovative Plastics Network / IFF Value Chain Network
Partnership / Alliances / JVsWalt Disney & NBC & News Corp. / Nike & Apple iPod
Spectrum of ecosystem models
Collaborating across the value chain with different models creates ecosystems that in turn interact with other ecosystems and platforms
Building effective ecosystems
14
Captive Labs
SuppliersUniversities
Trade Customers
Industry Players
Expert Networks
VC Funds Internal
Competitor networks Supplier and customernetworks
Outsiders
Current ecosystem
Broad Reaching and Transactional
Focused and Collaborative

© 2016 Monitor Deloitte The Netherlands
In order to be successful, eight key elements need to be properly covered in the ecosystem
Building effective ecosystems
15
PARTNERS
STRATEGIC ALLIANCE
CHALLENGES
OPPORTUNITIESEXTERNAL EXPERTISE
ANALOGIES
KNOWLEDGE SHARING
SPONSORING & INCENTIVESIdentify & manage partner & portfolio relationships
Define long-term collaborative strategy fitting for all partners
Frame market problem statements and challenges
Create high impact opportunities
Attract relevant external expertise
Spot useful analogies in external companies and adjacent industries
Define optimal levels of IP and knowledge sharing with
partners
Provide sponsorships, metrics & incentives
Deloitte refers to one or more of Deloitte Touche Tohmatsu Limited, a UK private company limited by guarantee (“DTTL”), its network of member firms, and their related entities. DTTL and each of its member firmsare legally separate and independent entities. DTTL (also referred to as “Deloitte Global”) does not provide services to clients. Please see www.deloitte.nl/about for a more detailed description of DTTL and its memberfirms.
Deloitte provides audit, consulting, financial advisory, risk management, tax and related services to public and private clients spanning multiple industries. Deloitte serves four out of five Fortune Global 500®companies through a globally connected network of member firms in more than 150 countries bringing world-class capabilities, insights, and high-quality service to address clients’ most complex business challenges.To learn more about how Deloitte’s approximately 225,000 professionals make an impact that matters, please connect with us on Facebook, LinkedIn, or Twitter.
This communication contains general information only, and none of Deloitte Touche Tohmatsu Limited, its member firms, or their related entities (collectively, the “Deloitte Network”) is, by means of thiscommunication, rendering professional advice or services. Before making any decision or taking any action that may affect your finances or your business, you should consult a qualified professional adviser. No entityin the Deloitte Network shall be responsible for any loss whatsoever sustained by any person who relies on this communication.
© 2016 Monitor Deloitte The Netherlands