innovation in the textiles sector: a firm-level analysis ... · the lahore journal of economics 21...
TRANSCRIPT

The Lahore Journal of Economics 21 : SE (September 2016): pp. 129–166
Innovation in the Textiles Sector: A Firm-Level Analysis of
Technological and Nontechnological Innovation
Waqar Wadho* and Azam Chaudhry**
Abstract
In a knowledge-based economy, it has become increasingly important to better understand critical aspects of the innovation process such as innovation activities beyond R&D, the interaction among different actors in the market and the relevant knowledge flows. Using a sample of 431 textiles and apparel manufacturers, this paper explores the dynamics of firms’ innovation activities by analyzing their innovation behavior, the extent and types of innovation, the resources devoted to innovation, sources of knowledge spillovers, the factors hampering technological innovation and the returns to innovation for three years, 2013–15. Our results show that 56 percent of the surveyed firms introduced technological and/or nontechnological innovations, while 38 percent introduced new products, these innovations were generally incremental as the majority of innovations were new only to the firm. Furthermore, the innovation rate increases with firm size; large firms have an innovation rate of 83 percent, followed by medium firms (68 percent) and small firms (39 percent). Technologically innovative firms spent, on average, 10 percent of their turnover on innovation expenditure in 2015. Acquisition of machinery and equipment is the main innovation activity, accounting for 56 percent of innovation expenditures. Large firms consider foreign market sources (clients and suppliers) and small firms consider local market sources their key source of information and cooperation. 63 percent of technological innovators cite improving the quality of goods as their most important objective. Lack of available funds within the enterprise is the single most important cost factor hampering innovation, followed by the high cost of innovation. Our results show that 67 percent of the turnover among product innovators in 2015 resulted from product innovations that were either new to the market or new to the firm.
Keywords: Innovation, textiles, technological, non-technological, Pakistan.
JEL classification: O14, O32.
* Assistant Professor, Faculty of Economics, Lahore School of Economics. ** Dean and Professor, Faculty of Economics, Lahore School of Economics.

Waqar Wadho and Azam Chaudhry 130
1. Introduction
Recent developments in the theory of economic growth and availability of data highlight the importance of innovation for the sustained growth of output and productivity. The process of innovation benefits the economy in several ways: by increasing productivity, reducing costs, creating more and better jobs, diversifying industrial composition, increasing incomes, better marketing techniques and managerial restructuring of businesses.
However, our understanding of innovations and their economic impact is still limited, especially in developing countries. In recent years, information technology has led to an extraordinary increase in access to information and new markets for firms in many developing countries. This, coupled with increased globalization, is constantly changing the landscape of innovation and firm competitiveness. It has also resulted in greater international competition and new organizational forms for the effective management of global supply chains. As a result, knowledge has taken a central place as the main driver of innovation and economic growth. In such a knowledge-based economy, it has become increasingly important to better understand critical aspects of the innovation process, such as innovation activities beyond research and development (R&D), the interaction among different actors in the market and the relevant knowledge flows.
Using a sample of 431 Pakistani textiles and apparel manufacturers, this study explores the dynamics of firms’ innovation activities by analyzing their innovation behavior, the extent and types of innovation, the resources devoted to innovation, sources of knowledge spillovers, factors hampering technological innovation and the returns to innovation for three years, 2013–15. Textiles, like many other merchandise products, have experienced tremendous growth in recent years. World exports of textiles and clothing increased from $482 billion in 2005 to $797 billion in 2014. During the same period, Pakistani textile exports increased from $10.7 billion to $14 billion (US dollars). However, compared to the rest of the world, the textiles sector in Pakistan has been fairly stagnant and its share of world textile exports has been falling throughout the past decade.
As the major manufacturing sector of Pakistan, textiles contribute one fourth of industrial value-added and employ 40 percent of the industrial labor force. Most importantly, the sector accounts for, on average, 56 percent of national exports. Since it is competing in global markets, a continuous flow of innovation is required to at least maintain its share of world trade.

Technological and Nontechnological Innovation in the Textiles Sector 131
This competitive pressure requires the innovation of new products, new processes, new organizational structures and new marketing techniques to survive and strive in the global arena.
In Pakistan, two particular characteristics of textiles – scope and the production chain – posit both opportunities and challenges for becoming more innovative and competitive. First, even though textiles account for 56 percent of national exports, their share of world trade is less than 2 percent (1.8% in 2014). There is greater scope for increasing this world share through innovation and competitiveness. Particularly given the increasing trend in wages in China, the leading textiles exporter, coupled with the recent GSP plus status granted by Europe, openings are more likely for competitive textiles firms. Second, textiles have the longest production chain, with inherent potential for value addition at each stage of processing, from cotton to ginning, spinning, fabric, processing, made-ups and garments.
In this study, we take into account the fact that innovation is a dynamic and nonlinear system that is difficult to measure. Traditionally, two dominant ways of measuring innovation are R&D investment and patents. However, both these proxies are associated with inherent deficiencies. R&D investment is an input in the innovation process rather than an output. Thus, investing in R&D may or may not result in the introduction of new products or new processes in the market.
In the context of developing countries, firms generate technological advances outside formal R&D such as acquiring embedded technology through the purchase of machinery and hardware, licensing and the purchase of patents. In such cases, considering only formal R&D as an innovation effort might not capture the true extent of efforts to innovate. A patent on the other hand is an output, but poses two problems. First, not all innovations are patented. A firm’s propensity to patent varies by location (developed vs. developing countries), the type of business and innovations. Second, not all patents have the same practical application to the production of goods and processes.
Our treatment of innovation is based on the Oslo Manual (OECD & Eurostat, 2005) and its recommendations for developing countries. It incorporates the idea of Schumpeterian “creative destruction” whereby innovation is a dynamic process in which new technologies replace the old. Schumpeter (1934) proposes five types of innovation: (i) introducing new products, (ii) introducing new methods of production, (iii) opening up new markets, (iv) developing new sources of supply for raw materials and

Waqar Wadho and Azam Chaudhry 132
inputs, and (v) creating new market structures in an industry. Similarly, it encompasses aspects of industrial organization (Tirole, 1995), uncertainties in innovation (Rosenberg, 1994), organizational structure (Lam, 2005), marketing mix models (Perreault & McCarthy, 2005) and the diffusion of technologies (Hall, 2005).1
The resulting framework highlights the driving forces behind innovation, the importance of technological aspects such as product and process, nontechnological aspects such as organizational and marketing practices, the role of cooperation and linkages and the view of innovation as a system. More recently, many countries, especially in Europe, are using the Oslo Manual framework to conduct innovation surveys. In Europe, community innovation surveys are designed based on this framework and are conducted at regular intervals.
Our survey results show that 56 percent of firms introduced technological or nontechnological innovations. While 38 percent of firms introduced new products, these innovations were generally incremental as the vast majority of innovations were new only to the firm. Six enterprises introduced products that were new to the world – all six are in Sialkot – and 30 enterprises introduced new products to their market. The innovation rate increases with firm size: large firms have an innovation rate of 83 percent, followed by medium firms (68 percent) and small firms (39 percent). Technologically innovative firms spent, on average, 10 percent of their turnover on innovation expenditure in 2015.
Acquiring newer vintages of capital with the aim of introducing new or improved products and processes is the dominant innovation activity. Acquisition of machinery and equipment is the main innovation activity, accounting for 56 percent of innovation expenditures. About 31 percent of innovation expenditure is on R&D (25 percent on in-house and 6 percent on external R&D). Overall, firms consider market sources their most important source of knowledge spillover. However, large firms consider foreign market sources (clients and suppliers) and small firms consider local market sources their key source of information and cooperation.
Firms appear to focus more on innovations that promote growth and product outcomes dominate their objectives: 63 percent of technological innovators cite improving the quality of goods as their most important objective. The lack of available funds within the enterprise is the single most important cost factor hampering innovation, followed by the high cost of
1 See Chapter 2 of the Oslo Manual for a detailed description.

Technological and Nontechnological Innovation in the Textiles Sector 133
innovation. The economic importance of innovation seems very high, as measured by the percentage share due to innovative products. Our results show that 67 percent of the turnover among product-innovative firms in 2015 resulted from product innovations that were either new to the market or new to the firm.
The rest of the paper is structured as follows. Section 2 describes our methodology and data collection. Section 3 presents the descriptive statistics and results with a discussion. Section 4 concludes the study.
2. Survey and Data
The textiles sector is defined as all manufacturers classified under Sections 13 and 14 of the Pakistan Standard Industrial Classification (PSIC) 2010 (International Standard Industrial Classification 17 and 18). The total population of such firms is around 4,458. Table 1 gives a province-wise breakdown of these units.
Table 1: Provincial distribution of textiles and related product manufacturing firms
Province Number of manufacturing firms
% of total population
Punjab 2,687 60.3
Sindh 1,592 35.7
KP 128 2.9
Balochistan 51 1.1
Total 4,458 100.0
Source: Authors’ calculations based on data from the provincial bureaus of statistics.
Our study focuses only on Punjab and Sindh.2 We have used the Directory of Industries3 for both provinces as a basic data frame and then worked with the Bureau of Statistics in Punjab and in Sindh to update and clean the directory. We concentrate on major textile hubs in these provinces, drawing samples for only those districts or regions that represent at least 1.5 percent of the total population of textiles and related product manufacturers in Pakistan.4
2 This decision was primarily driven by the lower concentration of manufacturing units in the other
two provinces. 3 The same is used for the Census of Manufacturing Industries and only firms with a minimum of ten
workers are included. 4 This was decided to avoid districts with a lower concentration of units, which could inflate the cost
of the survey.

Waqar Wadho and Azam Chaudhry 134
A total of six districts in Punjab (Faisalabad, Lahore, Gujranwala, Kasur, Sheikhupura and Sialkot) had concentrations equal to or greater than 1.5 percent. In Sindh, however, a priori it was difficult to determine the districts with accuracy and we relied more on the regions of Karachi and Hyderabad/Jamshoro.5 We drew a stratified random sample representative first at the provincial level and then at the district/regional level. The total sample size was 15 percent of the population (3,946 firms) of the selected areas or 592 firms. However, given the significance of the Karachi region, which accounts for 33.9 percent of all textiles and related product manufacturers in Pakistan, coupled with an expected low response rate (given the less clean data frame and volatile security situation), we oversampled Karachi by 10 percent. As a result, our total sample after oversampling comprised 614 firms. The distribution of the population of interest across the two provinces, their weight and sample size are shown in Tables 2 to 4.
Table 2: Distribution, weight and sample size, by province
Province (population of
selected regions only)
Number of
firms
Weight Sample size
Punjab 2,367 60.0% 355
Sindh a 1,579 40.0% 259
Total 3,946 614
Note: a = after adjusting for 10 percent oversampling for the Karachi region. Source: Authors’ calculations based on data from the provincial bureaus of statistics.
Table 3: Distribution, weight and sample size, by district (Punjab)
District Number of firms Weight Sample size
Faisalabad 1,128 47.7% 169
Lahore 466 19.7% 70
Gujranwala 246 10.4% 37
Kasur 219 9.3% 33
Sheikhupura 167 7.1% 25
Sialkot 141 6.0% 21
Total 2,367 355
Source: Authors’ calculations based on data from the provincial bureaus of statistics.
5 Before 2004, Jamshoro was part of Dadu district.

Technological and Nontechnological Innovation in the Textiles Sector 135
Table 4: Distribution, weight and sample size, by district (Sindh)
District Total number
of firms
Weight Sample size
Karachi (all districts) 1,511 95.7% 227
Karachi (all districts) – number of oversampled firms
22
Hyderabad and Jamshoro 68 4.3% 10
Total 1,579 259
Source: Authors’ calculations based on data from the provincial bureaus of statistics.
Out of 614 firms drawn for the sample, 431 participated voluntarily in the survey, resulting in a response rate of 70.2 percent (Table 5).
Table 5: Survey response rate
Province Sample
size
Surveyed
firms
Response
rate
Closed/not
found
% Refusals %
Punjab 355 307 86.5% 46 13.0 2 0.5
Sindh 259 124 47.9% 93 35.9 42 16.2
Overall 614 431 70.2% 139 22.6 44 7.2
Source: Authors’ calculations based on data from the provincial bureaus of statistics.
3. Results
This section gives the results of the innovation and nontechnological innovation rates.
1.1 Innovation Rate
The innovation rate is defined as the implementation of a new or significantly improved product, process, marketing method or managerial method in business practices, workplace organization or external relations. The minimum requirement for innovation is that the product, process, organizational method or marketing method must be new to the firm, whether it was originally developed by that firm or adopted from other firms or organizations.
Overall, 56 percent of firms were involved in either technological or nontechnological innovation or had ongoing or abandoned innovation activities during the three-year period 2013–15. Sindh has a 75 percent innovation rate compared to 49 percent for Punjab (Table 6).

Waqar Wadho and Azam Chaudhry 136
Table 6: Innovation rate, by province
Province Innovation rate
Punjab 49%
Sindh 75%
Overall 56%
Source: Authors’ calculations based on data from the provincial bureaus of statistics.
A geographical breakdown at the district level provides interesting insights into the concentration of innovative firms. Karachi Central is the most innovative district with an innovation rate of 96 percent. Kasur is the least innovative, with an innovation rate of only 11 percent (Figure 1).6
Figure 1: Innovation rate, by district
In Punjab, Sialkot is the most innovative district (78 percent) whereas Faisalabad, the district with the most textile units, has an innovation rate of 46 percent.
1.2 Types of Innovation
Technological innovation can be categorized into product and process innovations. Product innovation is the introduction of a good that is
6 Jamshoro, Malir and Hyderabad are excluded due to limited observations (one and two each,
respectively).
0%
10%
20%
30%
40%
50%
60%
70%
80%
90%
100%

Technological and Nontechnological Innovation in the Textiles Sector 137
new or significantly improved with respect to its characteristics or intended use. Process innovation is the implementation of a new or significantly improved production or delivery method. Similarly, nontechnological innovation is categorized as managerial or marketing innovation. Managerial innovation is the introduction of a new organizational method in the firm’s business practices, workplace organization or external relations. Marketing innovation is the implementation of a new marketing method involving significant changes in product design or packaging, product placement, product promotion or pricing.
Figure 2: Innovation rate, by type
Overall, 48 percent of the enterprises were involved in product or/and process innovations or reported ongoing or abandoned innovation activities during the sample period (Figure 2). This is striking since almost every second enterprise in the textiles sector has introduced a new product or/and a new process during these three years. While 14 percent of firms have either introduced a new product or a new process, 8 percent have introduced managerial or/and marketing innovations and 33 percent have introduced both technological and nontechnological innovations. Only 1 percent of enterprises are technologically active, i.e., they have ongoing innovations or have abandoned technological innovation activities during the sample period.
Technological Innovation Only
14%
Non-Technological Innovation Only
8%
Technological & Non-Technological
Innovations33%
Ongoing or Abandoned Innovations
1%
No Innovation44%

Waqar Wadho and Azam Chaudhry 138
1.3 Innovation Rate by Firm Attributes
The literature on innovation suggests that firm-level attributes such as firm size, the main market in which firms sell their products and firm type affect innovation behavior.
1.3.1 Firm Size
Firms are classified as small, medium or large depending on the size of the workforce. Firms with 10–49 employees are classified as small, firms with 50–249 employees are classified as medium and firms with 250 or more employees are classified as large.
There are striking differences in the innovation rate across firms of different sizes. Large firms are more than twice as innovative as small firms. A similar trend emerges between technological innovation rates and firm size. Table 7 shows that, as firm size increases, the percentage of firms that introduced technological innovations alone or both technological and nontechnological innovations increases. While the percentage of firms that introduced only nontechnological innovations falls. This shows that bigger firms tend to introduce more technological innovations. Another trend (column 3) is that, as firm size increases, firms are more likely to introduce both technological and nontechnological innovations.
Table 7: Innovation rate, by type and firm size
Firm size Technological Nontech. Tech. and
nontechnological
Ongoing or
abandoned
Overall
rate
Small 11% 10% 17% 1% 39%
Medium 16% 8% 43% 2% 68%
Large 20% 5% 58% 0% 83%
Source: Authors’ calculations based on data from the provincial bureaus of statistics.
1.3.2 Main Market
The main market of a given set of enterprises is their largest geographical market in terms of turnover during 2013–15. The questionnaire included nine different exhaustive geographical regions: local/regional (some provinces of Pakistan), national (across Pakistan), Europe, the US, the Middle East, China, Bangladesh, the rest of Asia and the rest of the world.

Technological and Nontechnological Innovation in the Textiles Sector 139
Firms with the Middle East as their main market are the most innovative (100 percent),7 followed by the US (91 percent) and Europe (80 percent). Firms whose main market is the local market are the least innovative (41 percent). Table 8 presents a market-wise breakdown of innovative firms.8 Overall, firms with international markets as their main market are more innovative than firms targeting local markets.
Table 8: Innovation rate, by market
Local Pakistan Europe US Middle East
Innovation rate 41% 56% 80% 91% 100%
Source: Authors’ calculations based on data from the provincial bureaus of statistics.
1.3.3 Industrial Classification
Innovation behavior also varies by type or the firm’s main activity. We divide the sample into two broad categories: textiles and wearing apparel manufacturers (PSIC 13 and 14, respectively). Manufacturers of wearing apparel are more innovative (67 percent) than manufacturers of textiles (54 percent). They have a higher technological as well as nontechnological innovation rate. Since wearing apparel is generally at a higher stage in the textiles value chain, these firms are also perceived as being more innovative, which the data confirms (Table 9).
Table 9: Innovation rate, by industrial classification
Industrial classification Overall Technological Nontechnological
Manufacturers of wearing apparel 67% 62% 56%
Manufacturers of textile 54% 45% 38%
Overall 56% 48% 41%
Source: Authors’ calculations based on data from the provincial bureaus of statistics.
1.4 Technological Innovation Rate
The technological innovation rate is defined as the percentage of surveyed enterprises that reported any product or process innovations or both during 2013–15 as well as those firms that had ongoing or abandoned innovations during this time. Our results (shown in Table 10) show that 48
7 We have eight observations for the Middle East. 8 Since we have very few observations for Bangladesh, China, the rest of Asia and the rest of the
world (2, 3, 1 and 1, respectively), these markets are excluded from the discussion. Furthermore,
three firms did not mention their main market at all.

Waqar Wadho and Azam Chaudhry 140
percent of enterprises were involved in either product or process innovation or both or had ongoing or abandoned innovation activities during the sample period. About 60 percent of firms in Sindh introduced technological innovations compared to 43 percent in Punjab.
Table 10: Technological innovation rate, by province
Province Technological innovation rate
Punjab 43%
Sindh 60%
Overall 48%
Source: Authors’ calculations based on data from the provincial bureaus of statistics.
The breakdown of technological innovation at the district level (shown in Figure 3) reveals significant differences across districts. Sialkot is the most technologically innovative district in Pakistan with an innovation rate of 78 percent, followed by Karachi Central at 70 percent. Kasur is the least technologically innovative district in Pakistan with an innovation rate of 11 percent. Faisalabad, the textiles hub of Pakistan, has a technological innovation rate of 39 percent.
Figure 3: Technological innovation rate, by district
A detailed type-wise analysis of technological innovation reveals that almost half the technologically innovative firms have introduced both product and process innovation. Sialkot has the highest (56 percent) rate, whereas Gujranwala has the lowest rate (6 percent) for product as well as
0%
10%
20%
30%
40%
50%
60%
70%
80%

Technological and Nontechnological Innovation in the Textiles Sector 141
process innovation. Karachi Central has the highest rate (37 percent) for product-only innovation but 0 percent for process innovation. Sheikhupura and Kasur have a 0 percent product-only innovation rate (Figure 4).
Figure 4: Technological innovation, by type and district
Sheikhupura has the highest process-only (36 percent) innovation rate, followed by Korangi with 26 percent. Karachi Central and Kasur have a 0 percent process-only innovation rate. Sheikhupura and Faisalabad are the only two districts where the process-only innovation rate is highest.
1.5 Technological Innovation and Firm Size
There is considerable variation across firm sizes regarding the type of technological innovation introduced during 2013–15. Table 11 reveals that the percentage of firms introducing product-only innovation is higher for medium firms. Overall, a small fraction of large firms introduced product-only innovation and a bigger fraction introduced both product and process innovation. This shows a positive association between product and process innovations for large firms. However, there is not much variation in the type of innovation introduced by small firms.
0%
10%
20%
30%
40%
50%
60%
Product Innovation Only Process Innovation Only
Product & Process Innovations Ongoing or Abandoned Innovations

Waqar Wadho and Azam Chaudhry 142
Table 11: Technological innovation, by type and size
Firm size Product Process Product and
process
Ongoing or
abandoned
Small 8% 10% 8% 3%
Medium 11% 13% 33% 3%
Large 5% 29% 42% 0%
Overall 8% 15% 22% 2%
Source: Authors’ calculations based on data from the provincial bureaus of statistics.
1.6 Technological Innovation: Detailed Types
The previous section measured technological innovation as the introduction of new products and/or processes to the market. However, this does not completely measure the extent of innovation. The extent of innovation can be also measured by looking at the degree of novelty of product innovations. We provide a detailed analysis of product and process innovations by looking at the degree of novelty of product innovations and types of process innovations reported by firms. Further, we show how the degree of novelty and type of process innovation vary across locations and types of firms.
1.6.1 Product Innovation Type
Product innovations differ in their degree of novelty. We categorize these into three distinct types. A product innovation is considered new to the firm if it is being employed by the firm for the first time, even if it has already been introduced to the market by another firm. A new product innovation can also mean that one firm has introduced it to the market before its competitors, although the same innovation may already have been introduced to other markets. The market is defined as the firm and its competitors and can include a geographic region or product line. Finally, a world-first innovation is one that has been introduced by a firm to its market, but is also new to all markets.
Overall, 38 percent of enterprises introduced new products during 2013–15. A further breakdown (show in Table 12) reveals that the share of innovations that are new to the world is quite low (only around 1 percent). Out of 431 firms, six introduced product innovations new to the world and 30 introduced product innovations new to the market.

Technological and Nontechnological Innovation in the Textiles Sector 143
Table 12: Product innovation novelty, by province
Province World first % New to market % New to firm %
Punjab 6 2 22 7 76 25
Sindh 0 0 8 6 52 42
Overall 6 1 30 7 128 30
Source: Authors’ calculations based on data from the provincial bureaus of statistics.
Overall, Sindh has a higher percentage of firms with product innovations, while Punjab has a higher percentage of product innovations that are new to the world and new to the market (Figure 5). All six product innovations new to the world originate from Sialkot, which is well-known for surgical goods and is also a leading manufacturer of sports goods. This result suggests that it is also the leading district in product innovations.
Figure 5: Product innovation novelty, by province
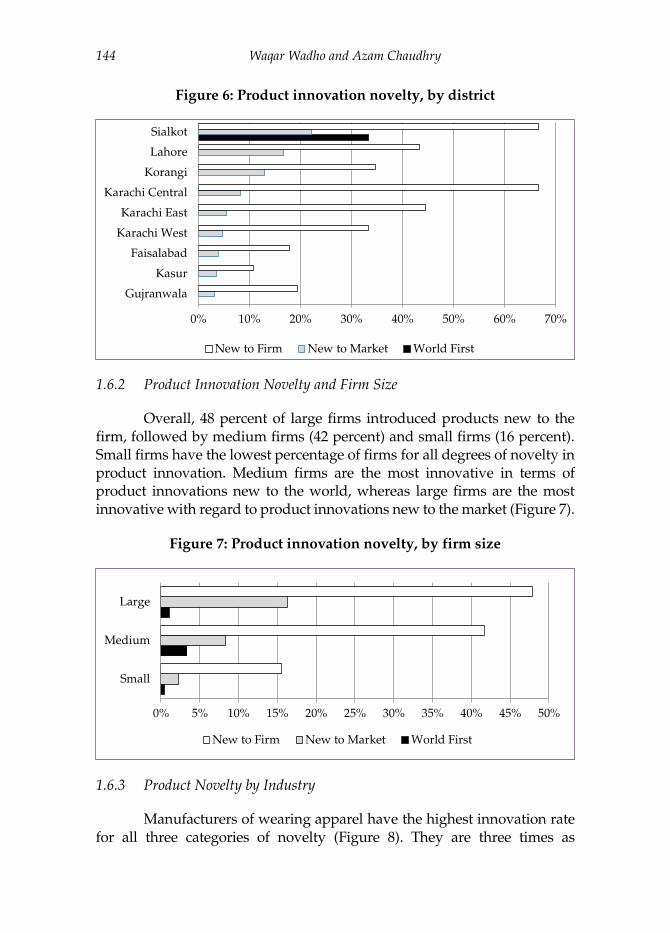
Figure 6 shows that Sialkot has the highest percentage (22 percent) of firms that introduced products new to the market, followed by Lahore (17 percent) and Korangi (13 percent). Sialkot and Karachi Central have the highest percentage (67 percent) of firms with product innovations new to the firm, followed by Karachi East (44 percent) and Lahore (43 percent). Faisalabad accounts for 4 percent of the firms with innovations new to the market and 18 percent of the firms with product innovations new to the firm.
0% 5% 10% 15% 20% 25% 30% 35% 40% 45%
World First (%)
New to Market (%)
New to Firm (%)
Sindh Punjab
Waqar Wadho and Azam Chaudhry 144
Figure 6: Product innovation novelty, by district
1.6.2 Product Innovation Novelty and Firm Size
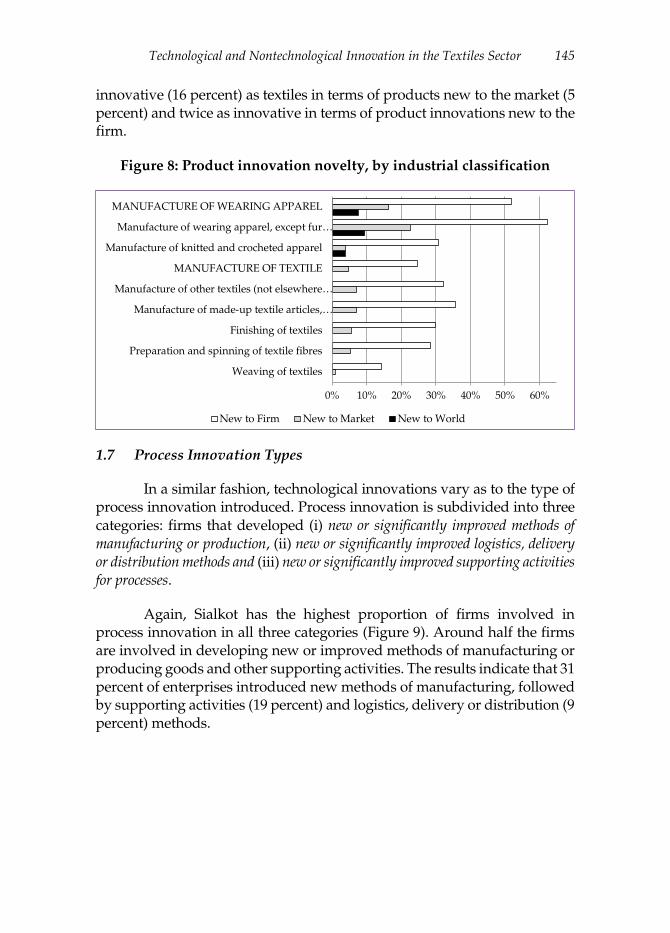
Overall, 48 percent of large firms introduced products new to the firm, followed by medium firms (42 percent) and small firms (16 percent). Small firms have the lowest percentage of firms for all degrees of novelty in product innovation. Medium firms are the most innovative in terms of product innovations new to the world, whereas large firms are the most innovative with regard to product innovations new to the market (Figure 7).
Figure 7: Product innovation novelty, by firm size
1.6.3 Product Novelty by Industry
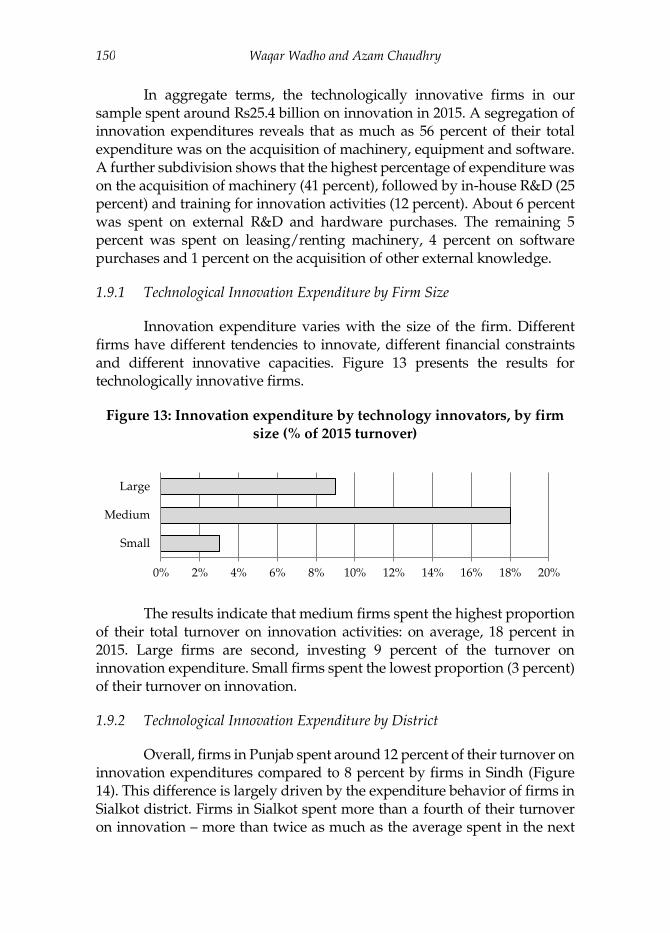
Manufacturers of wearing apparel have the highest innovation rate for all three categories of novelty (Figure 8). They are three times as
0% 10% 20% 30% 40% 50% 60% 70%
Gujranwala
Kasur
Faisalabad
Karachi West
Karachi East
Karachi Central
Korangi
Lahore
Sialkot
New to Firm New to Market World First
0% 5% 10% 15% 20% 25% 30% 35% 40% 45% 50%
Small
Medium
Large
New to Firm New to Market World First
Technological and Nontechnological Innovation in the Textiles Sector 145
innovative (16 percent) as textiles in terms of products new to the market (5 percent) and twice as innovative in terms of product innovations new to the firm.
Figure 8: Product innovation novelty, by industrial classification
1.7 Process Innovation Types
In a similar fashion, technological innovations vary as to the type of process innovation introduced. Process innovation is subdivided into three categories: firms that developed (i) new or significantly improved methods of manufacturing or production, (ii) new or significantly improved logistics, delivery or distribution methods and (iii) new or significantly improved supporting activities for processes.
Again, Sialkot has the highest proportion of firms involved in process innovation in all three categories (Figure 9). Around half the firms are involved in developing new or improved methods of manufacturing or producing goods and other supporting activities. The results indicate that 31 percent of enterprises introduced new methods of manufacturing, followed by supporting activities (19 percent) and logistics, delivery or distribution (9 percent) methods.
0% 10% 20% 30% 40% 50% 60%
Weaving of textiles
Preparation and spinning of textile fibres
Finishing of textiles
Manufacture of made-up textile articles,…
Manufacture of other textiles (not elsewhere…
MANUFACTURE OF TEXTILE
Manufacture of knitted and crocheted apparel
Manufacture of wearing apparel, except fur…
MANUFACTURE OF WEARING APPAREL
New to Firm New to Market New to World

Waqar Wadho and Azam Chaudhry 146
Figure 9: Process innovation types, by district
1.8 Nontechnological Innovation Rate
The nontechnological innovation rate is the percentage of firms that reported any managerial innovations, marketing innovations or both during 2013–15. Overall, 41 percent of the enterprises were involved in either managerial or marketing innovations or both (Table 13). A province-wise breakdown of nontechnological innovation reveals a similar pattern to that found in the analysis of technological innovation. Sindh has a higher innovation rate than Punjab, with 60 percent of firms in Sindh having introduced nontechnological innovations. This is almost double the innovation rate for Punjab (34 percent).
Table 13: Nontechnological innovation rate, by province
Province Nontechnological innovation rate
Punjab 34%
Sindh 60%
Overall 41%
Source: Authors’ calculations based on data from the provincial bureaus of statistics.
0%
10%
20%
30%
40%
50%
60%
New or significantly improved methods of manufacturing or producing goodsNew or significantly improved logistics, delivery or distribution methodsNew or significantly improved supporting activities

Technological and Nontechnological Innovation in the Textiles Sector 147
A stratification of the sample by nontechnological innovation rates by district shows that Karachi East is the most innovative district, with an innovation rate as high as 92 percent, followed by Sialkot (72 percent). Gujranwala has the lowest nontechnological innovation rate of just 13 percent. Again, Faisalabad has a modest rate of 31 percent (Figure 10).
Figure 10: Nontechnological innovation rate, by district
1.8.1 Managerial and Marketing Innovations by District and Type
A disaggregation of the data by type of nontechnological innovation reveals that, overall, 21 percent of firms introduced both managerial and marketing innovations, 14 percent introduced marketing-only innovations and 6 percent introduced managerial-only innovations. Nontechnological innovation behavior differs between the two provinces: firms in Sindh have the highest percentage of marketing-only innovations (24 percent) while those in Punjab have the highest managerial as well as marketing (23 percent) innovations.
Figure 11 shows that Sialkot has the highest managerial plus marketing innovation rate (56 percent), followed by Korangi (43 percent). Sheikhupura has the lowest rate (7 percent). Karachi Central has the highest marketing-only innovation rate (71 percent), followed by Karachi East (33 percent). Korangi and Kasur have a 0 percent marketing-only innovation rate. Korangi has the highest managerial-only innovation rate (17 percent), followed by Karachi West (14 percent). Sialkot, Gujranwala, Kasur and Karachi South have a 0 percent managerial-only innovation rate.
0%10%20%30%40%50%60%70%80%90%
100%

Waqar Wadho and Azam Chaudhry 148
Figure 11: Type of nontechnological innovation, by district
1.8.2 Types of Nontechnological Innovation by Firm Size
Large firms have the highest nontechnological innovation rate (63 percent), followed by medium firms (51 percent). Small firms have the lowest rate (26 percent). Large firms are found to be the most active in all three categories: 10 percent for managerial-only innovation, 14 percent for marketing-only innovation and 39 percent for managerial and marketing innovation. Medium firms have relatively high rates of nontechnological innovation in all three categories.
Table 14: Types of nontechnological innovation, by firm size
Firm size Managerial Marketing Managerial and
marketing
Small 5% 16% 5%
Medium 7% 9% 35%
Large 10% 14% 39%
Overall 6% 14% 21%
Source: Authors’ calculations based on data from the provincial bureaus of statistics.
Table 14 shows that around 35 percent of medium firms are involved in both managerial and marketing innovations – the highest type among them. Both large and medium firms have the highest managerial and marketing innovation rate, followed by marketing-only and management-only innovation rates, respectively. However, small firms have the highest
0%
10%
20%
30%
40%
50%
60%
70%
80%
Managerial Innovation Only Marketing Innovation OnlyManagerial & Marketing Innovations

Technological and Nontechnological Innovation in the Textiles Sector 149
marketing-only innovation rate and an equal rate for managerial-only and managerial-plus-marketing innovations.
1.9 Expenditure on Technological Innovation
Traditionally, R&D expenditure measures the monetary resources devoted to innovation. However, in widely used indicators such as that proposed by the Frascati manual, many important inputs – such as the acquisition of machinery and training for innovative activities and expenditures related to the market introduction of innovations – are excluded. To overcome these deficiencies, the Oslo Manual proposes a broader input measure of innovation expenditure that takes into account most innovation-related expenditures. Innovation input is defined as the innovation cost or expenditure that includes innovation/investment in the following activities: in-house R&D, external R&D, the acquisition of machinery, equipment and software, other external knowledge, training for innovative activities, the market introduction of innovations and others (including design).
Firms were asked if they were active in any of the above categories over the three years 2013–15 and to estimate their innovation spending in each category for 2015 only. Overall, 9 percent of the turnover in 2015 (both innovative and noninnovative firms) was spent on innovation expenditure (Figure 12).9 For those firms that were technologically innovative, the innovation expenditure stood at 10 percent of their turnover in 2015.
Figure 12: Innovation expenditure, by type
9 Not all firms provided data on their turnover: of 431 firms that responded to the questionnaire, 377
provided data on turnover.
In-house R&D25%
External R&D6%
Acquisition of Machinery
41%
Hardware Purchases6%
Software Purchases4%
Lease or rental of machinery/equipment
5%
Acquisition of other external knowledge
1%
Training for innovation activities
12%
Waqar Wadho and Azam Chaudhry 150
In aggregate terms, the technologically innovative firms in our sample spent around Rs25.4 billion on innovation in 2015. A segregation of innovation expenditures reveals that as much as 56 percent of their total expenditure was on the acquisition of machinery, equipment and software. A further subdivision shows that the highest percentage of expenditure was on the acquisition of machinery (41 percent), followed by in-house R&D (25 percent) and training for innovation activities (12 percent). About 6 percent was spent on external R&D and hardware purchases. The remaining 5 percent was spent on leasing/renting machinery, 4 percent on software purchases and 1 percent on the acquisition of other external knowledge.
1.9.1 Technological Innovation Expenditure by Firm Size
Innovation expenditure varies with the size of the firm. Different firms have different tendencies to innovate, different financial constraints and different innovative capacities. Figure 13 presents the results for technologically innovative firms.
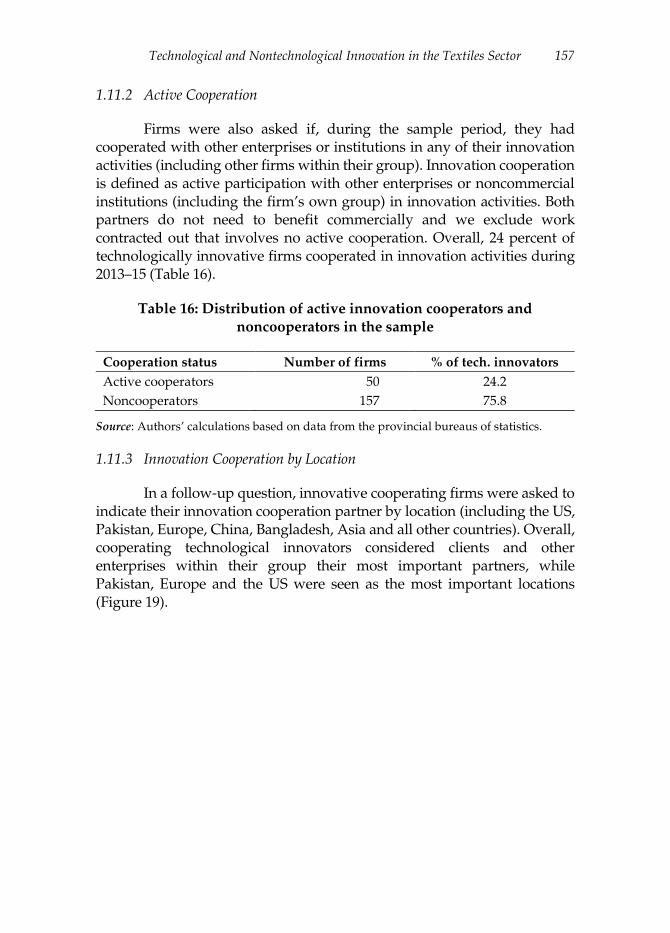
Figure 13: Innovation expenditure by technology innovators, by firm
size (% of 2015 turnover)
The results indicate that medium firms spent the highest proportion of their total turnover on innovation activities: on average, 18 percent in 2015. Large firms are second, investing 9 percent of the turnover on innovation expenditure. Small firms spent the lowest proportion (3 percent) of their turnover on innovation.
1.9.2 Technological Innovation Expenditure by District
Overall, firms in Punjab spent around 12 percent of their turnover on innovation expenditures compared to 8 percent by firms in Sindh (Figure 14). This difference is largely driven by the expenditure behavior of firms in Sialkot district. Firms in Sialkot spent more than a fourth of their turnover on innovation – more than twice as much as the average spent in the next
0% 2% 4% 6% 8% 10% 12% 14% 16% 18% 20%
Small
Medium
Large

Technological and Nontechnological Innovation in the Textiles Sector 151
district in line. Firms in Sialkot spent 27 percent of their turnover in 2015 on innovation-related expenditures, followed by Karachi South and Faisalabad (12 percent). Firms in Sheikhupura spent only 1 percent and firms in Karachi West spent 2 percent of their turnover.
Figure 14: Innovation expenditure by technology innovators, by district
(% of 2015 turnover)
1.9.3 Innovation Expenditure by Industrial Classification
The wearing apparel industry invested over one fifth of its turnover in innovation inputs (22 percent). On the other hand, textiles firms only spent about 5 percent of their turnover on innovation activities (Figure 15).
A further analysis within each industry reveals noticeable differences in innovation expenditure among different types of firms. Overall, manufacturers of knitted and crocheted apparel invested the largest proportion in innovation. On average, firms in this subcategory spent 28 percent of their turnover in 2015 on innovation-related expenditures. Manufacturers of apparel were second, with 15 percent of their turnover spent on innovation.
0% 5% 10% 15% 20% 25% 30%
Sheikhupura
Kasur
Gujranwala
Lahore
Faisalabad
Sialkot
PUNJAB
Karachi West
Karachi East
Karachi Central
Korangi
Karachi South
SINDH

Waqar Wadho and Azam Chaudhry 152
Figure 15: Innovation expenditure by technology innovators, by PSIC
code (% of 2015 turnover)
1.10 Product Innovation Turnover
Innovation inputs such as R&D expenditure culminate in benefits for the innovative firm in the form of increased turnover. This is also a useful indicator of the innovation intensity of product innovations. Firms were asked to estimate how much of their total turnover in 2015 was attributable to product innovations, separated into new-to-the-market innovations (a measure of novelty and creativity) and new-to-the-firm innovations (those adopted by the firm but invented elsewhere). The product innovations could have been introduced at any stage during the sample period.
1.10.1 Innovation Turnover
The share of innovative activities in turnover quantifies the intensity of product innovations. Overall, the share of turnover in 2015 attributed to products that were new to the market and new to the firm for all product-innovative and noninnovative firms was 48 percent. A more accurate measure would be the share of innovative output for only those firms that introduced any product innovation during the three years 2013–15. Overall, 67 percent of the turnover of product-innovative firms in 2015 resulted from product innovations that were either new to the market or to the firm.
0% 5% 10% 15% 20% 25% 30%
Manufacture of carpets and rugs
Preparation and spinning of textile fibres
Finishing of textiles
Manufacture of other textiles (not…
Weaving of textiles
Manufacture of made-up textile articles,…
MANUFACTURE OF TEXTILE
Manufacture of wearing apparel, except fur…
Manufacture of knitted and crocheted…
MANUFACTURE OF WEARING APPAREL

Technological and Nontechnological Innovation in the Textiles Sector 153
1.10.2 Share of Innovation Turnover by District
Overall, there is a noticeable difference between firms in the two provinces. Punjab has higher rates of turnover from product innovation than Sindh. Apart from Sheikhupura, the innovation output of all districts in Punjab is very high (Figure 16). Faisalabad has the highest ratio (96 percent), implying that product-innovative firms attributed almost all their turnover in 2015 to products that were either new to the firm or new to the market. Gujranwala has an innovation output of 86 percent, followed by Sialkot (80 percent). Sindh has a 41 percent innovation output: Karachi West has the highest ratio (52 percent), followed by Karachi Central (42 percent).
Figure 16: Turnover share of innovation output for product innovators,
by district
1.10.3 Share of Innovation Turnover by Firm Size
There is little variation in innovation output across firms of different sizes (Figure 17). Medium firms have the highest innovation output ratio (68 percent), followed by large firms (67 percent) and small firms (65 percent).
0% 10% 20% 30% 40% 50% 60% 70% 80% 90% 100%
Kasur
Lahore
Sialkot
Gujranwala
Faisalabad
PUNJAB
Karachi East
Korangi
Karachi South
Karachi Central
Karachi West
SINDH

Waqar Wadho and Azam Chaudhry 154
Figure 17: Turnover share of innovation output for product innovators,
by firm size
1.10.4 Share of Innovation Turnover by Industrial Classification
Disaggregating turnover with respect to industrial classification shows that there is no variation between manufacturers of textiles and wearing apparel. Both have innovation turnovers of 67 and 66 percent, respectively. However, a detailed analysis of subcategories reveals some heterogeneity. Firms engaged in spinning textile fibers have the highest innovation turnover ratio (80 percent), followed by manufacturers of wearing apparel (69 percent). Firms that fall under the category of textiles finishing have the lowest innovation turnover (40 percent).
1.10.5 Share of Innovation Turnover by Market
The classification of innovation turnover by the main market (shown in Figure 18) reveals striking differences. Product innovators with the Middle East as their main market have an innovation output of 96 percent of their total turnover in 2015. Interestingly, almost all sales to the Middle East by product innovators involve innovations that were either new to the market or at least new to the firm. This is followed by Europe, with an innovation output of 85 percent. The US and local markets have the lowest (42 percent) innovation outputs as a percentage of total turnover in 2015.
0% 10% 20% 30% 40% 50% 60% 70%
Small
Medium
Large

Technological and Nontechnological Innovation in the Textiles Sector 155
Figure 18: Turnover share of innovation output for product innovators,
by main market
1.11 Technological Innovation Cooperation
Collaboration between firms and other entities is considered vital to the successful development and implementation of product and process innovations. Firms were asked about their sources of information and cooperation for innovation, the degree of importance and location. They were initially asked to identify sources that provided information on new innovation projects or contributed to the completion of existing innovation projects during 2013–15. Then, they were asked to rank each source according to its degree of importance: none, low, medium or high.
The sources were grouped into different categories: internal sources (within the enterprise or enterprise group), market sources (including suppliers of equipment, materials, components or software, separated into local and foreign), clients (separated into local and foreign), competitors and private R&D institutions (including consultants), institutional sources (including universities and public research institutions) and other sources (conferences, trade fairs, exhibitions, scientific journals and industry associations).
1.11.1 Type of Cooperation by Firm Size
This section analyzes innovation cooperation for innovative firms. We report the cooperation only if it was identified as highly important. Overall, firms consider market sources their most important source of information and cooperation for innovation: 49 percent of firms consider foreign clients their most important source and 38 percent consider local clients a very important source. However, the degree of importance varies
0% 10% 20% 30% 40% 50% 60% 70% 80% 90% 100%
Local/Regional
United States
Across Pakistan
Europe
Middle East

Waqar Wadho and Azam Chaudhry 156
with the size of the firm. As much as 72 percent of large firms consider foreign clients a very important source, followed by 53 percent of medium firms. However, only 19 percent of small firms consider foreign clients a very important source. On the other hand, 48 percent of small firms consider local clients a very important source, compared to 33 percent of medium firms and 32 percent of large firms.
After foreign clients, the second most important source is within the enterprise group: 43 percent of firms consider this a very important source of information and cooperation. About 31 percent of firms consider foreign suppliers a very important source and 29 percent see local suppliers as a very important source. Only 5 percent of firms see universities and public research institutions as a very important source of information and cooperation.
About 27 percent of firms consider competitors and conferences or exhibitions a very important source, with a visible difference between large and small firms. Different firm sizes cite different sources as being the most important. Large firms see foreign clients (72 percent) as their most important source, followed by firms within the enterprise group (56 percent), foreign suppliers (44 percent), competitors (39 percent) and conferences/exhibitions (34 percent). Small firms consider local clients (48 percent) their most important source, followed by local suppliers (42 percent), firms within the enterprise group (27 percent), foreign clients, competitors and conferences/exhibitions (19 percent each). Medium firms see foreign clients (53 percent) as their most important source, followed by firms within the enterprise group (44 percent), foreign suppliers (35 percent), local clients (33 percent), conferences/exhibitions (26 percent) and local suppliers (25 percent) (Table 15).
Table 15: Important sources of information for innovation, by firm size
Internal Market sources Institutional
sources
Other sources
Firm size 1 2 3 4 5 6 7 8 9 10 11 12
Small 27% 14% 42% 19% 48% 19% 3% 0% 2% 19% 2% 2%
Medium 44% 35% 25% 53% 33% 22% 4% 1% 0% 26% 15% 13%
Large 56% 44% 21% 72% 32% 39% 11% 7% 6% 34% 7% 7%
Overall 43% 31% 29% 49% 38% 27% 6% 3% 2% 27% 8% 7%
Note: 1 = within enterprise/group, 2 = foreign supplier, 3 = local supplier, 4 = foreign client, 5 = local client, 6 = competitors, 7 = consultants, 8 = universities, 9 = public research institutes, 10 = conferences, exhibitions, 11 = publications, 12 = associations. Source: Authors’ calculations based on data from the provincial bureaus of statistics.
Technological and Nontechnological Innovation in the Textiles Sector 157
1.11.2 Active Cooperation
Firms were also asked if, during the sample period, they had cooperated with other enterprises or institutions in any of their innovation activities (including other firms within their group). Innovation cooperation is defined as active participation with other enterprises or noncommercial institutions (including the firm’s own group) in innovation activities. Both partners do not need to benefit commercially and we exclude work contracted out that involves no active cooperation. Overall, 24 percent of technologically innovative firms cooperated in innovation activities during 2013–15 (Table 16).
Table 16: Distribution of active innovation cooperators and
noncooperators in the sample
Cooperation status Number of firms % of tech. innovators
Active cooperators 50 24.2
Noncooperators 157 75.8
Source: Authors’ calculations based on data from the provincial bureaus of statistics.
1.11.3 Innovation Cooperation by Location
In a follow-up question, innovative cooperating firms were asked to indicate their innovation cooperation partner by location (including the US, Pakistan, Europe, China, Bangladesh, Asia and all other countries). Overall, cooperating technological innovators considered clients and other enterprises within their group their most important partners, while Pakistan, Europe and the US were seen as the most important locations (Figure 19).

Waqar Wadho and Azam Chaudhry 158
Figure 19: Cooperation partners, by type and location
1.11.4 Innovation Cooperation by Location and Importance
In a follow-up question, cooperating firms were asked to identify the type of cooperation partner they had found the most valuable to their innovation activities. Overall (Figure 20 shows), 31 percent of cooperating technological innovators consider clients based in Pakistan their most valuable partners in innovative activities, followed by other enterprises within the group located in Pakistan (21 percent), clients based in Europe (18 percent), clients in the US (10 percent) and suppliers based in Pakistan (8 percent). Among foreign partners, Europeans are considered the most valuable partners (20 percent), followed by Americans (12 percent). Conversely, every fifth technological innovator engaging in active cooperation sees European clients and suppliers as the most valuable cooperating partners.
0.0% 10.0% 20.0% 30.0% 40.0% 50.0%
Other enterprises within your enterprise group
Suppliers of equipment, materials, components, orsoftware
Clients or customers
Competitors or other enterprises in your sector
Consultants, commercial labs, or private R&Dinstitutes
Universities or other higher education institutions
Government or public research institutes
Professional and industry associations
China based (% of active co-operators) USA based (% of active co-operators)Europe based (% of active co-operators) Pakistan based (% of active co-operators)

Technological and Nontechnological Innovation in the Textiles Sector 159
Figure 20: Most valuable cooperation partners, by type and location
1.12 Factors Hampering Technological Innovation
Both innovative and noninnovative firms were asked to report factors that had prevented them from innovating or hampered innovative activities during 2013–15. Firms were also asked to rank each factor by importance on a scale of none (did not experience this constraint), low, medium and high. The questionnaire divided these factors into four mutually exclusive categories: cost, knowledge, market and other factors.
Cost factors include financial constraints and are divided into three different types: (i) lack of funds within the enterprise or its group, (ii) lack of external financing (banks and nonbanks) and (iii) innovation costs being too high. Knowledge factors include (i) the lack of qualified personnel, (ii) lack of information on technology, (iii) lack of information on markets and (iv) difficulty finding cooperating partners for innovation. Market factors include (i) the market being dominated by established enterprises and (ii) uncertain demand for innovative products. Other factors include (i) having no need to innovate due to prior innovations by the enterprise, (ii) having no need to innovate due to lack of demand for innovative products, (iii) macro-level uncertainties and (iv) any other reasons.
1.12.1 Constraints to Technological Innovation
Here, we report the constraints that firms ranked as being highly important. Overall, cost factors are seen as the most important constraint. Every second firm considers a lack of funds within the enterprise or its group
Other enterprises within group (based in
Europe)2%
Suppliers (based in Europe)
2%
Suppliers (based in United States)
2%Competitors (based in
Pakistan)2%
Clients (based in China)
4%
Suppliers (based in Pakistan)
8%
Clients (based in United States)
10%
Clients (based in Europe)
18%
Other enterprises within group (based in
Pakistan)21%
Clients (based in Pakistan)
31%
Waqar Wadho and Azam Chaudhry 160
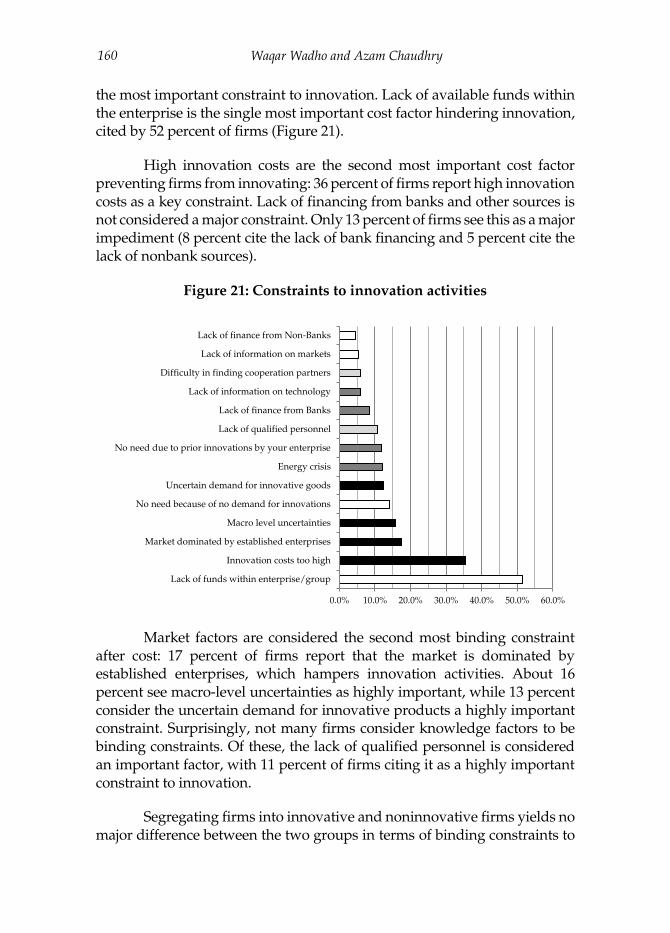
the most important constraint to innovation. Lack of available funds within the enterprise is the single most important cost factor hindering innovation, cited by 52 percent of firms (Figure 21).
High innovation costs are the second most important cost factor preventing firms from innovating: 36 percent of firms report high innovation costs as a key constraint. Lack of financing from banks and other sources is not considered a major constraint. Only 13 percent of firms see this as a major impediment (8 percent cite the lack of bank financing and 5 percent cite the lack of nonbank sources).
Figure 21: Constraints to innovation activities
Market factors are considered the second most binding constraint after cost: 17 percent of firms report that the market is dominated by established enterprises, which hampers innovation activities. About 16 percent see macro-level uncertainties as highly important, while 13 percent consider the uncertain demand for innovative products a highly important constraint. Surprisingly, not many firms consider knowledge factors to be binding constraints. Of these, the lack of qualified personnel is considered an important factor, with 11 percent of firms citing it as a highly important constraint to innovation.
Segregating firms into innovative and noninnovative firms yields no major difference between the two groups in terms of binding constraints to
0.0% 10.0% 20.0% 30.0% 40.0% 50.0% 60.0%
Lack of funds within enterprise/group
Innovation costs too high
Market dominated by established enterprises
Macro level uncertainties
No need because of no demand for innovations
Uncertain demand for innovative goods
Energy crisis
No need due to prior innovations by your enterprise
Lack of qualified personnel
Lack of finance from Banks
Lack of information on technology
Difficulty in finding cooperation partners
Lack of information on markets
Lack of finance from Non-Banks

Technological and Nontechnological Innovation in the Textiles Sector 161
innovation (see Figure 22). The key difference lies in energy constraints: compared to 5 percent of innovative firms, as many as 19 percent of noninnovative firms cite this as a highly important constraint. There is also a difference in the perception that firms need not innovate due to prior innovations. As expected, a higher percentage of noninnovators consider this an important factor compared to innovators. Finally, compared to 7 percent of innovators, 21 percent of noninnovators see the lack of demand for innovative products as a highly important constraint to innovation.
Figure 22: Constraints to innovation activities, by innovative and
noninnovative firms
1.12.2 Constraints to Innovation, by Firm Size
Firms of different sizes face different challenges and thus identify different factors as highly important constraints to innovation. Overall, 60 percent of small firms consider a lack of funds within the enterprise or its group to be a very important constraint. This is twice as high as among large firms (30 percent), while 52 percent of medium firms cite it as a key constraint (Table 17). Overall, medium firms cite the following constraints as being very important: lack of qualified personnel (15 percent), lack of information on technology (11 percent, compared to only 3 percent among small firms) and difficulty finding cooperative partners (11 percent, compared to only 2 percent among small firms).
0.0% 10.0% 20.0% 30.0% 40.0% 50.0% 60.0%
Energy crisis
Lack of information on markets
Lack of finance from Non-Banks
Difficulty in finding cooperation partners
Lack of information on technology
No need due to prior innovations by your enterprise
Lack of finance from Banks
No need because of no demand for innovations
Uncertain demand for innovative goods
Macro level uncertainties
Lack of qualified personnel
Market dominated by established enterprises
Innovation costs too high
Lack of funds within enterprise/group
% of non-innovative firms reporting the factor as "highly important"% of innovative firms reporting the factor as "highly important"

Waqar Wadho and Azam Chaudhry 162
Table 17: Factors hampering technological innovation, by firm size
Factor Small Medium Large
Lack of funds within enterprise/group 60% 52% 30%
Innovation costs too high 33% 41% 34%
Market dominated by established enterprises 18% 19% 14%
Energy crisis 16% 8% 8%
No need because no demand for innovations 15% 17% 9%
Macro-level uncertainties 15% 17% 16%
Uncertain demand for innovative goods 11% 13% 15%
No need due to prior innovations by enterprise 9% 16% 14%
Lack of finance from banks 8% 11% 7%
Lack of qualified personnel 8% 15% 12%
Lack of information on markets 5% 8% 2%
Lack of finance from nonbanks 4% 7% 4%
Lack of information on technology 3% 11% 5%
Difficulty finding cooperation partners 2% 11% 8%
Source: Authors’ calculations based on data from the provincial bureaus of statistics.
1.13 Innovation Objectives
A firm’s innovation behavior, the type of innovation and its extent depend on the objectives of innovation. For example, firms may focus on improving efficiency, in which case their innovations will aim to reduce costs. Firms focusing on growth may innovate by introducing a new product range or capacity or by entering a new market. The surveyed firms were asked about their objectives and the significance of these in terms of both technological and nontechnological innovations.
1.13.1 Objectives of Technological Innovation
These objectives are divided into three categories: product outcomes, process outcomes and other outcomes. Each has multiple subcategories. Product outcomes include (i) increasing the range of goods, (ii) entering new markets or increasing market share and (iii) improving the quality of goods. Process outcomes include (i) improving flexibility in producing goods, (ii) increasing the capacity to produce goods, (iii) reducing the labor cost per unit of output and (iv) reducing material and energy costs per unit of output. Other outcomes include (i) reducing environmental impacts, (ii) improving worker health and safety, (iii) meeting government regulatory requirements and (iv) meeting international regulatory requirements. Firms were asked to rank these objectives as not relevant, low, medium or high with regard to their innovation objectives during 2013–15.

Technological and Nontechnological Innovation in the Textiles Sector 163
Overall, our results show that the textiles sector is more focused on innovation that promotes growth. Product outcomes dominate these firms’ objectives: 63 percent of technological innovators report that improving the quality of goods is their most important objective, followed by entering new markets or increasing market share (43 percent), and increasing the range of goods (39 percent). Process outcomes vary less. Overall, every third firm reports improving flexibility in producing goods (29 percent), increasing the capacity to produce goods (35 percent), reducing the labor cost per unit of output (37 percent) and reducing material and energy costs per unit of output (34 percent) (Table 18).
Table 18: Key objectives of technological innovation
Objective % reporting
Improve quality of goods 63%
Enter new markets or increase market share 43%
Increase range of goods 39%
Reduce labor cost per unit of output 37%
Increase capacity for producing goods 35%
Reduce material and energy costs per unit of output 34%
Improve health or safety of employees 32%
Meet international regulatory requirements 31%
Improve flexibility of producing goods 29%
Meet government regulatory requirements 27%
Reduce environmental impacts 21%
Source: Authors’ calculations based on data from the provincial bureaus of statistics.
1.13.2 Objectives of Nontechnological Innovation
For nontechnological innovation, separate objectives were listed for managerial and marketing innovations.
1.13.3 Objectives of Managerial Innovation
Managerial innovation objectives include: (i) improving or maintaining market share, (ii) reducing the time taken to respond to customer or supplier needs, (iii) improving the quality of goods, (iv) reducing the cost per unit of output and (v) improving employee satisfaction and/or reducing employee turnover.
The objectives of technological and managerial innovation are more or less consistent (see Table 19). Improving the quality of goods ranks

Waqar Wadho and Azam Chaudhry 164
highest among managerial innovators. Around three quarters of the active managerial innovators surveyed report that improving the quality of goods is their most important objective when introducing new business practices. Reducing the time taken to respond to client and supplier needs is the second most important factor: 64 percent of active managerial innovators cite this as a highly important objective. Around half the firms report maintaining and improving their market share as a highly important objective. Around four in ten firms see reducing costs per unit of output and improving employee satisfaction as highly important objectives in managerial innovation.
Table 19: Key objectives of managerial innovation
Objective % reporting
Improve quality of goods 70%
Reduce time taken to respond to customer or supplier needs 64%
Improve or maintain market share 52%
Improve employee satisfaction and/or reduce turnover rate 43%
Reduce cost per unit of output 42%
Source: Authors’ calculations based on data from the provincial bureaus of statistics.
1.13.4 Objectives of Marketing Innovation
The objectives of marketing innovation are categorized as follows: (i) increasing or maintaining market share, (ii) introducing products to new customer groups and (iii) introducing products to new geographic markets. In this case, innovations among textile firms are more focused on growth. Firms introducing these innovations see increasing or maintaining their market share as the most important objective of marketing innovation. About 47 percent of firms report introducing products to new customer groups as a highly important objective, followed by introducing products to new geographic markets (32 percent) (Table 20).
Table 20: Key objectives of marketing innovation
Objective % reporting
Increase or maintain market share 51%
Introduce products to new customer groups 47%
Introduce products to new geographic markets 32%
Source: Authors’ calculations based on data from the provincial bureaus of statistics.

Technological and Nontechnological Innovation in the Textiles Sector 165
4. Conclusions
Using a sample of 431 Pakistani textiles and apparel manufacturers, we have analyzed their innovation behavior, the extent and types of innovation, the resources devoted to innovation, sources of knowledge spillovers, factors hampering technological innovation and the returns to innovation over a three-year period (2013–15). Our treatment of innovation is based on the Oslo Manual (2005) and its recommendation for developing countries. Our analysis looks at the importance of technological aspects such as product and process as well as nontechnological aspects such as organizational and marketing practices, the role of cooperation and linkages and the perception of innovation as a system.
Our results show that 56 percent of firms introduced technological or nontechnological innovations. While 38 percent of firms introduced new products, these innovations were generally incremental as the vast majority of innovations were new only to the firm. Six enterprises introduced products that were new to the world (all six are in Sialkot) and 30 enterprises introduced new products to their market.
The innovation rate increases with firm size. Technologically innovative firms spent on average 10 percent of their turnover in 2015 on innovation. Acquiring newer vintages of capital with the aim of introducing new or improved products and processes is the dominant innovation activity. Overall, firms consider market sources their most important source of knowledge spillovers, with large firms pointing to foreign markets (clients and suppliers) and small firms citing local markets as important sources of information and cooperation. Firms appear to be more focused on innovations that promote growth and product outcomes. The lack of available funds within the enterprise was the single most important cost factor hampering innovation, followed by the high cost of innovation.
The economic importance of innovation seems very high, as measured by the percentage share due to innovative products. Our results show that 67 percent of the turnover of product-innovative firms in 2015 resulted from product innovations that were either new to the market or new to the firm.

Waqar Wadho and Azam Chaudhry 166
References
Hall, B. (2005). Innovation and diffusion. In J. Fagerberg, D. Mowery & R. R. Nelson (Eds.), The Oxford handbook of innovation (chap. 17). Oxford: Oxford University Press.
Lam, A. (2005). Organizational innovation. In J. Fagerberg, D. Mowery & R. R. Nelson (Eds.), The Oxford handbook of innovation (chap. 5). Oxford: Oxford University Press.
OECD and Eurostat. (2005). Oslo manual: Guidelines for collecting and interpreting innovation data. Paris: Authors.
Perreault, W. D., & McCarthy, E. J. (2005). Basic marketing: A global managerial approach. New York: McGraw-Hill.
Rosenberg, N. (1994). Exploring the black box: Technology, economics and history. Cambridge: Cambridge University Press.
Schumpeter, J. (1934). The theory of economic development. Cambridge, MA: Harvard University Press.
Tirole, J. (1995). The theory of industrial organization. Cambridge, MA: MIT Press.