innovation metrics – keys to increase competitiveness
TRANSCRIPT
STOCKHOLM SCHOOL OF ECONOMICS MASTER’S THESIS WITHIN INTERNATIONAL BUSINESS
Innovation Metrics – keys to increase competitiveness Abstract The quest and need for innovation have become ever more evident in today’s corporate world. Western com-panies in particular are facing high competition due to the continuous globalization of the world. This calls for higher focus on making innovation more comprehensive and hence more tacit throughout the competitive organization, in order to effectively be able to manage and improve it. The purpose of this thesis has been to identify ways of using metrics as a way to improve innovation management and hence innovation perform-ance. The research is conducted around discussions on theories concerning innovation and innovation metrics, as well as by an illustration of the practical ways of working with innovation metrics in large-sized Swedish multinational companies. The empirical data is collected through both qualitative and quantitative interviews with employees working specifically with innovation, in some companies even called “Innovation Manag-ers”. An abductive research approach has lead to the construction of a 12-window matrix, based in theory but provoked by the corporate reality, in which the empirical results have been analyzed. Through this frame-work, similarities and dissimilarities between theory and practice have been analyzed, showing that practical ways of measuring innovation differ highly from the metrics suggested by theory, through highly unbalanced and seemingly random metrics of very simple character. The aim of the comparison and creation of a frame-work is to show that by in fact rather small changes of the metrics in use, improvements could be achieved rather easily. Finally, a clear structuring of innovation through the use of a metrics framework, opens up for common organizational understanding of the concept, and hereby more tacit reasoning for managerial deci-sions and allocation of resources. Key words: Innovation, innovation metrics, competitiveness, leadership
Author: Karin Källman (20071) Advisor and Examiner: Robin Teigland, Ass. Prof. Dept. of Marketing & Strategy, Aff. Res. Cen-ter for Strategy & Competitiveness, Stockholm School of Economics Opponents: Filippa Malmegård (19818) & Johan Östberg (20561) Presentation & Defence: 8th
June 2009
2
Contents
I OVATIO METRICS – KEYS TO I CREASE COMPETITIVE ESS ............................................................1
CO TE TS.......................................................................................................................................................................2
1. I OVATIO -SITUATIO OF TODAY ...........................................................................................................4
1.1 INNOVATION IN THE NEWS ................................................................................................................................4 1.2 PROBLEM DEFINITION AND AIM OF THESIS ........................................................................................................5 1.3 LIMITATIONS ....................................................................................................................................................6 1.4 CHAPTER LAYOUT.............................................................................................................................................7
2. METHODOLOGY ..................................................................................................................................................8
2.1 RESEARCH METHODOLOGY...............................................................................................................................8 2.1.1 Theoretical approach ..................................................................................................................................9 2.1.2 Empirical approach.....................................................................................................................................9
2.1.2.1 Choice of corporate representatives ................................................................................................................. 10 2.1.2.2 Interview technique.......................................................................................................................................... 11 2.1.2.3 Data analysis .................................................................................................................................................... 11 2.1.2.4 Quality of empirical research ........................................................................................................................... 12
2.1.2.4.1 Reliability ................................................................................................................................................... 12 2.1.2.4.2 Validity ....................................................................................................................................................... 13
3. THEORETICAL APPROACHES TO I OVATIO METRICS..................................................................15
3.1 DEFINITION OF INNOVATION ...........................................................................................................................15 3.2 IDENTIFICATION OF FOUR THEORIES FOR STRUCTURING INNOVATION.............................................................16
3.2.1 Davila et al. ...............................................................................................................................................17 3.2.2 Goffin & Mitchell ......................................................................................................................................18 3.2.3 Muller et al. ...............................................................................................................................................19 3.2.4 Regnell et al...............................................................................................................................................20
3.3 PERSPECTIVES ON THE FOUR THEORIES...........................................................................................................20
4 A ALYSIS OF THEORETICAL FRAMEWORK ...........................................................................................25
4.1 THREE HORIZONTAL PHASES OF METRICS .......................................................................................................25 4.2 FOUR VERTICAL DRIVERS OF METRICS ............................................................................................................26 4.3 FOUR INDICATORS OF METRICS .......................................................................................................................26 4.4 PROPOSED FRAMEWORK WITH ACCOMPANIED METRICS..................................................................................27
5 EMPIRICAL APPROACHES TO I OVATIO METRICS........................................................................30
5.1 GENERAL ATTITUDES......................................................................................................................................30 5.2 IDENTIFICATION OF INNOVATION METRICS .....................................................................................................31
5.2.1 Definition of innovation ............................................................................................................................32 5.2.2 Organizational transparency ....................................................................................................................33 5.2.3 Historical legacies.....................................................................................................................................34
5.3 METRICS ACTUALLY REPORTED......................................................................................................................34 5.4 CHALLENGES/IMPORTANT ISSUES ...................................................................................................................35
6 A ALYSIS.............................................................................................................................................................38
6.1 WAYS OF WORKING ........................................................................................................................................38 6.1.1 Legacies, transparency, terminology, communication and responsibility ................................................38 6.1.2 Definition of innovation ............................................................................................................................39
6.2 METRICS .........................................................................................................................................................40 6.2.1 Broad picture ............................................................................................................................................40 6.2.2 The three horizontal phases ......................................................................................................................40 6.2.3 The four vertical levels ..............................................................................................................................41 6.2.4 Specific metrics and the four types of indicators.......................................................................................42

3
6.2.4.1 Task-related metrics ......................................................................................................................................... 42 6.2.4.2 Organizational level ......................................................................................................................................... 44 6.2.4.3 Financial level .................................................................................................................................................. 45 6.2.4.4 Market level ..................................................................................................................................................... 46
6.3 PERSPECTIVE ON THE ANALYSIS .....................................................................................................................46
7 CO CLUSIO ......................................................................................................................................................48
8 FUTURE RESEARCH..........................................................................................................................................50
9 LITERATURE.......................................................................................................................................................51
10 APPE DIX ............................................................................................................................................................55
4
1. Innovation-situation of today In this chapter, some current discussions around innovation will be dealt with. This insight will lead to the argument for innovation metrics as a useful and potentially crucial tool in order to manage innovation effectively. The chapter will go on to discuss the specific problem definition and the aim of answering to the formulated research questions. Successively a few limitations will be discussed, whereafter a chapter layout will present the structure of the thesis.
1.1 Innovation in the news
A simple definition of innovation is “the introduction of something new”. In terms of business it can more vividly be explained as “the continuous process of developing ideas and business oppor-tunities into commercially viable initiatives”1. To most established companies, innovation is what propels growth. In fact, this growth has become increasingly under pressure during the past dec-ades, with the rapid change of the world’s economic order. New market entrants, new technologies, shorter product life cycles, more empowered customers and a more globalized marketplace has posed new challenges, for all types of industries. The US' Council on Competitiveness has even declared that innovation will be the single most important factor in the 21st century in determining the success of the nation.2 The European Union body for Enterprise & Industry Innovation has claimed that European companies cannot compete in the new global environment unless it becomes more innovative and responds more effectively to consumers' needs and preferences, a need which has become ever more apparent.3 In fact, organizations today cannot expect to survive without in-novation, and the only question is whether slow innovators will be overrun suddenly by competitors who come up with successful innovations or if they will slowly fall deeper as their competitors con-stantly push the competition.4 Therefore, what is needed is not just innovation, but sustained inno-vation5 – that is well balanced and long-term lasting. Companies need a stable flow of different types of innovations, over time. Over the years, companies have indeed become increasingly aware of the need for innovation. Sev-eral have tried to tackle the issue by introducing innovation programs, innovation work flows, inno-vation processes and other structures in order to take control of an area which was previously through of as something “free-flowing” and “uncontrollable”. In times of economical turmoil, it can be argued that one does not have the resources to focus on innovation initiatives. However, many argue that innovation, now more than ever, should be on top of the agenda. “Innovation (…) is par-ticularly important right now in the current global and economic environment (…) because innova-tion is driven by the capture and implementation of ideas from across the organisation (…) that can be used to effectively generate ideas for new products and services (but also) for cost savings and improving efficiency in a downturn”6. Old management aphorisms such as “you can’t manage what you don’t measure” and “what gets measured gets done” imply that it is vital to also measure innovation in order to manage it. Only hereby can you diagnose the overall innovation performance over time. But innovation metrics are
1 Googol Business Navigator AB on “Innovation”. A further discussion of innovation definitions will take place in Chapter 3.1 2 Council of Competitiveness 2004 3 European Commission: Enterprise & Industry Innovation 2009 4 See for instance: Davila et al. 2006, Dundon, Drucker (Innovation…)2007, Drucker (People…) 2007 5 Muller et al. 2005 6 Mackinnon 2004
5
not only important to in order to measure the current situation, but is also a vigorous tool for im-proving it. Only by measuring can management decide on strategic direction and identify where to allocate resources to innovation projects.7 Well communicated metrics also steer behaviour through the inherent identification of important innovation areas. It can hence also play an important role in enhancing the long-run innovativeness, through having all employees on board.8 On top of this, measurable numbers are an easy way of sending a credible signal of innovativeness to your share-holders. In fact, it has been claimed that as soon as a leading company can demonstrate the long-term advantage of its superior performance on innovation, this will change the rules on the market forever, and it is only a matter of time given the efforts to try to track and enhance non-primarily-fiscal-measures related to innovation.9 Still however, companies do not seem to know how or what to measure. In the companies where metrics actually exist, they vary considerably and remain highly rudimentary according to global studies, recently performed by two separate well known management consulting firms.10 The same situation can be identified in Sweden where a study performed in 2006 on CEO’s in 29 large-sized companies in Sweden concluded that a majority of the respondents felt they lacked adequate inno-vation metrics.11 One reason, according to one of the above consulting firms, is that companies are under the mis-taken impression that innovation somehow is different from other business processes and that it cannot or should not be measured. “The potential cost of this error (…) is substantial.”12. Another major reason may be that there exists no general and official suggestions for measuring firm-level innovation, leaving the companies without framework.
1.2 Problem definition and aim of thesis
Swedish as well as the international companies obviously struggle to find the right metrics and the right methods of measuring. The current situation has lead to the following problem definition: Q: How can innovation metrics be used to strengthen the competitiveness of a company?
To help answer this main question, the following two research questions will be included:
(i) Which innovation metrics are developed and suggested by academia?
(ii) What are the ways of working with innovation metrics, in Swedish large-sized multinational
corporations, and what actual metrics are being used today?
Through answers to these questions, this paper aims to contribute to an improved (and more trans-parent) relationship between conceptual and applied work in this area. Research question i) answers to a mapping of innovation metrics suggested by various international academic research, which will lead to a better understanding of what metrics are “potentially useful”13 according to theory. Through research question ii) information will then be complemented with an understanding of the
7 See for instance Muller et al. 2003, Goffin & Mitchell, 2005, Davila et al. 2006 8 See for instance Regnell et al. 2008, Goffin & Mitchell, 2005, Davila et al. 2006 9 Eccles 1991 10 Chan et al. 2008 11 Schleimann-Jensen & Sauraga 2006 12 Andrew et al. 2008 13 The “usefulness” implies that the theoretic metrics chosen should be generic in order to be useful for a broader selec-tion of companies.
6
situation in practice, through a study on how and what metrics are in fact applied in large Swedish multinationals (limitations will be explained further in chapter 1.3.) combined which the actual ex-periences, challenges and requirements of innovation metrics. An analysis of this theoretical and practical current status aims to create better understanding of whether, and if so how, a more com-petitive use of innovation metrics could be applied. Although this study is performed on 26 of Swe-den’s largest multinationals, it aims to contribute to improved applicability of innovation metrics regardless of nationality of corporation, and to an increased general knowledge on the area of inno-vation metrics. Finally, there is a global innovation metric for nations, called the Global Innovation Index (GII), which builds on a holistic framework including 5 input metrics and 3 output metrics (all calculated by a number of sub-metrics)14. This index ranks the worlds best and worst-performing economies in terms of innovation. It is the hope that this thesis will make a contribution by inspiring to what in the future might result in a Global Corporate Innovation Index, which could be used for internal management and improvement, but also for signaling towards investors and benchmarking against competitors.
1.3 Limitations
General innovation concepts will be discussed through four theoretical models and additional au-thor’s supporting comments only in order to ensure cohesion between the authors’ and the readers’ definition and understanding of innovation concepts and to lay a foundation for the arguments around innovation metrics. The thesis will however not discuss specifics of innovation management such as how to encourage innovation, how to organize innovation teams etc, other than on points specifically relevant to metrics. Several specific theoretical as well as empirical metrics will be used in the thesis. Theoretical met-rics will be chosen on the basis of certain important parameters, explained further in Chapter 4.4. Beyond that, it will be assumed that the applicability has already been considered before suggested. There will hence be no thorough investigation as to how, where, how often, by whom etc. the data for the metrics will be collected. Neither will any financial analysis be performed as to the cost-benefit or similar of the metrics. The display of specific metrics is only provided in order to support the different parts of the model, and should not be interpreted as an exhaustive list of possible met-rics, neither a perfect one. Rather it should be seen as a source for inspiration, where modifications, definitions and applications will need further discussion. In terms of evolution, the historical perspective, such as how innovation or innovation metrics has changed until today, will not be dealt with. Although it could give interesting inputs as to how and in which direction innovation metrics application is changing, it is not directly relevant to the prob-lem definition of this thesis. For the same reason, no discussion around general performance metrics or indicators beyond those that relate to innovation will be brought up. As mentioned in chapter 1.2 and chapter 2.1.2 neither nationality nor size will play a part in the conclusions, and the results will be assumed generally applicable in an international business con-text. However, in order to create limitation and a certain level of homogeneity, this limited sample has been chosen for the empirical part of the thesis. The sample consists of companies from many different industries, and no limitation in terms of industry, type of product, product life cycle etc.
14 See Chapter 3.3 for a definition of input versus output
7
has been made, other than that the companies are all for-profit, registered corporations. Based on previous studies of innovation and innovation metrics, the tendency has showed that structuring of innovation metrics is still under testing or even un-tested in the corporate world, wherefore com-parisons would be difficult, and probably not even constructive to make. The study will in addition focus only on middle managers as respondents. A confirmation of their responses from both top management as well as lower level employees would have been both inter-esting and valuable, however not possible within the timeframe of this thesis.
1.4 Chapter layout
The below exploratory design has the purpose of describing the course in which the thesis has been structured, and hereby to create a holistic picture of the structure and progression of the work. This will be illustrated by a short description of the contents of each chapter: To give an understanding of the methodological approach of the thesis, chapter 2 describes the theoretical and empirical approaches, as well as different techniques in terms of interviews and analysis of the data. This is followed by an evaluation of reliability and validity of the work. Chap-
ter 3 includes an understanding of the term “innovation”, and identifies four main theoretical ap-proaches to innovation, that are discussed and compared, at the same time as being complemented with other theories and sources. This is then followed by chapter 4, where three horizontal phases and four vertical levels are identified based on the theoretical discussion, in order to create a com-mon framework that the empirical data in chapter 5 will be built upon. Furthermore, chapter 5 gives an understanding of the included companies’ attitudes towards innovation, as well as their approaches to measuring innovation today. This chapter is rounded off with several challenges and issues that they have identified. Chapter 3 - 5 therefore lays the foundation for the analysis in chap-
ter 6. Here, the findings are analysed in comparison to the suggested framework from chapter 4, thereby resulting in a conclusion to how the main question of this thesis is answered. A conclusion of the findings will be presented in chapter 7, followed by future research suggestions, literature overview and appendix in chapter 8, 9 and 10 respectively.
8
2. Methodology The following part of the paper has the purpose of explaining the methodology of the thesis. It will start out with a description of how the research process has evolved over time. Then, a de-scription of the theoretical as well as empirical approach will be presented, followed by a discussion of the reliability and validity of the theories and the empirical data.
2.1 Research methodology
When conducting social sciences research, two different main methods can be followed to connect theory with empirical findings: deductive and inductive methods. The former method includes for-mulating one or more hypothesis based on existing theory, and testing these against collected em-pirical data. When following the latter method, the researcher starts out with collection of empirical data, which then functions as a basis for formulating relevant theory.15 In between these extremes, a third method can be found - the abductive method
16. This method entails taking part of existing theories during the collection of the empirical data. This can be explained as a circular analytical approach, where a natural cause of doing research will raise new questions and further understand-ing.17 When, as has been done in this thesis, creating fusions and extensions of previous theories, conclu-sions should be derived from both existing theories and empirical data, alternating between induc-tive and deductive methods. In this thesis, the abductive, or circular, approach has therefore been judged the most appropriate method as theories around innovation metrics are scarce. The existing theories on the subject were studied before collecting empirical data, in order to understand the spe-cific research area. The design of the interviews was thereby based on theoretical knowledge, which represents a deductive approach. The interviews have then allowed for situation-adaptation in order to ensure the collection of further important business context parameters, which represents an in-ductive approach. In this thesis, a mixed method study has also been used, which entails a combination of qualitative and quantitative data collection and analysis.18 The approach, also labelled multi-method, methodo-logical mix, combined method, integrated mix, multiple methods and triangulation, may offer sev-eral benefits and increase the value added of a study.19 The field of international business’s special character of increasing complexity and high speed of change within organizations and business due to globalization, poses higher pressure for change to existing theories. Therefore, it is argued that the solution to these problems requires a more holistic, multidisciplinary and multi-method ap-proach in research.20 In this thesis, the initial reading on literature created an understanding on rec-ommendations around metrics. During the initial interviews however, is very soon became clear that no answer, or even line of thinking around metrics, was similar to the next, and hence the deci-sion was made to focus on creating a more extensive and thorough model of innovation metrics, than has so far been provided in theory. In this, the quantitative approach of mapping various met-rics used was judged important in order to create an understanding for the current business approach 15 Bryman 2006, Patel & Davidson 2003, Rienecker & Jörgensen 2002 16 Alvesson & Sköldberg 2008 17 Andersen 2005 18 Creswell et al. 2003 19 See for instance Jick 1979, Creswell 1994, Wolstenholme 1999, Tashakkori & Teddlie 2003, Hurmerinta-Peltomaki
& Nummela 2006 20 Hurmerinta-Peltomaki &Nummela 2006
9
to innovation metrics. A simultaneous qualitative approach would then be crucial for reaching a deeper and fuller understanding of what was actually lacking with the companies in terms of inno-vation metrics. 21 The qualitative approach would here also be useful for analysing existing but lim-ited theory.22
2.1.1 Theoretical approach
As of today, there is no single book dealing exclusively with innovation metrics.23 Many innovation management books however have specific chapters on metrics which, together with a number of papers on the subject, has constituted the theoretical foundation for this thesis. Four very recent (from between 2005 to 2008), non-industry specific and rather holistic models of general innovation management, accompanied by specific suggestions for metrics, have been chosen to constitute the basis for the later developed model of innovation metrics. The novelty of the four models has been judged highly important as the concept of working structured with innovation is rather new, as well as the fact that the increasing popularity of it leads to a strong stream of general articles on updated views on innovation. Again, in terms of subjects relating to international business, this is increas-ingly important.24 To support the models and the reasoning for the structuring of the framework, they have however been complemented with comments from other sources. These sources stem from both old as well as more up to date articles and books on innovation. No further validation of these specific sources will be done, as they are only used to back up the statements throughout the thesis. The holistic and non-industry specific character of the four models has also been judged important, as the thesis is based on cross-industrial empirics. This due to the later developed argument that the modern definitions of innovation are multifaceted and non-industry specific and covers several ar-eas of an organization (see chapter 3.1). In connection to specificity, the literature research has found other holistic innovation management models either too specific or simply outdated due to the previously mentioned continuous evolution of the field of International Business.25 Note that the word “theoretic” will be used throughout the thesis, denoting concepts or comments of the above described theoretical sources, all originating from publications in recognized magazines or academically approved or printed books.26
2.1.2 Empirical approach
Although this thesis aims for broad application of results, companies participating in the study were to possess all of the below attributes in order to create a comparable sample of study object:
(i) Must be defined as a Swedish organization
Swedish origin or identity was chosen as a parameter only to limit the study, and will therefore not lead to any Sweden specific discussions or analyses. Due to the increasing difficulties of and wide-spread discussions on determining the nationality of globally present multinational companies27 (see
21 Holme & Solvang 1997 22 Eisenhardt 1989 23 Based on search in Scandinavian libraries as well as on www.amazon.com which is America’s largest online retailer and one of the most comprehensive search engines for books. 24 Hurmerinta-Peltomaki &Nummela 2006 25 Hurmerinta-Peltomaki &Nummela 2006 26 This will be understood as ”theory”. No further development of this understanding will be performed. 27 See for Reich 1990, Jones & Wilson 2005
10
point iii), for this thesis, the nationality will be based on country of naissance, country of headquar-ters, country of majority of stakeholders or similar, with the only purpose to create a limitation.
(ii) Must be of considerable size
A report on innovation metrics claims that “small companies often manage innovation less formally because there are fewer projects to track and fewer resources to allocate, and leaders can have a bigger impact.”28 Hence, it has been judged that larger companies have a relatively stronger need for rigorous structures for monitoring and managing, including a need for innovation metrics. Headcounts have been used to determine the size of companies, and approximately 2000 employees or more has been judged to be a considerable size.
(iii) Must have multinational operation or presence
Multinationality can also be defined in many different ways, however for this study the simple defi-nition that “an MNC is a corporate entity that is involved in operations in a number of countries” has been used.29 The reason for adding this parameter is that companies with international business also have a relatively stronger need, than solely nationally operating companies, of rigorous struc-tures for monitoring and managing the different parts of the organization, including innovation met-rics. In addition, it has been assumed that respondents from companies of considerable size and multinational character will have better established notion of, and relation to, innovation metrics. In addition it has been assumed that they therefore also have a larger interest in contributing to and attaining results of a study on the subject.
2.1.2.1 Choice of corporate representatives
Based on the three criteria for the empirical sample, a list of 34 suitable organizations was created. When looking for general patterns rather than specific issues of a certain organization, studies on multiple objects are preferred.30 Therefore it was decided that the study was to be performed on 20-25 organizations, in order to ensure reasonable scope. A lower number would decrease the ability of drawing generalizing conclusions of the results whereas a too high number would on the other hand not be manageable within the timeframe of the thesis. In the end 26 companies provided informa-tion, which is considered a high feedback percentage. To attain a representative picture of application of innovation metrics in the corporations, middle
managers were the focus of the empirical study, as their position indicates awareness of what is communicated both upwards and downwards. The sought after position was ”Innovation Manager”, “Innovation Director” or similar. In the cases where this position did not exist, a “Business Devel-opment Manager” or similar was contacted. In the few cases where also this did not exist, a “Prod-uct Development Manager”, “R&D Manager” or similar person was complemented with a prod-uct/portfolio/customer-related or similar manager from a different part of the organization in order to attain as full a spectra of information as possible. In terms of location in an organizational struc-ture, all of these positions were in this content defined as middle managers. A valuation of the qual-ity of the respondents’ answers was made in the latter cases, based on the areas of innovation they talk about (narrow or broad) and the amount of general insight to metrics they seemed to possess. The valuation lead to the decision on whether or not to find a complementing respondent from the same company. In two instances, an additional person was contacted and agreed to participate but did not or could not provide information within the timeframe of the thesis. In these two cases, the
28 Andrew et al. 2009 29 O'Connell & Cooper 2009 30 Eisenhardt 1991
11
answers from the first person contacted have been used, in combination with the insight that innova-tion metrics were very difficult to track in these companies – an answer in itself. The situation does however decrease the reliability as well as the validity of these two respondents (see further discus-sion on validity and reliability in chapter 2.1.2.4.1 and 2.1.2.4.2).
2.1.2.2 Interview technique
All suitable persons31 were initially contacted via telephone in order to ensure an understanding of the thesis purpose as well as to create a personal contact and trust and to allow for the respondent to ask any questions or discuss any hesitations to participating. In all interviews the focus rested on three specific areas:
(i) Definition of innovation on corporate level (quantitative) (ii) Potentially used innovation metrics within the organization (on what level measured,
how measured, how often measured, how communicated) (quantitative) (iii) Challenges faced/issues considered important based on experience with/considerations
of innovation metrics (qualitative) In some cases the whole interview was held via telephone, either immediately when reached or at a later booked time. In other cases, the respondent preferred to have an email sent to them, with the questions clearly explained. Finally, a limited number wanted to book physical interviews. In order to give all 26 respondents equal focus, and since an answer by email would not be comparable to a physical interview, all interviews in the end were held via email and/or phone. The few respondents who were handled mainly over email received the three specific questions, in addition to an excel sheet to fill in different parameters of the metrics used (mentioned in parenthe-sis on (ii) above) in order to attain clear and unambiguous information of the metrics used. Oral interviews can be divided into two types, information discussions and scheduled interviews. When searching for appropriate persons within the companies, in the early stages of the research, some of these contact initiations in the end turned into informal discussions. This was at a point where the structure and knowledge base of the thesis was still forming, but where information was considered to answer research questions it was included as a statement from the company. As for the scheduled interviews, the three broad questions mentioned above as well as the excel sheet for metrics were sent beforehand, so that the respondents were able to prepare the necessary data. The interviews were semi-structured with open-ended questions in order to keep the interviews comparable, but to enable the best results given that an abductive and mixed method approach was chosen. Interviews were generally held between 30 minutes to one hour in Swedish or English. The language was chosen by the interviewee, in order to ensure his or her comfortableness, again in or-der to create more reliable responses.
2.1.2.3 Data analysis
As the method of this thesis is circular, and the level of information is a combination of qualitative as well as quantitative, the analysis of theory has been influenced by both qualitative and quantita-tive empirical finding, and the analysis of the quantitative as well as qualitative empirics of course also has been influenced by theoretical findings. The initial theoretical reading, resulted in a basic understanding for areas which were of importance when structuring innovation metrics. Based on this reading, an initial division of three main and MECE (mutually exclusive and collectively exhaus-tive) phases of innovation was created; input, throughput and process. Once the empirical patterns
31 With one exception due to the difficulties in reaching this person over telephone.
12
were identified however, a true value of additional layers was identified. Based in theory, but pro-voked by reality, this lead to a further crystallization of the framework four different and MECE levels of metrics; related to task, organization, finance and market. Again, looking at the often wide range of metrics in theory on these four additional levels, and also realizing the important directions in which metrics should steer behavior, an additional division of the metrics based on the type of indicators was made. This finally resulted in four additional layers; amount, balance, efficiency and effectiveness. In essence, all levels can be based on and found in theory, but the heavy decomposi-tion is a result of the empirical reality. In this thesis, the underlying circular approach does not fully come to its right due to the necessity of presenting the information structurally. Therefore, the analysis has been divided into two parts, one on theory, which enables the presentation of the empirical data in a more structured way, and a later analysis of the patterns and dissimilarities between the theoretical analysis (the framework) and the empirical data. This partial analysis of theory, allows for a more value-added presentation of the quantitative data through a cross-company analysis. 32 A within-case analysis of the data would have been interesting as it could have created a rich familiarity with each case, and allowed for company unique patterns. However, the number of cases was judged too high to make this sort of reporting of empiric data interesting. Instead, the quantitative data has been presented in an over-view, complemented with qualitative features in the form of quotes organized on different themes, providing interesting nuances which became apparent during the study. All information on metrics has been presented in tables in order to ensure comparison between the-ory and practice as well as in-between theoretics and companies.
2.1.2.4 Quality of empirical research
It is important to evaluate the quality of the research in order to establish credible results, at the same time as stabilizing the ground for future research. When evaluating the quality of the data col-lected, usual criteria are validity and reliability. The purpose of assessing reliability is to assure that later potential studies on the same subject with the same procedures would provide the same find-ings and conclusions, i.e. whether the produced data is independent of the context. This probability is higher if random errors and biases are minimized. The purpose of assessing validity is to test whether the evaluation technique actually measures what is supposed to be measured, i.e. if the pro-duced data represents the truth.33
2.1.2.4.1 Reliability
In terms of the qualitative data collected, it is judged that the necessary precautions were taken in order to ensure the minimization of errors and biases, i.e. to increase the reliability. Here, detailed notes have been taken during the interviews and summarized straight after. Any uncertainties have however been cleared over phone or through additional mail correspondence in order to ensure a high reliability of the information. In the same way company-unique definitions, specifics of met-rics and organizational structures important in order to understand, have been clarified during the interviews in order to understand the company’s ways of working with innovation and innovation metrics. In addition, concerning qualitative data, investigations should preferably be based on re-search problems and specific potentially important variables with reference to existing literature in theory building research, but thinking about specific relationships should be avoided in order to
32 Eisenhardt 1989 33 See for instance Yin 2003, Gustavsson 2004
13
prevent predetermination which will bias and limit the findings.34 This idea has been born in mind throughout the interviews as it was evident that the circular methodology would mean a theory-tinted interview format. Hence, it has been continuously ensured that the direction beyond the spe-cific questions sought answered followed the respondent rather than the interviewer, in order to decrease the risk of biased interviewing. In terms of the quantitative data, the majority of the respondents chose to use the provided excel sheet, where the description of the different parameters per metrics helped enabling a deeper under-standing of the metrics. The parameters also ensured that the respondent understood the types of metrics and parameters sought after. In certain cases, respondents chose to report the metrics in or-dinary email format, or orally during the interviews. In these cases the information has been noted in detail and definitions, application levels etc. have been clarified during or after the interview. In terms of reliability, it must however also be noted that the fact that only one or few people at each company have been interviewed, increases the risk of a biased picture, not representative for the whole company. To the reliability on this matter however, precautions have been taken through the extensive search for suitable people to talk to. It should also be noted that there is a risk for er-rors in the quotes, in that the majority of the interviews were held, and summaries were written, in Swedish but quotes have been translated into English for the thesis. The translations have however been confirmed by an English/Swedish speaking person, in order to minimize this risk.
2.1.2.4.2 Validity
Validity consists of three components: construct validity (correct operational measures, for instance the use of multiple sources of evidence), internal validity (the extent to which research results cor-respond with reality) and external validity (extent to which a study’s findings can be generalized beyond the case study conducted).35 In terms of construct and internal validity of the quantitative data, there is a possibility of the inter-viewed being unaware of certain metrics in use in parts of the organization, so that a non-complete picture of metrics has been reported. On the other hand, metrics which are not well communicated have little importance to the organization as they without communication cannot use them to steer behaviour (see chapter 3.3 for further explanation) More probable due to the positions of the re-spondents would be the situation of an “over-complete” picture of metrics, where the respondent might release metrics and ways of working with innovation that other parts of the organization are unaware of or that are not actually well used in reality. Over-reporting could come from a desire to give a good picture of the company, or ones own work on the area. This could have been minimized by having more respondents per company from various parts of the organization; however it has not been possible within the limited scope and timeframe of the thesis. Instead, focus has been laid on creation of trust and ensuring of confidentiality, which has been attained through the oral contact initiation, and oral interviews in most cases. For the same reason, recording the interviews and writing exact transcriptions has been avoided. This also limits the risk of focusing on word-for-word analysis as the main objective has been to create an understanding for what is needed on the area of innovation metrics rather than specific answers to specific questions.
34 Eisenhardt 1989 35 See for instance Yin 2003, Gustavsson 2004
14
The respondent’s perception of the interview as being comfortable and informal, has been judged more important than having post-interview access to word-for-word information. The large number of interviews in addition with the fact that the interviewer had previous notion of the subject through the initially deductive approach, further supported this choice. The approach also followed the focus of the qualitative data collection, where it was the respondent’s mental construct of reality which was studied, wherefore the results do not have to purely reflect the objective reality but where the perception is more interesting than the truth itself.36 However, in addition to add pieces of reality and strengthening the internal validity, a number of quotes have been included in the empiri-cal data section.37 In terms of external validity, it is possible that the representatives of companies who have been con-tacted but who denied an interview, might to a lower extent find interest in innovation issues and innovation metrics specifically, and hence represent companies who do not see a problem with the status quo and who do not want to increase the focus on innovation metrics. The high number of responding companies, unrelated by industry, type of product, type of customer, product life cycle etc., on a subject which with a broad definitions is non-industry and non-product/service-related (see chapter 3.1 for further support) is however argued to give a very high external validity.38
36 Taylor & Bogdan 1984 37 Merriam 1994 38 Yin 2003
15
3. Theoretical approaches to innovation metrics In order to be able to understand the way in which innovation metrics are used in reality, and to be able to later identify improved structures, different theories on the topic will be presented in the following chapter. First, an overview of how innovation is generally defined in theory will be pre-sented. Hereafter, four different authors’ view on innovation will be presented, together with a de-scription of their frameworks. To sum up this chapter, a discussion of the four authors will take place, combined with additional author’s comments on measuring innovation will be presented.
3.1 Definition of innovation
Innovation as a field of study has been discussed at least since the 19th century, by economist such as Say, Smith, Schumpeter, Keynes and Friedman. At this time, the definition of innovation seems to have been rather simple, meaning “the introduction of something new” as derived from the Latin words “in” and “novare” which means to “make new”.39 Schumpeter was the most prevalent de-bater of innovation, publishing several articles on the subject up until his death in 1950. His defini-tion of innovation could be divided into five different areas: new products, new methods of produc-tion, new sources of supply, the exploitation of new markets, and new ways to organize busi-nesses.40 However, the output of other academic articles on innovation was few at this time, and most definitions of innovation were narrow and highly technologically centered.41 It was not until the 1960s that the topic really hit the masses. Since then a large amount of articles and academic material has been published, increasing especially rapidly during the past 10 years.42 Today, we therefore see practically as many angles and definitions of innovation as there are au-thors on it. However, most have moved away from the technical, product development specific no-tion of innovation, and started including business model innovations, social innovation, national innovation, customer-driven innovation etc. Although impossible to here go through a thorough summary of innovation definitions, one of the most important distinctions include one between in-
vention and innovation, where invention basically is an idea for a new product, process etc. whilst innovation is the attempt to carry it out into practice. A change or improvement is only an innova-tion when it is put into use and hence causes a social or commercial reorganization.43 In addition, innovation is to be seen as the result of a lengthy process which involves many interrelated innova-tions, rather than as a single item.44 According to Kuczmerski innovation “is a mindset”45. Beyond this, there are several different types of innovations on a firm-level. Some of them in-clude:46
• Type of innovation: Product/service, Process, Business model, Social, Market-driven, Expe-
riential, Marketing, Structural, Disruptive, Technical vs. ;on-technical etc. • Type of newness: ;ew to the world, ;ew to the company, Line extensions, Improvements or
revisions, Product/Service/repositioning, Cost reductions etc.
39 Sarkar 2007 40 According to Fagerberg et al. 2005, Freeman 2008 41 Edquist 1997 42 Fagerberg & Verspagen 2008 43 See for instance Goffin & Mitchell 2005, Fagerberg et al. 2005 44 Fagerberg et al. 2005 45 Kuczmarksi 2000 46 Selection based on Moore, 2004, Davila et al. 2006, Goffin & Mitchell 2005, Kuczmarksi 2000
16
• Type of strategy behind: Market penetration, Product development, Market development,
Diversification etc. Whilst one the one hand, the high diversity in definitions probably has spurred the interest and pro-duction of much interdisciplinary work, it is also of value to create a harmonization of the concepts in order to be able to create further development on innovation related areas, 47 including innovation metrics. Although a harmonization is not the aim of the thesis, it is important to state that the fol-lowing chapters of the thesis understands innovation from a broad, inclusive and “modern” (if you’ll have it) meaning of innovation, where innovation can be performed by a number of people in a number of ways. However, no further breakdowns will made.
3.2 Identification of four theories for structuring innovation
In order to create metrics, and be confident in that the important areas are measured, innovation must be structured. A thorough study of the literature on general innovation management however showed that there are several authors discussing innovation management frameworks in general, but not linking performance measurements to it. On the other hand there are theoretics suggesting spe-cific metrics or measurement levels, but not providing sufficient support for the chosen ones, in terms of holistic systems or models. Building on a quote saying that “designing a measurement system for innovation relies on a clear model of how innovation is managed and how ideas are created, evaluated and selected, and trans-formed into value”48, four groups of academics who recently (2005, 2005, 2006 and 2008 respec-tively)49 have provided both models for innovation management as well as specific metrics sugges-tions, will be presented in this chapter. Four different ones have been chosen in order to create a fundamental understanding of the innovation process and the similarities and variation that the dif-ferent authors provide. The areas important to innovation management would naturally correspond to the areas which are important to monitor and control. The reader will therefore through the italic words be able to follow areas of innovation management and measurement which are strongly sug-gested by the authors. This will also facilitate the connection to the summarizing table of metrics, which is a combination of the important areas and specific metrics suggested by the authors. Please refer to Appendix 1, for a full description of the specific metrics, suggested by each author. It is important to note that none of the four authors deal very thoroughly with innovation metrics in terms of breaking the metrics down, making clear definitions or distinctions between parameters, identifying measurement levels, suggesting actual methods for data collection or backing up the metrics through empirical studies. However, all authors have a background of working closely with several organizations on innovation metrics, through teaching, consulting etc. Together, their over-all arguments lay a foundation as to which areas of innovation are important, functioning as a re-minder not to focus on one, but many elements of innovation management when looking to measure it.
47 Archibugi 1999 48 Davila et al. 2006, p. 148 49 For instance, Kuczmarksi also uses an innovation model to draw conclusions of metrics from. However his paper dates back to 2000 and the four chosen theories all overlap his suggestions.
17
3.2.1 Davila et al.
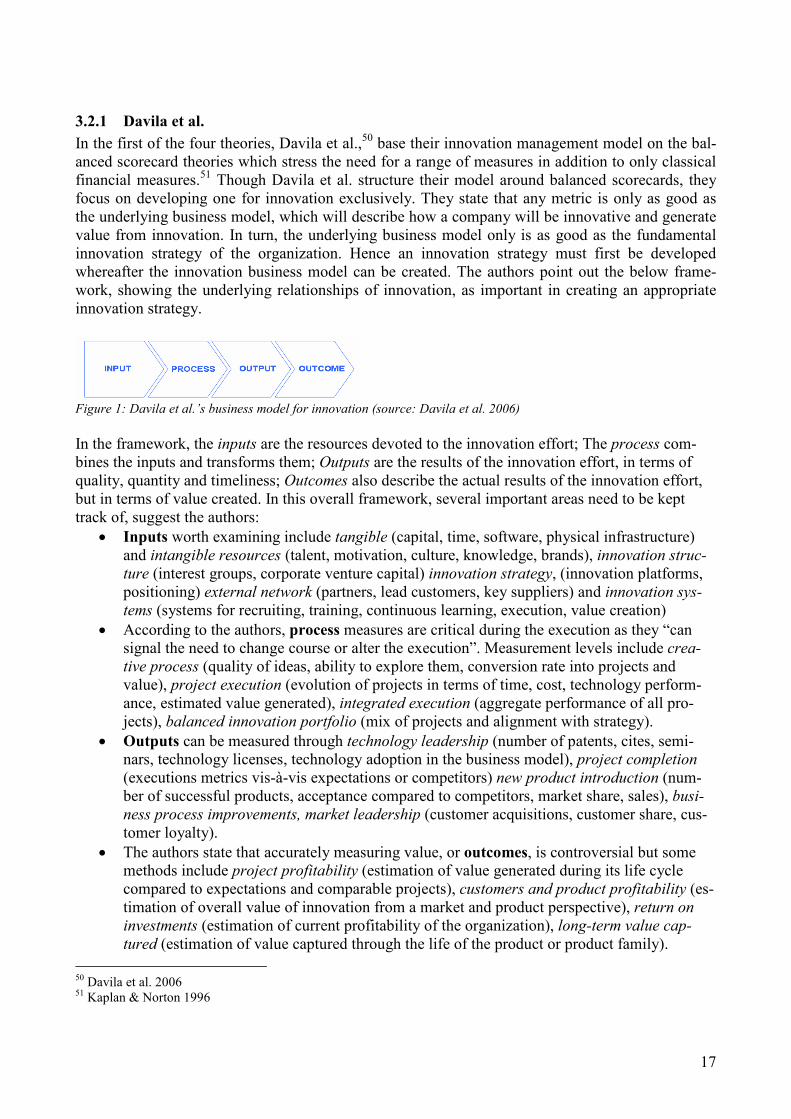
In the first of the four theories, Davila et al.,50 base their innovation management model on the bal-anced scorecard theories which stress the need for a range of measures in addition to only classical financial measures.51 Though Davila et al. structure their model around balanced scorecards, they focus on developing one for innovation exclusively. They state that any metric is only as good as the underlying business model, which will describe how a company will be innovative and generate value from innovation. In turn, the underlying business model only is as good as the fundamental innovation strategy of the organization. Hence an innovation strategy must first be developed whereafter the innovation business model can be created. The authors point out the below frame-work, showing the underlying relationships of innovation, as important in creating an appropriate innovation strategy.
Figure 1: Davila et al.’s business model for innovation (source: Davila et al. 2006)
In the framework, the inputs are the resources devoted to the innovation effort; The process com-bines the inputs and transforms them; Outputs are the results of the innovation effort, in terms of quality, quantity and timeliness; Outcomes also describe the actual results of the innovation effort, but in terms of value created. In this overall framework, several important areas need to be kept track of, suggest the authors:
• Inputs worth examining include tangible (capital, time, software, physical infrastructure) and intangible resources (talent, motivation, culture, knowledge, brands), innovation struc-
ture (interest groups, corporate venture capital) innovation strategy, (innovation platforms, positioning) external network (partners, lead customers, key suppliers) and innovation sys-
tems (systems for recruiting, training, continuous learning, execution, value creation) • According to the authors, process measures are critical during the execution as they “can
signal the need to change course or alter the execution”. Measurement levels include crea-
tive process (quality of ideas, ability to explore them, conversion rate into projects and value), project execution (evolution of projects in terms of time, cost, technology perform-ance, estimated value generated), integrated execution (aggregate performance of all pro-jects), balanced innovation portfolio (mix of projects and alignment with strategy).
• Outputs can be measured through technology leadership (number of patents, cites, semi-nars, technology licenses, technology adoption in the business model), project completion (executions metrics vis-à-vis expectations or competitors) new product introduction (num-ber of successful products, acceptance compared to competitors, market share, sales), busi-
ness process improvements, market leadership (customer acquisitions, customer share, cus-tomer loyalty).
• The authors state that accurately measuring value, or outcomes, is controversial but some methods include project profitability (estimation of value generated during its life cycle compared to expectations and comparable projects), customers and product profitability (es-timation of overall value of innovation from a market and product perspective), return on
investments (estimation of current profitability of the organization), long-term value cap-
tured (estimation of value captured through the life of the product or product family).
50 Davila et al. 2006 51 Kaplan & Norton 1996
18
Change in valuation of share prices could be another measurement but it relies on the as-sumption of efficient markets, claim the authors. In addition it can of course only be used by public companies.
3.2.2 Goffin & Mitchell
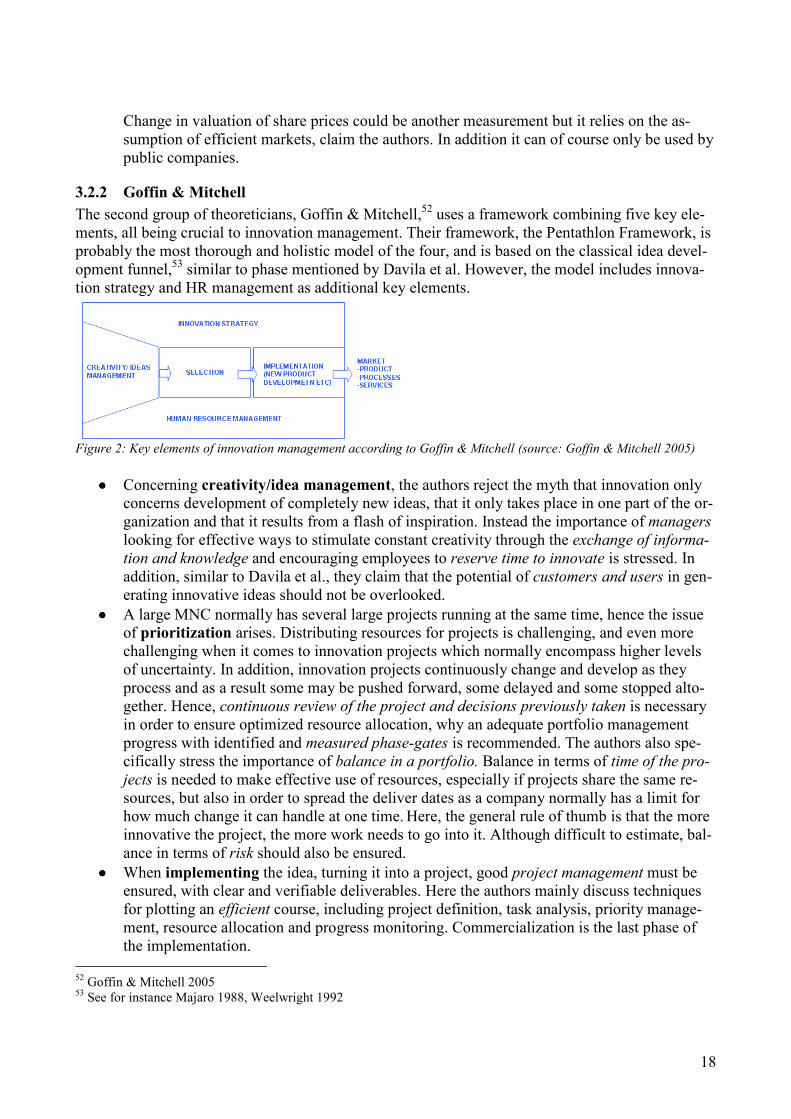
The second group of theoreticians, Goffin & Mitchell,52 uses a framework combining five key ele-ments, all being crucial to innovation management. Their framework, the Pentathlon Framework, is probably the most thorough and holistic model of the four, and is based on the classical idea devel-opment funnel,53 similar to phase mentioned by Davila et al. However, the model includes innova-tion strategy and HR management as additional key elements.
Figure 2: Key elements of innovation management according to Goffin & Mitchell (source: Goffin & Mitchell 2005)
•••• Concerning creativity/idea management, the authors reject the myth that innovation only
concerns development of completely new ideas, that it only takes place in one part of the or-ganization and that it results from a flash of inspiration. Instead the importance of managers looking for effective ways to stimulate constant creativity through the exchange of informa-
tion and knowledge and encouraging employees to reserve time to innovate is stressed. In addition, similar to Davila et al., they claim that the potential of customers and users in gen-erating innovative ideas should not be overlooked.
•••• A large MNC normally has several large projects running at the same time, hence the issue of prioritization arises. Distributing resources for projects is challenging, and even more challenging when it comes to innovation projects which normally encompass higher levels of uncertainty. In addition, innovation projects continuously change and develop as they process and as a result some may be pushed forward, some delayed and some stopped alto-gether. Hence, continuous review of the project and decisions previously taken is necessary in order to ensure optimized resource allocation, why an adequate portfolio management progress with identified and measured phase-gates is recommended. The authors also spe-cifically stress the importance of balance in a portfolio. Balance in terms of time of the pro-
jects is needed to make effective use of resources, especially if projects share the same re-sources, but also in order to spread the deliver dates as a company normally has a limit for how much change it can handle at one time. Here, the general rule of thumb is that the more innovative the project, the more work needs to go into it. Although difficult to estimate, bal-ance in terms of risk should also be ensured.
•••• When implementing the idea, turning it into a project, good project management must be ensured, with clear and verifiable deliverables. Here the authors mainly discuss techniques for plotting an efficient course, including project definition, task analysis, priority manage-ment, resource allocation and progress monitoring. Commercialization is the last phase of the implementation.
52 Goffin & Mitchell 2005 53 See for instance Majaro 1988, Weelwright 1992
19
•••• Similar to Davila et al., Goffin & Mitchell also stress the importance of the innovation
strategy which is part of the overall strategy and has the role to indicate what new ideas are needed, which in practise is not often done. As many people can come up with solutions when faced with specific problems, but few are successful in producing new ideas spontane-ously, direction from above regarding what areas of the organization/products are in need of new inventions, is crucial in order to direct people efficiently. In addition, Goffin & Mitchell focus on the need for balance in the innovation portfolio, claiming that innovation strategy plays an important role in clearly indicating a certain level of newness required in the new innovations, in order to avoid that the company is being supported only on innovations of the current business model, which may be inaccurate a few years later.
•••• The human resource management element, stresses the strategic importance of the man-agement of human resources in three levels: organizational, innovation project team and employee level. Here, the authors mainly discuss how to create innovative environments, in-
novative teams and how to motivate people on an individual level, but also suggests some metrics of innovative performance on employee level.
Goffin & Mitchell argue that input, process and output measures in relation to their five parameters should be applied when measuring an organizations’ level of innovation. It should however be noted that there is a substantial lack of connection between the model and their suggested metrics. See Appendix 1B for all full description.
3.2.3 Muller et al.
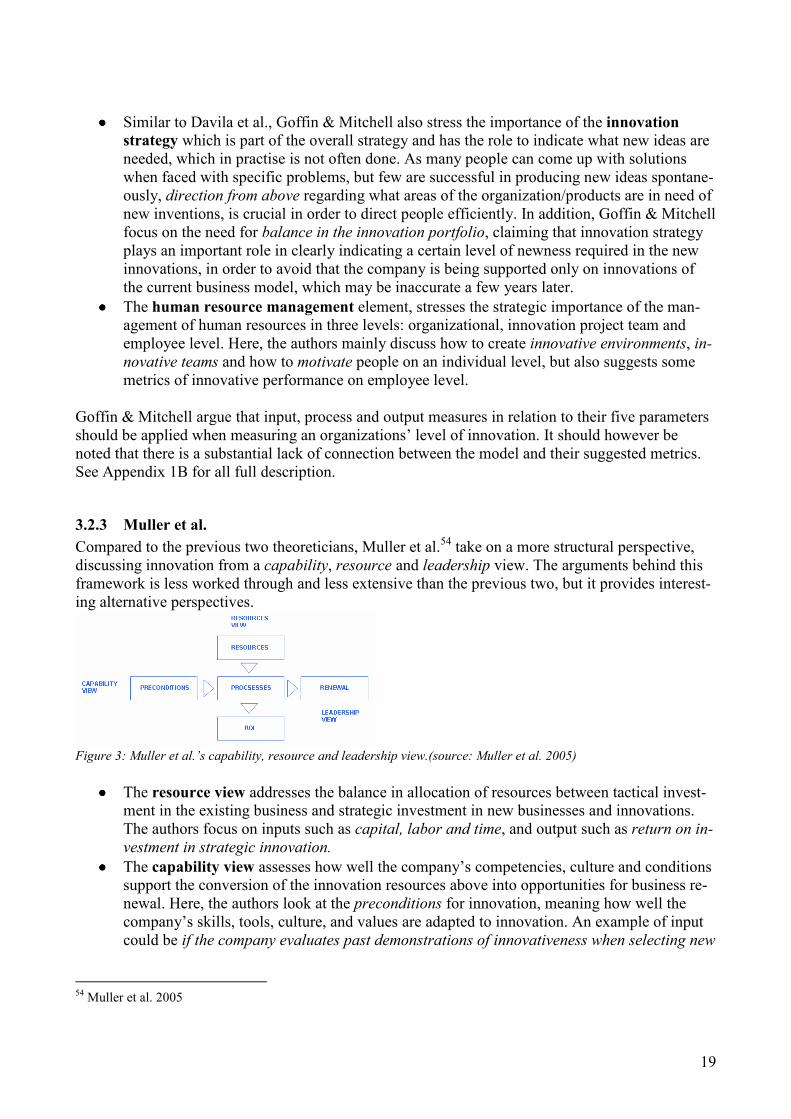
Compared to the previous two theoreticians, Muller et al.54 take on a more structural perspective, discussing innovation from a capability, resource and leadership view. The arguments behind this framework is less worked through and less extensive than the previous two, but it provides interest-ing alternative perspectives.
Figure 3: Muller et al.’s capability, resource and leadership view.(source: Muller et al. 2005)
•••• The resource view addresses the balance in allocation of resources between tactical invest-ment in the existing business and strategic investment in new businesses and innovations. The authors focus on inputs such as capital, labor and time, and output such as return on in-
vestment in strategic innovation. •••• The capability view assesses how well the company’s competencies, culture and conditions
support the conversion of the innovation resources above into opportunities for business re-newal. Here, the authors look at the preconditions for innovation, meaning how well the company’s skills, tools, culture, and values are adapted to innovation. An example of input could be if the company evaluates past demonstrations of innovativeness when selecting new
54 Muller et al. 2005
20
recruits. An output could be the development of new skills and knowledge areas that gener-ates innovation or opportunities.
•••• The leadership view illustrates how the company’s leadership supports innovation. This is done by evaluating leaders’ involvement in innovation activities, the establishment of formal
processes to promote innovation, and dissemination of innovation goals. The three views are in the framework linked together through the processes, constituting an addi-tional element to the framework. Processes are here understood as organizational structures such as incubators, innovation markets, venture funds, and innovation incentives.
3.2.4 Regnell et al.
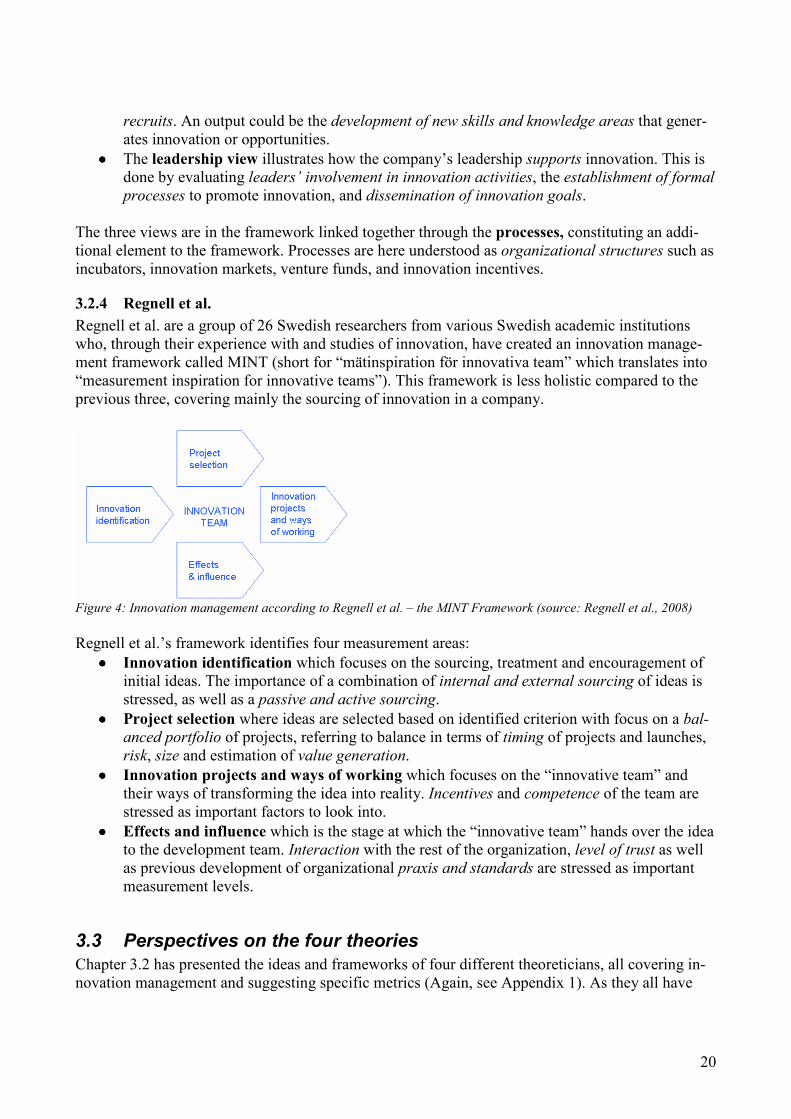
Regnell et al. are a group of 26 Swedish researchers from various Swedish academic institutions who, through their experience with and studies of innovation, have created an innovation manage-ment framework called MINT (short for “mätinspiration för innovativa team” which translates into “measurement inspiration for innovative teams”). This framework is less holistic compared to the previous three, covering mainly the sourcing of innovation in a company.
Figure 4: Innovation management according to Regnell et al. – the MI;T Framework (source: Regnell et al., 2008)
Regnell et al.’s framework identifies four measurement areas:
•••• Innovation identification which focuses on the sourcing, treatment and encouragement of initial ideas. The importance of a combination of internal and external sourcing of ideas is stressed, as well as a passive and active sourcing.
•••• Project selection where ideas are selected based on identified criterion with focus on a bal-
anced portfolio of projects, referring to balance in terms of timing of projects and launches, risk, size and estimation of value generation.
•••• Innovation projects and ways of working which focuses on the “innovative team” and their ways of transforming the idea into reality. Incentives and competence of the team are stressed as important factors to look into.
•••• Effects and influence which is the stage at which the “innovative team” hands over the idea to the development team. Interaction with the rest of the organization, level of trust as well as previous development of organizational praxis and standards are stressed as important measurement levels.
3.3 Perspectives on the four theories
Chapter 3.2 has presented the ideas and frameworks of four different theoreticians, all covering in-novation management and suggesting specific metrics (Again, see Appendix 1). As they all have
21
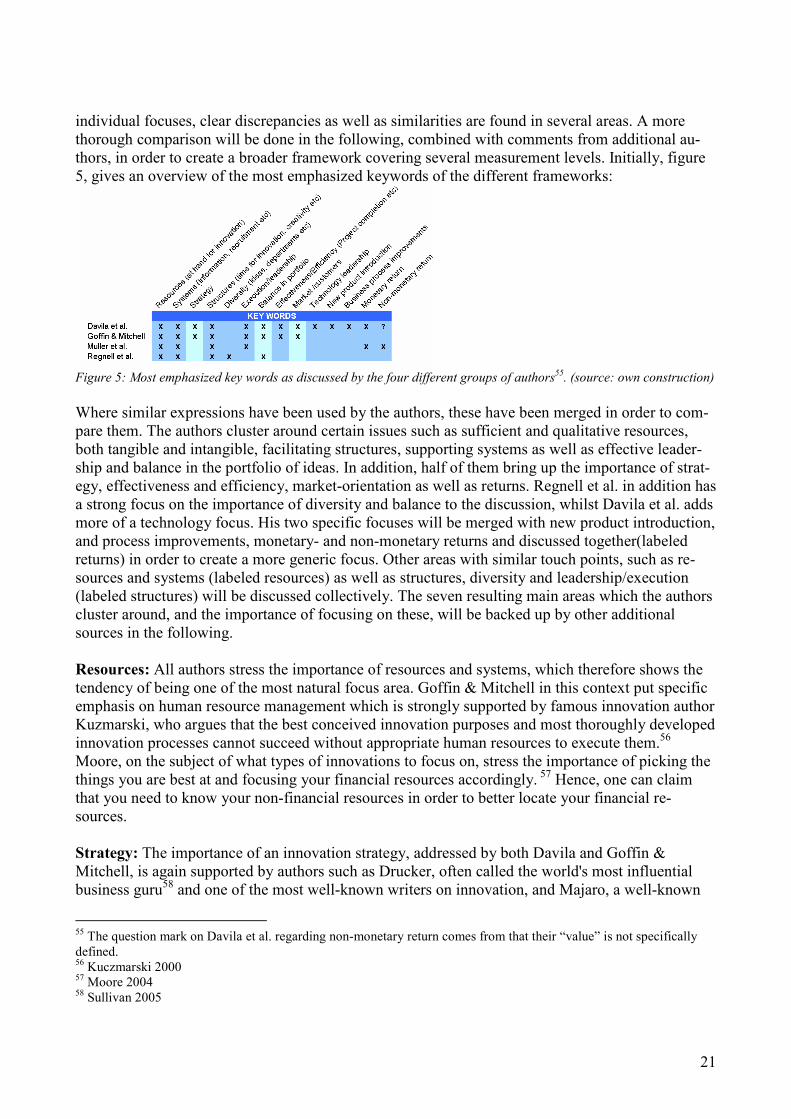
individual focuses, clear discrepancies as well as similarities are found in several areas. A more thorough comparison will be done in the following, combined with comments from additional au-thors, in order to create a broader framework covering several measurement levels. Initially, figure 5, gives an overview of the most emphasized keywords of the different frameworks:
Figure 5: Most emphasized key words as discussed by the four different groups of authors
55. (source: own construction)
Where similar expressions have been used by the authors, these have been merged in order to com-pare them. The authors cluster around certain issues such as sufficient and qualitative resources, both tangible and intangible, facilitating structures, supporting systems as well as effective leader-ship and balance in the portfolio of ideas. In addition, half of them bring up the importance of strat-egy, effectiveness and efficiency, market-orientation as well as returns. Regnell et al. in addition has a strong focus on the importance of diversity and balance to the discussion, whilst Davila et al. adds more of a technology focus. His two specific focuses will be merged with new product introduction, and process improvements, monetary- and non-monetary returns and discussed together(labeled returns) in order to create a more generic focus. Other areas with similar touch points, such as re-sources and systems (labeled resources) as well as structures, diversity and leadership/execution (labeled structures) will be discussed collectively. The seven resulting main areas which the authors cluster around, and the importance of focusing on these, will be backed up by other additional sources in the following. Resources: All authors stress the importance of resources and systems, which therefore shows the tendency of being one of the most natural focus area. Goffin & Mitchell in this context put specific emphasis on human resource management which is strongly supported by famous innovation author Kuzmarski, who argues that the best conceived innovation purposes and most thoroughly developed innovation processes cannot succeed without appropriate human resources to execute them.56 Moore, on the subject of what types of innovations to focus on, stress the importance of picking the things you are best at and focusing your financial resources accordingly. 57 Hence, one can claim that you need to know your non-financial resources in order to better locate your financial re-sources. Strategy: The importance of an innovation strategy, addressed by both Davila and Goffin & Mitchell, is again supported by authors such as Drucker, often called the world's most influential business guru58 and one of the most well-known writers on innovation, and Majaro, a well-known
55 The question mark on Davila et al. regarding non-monetary return comes from that their “value” is not specifically defined. 56 Kuczmarski 2000 57 Moore 2004 58 Sullivan 2005
22
marketing strategist. They both discuss the importance of clear and specific innovation strategies to help integrate the organization’s diverse activities so that the overall goal of innovation can be sup-ported. According to Majaro, the innovation strategy must be clearly communicated on all levels of the organization in order to be effective and gain this support.59 Structures: The need for organizational praxis and standards is in addition supported by Drucker. He argues that everybody in the organization always knows that the need (for process innovation and improvements) exists, yet usually no one does anything about it.60 The importance of the man-agement here is further supported by Hamel, the world’s most influential business thinker according to the Wall Street Journal61, who however takes the perspective even further by discussing the ne-cessity of strong management innovation, which means innovating around new ways to organize, lead, coordinate and motivate. Hamel claims that management innovations are what create long-lasting advantages, rather than technology and product innovation which are low-calibre innova-tions, having impact only in the short-term.62 Kuczmarski similarly states that each company has its own identity and challenges, and works in a different competitive environments, but that it however is the top management, particularly the CEO, who makes or breaks the spirit of innovation. Hence, innovation cannot be delegated, and will succeed only if senior management develops the right alti-tude.63 Cooper et al. further stresses the importance of looking into structures, through his focus on the cross-functional teams. They state that leading organizations greatly rely on cross-functional teams throughout the NPD process, which should be possible to equal with innovation. Based on the same study, Cooper et al specifically comments on the structural and managerial matter which concerns time allowed for innovation, claiming that managers must take a hard look at the percent-age of time truly available for NPD and that their commitment must be spelled out quantitatively.64 Barczak in addition presents data supporting that the leading organizations rely greatly on cross-functional teams throughout the NPD process.65 As a part of this, the exchange of information and knowledge, is further supported by Drucker who claims that it requires knowledge.66 Knowledge, and specifically communication of knowledge, is supported by several other sources.67 Balance: The pre-calculation and monitoring of balance in terms of risk, particularly stressed by Regnell, is strongly supported by Drucker who says that successful innovators are and have to be conservative.68 Kuczmarski also supports the mix of projects in the portfolio and brings up the types of innovations, previously discussed in chapter 3.1. A tracking of the balance of different types of innovations, he argues, gives a broader picture of the types of innovations that the company is deal-ing with.69 Effectiveness and efficiency: The importance of a focus on efficiency and effectiveness are par-ticularly stressed by Davila et. al. and Goffin & Mitchell. Davila et al. does however stress the im-portance of not focusing too much on efficiency, as this may inhibit creativity, but later also ac-
59 Majaro 1984, Drucker (People…) 2007 60 Drucker (Innovation…) 2007 61 White 2008 62 Hamel 2006 63 Kuczmarski 2000 64 Cooper et al. 2004 65 Barczak 2006 66 Drucker (Innovation…) 2007 67 See for instance Dooley & Sullivan 2007, Kuczmarksi 2001 68 Drucker (Innovation…) 2007 69 Kuczmarski 2000
23
knowledges that a “right way” of structuring can enhance creativity70. In a very recent study, Sar-kees & Hulland71 argues that relatively few firms are able to balance efficiency and innovation due to battles for resources. Their cross-industry study on publicly-traded U.S. firms however shows that companies which are successful at combining these two focuses outperform those which over-emphasize either. Effectiveness concerns the importance of focusing on the right types of innova-tions which is naturally important, and also covered by several authors including Drucker.72
Market-orientation: Only two of the groups of the authors mention the importance of some kind of market-orientation, although one would instinctively argue that an innovation can have no suc-cess without it being useful to, and required by the customer. Drucker supports this by claiming that an innovative strategy needs to deliver what is “value” to the customer rather than what is “product” to the manufacturer and that the entrepreneurial strategy has a larger chance of success the more it starts out with the users.73 He further claims that the test of an innovation always is what it does for the user, and that entrepreneurship always needs to be market-focused and market-driven. The im-portance of market-orientation is further supported by Majaro, who states that innovation can be derived from several influential factors, but if they are derived solely from people without influence from the market, there is a risk that the level of innovation will be fairly low.74 Leadbeater, a strong supporter of consumer innovation, confirmingly states that consumers and markets need to be just as highly involved in innovation as scientists and laboratories and that this is the only way for both companies and nations to survive in the long run. 75
Returns: Neither Goffin & Mitchell nor Regnell et al. cover the outputs of innovation. Goffin & Mitchell however includes it in their specific suggestions for metrics, and it is emphasized by both Davila et al. and Muller et al. In addition, to Davila et al.’s long-term value focus and Muller et al.’s focus on more softer outputs, Drucker comments on the risk of having too static and only short-term focus on innovation output such as goals of 5 percent growth in profits every year, since normally innovations do not result in profits until much later, after its introduction.76 As the inherent reason for innovation is returns, this is argued to be enough supported. Beyond these seven areas, there are several voices commenting on the actual set of metrics. It needs of course be ensured that the cost of locating the data does not exceed the benefit of knowing
the data. This is closely related to the number of metrics where it is important not to have too many metrics, but at the same time not limiting the number too much. Too many in a complex measure-ment system creates prioritization difficulties, whilst few metrics in a clear system can give an overview just as good.77 Measuring the right thing is crucial, as metrics steer the behaviour in the organization. Common mistakes are that the metrics are too focused on outcome and cutting costs (sub-optimal if you want to encourage risk-taking and thinking outside of the box), historical per-formance (meaning that people will see it as that happened then) too difficult to interpret (that peo-ple do not react to it), too difficult to impact (only measuring R&D investments gives little incen-tive for employees to act) and not customer focused (sub-optimal if you’re looking for the innova-
70 Davila et al. 2006 71 Sarkees & Hulland 2009 72 Drucker (People) 2007 73 Drucker (Innovation…) 2007 74 Majaro 1984 75 Leadbeater 2006 76 Drucker (People…) 2007 77 For instance Goffin & Mitchell 2005, Kuczmarski 2000, Rae 2006, Muller et al. 2005

24
tions to be customer-driven)78 Finally, and similarly, there is a risk that organizations put too much efforts on metrics without reflecting on whether or not the metrics are value creating, if they tell something about the business impact, or if they are linked to the business strategy.79
78 For instance Regnell et al. 2008, Kuczmarski 2001, Muller et al. 2005, Goffin & Mitchell, 2005, Dooley & O’Sullivan 2007 79 For instance Rae 2006, Goffin & Mitchell 2005, Dooley & Sullivan 2007, Kuczmarski 2001
25
4 Analysis of theoretical framework In chapter 3, the contents and suggestions of the four theoretical frameworks were presented one by one, followed by an identification of common views on important metric areas. These resulting ar-eas, were further backed up by other literature and sources on innovation. All the resulting areas described in chapter 3.3 can therefore be argued as being important for a company’s success on innovation. A deeper analysis of these areas will be conceived in the following section, with the purpose of merging them into a common applicable framework for further analysis of the empirical data.
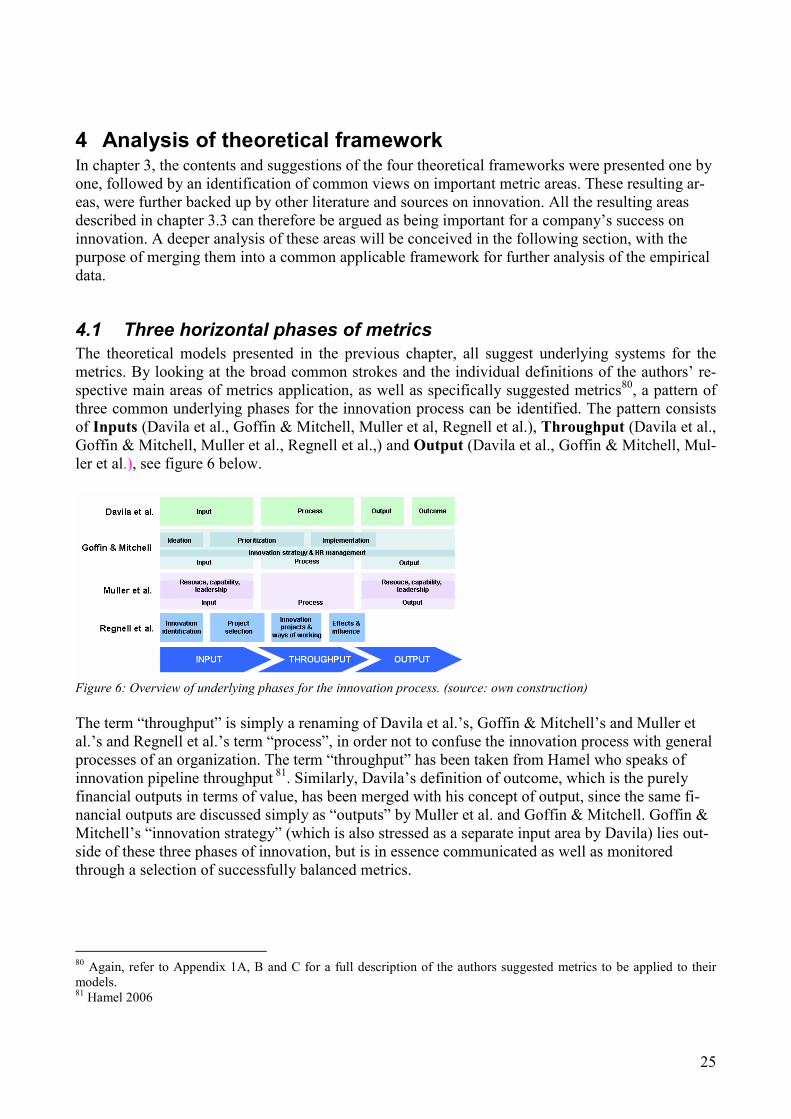
4.1 Three horizontal phases of metrics
The theoretical models presented in the previous chapter, all suggest underlying systems for the metrics. By looking at the broad common strokes and the individual definitions of the authors’ re-spective main areas of metrics application, as well as specifically suggested metrics80, a pattern of three common underlying phases for the innovation process can be identified. The pattern consists of Inputs (Davila et al., Goffin & Mitchell, Muller et al, Regnell et al.), Throughput (Davila et al., Goffin & Mitchell, Muller et al., Regnell et al.,) and Output (Davila et al., Goffin & Mitchell, Mul-ler et al.), see figure 6 below.
Figure 6: Overview of underlying phases for the innovation process. (source: own construction)
The term “throughput” is simply a renaming of Davila et al.’s, Goffin & Mitchell’s and Muller et al.’s and Regnell et al.’s term “process”, in order not to confuse the innovation process with general processes of an organization. The term “throughput” has been taken from Hamel who speaks of innovation pipeline throughput 81. Similarly, Davila’s definition of outcome, which is the purely financial outputs in terms of value, has been merged with his concept of output, since the same fi-nancial outputs are discussed simply as “outputs” by Muller et al. and Goffin & Mitchell. Goffin & Mitchell’s “innovation strategy” (which is also stressed as a separate input area by Davila) lies out-side of these three phases of innovation, but is in essence communicated as well as monitored through a selection of successfully balanced metrics.
80 Again, refer to Appendix 1A, B and C for a full description of the authors suggested metrics to be applied to their models. 81 Hamel 2006
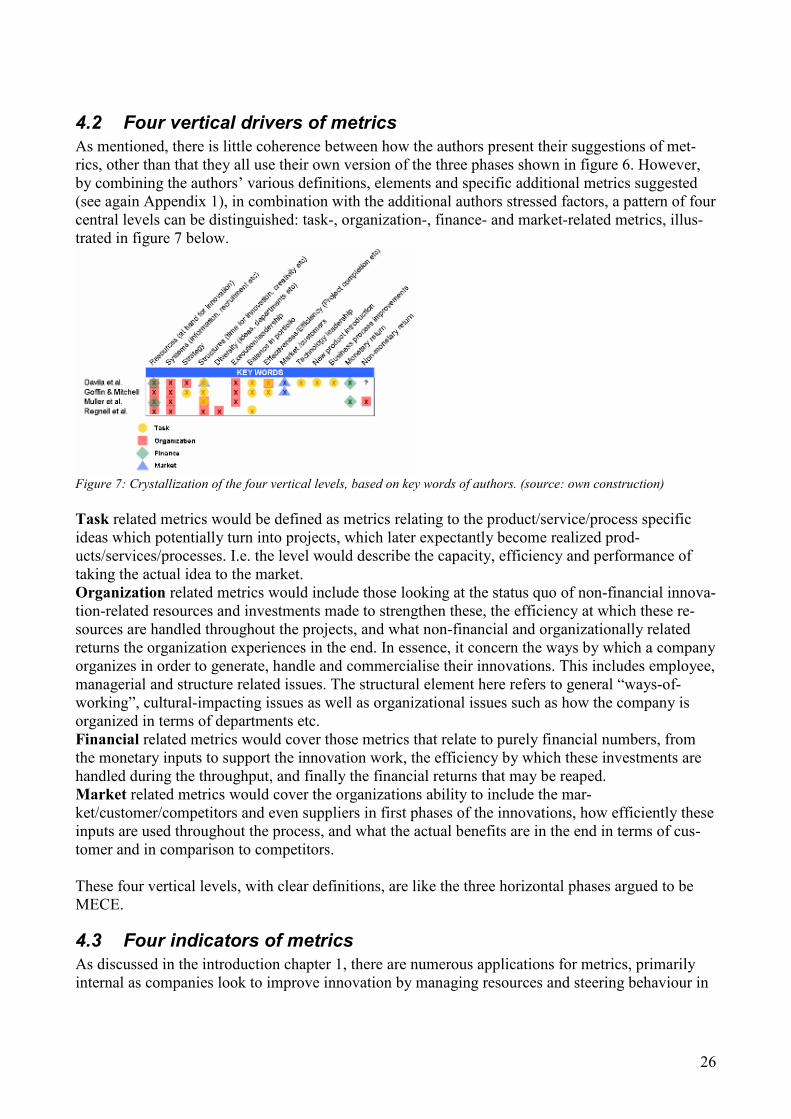
26
4.2 Four vertical drivers of metrics
As mentioned, there is little coherence between how the authors present their suggestions of met-rics, other than that they all use their own version of the three phases shown in figure 6. However, by combining the authors’ various definitions, elements and specific additional metrics suggested (see again Appendix 1), in combination with the additional authors stressed factors, a pattern of four central levels can be distinguished: task-, organization-, finance- and market-related metrics, illus-trated in figure 7 below.
Figure 7: Crystallization of the four vertical levels, based on key words of authors. (source: own construction)
Task related metrics would be defined as metrics relating to the product/service/process specific ideas which potentially turn into projects, which later expectantly become realized prod-ucts/services/processes. I.e. the level would describe the capacity, efficiency and performance of taking the actual idea to the market. Organization related metrics would include those looking at the status quo of non-financial innova-tion-related resources and investments made to strengthen these, the efficiency at which these re-sources are handled throughout the projects, and what non-financial and organizationally related returns the organization experiences in the end. In essence, it concern the ways by which a company organizes in order to generate, handle and commercialise their innovations. This includes employee, managerial and structure related issues. The structural element here refers to general “ways-of-working”, cultural-impacting issues as well as organizational issues such as how the company is organized in terms of departments etc. Financial related metrics would cover those metrics that relate to purely financial numbers, from the monetary inputs to support the innovation work, the efficiency by which these investments are handled during the throughput, and finally the financial returns that may be reaped. Market related metrics would cover the organizations ability to include the mar-ket/customer/competitors and even suppliers in first phases of the innovations, how efficiently these inputs are used throughout the process, and what the actual benefits are in the end in terms of cus-tomer and in comparison to competitors. These four vertical levels, with clear definitions, are like the three horizontal phases argued to be MECE.
4.3 Four indicators of metrics
As discussed in the introduction chapter 1, there are numerous applications for metrics, primarily internal as companies look to improve innovation by managing resources and steering behaviour in
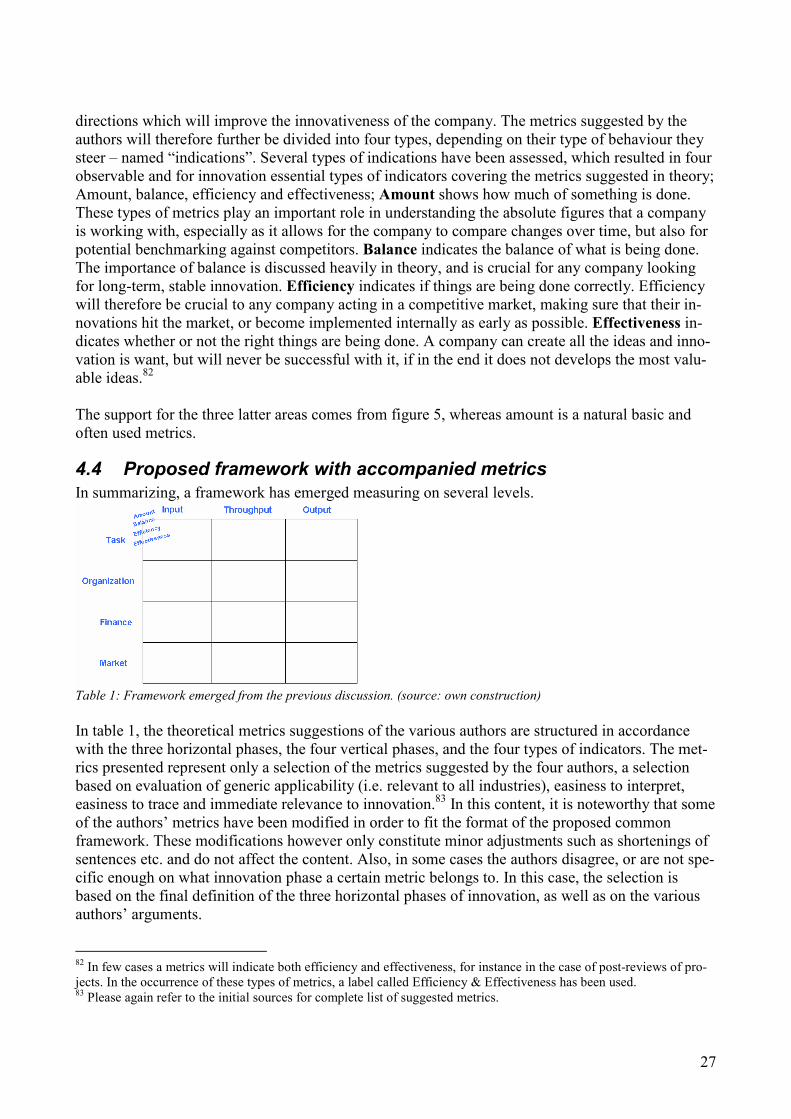
27
directions which will improve the innovativeness of the company. The metrics suggested by the authors will therefore further be divided into four types, depending on their type of behaviour they steer – named “indications”. Several types of indications have been assessed, which resulted in four observable and for innovation essential types of indicators covering the metrics suggested in theory; Amount, balance, efficiency and effectiveness; Amount shows how much of something is done. These types of metrics play an important role in understanding the absolute figures that a company is working with, especially as it allows for the company to compare changes over time, but also for potential benchmarking against competitors. Balance indicates the balance of what is being done. The importance of balance is discussed heavily in theory, and is crucial for any company looking for long-term, stable innovation. Efficiency indicates if things are being done correctly. Efficiency will therefore be crucial to any company acting in a competitive market, making sure that their in-novations hit the market, or become implemented internally as early as possible. Effectiveness in-dicates whether or not the right things are being done. A company can create all the ideas and inno-vation is want, but will never be successful with it, if in the end it does not develops the most valu-able ideas.82 The support for the three latter areas comes from figure 5, whereas amount is a natural basic and often used metrics.
4.4 Proposed framework with accompanied metrics
In summarizing, a framework has emerged measuring on several levels.
Table 1: Framework emerged from the previous discussion. (source: own construction)
In table 1, the theoretical metrics suggestions of the various authors are structured in accordance with the three horizontal phases, the four vertical phases, and the four types of indicators. The met-rics presented represent only a selection of the metrics suggested by the four authors, a selection based on evaluation of generic applicability (i.e. relevant to all industries), easiness to interpret, easiness to trace and immediate relevance to innovation.83 In this content, it is noteworthy that some of the authors’ metrics have been modified in order to fit the format of the proposed common framework. These modifications however only constitute minor adjustments such as shortenings of sentences etc. and do not affect the content. Also, in some cases the authors disagree, or are not spe-cific enough on what innovation phase a certain metric belongs to. In this case, the selection is based on the final definition of the three horizontal phases of innovation, as well as on the various authors’ arguments.
82 In few cases a metrics will indicate both efficiency and effectiveness, for instance in the case of post-reviews of pro-jects. In the occurrence of these types of metrics, a label called Efficiency & Effectiveness has been used. 83 Please again refer to the initial sources for complete list of suggested metrics.
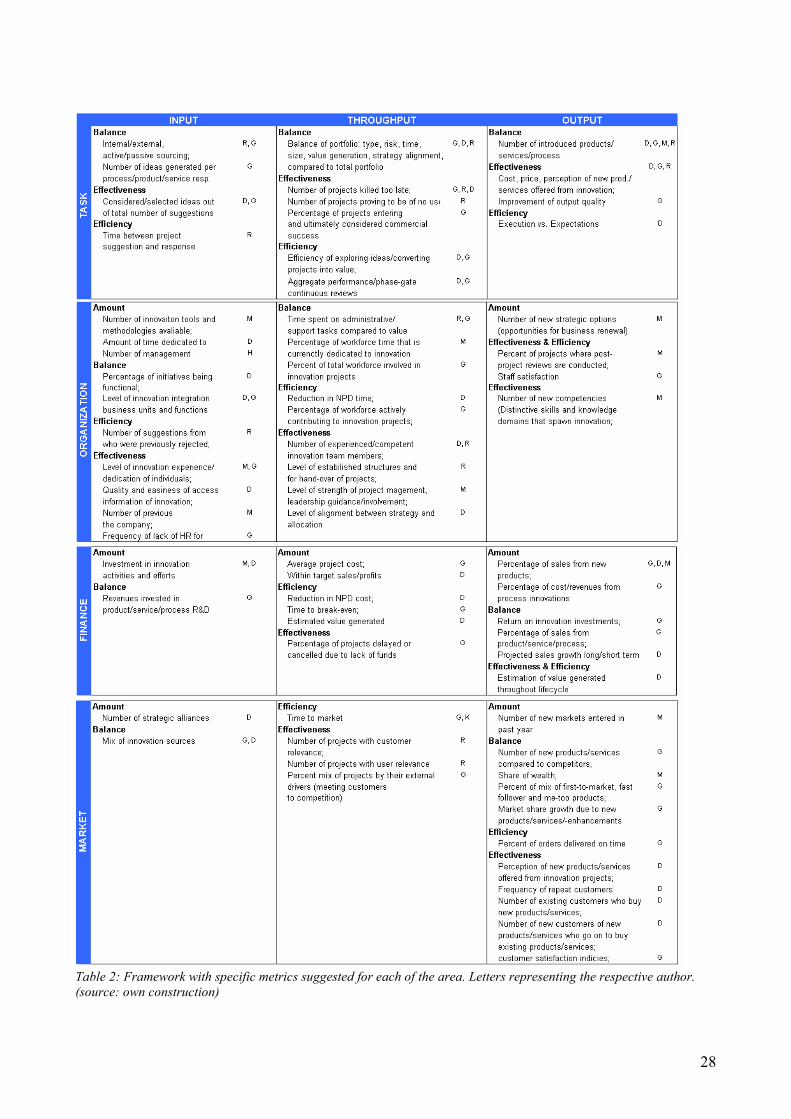
28
Table 2: Framework with specific metrics suggested for each of the area. Letters representing the respective author.
(source: own construction)
29
We can see that task related metrics in theory particularly stress a balance of tasks, in addition to a check of quality (effectiveness, efficiency) of the actual tasks performed. Based on Regnell’s and Goffin & Mitchell’s definitions of project selection and prioritization respectively, the importance of a balancing portfolio will be accounted the throughput phase. Attempts to ensure that inputs are balanced can be made, however it is in fact not until the project is part of a portfolio, and i.e. is in the throughput, that it can in fact be measured/estimated. Additionally, “type” in “balance of portfo-lio” refers to process/product/service for instance, as defined by Goffin & Mitchell. Chapter 3.1 on definition of innovation, identifies some of these types, which can all be considered important in order to maintain long-term innovativeness.
The organizational level evidently includes a lot of “soft” metrics, however as can be seen in the table above, also several highly quantitative metric are recommended on this level. Belonging to this level are for instance all metrics involving time, as this concern the efficiency of the employees, managers and structures.84 With good project management and project plans, time should be rather easily traceable, although, or course, should not be overemphasized, as noted by for instance Davila et al. Regarding some specific metrics, it can be seen in the table, “Innovation experience” is la-belled an indicator of effectiveness of the input. Innovation experience of employees, does not nec-essarily equal effective performance, however, experience of innovation work would indicate a ten-dency to have a more “innovative” mind-set, and hence being able to create more effective inputs. “Lack of human resources” is similarly reported as a measurement of effectiveness, as the lack means that the company does not do the right things, what they want, because they are hindered by this. “Number of new strategic options” is labelled “amount” as the measurement lacks a value-related element of the actual outcome – i.e. whether or not the options are actually used for improv-ing purposes. Financial measures are possibly the most straight-forward, with the exception of “value generated”. Due to the general difficulty of estimating it, value generation should be re-estimated continuously and has therefore been brought up as a metric in both throughput and output. The importance of market-related metrics is one of the areas most heavily stressed in theory (See chapter 3.3). Through this structuring of the metrics, we can see that mainly output metrics are to be found in theory, although the few mentioned in input and throughput above are just as important although few. Note that the output-balance metric “share of wealth” is by Muller explained as the change in the company’s market value during the past year divided by the change in the total indus-try’s market value during the same period.
84 One exception is the “balance of portfolio in terms of time” (previously mentioned under task related) as this is an estimation of the specific product features.
30
5 Empirical approaches to innovation metrics The past introduction to, and discussion of models for innovation metrics, resulted in a more exten-sive and thorough framework than has previous been suggested in theory. As this is a theoretical and in one way ideal approach to measuring innovation, the more practical realities of working with innovation, will therefore be sought answered in the following. By doing this, it will create the basis for further analysis, which will be done in chapter 6. This following chapter will introduce qualita-tive data in the form of general views and structural issues of innovation, followed by the quantita-tive data on metrics used by the companies. In the end of the chapter the focus will return to qualita-tive data in the form of the most important issues and challenges that the companies report facing when working with innovation metrics.
5.1 General attitudes
Out of the initial list of 34 companies, one single company decided not to join the study due to company policies not to participate in student researches. Finding the “right” people within the other contacted companies however proved generally difficult, as also discussed in chapter 2.1.2. In one company, it took two calls to the operator to finally be directed to a product developer for a specific type of products. This person in turn explained that
“We have no innovation terminology, and most probably no one in the
organization has a cross-company insight on this matter.” 85
The same person claimed that the only way to find out would be through the press responsible, who in turn had no idea, but were willing to find out and reply by email. This email was never received. In a second company, the search for a suitable person went through four different people and took 22 days, with a comment that
“I’ve worked on several projects called “innovative projects”, but I’ve never heard of
someone with a cross-company insight into innovation or innovation metrics…which
I can find strange since innovation has been a buzz-word with us for at least 10 years.” 86
In a third company, a person involved in R&D could provide part of the story, but referred to a sec-ond person with better overview of their innovations. This person was contacted and offered to help, but 15 days and two reminders later replied that he had talked to various relevant people in the organization, but that neither of them had any good answers;
“I wish I could help you, but we don’t have the definitions you are looking for.” 87
With some companies, contact with a suitable person was never attained. Five companies in addi-tion agreed to participate, but never followed through due to lack of time or inability to locate rele-vant people or information on the matter. Finally however, data from 26 companies was collected, companies who all but two demonstrated a great interest in understanding more about innovation metrics. One single out of the 26 companies required the signing of a confidentiality agreement, which shows a very high interest in contributing to transparency and better knowledge on this area.
85 Company 23, 14 April, Resp A 86 Company 5, 7 April, Resp A 87 Company 20, 2 April, Resp B
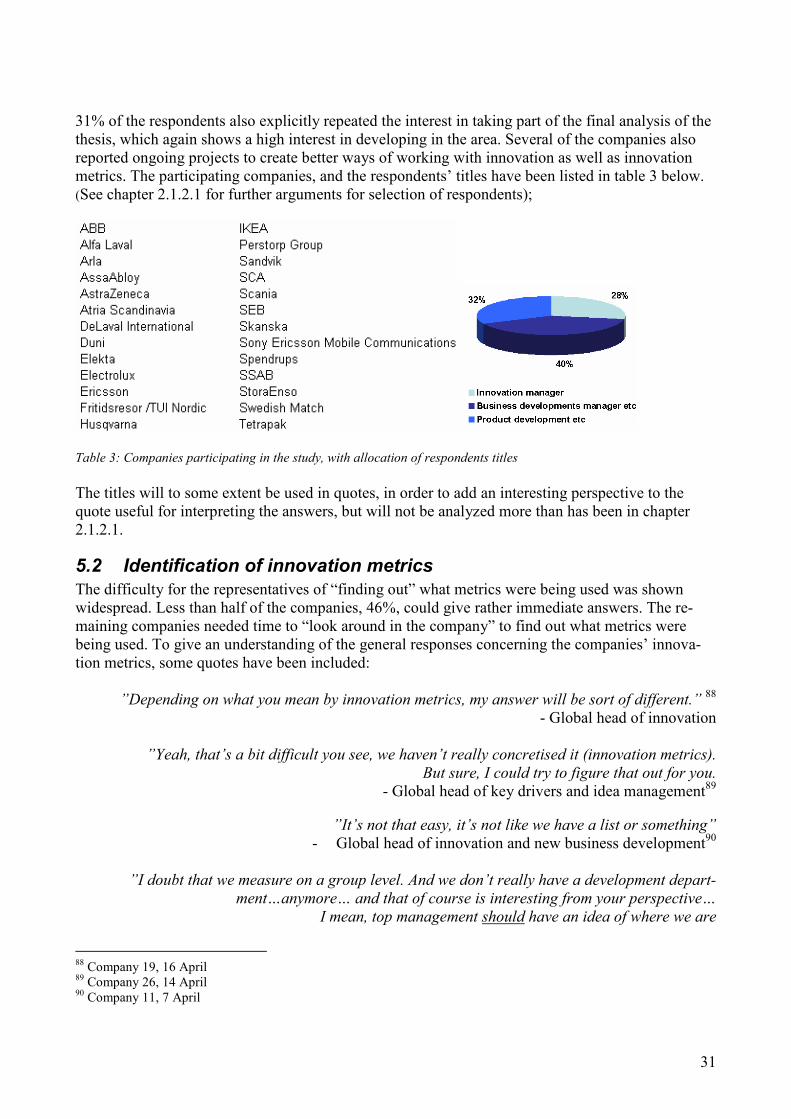
31
31% of the respondents also explicitly repeated the interest in taking part of the final analysis of the thesis, which again shows a high interest in developing in the area. Several of the companies also reported ongoing projects to create better ways of working with innovation as well as innovation metrics. The participating companies, and the respondents’ titles have been listed in table 3 below. (See chapter 2.1.2.1 for further arguments for selection of respondents);
Table 3: Companies participating in the study, with allocation of respondents titles
The titles will to some extent be used in quotes, in order to add an interesting perspective to the quote useful for interpreting the answers, but will not be analyzed more than has been in chapter 2.1.2.1.
5.2 Identification of innovation metrics
The difficulty for the representatives of “finding out” what metrics were being used was shown widespread. Less than half of the companies, 46%, could give rather immediate answers. The re-maining companies needed time to “look around in the company” to find out what metrics were being used. To give an understanding of the general responses concerning the companies’ innova-tion metrics, some quotes have been included:
”Depending on what you mean by innovation metrics, my answer will be sort of different.” 88 - Global head of innovation
”Yeah, that’s a bit difficult you see, we haven’t really concretised it (innovation metrics).
But sure, I could try to figure that out for you.
- Global head of key drivers and idea management89
”It’s not that easy, it’s not like we have a list or something”
- Global head of innovation and new business development90
”I doubt that we measure on a group level. And we don’t really have a development depart-
ment…anymore… and that of course is interesting from your perspective…
I mean, top management should have an idea of where we are
88 Company 19, 16 April 89 Company 26, 14 April 90 Company 11, 7 April
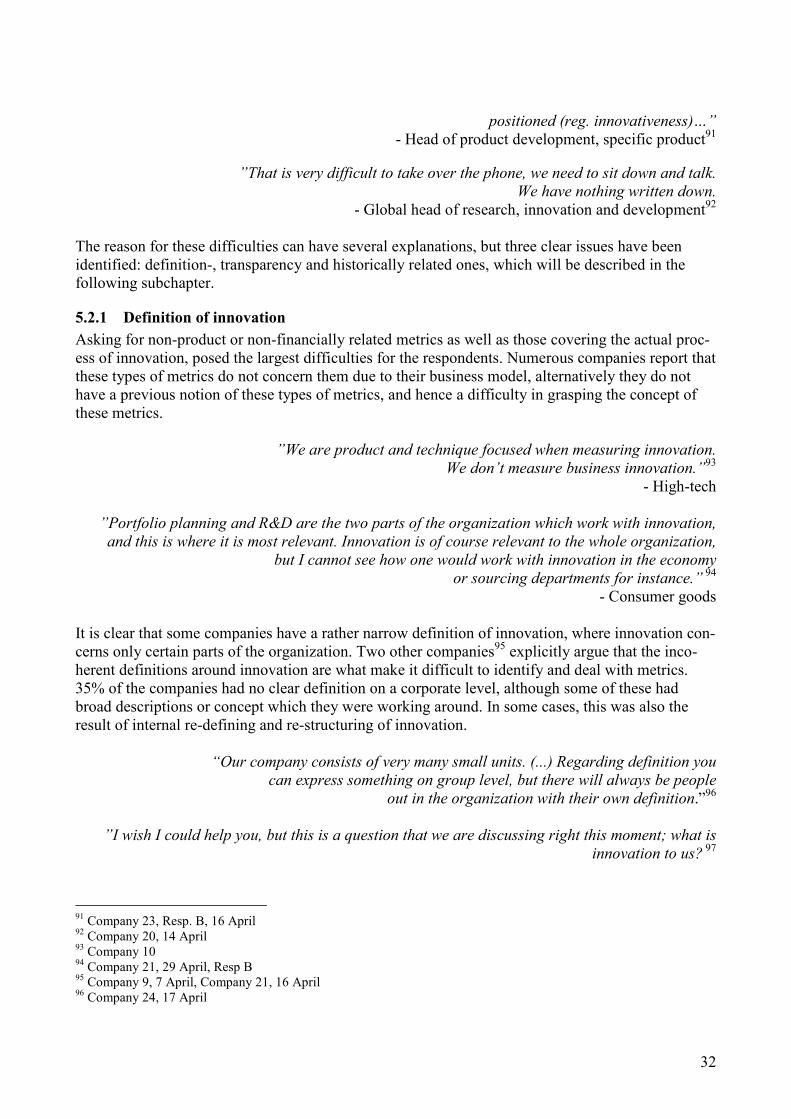
32
positioned (reg. innovativeness)…”
- Head of product development, specific product91
”That is very difficult to take over the phone, we need to sit down and talk.
We have nothing written down.
- Global head of research, innovation and development92
The reason for these difficulties can have several explanations, but three clear issues have been identified: definition-, transparency and historically related ones, which will be described in the following subchapter.
5.2.1 Definition of innovation
Asking for non-product or non-financially related metrics as well as those covering the actual proc-ess of innovation, posed the largest difficulties for the respondents. Numerous companies report that these types of metrics do not concern them due to their business model, alternatively they do not have a previous notion of these types of metrics, and hence a difficulty in grasping the concept of these metrics.
”We are product and technique focused when measuring innovation.
We don’t measure business innovation.”93
- High-tech
”Portfolio planning and R&D are the two parts of the organization which work with innovation,
and this is where it is most relevant. Innovation is of course relevant to the whole organization,
but I cannot see how one would work with innovation in the economy
or sourcing departments for instance.” 94
- Consumer goods It is clear that some companies have a rather narrow definition of innovation, where innovation con-cerns only certain parts of the organization. Two other companies95 explicitly argue that the inco-herent definitions around innovation are what make it difficult to identify and deal with metrics. 35% of the companies had no clear definition on a corporate level, although some of these had broad descriptions or concept which they were working around. In some cases, this was also the result of internal re-defining and re-structuring of innovation.
“Our company consists of very many small units. (...) Regarding definition you
can express something on group level, but there will always be people
out in the organization with their own definition.”96
”I wish I could help you, but this is a question that we are discussing right this moment; what is
innovation to us? 97
91 Company 23, Resp. B, 16 April 92 Company 20, 14 April 93 Company 10 94 Company 21, 29 April, Resp B 95 Company 9, 7 April, Company 21, 16 April 96 Company 24, 17 April
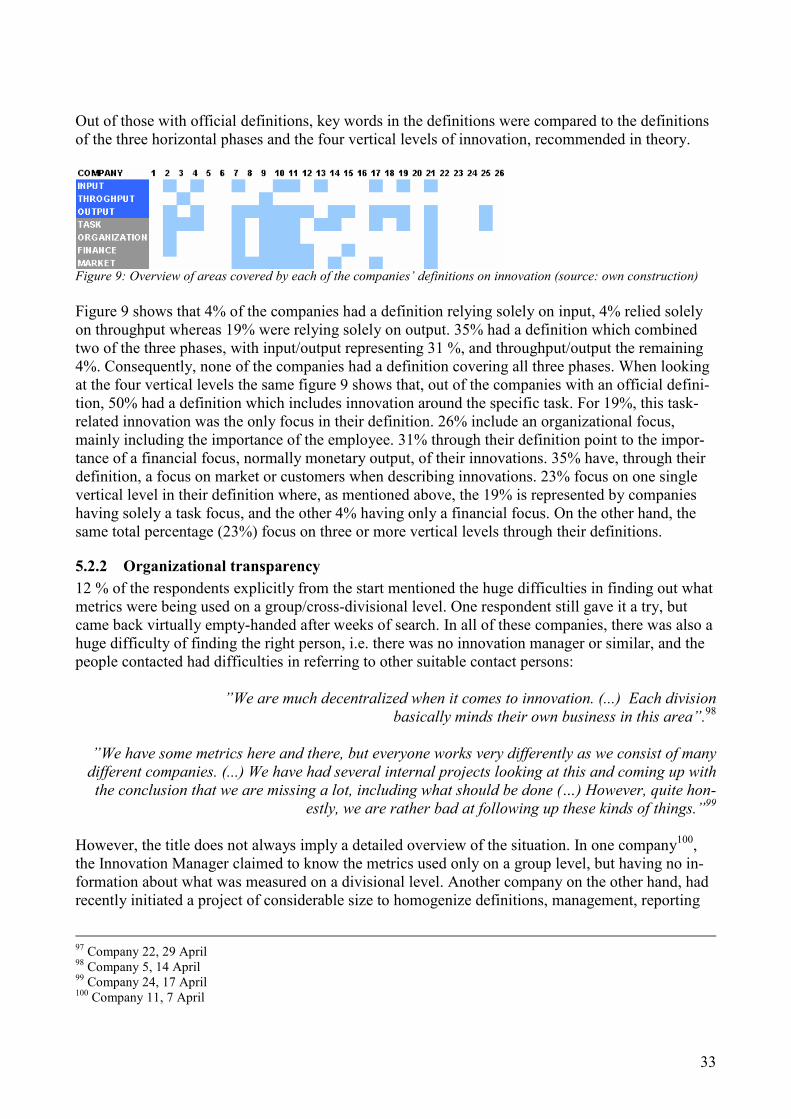
33
Out of those with official definitions, key words in the definitions were compared to the definitions of the three horizontal phases and the four vertical levels of innovation, recommended in theory.
Figure 9: Overview of areas covered by each of the companies’ definitions on innovation (source: own construction)
Figure 9 shows that 4% of the companies had a definition relying solely on input, 4% relied solely on throughput whereas 19% were relying solely on output. 35% had a definition which combined two of the three phases, with input/output representing 31 %, and throughput/output the remaining 4%. Consequently, none of the companies had a definition covering all three phases. When looking at the four vertical levels the same figure 9 shows that, out of the companies with an official defini-tion, 50% had a definition which includes innovation around the specific task. For 19%, this task-related innovation was the only focus in their definition. 26% include an organizational focus, mainly including the importance of the employee. 31% through their definition point to the impor-tance of a financial focus, normally monetary output, of their innovations. 35% have, through their definition, a focus on market or customers when describing innovations. 23% focus on one single vertical level in their definition where, as mentioned above, the 19% is represented by companies having solely a task focus, and the other 4% having only a financial focus. On the other hand, the same total percentage (23%) focus on three or more vertical levels through their definitions.
5.2.2 Organizational transparency
12 % of the respondents explicitly from the start mentioned the huge difficulties in finding out what metrics were being used on a group/cross-divisional level. One respondent still gave it a try, but came back virtually empty-handed after weeks of search. In all of these companies, there was also a huge difficulty of finding the right person, i.e. there was no innovation manager or similar, and the people contacted had difficulties in referring to other suitable contact persons:
”We are much decentralized when it comes to innovation. (...) Each division
basically minds their own business in this area”.98
”We have some metrics here and there, but everyone works very differently as we consist of many
different companies. (...) We have had several internal projects looking at this and coming up with
the conclusion that we are missing a lot, including what should be done (…) However, quite hon-
estly, we are rather bad at following up these kinds of things.”99
However, the title does not always imply a detailed overview of the situation. In one company100, the Innovation Manager claimed to know the metrics used only on a group level, but having no in-formation about what was measured on a divisional level. Another company on the other hand, had recently initiated a project of considerable size to homogenize definitions, management, reporting
97 Company 22, 29 April 98 Company 5, 14 April 99 Company 24, 17 April 100 Company 11, 7 April
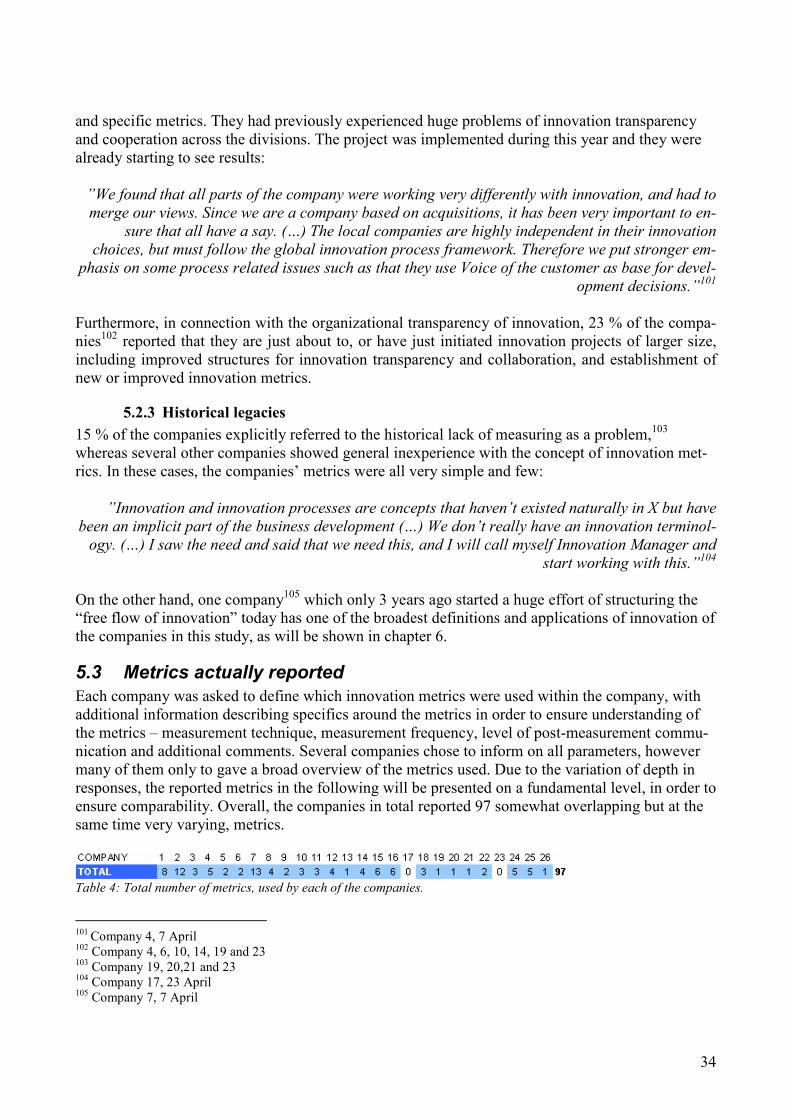
34
and specific metrics. They had previously experienced huge problems of innovation transparency and cooperation across the divisions. The project was implemented during this year and they were already starting to see results:
”We found that all parts of the company were working very differently with innovation, and had to
merge our views. Since we are a company based on acquisitions, it has been very important to en-
sure that all have a say. (…) The local companies are highly independent in their innovation
choices, but must follow the global innovation process framework. Therefore we put stronger em-
phasis on some process related issues such as that they use Voice of the customer as base for devel-
opment decisions.”101
Furthermore, in connection with the organizational transparency of innovation, 23 % of the compa-nies102 reported that they are just about to, or have just initiated innovation projects of larger size, including improved structures for innovation transparency and collaboration, and establishment of new or improved innovation metrics.
5.2.3 Historical legacies
15 % of the companies explicitly referred to the historical lack of measuring as a problem,103 whereas several other companies showed general inexperience with the concept of innovation met-rics. In these cases, the companies’ metrics were all very simple and few:
”Innovation and innovation processes are concepts that haven’t existed naturally in X but have
been an implicit part of the business development (…) We don’t really have an innovation terminol-
ogy. (…) I saw the need and said that we need this, and I will call myself Innovation Manager and
start working with this.”104
On the other hand, one company105 which only 3 years ago started a huge effort of structuring the “free flow of innovation” today has one of the broadest definitions and applications of innovation of the companies in this study, as will be shown in chapter 6.
5.3 Metrics actually reported
Each company was asked to define which innovation metrics were used within the company, with additional information describing specifics around the metrics in order to ensure understanding of the metrics – measurement technique, measurement frequency, level of post-measurement commu-nication and additional comments. Several companies chose to inform on all parameters, however many of them only to gave a broad overview of the metrics used. Due to the variation of depth in responses, the reported metrics in the following will be presented on a fundamental level, in order to ensure comparability. Overall, the companies in total reported 97 somewhat overlapping but at the same time very varying, metrics.
Table 4: Total number of metrics, used by each of the companies.
101 Company 4, 7 April 102 Company 4, 6, 10, 14, 19 and 23 103 Company 19, 20,21 and 23 104 Company 17, 23 April 105 Company 7, 7 April
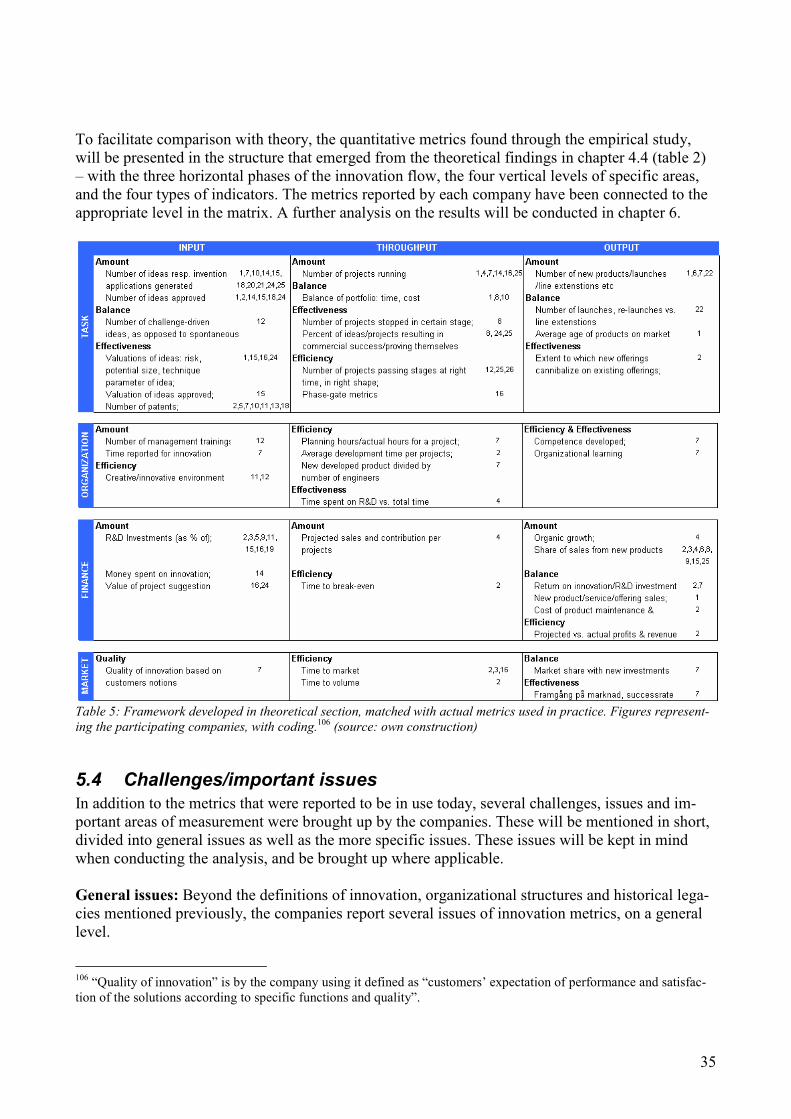
35
To facilitate comparison with theory, the quantitative metrics found through the empirical study, will be presented in the structure that emerged from the theoretical findings in chapter 4.4 (table 2) – with the three horizontal phases of the innovation flow, the four vertical levels of specific areas, and the four types of indicators. The metrics reported by each company have been connected to the appropriate level in the matrix. A further analysis on the results will be conducted in chapter 6.
Table 5: Framework developed in theoretical section, matched with actual metrics used in practice. Figures represent-
ing the participating companies, with coding.106
(source: own construction)
5.4 Challenges/important issues
In addition to the metrics that were reported to be in use today, several challenges, issues and im-portant areas of measurement were brought up by the companies. These will be mentioned in short, divided into general issues as well as the more specific issues. These issues will be kept in mind when conducting the analysis, and be brought up where applicable. General issues: Beyond the definitions of innovation, organizational structures and historical lega-cies mentioned previously, the companies report several issues of innovation metrics, on a general level.
106 “Quality of innovation” is by the company using it defined as “customers’ expectation of performance and satisfac-tion of the solutions according to specific functions and quality”.
36
A: The difficulty of finding relevant metrics.107 B: The general lack of standards to lean towards.108 C: Finding concrete, absolute metrics.109 D: Finding qualitative metrics.110 E: Two representatives stress the issue of too few, versus too many metrics.111 F: The same companies argue that the balance must be found by metrics that are easy to under-
stand.112 G: Metrics that the staff can actually influence.113 H: Metrics that are easily traceable.114 I: Another representative sees communication as both difficult and important, where another re-spondent adds the importance of communication through that is creates a buzz around innovation, and puts innovation on the map.115 J: Furthermore, one representative brings up the volatility of ”innovation focus” where resources are easier to set aside in good times, but at the same time the need for innovation is less. In more difficult times on the other hand, the surge and need for innovations are greater, however it is also more difficult to get resources in terms of both people and money.116 K: One company sees large challenges with even just describing the innovation process (”which probably differs from the product development process”) and measuring being even more diffi-cult.117 L: One company stresses the difficulties in measuring without focusing on results, as capability creation in reality is the most important.118 M: Several companies bring up the measurement of value creation as the biggest issue. : Another one stresses that the real added values of innovation are hard to really translate into money.”119 O: Two others mention specifically the difficulties with time perspectives in terms of output, with regards to long life cycles.120
Specific issues: Beyond these general issues for metrics, the companies report several specific con-cerns and/or suggestions: P: Two representatives claim a desire to create better metrics for patents; for instance number of new patents in new products or efficiency of patent portfolio.121 Q: Some companies stress the specific difficulties in measuring quality of ideas,122 R: Others would like a measurement better supporting the generation of more radical innova-
tions.123
107 Company 26, 8 April 108 Company 7, 2 April 109 Company 7, 2 April 110 Company 9, 7 April 111 Company 21, 29 April, Resp B 112 Company 21, 29 April, Resp B 113 Company 21, 29 April, Resp B 114 Company 21, 29 April, Resp B 115 Company 11, 29 April, Company 18, 24 April 116 Company 24, 17 April 117 Company 18, 24 April 118 Company 21, 29 April, Resp B 119 Company 12, 16 April 120 Company 26, 14 April, Company 4, 7 April 121 Company 10, 27 April, Resp B, Company 13, 7 April 122 Company 11, 29 April

37
S: One company stresses the interest in knowing how to separate large innovations from incre-
mental innovations, but still being able to measure both.124 T: Another company claims that it is the innovation efficiency which is the most important – what they actually manage to perform with their ideas.125 U: Two representatives wish they could measure “return on innovation” and brings up the early value estimations as the largest issue.126 V: Another company stresses the need for focusing more on learning and how experience is lever-aged.127 X: Several bring up organization related issues on a broader level. Issues such as better understand-
ing and monitoring of the culture, influencing factors, creativity and being able to translate it into
absolute value.128
123 Company 13, 14 April 124 Company 21, 29 April, Resp B 125 Company 11, 29 April 126 Company 3, 22 April, Company 15, 2 April 127 Company 4, 7 April 128 Company 1, 24 April, Company 18, 24 April, Company 12, 16 April
38
6 Analysis Given the theory analysis in chapter 4, this analysis will focus on the patterns that appear when merging theory with the empirics from chapter 5. The challenges and important tasks concerning innovation metrics will be integrated into the analysis, under the area in which it belongs to.
6.1 Ways of working
It is obvious that the majority of companies studied are struggling to find relevant and well-based innovation metrics. Even those that do have a rather broad selection of metrics, as well as generally well-structured ways of working with metrics, report the need for better metrics in order to gain management support and thereby allocate resources more efficiently.
6.1.1 Legacies, transparency, terminology, communication and responsibility
Historical legacies do seem to play a part in this, as many companies have a history of not knowing how to approach innovation metrics. On the other hand, the findings showed an example where a company had been able to build up a structure for innovation metrics in only a few years time, al-though the structure seemed rather rigid. Organizational transparency similarly posed difficulties for the companies, where large and highly decentralized companies made transparency and cross-cooperation around innovation and innovation metrics more difficult. On the other hand one exam-ple brought up where a company very recently took a strong grip on harmonizing the various parts of the company, but still taking the voices of the departments into consideration. Historical legacies can not be affected, and organizational transparency is neither easy to change nor rational to change only to attain a better overview of innovation. Are which were identified as challenging areas, but still should be alterable however, include the lack of innovation terminology,
clear innovation communication and people with an overview responsibility for innovation. Al-though these issues overlap, the lack of innovation terminology became clear in many companies due to the general difficulties in discussing innovation in broad terms, without falling into product development, patents and R&D. The lack of innovation communication is based on the huge efforts put into collecting the data from the various companies, as well as the huge efforts put in by some of the respondents, who sometimes also came back empty handed or with very limited and incom-plete information. The lack of people with an overview responsibility for innovation is based on the, in many companies, difficulty of finding the correct person to talk. An established and inclusive innovation terminology, a clear communication around innovation which thereby steers behaviour as requested, and a person with true responsibility and insight on an overview level (indeed, several people with “innovation manager” title or similar struggled to find the information) would allow for higher probability of value-added use of innovation metrics, whereas a lack in one of more of these areas indicates that the company does not have a clear base to build innovation upon, nonetheless useful metrics. A lack of this kind was identified in many of the companies, indicating that there is room for sig-
nificant improvement of basic fundamentals which can increase the probability of working suc-
cessfully with innovation.
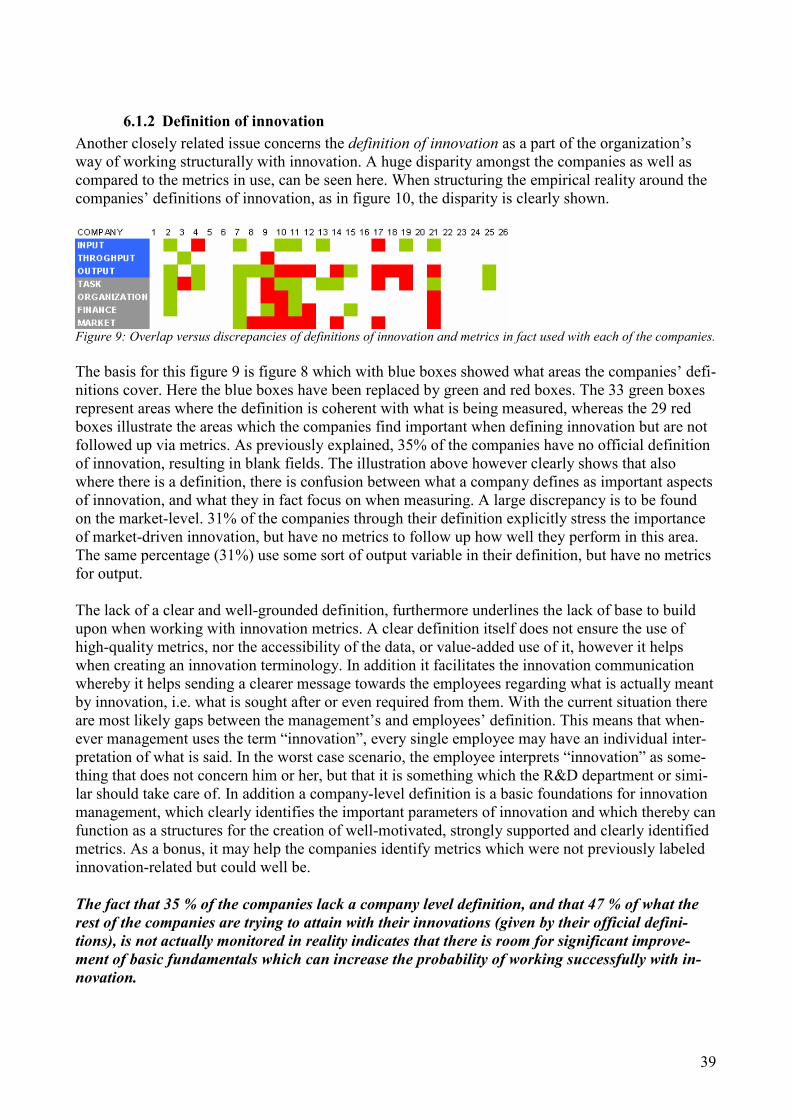
39
6.1.2 Definition of innovation
Another closely related issue concerns the definition of innovation as a part of the organization’s way of working structurally with innovation. A huge disparity amongst the companies as well as compared to the metrics in use, can be seen here. When structuring the empirical reality around the companies’ definitions of innovation, as in figure 10, the disparity is clearly shown.
Figure 9: Overlap versus discrepancies of definitions of innovation and metrics in fact used with each of the companies.
The basis for this figure 9 is figure 8 which with blue boxes showed what areas the companies’ defi-nitions cover. Here the blue boxes have been replaced by green and red boxes. The 33 green boxes represent areas where the definition is coherent with what is being measured, whereas the 29 red boxes illustrate the areas which the companies find important when defining innovation but are not followed up via metrics. As previously explained, 35% of the companies have no official definition of innovation, resulting in blank fields. The illustration above however clearly shows that also where there is a definition, there is confusion between what a company defines as important aspects of innovation, and what they in fact focus on when measuring. A large discrepancy is to be found on the market-level. 31% of the companies through their definition explicitly stress the importance of market-driven innovation, but have no metrics to follow up how well they perform in this area. The same percentage (31%) use some sort of output variable in their definition, but have no metrics for output. The lack of a clear and well-grounded definition, furthermore underlines the lack of base to build upon when working with innovation metrics. A clear definition itself does not ensure the use of high-quality metrics, nor the accessibility of the data, or value-added use of it, however it helps when creating an innovation terminology. In addition it facilitates the innovation communication whereby it helps sending a clearer message towards the employees regarding what is actually meant by innovation, i.e. what is sought after or even required from them. With the current situation there are most likely gaps between the management’s and employees’ definition. This means that when-ever management uses the term “innovation”, every single employee may have an individual inter-pretation of what is said. In the worst case scenario, the employee interprets “innovation” as some-thing that does not concern him or her, but that it is something which the R&D department or simi-lar should take care of. In addition a company-level definition is a basic foundations for innovation management, which clearly identifies the important parameters of innovation and which thereby can function as a structures for the creation of well-motivated, strongly supported and clearly identified metrics. As a bonus, it may help the companies identify metrics which were not previously labeled innovation-related but could well be.
The fact that 35 % of the companies lack a company level definition, and that 47 % of what the
rest of the companies are trying to attain with their innovations (given by their official defini-
tions), is not actually monitored in reality indicates that there is room for significant improve-
ment of basic fundamentals which can increase the probability of working successfully with in-
novation.
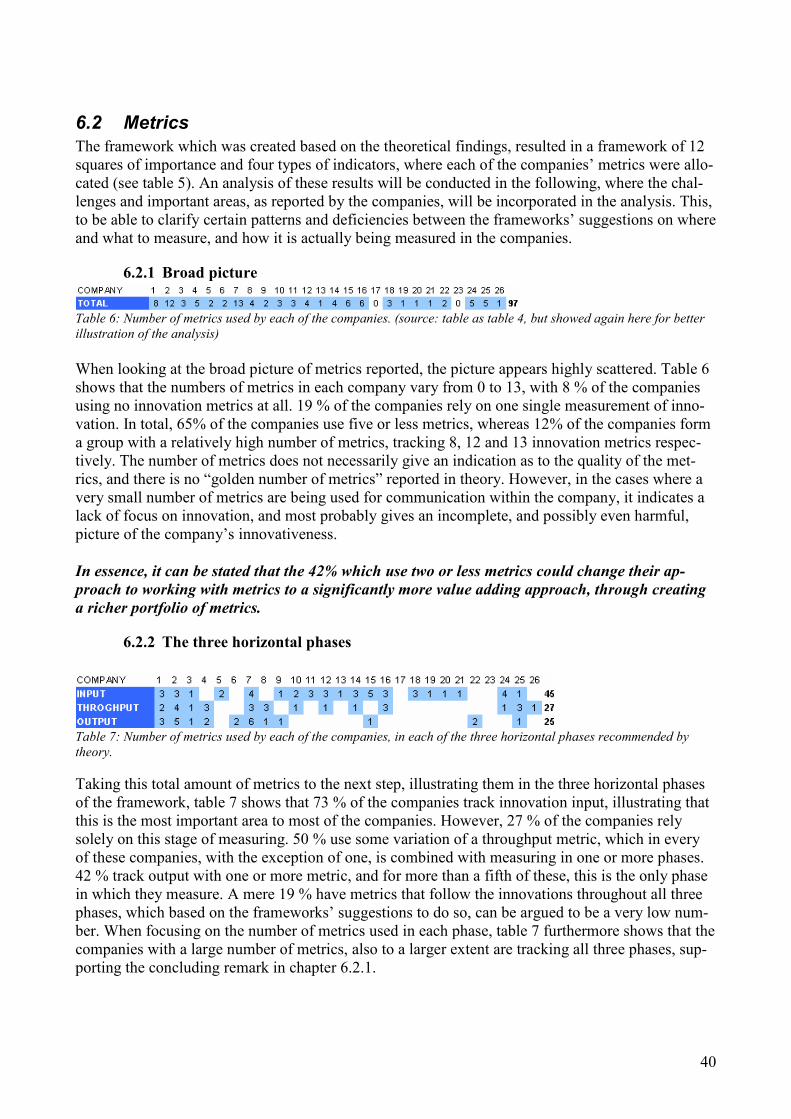
40
6.2 Metrics
The framework which was created based on the theoretical findings, resulted in a framework of 12 squares of importance and four types of indicators, where each of the companies’ metrics were allo-cated (see table 5). An analysis of these results will be conducted in the following, where the chal-lenges and important areas, as reported by the companies, will be incorporated in the analysis. This, to be able to clarify certain patterns and deficiencies between the frameworks’ suggestions on where and what to measure, and how it is actually being measured in the companies.
6.2.1 Broad picture
Table 6: ;umber of metrics used by each of the companies. (source: table as table 4, but showed again here for better
illustration of the analysis)
When looking at the broad picture of metrics reported, the picture appears highly scattered. Table 6 shows that the numbers of metrics in each company vary from 0 to 13, with 8 % of the companies using no innovation metrics at all. 19 % of the companies rely on one single measurement of inno-vation. In total, 65% of the companies use five or less metrics, whereas 12% of the companies form a group with a relatively high number of metrics, tracking 8, 12 and 13 innovation metrics respec-tively. The number of metrics does not necessarily give an indication as to the quality of the met-rics, and there is no “golden number of metrics” reported in theory. However, in the cases where a very small number of metrics are being used for communication within the company, it indicates a lack of focus on innovation, and most probably gives an incomplete, and possibly even harmful, picture of the company’s innovativeness. In essence, it can be stated that the 42% which use two or less metrics could change their ap-
proach to working with metrics to a significantly more value adding approach, through creating
a richer portfolio of metrics.
6.2.2 The three horizontal phases
Table 7: ;umber of metrics used by each of the companies, in each of the three horizontal phases recommended by
theory.
Taking this total amount of metrics to the next step, illustrating them in the three horizontal phases of the framework, table 7 shows that 73 % of the companies track innovation input, illustrating that this is the most important area to most of the companies. However, 27 % of the companies rely solely on this stage of measuring. 50 % use some variation of a throughput metric, which in every of these companies, with the exception of one, is combined with measuring in one or more phases. 42 % track output with one or more metric, and for more than a fifth of these, this is the only phase in which they measure. A mere 19 % have metrics that follow the innovations throughout all three phases, which based on the frameworks’ suggestions to do so, can be argued to be a very low num-ber. When focusing on the number of metrics used in each phase, table 7 furthermore shows that the companies with a large number of metrics, also to a larger extent are tracking all three phases, sup-porting the concluding remark in chapter 6.2.1.
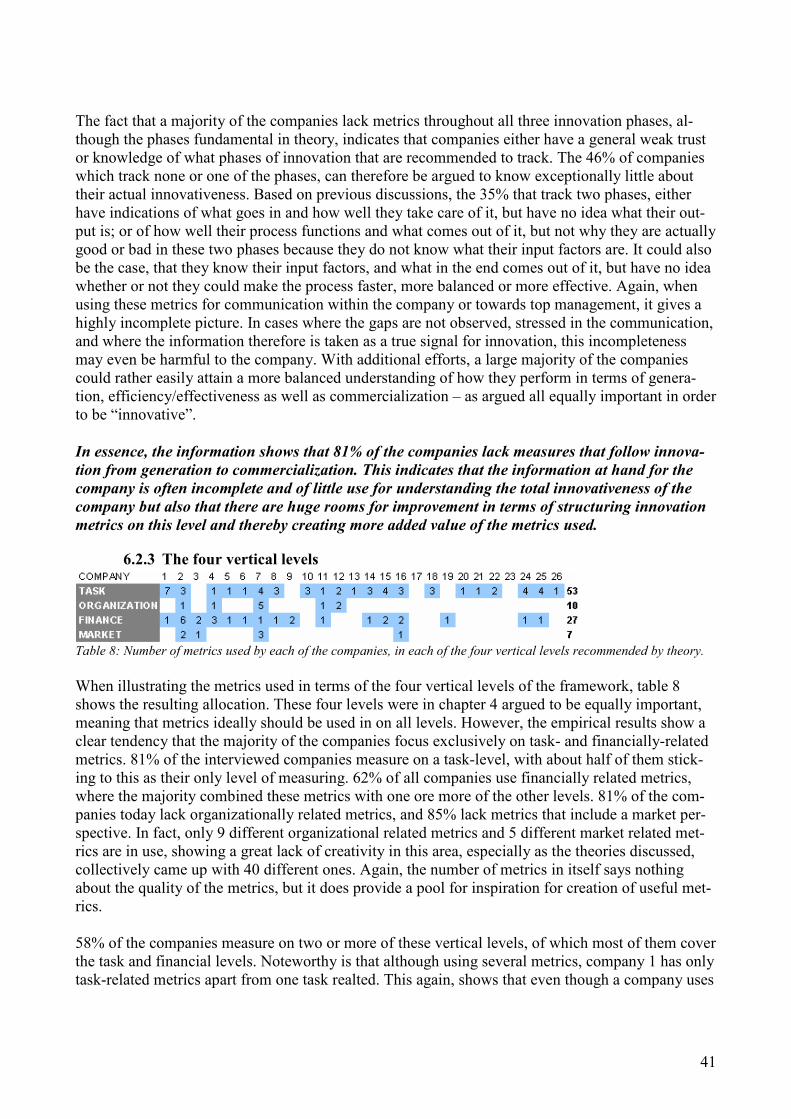
41
The fact that a majority of the companies lack metrics throughout all three innovation phases, al-though the phases fundamental in theory, indicates that companies either have a general weak trust or knowledge of what phases of innovation that are recommended to track. The 46% of companies which track none or one of the phases, can therefore be argued to know exceptionally little about their actual innovativeness. Based on previous discussions, the 35% that track two phases, either have indications of what goes in and how well they take care of it, but have no idea what their out-put is; or of how well their process functions and what comes out of it, but not why they are actually good or bad in these two phases because they do not know what their input factors are. It could also be the case, that they know their input factors, and what in the end comes out of it, but have no idea whether or not they could make the process faster, more balanced or more effective. Again, when using these metrics for communication within the company or towards top management, it gives a highly incomplete picture. In cases where the gaps are not observed, stressed in the communication, and where the information therefore is taken as a true signal for innovation, this incompleteness may even be harmful to the company. With additional efforts, a large majority of the companies could rather easily attain a more balanced understanding of how they perform in terms of genera-tion, efficiency/effectiveness as well as commercialization – as argued all equally important in order to be “innovative”. In essence, the information shows that 81% of the companies lack measures that follow innova-
tion from generation to commercialization. This indicates that the information at hand for the
company is often incomplete and of little use for understanding the total innovativeness of the
company but also that there are huge rooms for improvement in terms of structuring innovation
metrics on this level and thereby creating more added value of the metrics used.
6.2.3 The four vertical levels
Table 8: ;umber of metrics used by each of the companies, in each of the four vertical levels recommended by theory.
When illustrating the metrics used in terms of the four vertical levels of the framework, table 8 shows the resulting allocation. These four levels were in chapter 4 argued to be equally important, meaning that metrics ideally should be used in on all levels. However, the empirical results show a clear tendency that the majority of the companies focus exclusively on task- and financially-related metrics. 81% of the interviewed companies measure on a task-level, with about half of them stick-ing to this as their only level of measuring. 62% of all companies use financially related metrics, where the majority combined these metrics with one ore more of the other levels. 81% of the com-panies today lack organizationally related metrics, and 85% lack metrics that include a market per-spective. In fact, only 9 different organizational related metrics and 5 different market related met-rics are in use, showing a great lack of creativity in this area, especially as the theories discussed, collectively came up with 40 different ones. Again, the number of metrics in itself says nothing about the quality of the metrics, but it does provide a pool for inspiration for creation of useful met-rics. 58% of the companies measure on two or more of these vertical levels, of which most of them cover the task and financial levels. Noteworthy is that although using several metrics, company 1 has only task-related metrics apart from one task realted. This again, shows that even though a company uses
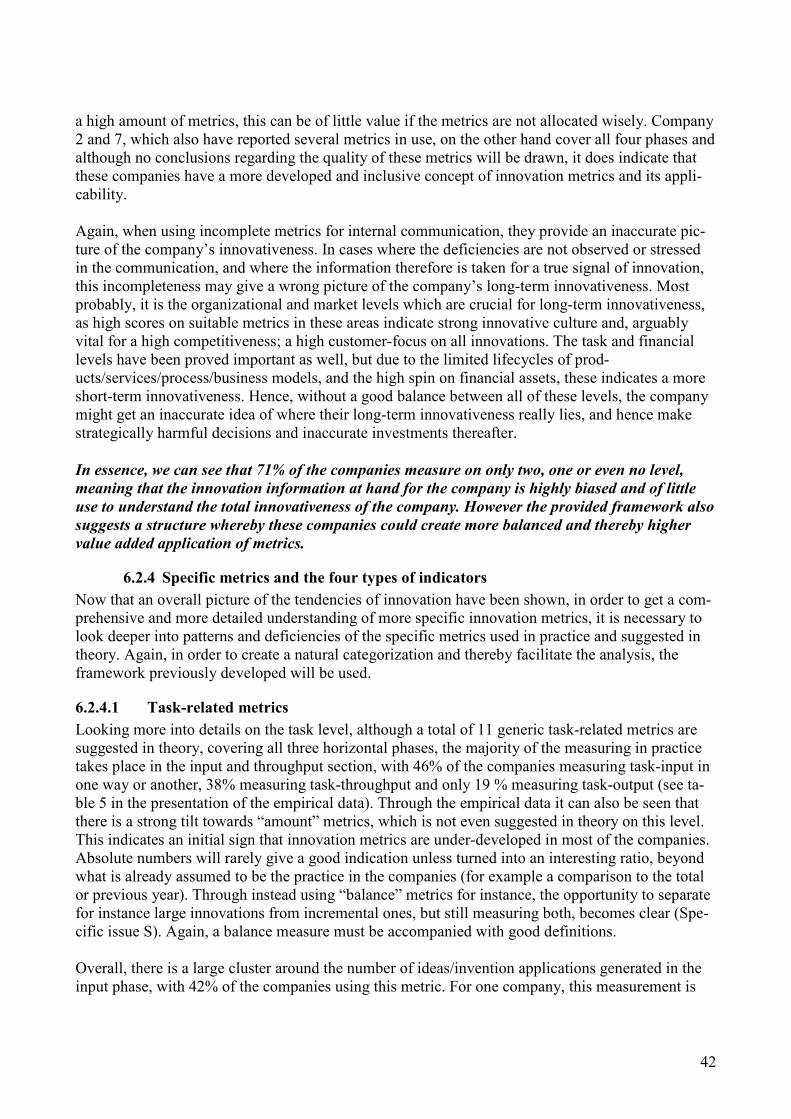
42
a high amount of metrics, this can be of little value if the metrics are not allocated wisely. Company 2 and 7, which also have reported several metrics in use, on the other hand cover all four phases and although no conclusions regarding the quality of these metrics will be drawn, it does indicate that these companies have a more developed and inclusive concept of innovation metrics and its appli-cability. Again, when using incomplete metrics for internal communication, they provide an inaccurate pic-ture of the company’s innovativeness. In cases where the deficiencies are not observed or stressed in the communication, and where the information therefore is taken for a true signal of innovation, this incompleteness may give a wrong picture of the company’s long-term innovativeness. Most probably, it is the organizational and market levels which are crucial for long-term innovativeness, as high scores on suitable metrics in these areas indicate strong innovative culture and, arguably vital for a high competitiveness; a high customer-focus on all innovations. The task and financial levels have been proved important as well, but due to the limited lifecycles of prod-ucts/services/process/business models, and the high spin on financial assets, these indicates a more short-term innovativeness. Hence, without a good balance between all of these levels, the company might get an inaccurate idea of where their long-term innovativeness really lies, and hence make strategically harmful decisions and inaccurate investments thereafter. In essence, we can see that 71% of the companies measure on only two, one or even no level,
meaning that the innovation information at hand for the company is highly biased and of little
use to understand the total innovativeness of the company. However the provided framework also
suggests a structure whereby these companies could create more balanced and thereby higher
value added application of metrics.
6.2.4 Specific metrics and the four types of indicators
Now that an overall picture of the tendencies of innovation have been shown, in order to get a com-prehensive and more detailed understanding of more specific innovation metrics, it is necessary to look deeper into patterns and deficiencies of the specific metrics used in practice and suggested in theory. Again, in order to create a natural categorization and thereby facilitate the analysis, the framework previously developed will be used.
6.2.4.1 Task-related metrics
Looking more into details on the task level, although a total of 11 generic task-related metrics are suggested in theory, covering all three horizontal phases, the majority of the measuring in practice takes place in the input and throughput section, with 46% of the companies measuring task-input in one way or another, 38% measuring task-throughput and only 19 % measuring task-output (see ta-ble 5 in the presentation of the empirical data). Through the empirical data it can also be seen that there is a strong tilt towards “amount” metrics, which is not even suggested in theory on this level. This indicates an initial sign that innovation metrics are under-developed in most of the companies. Absolute numbers will rarely give a good indication unless turned into an interesting ratio, beyond what is already assumed to be the practice in the companies (for example a comparison to the total or previous year). Through instead using “balance” metrics for instance, the opportunity to separate for instance large innovations from incremental ones, but still measuring both, becomes clear (Spe-cific issue S). Again, a balance measure must be accompanied with good definitions. Overall, there is a large cluster around the number of ideas/invention applications generated in the input phase, with 42% of the companies using this metric. For one company, this measurement is
43
their one and only innovation measure. Only about one third of the companies using this metric, however make a valuation of the initial ideas. These same companies also take information further by tracking the number of approved ideas. In addition, one company tracks only “ideas approved”, without measuring “ideas generated”, hereby loosing an important comparison figure. As brought up in chapter 5.4, several companies stress the specific difficulties in measuring the quality of ideas (Specific issue Q). However, one can make a rather simple judgment of quality of ideas, through a straightforward comparison between number of ideas generated and ideas approved. This is obvi-ously not taken advantage of in practice. By using effectiveness metrics on the throughput side, it can also quite easily become clear whether or not the ideas selected are succeeding, which functions as a guideline for whether or not good ideas are chosen. Another company would like a measurement which better supports the generation of more radical innovations (Specific issue R). On this note, theory rather heavily argues for balance metrics in general, and for task-input suggests measuring (and thereby stressing the importance of) balance of different types of ideas - also measured rather simply given clear definitions. Through a balance measure of this type, accompanied with clear definitions, the difference between different types of innovations is not only measured but also stressed and visible. Another company in practice meas-ured only the number of ideas with a particular character only, again missing the opportunity to create an interesting balance-metric instead. 27% of the companies track patents. Almost a third of these use this patent metric as one out of a portfolio of maximum three metrics. It is true that for some industries and companies, tracking pat-ents might make sense. However, following the general characteristics of an innovation in chapter 3.1, the patent lacks a commercialization component in that it does not indicate the actual success of the patent, and therefore cannot be seen as a successful output. If anything, patent compared to number of initial ideas give an indication of the general qualities of ideas, potentially useful for pat-ent-oriented companies. But only one company using patent as a metric makes this comparison. A patent metric could also be complemented with a measurement for “number of patents that are a success on the market” or “% of sales from patents….”, which is not used by any of the companies. On the other hand, these kinds of metrics create separate measurements for patents, rather than for innovation on the whole, and still needs to be complemented on the other areas. In addition, patent is a highly non-generic metric, and as the aim of this thesis is to find a pattern of generic metrics that could be used cross-industrially, this metric, although used by 27% of the respondents, must be judged as of little use in the bigger picture. For the two companies that mention patent metrics as something they want to continue to refine (Specific issue P); Combining the fact that this was their only real area of concern mentioned with the above analysis of innovation definition and vertical levels covered by metric, it can be concluded that these two companies would need a more inclusive and non-primarily-product oriented view on innovation. However, looking on the whole, these are not the only companies who would benefit from this. Regarding task-throughput, it was mentioned that 38% had a metric in this area, however 20% of these fail to actually make a judgment of this throughput in terms of quality, balance, effectiveness or efficiency, meaning that they miss to create a value-based metric. One of the companies stress that task related innovation efficiency is what is most important to measure, meaning what they actually manage to perform with their ideas (Specific Issue T). This is a typical problem which could be solved with throughput measures, which the company currently does not use. Both theory and practise here suggests several metrics.
44
Concerning task-output, a surprising 85% lack a simple innovation metric concerning the number of new products/services/processes introduced. Of the companies that do use this metric, 50% neglect the importance of making some sort of valuation of this output, in terms of cannibalization, age, balance etc.
In summing up; on a task-related level, several generic and useful metrics have been suggested
in theory. However the companies cluster around number of ideas generated and patents at-
tained. In addition, 85% of companies lack an output metric related to the number of new inno-
vations that are being commercialized. It was also shown that some of the areas considered as the
most important issues for the companies, can be solved rather simply by applying theoretically
suggested metrics, or theoretically suggested removals of metrics.
6.2.4.2 Organizational level
When analyzing the organizational metrics, first of all the theory have several suggestions. Among these are suggestions in terms of employee, management/strategy and structure related metrics as well as ones which indicate “amount”, “balance”, “quality”, “efficiency” as well as “effectiveness” plenty, at least concerning input and throughput. However, the results of the practical application shows a clear lack of both specific metrics as well as measurement throughout the innovation phases. 12% of all companies measure input in terms of training, time or environment, 12% meas-ure throughput in terms of time mainly and 4 % make an attempt to estimate organizational learning and competence developed. One company specifically stresses the need to focus more on learning and how experience is leveraged (Specific issue V), where this latter figure shows that at least one company is doing just that at the moment (although mainly through surveys). There are also some theoretical suggestions for how to go about it, where primarily the post-project review is an indica-tor of organizational learning and leveraging. One single company, measures the organizational level in all three horizontal phases with several measures in each phase, whilst the rest of the companies measure in only one of the two first phases, input or throughput. The implications of the immense lack on this level can be that the ac-tual “resources” or innovations in terms of the people, management and structures which will create the ideas, is not at all tracked and followed up by the majority the companies. The few companies that do track, but in only either of the three phases, will based on the discussions on allocating the metrics; i) Either track the basic innovative environment of the company, or the investments made into creating it, but not how this “initial innovativeness” is taken advantage of or what output they actually get from it or; ii) Alternatively measure how good they are at transforming innovativeness into value, throughput, but neither what has gone into the system in terms of investments or inher-ent capabilities of the employees etc, or what actual output they get from it. All in all, neither of it provides sufficient information to make investments on this organizational level.
Numerous of the companies bring up the difficulties of better understanding and monitoring the culture, influencing factors, creativity and being able to translate it into absolute value (Specific issue X). The use of well-grounded metrics in all phases on the organizational level has been argued to help in getting a better understanding, in combination with the other three levels of metrics, as value should concern output on all four vertical levels. In summing up; on an organizationally related level, the abundance of generic metrics suggested
in theory is evident. However 81% of the companies lack metrics on this level, although one
company covers all phases. It has also been shown that some issues considered as most important
45
for the companies, can be solved rather easily by adding organizationally related metric through-
out the three horizontal phases, and using theoretical inspiration particularly concerning the
final phase.
6.2.4.3 Financial level
Remarkably, 38% of all the companies lack financial metrics for innovation, whilst one company in fact has as many as six different ones for this level. By the nature of the financial level, “amount” metrics are used in both theory and practice. However, for instance theory again suggests the inclu-sion of “balance” measures to ensure a stable and long-term portfolio of projects. One single com-pany uses a balance metric, and this is first in the finance-output square. Neither effectiveness nor efficiency is very well monitored in practise. Although R&D in theory has been discussed as a rather unfitted measurement for innovation, it can in addition be seen that 31% use R&D investments as a metric for innovation, normally in relation to revenues or similar. For more than a third of the companies with R&D metrics, this is one metric out of a total portfolio of maximum three metrics. This gives a picture of a strong lack of more “creative measures” and further support that companies tend to measure what is easy to measure. R&D does give some indication as to how much the company is focusing on the financial area, but as discussed in theory, the metric can be replaced by better metrics which target what you are actu-ally trying to monitor. In addition, R&D is not very generic, as it is mainly applicable to manufac-turing industries. Therefore it would be better fitting, from an innovation perspective, to use a met-ric such as “investments in innovation activities and efforts” instead, as suggested by theory. Al-though this requires clear definitions of innovation activities and efforts, these figures lie some-where in the financial statements. This type of metrics is used by one company, which however does neither track these investments throughout the throughput nor the output. Again, an insight of the like, which however is not completely followed through, has been seen several times. This situa-tion may have a number of explanations; however it does again clearly support the case for the need of a basic structure for innovation metrics. Two single companies track financial throughput through “time to breakeven”, the actual efficiency of the money invested. In the eyes of the investors, this is a highly surprising figure. Most compa-nies would follow average costs/sales/profits of projects; however, no company reports this as a metrics being used to track the path of the investments made in innovation. In addition there are a number of potentially useful metrics provided in theory. Quite remarkably, only 27% track the “sales from new products” as a measure of innovation output. This would again be a measure that most companies track, and therefore not difficult to communicate as a metric of innovation. Of the balance and efficiency metrics in the empirical data, all but one belong to the company with six different metrics, showing a great need but also prospect for improvement in this area. In fact there are also two companies, including this one, which already measure “return on innovation”, in finan-cial terms, something discussed as a difficulty by two companies (Specific issue U). In summing up: on a financially related level, a number of generic metrics are again suggested
in theory. Still, 38% of the companies lack metrics on this level, although one company has as
many as six metrics. The reality of this company, in addition with the suggestions from theory,
suggests that these 38% could measure financial related innovation in a more value added way.
It has also been shown that one specific issue reported by two companies, is already solved by one
company.
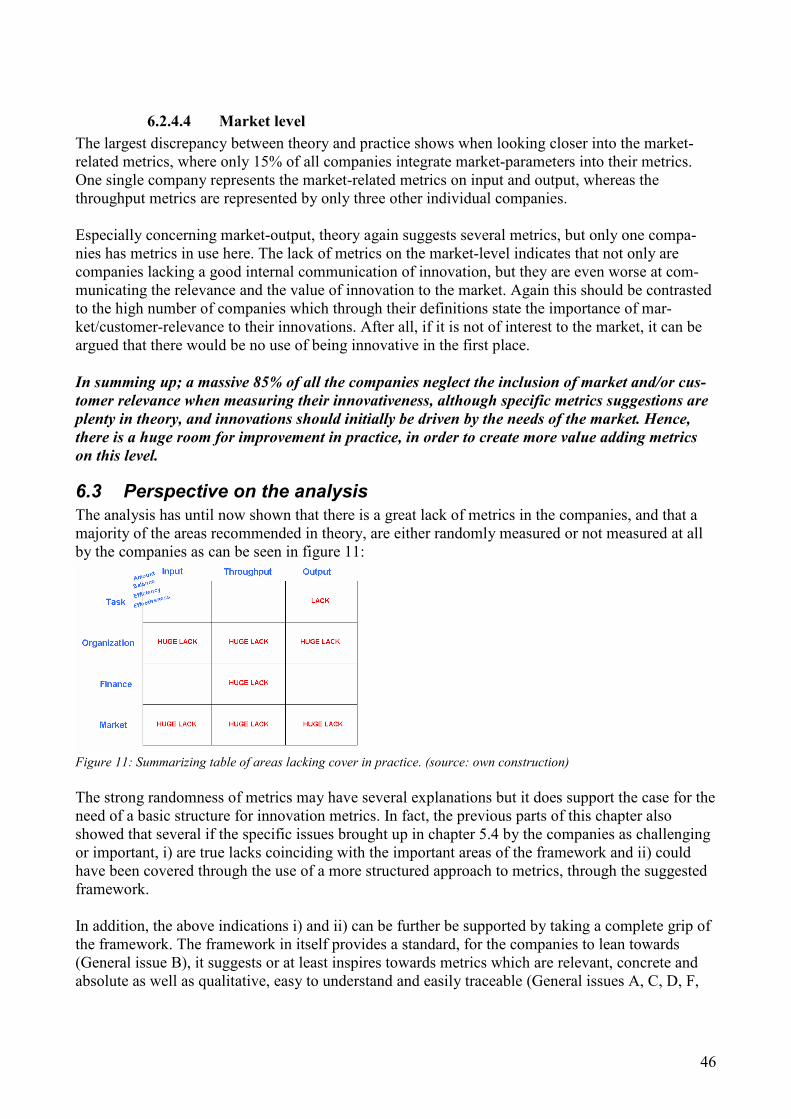
46
6.2.4.4 Market level
The largest discrepancy between theory and practice shows when looking closer into the market-related metrics, where only 15% of all companies integrate market-parameters into their metrics. One single company represents the market-related metrics on input and output, whereas the throughput metrics are represented by only three other individual companies.
Especially concerning market-output, theory again suggests several metrics, but only one compa-nies has metrics in use here. The lack of metrics on the market-level indicates that not only are companies lacking a good internal communication of innovation, but they are even worse at com-municating the relevance and the value of innovation to the market. Again this should be contrasted to the high number of companies which through their definitions state the importance of mar-ket/customer-relevance to their innovations. After all, if it is not of interest to the market, it can be argued that there would be no use of being innovative in the first place. In summing up; a massive 85% of all the companies neglect the inclusion of market and/or cus-
tomer relevance when measuring their innovativeness, although specific metrics suggestions are
plenty in theory, and innovations should initially be driven by the needs of the market. Hence,
there is a huge room for improvement in practice, in order to create more value adding metrics
on this level.
6.3 Perspective on the analysis
The analysis has until now shown that there is a great lack of metrics in the companies, and that a majority of the areas recommended in theory, are either randomly measured or not measured at all by the companies as can be seen in figure 11:
Figure 11: Summarizing table of areas lacking cover in practice. (source: own construction)
The strong randomness of metrics may have several explanations but it does support the case for the need of a basic structure for innovation metrics. In fact, the previous parts of this chapter also showed that several if the specific issues brought up in chapter 5.4 by the companies as challenging or important, i) are true lacks coinciding with the important areas of the framework and ii) could have been covered through the use of a more structured approach to metrics, through the suggested framework. In addition, the above indications i) and ii) can be further be supported by taking a complete grip of the framework. The framework in itself provides a standard, for the companies to lean towards (General issue B), it suggests or at least inspires towards metrics which are relevant, concrete and absolute as well as qualitative, easy to understand and easily traceable (General issues A, C, D, F,
47
H). The balance of different areas provided by the framework, ensure a focus not only on returns, but also capabilities (General issue L). In addition it, through the measuring of four different types of output, creates a more holistic way of measuring value of the innovations, with values that can be seen both long-term and short-term (General issue M, N, O). The framework also provides aggrega-tion versus drilling opportunities, meaning that the chosen portfolio of metrics can consists of dif-ferent number of metrics, to be used on different levels of the organization. The framework is also only a framework, suggesting a balance from where the company can pick the amount of metrics it finds suitable (General issue E). The levels of task, organization and market are generally easily influenced by the staff (General issue G). Using a structure like the one the framework provides, in addition to improving on the areas suggested in chapter 6.1 strongly facilitates the communication of innovation, and the innovation process, as it makes the matter more tangible (General issue I, K). In addition, this way of creating more tangible touch points for innovation in addition most proba-bly would also help reducing the general volatility in innovation focus, as there are specific num-bers and areas to point towards, as well as specific accomplishments and performances (General issue J). Hence we can see that the framework, based on theory but provoked by practise (as described in chapter 2.1.2.3) does include the areas considered most important by the companies.
48
7 Conclusion The aim of this thesis was to investigate how innovation metrics can be used to strengthen the com-petitiveness of a company. The motivation behind, came from the common notion of “innovation” as a highly non-tacit area of today’s businesses, combined with the fact that companies are ever more affected by globalization which creates a need for continuous renewal and innovative think-ing. Innovation metrics here shows up as a means by which this non-tacit area could be made more tacit, and potentially be a useful way for improving competitiveness. To answer the main problem of the thesis, the research commenced with a study of literature con-cerning innovation and the metrics suggested in theory. After a thorough research on the subject, the result was a great lack of academically suggested structures for innovation metrics. Four rather holistic, non-industry specific and recent models were however found. All models had somewhat different focuses, but coherence in some areas was found after studying them further. Three general phases of innovation were identified; input, throughput and output, which all could be combined with specific theoretical suggestions for metrics. The literature research was conducted parallel to gathering empirical data from 26 large-sized Swedish multinationals on their ways of working with innovation. This resulted in an understanding that further crystallization of the three phases would add considerable value to the practical application of innovation metrics. Therefore, further patterns in theory were sought, where four vertical levels of innovation: task, organizational, financial and
market related were identified, which better structured the specific theoretical suggestions for using metrics. Through a further understanding of the empirical reality through continuous interviews, it also became clear that very few of the metrics used in reality were in fact suitable for steering be-havior, which is a main argument for using innovation metrics. Through a further analysis of theory, four types of indicators: amount, balance, efficiency and effectiveness were therefore identified, discussed, and incorporated in the framework. The work resulted in a matrix consisting of 12 win-dows, each linked with theoretical suggestions to specific ways of measuring. The matrix could thereby be used as the basis for analyzing the empirical data, and give a picture of the corporate reality of innovation metrics. During the interviewing of the 26 companies, general attitudes to-wards innovation metrics as well as challenges and important issues, were furthermore collected. This, together with specific metrics used in reality, resulted in a number of interesting findings in the analysis. Firstly, a generally positive attitude towards innovation was stated. But even though most compa-nies expressed willingness to increase their knowledge and development of this area, several obsta-cles within their companies were identified. The difficulty of finding people with an overview of innovation matters, the difficulties for these people in turn to locate the data and the general lack of an innovation terminology indicated a lack for some very basic fundamentals for working with in-novation management, nonetheless innovation metrics. Secondly, to be able to improve on something, a clear definition of what you want to improve is needed. It turned out that many of the companies did not have a clear corporate definition of inno-vation although applying different types of innovation metrics in the organization, or used a defini-tion which had very little coherence with the metrics actually used. The clear structures and defini-tions for important areas, contrasted with the situation apparent in practice gives a rather obvious conclusion around fundaments. Where there is a lack of a clear definition which all parts of the or-ganization can understand and which is communicated effectively throughout the company, it is
49
very difficult to create innovation metrics to steer the behavior of the employees. In addition, it shows even more difficult to create strategic decisions as the company does not have a common visual picture of what innovation is to them. In terms of innovation metrics, the lack of a visual pic-ture similarly leaves it virtually impossible to create metrics which will reflect the needs and priori-tizations of the company. To a large extent, the companies with a definition, did not reinforce it with actual action on innovation, i.e. use coherent metrics, which gives the definition limited credi-bility and applicability. Thirdly, building on the argument of a need for a solid ground to build innovation metrics upon, extensive difficulties of choosing what metrics to use was both reported and identified. Concerning specific metrics, the companies generally clustered around metrics which in theory were described as highly ineffective and practically useless. 81% of the companies lacked measures that followed the innovativeness from generation to commercialization, and 71% of the companies measure on only two, one or even none of the four vertical levels. In fact, 85% of all companies neglected the inclusion of market and/or customer relevance when measuring their innovativeness, 38% had no financial metrics and 81% of the companies lacked metrics relating to an organizational level. This showed that although companies are aware of the importance of innovation and the value of meas-uring it, resources are placed in the wrong and highly unbalanced areas, with reference to the holis-tic framework identified through theory. Fourthly, all areas reported by the companies as important or challenging, were covered by this in-clusive structure for metrics. In addition, all specific theoretically suggested metrics as well as the metrics actually used in reality, were covered. The areas of the framework which in reality were only vaguely covered by the average company, we could also see that specific companies were put-ting a lot of effort into measuring in these areas, using a number of specific and traceable metrics. The conclusion to this, is that the framework does provide useful guidance for taking on the chal-lenge to create a more structured and truly value-oriented (in that it covers more than financial value) way of working with innovation metrics. The matrix framework is presented as slightly ideal, but is a highly useful framework for benchmarking the current metrics in use, identifying areas where more resources should be focused, identifying areas where use of metrics maybe even should be toned down, in order to better steer behaviour and get better indications for management. As all theoretically related studies however, it is important that the company takes the time to discuss (with an innovation team if possible) the company’s specific needs and requirements, relative to the overall tendencies and suggestions in this thesis. The framework may prove too extensive for some, wherefore the importance of a balanced set of metrics cannot be understated. A good balance in-creases the chances of a more value-added application of innovation metrics – in the long run. Concluding, the analysis showed an abundance of suggestions around innovation metrics, in all areas, which shows that by making innovation more tangible through facilitating structures and clearly communicated definitions, there are no reasons why innovation metrics should not be suc-cessfully applied in “soft” as well as “hard” areas of the organization, adding value to strategic de-cisions and internal behaviour around innovation - with the aim to improve competitiveness.
50
8 Future research Due to the novelty of the area of innovation metrics, the thesis can only cover so many areas, and hence leaves many interesting questions unanswered. More details as to specific metrics and a comparison of the metrics within each of the squares of the framework is a highly interesting area for future research. Through this, the skeleton for innovation metrics presented in this thesis, could potentially turn into a specifically recommended set of met-rics, evaluated and tested. The current situation of high diffusion and little coherence between companies allowed for very limited specific conclusions to be drawn, regarding quantitative conclusions etc. For instance, track-ing financial results, such as operational profit over a few years and comparing to companies differ-ent methods of measuring would be interesting once a more common ground has been laid concern-ing innovation metrics. Similarly, studying the impact or effect of specific metrics would be highly interesting. For instance, comparing chosen metrics with annual growth rates over time would have been an interesting way of seeing if some measures are more successful than others. Due to the fact that few companies have a rigid way of measuring innovation, and the coherencies again are very scarce, this has been left for future research. Interesting would also be to follow companies’ potential changes in accordance with the framework suggested, and monitor the impacts on long-term results.
51
9 Literature Alvesson, M. & Sköldberg, K., “Tolkning og reflektion – Vetenskapsteori och kvalitativ metod”, Studentlitteratur, 2008 Andersen, I., ”Den skinbarlige virkelighed – vidensproduktion inden for samfundsvidenskaberne”, Forlaget Samfundslitteratur, 3rd edition, 2005 Andrew, J.P., Derocco, E.S., Taylor, A., “The innovation imperative in Manufacturing – How the United States can restore its edge”, The Boston Consulting Group Inc., 2009 Andrew, J. P., Haanæs K., Michael, D.C, Sirkin, H.L., Taylor, A., “Measuring Innovation 2008: Squandered opportunities”, The Boston Consulting Group Inc., 2008 Archibugi, D., Howells, J., Michie, J., “Innovation systems in a Global Economy”, Technology Analysis & Strategic Management, Vol. 11, No.4, Taylor & Francis Ltd, 1999 Barczak, G., Kahn, K.B., Moss, R., “An Exploratory Investigation of NPD Practices in Non-profit Organizations”, The journal of Product Innovation Management, Product Development & Man-agement Association, 2006 Bryman, A., ”Samhällsvetenskapliga metoder”, Malmö: Liber Ekonomi, 2006 Chan, V., Musso, C., Shankar, V., “McKinsey Global Survey Results - Assessing Innovation Metrics”, The McKinsey Quarterly, 2008 Cooper, R. G., Edgett, S. J., Kleinschmidt, E. J., “Benchmarking Best NPD Practised – II” Re-search Technology Management; Vol. 47, No. 3, 2004 Council on Competitiveness, “Innovate America – Thriving in a world of challenge and change”, National Innovation Initiative Summit and Report, 2004 Creswell, J. W., Plano Clark, V. L., Gutmann, M. L., & Hanson, W. E., “Advanced mixed methods research”, Handbook of mixed methods in social & behavioral research”, Thousand Oaks, 2003 Creswell, J.W., “Research design: Qualitative and quantitative approaches”, Thousand Oaks, 1994 Davila T., Epstein M. J. & Shelton R., “Making Innovation Work: How to Manage It, Measure It, and Profit from It”, Wharton School Publishing, Jan 2006 Dooley, L., O’Sullivan, D., “Managing within distributed innovation networks”, International Jour-nal of Innovation Management, Imperial College Press, Vol. 11, No.3, 2007 Drucker, P. F., “Innovation and Entrepreneurship – Practice and Principles”, Elsevier, Revised edition, 2007
52
Drucker, P. F., “People and Performance”, Harvard Business School Press, Boston Massachusetts, 3rd edition, 2007 Dundon, E., “The seeds of innovation – cultivating the synergy that fosters new ideas”, American Management Association, 2002 Eccles, R. G., “The Performance Measurement Manifesto”, Harvard Business Review, Vol. 69, No. 1, 1991 Edquist, C., “Systems of innovation : technologies, institutions and organizations”, London, Pin-ter, 1997 European Commission: Enterprise & Industry Innovation on “Innovation”. http://ec.europa.eu/enterprise/policies/innovation/index_en.htm, retrieved on 2009-02-14 Eisenhardt, D.K., “Building theories from case study research”, Academy of Management Review, 14, 1989 Eisenhardt, D.K., “Better stories and better constructions – the case for rigor and comparative logic”, Academy of Management Review, Vol.16, No. 3, 1991 Fagerberg, J., Mowery, D. C. & elson, R. R., “The Oxford Handbook of innovation – Innova-tion – A guide to the literature”, Oxford University Press, 2005 Fagerberg, J. & Verspagen, B., “Innovation studies - The emerging structure of a new scientific field”, Centre for Technology, Innovation and Culture, University of Oslo, 2008 Freeman, C., “Systems of Innovation – Selected Essays in Evolutionary Economics”, Edward El-gar, 2008 Goffin, K. & Mitchell, R., “Innovation Management: Strategy and Implementation using the Pen-tathlon Framework”, Palgrave Macmillan, June 2005 Googol Business avigator AB, Innovation management consulting firm on “Innovation”, http://googol.se/page/page.asp?id=1, retrieved on 2009-03-10 Gustavsson, B., “Kunskapande metoder”, Studentlitteratur Stockholm, 3rd edition, 2004 Hamel, G., “The why what and how of innovation management”, Harvard Business Review, Vol. 84, No. 2, 2006 Holme, I. M. & Solvang, B. K., “Forskningsmetodik: Om kvalitativa och kvantitativa metoder”, Studentlitteratur Lund, 1997 Hurmerinta-Peltomaki, L. & ummela, ., ”Mixed methods in international business research – a value added perspective”, Management International Review, Vol.46, No.4, 2006
53
Jick, T.D., ”Mixing qualitative and quantitative methods – triangulation in action”, Administrative Science Quarterly, December, 1979 Jones, G. & Wilson, J. C., “Nationality and Multinationals in Historical Perspective”, Harvard Business School, working paper, 2005 Kaplan, R. S. and orton, D.P., “The Balanced Scorecard – Translating Strategy into Action”, Harvard Business School Press, 1996 Kuczmarksi, T.D., “Measuring your return on innovation”, Marketing Management Journal of American Marketing Association, 2000 Kuczmarksi, T.D., “Five Fatal Flaws of Innovation”, Marketing Management Journal of American Marketing Association, 2001 Leadbeater, C., “Ten habits of Mass innovation”, UK National Endowment for Science, Technol-ogy and the Arts, November 2006 Mackinnon, L.A.K., “Accelerating in the turns”, 2004, http://www.ideamanagementsystems.com. Retrieved on 2009-04-15 Majaro, S., “Marketing Insurance Service - The Main challenges”, Service Industries Journal, Vol. 4, No. 3, 1984 Majaro, S., “The creative gap- managing ideas for profit”, Burnt Mill: Longman, 1988 Merriam, S.B. “Fallstudien som forskningsmetod”, Studentlitteratur Lund, 1994 Moore, G. A., “Darwin and the Demon - Innovating Within Established Enterprises”, Harvard Business Review, Vol. 82, No. 7/8, 2004 Muller, A., Välikangas, L. & Merlyn, P., “Metrics for innovation: guidelines for developing a customized suite of innovation metrics”, Strategy & Leadership, Emerald Group Publishing Ltd, Vol. 33, No 1, 2005 Muller, A., Välikangas, L. & Merlyn, P., “Metrics for innovation – how companies can develop a suite of innovation metrics to combat decay”, Woodside Institute, 2003 O'Connell, J., Cooper, C.L., “Multinational Corporation (MNC)", The Blackwell Encyclopedia of Management, Blackwell Reference Online. Retrieved on 2009-04-27. Patel, R. & Davidson, B., ”Forskningsmetodikens grunder – Att planera, genomföra och rapportera en undersökning”, Studentlitteratur, 2003 Rae, J., “Closing the gap on innovation metrics”, Business Week Online, 2006 Reich, R. B., “The Work of Nations: Preparing Ourselves for 21st Century Capitalism”, New York: Alfred A. Knopf, 1991
54
Regnell, B., Ritzén, S., Höst, M., Larsson, T., ilsson, F., Sundin, E., ”Innovationsförmåga – Mätning av innovationsförmåga i team”, Product Innovation Engineering program, Lunds Universitet, 2008. Rienecker, L. & Jörgensen, P., “Att skriva en bra uppsats”, Liber Ekonomi, 2002 Sarkar, S., “Innovation, market archetypes and outcome”, Physica-verlag Gmbh & Co, 2007 Sarkees, M., Hulland, J., “Innovation and efficiency: It is possible to have it all”, Business Hori-zons;Vol.52 No.1, 2009 Schleimann-Jensen, U. & Suraga, C., “Innovation Management - A Master’s Thesis on how Top Managements in Swedish Industry commit to and prioritize innovation, and non-technical innova-tion in particular”, Royal Institute of Technology, Stockholm, 2006 Sullivan, P., “Management Visionary Drucker dies”, The Washington Post Company, Page B06, 2005 Tashakkori, A., & Teddlie C., “Handbook of mixed methods in social & behavioural research, Thousand Oaks, Calif.: SAGE Publications, 2003 Taylor, S. J. & Bogdan, R., ”Introduction to qualitative research methods”, Wiley New York, 1984 Weelwright , S.C., “Revolutionizing product development : quantum leaps in speed, efficiency, and quality”, New York: The Free Press, 1992 White, E., “Quest for innovation, motivation inspires the gurus”, Wall Street Journal, May 2008 Wolstenholme, E. F., “Qualitative vs. Quantitative Modelling: The Evolving Balance”, The Jour-nal of the Operational Research Society, Palgrave Macmillan Journals, Vol. 50, No. 4, 1999 Yin, R.K. “Case study research: Design and methods”, Third edition, Thousand Oaks, 2003
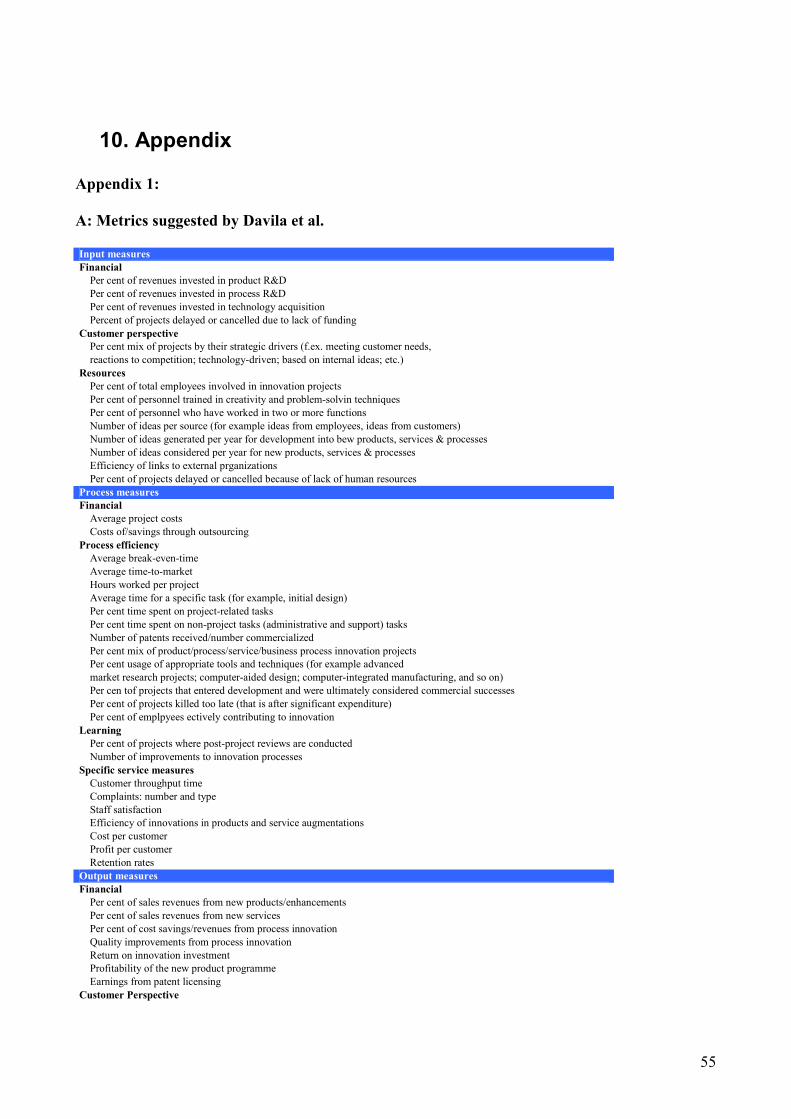
55
10. Appendix
Appendix 1:
A: Metrics suggested by Davila et al.
Input measures
Financial
Per cent of revenues invested in product R&D Per cent of revenues invested in process R&D Per cent of revenues invested in technology acquisition Percent of projects delayed or cancelled due to lack of funding
Customer perspective
Per cent mix of projects by their strategic drivers (f.ex. meeting customer needs, reactions to competition; technology-driven; based on internal ideas; etc.)
Resources
Per cent of total employees involved in innovation projects Per cent of personnel trained in creativity and problem-solvin techniques Per cent of personnel who have worked in two or more functions Number of ideas per source (for example ideas from employees, ideas from customers) Number of ideas generated per year for development into bew products, services & processes Number of ideas considered per year for new products, services & processes Efficiency of links to external prganizations Per cent of projects delayed or cancelled because of lack of human resources
Process measures
Financial
Average project costs Costs of/savings through outsourcing
Process efficiency
Average break-even-time Average time-to-market Hours worked per project Average time for a specific task (for example, initial design) Per cent time spent on project-related tasks Per cent time spent on non-project tasks (administrative and support) tasks Number of patents received/number commercialized Per cent mix of product/process/service/business process innovation projects Per cent usage of appropriate tools and techniques (for example advanced market research projects; computer-aided design; computer-integrated manufacturing, and so on) Per cen tof projects that entered development and were ultimately considered commercial successes Per cent of projects killed too late (that is after significant expenditure) Per cent of emplpyees ectively contributing to innovation
Learning
Per cent of projects where post-project reviews are conducted Number of improvements to innovation processes
Specific service measures
Customer throughput time Complaints: number and type Staff satisfaction Efficiency of innovations in products and service augmentations Cost per customer Profit per customer Retention rates
Output measures
Financial
Per cent of sales revenues from new products/enhancements Per cent of sales revenues from new services Per cent of cost savings/revenues from process innovation Quality improvements from process innovation Return on innovation investment Profitability of the new product programme Earnings from patent licensing
Customer Perspective
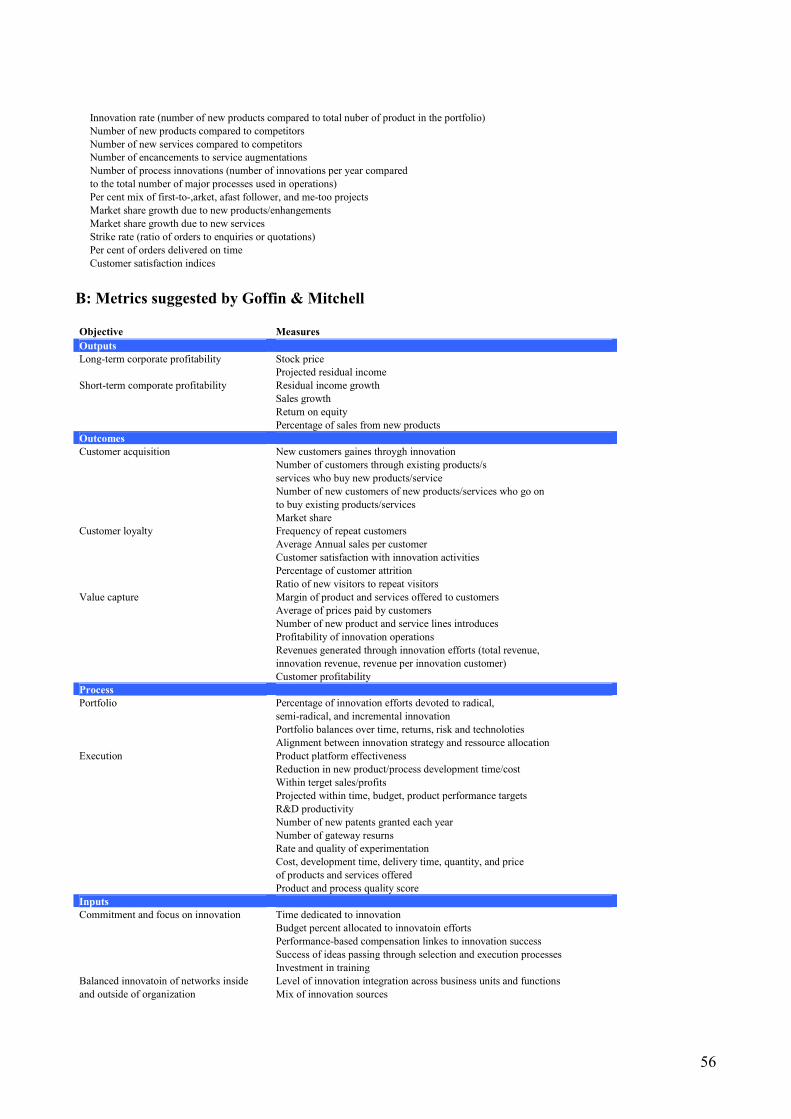
56
Innovation rate (number of new products compared to total nuber of product in the portfolio) Number of new products compared to competitors Number of new services compared to competitors Number of encancements to service augmentations Number of process innovations (number of innovations per year compared to the total number of major processes used in operations) Per cent mix of first-to-,arket, afast follower, and me-too projects Market share growth due to new products/enhangements Market share growth due to new services Strike rate (ratio of orders to enquiries or quotations) Per cent of orders delivered on time Customer satisfaction indices
B: Metrics suggested by Goffin & Mitchell
Objective Measures
Outputs Long-term corporate profitability Stock price Projected residual income Short-term comporate profitability Residual income growth Sales growth Return on equity Percentage of sales from new products Outcomes Customer acquisition New customers gaines throygh innovation Number of customers through existing products/s services who buy new products/service Number of new customers of new products/services who go on to buy existing products/services Market share Customer loyalty Frequency of repeat customers Average Annual sales per customer Customer satisfaction with innovation activities Percentage of customer attrition Ratio of new visitors to repeat visitors Value capture Margin of product and services offered to customers Average of prices paid by customers Number of new product and service lines introduces Profitability of innovation operations Revenues generated through innovation efforts (total revenue, innovation revenue, revenue per innovation customer) Customer profitability Process Portfolio Percentage of innovation efforts devoted to radical, semi-radical, and incremental innovation Portfolio balances over time, returns, risk and technoloties Alignment between innovation strategy and ressource allocation Execution Product platform effectiveness Reduction in new product/process development time/cost Within terget sales/profits Projected within time, budget, product performance targets R&D productivity Number of new patents granted each year Number of gateway resurns Rate and quality of experimentation Cost, development time, delivery time, quantity, and price of products and services offered Product and process quality score Inputs Commitment and focus on innovation Time dedicated to innovation Budget percent allocated to innovatoin efforts Performance-based compensation linkes to innovation success Success of ideas passing through selection and execution processes Investment in training Balanced innovatoin of networks inside Level of innovation integration across business units and functions and outside of organization Mix of innovation sources
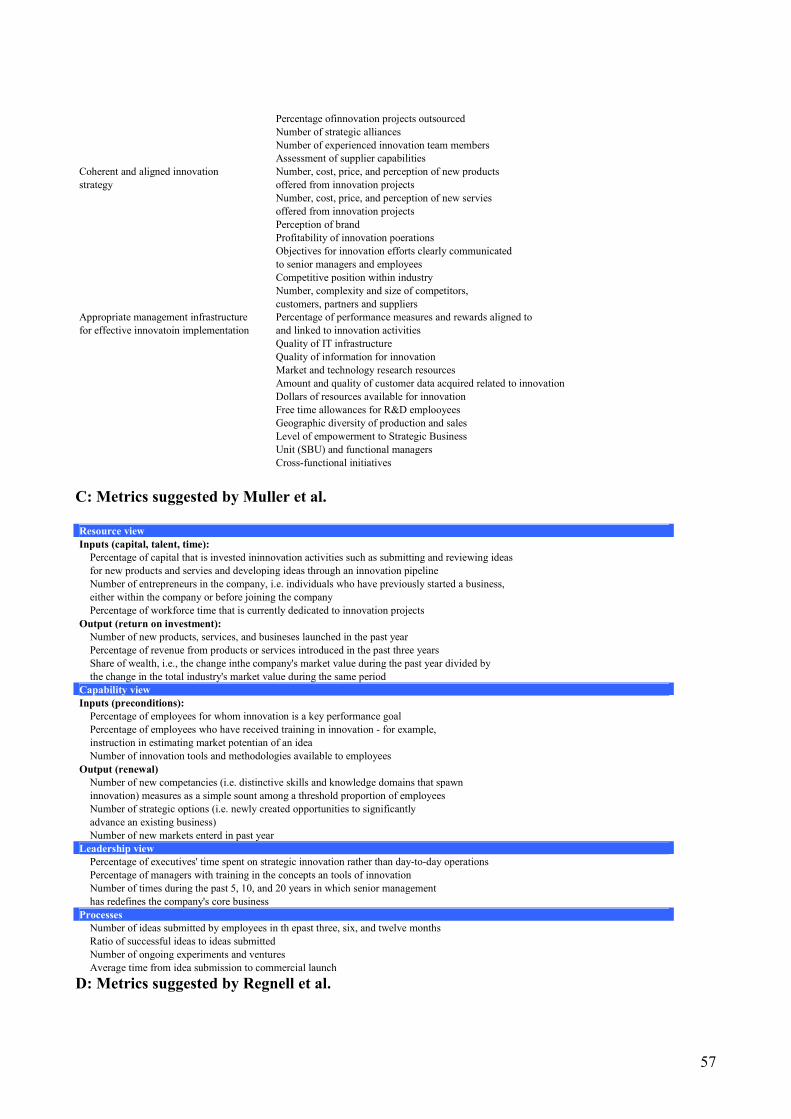
57
Percentage ofinnovation projects outsourced Number of strategic alliances Number of experienced innovation team members Assessment of supplier capabilities Coherent and aligned innovation Number, cost, price, and perception of new products strategy offered from innovation projects Number, cost, price, and perception of new servies offered from innovation projects Perception of brand Profitability of innovation poerations Objectives for innovation efforts clearly communicated to senior managers and employees Competitive position within industry Number, complexity and size of competitors, customers, partners and suppliers Appropriate management infrastructure Percentage of performance measures and rewards aligned to for effective innovatoin implementation and linked to innovation activities Quality of IT infrastructure Quality of information for innovation Market and technology research resources Amount and quality of customer data acquired related to innovation Dollars of resources available for innovation Free time allowances for R&D emplooyees Geographic diversity of production and sales Level of empowerment to Strategic Business Unit (SBU) and functional managers Cross-functional initiatives
C: Metrics suggested by Muller et al.
Resource view
Inputs (capital, talent, time):
Percentage of capital that is invested ininnovation activities such as submitting and reviewing ideas for new products and servies and developing ideas through an innovation pipeline Number of entrepreneurs in the company, i.e. individuals who have previously started a business, either within the company or before joining the company Percentage of workforce time that is currently dedicated to innovation projects
Output (return on investment):
Number of new products, services, and busineses launched in the past year Percentage of revenue from products or services introduced in the past three years Share of wealth, i.e., the change inthe company's market value during the past year divided by the change in the total industry's market value during the same period
Capability view
Inputs (preconditions):
Percentage of employees for whom innovation is a key performance goal Percentage of employees who have received training in innovation - for example, instruction in estimating market potentian of an idea Number of innovation tools and methodologies available to employees
Output (renewal)
Number of new competancies (i.e. distinctive skills and knowledge domains that spawn innovation) measures as a simple sount among a threshold proportion of employees Number of strategic options (i.e. newly created opportunities to significantly advance an existing business) Number of new markets enterd in past year
Leadership view
Percentage of executives' time spent on strategic innovation rather than day-to-day operations Percentage of managers with training in the concepts an tools of innovation Number of times during the past 5, 10, and 20 years in which senior management has redefines the company's core business
Processes
Number of ideas submitted by employees in th epast three, six, and twelve months Ratio of successful ideas to ideas submitted Number of ongoing experiments and ventures Average time from idea submission to commercial launch
D: Metrics suggested by Regnell et al.
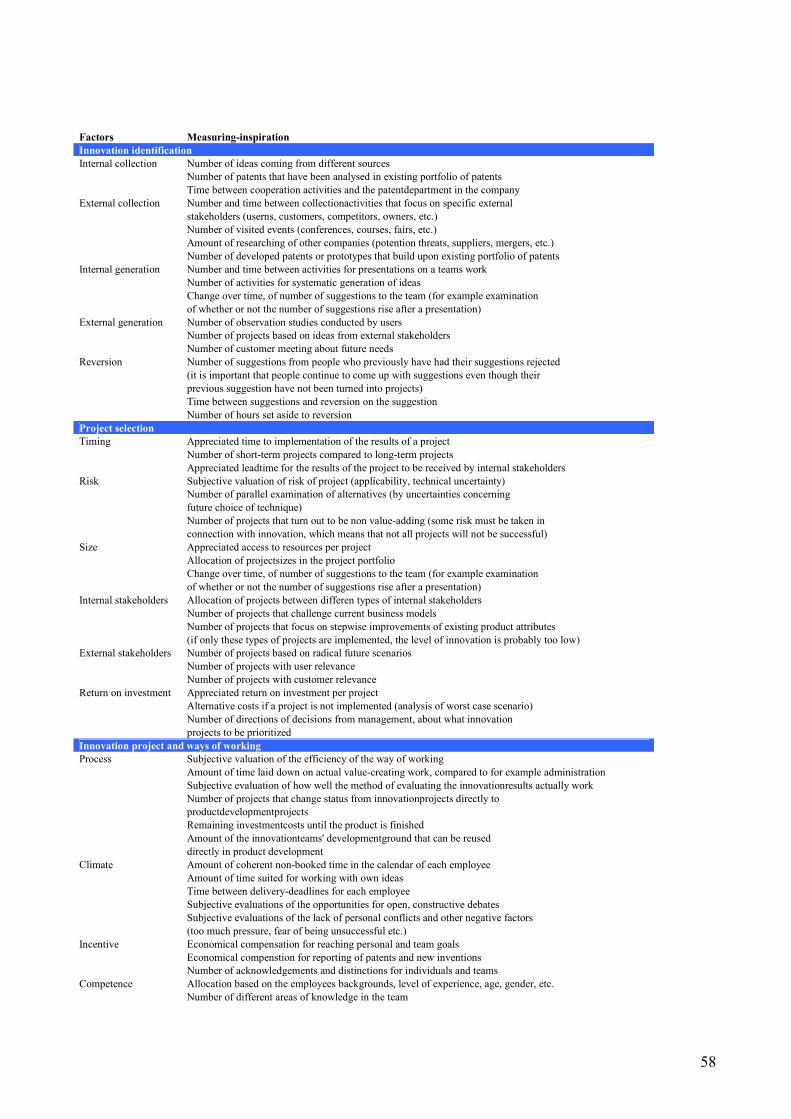
58
Factors Measuring-inspiration
Innovation identification
Internal collection Number of ideas coming from different sources Number of patents that have been analysed in existing portfolio of patents Time between cooperation activities and the patentdepartment in the company External collection Number and time between collectionactivities that focus on specific external stakeholders (userns, customers, competitors, owners, etc.) Number of visited events (conferences, courses, fairs, etc.) Amount of researching of other companies (potention threats, suppliers, mergers, etc.) Number of developed patents or prototypes that build upon existing portfolio of patents Internal generation Number and time between activities for presentations on a teams work Number of activities for systematic generation of ideas Change over time, of number of suggestions to the team (for example examination of whether or not the number of suggestions rise after a presentation) External generation Number of observation studies conducted by users Number of projects based on ideas from external stakeholders Number of customer meeting about future needs Reversion Number of suggestions from people who previously have had their suggestions rejected (it is important that people continue to come up with suggestions even though their previous suggestion have not been turned into projects) Time between suggestions and reversion on the suggestion Number of hours set aside to reversion Project selection
Timing Appreciated time to implementation of the results of a project Number of short-term projects compared to long-term projects Appreciated leadtime for the results of the project to be received by internal stakeholders Risk Subjective valuation of risk of project (applicability, technical uncertainty) Number of parallel examination of alternatives (by uncertainties concerning future choice of technique) Number of projects that turn out to be non value-adding (some risk must be taken in connection with innovation, which means that not all projects will not be successful) Size Appreciated access to resources per project Allocation of projectsizes in the project portfolio Change over time, of number of suggestions to the team (for example examination of whether or not the number of suggestions rise after a presentation) Internal stakeholders Allocation of projects between differen types of internal stakeholders Number of projects that challenge current business models Number of projects that focus on stepwise improvements of existing product attributes (if only these types of projects are implemented, the level of innovation is probably too low) External stakeholders Number of projects based on radical future scenarios Number of projects with user relevance Number of projects with customer relevance Return on investment Appreciated return on investment per project Alternative costs if a project is not implemented (analysis of worst case scenario) Number of directions of decisions from management, about what innovation projects to be prioritized Innovation project and ways of working
Process Subjective valuation of the efficiency of the way of working Amount of time laid down on actual value-creating work, compared to for example administration Subjective evaluation of how well the method of evaluating the innovationresults actually work Number of projects that change status from innovationprojects directly to productdevelopmentprojects Remaining investmentcosts until the product is finished Amount of the innovationteams' developmentground that can be reused directly in product development Climate Amount of coherent non-booked time in the calendar of each employee Amount of time suited for working with own ideas Time between delivery-deadlines for each employee Subjective evaluations of the opportunities for open, constructive debates Subjective evaluations of the lack of personal conflicts and other negative factors (too much pressure, fear of being unsuccessful etc.) Incentive Economical compensation for reaching personal and team goals Economical compenstion for reporting of patents and new inventions Number of acknowledgements and distinctions for individuals and teams Competence Allocation based on the employees backgrounds, level of experience, age, gender, etc. Number of different areas of knowledge in the team
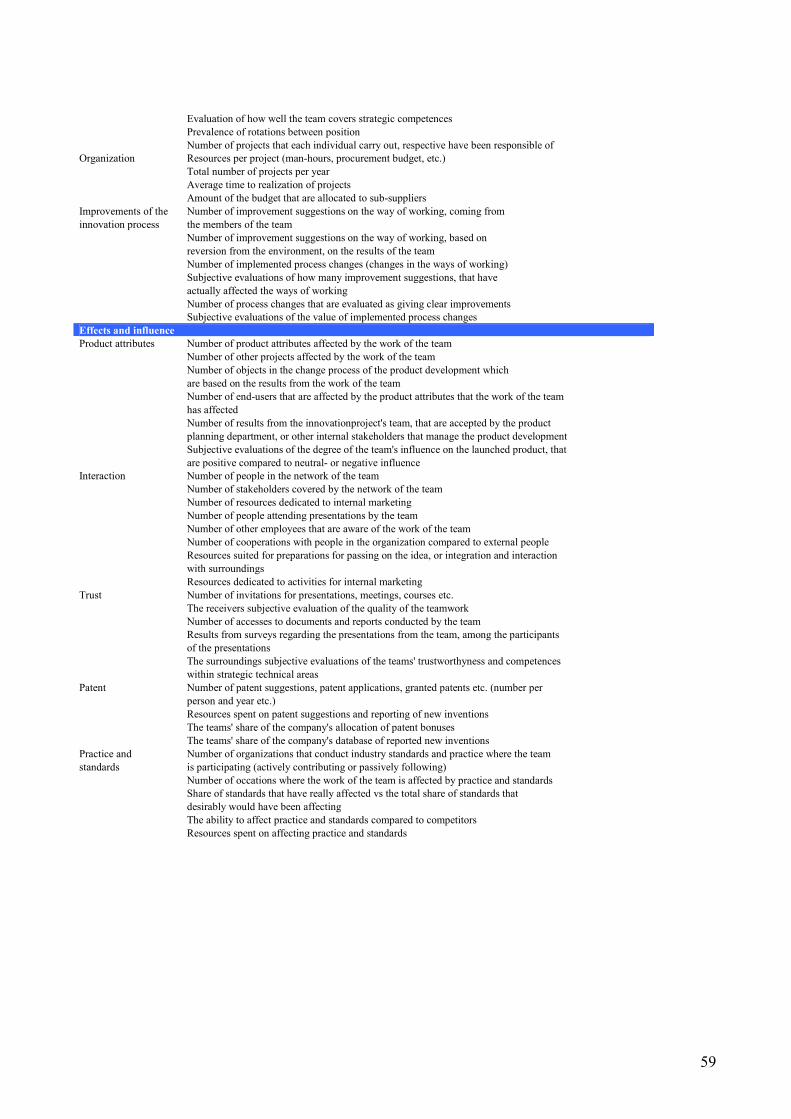
59
Evaluation of how well the team covers strategic competences Prevalence of rotations between position Number of projects that each individual carry out, respective have been responsible of Organization Resources per project (man-hours, procurement budget, etc.) Total number of projects per year Average time to realization of projects Amount of the budget that are allocated to sub-suppliers Improvements of the Number of improvement suggestions on the way of working, coming from innovation process the members of the team Number of improvement suggestions on the way of working, based on reversion from the environment, on the results of the team Number of implemented process changes (changes in the ways of working) Subjective evaluations of how many improvement suggestions, that have actually affected the ways of working Number of process changes that are evaluated as giving clear improvements Subjective evaluations of the value of implemented process changes Effects and influence
Product attributes Number of product attributes affected by the work of the team Number of other projects affected by the work of the team Number of objects in the change process of the product development which are based on the results from the work of the team Number of end-users that are affected by the product attributes that the work of the team has affected Number of results from the innovationproject's team, that are accepted by the product planning department, or other internal stakeholders that manage the product development Subjective evaluations of the degree of the team's influence on the launched product, that are positive compared to neutral- or negative influence Interaction Number of people in the network of the team Number of stakeholders covered by the network of the team Number of resources dedicated to internal marketing Number of people attending presentations by the team Number of other employees that are aware of the work of the team Number of cooperations with people in the organization compared to external people Resources suited for preparations for passing on the idea, or integration and interaction with surroundings Resources dedicated to activities for internal marketing Trust Number of invitations for presentations, meetings, courses etc. The receivers subjective evaluation of the quality of the teamwork Number of accesses to documents and reports conducted by the team Results from surveys regarding the presentations from the team, among the participants of the presentations The surroundings subjective evaluations of the teams' trustworthyness and competences within strategic technical areas Patent Number of patent suggestions, patent applications, granted patents etc. (number per person and year etc.) Resources spent on patent suggestions and reporting of new inventions The teams' share of the company's allocation of patent bonuses The teams' share of the company's database of reported new inventions Practice and Number of organizations that conduct industry standards and practice where the team standards is participating (actively contributing or passively following) Number of occations where the work of the team is affected by practice and standards Share of standards that have really affected vs the total share of standards that desirably would have been affecting The ability to affect practice and standards compared to competitors Resources spent on affecting practice and standards