innovation networks and knowledge flows across …
TRANSCRIPT

C R E NÝS
C e n t r o R i c e r c h e E c o n o m i c h e N o r d S u d U n i v e r s i t à d i C a g l i a r i U n i v e r s i t à d i S a s s a r i
INNOVATION NETWORKS AND KNOWLEDGE FLOWS ACROSS THE EUROPEAN REGIONS
Raffaele Paci
Ernesto Batteta
CONTRIBUTI DI RICERCA 03/13

Raffaele Paci University of Cagliari and CRENoS
Ernesto Batteta
University of Cagliari and CRENoS
INNOVATION NETWORKS AND KNOWLEDGE FLOWS ACROSS THE EUROPEAN REGIONS
Abstract The recent resurgence of growth studies has indicated technological activities and knowledge spillovers as one of the most important factors in determining the performance of the economic systems. However, only few empirical studies have tried to analyse the flows of technology across regional economies due to the lack of adequate indicators. In this paper we propose new evidence on the characteristics of knowledge spillovers across the European regions based on a database on patents citations developed at the NBER . The data refers to patents granted by the US patent office to European firms over the period 1978-1997. First, we have assigned each patent to 147 European regions according to the place of residence of the first inventor. Then, we have examined in- and out- flows of patent citations as proxy of knowledge spillovers. In order to asses both the spatial and network characteristics of these flows we have tried to combine methodological instruments developed within the Social Network Analysis and the Geographical Information Systems. Our analysis shows the huge differences that exist among high tech and traditional sectors in the complexity of technological networks and in the geographical distribution of knowledge flows. Keywords: patent citations, technological networks, knowledge spillovers JEL: O31, O34, O52, R10
December 2003

1. Introduction1
Technological activities and knowledge spillovers are considered one of the most important factors in determining the performance of the economic systems. More specifically, in the last two decades greater attention has been devoted to the geographical dimension of the mechanisms of creation and diffusion of technology and most studies have emphasized the local and cumulative nature of the technology spillovers.2 Starting from the seminal paper by Griliches (1979), several studies have tried to explore the characteristics of R&D spillovers and their role in the process of creation of new knowledge. However, the empirical investigation of technology flows across regional economies has suffered from the lack of adequate indicators. As a matter of fact, Krugman (1991) stressed that knowledge flows are invisible and cannot be measured and tracked. This view has been opposed by Jaffe et al (1993) which suggested that indeed knowledge flows may leave a “paper trial”, in the form of patent citations, which can be measured and used to obtain information on the geographical component of the innovation spillover mechanism. Other studies [Rallet and Torre (1999), Paci and Usai (1999), Maskell and Malmberg (1999)], using different methodologies, have emphasized the local nature of knowledge diffusion which is difficult to transmit across space.3 Spatial proximity encourages firms to interact and to share information and thus it helps the process of knowledge transmission.
1 We have benefited from useful comments by participants at the 2003 ERSA conference in Jyvaskyla, Finland. Financial support by MIUR is gratefully acknowledged (COFIN 2002 project n. 2002138187_02). 2 For a recent survey of the debate on spatial knowledge spillover see Audretsch and Feldman (2004). 3 See, among others, Audretsch and Feldman (1996), Paci and Usai (1999), Maskell and Malmberg (1999).

In this paper we propose new evidence on the characteristics of knowledge spillovers, proxied by in- and out- flows of patent citations, across the European regions.4 In order to asses both the spatial and network characteristics of these flows we have tried to combine methodological instruments developed within the Social Network Analysis (SNA) and the Geographical Information Systems (GIS) techniques. Social Network Analysis, developed to study social relationships and networks (Scott, 1991) can be seen as a useful instrument to be applied also to economic relationships and it has already been used in the analysis of scientific citations (Balconi et al, 2002). The SNA allows to measure the main characteristics of a network and therefore to address crucial aspects of the debate on localised technological spillovers. For instance, the evaluation of the centre – periphery models and the detection of a core of regions characterised by a high degree of technology exchanges. A second goal of the paper is to investigate the differences across industrial sectors with respect to the characteristics of technological networks and knowledge flows. Our assumption is that geographical proximity helps the technological spillovers in traditional sectors where knowledge is more tacit and uncodified. While, in high tech sectors the exchange of codified and standardised knowledge can take place even among firms located in remote regions. The paper is based on the database on citations recently developed at NBER by Hall et al. (2001) based on patents granted to European countries by the United States Patent and Trademark Office (USPTO) over the period 1963-1999. The paper is organised as follows. In section 2 the dataset on patents and citations is presented together with a descriptive
4 An analysis of patent citations from the European Patent Office is presented in Maurseth and Verspagen (1999). The role of technological spillovers within growth models has been examined for the case of the European regions by Paci and Pigliaru (2002) and Bottazzi and Peri (2003).

analysis of their distribution at the country level and at the regional level for the three selected sectors. The basic concepts of the Social Networks Analysis are discussed in section 3. The application of the network analysis to the technological networks in the shoes, drugs and computer sectors is presented in sections 4. Some concluding comments are in section 5.
2. Patents and citations in Europe
2.1. The NBER database This paper makes use of the dataset developed at NBER by Hall, Jaffe and Trajtenberg on patents granted in the USA by the United States Patent Office (USPTO) over the period 1978-1997.5 The debate on the pros and cons of patents as indicator of technological activity is a long standing one (see, among others, Pavitt, 1982 and Griliches, 1990); however a full assessment of this issue is beyond the aim of the present paper. In general, patents are very useful for economic research since they provide information: (i) on the inventors’ residence and thus are geographically defined starting from the zip codes; (ii) on the technological content of the invention and can be classified according to the industrial sectors; (iii) on the timing of the innovation over a long time span and therefore are appropriate for a dynamic analysis. For the purpose of our analysis, patent statistics seem particularly suitable, since they are the only available indicator which allows to record the citations of previous innovations. This information is collected for legal reasons, since it limits the property right (and therefore the monopoly power) awarded to patents proponents. In other words, the cited patent represents a previous piece of existing knowledge that is embodied in the new technology.
5 A detailed description of the dataset is presented in Hall et. al. (2001) and in Jaffe and Trajtenberg (2002).

In the economic literature, citations are used as proxy for the flows of technological information between firms. More specifically, two different applications of citations have been proposed. First, citations made as proxy of “paper trial” for technological spillovers given that when a firm makes a citation of previous patent it recognizes the presence of a knowledge inflow. Second, citations received as an indicator of the significance of the cited patent based on the idea that the more time a patent is cited the higher is its economic value. In the present contribution we focus mainly on the first use of citations, as proxy for knowledge flows which can be geographically identified. It should be noted that when citations received are considered the “inversion” problem may occur (see Hall et al. 2001). In other words, only previous patents can be cited and therefore the probability that a new patent receives citations is lower. This can create a bias in the distribution of citations received both at sectoral and geographical levels. However, in our empirical analysis we find similar results both for citations made and received, and this is probably due to the fact that we are considering together a long time period (1978-97).6 From the NBER database we have first selected all patents originated from the European countries. Then, each patent has been attributed to a European region on the basis of the place of residence of the first inventor. The use of the inventor’s residence, rather than the proponent’s residence, is preferred in order to get a more precise picture of the spatial localisation of each innovation (Paci and Usai, 2000, Breschi 2000).7 Indeed, the residence of the proponent generally corresponds to firms’ 6 A detailed analysis of changes in the technological networks which may have happened in different sub-periods is due in future extensions of the research. 7 In this paper we have assigned patents just to the first investor to simplify the handling of this very complex database. In general , for the case a multiple inventors a proportional attribution is preferred (see Moreno, Paci, Usai, 2003).

headquarters and therefore it might lead to an underestimation of peripheral regions’ innovative activity whenever the invention has been developed in a firm’s plant or laboratory located in another area. As far as the territorial split is concerned we have followed the classification provided by EUROSTAT through NUTS (Nomenclature des Unités Territoriales Statistiques) trying to select, in each country, geographical units with a certain degree of administrative and economic control. As a result, we consider 147 sub-national units (which, from now on, we will simply call, regions) which are a combination of NUTS 0, 1 and 2 levels, belonging to 17 countries (15 of the European Union plus Switzerland and Norway) (see Appendix for details). As for the sectoral breakdown, patents are sorted by the USPTO classification which includes over 400 main categories and 120,000 sub-categories. In the analysis of technological flows within Europe we have focused our attention to three industrial sectors (shoes, drugs and computers) which display different levels of technological pace (more on this in section 2.3 below). For each patent the NBER database provides information on the citations to previous patents and therefore on the geographical location and industrial sector of the cited patents. A general overview of the patenting activity and the related citations by the European countries at the USPTO over the whole period 1978-97 is presented in Table 1. We consider over 350,000 patents, which have generated over 2 millions citations, while 1.3 million are the citations received by the European based patents. The highest quota is shown by Germany (around 40% of the total), followed by France (15%) and UK (14.5%). Other countries with a relevant patenting activity are Switzerland (6.8%) and Italy (6.2), followed by Netherlands (4.7%) and Sweden (4.6%). A very low innovative activity is shown by Portugal, Greece and Luxembourg.
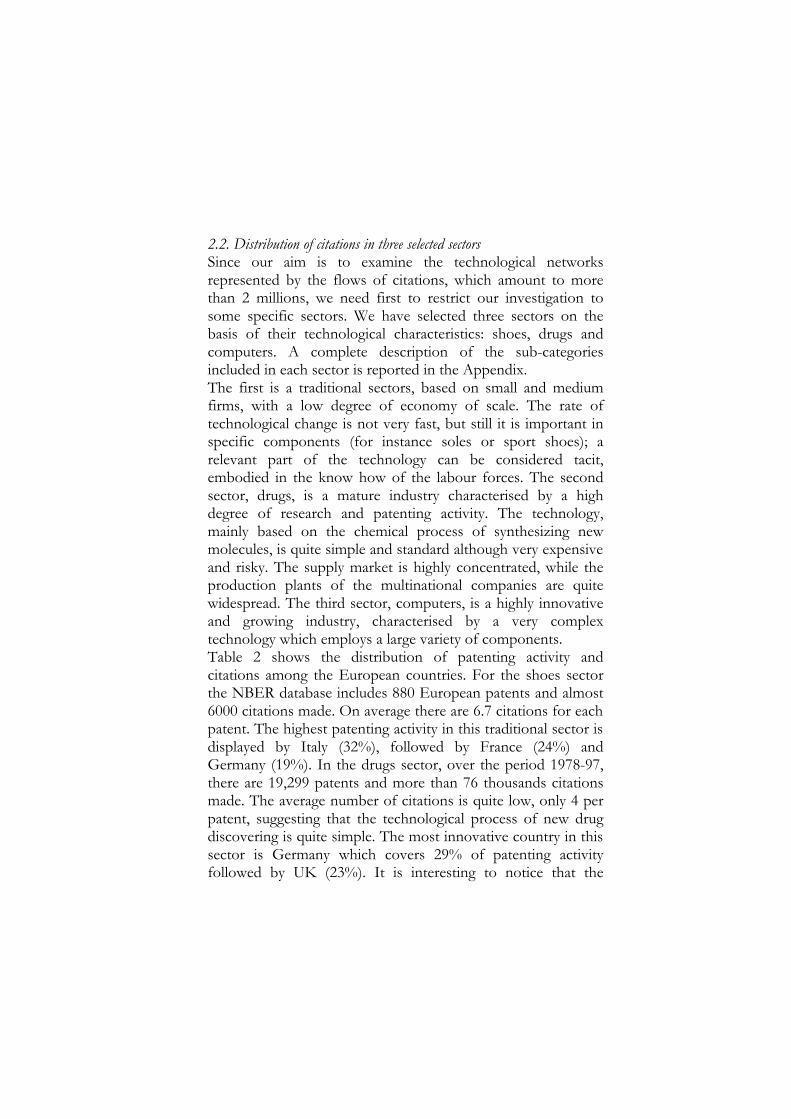
2.2. Distribution of citations in three selected sectors Since our aim is to examine the technological networks represented by the flows of citations, which amount to more than 2 millions, we need first to restrict our investigation to some specific sectors. We have selected three sectors on the basis of their technological characteristics: shoes, drugs and computers. A complete description of the sub-categories included in each sector is reported in the Appendix. The first is a traditional sectors, based on small and medium firms, with a low degree of economy of scale. The rate of technological change is not very fast, but still it is important in specific components (for instance soles or sport shoes); a relevant part of the technology can be considered tacit, embodied in the know how of the labour forces. The second sector, drugs, is a mature industry characterised by a high degree of research and patenting activity. The technology, mainly based on the chemical process of synthesizing new molecules, is quite simple and standard although very expensive and risky. The supply market is highly concentrated, while the production plants of the multinational companies are quite widespread. The third sector, computers, is a highly innovative and growing industry, characterised by a very complex technology which employs a large variety of components. Table 2 shows the distribution of patenting activity and citations among the European countries. For the shoes sector the NBER database includes 880 European patents and almost 6000 citations made. On average there are 6.7 citations for each patent. The highest patenting activity in this traditional sector is displayed by Italy (32%), followed by France (24%) and Germany (19%). In the drugs sector, over the period 1978-97, there are 19,299 patents and more than 76 thousands citations made. The average number of citations is quite low, only 4 per patent, suggesting that the technological process of new drug discovering is quite simple. The most innovative country in this sector is Germany which covers 29% of patenting activity followed by UK (23%). It is interesting to notice that the
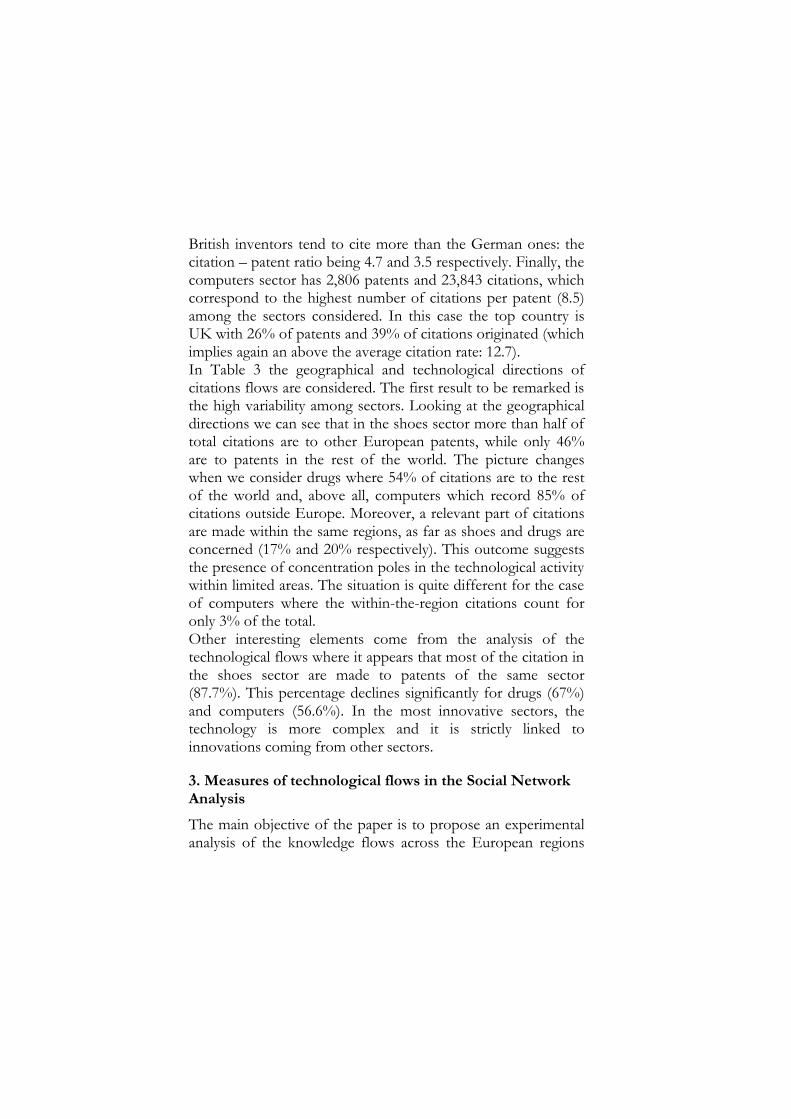
British inventors tend to cite more than the German ones: the citation – patent ratio being 4.7 and 3.5 respectively. Finally, the computers sector has 2,806 patents and 23,843 citations, which correspond to the highest number of citations per patent (8.5) among the sectors considered. In this case the top country is UK with 26% of patents and 39% of citations originated (which implies again an above the average citation rate: 12.7). In Table 3 the geographical and technological directions of citations flows are considered. The first result to be remarked is the high variability among sectors. Looking at the geographical directions we can see that in the shoes sector more than half of total citations are to other European patents, while only 46% are to patents in the rest of the world. The picture changes when we consider drugs where 54% of citations are to the rest of the world and, above all, computers which record 85% of citations outside Europe. Moreover, a relevant part of citations are made within the same regions, as far as shoes and drugs are concerned (17% and 20% respectively). This outcome suggests the presence of concentration poles in the technological activity within limited areas. The situation is quite different for the case of computers where the within-the-region citations count for only 3% of the total. Other interesting elements come from the analysis of the technological flows where it appears that most of the citation in the shoes sector are made to patents of the same sector (87.7%). This percentage declines significantly for drugs (67%) and computers (56.6%). In the most innovative sectors, the technology is more complex and it is strictly linked to innovations coming from other sectors.
3. Measures of technological flows in the Social Network Analysis
The main objective of the paper is to propose an experimental analysis of the knowledge flows across the European regions

based on the methodology of the Social Network Analysis (SNA) combined with the GIS techniques. The SNA, through quantitative measures of the main characteristics of a network, allows to address crucial aspects of the most recent debate on technological spillovers within a spatial dimension. Among them, the evaluation of the centre – periphery models, the detection of a core of regions characterised by a high degree of in- and out- flows of technology, the role of polarisation regions, the effects of the geographical distance. Moreover, we are interested in investigating the differences across industrial sectors with respect to the features of technological networks and knowledge flows. The idea is that the geographical distance restricts relatively the technological flows in traditional sectors which are characterised by tacit and uncodified knowledge and thus by spatially localised spillovers. Whereas, in high tech sectors the exchange of codified and standardised knowledge can take place even among firms located in remote regions. Therefore, in terms of technological networks, we may expect a higher degree of centralisation in the traditional sector. Technological activity is not uniformly distributed in space; some regions are highly specialised in particular industrial sector and act as polarisation nodes of knowledge flows which affects the entire technological network. To evaluate the role of each region as a junction for the exchange of knowledge among all the other European regions, we first compute a citation square matrix C, where the generic element cij represents citations made by region i to region j. In each row citations originated by a specific regions are listed; while, along a column, we have citations received by a certain region. Starting from such citation matrices it is possible to compute, for the desired level of sectoral break down, a network with oriented and valued relationships.

A first index which allows to assess the characteristics of the network is Freeman's general centralisation index adapted for valued digraph
[ ]
( ) [ ]∑
∑
=
=
−
−= n
ii
n
ii
dn
ddD
1
1max
1
where ∑=
=n
jiji cd
1
is the sum of citations made (received) by
region i towards all other regions of the network and dmax is the maximum value reached by di.8 The index is defined within a range 0-1 and it is independent on the number of regions and citations in the networks. Two examples of networks with extreme values of Freeman’s centralisation index are in the following panel.
Index Network D = 1 A central region receives all citations
D = 0 Each region receives a citation
In general, a high value of Freeman’s index indicates that some regions attract most of the citations made in the network and thus they represent crucial nodes of the knowledge flows.
8 The index can be computed for both citations made and received. As we can see in the next sections the results are quite similar.

Once the degree of centralisation of the whole network has been computed, it is interesting to identify the group of regions which constitutes the core of knowledge exchanges and to detect the centre/periphery structure of citations. To this aim we follow the iterative procedure suggested by Borgatti and Everett (2002) for detecting a core/periphery structure without the benefit of an a priori partition.9 The procedure implemented into the computer package UCINET 6 For Windows (Borgatti,et al. 2002) is based on a combinatorial optimization technique which allows to find a partition (the core regions) such that the correlation between the data and the pattern matrix induced by the partition is maximized. The range of the centre/periphery fit is 0-1 where high value signals the presence of a core group with a high technology flows. In the following section we apply the methodology of the SNA to the technological flows (proxied by patent citations ) across the European regions for the three sectors selected.10
4. Technological networks in selected sectors
4.1 Shoes The patenting activity in this traditional sector is spread among 87 regions out of the 147 included in the database. In Map 1 we have represented the geographical distribution of citations originated and received. From a visual inspection it appears a rather concentrated structure of technological flows in the shoes sector. We have also computed the average distance of citations; the European average is 362 km. From Table 4, where the main indicators for the top 20 most innovative regions are reported, we can see that Veneto in Italy displays the highest number of patents (229) and citations made
9 In some experiments we may have an a priori distinction between regions in the centre and in the periphery; in our case we must construct the partition from the data itself. 10 In the following sections we consider only the citations flows among the European regions.

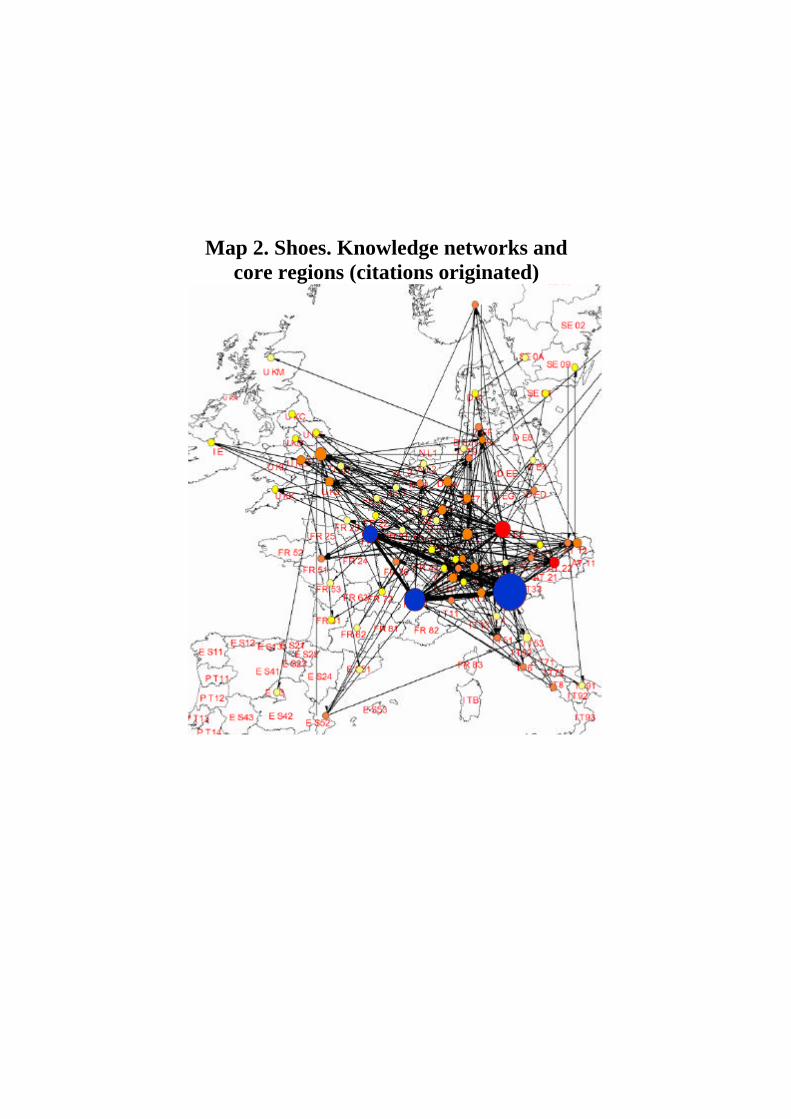
(682) and received (623). In this region are located highly specialised industrial districts (Verona for the traditional shoes and Montebelluna for the sport ones). Firms located in Veneto make use of knowledge coming from other 31 regions in Europe and, at the same time, 22 regions cite innovations developed in Veneto. Among other top innovative regions are Rhone Alpes (467 citations made and 16 regions cited) and Ile de France (174 citations made and 19 regions cited). It is interesting to remark that some regions show a higher capacity to attracts citations with respect to their number of patents and citations made (for instance, Ile de France and Bayern). This result can be interpreted as signal of a higher significance and value of patenting activities in these areas. In Table 4 are also reported measures for the entire network. More specifically, Freeman's general centralisation index is equal to 0.32 and 0.31 for citations made and received, respectively. This value is significantly different from zero and it suggests the presence of a centralised pattern in the distribution of citations. The existence of a spatially concentrated structure in the knowledge flows is confirmed by the core / periphery fit (0.90). Three regions (Veneto in Italy and the French regions Rhone Alpes and Ile de France) turn out to represent the core of the technological network in the shoes sector. These regions, which receive 62% of total citations, act as attraction nodes for the exchange of knowledge among the whole network. A significant picture of the knowledge linkages in the shoes sector across the European regions is presented in Map. 2. The role of the three core regions as polarisation nodes in the technological network is emphasized.
4.2 Drugs This sector is characterised by an intensive patenting activity, quite dispersed across 117 European regions (see Map 3). Patents and citations are very high, compared to other sectors,

while the number of citations per patent tends to be low. The average distance of citations is relatively low, (341 km) probably because a large part of total citations are concentrated within the core regions. From Table 5 we can see that the region with the highest technological activity is South East in UK with 2,791 patents, 4,685 citations made and 3,544 received. Among other top performers we find again Ile de France, followed by three German regions (Nordrehin-Westfalen, Hessen and Baden Werttemberg), one Swiss (Nordwestschweizn) and one Italian (Lombardia). It is interesting to notice that the exchange of knowledge involves several regions: for instance patents in South East cite innovations made in 71 regions and are cited by other 74 regions. Similar high value are detected for other highly innovative regions. To examine the features of the whole network, Table 5 reports also Freeman's general centralisation index which is equal to 0.16 for both citations made and received. This value is lower compared to the shoes sector and this result indicates the presence of a less centralised pattern in the distribution of knowledge flows. As a matter of fact in the drugs industry we find that six regions constitute the core of the technological network: Ile de France (FR), South East (UK), Hessen, Baden Werttemberg and Nordrhein-Westfalen (DE), Nordwestschweiz (CH). The core regions make up 54% of total citations received. The existence of a spatially concentrated structure in the knowledge flows is however confirmed by looking at the core / periphery fit (0.90). The role of the core regions as attraction nodes for the exchange of knowledge among the whole network is shown by Map 4 where the graph is plotted over the European regional map. The density of the technological network around the core regions appears very high, but it is also evident the involvement of a large number of regions in the production and exchange of new knowledge.

4.3 Computers The last sector we analyse is the computers industry, which can be considered as one of the most innovative sector. As we have already seen in section 2, most of citations in this sector are directed (or come from) the United States. Therefore we must be particularly careful in interpreting the results, since we are now limiting our analysis to the knowledge exchanges between the European regions, which are only a small fraction of the total citations flows. The technological network includes 84 regions out of 147 and it appears geographically dispersed due to the presence of the Scandinavian area in the top performers (see Map 5). The average distance of the citations is 500 km, the highest value among the sectors considered. In Table 6 the list of the top 20 regions for innovative activity is reported. It is interesting to notice that South West in UK is the region with the highest number of citation made (449) but it shows relatively low values in term citation received (81) and patent (107). A specific research is required to understand why this region has such an abnormal degree of citation made per patent. Among the other regions, South East in UK has the highest number of patents (368) and also shows the highest degree of centrality since it is linked to several other regions: 47 as cited regions and 42 as citing regions. The highest number of citations received is shown by Ile de France signalling the great value of the innovative activity performed in this region. Let us now turn the attention to the analysis of the whole technological network. Freeman's general centralisation index is equal to 0.13 and 0.16 for citations made and received, respectively (see last rows in Table 6). This value is quite low and implies that the exchange of knowledge in the computer industry is quite diffuse among the European regions considered. The core / periphery fit (0.67) confirms the relatively decentralised structure of knowledge flows in this sector. Three regions appear to constitute the core of the technological network: South West and South East in UK and Ile de France (FR). These regions receive only 33% of total

citations and this reinforces the idea that the computer sector has a quite decentralised structure as it can also be perceived in the geographical representation of the technological network in Map 6.
5. Concluding remarks
In this paper we present new evidence on the characteristics of knowledge spillovers across the European regions based on a database on patents citations developed at the NBER which refers to patents granted by the US patent office over the period 1978-1997. From the NBER database we have first selected all patents originated from the European countries. Then, each patent has been attributed to a European region on the basis of the place of residence of the first inventor. We consider over 350,000 patents, which have generated over 1.3 million citations to European based patents. Since our aim is to examine the technological networks represented by the flows of citations, due to the enormous amount of citations available, we have restricted our analysis to three sectors chosen for their technological characteristics: shoes, drugs and computers. A first interesting result to be remarked is the high variability among sectors when the geographical directions of citations flows are considered. In the traditional shoes sector more than half of total citations are made to other European patents, while in the computers industry a large majority of citations are outside Europe. Moreover, as far as shoes and drugs are concerned a relevant part of citations are made within the same regions signalling the presence of concentration poles in the technological activity within limited areas. Other interesting elements come from the analysis of the exchange of technological information across sectors. In the most innovative sectors (drugs and computers) the technology is more complex and it is highly connected to innovations

coming from other sectors, while in the traditional sector the intra industry citations are prevalent. In order to asses both the spatial and network characteristics of these knowledge flows we have tried to combine methodological instruments developed within the Social Network Analysis and the Geographical Information Systems. Through the SNA we are able to identify, for each sector, a group of regions which act as junctions for the exchange of knowledge in the entire technological network. Moreover this methodology allows to evaluate the degree of polarisation of knowledge flows and thus the existence of a centre-periphery structure in the technological network. For the three sectors considered we have identified the core regions which function as attraction nodes for the exchange of knowledge among the whole network. For the shoes sector three regions (Veneto in Italy and Rhone Alpes and Ile de France in France) which receive 62% of total citations. In the drugs industry six regions (Ile de France (FR), South East (UK), Hessen, Baden Werttemberg and Nordrhein-Westfalen (DE), Nordwestschweiz (CH)) which make up 54% of total citations. Finally, for the computers sector three regions represent the core of the technological network (South West and South East in UK and Ile de France (FR)) but receive only 33% of total citations. It is also interesting to notice that the average distance of citations increases with the technological scope of the industry: in our empirical analysis it reaches the highest value in the high tech computers industry. Our results confirm the existence of significant differences across industrial sectors with respect to the patterns of technological networks and knowledge flows. More specifically, on the basis of Freeman's general centralisation index and the core / periphery fit, we have revealed that in the traditional sectors technological flows are relatively more spatially bounded and the degree of polarisation of the innovative networks is higher. On the other extreme, the computers

industry shows the lower degree of spatial concentrations: the knowledge exchanges can spill over longer distances because they are codified and thus less restricted to the local environment. These outcomes need to be confirmed by future research, in particular through the extensions of the analysis to other industrial sectors. Moreover, it may be interesting to see if the results are robust to the employment of different data such as citations of patents granted by the European Patent Office (EPO) which are expected to be less biased with respect to foreign citations.

References
Audretsch D. and Feldman M. (1996), R&D Spillovers and the Geography of Innovation and Production, American Economic Review, 86, 631-640.
Audretsch D. and Feldman M. (2004), Knowledge Spillovers and the Geography of Innovation, in Henderson J.V. and J.F. Thisse (eds.) Handbook of Urban and Regional Economics, forthcoming.
Balconi M. Breschi S., Lissoni F. (2002), Networks of inventors and the location of university research: an exploration of Italian data, CESPRI, wp n. 127
Borgatti, S. P., Everett, M.G. and Freeman, L.C. (1999), Ucinet for Windows: Software for Social Network Analysis, User’s Guide. Harvard: Analytic Technologies.
Borgatti, S.P., Everett, M.G. and Freeman, L.C. (2002). Ucinet for Windows: Software for Social Network Analysis. Harvard: Analytic Technologies.
Borgatti, S. P., Everett, M. G. (1999), Models of Core/Periphery Structure, available in internet site www.analytictech.com
Borgatti, et al. (1999),
Bottazzi L. and Peri G. (2003), Innovation and Spillovers in Regions: evidence from European Patent Data, European Economic Review.
Breschi, S. (2000), The Geography of Innovation: A Cross-Sector Analysis, Regional Studies, 34, 213-29.
Breschi S., Lissoni F. (2001a), “Knowledge Spillovers and Local Innovation Systems: A critical Survey”, Industrial and Corporate Change 10/4

Griliches Z. (1979), Issues in Assessing the Contribution of Research and Development to Productivity Growth, Bell Journal of Economics, 10, 92-116.
Griliches Z. (1990), Patent Statistics as Economic Indicators: A Survey, Journal of Economic Literature, 28, 1661-1707.
Hall B., A. Jaffe and M. Trajtenberg (2001), The NBER Patent Citations Data File: Lessons, Insights and Methodological Tools, NBER WP 8498.
Jaffe A. and Trajtenberg M, (2002), Patents, Citations and Innovation, Cambridge: The MIT Press
Jaffe A., M. Trajtenberg and R. Henderson (1993), Geographic Localization of Knowledge Spillovers as Evidenced by Patent Citations, Quarterly Journal of Economics,108, 577-598.
Krugman P. (1991) Economic Geography and Trade. Cambridge, MA: MIT Press.
Maskell P. and Malmberg A. (1999) Localised Learning and Industrial Competitiveness, Cambridge Journal of Economics, 23, 167-185.
Maurseth P.B. and B. Verspagen (1999), Knowledge Spillovers in Europe and its Consequences for Systems of Innovations, Aldershot: Edward Elgar.
Moreno R., Paci R., Usai S. (2003) Spatial distribution of innovation activity. The case of European regions, Contributi di Ricerca CRENoS, 03/10.
Paci R. and Usai S. (1999) Externalities, Knowledge Spillovers and the Spatial Distribution of Innovation, GeoJournal, 49, 381-390.

Paci R. and Usai S. (2000), Technological enclaves and industrial districts. An analysis of the regional distribution of innovative activity in Europe, Regional Studies, 34, 97-114.
Paci R. and Pigliaru F. (2002) Technological Diffusion, Spatial Spillovers and Regional Convergence in Europe, in J. R. Cuadrado and M. Parellada (eds) The European Monetary Union and Regional Convergence. Springer, 273-292.
Pavitt K. (1982), R&D, Patenting and Innovative Activities. A Statistical Exploration, Research Policy, 11, 33-51.
Scott J. (1991), Social network analysis : a handbook, London, Sage
Wasserman S., Faust K. (1997) Social Network Analysis, Methods and Applications, Cambridge: University Press

Appendix
A. Regional breakdown (number of regions in parenthesis)
Country NUTS level
Danimarca, Irlanda, Norvegia, Lussemburgo N0
Belgio, Germania, Paesi Bassi, Regno Unito N1
Austria, Finlandia, Francia, Grecia, Italia, Portogallo, Spagna, Svezia, Svizzera N2

B. Sectoral breakdown
Sector USPTO class Description 12 Boot and Shoe Making
Shoes 36 Boots, Shoes, and Leggings 424 Drug, Bio-Affecting and Body Treating
Compositions Drugs 514 Drug, Bio-Affecting and Body Treating
Compositions 708 Electrical Computers: Arithmetic
Processing and Calculating 709 Electrical Computers and Digital
Processing Systems: Multiple Computer or Process Coordinating
710 Electrical Computers and Digital Data Processing Systems: Input/Output
711 Electrical Computers and Digital Processing Systems: Memory
712 Electrical Computers and Digital Processing Systems: Processing Architectures and Instruction Processing (e.g., Processors)
713 Electrical Computers and Digital Processing Systems: Support
Computer
714 Error Detection/Correction and Fault Detection/Recovery

Table 1. Patents and citation across European countries 1978-97
Patents Citations originated Citations received
n. % n. % n. % Austria 6,633 1.9 37,700 1.8 20,425 1.6 Belgium 6,849 1.9 42,333 2.0 24,523 1.9 Denmark 4,143 1.2 25,785 1.2 14,104 1.1 Finland 5,800 1.6 37,131 1.8 17,318 1.3 France 53,632 15.2 309,295 14.8 194,476 15.0 Germany 139,445 39.6 786,103 37.7 501,836 38.7 Greece 196 0.1 1,328 0.1 469 0.0 Ireland 928 0.3 8,023 0.4 3,935 0.3 Italy 21,830 6.2 125,464 6.0 68,864 5.3 Luxembourg 492 0.1 2,938 0.1 1,416 0.1 Netherlands 16,681 4.7 98,592 4.7 66,173 5.1 Norway 2,310 0.7 15,472 0.7 7,102 0.5 Portugal 96 0.0 608 0.0 377 0.0 Spain 2,464 0.7 14,730 0.7 5,746 0.4 Sweden 16,120 4.6 106,859 5.1 61,594 4.7 Switzerland 23,886 6.8 141,224 6.8 90,624 7.0 United Kingdom 51,019 14.5 331,035 15.9 218,951 16.9 Total 352,524 100.0 2,084,620 100.0 1,297,933 100.0

Table 2. Patents and citation for selected sectors 1978-97
Shoes Drugs Computers
Patents Citations originated
Citation / patent
Patents Citations originated
Citation / patent
Patents Citations originated
Citation / patent
Austria 50 314 6.3 210 787 3.7 17 75 4.4 Belgium 2 13 6.5 473 1,705 3.6 26 174 6.7 Denmark 4 35 8.8 501 2,103 4.2 11 128 11.6 Finland 1 6 6.0 112 421 3.8 25 161 6.4 France 216 1,546 7.2 3,565 13,180 3.7 688 4,434 6.4 Germany 170 1,331 7.8 5,592 19,603 3.5 728 5,214 7.2 Greece 0 0 10 24 2.4 6 39 6.5 Ireland 1 5 5.0 51 399 7.8 26 247 9.5 Italy 285 1,795 6.3 1,668 5,403 3.2 126 804 6.4 Luxembourg 0 0 0 0 0 0 Netherlands 5 27 5.4 423 1,745 4.1 222 1,553 7.0 Norway 1 17 17.0 111 568 5.1 16 136 8.5 Portugal 0 0 7 12 1.7 0 0 Spain 7 54 7.7 215 596 2.8 3 27 9.0 Sweden 8 36 4.5 503 2,648 5.3 112 985 8.8 Switzerland 51 314 6.2 1,455 6,295 4.3 62 477 7.7 United Kingdom 79 429 5.4 4,403 20,688 4.7 738 9,389 12.7 Total 880 5,922 6.7 19,299 76,177 3.9 2,806 23,843 8.5

Table 3. Flows of citations made in selected sectors 1978-97 (percentage composition)
Shoes Drugs Computers Geographical flows within the region 17.4 20.4 3.4 in contiguous regions 2.6 3.9 1.8 within the nation 4.5 2.7 1.1 within Europe 29.0 18.9 8.2 in rest of the world 46.5 54.0 85.6 Total 100.0 100.0 100.0 Technological flows within the sector 87.7 66.9 56.6 other sectors 12.3 33.1 43.4 Total 100.0 100.0 100.0

Table 4. Shoes. Knowledge flows and technological network measures, 1978-97
NUTS Region Citations made
Citations received
N. regions cited
N. regions citing
Patents Ratio citations received/made
Citations made per
patent
Citations received per
patent n. rank n. rank IT32 Veneto 682 1 623 1 31 22 229 0.91 2.98 2.72 FR71 Rhone-Alpes 467 2 246 3 16 10 121 0.53 3.86 2.03 FR1 Ile De France 174 3 249 2 19 19 72 1.43 2.42 3.46 AT22 Steiermark 110 4 68 5 10 11 32 0.62 3.44 2.13 DE2 Bayern 107 5 143 4 22 21 78 1.34 1.37 1.83 CH05 Ostschweiz 72 6 64 6 11 10 21 0.89 3.43 3.05 UKF East Midlands 67 7 56 7 12 10 47 0.84 1.43 1.19 DE1 Baden-Wuerttemberg 48 8 55 8 16 17 33 1.15 1.45 1.67 AT13 Wien 37 9 11 16 9 5 10 0.30 3.70 1.10 DEB Rheinland-Pfalz 27 10 20 11 12 10 14 0.74 1.93 1.43 DEA Nordrhein-Westfalen 26 11 16 13 10 9 14 0.62 1.86 1.14 CH01 Region Iemanique 26 12 37 10 10 10 13 1.42 2.00 2.85 IT31 Trentino-Alto Adige 22 13 20 11 6 5 9 0.91 2.44 2.22 IT2 Lombardia 20 14 14 14 13 5 21 0.70 0.95 0.67 DE7 Hessen 19 15 6 21 11 5 15 0.32 1.27 0.40 DE6 Hamburg 19 16 12 15 6 7 4 0.63 4.75 3.00 CH04 Zürich 13 17 40 9 6 7 6 3.08 2.17 6.67 UKJ South East 10 18 10 17 6 6 11 1.00 0.91 0.91 UKG West Midlands 10 19 9 18 5 4 8 0.90 1.25 1.13 AT12 Niederoesterreich 9 20 4 26 3 2 5 0.44 1.80 0.80 Others 47 regions 99 99 110 1.00 0.90 0.90 Total (67 regions) 2,064 1802 873 0.87 2.36 2.06 Freeman's general centralisation index: citations made = 0.32; citations received = 0.31 Core / periphery fit: 0.90 Core regions (shaded area): Veneto, Rhone Alpes, Ile de France

Table 5. Drugs. Top 20 regions for number of citations, 1978-97
NUTS Region Citations made
Citations received
N. regions cited
N. regions citing
Patents Ratio citations received/made
Citations made per
patent
Citations received
per patent n. rank n. rank UKJ South East 4.685 1 3.544 1 71 74 2.791 0,76 1,68 1,27 FR1 Ile De France 2.887 2 2.360 2 72 74 2.291 0,82 1,26 1,03 DEA Nordrhein-Westfalen 2.417 3 2.267 3 61 67 1.717 0,94 1,41 1,32 DE7 Hessen 1.715 4 1.254 5 63 62 1.026 0,73 1,67 1,22 CH03 Nordwestschweiz 1.694 5 1.349 4 54 62 975 0,80 1,74 1,38 IT2 Lombardia 1.442 6 1.111 7 66 65 1.112 0,77 1,30 1,00 DE1 Baden-Wuerttemberg 1.349 7 1.223 6 55 60 983 0,91 1,37 1,24 UKD North West 1.257 8 975 8 50 54 566 0,78 2,22 1,72 DEB Rheinland-Pfalz 845 9 623 11 41 50 615 0,74 1,37 1,01 DK Danmark 800 10 667 10 47 53 501 0,83 1,60 1,33 DE3 Berlin 732 11 699 9 39 43 450 0,95 1,63 1,55 BE2 Vlaams Gewest 535 12 543 12 31 36 279 1,01 1,92 1,95 UKH Eastern 469 13 280 15 40 42 237 0,60 1,98 1,18 UKG West Midlands 403 14 148 25 28 20 156 0,37 2,58 0,95 DE2 Bayern 401 15 289 14 46 40 359 0,72 1,12 0,81 UKF East Midlands 389 16 371 13 45 40 243 0,95 1,60 1,53 FR71 Rhone-Alpes 315 17 146 26 46 34 191 0,46 1,65 0,76 NL3 West-Nederland 291 18 230 16 42 37 236 0,79 1,23 0,97 SE04 Sydsverige 288 19 207 18 30 31 163 0,72 1,77 1,27 CH01 Region Iemanique 266 20 205 19 40 40 142 0,77 1,87 1,44 Others 97 regions 5.485 3.895 4.266 0,71 1,29 0,91 Total (117 regions) 28.665 22.386 19.299 0,78 1,49 1,16 Freeman's general centralisation index: citations made = 0.16;citations received = 0.16 Core / periphery fit: 0.87 Core regions (shaded area): Ile De France, South East, Hessen, Nordrhein-Westfalen, Nordwestschweiz, Baden-Wuerttemberg

Table 6. Computers. Top 20 regions for number of citations, 1978-97
NUTS Region Citations made
Citations received
N. regions cited
N. regions citing
Patents Ratio
citations received/made
Citations made per
patent
Citations received
per patent n. rank n. rank UKK South West 449 1 81 7 24 15 107 0,18 4,20 0,76 UKJ South East 365 2 291 2 47 42 368 0,80 0,99 0,79 DE2 Bayern 339 3 226 3 36 35 327 0,67 1,04 0,69 FR1 Ile De France 323 4 349 1 45 43 359 1,08 0,90 0,97 DE1 Baden-Wuerttemberg 275 5 187 5 41 30 245 0,68 1,12 0,76 NL4 Zuid-Nederland 195 6 208 4 29 36 173 1,07 1,13 1,20 FR82 Provence-Alpes-Cote D'Azur 131 7 101 6 28 23 133 0,77 0,98 0,76 SE01 Stockholm 109 8 50 11 23 17 79 0,46 1,38 0,63 UKH Eastern 90 9 32 15 25 15 69 0,36 1,30 0,46 UKD North West 70 10 53 10 19 16 77 0,76 0,91 0,69 IT2 Lombardia 67 11 72 8 14 25 81 1,07 0,83 0,89 DEA Nordrhein-Westfalen 59 12 20 19 20 9 51 0,34 1,16 0,39 FR71 Rhone-Alpes 57 13 12 25 17 10 82 0,21 0,70 0,15 UKG West Midlands 50 14 57 9 14 18 44 1,14 1,14 1,30 UKM Scotland 34 15 14 24 18 11 38 0,41 0,89 0,37 NL3 West-Nederland 33 16 15 22 14 11 38 0,45 0,87 0,39 DE9 Niedersachsen 33 17 35 14 13 17 23 1,06 1,43 1,52 DE7 Hessen 32 18 47 12 13 14 29 1,47 1,10 1,62 IE Ireland 31 19 16 21 15 9 26 0,52 1,19 0,62 FR52 Bretagne 24 20 23 17 10 13 35 0,96 0,69 0,66 Others 64 regions 382 302 422 0,79 0,91 0,72 Total (84 regions) 3.148 2.191 2.806 0,70 1,12 0,78 Freeman's general centralisation index: citations made = 0.13;citations received = 0.16 Core / periphery fit: 0.67 Core regions (shaded area): South East, Ile De France, South West

Map. 1 - Shoes - Regional distribution of citations
Map 2. Shoes. Knowledge networks and core regions (citations originated)

Map. 3 - Drugs - Regional distribution of citations

Map 4. Drugs. Knowledge networks and core regions (citations originated)

Map. 5 - Computers - Regional distribution of citations

Map 6. Computer. Knowledge networks and core regions (citations originated)