innovation systems and development
TRANSCRIPT

Innovation Systems and Development
The Journey of a Beleaguered Nile Perch Fishery in Uganda

© Copyright Rose Kiggundu, Maastricht 2006 ISBN-13: 978-90-5278-580-6 ISBN-10: 90 5278-580-5 Productie: Datawyse / Universitaire Pers Maastricht
Maastricht Economic and social Research and training centre on Innovation and Technology

Innovation Systems and Development
The Journey of a Beleaguered Nile Perch Fishery in Uganda
PROEFSCHRIFT
ter verkrijging van de graad van doctor
aan de Universiteit Maastricht,
op gezag van de Rector Magnificus, Prof.mr G.P.M.F. Mols,
volgens het besluit van het College van Decanen
in het openbaar te verdedigen op donderdag 26 oktober 2006 om 12.00 uur
door
Rose Kiggundu
UNIVERSITAIREPERS MAASTRICHT
U P
M

Promotor
Prof. dr. Lynn K. Mytelka
Co-promotor
Prof. dr. Banji Oyelaran-Oyeyinka
Beoordelingscommissie
Prof. dr. Robin Cowan (voorzitter) Prof. dr. ir. Wiebe Bijker Prof. Joanna Chataway, The Open University, Walton Hall, Milton Keynes, UK

v
Acknowledgement
When I started this research and learning journey six years ago, I thought I was going to write some kind of report like I always did in my past working life with banks, non-government organizations and donor agencies. A couple of years and mentoring exer-cises later, not only did I find that the world of academia had a completely different set of principles defining its values and character but also that a dissertation had its own life. My children, family and I chose to adapt our lives to the many demands of this dissertation. The path was far from easy but we were all determined to keep going and I must say we enjoyed the rollercoaster ride. The list of people that made this undertaking possible is very long and it is impossible to acknowledge and express my gratitude to each of these people by name. Some helped by constantly praying for me. Others opened their doors when I knocked to ask for data and information. Some wrote me messages just to say they were thinking of me and wishing me well. Others arranged visas, sent documents and reminders of deadlines while others never tired of my endless requests for additional information. I am very grateful to the many people that assisted and I will now mention only a few names just to show the broad range of support underlying this work.. First, my deepest words of gratitude go to a woman who held my hand at a critical moment of my journey and has since become a dear friend, mentor and mother. Lynn K. Mytelka introduced me to the world of technology and development and agreed to be my promoter. She taught me how to analyse and write academic papers. She set the bar very high and linked me to many people in her networks. She always managed to prepare detailed comments on my drafts and in fact walked the entire journey of this thesis with me. I want to thank her for her confidence in me and untiring support. Second, I would like to extend my deep appreciation for the kindness and support provided by Banji and his family. Banji Oyelaran-Oyeyinka was not only my supervi-sor but also a great friend. He read and guided my work and provided useful com-ments. By enabling me to work as an assistant on some of his projects, he helped me to acquire wider and deeper knowledge on the subject of innovation. Professors Robin Cowan, Wiebe de Bijker and Jo Chataway examined my thesis and I would like to thank them for their effort and support. Dr. Henny Romijn at the University of Eind-hoven and Dr. Machiko Nissanke at the School of Oriental and African Studies (SOAS), University of London were initially identified as possible co-supervisors. They gave me excellent guidance, attended to me when I visited and gave me vital papers that eventually shaped and influenced the direction of my work.. Dr. Joy Clancy at the University of Twente examined my research proposal and initial chap-ters and I would like to thank her for her effort. Dr. Meine Pieter van Dijk at Erasmus University kindly shared an early draft of his influential publication on innovation and small enterprise in developing countries. Prof. Hubert Schmitz at the Institute of De-velopment Studies, University of Sussex, UK, Dr. Henry Sandee at the Vrije Uiversity in Amsterdam, Dr. Dorothy McCormick at the University of Nairobi, Kenya, Dr.

vi
Micheline Goedhuys at Leuven University in Belgium and researcher at UNU MERIT, Dr. Kaushalesh Lal and Dr. Louis Kasekende, a Deputy Governor at the Bank of Uganda and later, a Director at The World Bank in Washington D.C, served as readers of different chapters of my draft thesis and provided extremely helpful comments. Mr. Andy Manning provided editorial input. The RPED office and particu-larly Manju Shah at The World Bank in Washington D.C. shared The Bank’s 2002 RPED Uganda dataset and let me use it as part of my PhD studies. I am highly in-debted to all. The United Nations University, Institute for New Technologies (now part of the UNU MERIT) gave me a two year research grant. It also provided the supplies and office infrastructure that enabled me to work on this dissertation. My late professor, Charles Cooper is the one who encouraged me to join the PhD programme in the first place and together with Professor Luc Soete at MERIT, made it possible for the process to get started. I would like to register my deep appreciation for their efforts. Special thanks go to the old UNU INTECH crew for facilitating the journey in various ways. Prof. Rajah Rasiah and Dr. Andy Hall were always inspirational. I learned a lot from them and will always be grateful for their efforts to connect me to their networks at The World Bank. We also shared very many light and fun moments together includ-ing badminton games, meals and drinks that gave me renewed strength and vigour to continue in my pursuit. Andy Hall, Wangu Mwangi, Ann Kelledy and Marion Motari were always willing to help where they could and their excellent company made those Friday nights as good and memorable as they could get. My friend Jane Williams al-ways pushed and reminded me to deliver the goods. I occasionally had inspirational chats with Yvonne de Groot and Jacqueline van Kesteren and both ladies handled some of my business and messages whenever I was traveling. Raeleen Waasdorp (Rae) was very helpful in a number of ways. Because I habitually carried many heavy bags around, Yvonne even tolerated my continuous difficulty to open the automated front door. Ad Notten provided excellent and untiring library support. On many occa-sions, Marc Vleugels went an extra mile to facilitate my visa renewal processes be-sides responding to my financial requests in a very compassionate and prompt man-ner. Mourik Jan Heupink, the computer assistant always facilitated several things that enabled me to work from remote locations. Eveline in de Braek kept me on my toes so the administrative process of graduating would not slip. Martin Reed, Monique Raedts and others all assisted in many ways. To you all, I say thank you. Geoffrey Gachino, a fellow student and friend spent many cold evenings teaching me the A’s to Z’s of the mathematical techniques employed in the study of technical change. Samia Nour, Branca, Minh Dinh, Marion Motari, Bertha Vallejo, Fernando Santiago all made our student discussions and coffee breaks enjoyable. Daniel Dala-houn sacrificed his precious time to teach me French. Many colleagues from MERIT provided comments during seminars and I would like to acknowledge their contribu-tion. Corien Gijsbers and Silvana de Sanctis were instrumental in many ways and I would like to express my heartfelt gratitude to each of them. Back in Uganda, I would like to express my profound gratitude to Mr. Nsimbe-Bulega and to the entire management and staff of the Department for Fisheries Resources (DFR) for cooperating in all matters related to this study. My deepest appreciation goes to Mr. Ignatius Odongo and Ms. Rosette Birungi who were extremely patient and helpful during the difficult task of assembling data and information. Mr. Mukalazi

vii
Francis offered tremendous help and as a friend, went the extra mile to assist with fieldwork. I am also thankful to all of the other officers at the DFR who assisted in different ways. I am indebted to Dr. John Okidi, director of the Economic Policy Re-search Centre for having let me participate in a course that introduced me to STATA, the statistical software package I used in this study. The non-government organization CEEWA-Uganda provided me with office space, personnel and logistics during the many months I was in Uganda for fieldwork and I would like to express my heartfelt gratitude to the entire management, membership and staff for their support. It would not have been possible to complete this work without the cooperation and participa-tion of the very many key informants and respondents in and outside Uganda that par-ticipated in the study. I gratefully acknowledge and thank them all for their input. The people that have closely walked this journey with me will already know that without the incredible help and support received from my family, none of this would have been possible. Due to my constant traveling ,my sister Maria helped with many chores including taking Adolph to school. She consistently helped all three boys Ar-nold, Adrian and Ado in countless ways. Arnold took care of his siblings and their dad, Arthur provided excellent support. My maternal aunts, Rose and Sarah, cousins Eva, Kiyonga, Patricia, Nankya and Tendo all helped in several ways. In Uganda, my brothers David, Kasujja and Willy were untiring in dealing with my numerous re-quests. My dad sometimes engaged me in inspiring debates and often wanted to hear what my thoughts were on the direction Uganda’s economy was taking. He was al-ways fascinated by my remarks that unless Uganda realized the importance of invest-ing in a process of continuous innovation, it would be difficult to sustain the economic growth bubble of the 90s. He would then smile and ask how my children – his grand-children – were doing. Arnold, Adrian and Adolph Kawuba, we have braved this rollercoaster ride together and to you, my wonderful, wonderful children and the joy of my life, I dedicate this work.

viii
Contents
Chapter 1 Introduction............................................................................................. 1
1.1 The Theoretical Motivation....................................................................................................... 3 1.2 The Sectoral Focus ...................................................................................................................... 4 1.3 The Theoretical Argument......................................................................................................... 5 1.4 Research Objectives and Hypotheses................................................................................... 10 1.5 Outline of the Thesis ................................................................................................................. 11
Chapter 2 Explaining Innovation in a Developing Country Context....................... 15
2.1 Introduction ................................................................................................................................. 15 2.2 Technological Learning and Innovation in Developing Countries: The Literature . 15 2.3 The Innovation Systems Approach to the study of Innovation ..................................... 18 2.4 How Does the Innovation Systems Approach Compare with Other Approaches?.. 29 2.5 Issues in Applying the Innovation Systems Approach to Developing Countries..... 31 2.6 Building Testable Hypotheses................................................................................................ 33 2.7 Summing up................................................................................................................................. 43
Chapter 3 The Design and Methodology of the Study...................................... 45
3.1 Introduction ................................................................................................................................. 45 3.2 Instability and Reforms in Uganda........................................................................................ 45 3.3 The Failure to Develop Technological Learning and Innovation Capabilities.......... 48 3.4 The Choice of Uganda for the Present Study and Generalization of Research
Findings........................................................................................................................................ 51 3.5 The Sectors Chosen for Research.......................................................................................... 52 3.6 Research Methodology............................................................................................................. 54
Chapter 4 Defining the Factors and Subsystems Important for Innovation............ 65
4.1 Introduction ................................................................................................................................. 65 4.2 Firm-level Studies of the Factors Influencing Innovation Activities........................... 66 4.3 The Dependent and Explanatory Variables......................................................................... 67 4.4 The Statistical Model Adopted for Data Analysis ............................................................ 72 4.5 Description of the Data............................................................................................................. 73 4.6 Results of the Regression Analysis ....................................................................................... 75
Chapter 5 Case Study Analysis of the Factors Important for Innovation................ 87
5.1 Introduction ................................................................................................................................. 87 5.2 Firm Characteristics and Market Performance Trends: An Overview ........................ 88 5.3 Evaluation of Firm-level Improvements: Results of a Rating Exercise...................... 82 5.4 Case Studies.............................................................................................................................. 102 5.5 Summing up.............................................................................................................................. 115

ix
Chapter 6 How did the important subsystems fit together?.................................. 119
6.1 Introduction .............................................................................................................................. 119 6.2 The Institutional and Organizational Set-up of Key Subsystems: The Old ............ 120 6.3 Learning to Change: The New Institutional and Organizational Set-up.................. 125 6.4 Summing up.............................................................................................................................. 149
Chapter 7 Other Food-Processing Systems of Innovation in Uganda:
A comparative Assessment1............................................................ 151
7.1 Introduction .............................................................................................................................. 151 7.2 Learning and Innovation Activities Introduced by the Control Group..................... 152 7.3 The Control Group Firm-Level Subsystem: A Descriptive Overview..................... 154 7.4 The Subsystem Promoting Knowledge Generation, Accessibility and Learning.. 159 7.5 The Subsystem Mediating Market Institutions across Systems in the Control
Group ......................................................................................................................................... 165 7.6 Practices of the Bank and Non-Bank Financial Subsystem in relation to the
Characteristics of the Control Group................................................................................. 166 7.7 Synthesis.................................................................................................................................... 178
Chapter 8 Conclusions and Policy Inferences....................................................... 181
Samenvatting ............................................................................................................ 191
Appendix 1: Description of the data ........................................................................ 197
References ............................................................................................................ 199
Curriculum Vitae ......................................................................................................... 207

x

1
Chapter 1 Introduction
This thesis contributes to the growing menu of ideas on innovation systems-building in developing countries. It provides a positive and interesting example of how a tech-nologically weak industry in sub-Saharan Africa (SSA) successfully responded to global changes in technological and competitive conditions and hence departs from the implicitly bleak picture often portrayed in contemporary associated literature. The findings examined in the thesis emanate from our research into the Nile Perch (Lates Niloticus) fish processing and exporting industry in Uganda and its success in intro-ducing technological change, learning and innovation processes. The results of this examination provide reasonable evidence to support the notion that the likelihood for firms to undertake intense learning and innovation activities is high where suitable ‘institutional’ change, relationships and flows of knowledge emerge within an innova-tion system In the late 90s, the European Union (EU) imposed a set of Sanitary and PhytoSanitary (SPS) standards on Uganda’s fish exports. This led to a conditional ban of one of Uganda’s important exports when the country’s fish processing and export industry was unable to meet the new exporting requirements. Consequently, the industry was plunged into a hard-hitting export crisis and for a prolonged period fish processing firms were locked out of their biggest and most lucrative export market. Export reve-nues fell at a time when revenues from traditional commodity exports (coffee in par-ticular) were also falling. Fish processing plants were forced to close in order to re-structure. Jobs were lost and fishing communities lost their main source of livelihood. All this created a new form of pressure for technological upgrading. In response, Uganda’s fish processing and exporting industry successfully engaged in learning and innovation activities, changes that resulted in substantial gains for Uganda’s economy. The focus of this thesis is upon explaining the ability of Uganda’s fish processing and exporting industry to learn and innovate in a typical developing country setting. We attempt to answer the following two questions:
• What was the nature of the response following the EU ban(s) and how can we explain such a response?
• What factors explain the ability of Uganda’s fish processing and exporting industry to learn and innovate and how do these factors interact with each other to affect innova-tion?
Answering these questions provides, we believe, some useful insights into the factors that influence innovation activities and therefore how technological learning and in-novation processes can be promoted and supported in a developing country context.
In developing African countries, we still have very limited empirical knowledge and policy guidelines of how the innovation process can be stimulated and supported. As-sessments exist but are either not comparative or do not necessarily focus on innova-

2
tion processes as a systemic phenomenon. Some have only focused on the innovative behavior of firms in Africa following the introduction of liberalized markets in the 80 and 90s1. Much of this research casts a negative and often gloomy picture. For exam-ple, in the aftermath of liberalization, most African-owned enterprises were either ‘withdrawing from the exposed parts of their manufacturing activity or from manufac-turing entirely’ (Lall, 1999: 238). In Zimbabwe, the predominant response of firms was rather passive. Firms tended to adjust to lower sales, retrench staff or simply re-duce costs by postponing expenditures using lower quality inputs to compete on the basis of price (Latsch and Robinson, 1999; Helmsing, 2001). Others switched from tradable to non-traded products to avoid the competition (Lall, 1999). For a majority, no effort had been made to upgrade quality, skill levels and general technological ca-pabilities. The smaller and technologically weaker firms were not aware of or were incapable of attenuating the effects of their technical skill constraints and invested lit-
tle in employee training due to resource initiation. Equipment was often old and per-
sonnel with skills to use such equipment were lacking. With the exception of a few foreign affiliates, firms in SSA had few technology-licensing arrangements and the flow of FDI (Foreign Direct Investment) was slow. Both large and small firms were isolated from technology support institutions, which were weak to begin with. The picture was, however, not uniformly bleak. In Ghana, Steel and Webster (1991) had already found considerable differences in the post-liberalization performance of small firms. While firms in some sectors made some technological improvements, others simply stagnated. Overall, some critical scholarly attention has been given in the past to the study of the abilities of firms in SSA and has generated useful insights into their innovative behav-ior following market liberalization. Much of this research has, however, not consid-ered the response to pressures other than those associated with liberalized markets, which leaves research, policy and development agencies with limited guidance on how technological learning and innovation processes actually come about and how they can be promoted. It is important to address this gap in the literature particularly because the often grim and negative innovative response to liberalized markets has tended to form the baseline for what is understood as the typical African response to changes in technological and competitive conditions. Much of the available research also focuses on the firm rather than the collective capacity of a system of actors to re-spond. We provide a somewhat different analysis and focus on a different form of pressure by examining the response of Uganda’s fish processing firms to the enforce-
1 See Biggs, Shah and Srivastava (1995); Biggs and Raturi (1998) and others in the RPED series. Since the mid 90s, The RPED program of The World Bank has produced a set of studies examining firm-level technological capabilities, and technical efficiency/firm productivity in the context of liberalized markets. The central question asked was whether African manufacturing firms had the technological capability to deal with the rigors of import and export competition. That is, if formerly protected activi-ties were basically inefficient, would new dynamic manufacturing firms emerge in the new environ-ment to take their place? The sectors studied included textiles and garments, food processing, wood-working, and metalworking in Ghana, Kenya and Zimbabwe. Detailed case studies were also con-ducted to compare technological capabilities among firms focusing on their investment capabilities, production capabilities and learning mechanisms. Primary data was collected through two prior surveys in the same 3 countries; Ghana, Kenya and Zimbabwe. The second round of RPED studies conducted in the early 2000s has since included additional countries in Africa thereby generating panel and cross-sectional data spanning a number of topics in the enterprise development, learning and innovation arena. This work is important because very few other studies have generated such a rich dataset including technology-related variables across various firm sizes, sectors, and countries in sub-Saharan Africa.

3
ment of SPS imposed by the EU and explain, from an innovation systems perspective, why the response was not as bleak as might have been predicted.
1.1 The Theoretical Motivation
In contrast to the conventional economic models that viewed innovation as a linear process driven by the supply of research and development (R&D), contemporary ap-proaches have highlighted its non-linear nature and dynamics. They view innovation processes in more systemic, interactive and evolutionary terms, a view that has come to be known as the innovation systems approach. Innovation systems scholars are ‘centrally focused on technological innovation and, in addition, all are interested in organizational and institutional change’ (Edquist, 1997:10). The policy perspective is emphasized and ideas about broadening the approach to contribute towards systems building and policy making in Africa are growing (Mytelka, 2000, 2003; Oyeyinka, 2003). The innovation systems approach provides the analytical framework for this study. However, it is observed that the approach is evolving and as yet, not considered a formal theory of innovation. It is therefore possible that some might question the theo-retical basis of our study. Suffice it to recount that even though the innovation systems framework is not yet considered to be a formal theory, it is inspired by several strands of established theory and hence provides a solid basis for research. The strands of the-ory are several and they include systems theory, institutional economics and, innova-tion theories, particularly theories of interactive learning and evolutionary economics.
‘As an alternative to understanding technical change to be a result of seeking to maximize profits, Nelson and Winter propose that it can be understood as an evolutionary process (Nelson and Winter, 1977, 1982; Nelson, 1987, 1995b)….The technologies that are developed are only superior in a relative sense, not optimal in an absolute sense, and the system never reaches a state of equilibrium. Technological change is an open-ended and path-dependent process where no optimal solution to a technical problem can be identified’ (Edquist, 1997:6).
Innovation systems analysts are increasingly associating the innovation systems ap-proach to evolutionary theories (Edquist, 1997; Saviotti, 1997; Andersen and Lund-vall, 1997). Edquist writes:
‘Not only is the systems of innovation approach compatible with evolutionary theories of innovation but there is a close affinity between the two.…[T]heories of interactive learning, together with evolutionary theories of technical change constitute origins of the systems of innovation approach’ (Edquist, 1997: 6-7).
Hence, even though the theoretical thrust of the present study is not evolutionary eco-nomic theories or institutional economics theories or even systems theories as such, it is observed that all form an important foundation for the innovation systems frame-work upon which this study is based. It is also observed that while the approach has diffused rather rapidly across the OECD, European Commission and some United Na-tions agencies such as UNCTAD (Lundvall et al., 2002), arguments for its relevance for policy making in the developing world, particularly in Africa, have emerged only

4
recently (Mytelka, 2003). Nevertheless, its adoption is increasing in the African pol-icy arena as we can see in the following quote:
“The first NEPAD [New Partnership for Africa’s Development] Ministerial Conference on cience and Technology called on the NEPAD secretariat to initi-ate activities that would generate an African Innovation Outlook (AIO), that is, a comprehensive profile or survey of the innovation landscape. It further agreed to promote the application of a national system of innovation (NSI) framework and methodology to guide and inform policy-making. As a basis for an AIO and its use by African leaders to benchmark the innovative performance of their coun-tries, identify common problems and search for regional solutions, two distinct, but complementary surveys, one on science and technology and a second on in-novation were designed”(UNU-INTECH, 2004:8)2.
We should perhaps mention that as a source of experience and learning for the present study, we could find only very few empirical examples of innovation systems studies focused on Africa. Yet it is Africa where the need to apply the innovation systems concept ‘ex-ante’ (Arocena and Sutz, 2000) for ‘system building’ (Lundvall et al., 2002), but also ‘ex-post’ for explaining the emergence of systems is perhaps greatest. The NEPAD surveys are therefore expected to open up a process of empirical re-search necessary to fill the void in innovation-related data and information availabil-ity.
1.2 The Sectoral Focus
There is variation in the way the systems of innovation approach is applied. We should therefore clarify that even though we perceive an industry [or in policy terms, a sector], as an innovation system, our analysis is not based upon the concept of ‘sec-toral systems of innovation’ in the sense developed by Breschi and Malerba (1997). Rather, our approach derives from what Mytelka has called ‘sector-based systems’. She writes:
‘…Reconceptualising [economic] sectors as innovation systems and embedding them within the broader national system of innovation opens a multitude of new opportunities to identify and strengthen knowledge bases that are common to several sectors, to build linkages across these sector-based systems and to iden-tify critical actors and the nature of their interactions in local sector-based sys-tems using detailed comparative analysis (Mytelka, 2003:38).
Many scholars insist that the ‘national’ matters because country-specific ‘institutions’, support systems and national level policies are important and they differ in important ways (Lundvall et al., 2002). Others argue for a broadening of the ‘national’ system of innovation perspective to include the ‘dynamics of industrial, technological and insti-tutional change at the global level’ (see Mytelka 2003: 38 for example). In our view, the focus on sector-based systems allows a focus on specific economic sectors while opening up the analysis to out-of-country actors, processes, regional or global trading arrangements and regulations of relevance to the study of that particular sector-based system. At the same time, focusing on sector-based systems permits an anatomy of
2 This study was developed and concluded by a team of researchers led by Professor Lynn Mytelka

5
both the national policies common to several sectors in addition to the sector-specific policies within which the sector-based systems are embedded. In other words, a focus on sector-based systems situates sectors within the national as well as the global envi-ronment. Thus, since a focus on sector-based systems does not deny the importance of both the ‘national’ and the ‘global’, it is beneficial because it yields more sector-specific material for policy making and learning given that history, demand factors, size composition and other characteristics of sectors differ (Pavitt, 1984). In particular, we find the idea of examining sector-based systems of innovation around products3 as a good entry-point to the anatomy of these systems especially in agro-based developing countries whose economic sectors are organized around a few agricultural commodities and related agro-products. Hence, this study looks at innova-tion systems through the lens of one or a set of related products that we can associate with particular industries (sectors). In focusing on sector-based systems, we concen-trate on the relations between all elements and factors in the system as our unit of analysis. From this perspective, one can talk of a livestock innovation system, fish farming innovation system, fish-processing innovation system, meat products innova-tion system, fruit-processing innovation system and so on. Together, all these innova-tion systems constitute systems of innovation – in plural. Our methodological choice to compare the fisheries innovation system with other food-related innovation systems illustrates the possibilities available to research and policy makers in trying to under-stand the differences between systems and various ways by which innovation proc-esses can meaningfully be supported.
1.3 The Theoretical Argument
In common with other studies inspired by the innovation systems framework, the con-cept of ‘institutions’ is central to our approach and because there is variation in the meaning attached by different authors to the term ‘institutions’, it is important to be-gin by clarifying what the concept denotes in this study. ‘Institutional economists usually adopt the sociological meaning of institutions as the things that pattern behavior, e.g. routines, norms, shared expectations, morals, etc - including certain ground rules for economic behavior often referred to as property rights. …North offers several explicit definitions of the concept of institutions which slightly differ from one another: Institutions are the rules of the game in society or, more formally, are the humanly devised constraints that shape human interaction… (North 1990:3)…Institutions are the humanly devised constraints that structure politi-cal, economic and social interaction. They consist of both informal constraints (sanc-tions, taboos, customs, traditions, and codes of conduct), and formal rules (constitu-tions, laws, property rights) (North, 1991:97). [Drawing upon some of the ideas of-fered by the instutionalists, Edquist and Johnson define institutions as]…‘sets of common habits, routines, established practices, rules or laws that regulate the relations and interactions between individuals and groups’ (Edquist and Johnson: 43, 45, 46).
3 See methodology notes developed by Lynn Mytelka and, Andy Hall’s material in relation to the em-pirical studies directed by the United Nations University, Institute for New technologies (UNU-INTECH), Maastricht The Netherlands, on behalf of the Technical Centre for Agricultural and Rural Co-operation ACP-EU(CTA), 2004

6
In a number of important ways, the ‘fairly open’ definition of institutions offered by Edquist and Johnson (1997), their taxonomy and ideas on the function of institutions and institutional change in relation to innovation, have provided several conceptual clues for tackling our research problem and thus influenced the chosen direction of analysis. We have also adopted their definition of institutions as common habits, rou-tines, established practices, rules or laws that regulate relations and interactions be-tween people while organizations are understood as actors, players or ‘formal struc-tures with an explicit purpose’ such as business associations, international develop-ment agencies, universities, banks and so on. In their discussion of the relationship between organizations and firms, they write:
‘…[S]ome organizations are directly responsible for creating institutions. There are, for example, ‘dedicated’ standard-setting organizations which formulate or determine technical standards, which, in our sense of the term, are institu-tions…’(Edquist and Johnson, 1997:60).
Following this example, this study shall include standards as part of the concept of institutions and therefore consider a change in Sanitary and PhytoSanitary standards, to represent an ‘institutional change’. The particular set of standards that concern us in this study relate to food safety and agricultural health standards or what is commonly referred to as Sanitary and PhytoSanitary standards. The study makes a distinction between firm and non-firm organizations (intermediaries) and the reason for doing this is that some of the features that define competences of firms such as size, owner-ship, market orientation and others are more appropriate when referring to firms than to international development agencies and other public-sector support organizations for example. The view from the innovation systems literature, that institutions can have a support-ing and retarding effect on innovation, is enlightening and is applied to the analysis conducted here. We also adopt the institutionalist view that because markets are or-ganized and institutionally embedded in practice, they cannot also be pure. This view of markets as institutionally embedded and supported is a key starting point of the ar-gument presented by this thesis. We view the concept of demanding markets in insti-tutional and innovation systems terms and claim that what distinguishes demanding markets from less demanding ones is the balance between, what Edquist and Johnson (1997) have called ‘hard’ and ‘soft’ institutions governing transactions in those mar-kets. ‘Hard’ institutions such as the strict policing of the EU SPS standards, serve to strengthen the quality of demand thereby substituting for weakly formulated users’ demand. Such standards can therefore be viewed as institutions potentially useful for augmenting markets. They do this by strengthening and articulating users’ needs and demands and ensuring that these new demands are complied with. This additional pressure emanating from markets not only boosts the quality of demand, but also as-sists producers to discontinue older rules, habits and practices that may no longer be desirable for learning and innovation. In this way, they serve as forces assisting to bring about institutional change. We use the concept of institutionally-augmented markets to capture this effect of standards. Standards can also have a negative effect by acting as a barrier to smooth economic exchange especially where producers only have weak incentives or competences to cope and positively respond to new pres-sures, emanating from institutionally-augmented markets. In the case of most devel-oping countries, institutionally-augmented markets would have to be accompanied by

7
interventions that strengthen the technical and organizational competences of produc-ers to positively respond to this more intense pressure. Access to relevant bases of knowledge, inputs and services, interaction, technical assistance, and learning capa-bilities would all have to be improved. An attempt is made through the present study to track the role of this specific set of institutions (standards) by comparing innovation systems - with and without - institutionally-augmented markets. In our specific case, the comparison between the Nile Perch fisheries system, predominantly export-oriented and serving institutionally-augmented markets, with other food-processing systems serving relatively less institutionally-augmented domestic markets contributes to a better understanding of the role that institutionally-augmented markets play in learning and innovation processes. We shall argue that standards are an important set of institutions that help define innovation systems especially in contexts where pre-vailing market institutions are simply too weak to generate continuous learning and innovation pressure. The thesis discusses empirical evidence from Uganda in support of this general statement. One of the contributions made by this study is to confront the hypotheses within the evolving innovation systems framework with empirical data. For example, by con-ducting an empirical examination of specific ‘institutional’ changes – in this case – the imposition of the EU’s Sanitary and PhytoSanitary standards, the overall response and the role played by various organizations to deal with this institutional change, the study generates material in support of some of the ideas formulated by innovation sys-tems advocates. It also tracks the factors shaping competences at the level of the firm and connects this firm-level analysis to a scrutiny of the collective capability of a sys-tem of actors. This allows a broader anatomy of innovation systems and does so in the context of a typical developing country where we still know very little of the function-ing of innovation systems. In this thesis, these issues are addressed with reference to the fisheries sector in Uganda and the Nile Perch processing and export industry in particular. What moti-vated such a study in a country like Uganda? The main motivation was the need to investigate what actually happened within Uganda’s fish-processing sector following a series of export bans placed upon the industry in the 1990s. Recent documentation on Uganda’s fisheries had mentioned a number of operational improvements but this tended to be done in a very broad manner with very little detail about the nature of changes fish-processing firms had introduced. Explanations of why such changes were possible in a country like Uganda were largely missing. Crucially, the few ana-lytical studies of the fish export crisis had concentrated on the important but often anxious view of Sanitary and PhytoSanitary standards as a non-tariff trade barrier. While it is all very well to interrogate, in hindsight, what the ‘true reasons’ were for the imposition and enforcement of the EU SPS, there is a danger that the positive out-come of Uganda’s export crisis in the late 90s remains obscure and easily dispensed with. The concern of this study is with one particular set of outcomes. These are the learning and innovation processes observed within the industry in the aftermath of the Sanitary and PhytoSanitary standards imposed and enforced by the EU on Uganda’s fish exports. Crucially, the government, international development agencies, the fish processors association and private firms all worked very closely and swiftly to rescue the indus-try. Fish processing firms jointly explored solutions through the fish processors asso-

8
ciation. New arrangements between processing firms and their suppliers were intro-duced. Buyers of Nile Perch in Europe formed an association that served as an infor-mation broker between the fish processors in Uganda and the European Commission in Brussels. A few of these buyers supported their suppliers in Uganda to comply with the EU rules while others did not. Interestingly, the joint search for solutions extended well beyond producers (fish processing firms), their suppliers and buyers. University departments combined efforts to develop and jointly deliver a new training course in fisheries and aquaculture. International development agencies participated in this ef-fort too. Government departments and other providers of technical assistance intro-duced joint ways of delivering services to fish processing firms. There was another joint effort between government, international development agencies, fish-processing firms and boat builders to upgrade fish collection boats and fishing canoes. In relation to Uganda, the EU fish import ban(s) started late in 1996 and spanned the period 1997-2000 (October). In Table 1, we see that export values dropped from US$ 39 million in 1996 to a low of US$ 28 in 1997, rose to US$ 29 in 1998 and were about US $ 34 by the year 2000. There was a sharp increase in the value of exports after the ban was lifted in October 2000. Their value rose from US$ 34 million in 2000 to US$ 79 million in 2001 and even higher to about US $ 88 in 2002. While we might associate the increase in value between the year 2000 and 2001 with higher export quantities as indicated in Table 1, this does not appear to be the only reason because data in the same table also indicate that the export quantity fell from 28 thousand to 25 thousand tonnes between 2000 and 2001 but the value still in-creased from 79 to 88 million US Dollars. The ratio between value to quantity of fish exports increased from 2.8 in 2001 to about 3.4 in 2002. It was maintained at 3.4 in 2003 in spite of declining export quantities. We took into account the possibility that the observed increase in unit values could be due to an increase in prices. We, there-fore, compared the average unit values of Ugandan fish exports with those of the rest of the world. Using data (FAOSTAT) from the Food and Agriculture Organization (FAO) of the United Nations, we found a similar trend in Kenya and Tanzania, the two close competitors that share Lake Victoria with Uganda.

9
Table 1: Changes in Uganda’s fish exports
Quantity
(tonnes)
Value
(US $ in 000s)
Ratio: Value to
Quantity of fish
exports
Fish exports as
Percentage of
Non-traditional
Exports
1991 4,751 5,309 1.1 12
1992 4,831 6,451 1.3 20
1993 6,037 8,807 1.5 13
1994 6,563 14,769 2.3 11
1995 12,971 25,903 2.0 12
1996 16,396 39,781 2.4 17
1997 9,839 28,800 2.9 13
1998 11,604 29,733 2.6 22
1999 13,342 36,608 2.7 18
2000 15,876 34,363 2.2 16
2001 28,153 79,039 2.8 28
2002 25,525 87,945 3.4 31
2003 25,111 86,343 3.4 n.a.
Source: Department for Fisheries Resources (DFR), Uganda; Statistical Abstracts 1996, 2001, 2002 by Uganda Bureau of Statistics
From the FAOSTAT data, we also noted that while the average unit value of chilled fillets was more or less the same for the rest of the world (fluctuating close to US$ 3000 per tonne), the unit value (in the early 90s) of chilled fillet exports from all the three countries sharing Lake Victoria was significantly lower than the worldwide unit value. Between 1995 and 1997, the worldwide unit value (chilled fillets) and that of Lake Victoria exports almost converged. Thereafter, the unit value of chilled Nile Perch exports from the three countries declined due to the restrictions placed on these exports especially in the period 1997-2000. After the year 2000 and despite a more or less stable unit value worldwide, the unit value of Nile Perch fillets recovered to their pre-EU-restrictions level. Similarly, and despite on-going problems with raw-material (fish) supplies, the unit value of frozen exports from Tanzania and Uganda4 increased sharply after the year 2000 compared with the generally stable trend of comparable fillets
across the rest of the world. It was therefore concluded that the observed increase in value had to do with the acquisition of more knowledge and a greater ability to under-take processes necessary for producing and exporting higher quality fresh(chilled) and frozen Nile Perch fish products to the more remunerative EU markets. It is the unprecedented nature of the fish export crisis and the subsequent response, the empirical gaps identified by innovation systems scholars, and a dearth of auspicious learning and innovation experiences from Africa that prompted our investigation. Our interest was to understand and explain how and why the industry succeeded in intro-
4 The two countries for which comparable data is available

10
ducing processes of learning and innovation critical to its ability to re-enter the EU market. An inquiry into how fish-processing firms had coped with and survived the EU ban(s) would not only provide a better understanding of whether or not they had stimulated technological improvements, but also shed more light on the kind of condi-tions necessary for learning and innovation to occur within the context of an African developing country. We chose the innovation systems framework because of its ability to accommodate economic, social, political, and cultural dimensions in the analysis of the factors that shape and influence innovation processes. Such an approach would allow a compre-hensive and integrated analysis of the factors underpinning the introduction of innova-tion activities by Uganda’s fish processing and exporting firms in response to the im-position of sanitary standards by the EU. At the same time, the comparisons with other related food-processing industries where key conditions for innovation were ab-sent, would provide us with good empirical material to analyze the factors that influ-ence innovation from a developing country context. Additionally, it would provide an opportunity to test the empirical evidence against the innovation systems literature.
1.4 Research Objectives and Hypotheses
In explaining the ability of Uganda’s fish-processing industry to learn and innovate, we take the view that a fuller explanation of innovation activities and abilities of in-novation systems requires that we include in the analysis, the factors influencing firm-level competences and the complex relations between these, and the broader institu-tional and organizational set-up within which firms are embedded. We consider these firm-level factors not as the end of the analytical journey but as pointers that help de-fine key aspects and subsystems of the innovation systems to be assessed in greater detail. It is our contention that the integration of analytical approaches for firm-level behavior and competences into innovation systems research sharpens the analytical principles and explanatory power that the innovation systems approach provides. The key research problem addressed is to explain how and why Uganda’s fish proc-essing and exporting firms in Uganda introduced innovation activities in response to the imposition of sanitary standards and their enforcement by the EU. Within this con-text, the thesis concentrates upon examining the following hypotheses and sub-hypotheses and in doing so, attempts to fulfill the objectives outlined below. Research Objectives:
The study set out to:
a) Explain the nature of response to Sanitary and PhytoSanitary stan-dards imposed and enforced by the EU on Uganda’s fish exports
b) Explain the factors and relationships which might have driven the
learning and innovation process in the fish processing industry
The main hypotheses are the following:
1. The workers' education level, the size of the firm, access to technical assis-tance, market-orientation to more or less demanding (institutionally-

11
augmented) markets, the firms’ financial gearing position, and ‘institutions’ (beliefs, habits, practices) all significantly influence firm-level competences and are therefore important for innovation processes.
2. There is a significant difference in the intensity of innovation activities be-
tween the firms/ industries serving institutionally-augmented markets and those serving the less institutionally-augmented markets. Thus, one of the fea-tures defining differences in the performance of innovation systems is the quality of markets, that is, the degree to which markets are institutionally-augmented.
3. The likelihood for developing country firms to undertake intense learning and
innovation activities is high where suitable ‘institutional’ change, relationships and knowledge flows emerge within an innovation system. The intensity of the learning and innovation activities is shaped by the interaction between the in-stitutional and organizational set-up and dynamics of the key subsystems for learning plus the competences at firm level.
This study should be of particular interest to actors and students of innovation and de-velopment for a number of reasons. First, it provides an interesting example of how technological change, learning and innovation processes might be introduced and dif-fused in technologically lagging sectors and countries. Secondly, the export orienta-tion of Uganda’s fish-processing industry to markets where the ‘institutional’ set-up is remarkably different (from that of domestic markets) provides an opportunity for comparative research to examine how differences in the quality of markets interact with other factors to affect learning and innovation processes. Thirdly, the study pro-vides some exemplary material for an empirically-based study to test some of the hy-potheses generated by the innovation systems approach, especially in a developing country setting.
1.5 Outline of the Thesis
The rest of this volume is structured as follows. Chapter 2 presents the analytical framework used to explain innovation activities in a developing country context. It is based on the innovation systems concept which is already elaborated in a large and growing literature. The chapter starts with a review of the theoretical and empirical literature and defines some key concepts. In the last part of the chapter, the hypothe-ses constituting the broad argument presented by this thesis are sketched. In Chapter 3, we describe the overall design of the study and elaborate the research methodology. Before justifying the choice of Uganda and the possibilities for gener-alization of the research results, we begin by describing the country’s economic and political history. Its impressive economic record from a prolonged economic and po-litical rupture is discussed observing that the laudable macro-economic conditions were not accompanied by efforts to build local learning and innovation systems, a failure that exposed the fragility of Nile Perch fisheries exports to changing techno-logical and competitive conditions. In order to identify what was present for learning and innovation activities to occur in the Nile Perch fisheries system and what was ab-sent in comparable systems within Uganda, the last part of the chapter provides an overview and details of the methodology used for this comparative assessment.

12
Statistical analysis was conducted to identify the factors and subsystems important for innovation and therefore the boundaries of the system to be examined in greater de-tail. This is the subject of Chapter 4 but we should hasten to add that only basic statis-tical analysis is conducted largely because a basic analysis is adequate for our pur-poses. For this reason, we do not explore causal inferences from the data or attempt to conduct sophisticated statistical tests. Instead, we adopt the standard basic tools of data analysis to hypothesize that where some variables, or all of them, are present, there is a chance that a firm engages in intense innovation processes. The eventual realization of intense innovation processes is after all obscure as it is far from obvious that even where a chance exists, intense innovation processes will be introduced. Hence, we use regressions simply as a heuristic device to indicate the relative influ-ence of each of the hypothesized explanatory factors and associated subsystems on the probability of intense innovation activities. The analysis is undertaken using firm-level data from two sources. The first is our own survey of food-processing firms in Uganda (57 firms) including the 9 fish processing firms that survived the restrictions imposed by the EU. This survey was conducted in 2002. The second source is RPED5 data (300 firms) on Uganda assembled by The World Bank in 2002. The RPED data-set spanned 9 different sectors and served as a useful mechanism for triangulation in addition to providing much broader insights into the factors important for innovation. The thrust of this whole chapter is upon the identification of the factors and relations important for innovation and the subsystems they are related to. It is these factors, as-sociated subsystems and relationships that help to focus the anatomy of the innovation systems researched. The chapter tests some of the hypotheses outlined in the theoreti-cal chapter (Chapter 2) and establishes the difference in the intensity of innovation activities between fish processing and other food-processing firms. Through firm-level case studies drawn from Uganda’s fish processing industry, the next chapter (5) provides an in-depth analysis of the aggregate results obtained in chapter 4. The factors previously identified as important for innovation are discussed in relation to the intensity of innovation activities as well as the significance (or profi-ciency) of the changes introduced. We consider the characteristics and performance of the nine (9) fish-processing firms that survived the ban and the firms that exited the industry. This is followed by an introduction of the indicators used to qualitatively rate the significance of the changes introduced by the survivors. To proceed, cases are presented discussing how the various classes of fish-processing firms coped with the ban, how they learnt to innovate, what changes they made and who made them, the significance of the changes introduced (as judged by fisheries scientists in Uganda), and what role the various factors played in all this. Following the detailed examination of the firm-level subsystem, our interest in Chap-ter 6 is to examine the conduct and character of the other important subsystems, how they succeeded or failed in their own learning process and how this might have rein-forced or limited the broader learning and innovation process within the Nile Perch fisheries system. The first section takes a historical perspective to discuss Uganda's fisheries system before the export crisis. A description of the crisis follows before we examine the overall response with particular emphasis on the conduct and character of
5 Regional Program on Enterprise Development, The World Bank

13
the system of actors, policies, and institutional changes introduced across the subsys-tems identified as important for innovation. By shifting the focus to other food-related systems in Uganda, Chapter 7 provides a comparative assessment of the same subsystems and firm-level factors as those previ-ously examined in the study of the Nile Perch fisheries system. This helps to deter-mine the factors underlying the difference in the learning and innovative performance between the Nile Perch fish-processing and other food-processing systems in Uganda. Chapter 8 concludes and draws some policy inferences.

14

15
Chapter 2 Explaining Innovation in a Developing
Country Context
2.1 Introduction
There is a broad and growing acceptance that innovation is a key element for sus-tained growth and development. However, there is still a long way to go in achieving a common understanding of the concept itself, what innovation actually means, how it occurs, and the factors that influence it and therefore how best it can be promoted es-pecially in developing countries. We shall therefore begin with a review of received views and research on these aspects, drawing from the literature to define the key concepts central to our understanding of innovation activities in developing countries. Insights from the review provide a basis for the hypotheses and arguments developed in the last part of this chapter.
2.2 Technological Learning and Innovation in Developing Countries: The Literature
Various attempts6 have been made to define the term technology and it is not our in-tention to review the several variants in definition but rather to emphasize their close-ness. For example, Fransman (1984) defines technology broadly to encompass 'every-thing pertaining to the transformation of inputs into outputs’ (Fransman and King, 1984: 9) whereas Lall (1987) defines 'technology' as 'the application of scientific knowledge and skills to the setting up, operating, improving and expansion of produc-tive facilities' (1987:1). In both definitions, the use of the terminology ‘transforma-tion’ and, 'application' connote the idea that technology is a process of change rather than a physical state. From both definitions, we can also see that it is the knowl-edge(s), and capabilities that make up the term technology. The literature identifies different forms and modes of knowledge which can be tacit (implicit) or codified. The latter refers to that part of human knowledge that can be specified or communicated verbally, or written out in documents, ‘blueprints’ or soft-ware. Its key feature is that it is easily conveyed and transferred. In contrast, tacit knowledge is intuitive, not consciously known, and is more easily expressed than communicated. It grows out of considerable accumulated experience and practice, is potentially applicable to other situations but difficult to transfer (Polanyi, 1967). Different types of knowledge are also identified. There is knowledge about technical characteristics of production or what has been called knowledge of factual proposi-tions. There is also knowledge which constitutes explanations and understanding for example, how and why to search in particular ways, or why a particular device func-tions the way it does. There is the day to day knowledge about the operation of routine tasks, as well as knowledge of relevant key people, experts or actors in networks that
6 See the review in Rosenberg (1976) for example

16
might be required to tackle a variety of tasks and problems (David and Foray, 1995). Lundvall’s distinctions are along the same lines. ‘Know-what’ refers to knowledge about facts while ‘Know-why’ refers to knowledge about principles and laws of mo-tion in nature, in the human mind and in society. ‘Know-how’ refers to skills – the capability to do something and is typically a kind of knowledge developed and kept within the borders of the individual firm or a team of researchers [for example]. ‘Know-who’ involves information about who knows what....’ (Lundvall, 1996:5-6). In the literature, the expression ‘knowledge bases’ denotes the idea that different kinds(stocks), and modes of knowledge are used as a basis for technical and non-technical innovation processes. Knowledge flows occur when knowledge is diffused, accessed and utilized. However, accessing and utilizing the different kinds of knowledge requires an ability to absorb and master the diffused knowledge. In the context of Stewart’s conceptuali-zation of technology as the accumulation of technological capacity (Stewart, 1981), it can be said that an important element of this capacity concerns ‘absorptive capacity’ which was defined by Cohen and Levinthal (1989) as the ability to identify, assimilate and exploit knowledge from the environment. Many authors have since related the concept to various topics of research. For example, Narula (2004) discusses absorp-tive capacities in the context of innovation systems and stresses that the availability of human capital, in the form of appropriately trained, trainable, and qualified persons [affords the firm greater learning capabilities] but does not in itself result in efficient absorption of knowledge. Policies that shape the incentive regime and the parameters within which learning activities take place are important. Organizations and economic actors that determine the stock of knowledge also matter. In other words, technology is to be understood as a bundle of knowledge(s) and capa-bilities of which absorptive capabilities are an important subset. Technological capa-bility is the knowledge and experience necessary in firms to produce, innovate, and organize marketing functions. However, static increases in capacity and mastery of operational skills are simply inadequate to deal with rapidly changing economic and technological conditions. What is required is the accumulation of dynamic techno-logical capability (Lall, 1987; Bell and Pavitt, 1993; Ernst et al., 1998 and many others). If knowledge has to be learnt, Stewart (1981) counsels that imports of technology can be necessary for growth and development but are insufficient and can never substitute for the local acquisition of technology. In other words, the acquisition of local techno-logical capabilities is crucial to the process of development.
"The ability to make independent technological choices, to adapt and improve upon chosen techniques and products, and eventually to generate technology endogenously are essential aspects of the process of development. The process may be described as the accumulation of technological capacity; it is at least as important to economic development as the accumulation of capital" (Stewart, 1981: 80).
Technological learning is the way organizations such as enterprises accumulate tech-nological capability (Malerba, 1992). Different firms learn at different rates and their learning experiences are firm specific. The learning process is cumulative, path de-

17
pendent and does not only come about through passive learning-by-doing7 as experi-ence accumulated through routine operation is insufficient to master and improve technology. Instead, learning grows out of conscious and deliberate efforts and it takes several other forms. These include ‘learning by using’ (Rosenberg, 1982) which results from feedbacks associated with using a product, and ‘learning by interacting’ (Lundvall, 1992) resulting from the exploitation of customer and suppliers’ linkages and other firm to firm interactions (large with small, local with foreign). Learning can also occur through training, technology licenses or through formal education covering primary, secondary, technical and tertiary education. Learning could also take the form of non-formal or informal education. As pointed out by Mytelka and Tesfachew (2000), this type of learning takes place at the firm level through organized internal training activities or through direct participation in production and management. Since formal, non-formal and informal learning modes are all important, so it is argued, government policy is critical in determining the scope and quality of formal education and in creating an incentive system conducive to non-formal and informal learning (Mytelka and Tesfachew, 2000). In the present study, learning processes are understood as critical to the ability of firms to absorb knowledge and innovate hence the inclusion of a number of learning related variables in our data collection instruments and analysis. We also take into ac-count the possibility that it might be the foreign nationals, rather than local nationals who might benefit from a technological learning opportunity as pointed out by some of the early industrial innovation studies conducted in Africa (Mytelka, 1983, 1985, 1992; Stewart, Lall, Wangwe, 1992). These studies showed that local Africans lost opportunities for learning as only a few of them participated in the process of techni-cal change and mastery. Instead, it was the foreign owners or expatriates who bene-fited from the underlying learning process. This aspect of who learns was taken into consideration in the design of the study. Learning can manifest in the ability to undertake technological adaptation. In the lit-erature, the concept of technological adaptation derives from the realization that prod-uct designs, techniques of production or knowledge(s) about organizing can be im-ported but are rarely applied in the very form in which they were originally devel-oped. Several adaptations and modifications are [at times] made to make the technol-ogy suitable for local use. Adaptive changes to equipment might involve modifica-tions to suit a lower production scale, output range, local raw material mix and qual-ity, nature of services received from utilities or the local climate. They might involve modifications to the components of a design in order to scale it down to a smaller market size or a different local skill environment (Lall, 1987). For some, these adapta-tions and modifications may improve productivity through minor innovation of vari-ous kinds. Tasks involved in technological adaptation can be technically exacting es-pecially where the capability of the firm is weak. For Lall (1987), adaptive change does occur in developing countries but the distinction between operational and adap-tive change is crucial. While operational change requires knowledge to undertake quality control, production scheduling, trouble shooting, routine repairs and mainte-nance and other tasks, adaptive change requires the firm to make changes to the tech-nology in order to enhance its productivity given prevailing local conditions. The in-
7 This is the earlier neo-classical conceptualization by Arrow (1962) that the learning process is a by-product of production experience and therefore an automatic, passive process

18
novative changes introduced in African industry are often of the incremental type (Oyelaran-Oyeyinka et al., 1996) and many are minor in the sense that they constitute simpler modifications such as changes to machinery to enable it run faster without increasing breakage or downtime. The important point is that innovation of the adap-tive type can reduce costs; open up a process of learning, capability accumulation and incremental technical change (Malerba, 1992; Bell, 1984) which might result in an improved ability to compete. In this study, we use the term adaptations or adaptive change to refer to minor and major changes or modifications made by local firms to externally or internally gener-ated knowledge(s) embodied in product designs, processes of production or forms of organizing. We consider such adaptations to be part of the innovation activities that firms undertake since they constitute modifications previously unknown to the firm. Some researchers take the view that given the overall weak environment under which firms operate and their weak capabilities8, firms in SSA do not innovate. However, innovation is understood to mean “significant new things to the world”. In contrast, the characterization of innovation presented by innovation systems scholars collec-tively provides an enlightening and contemporary view that is considerably different from that portrayed by other literatures which associate innovation with new inven-tions. Given the context and research questions being addressed by the present study, we found the contemporary systemic view of innovation to be more helpful, hence its adoption. What follows is a review of its main ideas.
2.3 The Innovation Systems Approach to the study of Innovation
In common with Schumpeter’s oft-cited terminology of ‘new combina-tions’(Schumpeter, 1934), Lundvall speaks of innovations as reflecting already exist-ing knowledge, combined in new ways and stresses that innovation primarily appears not as a single event, but rather as a process also involving the diffusion of 'economi-cally useful knowledge'(Lundvall, 1992:12). The latter notion - ‘economically useful knowledge - is important because it underlines the point that it is simply not enough to produce good science and technologies if they cannot be ‘translated’ into uses of benefit to firms and economies. In his definition of innovation, Edquist also places emphasis on this idea of economic usefulness. Innovations relate to the production of new knowledge or the combination of already existing one in new ways. They may be of various kinds (e.g. technological and organizational).The crucial point is that this knowledge cannot be regarded as innovation unless it is transformed into products and processes that have social and economic use (Edquist, 1997:1) For Nelson and Rosenberg, innovation is interpreted as encompassing ‘…the proc-esses by which firms master and get into practice product designs and manufacturing processes that are new to them, whether or not they are new to the universe, or even to the world’. (Nelson and Rosenberg, 1993: 4-5). As observed by Edquist (1997), these authors conceive of innovation in a narrow sense in that they concentrate on technical innovations paying almost no attention to organizational, institutional, or social inno-
8 There a number of studies discussing these weaknesses. For example, see the RPED, World Bank set of studies reported in Biggs, Manju and Srivastava (1995); Biggs and Srivastava (1996); Biggs and Raturi (1997)

19
vations. Nevertheless, the authors provide some very important insights into the proc-ess of innovation. As with Lundvall, they interpret innovation as a process and not merely as a one time extraordinary event. From their definition, we can also see that firms are considered to be the principal actors that get product and process technolo-gies ‘into practice’. With the notion of ‘new to the firm’, Nelson and Rosenberg imply that innovation does not necessarily refer to the invention of frontier-extending tech-nologies – new to the world. Similarly, Ernst et al. (1998) view innovation as processes by which ‘firms master and implement the design and production of goods and services that are new to them, irre-spective of whether or not they are new to their competitors - domestic or foreign’ (Ernst, Ganiatsos and Mytelka, 1998: 12-13) or ‘[..] irrespective of whether they are new to their competitors, their countries or the world’ (Mytelka, 2000:18). For these authors too, the emphasis is not on technological novelty but rather on the process of implementing innovative activities that permit firms to learn and master the underly-ing principles and characteristics of the knowledge which might be externally or in-ternally produced but which are new to the firm. This approach is not only related to the definitions proposed by other innovation system scholars, it also embraces the na-ture of non-frontier, adaptive innovation activities often undertaken in developing country contexts and their usefulness for development. For this reason, our working definition of innovation draws from the one offered by Ernst, Ganiatsos and Mytelka (1998) and Mytelka (2000). Hence, within the context of this study, innovation refers to processes by which firms acquire, master and implement product designs, services, production processes, and organization knowledge new to the firm. Innovation activities would include the proc-ess of substituting local inputs for imported ones, enhancing the energy saving poten-tial of equipment, adoption of better technology embodied in newer vintages of equipment. This could also include a change in plant layout to enhance workflow or the modification of imported equipment to improve its productivity, the modification of standard operating procedures or even adoption of a scientific waste disposal and management system. Most of these changes might require adaptations or modifica-tions to externally produced scientific knowledge but the important point is that they happen to be new to the firm. The concept of ‘systems’ is rooted in systems theory and analysis. ‘..[T]he term ‘sys-tems’ refers to ‘complexes of elements or components, which mutually condition and constrain one another, so that the whole complex works together, with some […] clearly defined overall function’(Fleck in Edquist,1997:13). In practice, we can think of a system as an interconnected set of components that collectively contribute to the functioning of the whole. In the literature, a system is usually perceived as part of a larger system. It consists of interlinked subsystems and because there is interdepend-ence in a system, a system is more than the sum of its subsystems. Four different ele-ments are usually emphasized: (1) system elements and structure, (2) system linkages [interactions], (3) system environment, and (4) system performance. The literature also classifies systems into “hard’ and “soft”. In respect of this classification, the de-scription provided by Chema, Gilbert and Roseboom (2003) is illuminating. These authors draw from Hartwich and Meijerink (1999), to summarize the key differences between “hard” and “soft” systems. System objectives of hard systems are predefined, their elements and boundaries fixed while objectives, elements and boundaries of soft

20
systems vary according to the purpose of the system. The system environment of hard systems is of no relevance while the environment of soft systems matters and is often arbitrary since what is of relevance depends on the subject in focus. In a hard system, relations are fixed while they are complex and variable in a soft system. This classifi-cation helps us understand a soft system as merely a social construct used for analyti-cal purposes. ‘[It] is not a real entity although we often talk about is as though it really does exist (e.g. the education system, the legal system, and the financial system) (Chema, Gilbert and Roseboom, 2003:34). From the definition(s) of innovation sys-tems reviewed shortly, we shall see that an innovation system is a soft system.
2..3.1 What is meant by the expression ‘Systems of Innovation’?
In Edquist (1997), we are reminded of the origins of the expression ‘systems of inno-vation’ whose beginnings are traced to the term ‘national systems of innovation’ (NSI) developed by Freeman (1987); Lundvall (1988; 1992), Nelson (1993) and later, other scholars. A NSI has been defined in a variety of ways. For example, Freeman(1987) defines it as "…the network of institutions in the public and private sectors whose activities and interactions initiate, import, modify and diffuse new technologies"(p.1). Lundvall places emphasis on learning, which he considers to be an interactive process (Lund-vall, 1988); and, the role of institutions as the critical components of NSI. In a narrow sense, institutions are conceived as organizations such as universities or technology institutes while in broad terms, institutions include the political context, habits and practices and norms and the rules regulating relations and interactions between peo-ple. His conceptualization of NSI (1992) in a ‘broad’ sense includes all parts and as-pects of the economic structure and the institutional set-up affecting learning …the production system, the marketing system and the system of finance. The conceptuali-zation also emphasizes the diffusion of 'economically useful knowledge'(Lundvall, 1992:12). David and Foray (1995) already emphasized that it is not only the creation of knowledge that is vital but also its distribution. Thus, an understanding of knowl-edge and learning aspects and how the knowledge(s) is distributed and utilized is cru-cial for the analysis of innovation systems. Metcalfe (1995) defines NSI as "…that set of institutions which jointly and individu-ally contribute to the development and diffusion of new technologies and which pro-vides the framework within which governments form and implement policies to influ-ence the innovation process. As such it is a system of interconnected institutions to create, store, and transfer the knowledge, skills, and artifacts, which define new tech-nologies. The element of nationality follows not only from the domain of technology policy but from elements of shared language and culture which bind the system to-gether, and form the national focus of other policies, laws and regulations which con-dition the innovative environment". The framework acknowledges the influence of the notion of ‘routines’ (Nelson and Winter, 1982) and historical habits and, the importance of the local and international policy environment that sets the parameters within which all actors in the system can learn and innovate. Mytelka (2000) insists that the habits and practices of local actors in the system are critical to innovation and development because they not only influ-

21
ence innovative behavior but also tend to inhibit development efforts to diffuse and use knowledge. Lundvall et al. (2002) have argued that the systems of innovation approach particu-larly the ‘broad approach’ is highly relevant for the low-income countries of the South and both Mytelka (2003) and Oyeyinka (2003) have underlined the potential useful-ness of a broadened innovation systems approach for policy learning and making in developing countries especially those in Africa. Importantly, in her discussion of the policy dimension in the design of innovation sys-tems, Mytelka (2003) has drawn attention to a number of limitations of the ‘national’ systems of innovation perspective and observed that despite these limitations, the sys-tems of innovation approach has the potential to become a powerful tool for the for-mation of national and local policy as it provides a new way to organize the knowl-edge necessary for policy-making. In addition, it provides a means to analyze the sup-port structures and policies needed for innovation and a framework for situating the local in the context of dynamic processes of change at the global level (Mytelka, 2003:37). From a policy perspective, an innovation systems approach also draws at-tention to the behavior of local actors with respect to three key elements in the innova-tion process; learning, linkage and investment (Mytelka, 2000: 18). On the question of designing systems [’system construction’], Edquist and Johnson (1997) have observed that national systems or parts of them may or may not be con-sciously designed. It is also stressed that because of learning processes, the systems are dynamic and evolutionary. Relationships evolve and competences get reconfig-ured. What is therefore important is an understanding of the dynamics shaping mar-kets, networks of enterprises, technology policies, the macro-economic climate, knowledge-generation and training institutes such as research institutes and training centers, financial intermediaries, other actors and their habits, norms and practices and importantly, the relations between all these. Analysts warn that the specific actors, elements and relations to be examined in detail cannot be determined beforehand and because innovation systems are social systems (soft systems), the boundaries of the system to be studied are often unclear.
2.3.2 Institutions, Organizations and Innovation Systems Performance
The concept of ‘institutions’ is central to innovation systems approaches. Micro-level actors such as firms behave and perform differently with regard to innovation activi-ties not only under different contexts but also under similar conditions. However, it is important to note that different authors use the term ‘institutions’ to denote different things. Some use it when referring to organizations such as R&D laboratories, de-partments or institutes, universities, firms and other physical structures while others use it in the sense of habits, practices, rules, or laws that regulate the relations be-tween people. Hence Lundvall’s previously mentioned distinction between the narrow and broad sense in which the term institution is used. Edquist and Johnson (1997) provide no less than 8 categories of institutions (in the broad sense) and argue that these distinctions are important because the balance be-tween ‘formal’ and ‘informal’ institutions for example, may differ between countries, sectors and so on. Institutions can be formal or informal. Formal ones are codified and
22
more visible. They include laws, government regulations et al. In contrast, informal institutions are indirectly observed through behavior and examples include common law, customs and traditions, norms of cooperation, practices and others. Edquist and Johnson’s taxonomy also distinguishes between institutions that are ‘basic’ and those that are ‘supportive’. The former define basic rules in economic processes such as property rights, rules for cooperation and conflict resolution while supporting institu-tions specify certain aspects of these basic rules. Institutions are also distinguished between ‘hard’ and ‘soft’. While hard institutions are perceived as binding and often policed, soft institutions are more or less suggestions, not commands. In addition, in-stitutions may or may not be ‘consciously designed’ although some parts of uncon-sciously designed institutions can have elements that are consciously designed or vice versa. For the present study, the distinction made by Edquist and Johnson between ‘hard’ and ‘soft’, consciously or unconsciously designed institutions is vital to the line of analysis we take. Innovation systems scholars perceive institutions as playing a double role: they can stimulate, or become obstacles to innovation. In their constraining role, authors note that because institutions (in the sense of habits, norms et al) tend to have a long life-span, they can become unsuitable for innovation activities. Institutional change would then be necessary but the problem is that such change is often faced with stiff resis-tance. In their stimulating role, the key role of institutions is informational: to ‘reduce uncertainties, coordinate the use of knowledge, mediate conflicts and provide incen-tive systems’(Johnson, in Lundvall, 1992:26). Laws, health regulations, cultural norms, social rules, and technical standards are given as examples of institutions that can stimulate innovation. In this context, the behavior of firms and the broad innova-tion system, so it is argued, is importantly shaped by institutions that constitute con-straints and/or incentives for innovation. For the purposes of this study, another important dimension concerns the way in which the literature views markets. While standard economics views markets as trans-actions in an invisible, pure market place, guided by prices and quantities resulting from an equilibrium system of supply and demand, institutional economists and inno-vation studies understand markets as institutionally embedded. For the institutional-ists, markets facilitate economic exchange (by keeping costs of exchange transactions manageable). But they also emphasize that institutions support markets to function, otherwise exchange would be impossible without rules, norms and laws. As elo-quently put by Hodgson (1988), ‘exchange ...involves contractual agreement and the exchange of property rights, and the market consists in part of mechanisms to struc-ture, organize and legitimate these activities.... ’ (in Edquist and Johnson, 1997: 49). Remarking on this idea from an innovation systems perspective, Edquist and Johnson stress that:
Pure markets, i.e. markets in which sellers and buyers only communicate with the help of prices and quantities, will not produce many innovations. Technical possibilities and user needs need to be confronted and matched through communication and interaction, processes supported by different institutions. The character of these institutional ar-rangements affects interactive learning and innovation (Edquist and Johnson, 1997: 49).
As we shall shortly elaborate, this view of markets as institutionally embedded and supported is a key starting point of the hypotheses formulated and tested in this thesis.
23
How does innovation come about from an innovation systems perspective?
Lundvall argues that innovation is a ubiquitous phenomenon [occurring] practically in all parts of the economy and at all times such that we expect to find on-going proc-esses of learning, ‘searching’ and ‘exploring’ almost everywhere in the modern econ-omy, which results in new products, new techniques, new forms of organization and new markets. In some parts of the economy, these activities might be slow, gradual and incremental. Innovation may also be radical but the important point is that inno-vation is not restricted to particular parts or industries in the economy. Crucially, ‘not all important inputs to the process of innovation emanate from science and R&D ef-forts’ (Lundvall, 1992: 9). Instead, research is embedded in a wider process of innova-tion which is a continuous, cumulative process involving not only radical and incre-mental innovation but also the diffusion, absorption and use of innovation. While ac-knowledging learning through formal education, and science, research and develop-ment (R&D) as important inputs to the process of innovation, the literature empha-sizes that research is not the sole source of innovation. Innovation is also seen as em-bracing interactive learning in on-going activities such as procurement, production and sales (Johnson and Lundvall, 2003: 14-15). Innovation studies emphasize the im-portance of tacit knowledge for innovation and some have argued that one important rationale for [interaction, through] the formation of industrial networks [for example] is the need for firms to be able to share and combine elements of ‘know-how’ [tacit knowledge]. Overall, innovation systems literature stresses that interaction between various organizations operating in different institutional contexts is important for processes of innovation. However, it is also acknowledged that not all forms of learn-ing derive from interactions. The point of putting so much emphasis on interaction is that in practice, successful innovation activities often involves interactive relation-ships between a system of actors. ‘The processes through which technical innovations emerge are complex; they have to do with the emergence and diffusion of different knowledge elements, i.e. scientific and technological possibilities, as well as the 'translation' of these into new products and production processes. This translation by no means follows a 'linear' path from basic research to applied research and further to the development and implementation of new process and new products (Edquist, 1997:1). Instead, innovation involves complex relations, often characterised by inter-dependencies provoking complicated feedback mechanisms and interactive relations involving science, technology, learning, production policy and demand. Innovations emerge in such systems (Edquist, 1997). This is the view we take in attempting to explain the ability of fish processing firms to innovate. We cannot only search for answers to this question by focusing on the role played by the research sector or research activities of firms. Moreover, firms do not innovate in isolation. Therefore, we cannot focus on firm-level abilities alone. How-ever, their abilities to learn, absorb, utilize and thus ‘translate’ knowledge into ‘eco-nomically useful’ products and processes are a vital element of innovation processes. Innovation systems analysts observe that because evolutionary learning processes un-derlying innovation systems are continuously changing, systems cannot be assessed in terms of ‘optimality’ in the sense of textbook economics. Instead, comparisons of in-novation systems can point to what is a ‘high or low value, good or bad’, for policy purposes (Edquist, 1997). The comparison of innovation systems made in this study should therefore be understood as an attempt to identify what was present and absent

24
and the effect this might have had on the innovation capability of the different innova-tion systems.
2.3.3 The Financing of Innovation Processes
Innovation systems literature assigns a role to finance and one of the few works deal-ing explicitly with this topic is that of Christensen (1992). Taking an innovation sys-tems perspective, Christensen focused on how and why national differences in institu-tional set-ups of financial systems supported or limited repetitive interactive relation-ships between the lender and borrower and it was shown that institutional differences between national financial systems are important to the financing of innovation. Be-sides borrower-lender relationships, also of interest to the present study is interactive learning relationships between the financial intermediaries themselves. We do not fo-cus on national comparisons of financial systems. Instead, the main emphasis is put on how and why the institutional set-up (lending rules, practices et al) of the financial subsystem, and relations across financial intermediaries, support (or limit) the learn-ing and innovation activities of the sector-based systems examined. It is therefore use-ful to highlight some of the main insights from the finance-related literature that will guide our discussion of the financial subsystem. In two very influential papers, Stiglitz and Weiss (1980, 1981) suggested that the credit market could deny funds to borrowers due to the phenomenon of information asymmetry9. The quality of borrowers is difficult to ascertain and the ‘signaling’ me-dium of the Michael Spencer type might fail to identify the good from the bad bor-rowers, assuming that an appropriate signaling medium exists at all. Unobserved dif-ferences in borrower-quality evoke a form of credit rationing leading to ‘equilibrium’ in credit markets to co-exist with an excess demand for loans. The failure to distin-guish ‘lemons’ (Akerlof, 1969) from good-quality borrowers ex ante penalizes high-quality borrowers since the interest rate payable on loans already factors-in a lemons problem to compensate lenders in case of default [resulting from the riskier invest-ments of bad quality borrowers ( the lemons)]. The information asymmetry school cogently argues that the phenomenon of non-interest credit rationing as inherent in the very way credit markets function due to the uncertainty surrounding the completion of a credit transaction. In principle, such un-certainty can be resolved upon repayment of the loan by the borrower but the problem is that it is difficult to tell whether or not the borrower will indeed pay back the loan.
9 Asymmetric information is a situation where one side of an economic relationship has better informa-tion than the other. Two effects of information asymmetries are distinguished. First, adverse selection occurs when borrowers with investments, at reasonable rates of risk and return, are discouraged from seeking loans due to rising interest rates. In this situation, the lender and potential borrower have asymmetric information prior to contracting. At high interest rates, some borrowers have an incentive to undertake higher- return but more risky investments. This can bring about an adverse mix of appli-cants such that beyond a certain interest rate, the increased risk of default offsets gains from a higher interest rate (to the lender). In such circumstances, lenders will ration credit by other means other than the interest rate. It is then argued that even without interest rate ceilings; ‘credit rationing’ will charac-terise credit markets due to imperfect, often asymmetric information and, costly contract enforcement. On the other hand, a moral hazard problem arises when the incentive to default on a loan grows with higher interest rates and outweighs benefits associated with good lender-borrower relationships. These benefits relate to a borrower’s creditworthiness and reputation. In this situation, information asymme-tries arise after contracting (Stiglitz and Weiss, 1980 and 1981)

25
A number of strategies to solve this problem are identified. Prominent among them is the need to develop repetitive interactions in order to create credit history with the borrower. Such a long relationship enables the lender to obtain information about the borrower and to form judgments about a borrower's repayment sources, personal characteristics, and management abilities. Hence the focus by Christensen (1992) on how well different national finance systems, in advanced countries, supported or lim-ited the development of borrower-lender relationships. In respect of African and other developing countries, studies of the financial landscape and credit accessibility are many but are rarely conducted from an innovation systems perspective. Nonetheless, they generate important observations and ideas beneficial to the analysis we conduct in the present study. For example, Aryeetey and Udry (1997) suggest that if there is a high enough prob-ability of the relationship between lender and borrower continuing, the borrower will pay the loan and once the lender knows this, it will be in the lender's best interest to grant the loan implying that a credit market for loans will exist even in the absence of credit enforcement mechanisms. For Biggs (1991), financial intermediaries deal with information asymmetry problems by engaging in contracting. A contract promises fu-ture performance, typically because one party makes an investment, the profitability of which depends on the other party’s future behavior (Biggs, 1991). The party mak-ing the investment (lender) wants to safeguard against the possibility of opportunism by the borrower (misconduct, disguise and so on). Different modes of contracting are said to have different transaction costs which include the cost of making contracts en-forceable by law, precautions against expropriation, and the cost of informing and administering the contractual terms. The implication from this is that information asymmetry problems inevitably impose costs on credit transactions and as we might expect, cost and loan management prac-tices differ across financial intermediaries. Empirically, significant cost differences across different financial intermediaries in sub-Saharan Africa were observed by Nis-sanke and Aryeetey (1998). In the present study, it is observed that the ability of a fi-nance system to provide the finance with which to undertake some of the learning and innovation processes will be shaped by how well the system deals with information related difficulties. It is therefore useful to review some of the ways by which some of the more successful finance systems deal with these difficulties. In a book-length review of financial systems, innovation and development, Bhatt (1995) offers a helpful overview and examples explaining why and how financial in-novations emerge to reduce transaction cost and risk associated with information asymmetry. The interesting point is that the financial innovations Bhatt speaks of are systemic in nature and were relatively successful in dealing with information asym-metry problems within their specific country contexts. Bhatt’s notion of financial in-novation refers to a set of devices and creative ways by which lenders reduce risk without a disproportionate rise in transaction cost. To be effective, so the proposition goes, an innovation should have a risk-reducing effect much greater than its cost-increasing effect. This conceptualization deals with financial innovation at two levels; that of the lender and, that of the credit system as a whole. At the level of the lender, financial innovation might take the form of structuring loan eligibility criteria to include a personal guarantee or group guarantee in case of a rela-

26
tively homogeneous group of borrowers (Bhatt, 1995). By undertaking to pay the loan in case of failure by the borrower to repay, an immense amount of pressure to repay is exerted between the borrower and the guarantor(s). Since the borrower and guaran-tor(s) have some sort of business or other type of relationship, the failure to adhere to the loan contract might invoke social tension, sanction and moral reprobation. This way, the lender dispels moral hazard problems (unwillingness to pay even when the borrower is able to pay) and reduces risk without necessarily increasing transaction costs. Automatic renewals of short-term credit are another device often used to keep good borrowers rather than taking on new borrowers whose credit character and re-payment history is unknown to the lender. According to Bhatt, ‘rolling over’ short-term credit is a financial innovation because it helps the lender “to avoid the risk relat-ing to adverse selection…”(Bhatt, 1995:17). Inter-linking credit with trade transactions is considered to be another type of finan-cial innovation by the lender. This is already a common practice in the non-formal markets for trade credit. What is perhaps more interesting is the possibility for the trader or entity to upgrade to Biggs’s ‘defacto intermediaries’ observed in the Tai-wanese lending system. In their study of Taiwan, Biggs (1991) concluded that a dual, [parallel] financial system existed in the Taiwanese financial sector. While the formal sector [regulated] served ‘full-information’ borrowers, the informal lender served ‘in-formation intensive’ borrowers. The logic behind such layering should not be difficult to understand. The trader or entity with which information-intensive borrowers rou-tinely associate, knows the specific industry and individual borrowers better and can therefore monitor and enforce loan contracts better than the formal lender. The latter would therefore do well providing loans to the trader or entity for onward lending to the individual borrowers. In Taiwan, this kind of dual system helped lenders allocate funds to information intensive borrowers at a lower cost and more efficiently than would have been possible if all resources were to be channeled through formal sector banks (1991:168). Nissanke and Aryeetey (1998) gave three reasons why this was possible. First, there was a deliberate policy to foster and nurture effective linkages between the two market segments. Second, informal lenders were actively involved in developing innovative instruments for risky ventures without demanding physical as-sets as collateral. Third, an extensive system of sub-contracting permitted ‘defacto intermediaries’ (Biggs, 1991) to provide trade credit to their sub-contractors and sup-pliers. These defacto intermediaries served to enhance a system of market inter-linkage and credit layering (Biggs, 1991) and in so doing reduced risk and costs while expanding loan markets. For Bhatt, there is a tendency for each lender to specialize in cash flow analysis and risk appraisal techniques that suit the kind of borrowers dealt with. “…Its technology for transactions and risk appraisal is in tune with this type of assets and class of bor-rowers [as] it would increase both transaction costs and risk for a [lender] with a tech-nology suited for one type of transaction to undertake a different type, unrelated to the one in which they are specialized…. [Lenders] who have acquired a certain technol-ogy or expertise for historical reasons would find it more economical to undertake transactions related to their technology than to venture into fields that require a differ-ent type of technology. To deal with a different class of borrowers offering a different type of assets as security, therefore is a function of a new type of [lender]. It is thus that markets in specialized credit instruments evolve [and grow]…” (Bhatt, 1995:19-20).

27
The implication is that even though some lenders might attempt to superimpose a new set of loan screening and sanction techniques onto a pre-existing type of lending tech-nology, it takes only the innovative lender to successfully blend commercial bank lending techniques with non-standard commercial bank loan technology (for exam-ple). Which implies that it is neither easy to overcome idiosyncrasies in loan and risk appraisal techniques for different borrower categories nor to re-order mindsets and pre-conceived biases of bank managers and officers unaccustomed to non-standard screening and loan sanction techniques. We shall argue that such institutional lock-in needs to be overcome through the creation of an effective institutional-learning sys-tem within the financial system. The literature provides some useful examples of such learning. Besides innovations confined to the lender, Bhatt makes reference to systemic finan-cial innovations that reduce overall transaction costs, and risks, of all participants in the banking system taken together (Bhatt, 1995). One such systemic innovation is Ja-pan’s main bank system. It evolved out of conscious and deliberate efforts of the Min-istry of International Trade and Industry (MITI), the Ministry of Finance and the Bank of Japan to accelerate financial development and investment in the real sector. A main-bank structure entails setting up the closest possible relationship between a customer or client firm with its main bank. The latter observes and chooses its cus-tomers based on their conduct, carefully nurturing an intimate relationship through payment settlement accounts and repeated short-term loans. To reduce risks of moral hazard as well as improve firm performance, the main bank establishes formal and informal mechanisms to obtain accurate information about the firm’s functioning, to identify and anticipate performance problems and possible solutions. Such monitoring devices include representation on boards of client firms, deputation of senior officers to work for these firms and close contact with their top management (Bhatt, 1995). One other characteristic observed was the practice of cross shareholding. A main bank invests in the equity of the client enterprise [large firms], and the latter in the equity of the main bank. This not only cements and nurtures the long-term relationship and mu-tual commitment of the bank and the client enterprise (Bhatt, 1995), it also induces greater exchange of accurate information. While its in-house expertise might be ade-quate for routine investment appraisal, specialist support to evaluate technological content of an investment project is sought through linkages and interaction with spe-cialized institutions such as The Industrial Bank of Japan (IBJ). Germany’s banking system is also cited as another example of what the banking sys-tem could do to accelerate financial development, innovation and industrial develop-ment. German Banks are ‘universal banks’. They combine functions of commercial as well as investment banking and can thus provide all types of financial services10. Unlike Japan, firms have multi-bank relations and no exclusive relationship with any one bank. “The German banking system which is much more relevant to the develop-ing and transforming economies is the [type] that prevailed during the late nineteenth century. The universal bank during this period performed more effectively all the main bank functions and, in addition, performed the entrepreneurial role that is so relevant for developing and transforming economies” (Bhatt, 1995:100). Through Ko-
10 See Christian Harm, 1992, ‘The Relationship Between German Banks and large German Firms’, Pol-icy Research Working Paper Series No. 900, The World Bank, Washington D.C.

28
rea Development Bank and Korea long-term Credit Bank, South Korea made efforts to adapt the main bank idea to its circumstances (Bhatt, 1995). Similarly, India’s ‘lead development bank’ concept is an adaptation of the Japanese main bank system. The lead bank performs all the functions of the main bank in Japan. It appraises invest-ments, performs monitoring and supervision of assisted firms and performs the lead role in the restructuring of distressed firms. It arranges for syndicated loans too from a variety of participants including insurance companies (Bhatt, 1995). Bhatt (1995) argued that the similarity of conditions in post-war Japan and those that prevail in many developing countries make the experience of Japan’ s main bank sys-tem in the period 1951-73 relevant for developing countries. In particular, Japan’s fi-nancial system was bank-oriented, as its capital markets had barely developed. Some of the earlier controls in post-war reforms had been further relaxed and its industrial development had not yet gained momentum. Given the circumstances under which developing country firms operate, it might be the case that the usefulness of the main-bank arrangement is not so much in the multi-plicity of services it provides, but rather in the pressures and incentives it places upon lenders to support upgrading efforts of firms. That is, such a mechanism not only in-spires lenders to attend to upgrading and growth requirements of firms, but also dis-solves costs and risks inherent in loan contracts that would ordinarily be too unsafe or too costly to make. Their role is not to passively screen and appraise proposed in-vestment projects as is commonly the case in some development banks. Instead, a main bank handholds new firms providing entrepreneurial and managerial guidance. It does not perform these additional functions alone. Instead, it links up with specialist organizations to appraise and support technology choice and upgrading decisions of firms. Consequently, it provides information relating to technology, markets and, sup-pliers [It could also perform a broker role linking up parties previously isolated from each other]. Further, it arranges required financing through syndicated loans with other financial intermediaries and performs delegated monitoring. Besides, the system has in-built incentives and penalties. As a main bank, it is able to attract the business of the assisted firm, the business of its subsidiaries and affiliates, deposits from this web of firms and their employees plus associated fees. But once the main bank loses its reputation, one of the core participant banks could take over resulting in the loss of its main bank business and that which other main banks can give it as a participant bank in their syndicate operations. Because of the mutual trust and co-operative rela-tionships that develop, other banks in the syndicate arrangement trust the judgment of the main bank and find no need to appraise the enterprise they are assisting. Bhatt. (1995) has argued that since each bank functions as the main bank for some enter-prises, this reciprocity results in a reduction of transaction cost and risk for the entire banking system taken together. The preceding review provides examples of the kind of institutional set-up and inter-active relationships across financial intermediaries and between these and client firms [or clusters of firms] that permit various pre-industrial financial systems to support learning and innovation activities. This is, however, not to say that there should be naïve copying of Japan’s immediate post-war model, India’s lead bank model, or Taiwan’s credit layering model in Uganda. The examples reviewed are illustrative of the institutions and architectures that might be borrowed and adapted to suit Uganda’s specific context. In this study, we are specifically interested in understanding whether

29
or not interactive learning relations across financial intermediaries have developed in Uganda and if so, examine how the ‘institutional learning’ in the financial system has matched the learning and innovation requirements of firms. Methodologically, we consider the examination of the finance subsystem simply as a part of the overall analysis of sector-based innovation systems.
2.4 How Does the Innovation Systems Approach Compare with Other Approaches?
There are a number of alternative approaches in the literature that seek to explain the ability of firms to learn and innovate in developing countries. For instance, a number of analysts have examined the relative importance of various explanatory variables on firm-level capabilities. Their starting point is to quantify technological capabilities possessed by different firms. The outcome of this first step is to generate a technology index for an industry specific indicator of capability. Next, the relationship between the technology index (dependent variable) and a set of independent variables is exam-ined. Antecedents to this framework can be traced to Lall (1992), Lall and Wignaraja (1998), Deraniyagala (1995) and Wignaraja (1998; 2002). James and Romijn (1997) also developed a capability indicator [technological complexity] and conducted a cross-country comparison of technological capabilities. In her work on Pakistan, Romijn (1999) constructed a technology index based on the manufacturing complex-ity of a 100 engineering firms. Independent variables vary across these studies but they broadly include firm size, ownership, market orientation, incentives, foreign eq-uity, age of the firm, the entrepreneur’s education level, a skill index, technical man-power, technology imports, employee training, and external technical assistance. Only a few firm-level studies focused on Africa have taken this approach, not to be unex-pected given the difficulties associated with availability of data and small samples. In a study of 46 engineering firms in Tanzania, foreign equity, age, education level of entrepreneur and a skill index were positively related to the technology index. Firm size was not a significant influence (Deraniyagala and Semboja, 1999). In Kenya, Wignaraja and Ikiara (1999) found firm size, foreign equity, and education level of entrepreneur to be significant influences on the technology index. Ethnicity of firm owner or the head was also found to have some influence on capabilities and the un-derlying learning process of the firm. Overall, technology-index studies have shown that there are a number of firm characteristics which importantly influence its capa-bilities. We shall take the view that these need to be taken into account by research seeking to understand and explain the performance of innovations systems. Studies in the realm of clustering literature have pointed to the important role played by ‘collective efficiency’ for the growth and competitiveness of exporting clusters. According to Hubert Schmitz (1997), collective efficiency is the ‘competitive advan-tage derived from local external economies and joint action’ (Schmitz, 1997:3). The argument is that especially outside Africa, collective efficiency has afforded clustered small enterprises growth and export capabilities that they would otherwise be unable to acquire individually. However, clusters seem to have had only limited impact in Africa. In her early research on clusters in Africa, McCormick (1998) found some clusters in Africa to be no more than a mere agglomeration of small enterprises that helps to ‘build a productive environment and prepares the ground for industrializa-tion….helping to reduce growth constraints associated with independent operation of small-scale enterprises’ (McCormick 1998: 11). Emerging African clusters such as the

30
auto parts cluster in Nnewi, Nigeria (Oyelaran-Oyeyinka 1997; 2000) were found to have embarked on technological upgrading in the form of adaptations. but the cluster was found to be weak in the kind of specialization, division of labour and systemic support needed to facilitate further growth and innovation. In Kenya, Mitullah (1999) found ‘institutions’ in the sense of trust, norms and, practices too inauspicious for ef-fective joint action to emerge across the fish clusters examined. Indeed, Mytelka has stressed that a mere geographical clustering of firms does not necessarily predict to their development into systems of learning and innovation. Besides, even though ‘cluster studies tend to focus on specific sectors, they rarely situate these sectors within the broader policy environment and the policy dynamics that are the interface between policies and the habits and practices of the actors in a sector, are not dealt with’(Mytelka, 2003:38). For researchers in the value-chain camp, buyer-producer relationships play a vital role not only in facilitating upgrading processes and innovative change but they also tend to control how far other firms along the chain can go in their upgrading activities. This power relationship across actors also bears upon who benefits the most in terms of 'rents' across players in the chain. In this literature the influence of global buyers on upgrading developing country exports is underlined especially in buyer-driven value chains (Gereffi, 1994; Sandee, 1995; Schmitz and Knorringa, 1999; Dolan, Humphrey and Harris-Pascal, 1999; Humphrey and Schmitz, 2000; Schneider, 1999; Kaplinsky, 2000; Kaplinsky and Morris, 2003). While this literature provides a number of useful insights especially on power relationships affecting upgrading, it says very little about how developing country firms learn to acquire the exporting capabilities in the first place. The literature provides only limited clues on the factors explaining inter-firm differences in efforts to learn and upgrade let alone explaining why some developing country producers are more successful than others in meeting buyers' requirements. From an innovations systems perspective, producer-buyer relationships are simply one among many other relationships and conditions critical for learning and innova-tion. Crucially, innovation systems literature argues that the flows of knowledge and information necessary for learning and innovation to occur tend to ‘link a wider set of actors than those located along the value chain’ (Mytelka, 2003:32-33). Similarly, available evidence on clusters in Africa so far indicates that collective efficiency is barely sufficient for transformation of a typical cluster in Africa into a learning and innovative cluster11. Works following the innovation systems framework emphasize the importance of having strong stimuli or incentives for firms to engage in learning and innovative change. Competitive pressure is recognized as necessary but hardly sufficient to trigger such change. Earlier studies on technological change in develop-ing countries had already emphasized the interplay between stimuli or incentives, ca-pabilities, support from intermediaries and the nature of markets as critical (Lall, 1990; Mytelka, 1996a; Mytelka, 1999 and others). In Langdon (1984), we read of technological learning and incremental innovation among small and medium sized local firms whose owners were Kenyans of Asian ori-gin. The learning mode was of the learning-by-doing type and one that occurred be-cause the Asian entrepreneurs had failed to secure the kind of political support that foreign owned and local joint venture firms had secured. Faced with a different kind
11 See various chapter contributions in Oyeyinka and McCormick (forthcoming)
31
of operational environment, Asian firms made significantly different technological choices for inputs, machinery and equipment and in the process, acquired technical knowledge, which enabled them not only to cut costs but to switch to new local mate-rials. Mytelka and Tesfachew (2000) provide examples of other crisis-induced learn-ing in the auto parts industry in Nigeria after the Biafra war and the regime in Rhode-sia [Zimbabwe] which was forced to adapt and learn due to international sanctions. In a study of learning and innovative change across Kenyan micro enterprises, Ngahu (1999) observed that adaptive change was induced by resource scarcity. Micro-enterprises learnt to transform waste into usable items. They modified existing prod-uct designs to ensure easy maintenance and repair and introduced low-cost products suitable for low-end market segments in their countries. These findings suggest that some learning and innovative change might be triggered by a crisis, resource scarcity or through other possible ways. The processes or events that provoke innovative change might be negative situations such as disease, war or a ban on exports but they might also be positive such as procurement policies of gov-ernment. This is not to say that the negative triggers of innovation should be pro-moted. The important point is that policy might have to impose certain restrictions and conditions in order to generate the impetus and incentives for innovative change. Our story in the present volume shows how a seemingly negative series of events pro-vided an opportunity to learn, innovate and produce a set of positive outcomes for the Ugandan economy. A related aspect is the quality of demand. For Porter (1990), the size of home demand is far less significant than its character. This author stresses the importance of sophis-ticated and demanding buyers since they exert pressure on firms to meet higher stan-dards and innovate. Similarly, writers from an innovation systems approach such as Edquist (1995) and Gregersen (1992) also emphasize the importance of demand side policy instruments for innovation. These might include laws, taxes, regulations or government technology procurement policies. Innovation systems literature thus con-siders demand as one of the wide array of factors that influence innovation activities.
2.5 Issues in Applying the Innovation Systems Approach to Developing Countries
In 2004, the United Nations University, Institute for New Technologies (UNU-INTECH) designed and directed a set of empirical studies in developing countries. In essence, the studies were anatomies of ‘agricultural innovation systems’ (Hall et al., 2000, 2003, 2004) and their methodology urged two complementary approaches. The first involved detailed case studies built around ‘products’ with special attention paid to learning, interactions, investment, innovation, as well as habits and routines of the relevant organizations, while the second involved a broad survey, with the aid of a common questionnaire, of critical actors within the system. The information gathering and analytical work would focus on 5 key areas. The first was the historical evolution of the ‘sector’ while the second was a mapping of critical actors in the system. The third was the analysis and assessment of habits and practices of those actors in terms of learning, linkages and investment, and their competences and innovative perform-ance. Analysis of policies was the fourth aspect. Here, a wide range of policies would have to be examined including all those designed to have an influence within the sec-tor (industrial, educational, tax, land use, transport, intellectual property rights, for-

32
eign investment and tariff policies). The last and fifth aspect was the global environ-ment within which the local system was embedded (Mytelka, 2004). From the above, we can see that the explanatory power of the approach lies in the em-phasis it places on the complex relations between actors, competences, policies and ‘institutions’. But we can also see the level of difficulty involved in applying the ap-proach empirically. The terrain to be explored is not only vast; defining the bounda-ries of that vast terrain is not easy. This is more problematic in developing country contexts where a number of competences, actors, support systems and relationships are either missing or non-conducive for learning and innovation which makes it diffi-cult not to worry about the functioning of almost everything in the entire innovation system. Besides, the skills needed to undertake such a complex analysis might be in short supply in developing countries especially if the field-researchers have not had the relevant academic training. The financial costs for producing good studies are likely to be prohibitive for most budgets, due to their completion time. How can we address some of these difficulties and still obtain a reasonably good anatomy of a spe-cific sector-based system of innovation, useful for policy learning and making? Many policies might matter, therefore, what policy domains do you examine in depth and which ones should be left out altogether? What actors and relations in the system do you leave out and what is the basis for making this judgment? According to Lundvall (1992), ‘determining in detail which subsystems and social institutions should be in-cluded, or excluded in the analysis of the system is a task involving historical analysis as well as theoretical considerations...’ (pg. 12)…’a definition of the system of inno-vation must, to a certain degree, be kept open and flexible regarding which subsys-tems should be included and which processes should be studied…’(pg.13). In princi-ple, the ideas of openness and flexibility are central to our understanding of the con-cept of innovation systems and provide useful conceptual guidance. However, they still do not offer explicit guidance on how field-level studies can solve the difficulty of judging which subsystems to include or exclude in the analysis. Not surprisingly, early reviews of the approach have continued to raise this concern. For example, in an extensive overview, Edquist (1997) identifies such difficulties even though he does not really clarify how empirical work within the approach should proceed, especially in developing country contexts, where almost everything in the system needs scrutiny and development. However, the author clearly defines the gaps that need to be tackled and the answers that empirical research needs to provide. The identified gaps are important to highlight here because they helped direct the approach we chose for the study.
One way of specifying a system is to include in it all important economic, social, political, organizational, institutional, and other factors that influence the devel-opment, diffusion, and use of innovations. Potentially important determinants cannot be excluded apriori if we are to be able to understand and explain innova-tion. Provided that the innovation concept has been specified, the crucial issue then becomes one of identifying all those important factors. This could, in prin-ciple, be done by identifying the determinants of (a certain group) of innova-tions. If in this way, innovation could be causally explained, the explanatory fac-tors would define the limits of the system... [but] we might never be able com-pletely to identify the determinants of innovation. We are for example, unable to specify the relative importance of determinants in various cases and there may,

33
of course, still exist [those] unidentified determinants which are important. A primary objective of further research in the field is to decrease our ignorance in these respects. More work is needed on identification of the central elements in systems of innovation, estimating their relative importance, as well as investigat-ing the relations between them (Edquist, 1997: 14, 15, 21).
As an attempt in this direction, the present study conducted some regressions to pro-vide an indication of the relative influence of each of the hypothesized explanatory factors on the probability of what we will call intense innovation processes. To do this, we would have to predict the marginal effects of changes in one of the explana-tory variables (while others remain unchanged) on the probability of intense innova-tion processes. Even though the factors identified through such analysis simply indi-cate the likelihood to engage in intense innovation processes, the analysis facilitates the process of identifying the important factors and associated subsystems which need to be focused on for a more detailed analysis. Generally speaking, the usefulness of the approach we took could not be prejudged as we presently have very few empirical examples inspired by the innovation systems approach and therefore know very little about the empirical application of the approach particularly in the context of African developing countries.
2.6 Building Testable Hypotheses
The starting point of our argument is methodological. It derives from the recognition that because firms are part of larger systems, it is simply not enough for innovation studies, in developing countries, to focus on firm-level factors without considering the relations between these and the broader institutional and organizational set-up within which firms are embedded. As we have seen in the literature review, the dynamic ca-pabilities for absorption and innovation are influenced by firm-level factors and com-petences as well as the character and conduct of institutions and organizations defin-ing the system. We shall therefore take the view that the identification of factors in-fluencing firm-level competences provides useful pointers, but is not sufficient to a full understanding of the factors that shape innovation activities. While most anatomies of the strengths and weaknesses of innovation systems rarely include an empirical review of the firm level competences and factors of influence, a common weakness of empirical firm-capability studies in developing countries is they do not take into account the workings of the innovation system as a whole. Each of these approaches makes its own useful contribution to innovation theory but because we consider the interaction between firm-level competences and the broader system capabilities to be crucial, we find it useful to combine the analysis. We will argue that the integration of analytical approaches for firm-level behavior and competences into innovation systems research, as is done in the present study, sharpens the analytical principles and explanatory power that the innovation systems approach provides. Diagram 1 depicts the theoretical terrain covered in explaining the ability of the Nile Perch processing industry in Uganda to innovate. It is a visual representation of what we consider to be the important four sub-systems, actors, elements and relationships behind the learning and innovation process that took place within the industry. The first of the four is what we shall call the firm-level sub-system. It appears as the inner
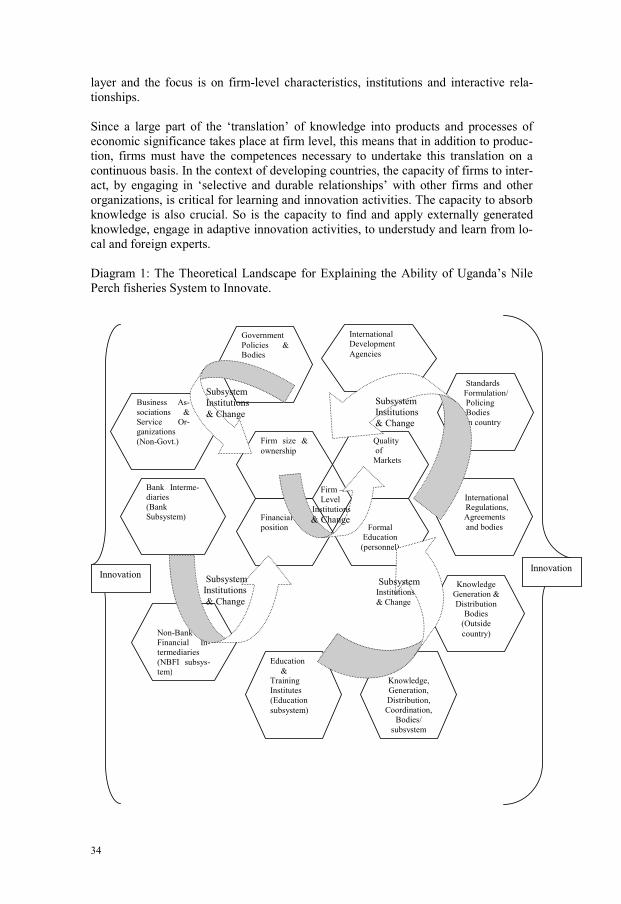
34
layer and the focus is on firm-level characteristics, institutions and interactive rela-tionships. Since a large part of the ‘translation’ of knowledge into products and processes of economic significance takes place at firm level, this means that in addition to produc-tion, firms must have the competences necessary to undertake this translation on a continuous basis. In the context of developing countries, the capacity of firms to inter-act, by engaging in ‘selective and durable relationships’ with other firms and other organizations, is critical for learning and innovation activities. The capacity to absorb knowledge is also crucial. So is the capacity to find and apply externally generated knowledge, engage in adaptive innovation activities, to understudy and learn from lo-cal and foreign experts. Diagram 1: The Theoretical Landscape for Explaining the Ability of Uganda’s Nile Perch fisheries System to Innovate.
Formal Education
(personnel)
Knowledge, Generation,
Distribution, Coordination,
Bodies/
subsystem
Education
& Training Institutes
(Education
subsystem)
Quality of Markets
Financial
position
Firm size &
ownership
Non-Bank Financial In-termediaries
(NBFI subsys-tem)
Bank Interme-diaries
(Bank Subsystem)
Business As-
sociations & Service Or-ganizations
(Non-Govt.)
Government
Policies & Bodies
International Development
Agencies
Knowledge Generation &
Distribution Bodies (Outside
country)
Standards
Formulation/ Policing Bodies
in country
International Regulations, Agreements
and bodies
Subsystem Institutions
& Change
Subsystem Institutions
& Change
Subsystem Institutions
& Change
Subsystem Institutions & Change
Firm –
Level Institutions
& Change
Innovation Innovation
35
These are not the only components of competences but in the context of developing countries, they are among the essential ones. The important problem then becomes to determine the factors that influence the accumulation of such competences. In this connection, we may formulate the hypothesis that:
Among the observable firm-level factors, firm size, market orientation to more
or less demanding markets, formal education of personnel, access to technical
assistance, a firm’s financial position, and institutions (beliefs, habits, practices
that firms might be accustomed to), significantly influence the intensity of inno-
vation activities. The null hypothesis is that these factors do not have a signifi-
cant influence.
It is important to stress that we consider these firm-level factors not as the end of the analytical journey but as pointers that make the journey of examining innovation sys-tems more defined and focused. They guide our choice of the key aspects and subsys-tems to be assessed in greater detail. The argument here is that the learning and inno-vative competences of the firm-level sub-system will jointly be influenced by firm-level factors and the system set-up within which they are embedded. By system set-up we mean the availability, character and conduct of non-firm organizations (intermedi-aries) as well as embedded institutions that shape learning and innovation activities. The following three sub-systems are deemed important because their set-up can have a direct influence on the firm-level factors hypothesized. They include:
• The subsystem mediating institutions in markets
• The subsystem promoting knowledge generation, accessibility and learning
• The Bank and NBFI12 subsystem
It is these three additional subsystems13 which constitute the outer layer of Diagram 1 and within those key sub-systems; the focus is on various actors, policies, relation-ships and institutions. Together with the firm-level sub-system, these sub-systems and the relationships across them are deemed to have played an important role in the learning and innovation process. The arrows connecting the outer and inner layers in Diagram 1 simply illustrate that the organizational and institutional architecture of the key subsystems does influence the ability of firms to engage in learning and innova-tion activities which is also affected by the specific competences and institutions at the level of firms. Thus, the hypothesis is that:
The intensity of firm-level innovation activities is shaped by the interaction be-
tween how well the system set-up functions, firm level-factors as well as firm-
level institutions, and change. Besides the conventional firm-level characteris-
tics such as firm size or personnel education, the firm-level response to changes
in the system set-up will importantly be influenced by firm-level institutions.
The expression ‘how well the system functions’ connotes relativity and thus requires clarification. At the level of the system or subsystem, we do not use any ‘benchmark’ or ‘optimal’ measure for judging how well a system or subsystem functions. Instead,
12 Non-Bank Financial Intermediaries 13 Within the outer layer, all boxes connected by a big arrow constitute a sub-system

36
we compare systems on the basis of what was present and absent in terms of availabil-ity of relevant intermediaries, accessibility of relevant knowledge bases, extensiveness of interactions and knowledge flows and, the occurrence of major institutional changes desirable for learning and innovation activities. Let us now elaborate upon the firm-level factors hypothesized as important.
• The nature of markets and institutions
The view in the literature that institutions can have a supporting and retarding effect on innovation (Edquist and Johnson, 1997) is enlightening and applied to the analysis conducted here. We also adopt the institutionalist view that because markets are or-ganized and institutionally embedded in practice, they cannot also be pure (North, 1990, 1991; Coase, 1988). For example, it is not difficult to see that there are a num-ber of rules (in the form of institutions) governing world wide economic exchange in fresh food products, flowers and textiles or any other product for that matter. In order to export fish fillets from Uganda to USA, Japan and Australia or to the EU for exam-ple, the Ugandan producer has to abide by a set of standards which can differ substan-tially between these various markets (Henson and Mitullah, 2004). Indeed, when we think of economic interactions, we can see that scripted and un-scripted regulations, specifications or standards, are everywhere and differ in form and character. What role does economic theory assign to standards? According to David (1995), a standard is ‘a set of technical specifications that may be adhered to by a producer ei-ther tacitly or as a result of a formal agreement’. Iversen (2000) provides an enlighten-ing overview of the literature on the economics of standards. The older view focuses on standards as mechanisms that address market-failure or reduce transaction costs. From this perspective, standards address the market’s inability to effectively facilitate information flows. They do this by clearly defining what is required to serve a market (information) and by reducing information costs and the collective risk associated with adopting new technology thereby lowering uncertainty and transaction costs for producers and other actors. The more contemporary literature, however, argues that ‘the received view about standards is flawed’ as the socio-economic importance of standards is much greater than market-failure (Williams, 1999 in Iversen, 2000: 7). Standards are also understood to have a coordinative role in that they ‘coordinate hu-man action concerning the design, production, combination, maintenance or utiliza-tion of technical artifacts. Compliance with rules promises compatibility and thus promises the artifacts’ smooth interoperation in a system’ (Schmidt & Werle 1998 in Iversen 2000:11). Their purpose includes ‘…reducing variety, specifying minimum quality requirements and ensuring compatibility’ (David, in Andersen and Lundvall, 1997:252). As stressed in an another strand of the literature, standards can also play an important role in shaping markets and in bringing about market dominance by one or a group of firms and in addition, serve as a non-tariff trade barrier. In relation to developing country trade, a large strand of this literature14 draws attention to the possible use of
14 Jaffee and Henson (2004) not only provide a recent and critical review but also discuss an alterna-tive perspective

37
standards as a protectionist tool, providing scientific justifications for prohibiting im-ports of certain products or discriminating against imports by applying higher stan-dards or more rigorous regulatory oversight than on domestic suppliers. Given that many developing countries lack the administrative, technical and scientific capacities to comply with the emerging requirements and because the investment and recurrent costs of compliance can serve to compress the profitability of high-value food exports, so goes the argument, the competitive position of developing countries can be un-dermined thereby contributing to the further marginalization of the weaker economic players (Jaffee and Henson, 2004). From an innovation systems perspective, analysts stress that firms neither produce innovations in isolation from each other nor from the influence of the institutional framework of which standards are an important element. That is, standards are an im-portant element of the local and global institutional framework within which firms and learning processes are embedded and through which firms interact during the process of innovation. Innovation systems literature identifies standards as innova-tion-stimulating institutions (and sometimes as innovation-retarding) although very little attention has been paid, by innovation systems analysts, to the question of the channels by which these specific institutions (standards) influence innovation proc-esses. Edquist and Johnson (1997) provide some general theoretical clues. For instance, one of the basic functions of institutions is to ‘reduce uncertainty about the behavior of other people by providing information or by reducing the amount of information needed’. Secondly, institutions control and regulate conflicts and cooperation between individuals and groups. Thirdly, they specify different incentives to engage in learning and to participate in innovation processes. Incentives (and associated sticks) can be of the pecuniary kind such as property rights to knowledge, tax allowances, salary and wage schemes, or they can be of the non-pecuniary kind such as loss in status and prestige. In addition, institutions channel resources to innovation activities. For in-stance, governments are committed through informal norms and traditions to direct resources to universities, libraries and so on. R&D may be supported by formal insti-tutions like tax rules and government subsidies. Institutions can also become obstacles to innovation especially where they are continuously changing (resulting in instabil-ity) while institutional rigidity is in the long run a threat to technical change. As em-phasized by these authors, what is important is to recognize that institutions may have both supporting and retarding effects on innovation (Edquist and Johnson, 1997: 51-55). In addition to the above functions of institutions in relation to innovation, we can also think of some institutions as forces that assist to bring about institutional change nec-essary for the innovation process. Essentially, a renewal of some institutions tends to bring about the demise of ineffective institutions (or some aspects) that might be un-desirable for learning and innovation processes. The following discussion on stan-dards and demanding markets attempts to clarify what we mean. The concept of demanding markets is often used in various strands of literature but it is not common to link this concept to institutional theory. We would argue that in connection with innovation systems, an institutional specification of this notion (de-manding markets) is vital given the inclusion of demand-related factors in the wide

38
array of aspects considered relevant for innovation processes. In the present study, we view the concept of demanding markets in institutional and innovation systems terms. Various formal and informal rules as well as norms govern the operations of all mar-kets. Rules might be informally or formally expressed, strictly or not strictly enforced but they will still be there if we examined the institutions governing markets more closely. They may or may not be consciously designed and they might produce unan-ticipated effects divergent from the purposes they were originally intended. It follows that what distinguishes demanding markets from less demanding ones is the balance between what Edquist and Johnson (1997) have called ‘hard’ and ‘soft’ institutions governing transactions in those markets. As the authors explain, both formal and in-formal institutions can be hard or softly policed. However, we can expect that soft po-licing of institutions be they ‘formal’ or ‘informal’, ‘basic’ or ‘supportive’, is not likely to exert the same degree of pressure as hard policing. This might mean that de-manding markets contain more of the ‘hard’ types in their bag of institutions while less demanding markets have less. Demanding markets often require their suppliers to meet specific requirements. These might concern technical standards of products and services. Requirements may also be of the organizational type such as delivery times, volumes and so on. Essentially, these requirements constitute ground rules or minimum sets of standards to direct economic interactions. They can be formal, informal, hard or soft. They can originate from private buyers, private organizations or from public-sector bodies such as stan-dard setting organizations. In the latter case, buyers may or may not be directly in-volved in their development especially where the public sector acts in the interest of safeguarding development, strategic or health needs of users. Buyers and public agen-cies tend to alter these rules to suit changing circumstances although this is not fre-quent (stable patterns of behavior are often observed in practice). Moreover, firms tend to adhere to what they have learnt in the past which means that their adaptive processes will be conducted gradually and within the vicinity of their accumulated knowledge. Thus, because the transition from the old to the new is difficult and non-instantaneous, compliance with altered rules will be of little effect if they were to be softly policed. Where the rules are public-led, hard and serve to enhance quality improvements of products or processes, they strengthen the quality of demand thereby substituting for weakly formulated private users’ demand. This study suggests, therefore, that hard standards can be viewed as institutions potentially useful for augmenting markets. They do this by strengthening and articulating users’ needs and demands and ensuring that new demands are complied with. This additional pressure emanating from mar-kets not only boosts the quality of demand but also raises the bar by assisting produc-ers to discontinue older rules, habits and practices that may no longer be desirable. In this way they bring about institutional change necessary for learning and innovation activities. We use the concept of institutionally-augmented markets to capture this ef-fect of standards. Even where the higher-order of institutions is or is not consciously designed to bring about innovations, if the scale of change involved is significant, al-tered institutions will likely spur processes of learning and innovation (inadvertently). We should perhaps note that when public-led, hard standards perform the function of sophisticated and demanding private buyers; this does not necessarily imply the sub-

39
stitution of private demands for public sector demands. In practice, public and private-led demands often complement each other. Standards can also have a negative effect by acting as a barrier to smooth economic interactions especially where producers only have weak incentives or competences to cope and positively respond to new pressures. Under such circumstances, producer firms might simply exit from the market and in some cases, close down. However, it is not at all obvious that standards necessarily harm innovation activities more than they stimulate them. Nonetheless, a positive outcome is more likely where the incen-tives to respond are relatively attractive and accessible and in the case of most devel-oping countries, where required support structures and competences are also built. Therefore, access to relevant bases of knowledge, inputs and services, interaction, technical assistance, and learning capabilities would need to be enhanced.
In the context of innovation studies, we expect that one of the features signifi-
cantly defining differences in the performance of innovation systems is the de-
gree to which markets are institutionally-augmented. That is, there is a signifi-
cant difference in the intensity of innovation activities between systems with and
without institutionally-augmented markets.
We shall argue that technical standards are an important set of institutions that help define innovation systems, especially where prevailing market institutions are simply too weak to generate continuous pressure for learning and innovation. In this context, standards can enhance competitiveness because once the more demanding problems communicated by sophisticated markets are met, producers are more or less assured of having met, at least the basic demands for alternative sophisticated markets. A key problem for policy is then to understand the conditions that favour the formation and maintenance of dynamic innovation systems. It is our contention that institutional change in the form and character of standards provides an important mechanism for dynamic innovation system-building. In the present study, an attempt was made to track the role of this specific set of insti-tutions (standards) by comparing innovation systems with and without institutionally-augmented markets. As we explained in the introductory chapter, Uganda’s Nile Perch fisheries innovation system had to confront institutional change in the form of conditional and strictly enforced standards orchestrated by public agencies in the EU market. The anatomy of the Nile Perch fisheries innovation system would therefore have to consider this institutional change. Hence, we compared the Nile Perch fisher-ies innovation system with other food-processing systems where such institutional change was absent. The expectation was that this comparison would generate insights useful for further research and relevance towards the policy making process of devel-oping countries. It should also be mentioned that while policy making should obvi-ously not consider the introduction of hard institutions in the form of enforced stan-dards as ‘the answer’ to the search for innovation-enhancing institutions, this form of institutional change can have important effects on processes of learning and innova-tion. This thesis discusses some empirical evidence from a developing country in sup-port of this general statement.

40
• The relations between the size of the firm, personnel education, markets and its financial position
In his Theory of Economic Development (1932), Schumpeter I expressed great hope in the small firm as the driver of innovation. A decade later in his Capitalism, Social-ism and Democracy - 1942, Schumpeter II had been convinced that the large firm possessed superior abilities and resources for innovation. Considerable attention has since been paid to the importance of size for innovation and growth of the firm. In the literature, the size of the firm is identified to be an important characteristic mainly for two reasons. First, it influences the nature of internal assets of the firm (Penrose, 1959; Freeman and Soete, 1997) and therefore, the scope of relationships and interac-tions the firm is able to make. The nature of these relationships might in turn, define the extent to which the firm is able to access and build upon acquired knowledge and information. Larger firms tend to attract better-educated and skilled workers, more trainable and where the conditions permit, able to absorb and effectively translate knowledge generated elsewhere into products and processes for economic use. Non-firm organizations such as technology institutes or universities might provide different services to different firms depending on size. The volume and type of technical assis-tance attracted from international and local development agencies might importantly depend on firm size. Secondly, firm size influences the market orientation of the firm. In the context of innovation studies focusing on developing countries, the distinction between export and domestic orientation is of great importance because the quality of demand matters for innovation. Sophisticated buyers matter because they place heavy demands on the exporting firm by requesting it to supply their needs differently. For example, producers might be asked to supply higher quality products and services, to standardize products, meet strict delivery times; introduce acceptable packaging mate-rials and so on. These demands may drive the local firm to alter, modify or improve products, a phenomenon that may otherwise be lacking in domestic or regional mar-kets. Besides, buyer firms in export markets might be a source of ‘complementary specialties’ (Andersen and Lundvall, 1997:249) necessary for the process of innova-tion. Innovation activities are not always cost free and certainly not so in developing coun-tries where such activities might involve a protracted search for poorly distributed knowledge. Relevant knowledge bases might be available within the country but rela-tively unknown. For example, new knowledge might be available at in-country re-search institutes but might simply be stored on the shelves with minimal interaction between the research institutes and industry, if any. Relevant knowledge might not even be locally available. Even where they access the required knowledge through their overseas buyers or suppliers, the interaction process is not always free of finan-cial expenditures. For innovating firms, the process often involves communications, visits, sending personnel to training events, in-house training courses, purchase of equipment, restructuring and new forms of organizing, or other activities that require financial resources. Firms might have to temporarily buy-in expertise to get the learn-ing process started or to solve specific technical problems. Even though innovation costs might not be explicitly captured and recorded as such by firms, we can neither assume away the costs of innovation activities nor simply suppose that all learning and innovation activities involve financial resources. What is required is to determine the aptness of a firm’s financial position (and the subsequent strategic choices it makes) in relation to its present and potential learning and innovation activities.

41
If learning and innovation activities are not always cost free, firm size is important because it also determines the range of financing possibilities available. In most de-veloping countries, the financial landscape is quite tenuous especially in the context of financing innovation activities. Venture capital markets are weak, largely inaccessible or non-existent. Long-term investment finance is either unavailable or hard to find especially by the smaller firms which form the majority in many developing countries. Credit rationing and information asymmetry theories provide an enlightening account as to why size matters when it comes to accessing finance15. Limited access to credit therefore implies that smaller firms have a narrower range of financing possibilities to choose from. Besides access, the cost of financing also matters and we know from the literature review that there are cost differences across intermediaries in the financial system. There are differences in nominal and effective interest rates as well as in hid-den costs. Some larger firms might be transnational and therefore able to access fi-nancing from their parent firms. Those able to access less costly financing are likely to have lower financing costs which might contribute to better cash flow and net profit streams than others reliant on more costly financing. What we then have is differing financial positions across firms. While some firms will privilege their financial posi-tion with lower-cost financing taking on only small amounts of high-cost debt, others will have fewer possibilities and might therefore have to rely more on high-cost debt if they truly need external finance in addition to self financing.
Therefore, we expect the financial gearing position of firms to significantly in-
fluence learning and innovation activities at the level of the firm, especially in a
developing country setting. Because firms sometimes apply financial resources
to innovation activities, we expect firms with a less healthy cash flow and profit
position to be inhibited by their more difficult financial position to engage in in-
novative activities. This will also be reflected in their ability to undertake some
of the innovation activities requiring lumpy investment e.g. upfront.
• Firm ownership and institutions
For interactive learning to bear fruition, the skills, habits and practices that allow indi-viduals and organizations to engage in open communication and thus effectively in-teract with each other are critical. In particular, trust and work ethics [including hon-esty and accountability] condition processes of learning and their absence can limit the formation of stable and durable learning relationships for the exchange of knowl-edge and other resources. As observed by Dalum, Johnson and Lundvall (1992), ‘...if society becomes invaded by opportunism and lack of trust, transaction costs will esca-late and learning processes will be blocked’ (pg 315). All are learnt behaviors and of-ten reflect the many years of evolution in social norms to which individuals have been exposed over time. As carriers of historically-determined habits and practices, firm owners or managers will behave differently and these differences might be reflected in the ways their firms deal with issues of cooperation, exchange of information and knowledge, searching for solutions, fair dealing, integrity and dependability, man-agement and so on. In the case of post-conflict developing countries such as Uganda, trust and work ethics can disintegrate not only because of war or prolonged civil con-flict but also because of sharp income disparities, unequal distribution of opportunities
15 In the case of Uganda, see a recent study by Mugume and Obwona (2001)

42
(socially and historically conditioned but sometimes exacerbated by public policies). Prolonged civil-conflict(s), totalitarian regimes or severe socio-economic inequalities can breed a climate of social insecurity and despair. They can also breed excessive opportunistic behavior potentially harmful to the very moral fabric and values that previously held and sustained society. The problem can become more acute where political or economic rupture is accompanied by a breakdown of law and order, a compromised judiciary system, the neglect of an already weak and exclusionary edu-cation system largely the case in the 80s and 90s in many African countries (Oyey-inka, 2003) and/or a near collapse of other social services. History gives us many ex-amples of how the corrosive effects of prolonged turmoil can weaken the entire social structure. It is therefore plausible that societies that have suffered protracted conflict, anarchy or severe socio-economic inequalities exhibit behavior and habits that are dis-tinctively different from those depicted by societies that have experienced relatively minor or no major unrest in their recent political and socio-economic history. More-over, even in the absence of political and economic upheaval, social norms tend to differ between societies or ethnic groupings. Thus,
We expect differences in the ethnicity of owner(s) or managers to significantly
influence learning and innovation activities at the level of the firm. Firms man-
aged [or owned] by individuals associated with societies not affected by major
disturbances or those from societies whose social institutions have successfully
been rebuilt (over time) are expected to engage in more intense interactive rela-
tionships and innovation activities.
However, we need to stress that this is highly context specific. In the case of Uganda which, is in the main a post-conflict country and characterised by a marked presence of industrialists of Indian origin, we can make a crude attempt to capture the influence of firm-level habits and practices by tracking whether a firm is foreign-owned or oth-erwise and if non-foreign track the ethnicity of the majority-owners or managers. In-sights generated from the inclusion of the ethnicity factor would be interesting for other countries with a comparable history or even those where preliminary research has already indicated a possible role of the ethnicity factor for learning processes. Such countries might include neighbouring Kenya, Tanzania and South Africa for ex-ample. The case studies of fish processing firms presented in Chapter 5 will shed light on the nature of the micro-macro relationship between firm-level characteristics (including institutions) and the three sub-systems previously mentioned. They will also explore how this might have affected the response of individual firms to changes introduced within the relevant sub-systems. As recognized by evolutionary theorists, firms have limited cognitive capacities thus do not respond promptly or instantaneously to changes [in the system set-up] as if they were neoclassical 'automaton maximizers'. They behave differently even under identical information and incentives.
The actions or behavior of firms will reflect the kind of coping devices that firms resort to in dealing with the severe information processing constraints they face. Contemporary literature assigns different metaphors to these devices but the key idea is that these "set of beliefs"- “habits and practices"- "rules of the game" importantly contribute to the explanation of firm […] behavior. The [hab-

43
its and practices] employed by a firm ought to be regarded as an important part of its overall capabilities (Nelson and Winter, 1982). "...what acquires a major importance in the description of decisions and behav-iors is the actual set of beliefs, their problem-solving rules, their specific knowl-edge, the ways they change them in non-stationary systems... amongst different classes of agents who hold different beliefs ..”(Dosi and Orsenigo., 1988:18)
Thus, we expect to find differences in behavior across the firms studied but also ex-pect to observe common sets of habits and practices across classes of firms. These would aid our understanding of how particular sets of habits and practices shape the competences of firms. In terms of policy, insights from such in-depth anatomies might point intermediaries to institutional changes necessary for the improved functioning of the system.
2.7 Summing up
The focus of this thesis is upon explaining the ability of Uganda’s fish processing and exporting industry to learn and innovate in a typical developing country setting. An attempt has been made in the present chapter to review various strands of literature for the purpose of informing and directing the present study, and as a basis for articulat-ing the hypotheses and frame of analysis. The contribution of the study lies in its methodological approach and the emphasis placed on the role of standards in innova-tion-systems building especially in developing countries. Most anatomies of the strengths and weaknesses of innovation systems rarely include an empirical review of enterprise level competences and factors of influence and a common weakness of em-pirical firm-capability studies is they do not take into account the workings of the in-novation system as a whole. Our methodological approach not only combines these two approaches, but also attempts to bring the developing country literatures on firm-capabilities, innovation systems and enterprise finance closer to each other. At the firm-level of analysis, we regard the size and composition of firms, orientation to in-stitutionally-augmented markets, access to technical assistance, the financial gearing position of firms, education of personnel and firm-level institutions (ethnicity of owner) as an important set of factors affecting learning and innovation. At a broader level, we consider institutional and organizational changes in the subsystem mediating market institutions, in the subsystem dealing with knowledge distribution and coordi-nation, and associated sector-based policies, and to some limited extent, institutional changes in the finance subsystem, to have played an important role. The hypotheses discussed in the last part of this chapter shall hopefully contribute to a broadened re-search agenda and menu of ideas on innovation systems-building in developing coun-tries. Our task in the next chapter is to describe the design of the study and its meth-odology.

44

45
Chapter 3 The Design and Methodology of the
Study
3.1 Introduction
This chapter discusses a number of choices made regarding the country of study, the overall research design and methodology. The first section provides the justification for selecting Uganda for research and highlights some of the difficulties and condi-tions common not only to Uganda but also to many other comparable developing countries. The last part of the chapter elaborates the research methodology. Despite a long troubled political and economic history, Uganda successfully intro-duced learning and innovation activities within its Nile Perch fisheries industry and it did so in a swift and unprecedented manner which makes for an interesting example of how technological change and innovation can be introduced in technologically lag-ging sectors and countries. There are at least three aspects of Uganda’s history that contribute to a better understanding of the way this country dealt with the restrictions imposed on its fish exports into the EU. The first is the long history of political and economic instability and in consequence, a serious rupture of the physical, political and socio-economic infrastructure. Secondly and in common with other comparable developing countries, Uganda has historically neglected the need for building local learning and innovation capabilities. The reactive as opposed to a proactive approach towards capability development in the Nile Perch fisheries is in many ways a reflec-tion of this persistent neglect. The third important element of Uganda’s history is partly a consequence of the first and second aspects. In the following review and that in subsequent chapters, these three key aspects of Uganda’s history shall be elabo-rated.
3.2 Instability and Reforms in Uganda
Various published works explaining Uganda's economic history identify at least four episodes of progress and decline (Bigsten and Kayizzi-Mugerwa, 1999; Reinikka and Svensson, 1999; Kasekende and Atingi-Ego, 1999; Bigsten 2000; Holmgren, Kasekende, Atingi-Ego, Ddamulira 2001 and many others). These episodes include the first decade of nation building following political independence from the British. Then, the 1970s characterised by prolonged political and economic unrest and third, the early 1980s when the country attempted to reform but was quickly re-launched into political and economic disorder. The fourth episode covers the latter half of the 80s through to the 90s when strong economic and political reforms were implemented in a relatively peaceful environment, at least within the largest part of the country. Between 1962-1969 and following Uganda’s independence from British rule was a time of nation building, characterised by the building of a local infrastructure and the

46
expansion of the public sector. As with most other African countries, prevailing im-port substitution policies were expected to spur economic growth and provide em-ployment especially in the formal public sector. Agricultural subsidies, extension ser-vices and agricultural research increasingly gained momentum alongside protective trade barriers and export duties. Public sector employment rose to about 40 per cent of formal employment although only 15 per cent of the labour force was in formal em-ployment. The share of manufacturing grew from 8 to 9 per cent and some export growth was recorded (Bigsten and Kayizzi-Mugerwa, 1999). However, the share of exports in GDP fell sharply, from 27 per cent in 1960 to 23 per cent in 1970. The share of manufactured exports in total exports somewhat increased but remained be-low 1 per cent throughout this period. An exhausted import substitution regime did not only shield local firms from competition, but also blocked linkages and the flow of knowledge that these firms badly needed to generate exports. From 1969/1970, the political leadership of the country headed by Milton Obote, the first president of post-independent Uganda, began to move to the left (Cold War era) and introduced a nationalization strategy which resulted in the creation of a pool of state owned enterprise in many sectors. In 1971, a new episode of sustained economic chaos was launched. The army overthrew Obote and Idi Amin became the new head of state. In 1972, one year into his dictatorial and murderous regime, Amin announced the so-called economic war which began by expelling, at very short notice, all persons of Asian descent. This included Ugandans of Asian origin. Their properties were unlawfully seized by the state a move that further entrenched the nationalization pro-gram of Obote. In time, the real sector contracted and the economy relied more on subsistence production, coffee smuggling and speculative trading. Investments, ex-ports and per capita incomes all dropped sharply (Bigsten, 2000). The global oil crisis of 1973 then arrived only to exacerbate the effect of the continuing domestic crisis, sharp cuts in foreign aid money and loans. Owing to an increase in subsistence agriculture, this sector increased its share in GDP while the share of industry dropped from about 14 per cent in 1970 to 4.2 percent in 1979 (Bigsten, 2000). The share of the services sector contracted too. Meanwhile, the country was swept by a wave of unprecedented insecurity, political and economic de-rangement and not surprisingly, a large number of Ugandans fled the country to es-cape persecution and lawlessness. Uganda became internationally isolated. These de-velopments not only eroded international confidence in the governance of the country, but also thinned out a category of skilled managers, technicians and workers that had started to build operating skills and some capability, especially in manufacturing. Eventually, the economy collapsed, an invasion force fought its way into the country through Tanzania and Amin's military junta was thrown out of power in 1979. The early 1980s were still a period of political disorder. Within the first two years af-ter Amin's departure in 1979, the country was consecutively governed by two presi-dents. Later, a military commission headed the country, arranged elections in 1980 and organized the return of the previously exiled leader, Milton Obote to assume power for a second time(hence the expression Obote II). On the economic front, infla-tion was in three-digit figures at about 240 per cent per annum. There were caps on interest rates, domestic savings were negligible, 70 per cent of total credit went to the public sector and the local shilling was heavily over valued (Kasekende & Ssemogerere,
1994; Bigsten, 2000).

47
In June 1981, the government of Obote II signed an IMF 13 - month stabilization pro-gram16. Major reforms included higher producer prices for export crops, price de-controls, improvements in the taxation structure, improved control of government ex-penditure and accountability (Bigsten, 2000). A new foreign exchange system was devised with two foreign exchange windows, one where the rate was determined by the central bank (Bank of Uganda) and a second where the rate was determined through a foreign exchange auction. Several analysts have observed that although these early reforms stimulated some revival of production and incomes at least until 1983, trade reforms were limited. Importers and import - substitution industries were still protected and the two window-float system was characterised by widening gaps that carried an implicit tax on exporters (compensated at the BOU determined rate of Window I). By 1983, the Obote II government was already facing mounting political pressure to abandon the reforms as the currency value slumped, money supply in-creased by about 127 per cent to help finance public sector wages and, inflation rose again. All this meant that the IMF performance criteria could not be met and the pro-gram was cancelled in 1984 (Kasekende & Ssemogerere, 1994; Bigsten, 2000). Meanwhile, the political situation had rapidly deteriorated. Through a military coup in 1985, a new military junta overthrew Obote II and a guerilla war led by Yoweri Museveni that had begun in 1980/81 intensified. With the collapse of the 1985 Nai-robi peace talks between Museveni's rebel groups and Uganda's ruling military junta, the situation soon retrogressed into a full scale civil war. Museveni's rebel forces eventually seized power in January 1986. Driven by an orientation towards the Left, Museveni’s early government introduced its 10 - point program (political and eco-nomic agenda) with a bias towards import substitution policies and controls. A new exchange rate was introduced, essentially over valuing the local shilling. Exports be-came uncompetitive, the budget deficit rose, the government came under renewed po-litical pressure and had few options but to seek international assistance. With support from multilateral and bilateral development agencies, a wide ranging set of stabilization and structural adjustment reforms was launched in 1987. The literature dealing with Uganda's reforms is very large but in the main, highlights the following changes. Instead of financing fiscal deficits through bank borrowing and printing money, the money supply was strictly controlled through restricted government bor-rowing and selling of government paper at market interest rates. Coupled with better revenue collection through the establishment of the Uganda Revenue Authority in 1991, better fiscal discipline resulted in reduced pressure on monetary growth. Money supply (M2) steadily reduced from 203 per cent in 1988 to 33 per cent by 1994 (Morissey and Rudaheranwa, 1998). Through this kind of discipline, authorities man-aged to bring down inflation from its 3-digit level of 196 per cent in 1988 to 6 per cent in 1993. This sharp reduction in inflation reduced real rates of interest. Other in-dicators showed improvement too. Inefficient marketing boards were dismantled and privatized and trade licenses were replaced by a certification system (lasting 6 months). The foreign exchange system was changed and gradually improved. In 1990, a decision was made to legalize the parallel foreign exchange market resulting in the entry of a large number of private foreign exchange bureaus. Tariffs on imported in-puts were gradually rationalized. By 1993, a series of measures to attain a market-
16 This section draws from Bigsten (2000)

48
based exchange rate management system alongside further liberalization had managed to open up the economy even further.17 Meanwhile, the government had introduced since 1987, an export diversification pol-icy and a number of initiatives to boost the volume and diversity of exports. An Ex-port Policy Development and Analysis Unit (EPADU) was established and research and agricultural extension services began to be directed towards this effort. These were to be high value export products other than unprocessed traditional exports (cof-fee, tea, cotton and tobacco). Emphasis was placed on Non-Traditional Agricultural Exports (NTAEs) notably fish, spices (such as chilies, vanilla, ginger, papain), cut flowers (roses, plant cuttings et al), oil seeds (sesame seeds, sunflower et al), cereal and pulses (beans, maize, rice, wheat), fresh and dried vegetables (French beans, okra, mushrooms et al) and silk cocoons. Of these non-traditional exports, fish was by far the most important. Available data shows that the contribution of fish exports to total exports was about 6 per cent in 1996. By 2001, this contribution had dramatically risen to 17 per cent and even higher to about 19 per cent by 2002. Within the non-traditional category, fish exports accounted for approximately 17 per cent of NTAEs by 1996. This rose to 28 per cent in 2001 and by 2002, to 31 per cent. It is therefore important to keep in mind that as other developing countries engaged and accelerated their development efforts, the years of civil and economic turmoil in Uganda crippled the development effort resulting in an economy overly dependent on a narrow and traditional agricultural commodity export base (coffee, cotton, tea, to-bacco). Export diversification into non-traditional exports such as fish, flowers, va-nilla and many others would, later in the 80s and 90s become a key aspect of the eco-nomic recovery and development programme. Of these non-traditional agricultural exports, fish was the most important. It is therefore, in some ways, not surprising that for a country recovering from a troubled past and still dependent on only a few tradi-tional agricultural exports whose global trading prices were sharply declining, it was imperative that a swift and decisive response was required to deal with the EU condi-tional ban(s). In fact our interviews revealed that there was a sense of urgency for the country to address and comply with the new SPS and fish exporting conditions im-posed by the EU.
3.3 The Failure to Develop Technological Learning and Innovation Capabilities
Uganda's recovery process from a history of economic and political rupture is widely acclaimed as impressive particularly during the 90s. Crucially, inflation was kept rela-tively low during the period of rapid economic growth, which was not necessarily the same in many other comparable countries in sub-Saharan Africa (SSA). Data from the World Development Indicators (The World Bank) show that GDP grew at an average of 6 per cent in Uganda in the 1990s up to 2001, clearly much higher than in compa-rable countries in SSA. But the data also indicates that previous high GDP growth rates in Uganda could not easily be sustained, at least in the early 2000s, probably due to a slump in coffee prices. By the end of 2001, GDP was growing at a much lower rate (4.6 per cent) than the average growth of 6 per cent recorded in the 1990s.
17 This section draws from Ssemogerere and Kalema(1998); Kasekende, Kitabire, Martin (1998); Morissey and Rudaheranwa (1998); Kasekende and Atingi-Ego(1999); Bigsten(2002)

49
Growth of manufacturing has been very rapid in the post-conflict period (close to 13 per cent in the 1990s). With the exception of Mozambique (18 per cent), another post-conflict country, growth in manufacturing exceeded that in comparable countries by a large margin as is to be expected since initial conditions were much lower. Neverthe-less, Uganda is still an agrarian economy given the share of agriculture in GDP which is still high although declining. The service sector in Uganda has grown rapidly (close to 8 per cent in the 1990s compared with 3 per cent in the 1980s) and since 1999, its contribution to GDP has exceeded that of agriculture. Importantly, "...during 1992-1996, the ratio of FDI inflows to gross fixed capital formation in Uganda reached 10.3 per cent, exceeding not only the average for Africa, but also the average performance of all developing countries"(UNCTAD, 2000: 4). The picture in the late 1990s is less clear as net inflows tended to widely fluctuate. Overall, macro-economic performance indicators suggest that Uganda has performed remarkably well in the post-conflict period. However, this performance has not pulled the country out of the ‘Least Developed Country’ (LDC) bracket. By all standards, Uganda is a typical poor African country and it is frequently asked whether the coun-try has the structural capacity to grow beyond recovery. Reinikka and Svensson (1999) have argued that present and future rates of growth cannot be sustained with-out higher investment and technical change. Several analysts call our attention to the typical and serious constraints faced by Uganda to sustain growth. Its critical shortage of a skilled labour force, high costs and the poor quality of utilities, an improved but still weak tax revenue collection system, high interest rates, corruption, a weak financial sector, the high cost of inputs and a weak science and technology system poorly adapted to meeting the needs of local in-dustry, are often cited among the critical factors constraining private sector led growth (Stamp, 1993; UNCTAD, 2001; MFPED, 2000 and others). The Medium Term Com-petitive Strategy (MTCS) for the Private Sector 2000-2005 (MFPED, 2000) is the key strategy developed by the government to address some of these shortcomings, at least within the private sector. However, the required interface between MTCS and the na-tional science and technology policy does not appear to have yet emerged. Uganda's first national Science and Technology (S&T) policy was only published in 1993 following the Statutory Act of 1990 which established the Uganda National Council of Science and Technology (UNCST). Prior to the formulation of this policy framework, Uganda's national planning and budgeting process produced limited con-sideration to aspects of science and technology let alone innovation policy. In Sep-tember 1997, the UNCST revised the S&T policy and produced a broad policy framework and strategies to guide the science and technology development policy. This was further upgraded in September 2001. Although the policy framework pro-vides some overall direction and asserts the importance of international linkages, it does not define specific actions required to nurture connecting bonds between various domestic policies, industry, organizations, and all the actors that would otherwise constitute a coordinated National System of Innovation (NSI). The section on "Scien-tific and Technological Innovation Policy" lacks depth and evidently requires further development and expansion18. In particular, the Science and Technology Policy up-
18 The text is only a half page long - on page 10, "National Science and Technology Policy", UNCST, MFPED, September 2001

50
graded in September 2001 is still much in need of more embedded functional linkages if it is to contribute to the building of local systems for producing and using knowl-edge and thus address problems germane to technological change in the country. To quote:
“Technological efforts to adopt, improve and adapt foreign technology are very limited at the firm level. Awareness of the need for technological effort is lack-ing. Skill development still occurs in the form of on-the -job training with nota-ble exceptions of some TNCs that invest in formal skill upgrading for employ-ees. A culture of quality and efficiency in manufacturing is beginning to emerge, but it is still confined to a few enterprises. …The science and technology system is weak. Institutions are under funded, without a clear idea of their mandate, and with insufficient links among themselves and more important, with the business [industry] sector. The Ugandan government lacks a strategy for tech-nology development, in the sense of coherent set of policies to remedy market failures and encourage the business sector to take on the initiatives needed” (UNCTAD 2001: 216-217).
Two sets of old traditions persisted from the colonial era to hold back meaningful ef-forts towards technological change in Uganda. First, successive governments wrongly believed that technology would be transferred from the industrialized world without deliberate and parallel efforts to promote and invest in indigenous technology capabil-ity development - the kind of efforts that South Korea, Taiwan and other fast develop-ers in Asia and Latin America pursued in the 50s, 60s and 70s (Dahlman and West-phal 1982; Fransman and King 1984; Lall 1987, 1992; Ernst, Ganiatsos, and Mytelka 1998 and many others). Consequently, a second tradition was maintained in which governments failed to establish well targeted and ‘selective’ interventions to promote the development of local learning and innovation capabilities. As we explain later in chapter 5, the improvements that occurred within Uganda’s Nile Perch fisheries sys-tem in the period 1997-2000 were in a general sense, reactive, not pro-active and the failure to develop a well-coordinated set of learning and innovation policies as part of the reactive learning response to the EU bans(s) is a manifestation of the historically preserved neglect of technological learning and capability development not only in Uganda but also across many other comparable countries. The third important aspect of Uganda’s history is partly a consequence of its troubled past and persistent neglect of technological upgrading. The toll of lost lives and liveli-hoods, social and physical insecurity, a collapsed economy and deplorable social ser-vices, and the commensurate effect of all this on the overall political and socio-economic situation served to dissipate the usual mixture of skepticism and the general preference to preserve that which is already familiar, indecisiveness and negative per-ceptions regarding the relevance and need for political and economic reform. The new post-conflict political leadership closely cooperated with a previously harassed aca-demic and professional elite to engage in meaningful public debate and analysis which when combined with huge inflows of grants and loans from bilateral and multi-lateral development agencies facilitated the relatively smooth introduction and im-plementation of a wide-ranging set of socio-economic reforms. The economic stabili-zation and adjustment programs and their sequencing were radical and in many ways controversial. Macro-economic growth indicators improved remarkably especially from the late 90s but social indicators were either flat or they declined. The unequal

51
distribution of growth benefits persisted, poverty was widespread and technological learning and capability development, necessary to sustain growth and competitive-ness, was still neglected. There were many other short-comings and with time, both the civil society and academia, and the international community exerted pressure for further public debate and analysis, decentralized decision making, inclusiveness and participatory processes. Where some African governments lacked the political will and instead reacted to such demands by doing nothing or by becoming more repres-sive and totalitarian, the post-conflict political and policy-making regime in Uganda learnt to change its working practices, yielded to some of the pressures and gradually improved some of its policies and programmes. This new tempo of a more liberalized and relatively inclusive and progressive political and socio-economic environment since the 90s set the stage for enhanced local and foreign private-sector investment as well as local and international development activity within the country. It created bet-ter conditions for dialogue within the private-sector and between private and public sector agencies. Some international development agencies seized the opportunity to design and implement integrated programs which, as discussed in chapter 6, would play a key role in helping the government to absorb some of the costs while support-ing it along with the industry to access the knowledge inputs critical to its ability to swiftly respond to the EU ban(s) on fish. Across other African countries, especially where political and economic reform was slower, the environment for local and inter-national development support was not as supportive.
3.4 The Choice of Uganda for the Present Study and Generalization of Research
Findings
A number of factors reinforced each other to make Uganda a suitable location for the present study. First, the country has recorded impressive levels of economic growth in an environment of relatively low inflation. At the same time, the country has quite rapidly expanded its industry and service sectors. FDI inflows, particularly in the early 1990s also grew impressively. State control of industry was dramatically re-duced, the economy was opened up and organizational development benefited from donor funding, which has been on the rise since. Overall, the macro-economic condi-tions in Uganda have been favourable, by comparison to other African developing countries, since the 90s. Secondly, this study maps the response of local agro-industry systems to changes in the global trading environment and in this particular case, their response to the Sani-tary and PhytoSanitary (SPS) measures imposed by trading partners. SPS measures can be applied to many agro-related commodities which form the bulk of exports from poor developing countries. Moreover, fish exports are important in several developing countries and notably in Africa, they would include Kenya, Tanzania, Mozambique, Madagascar and Senegal. Together with other non-traditional high-value agricultural exports, this group provides an alternative and promising source of growth not only for Uganda but also for many other comparable countries. However, in many of these countries, the drive towards export diversification has not been sufficiently matched by the need to build local systems for technological learning and innovation. In Uganda’s case, the emphasis (from the mid 80s through the 90s), on liberal trade poli-cies and on an improved infrastructure and macro-economic environment was simply insufficient for the sustained growth of fish exports. As demonstrated by the present study, much more needed to be done to enable technological learning and innovation

52
activities to occur within Uganda’s Nile Perch fisheries industry and it was the promo-tion of such activities that assisted the private-sector driven fisheries industry to sur-vive and remain competitive in export markets. This effort was, however, spontaneous and not part of a well-coordinated effort to build local systems of learning and innova-tion. Because the neglect of local technological learning and innovation processes is a common weakness of many developing countries particularly those in sub-Saharan Africa, the fisheries case in Uganda illustrates the fragility of some of the emerging high-value agro-related exports from Africa and exemplifies what more is needed in order to promote learning and innovation, export competitiveness, and the economic gains to be derived. It was therefore concluded that the results from this study could help inform research and policy development in many other countries. Moreover, the factors that facilitated the enhancement of Uganda’s Nile Perch fisheries system are not remarkably unique for they can be increasingly emulated within the country, the region and by comparable countries as pressures for technological upgrading inten-sify. Findings from our research should therefore bear relevance to varying degrees, to many other sectors and developing countries.
3.5 The Sectors Chosen for Research
The picture emerging from the data in Table 2 is that on average, the percentage share of traditional export crops has generally declined while the contribution of Non-Traditional Agricultural Exports (NTAEs) to Uganda's exports generally increased between 1991 and 2002. The data also show that the fish and fish products sector has increasingly contributed to Uganda’s export growth. This export growth in fish prod-ucts is attributed to the emergence in the late 80s and early 90s of private industrial fish processing of the Nile Perch, a non-endemic species introduced, amidst great con-troversy, to Lake Victoria, a fresh-water lake that also falls within the borders of Tanzania and Kenya in East Africa. When the Food and Agricultural Organization (FAO) of the United Nations assisted the Government of Uganda to conduct a scientific stock assessment of Lake Victoria in the 50s, the results indicated that close to 80 per cent of the lake resources consisted of a family of fish known as Haplochromines. Accounting for more than 500 species, they were considered by local officials to be 'trash fish' as they had “failed to make it to the kitchens and dining places of domestic buyers in Uganda” (author’s field inter-views, 2002). The FAO study sparked off a similar debate to the one that had emerged when a similarly large number of Haplochromines were found in Lake Kyoga, another lake in Uganda. To solve the problem in that lake, the government had introduced a predator (Nile Perch) to feed on the Haplochromines. Since it was indigenous to a nearby lake, Lake Albert, the Nile Perch was already a ‘table fish’ in this part of the country (North Western Uganda).

53
Table 2: Percentage contribution to exports: 1991-2002 (Selected exports-Uganda)
Traditional Exports 1991 1992 1993 1994 1995 1996 1997 1998 1999 2000 2001 2002
Coffee 64.2 65.0 53.1 74.6 66.9 55.8 52.0 55.1 60.1 31.2 21.6 20.7
Cotton 6.4 5.6 2.7 0.8 1.7 2.2 4.9 1.4 3.6 5.5 2.9 2.0
Tea 3.7 5.3 5.5 2.6 1.2 2.2 5.1 5.3 4.5 9.2 6.6 6.7
Tobacco 2.5 2.9 3.5 1.8 1.3 1.0 2.1 4.2 3.1 6.7 7.1 9.7
Non-traditional ex-
ports
Maize 2.3 2.7 11.6 6.2 4.0 2.6 2.5 1.7 1.1 0.6 4.1 2.3
Beans and other leg-umes
2.3 1.9 6.3 2.8 2.8 2.3 2.0 1.2 1.8 1.1 0.5 0.7
Fish and fish products 2.9 4.4 4.4 2.3 5.6 6.5 4.7 7.4 5.2 7.7 17.3 18.8
Cattle hides
1.8 2.3 2.6 2.3 1.8 1.1 1.7 1.1 0.6 3.2 5.6 2.1
Sesame seeds 5.7 4.4 1.4 0.3 1.0 1.3 0.2 0.0 0.30 0.2 0.2 0.1
Soap - - 0.6 0.4 0.5 0.3 0.4 0.3 0.4 0.4 0.6 0.7
Electric current 0.5 1.0 0.4 0.5 0.4 0.6 2.0 2.2 2.8 4.6 2.3 3.3
Cocoa beans 0.2 0.2 0.4 0.1 0.1 0.2 0.2 0.3 0.3 0.3 0.4 0.4
Goat and sheep skins 0.5 0.5 0.3 0.1 0.0 0.0 0.0 0.0 - 2.7
- -
Hoes and hand tools 0.2 0.3 0.2 0.2 0.3 0.1 0.0 0.0 0.05 - 0.1 0.1
Vanilla 0.1 - 0.2 0.1 0.0 0.1 0.0 0.2 0.0 0.2 0.5 1.5
Fruits - - 0.1 0.1 0.0 0.0 0.1 0.1 0.0 0.2 0.02 0.1
Bananas 0.1 0.1 0.1 0.1 0.1 0.1 0.0 0.0 0.1 0.2 0.2 0.1
Roses and Cut Flowers - - 0.1 0.1 0.1 0.4 0.6 1.4 1.5 2.5 3.3 3.8
Gold and gold com-pounds
5.3 0.0 0.0 0.0 4.7 9.2 13.6 3.6 7.0 10.8 10.9 12.9
Other products 1.3 3.2 5.0 4.1 6.9 13.7 7.8 14.3 6.70 10.3 12.7 10.0
Traditional export crops 76.8 78.5 64.8 78.8 74.0 61.1 64.2 65.9 71.3 52.6 38.3 39.1
Non-traditional exports 23.6 22.0 35.2 20.2 27.2 38.9 35.8 34.1 28.7 47.4 61.7 60.9
Note : Percentage total for traditional and non-traditional exports may not add up to 100% due to rounding
Sources: 1991-1995; Statistical Abstract 1999 (Table 14), Uganda Bureau of Statistics 1996-2000, Statistical Abstract 2001(Table 3), Uganda Bureau of Statistics 2001-2002, Statistical Abstract 2002, Uganda Bureau of Statistics (Internet: www.ugandaexportsonline.com/statistics.htm)
The introduction of the predator to Lake Kyoga, so the argument went, had not only helped to reduce the unwanted Haplochromines but had also converted them into table fish because the communities around Lake Kyoga eventually accepted the Perch (which fed on Haplochromines) in their diet. The question therefore became whether or not the Lake Kyoga experiment could be emulated in respect to Lake Victoria. Ge-heb (1997) discussed some of the arguments for and against the introduction of exotic species such as the Nile Perch into a fresh water lake already home to various valu-

54
able fish species such as the Tilapia family. While those in support of its introduction based their argument on the success of the Lake Kyoga experiment, those opposed insisted on a full-scale scientific appraisal before taking any further action. Such cau-tion came as early as the late 1920s (Graham 1929; Worthington 1933). According to the literature, the controversy was never resolved for as Geheb writes; the Nile Perch was 'surreptitiously' introduced into Lake Victoria from the Ugandan side of the lake in the late 1950s19 with further introductions in the early 60s. Between 1983 and 1989 alone, Nile Perch landings had risen from 1400 tonnes to 100,000 tonnes (Namisi, 2000; Nsimbe-Bulega and Akankwasa, 2002) and as the Nile Perch population grew, opportunities for private industrial fish processing and exports grew. These activities were first introduced on the Kenyan side of the lake and were eventually emulated in Uganda in the 80s and early 90s after the improvement of the overall political and economic environment. Around 1991, after Uganda's Ministry of Trade had imposed a ban on the export of unprocessed whole Nile Perch, an influx of investors from neighboring Kenya crossed into Uganda to process Nile Perch that had previously been transported in raw-material form (whole) for processing within the factories already established in Kenya (Nsimbe-Bulega and Wadanya, 1999). For al-most a decade since their start in Uganda, industrial fish-processing activities boomed until the export rupture of the mid 90s. As we shall shortly elaborate, the breakdown resulted from the imposition of SPS standards by the EU and the subsequent condi-tional ban of Uganda’s fish and fish products from the EU market. Remarkably, the Nile Perch processing and export industry in Uganda engaged in intensive learning and innovation activities, successfully re-entered the EU market and has since made substantial contributions to Uganda’s exports. It is the impressive growth of the indus-try, the unprecedented nature of the export crisis, the troubled but not so uncommon history across developing Africa, the impressive recovery and nature of actions under-taken by the authorities in Uganda and, subsequent response by the fisheries sector that facilitated our choice of the Nile Perch fisheries sector in Uganda for research.
3.6 Research Methodology
The study set out to explain the ability of Uganda’s fish processing and exporting firms to innovate. To analyze this problem, we adopted an innovation systems ap-proach for a number of reasons. First, the ability to deal with the EU ban(s) was es-sentially one related to technological change and innovation. Therefore, an approach that places innovation at the center of analysis was needed. Secondly, the approach recognizes that research and development is not the only source of innovation and thirdly, it recognizes and emphasizes the distinction between inventions and innova-tions. Invention is associated with novelty and at times results in patentable innova-tions that advance the world technological frontier. In contrast, innovation processes are wider and they include non-novel innovations in the sense of small improvements or adaptations in products, processes, organization or marketing. Fourthly, the ap-proach takes a wider perspective and considers many factors of relevance be they economic, historical, social or political.
19 See Anderson, 1961; Fryer , 1960; Jackson, 1971 in Geheb (1997); Ogutu-Ohwayo (1999)

55
How would we analyze the strengths and weaknesses of the Nile Perch fisheries inno-vation system? What factors and relationships might have driven the learning and in-novation process in this system? Since the strengths of innovation systems derive from the intensity of the interaction among the various elements, relations and institu-tions defining the system, the first task was to identify these. For this reason, we de-signed a firm-level survey of fish-processing firms but also because we believed that part of the analysis needed to be dedicated to a better understanding of firm-level fac-tors of influence. This was followed by in-depth case studies of fish-processing firms to explore how firm-level competences, including firm-level institutions, affected the intensity of innovation activities and the ways in which various fish-processing firms responded to the new pressures for change. Once the firm-level factors and associated subsystems were identified, the next task was to map the actors in the subsystems and to understand the system elements, relations and dynamics that affected the learning and innovation process.

56
Table 3: Overview of Research Design and Methodology
Method/Approach Purpose
Innovation Systems Approach This is the overall framework used to explain the ability of fish processing firms to innovate
Survey of fish and other food-processing firms in Uganda in 2002 with the aid of a questionnaire
• Assemble data from the entire population of post-ban fish processing firms (9)
• Assemble data from control group (48) The data on these 57 firms is what we refer to as the food-processing dataset
Regression analysis using cross-sectional data (Food-processing dataset: Uganda, 2002)
• Estimate the relative influence of different independent variables on the intensity of in-novation activities
• Use these factors as pointers to the key sub-systems and the dynamics that contributed to the process of innovation
• Identify differences in the intensity of innova-tion activities across systems with institution-ally-augmented markets and those without
Regression analysis using cross-sectional data assembled through RPED studies by The World Bank, Washington(2002) (RPED dataset: Uganda)
Triangulation to crosscheck data and results ob-tained with our small sample (57 food-processing firms including fish processing firms). The RPED sample covered 300 firms spanning 9 sectors (in-dustries)
Interviews across 3 subsystems in the Nile Perch fisheries system and across the control group sys-tems
• Subsystem mediating market institutions: Face to face interviews with key infor-mants, technical staff, managers and workers across several organizations
• Subsystem promoting knowledge genera-tion, accessibility and learning: Face to face interviews
• The Bank and NBFI subsystem: Face to face administration of a structured questionnaire
Assess how well the Nile Perch fisheries innova-tion system functioned in comparison with other food-processing innovation systems without insti-tutionally-augmented markets
• In-depth case studies of 8 fish processing firms(firm level subsystem)
• Evaluation and scoring of innovation ac-tivities introduced by fish processing firms. Evaluation exercise conducted with 5 fisheries scientists in Uganda (2002)
Generate in-depth information useful for examin-ing how the firm-level factors and institutions identified as important for innovation might have affected the proficiency with which individual firms responded to the changes in the set up of the Nile Perch fisheries system

57
How were we to demonstrate that the factors, relations and dynamics identified rea-sonably explained the ability of fish processing firms to undertake innovation proc-esses? We dealt with this through the ‘without’ control group approach. Here, the key con-ceptual guide was the notion of ‘demanding markets’ or what we have called institu-tionally-augmented markets. Fish processing firms export over 98 percent of their processed products largely to the EU market but also to Australia, USA, The Middle East and other countries. Since the late 80s when private, industrial fish processing operations started in Uganda, the largest market has and continues to be the countries within the EU and because this market imposed a new set of enforceable demands on fish imports into the EU, it was, by comparison, a more demanding market. In other words, the Nile Perch sector in Uganda dealt ‘with’ institutionally – augmented mar-kets. What if markets were less demanding? Given our hypothesis that one of the features significantly defining differences in the performance of innovation systems is the de-gree to which markets are institutionally-augmented, we wanted to get a control result for introducing intense innovation activities in the absence of institutionally aug-mented markets (the ‘without’ control group). Five food-processing industries in Uganda were identified and although some of the firms exported a small proportion of their products, in essence, they were domestic market oriented. It is important to clarify that we use the notions of domestic and ex-port orientation in the context of more and less demanding markets. In particular, we were interested in a control population that did not deal with markets as demanding as the EU. The five food-processing industries selected certainly never had to cope with the kind of EU standards faced by fish processing firms. We re-garded the domestic market of the five food-processing industries to be less demand-ing because per capita income is less, purchasing power is lower and standards of liv-ing are lower. Combined with lower levels of literacy, all these characteristics con-strain the ability of consumers in the Ugandan market to specify and place demands or minimum acceptable standards on products and processes of production. Buyers are generally less sophisticated, consumer organizations are weak and with respect to the particular control industries selected, the public-sector did not intervene to articulate and ensure that the demands of consumers were met. This implies that even though no markets are free of institutions, embedded institutions were of the ‘soft’ type. We identified the various food-processing systems in the control group with institutionally non-augmented markets. Table 3 presents an overview of the overall research design and methodology. Some of the details relating to methods and datasets used will be discussed in the following chapters. While a comparative study between Uganda and Kenya or Tanzania, the two neighbours that had to deal with the same series of EU ban(s), is undoubtedly an in-teresting area of further research, the present study concentrated on Uganda particu-larly because of our interest to test the innovation system literature against empirical material. Importantly, this literature insists that the ‘national’ policy and ‘institutional’ environment matters hence the necessity to limit our investigation to a national policy,

58
organizational and institutional setting common to both the fish and food processing sectors covered in the study.
3.6.1 Data Assembly and Fieldwork Procedure
The field research was conducted in Uganda from May to November 2002 prior to which a preliminary visit was arranged to search for aggregate-level data and inter-view key informants. Together with a desk review of secondary materials, findings from this visit guided our choice of the sectors for research. However, aggregate-level data and information gathered during the preliminary visit was found insufficient to determine the parameters of the structured questionnaire. We therefore decided, in the first instance, to visit four (4) fish-processing plants in order to clarify how fish-processing operations were organized and to assess the nature of actual innovation activities. Thereafter, a formal introduction of the study was presented to the govern-ment department responsible for fisheries in Uganda (DFR). Here, 3 officers were ap-pointed to coordinate and facilitate access to fish-processing firms. A total of five (5) weeks was spent at the DFR offices obtaining data, studying company profiles, gen-eral correspondence and policy documents. During the same period, in-depth inter-views were arranged with DFR officers to determine and validate innovation indica-tors, measures and definitions. These were industry-specific and based on actual changes that had occurred within firms. The draft questionnaire was then revised, coded and administered across fish-processing firms via face-to-face interviews. In-depth interviews were conducted during our second visit which also provided the opportunity to complete those parts of the questionnaire that could not be previously completed. DFR officers accompanied the researcher to all interviews, validated re-sponses and assisted in the evaluation of changes introduced by fish-processing firms. A questionnaire for the control group was designed to collect data comparable to that used in the fish questionnaire, but omitting fish-specific parameters. The question-naire was then applied to the entire control group and administered through face-to-face interviews and follow-on visits. At the DFR, we were introduced to a number of intermediaries that contributed to the process of change within the Nile Perch fisheries system. We interviewed across ten (10) organizations (non-firm) and used these visits to assemble published and non-published material. In addition, we identified a loan officer from each of the selected lending institutes that would help put together required data and information from the Bank and Non-Bank Financial Institutes (NBFI) subsystem. These formed a core group of loan officers to archive, assemble data and complete a questionnaire specifi-cally designed for banks and NBFI. They also provided in-depth information about their respective lending operations. This interaction with loan officers also allowed us access to managers, bank lists and addresses of borrowers.
3.6.2 Determination of Control Group and Sample Size
Given the small population of fish-processing firms in Uganda, we interviewed in all nine firms that were operational at the time. They had all experienced the EU series of bans and subsequently complied with the EU’s new SPS and associated exporting re-quirements. Three sets of criteria guided the choice of the control group. We were in-terested in those employing food-processing technologies. These needed to show po-

59
tential to introduce innovative activities possibly brought about by competitive pres-sures and to have identifiable support systems. They also had to be industries where technical standards were either of the ‘soft’ type (not strictly policed) or unavailable. Discussions with key informants and with the Uganda Bureau of Statistics (UBOS) were extremely important for this selection process. Even though accessible lists of borrowers from the bank and non-bank subsystem had too few industrial firms from food-processing industries, they did, however, give an indication of the type of indus-tries lenders tended to extend loans to and the purpose of loans. It was important that the control group population include both the firms that had or had never borrowed. To determine the number of sample units for the control group, the UBOS census20 provided data on the population of firms within each pre-selected industry. Lists pre-viously obtained from industry associations were also used as the UBOS census was still a work in progress. Sample units were determined with the assistance of statisti-cal officers at UBOS. An attempt was also made to proportionately allocate the 57 sample units (Table 4). We adopted a stratified sampling procedure and randomly se-lected the respondent firms.
Table 4: Sample allocation (firms)
Food-processing
industries
(1)
Number of
firms in
sample
(2)
Population
of firms
(3)
Sampling
weight***
(4)
Weighted
sample****
(5)
Sub sector representa-
tion in total weighted
sample (1990)
Fish processing 9 9* 1 9 0.45
Meat processing ( ISIC code 1511)
6 15** 2.5 18 0.90
Fruit processing ( ISIC code 1513)
8 4** 1 8 0.40
Grain processing ( ISIC code 1531)
25 1745** 69.8 1750 87.94
Bakeries (industrial) ( ISIC code 1541)
7 201** 28.7 203 10.20
Fish by-products processing
2 2* 1 2 0.10
Total 57 1976 1990 100.00
Notes:
* DFR records indicated a total of 9 fish processing firms as of July 2002. Towards the end of 2002 (after our fieldwork), 2 more fish processing plants were licensed to operate. These were not included in the sample. Records for processors of fish by-products showed 3 firms but one of them was virtually non-operational
20 This is the Census of Business Establishments (COBE) done by Uganda Bureau of Statistics (UBOS). The census was still a work-in-progress as of November 2002 but UBOS officials supplied us with a classification of total firms counted by food-processing industry, size band and location.

60
** This data is from The Uganda Bureau of Statistics (UBOS) - Census of Business Establishments (COBE). Number of fruit processing firms identified through this study, exceeded UBOS’s count. *** Sampling weight indicates the number of firms in the population that each sample firm is representing - calculated as Column (2) / Column (1). With the exception of grain milling firms, sampling weights for each industry indicate that sample units rep-resented a reasonable proportion of the actual population of firms in each industry
****Weighted sample is Column (3) corrected to the nearest whole number times Column (1)
3.6.3 Size Composition and Firms that Borrowed in the Sample
As demonstrated, we chose a stratified method of sampling to capture the aims of the study. Hence, 60 per cent of sample firms had borrowed from formal lenders21 as bro-ken down in Table 5
Table 5: Firms that borrowed in sample
Industrial food-processing industries
Number of firms that borrowed
Number that did not borrow
Total in sample
Fish processing 5 4 9
Meat-processing 4 2 6
Fruit-processing 2 6 8
Grain-processing 16 9 25
Bakery-processing 6 1 7
Fish by-products processing 1 1 2
Total 34 (60 %) 23 (40 %) 57
We also chose to include all firm-size cohorts. We define firm size in terms of the number of workers. Thus, micro-sized firms employ less than 10 workers while small sized firms have 10-50 workers, medium-sized firms have 51-100 while large firms have in excess of 100. By size distribution, Table 6 shows that 37 per cent of sample firms were in the micro-size category, 42 per cent in the small and medium sized category (SME) while 21 per cent were large.
21 Formal lenders include banks, development finance institutions, leasing companies, Micro Finance Institutions and Credit Institutes

61
Table 6: Sample firms by size category
Size (Number of workers)
Fish-processing
Meat-processing
Fruit-processing
Grain-processing
Bakery-processing
Fish by-products processing
Total
Less than 10 0 3 2 1622 0 0 21 (37%)
10-50 0 2 3 7 4 1 17 (30%)
51-100 1 1 2 0 3 0 7 (12%)
Over 100 8 0 1 2 0 1 12 (21%)
Total 9 6 8 25 7 2 57(100 %)
3.6.4 Regional Distribution of Sample Firms
Data from UBOS showed that Kampala city had the greatest concentration of food-processing firms. In the bakery industry, Kampala had 92 firms (45 %) out of the 201 nation-wide count by UBOS. Mbale had the highest number of grain milling firms, followed by Kampala, Tororo and Iganga districts an indication that Eastern Uganda had a heavier share of grain milling firms (probably because of a longer milling tradi-tion given that most of the milled food products are staples in this region). However, Kampala still had the largest share (14 per cent) of grain milling firms employing more than 10 workers. Tororo had 8.2 per cent, Iganga 7.9 per cent while Mbale had 6.7 per cent of firms with more than 10 workers. Kampala had a grain-milling cluster too, with a heavy concentration of firms with fewer than 10 workers.
Table 7: Location of the Sample firms
Location (town)
Fish - processing
Meat- processing
Fruit- processing
Grain -processing
Bakeries Total firms
Weighted frequency
Percent
Kampala 4 5 7 2023 6 44 1602 80.50
Entebbe 1 0 0 0 0 1 1 0.05
Jinja 3 0 1 0 0 4 4 0.20
Mbale 0 0 0 5 1 6 379 19.05
Soroti 0 1 0 0 0 1 3 0.15
Other 1 0 0 0 0 1 1 0.05
Total 9 6 8 25 7 57 1990 100.00
In the fruit-processing industry, UBOS's data showed that almost all the firms identi-fied were located in and around Kampala. However, the UBOS census seems to have identified and counted fewer firms (4) in the fruits industry than was indicated from the lists obtained from the industry association. In the fish processing industry; Kam-
22 Of the food-processing industries that met our control group selection criteria (see section 3.5), UBOS census data indicated that the grain milling sector was the most heavily populated and the ma-jority of firms there were in the micro and small enterprise category. 23 Within the grain milling stratum, the proportion that had borrowed was greater in the Kampala area.

62
pala alone had a total of 4 out of the 9 firms present in the industry. From Table 7, we can see that our sample units were mainly drawn from the Kampala area mirroring the relatively heavier concentration of industry around Kampala.
3.6.5 Sampling Procedure and Framework for Lenders
Selected lenders spanned a number of categories across Uganda’s credit markets. This would allow a better understanding of ‘institutional’ differences and common ele-ments across lenders in relation to the learning and innovation requirements of firms. Given the small population of banks (15)24 and credit institutes (6) operational in Uganda at the time of our fieldwork, we had planned to assemble data from all banks. This proved to be very difficult as some of the banks and credit intermediaries were simply inaccessible. Eventually, we accessed data from 6 banks and only 1 (one) credit institute (Table 8) albeit the largest and oldest credit institute in the NBFI sub-system. Table 8: Lenders in the Sample
Type of lender Frequency Percent of sample Population Location of Head Office
Bank 6 40 15 Kampala
Credit Institute 1 6.7 625 Kampala
Tier A MFI 4 26.7 6 in Tier A26 Kampala
Private money lender 3 20 Not known Kampala
Leasing Company 1 6.7 127 Kampala
Total 15 100 - Kampala
The characteristics of the 6 banks in terms of the nature of ownership, location, and size of assets, loan performance, number of workers and age all indicated that the sample was reasonably representative28. As of the time of this study, there were only two providers of lease finance. We focused on operations of the largest leasing com-pany. Due to their focus on poverty-based lending to micro-sized firms and the diffi-culties such firms face to technologically upgrade (Hulme and Mosley, 1996), only a few Tier I micro finance organizations were included so as to understand the general contribution made to the innovation process, by this type of lender.
24 By the time of our fieldwork, the previously state-owned Uganda Commercial Bank Ltd. had been acquired by Stanbic Bank (U) Ltd. Thus instead of 16, there were a total of 15 banks. 25 Access to other credit institutes was not possible 26 There were over 500 MFIs in the country as of 2002, mostly operating as non-governmental organi-zations. Some specialized in financial service provision while others engaged in a number of additional non-financial initiatives. According to the Ministry of Finance, Micro and Small Enterprise Policy Unit (MSEPU) in Uganda, Tier A MFIs were the strongest in terms of outreach and sustainability indicators. We included 3 of the 6 classified as Tier ‘A’ MFIs and 1 additional MFI based at the Faculty of Tech-nology, Makerere University to make the total sample of MFIs 4. 27 Besides 1 specialized leasing company, leasing facilities were provided by one development bank and one donor program 28 As often described in the publications by the Bank of Uganda (the central bank)

63
Even though statutory guidelines were in force for ‘money lending’ activities, none of our sources was able to provide a list of registered moneylenders. However, through firm-level interviews, a total of three (3) registered moneylenders were identified and included within the sample. Thus our sample included 6 banks, 1 credit institute, 1 leasing company, 4 micro finance organizations and 3 registered moneylenders.
All lenders in the sample were located in Kampala, to permit easier comparison and interpretation of results. The general structure of Uganda's credit markets had also in-dicated that this was the city with the highest concentration of formal lenders. With the exception of MFIs that were relatively more widely scattered in various parts of the country, other lenders tended to be concentrated in the larger cities and urban cen-ters. Geographically, Kampala had the greatest concentration of lenders.
3.6.6 Assembled Data Sets and Analysis
We assembled data of two types. The first was of the aggregate kind and it had two strands; aggregate-level data on Uganda’s fisheries and fish-processing firms and, ag-gregate-level data on Uganda’s credit markets. Besides aggregate-level datasets, we assembled a firm-level dataset and data on individual lenders. Additionally, informa-tion was assembled from a number of actors within the fisheries and food-processing subsystems. Access was also obtained to RPED data assembled by the World Bank in 2002. Presently, there are three techniques used in the literature for studies of this type. The first technique is detailed qualitative case studies. The second is a survey with the aid of a questionnaire. The data is then quantitatively analyzed to investigate the statisti-cal relationship between the dependent variable [indicator(s) of technical change] and explanatory factors. A third approach, which this study employs, is to combine both and because we take an innovation systems perspective, we move beyond the firm-level to analyze the subsystems within which the firms are embedded.
3.6.7 Limitations
While fish-processing firms were effectively overseen by a ‘competent authority’ that generously supported our data assembly exercise, the absence of a similar agency within the control group industries presented several difficulties. Access to these firms was difficult. Clearly, the level of organization within the control group industries was lower than that across fish-processing firms and partly because of this; we could not obtain sales data (over time) from a majority of firms. Hence, part of the analysis across fish-processing firms could not be completed for non-fish processing firms even though the RPED dataset enabled us to explore some of the relationships for which we lacked data in our small control group sample. Similarly, the problem of gaining access to lists of borrowers, as well as inaccessibility to some banks and credit institutes restricted the number of borrowers and lenders we could sample. In addi-tion, we needed a relatively large volume of information to enable us to capture data on characteristics, product, process and organizational improvements introduced by firms in addition to information on a firm’s relations with a number of actors in the system. Hence, the subject investigated spanned a wide area and required respondents to answer a relatively long and detailed set of questions. This affected the budget and completion time of the study.

64
The next chapter uses the data collected through our survey and that assembled through the RPED program of The World Bank, to identify the factors and associated subsystems, important for innovation.

65
Chapter 4 Defining the Factors and Subsystems
Important for Innovation
4.1 Introduction
The purpose of this chapter is to identify the important factors, associated subsystems and relations, to be further examined, for the analysis of the Nile Perch fisheries and other food-related innovation systems. We use regression analysis primarily as a heu-ristic device to gain a better understanding of the relative importance of various fac-tors in predicting the intensity of innovation activities. Given the limited research into the effects of the financial position of developing country firms in relation to innova-tion processes, a financial gearing variable is included within the analysis29. This is extremely relevant for many developing countries and more so in Africa, where older and more recent studies find that access to and the cost of finance compound the learning difficulties of many firms. Overall, the factors and relations identified as im-portant provide for a focused and more meaningful study of the key aspects within the innovation system and form the framework for a detailed analysis of the factors shap-ing the processes of learning and innovation. Chapter 1 introduced the two main ques-tions to be addressed by this thesis. One of them concerns the factors that might ex-plain the ability of Uganda’s fish processing and export industry to learn and inno-vate. Flowing from this broader question, this chapter seeks answers to the following two sets of sub-questions:
• What is the relative influence of a number of independent variables, including the financial position of firms, on the probability of undertaking intense inno-vation activities?
• Is there a significant difference in the intensity of innovation activities be-tween the fisheries industry and the other food-processing industries in Uganda?
The chapter is structured as follows. Following this introduction, section 4.2 provides a brief overview of firm-level approaches used to examine the factors that influence innovation activities. Section 4.3 presents the variables included in the analysis focus-ing on their definitions, what they measure and the methods used to compute them while section 4.4 provides a brief presentation of the statistical model adopted for the regression analysis. This is followed by a description of the data in section 4.5 and a
29 Using a large dataset of Kenyan firms (some 2000 firms), Green, Kimuyu, Manos and Murinde (2002) have recently underlined the importance of finance for firm-level investment in developing countries especially among the smaller firms. They provided an elegant analysis of how small firms in developing countries raise capital and analyzed their financing behavior in terms of how they make financial gearing decisions. In our analysis, we examine the relative importance of a number of factors including the firm's financial gearing position on innovation activities.

66
presentation of the analytical results in section 4.6. This assessment is first conducted in the context of a small dataset (57 firms) compiled through a survey30 of food-processing firms in Uganda (2002). A comparative dataset is then used to ascertain if the results would remain true with a larger and different dataset. For the comparative analysis, we utilize RPED31 data on Uganda (300 firms) assembled by the World Bank in 2002. The RPED data on Uganda spanned nine (9) different industries while our smaller sample concentrated on firms in the food-processing industry. Similar to the analysis done with our smaller dataset, we also use the RPED dataset to predict the probability to undertake intense innovation activities given the same set of ex-planatory variables. The results are presented and discussed in section 4.6.
4.2 Firm-level Studies of the Factors Influencing Innovation Activities
In Chapter 2, we briefly reviewed research on the effects of various firm characteris-tics on technological capability indices. As with such studies, Rasiah (2004) also computed capability indices but used a technique that aggregates related, normalized, qualitative proxies into a form of index that measures various dimensions of capabil-ity. To compute an index for process technology capability, Rasiah collected data on four proxies: equipment (E), machinery (M), information technology components (ICT) and quality control instruments (QC). Multinomial logistic variables were used to compute E and M: thus average age of over 5 years = 0, 3-5 years =1; 2 to less than 3 years = 2 and less than 2 years =3. ICT was scored on a Likert scale; QC as a dummy variable (QC=1 if cutting edge methods were used and 0 otherwise). A com-monly used normalization formula was used to normalize the scores. Thus, process technology was computed as PT = [E, M, ICT, QC]/4 (Rasiah, 2004:441). We have adopted this technique for the computation of many of the variables used in the re-gression analysis. Other studies have concentrated not on technological capability indices as a dependent variable but on whether certain innovative changes are introduced or not (in a devel-oping country context). For example, the work by Khunder (1989) on informal sector firms in Bangladesh used the probit analysis model to estimate the probability to un-dertake a particular type of innovative change where some or all independent vari-ables were present, otherwise not. For such studies, each firm's decision to undertake a particular type of innovative change is presented as a binary or 0/1 choice variable and the idea is to model the decisions that produce the binary observations. The firm-level analysis in this chapter is undertaken from an innovation systems per-spective. Based on the review conducted in chapter 2, it is recognized that a number of firm-level characteristics and factors in the broader system within which firms are embedded, all matter for learning and innovation processes. Linkages and flows of knowledge matter hence the inclusion of technical assistance as a variable in the analysis. As previously discussed in the literature review (chapter 2), a large body of research identifies export orientation and size as important variables. We include both in the analysis. We also include variables reflecting the level of education of owners and workers. The innovation systems framework suggests that the ability to discon-
30 The fish-processing questionnaire and control group, finance and RPED questionnaires are all pre-sented in a separate addendum to this volume 31 Regional Program on Enterprise Development, The World Bank, Washington D.C.

67
tinue unsuitable historical habits and practices matters for learning and innovation ac-tivities. For our analysis, this might mean that habits and practices of ethnic groupings facilitate or restrain communications, exchanges of information and knowledge and the sharing of resources necessary for innovation activities. But, ethnicity might also represent differences in risk-taking behavior and the prevalence or accessibility of re-sources and other support systems. Besides, these characteristics can change over time as individuals and groups get better educated, as they get exposed to practices of other communities, as survival pressures intensify or as better support systems emerge. Thus, we include ethnicity as a crude indicator of differences in habits and practices (institutions) and recognize that the heuristic results so obtained would require in-depth analysis through case studies (chapter 5). Availability of relevant financing pos-sibilities and the subsequent financial strategy of the firm is considered important, hence the inclusion of financial gearing variables. How well all these interact and their relative importance for innovation processes constitutes the core of the assess-ment conducted in this chapter. We hypothesize a positive sign on the coefficients of most variables: size; export orientation; technical assistance; workers’ education and a negative sign on ethnicity where the sample is dominated by ethnic groupings re-stricted by habits and other institutions ill-suited for effective learning. Technological change literature on developing countries offers only limited guidance on hypothe-sized signs for the financial gearing variable. Placed in the context of existing finance-related literature, we hypothesize a positive sign on the coefficient of non-interest bearing finance. The literature assigns a positive role to equity types of finance such as venture capital. Where such markets are underdeveloped or absent, we expect firms that privilege their financial position with venture-capital substitutes to have greater flexibility to undertake innovation activities. Greater access to bank loans especially loans suitable for learning and innovation processes is expected to better facilitate lump sum investments - in equipment for example. Non-interest bearing finance (such as trade credit or pre-shipment payments by buyers) might ease cash flow problems but fail to provide the time frame and flexibility necessary for firms to engage in learning and innovation activities.
4.3 The Dependent and Explanatory Variables
In this section, we present the variables included in the analysis, focusing on their definitions, what they measure and the methods used to compute them.
4.3a The Dependent Variable: Intensity of Innovation Activities [INNOVA]
INNOVA is a qualitative measure of the intensity of innovation activities. It is a form of composite score whose computation is based on a set of scores achieved by a firm on a number of inter-related indicators and proxies for learning and innovation activi-ties. An appropriate measure was identified for each of the related proxies constituting INNOVA (Tables 9 and 10). While some of the proxies take on a binary 0/1 form, others are categorical variables and are assigned scores based on underlying theory.

68
To make the scale of measurements comparable, we normalized them, as is the tradi-tion in related literature and more recently by Rasiah (2004), using the commonly used formula: Xi - X min
X max - X min where Xi is the value of the variable, Xmin is the minimum value of that variable and X max is its maximum value.

69
Table 9: Computation of the Dependent Variable: Food-processing Dataset
Dependent Variable = Intensity of Innovation Activities [INNOVA]
Food-processing sample
Related proxies for INNOVA Definition How it was computed
1. Introduction of new products [variable q821]
Whether firm introduced new products or not
Binary value 1 if firm introduced new products other-wise 0
2. Number of new products introduced [variable q823]
Number of new products introduced
Normalized categorical variable: >5 new products = score 4=Normalized score 1 4-5 new products = score =3 normalized score 0.75 2-3 new products = score 2= normalized score 0.5 only 1 new product = score 1= normalized score 0.25 zero new products = score 0= normalized score 0
3. Introduction of scientific product analysis/ certification [scientificprodanaly]
Whether firm introduced product certification procedures32
Binary value 1 if product certification was introduced otherwise 0
4. Number of new production processes introduced [numb-newproc]
Number of new processes introduced
>5 new processes =score 4= Normalized score 1 4-5 new processes = score 3= normalized score 0.75 2-3 new processes = score 2= normalized score 0.5 only 1 new processes = score 1= normalized score 0.25 zero new processes = score 0= normalized score 0
5. Introduction of new quality systems such as HACCP or ISO standards [qualitysys-tems]
Whether firm introduced new quality assurance systems
Binary value 1 if quality assurance systems were intro-duced otherwise 0 [HACCP is a preventive process to assure food safety and is discussed in more detail in Chapters 5 and 6]
6. Diversification of practices in supplies' procurement [pro-cure]
Number of changes in procurement practices
Average score on total changes made in procurement based on responses to the 6 multiple choices given to firms in questionnaire
7. Acquisition of equipment new to the firm [acquiredequipment]
Whether firm introduced equipment [new to the firm]
Binary value 1 if the firm acquired new equipment oth-erwise 0
8. Interaction33 [interact]
Number of actors ap-proached for knowledge on products, process and org change
"more than 5" = score 4= Normalized score 1 "4-5 sources" = score 3= normalized score 0.75 "2-3 sources" = score 2 = normalized score 0.5 "1 source" =score 1= normalized score 0.25 "none" = score 0= normalized score 0
9. Payment for knowledge search [payknowledge]
Whether firm made pay-ment for new knowledge
Binary value 1 if the firm made payments related to search for knowledge otherwise 0
10. Actual investment made with finance available [investscore1]
Actual uses made of finance obtained out of 16 possible learning and innovation activities
Average score on total uses made with finance ob-tained/available based on responses to the 16 multiple choices given to firms in questionnaire
INNOVA was computed as (q821 + q823 + scientificprodanaly + numbnewproc + qualitysystems + procure + acquiredequipment + interact + payknowledge + investscore1)/10
32 By taking products to approved laboratory (UNBS) for analysis and certification for example 33 In the sense of a search and learning activity to acquire knowledge

70
Table 10: Computation of the Dependent Variable: RPED Dataset
Dependent Variable = Intensity of Innovation Activities [INNOVARPED]
RPED Uganda sample
Related proxies for INNO-VARPED
Definition How it was computed
1. Introduction of new prod-ucts [newprod]
Whether firm introduced new products or not
Binary value 1 if firm introduced new products other-wise 0 [1 if variables S505F up to S505J are not equal to "NA" or are not missing values]
2. Number of new products introduced [prodnorm]
Number of new products introduced34
Normalized categorical variable: >5 new products = score 4=Normalized score 1 4-5 new products = score 3= normalized score 0.75 2-3 new products = score 2= normalized score 0.5 only 1 new product = score 1= normalized score 0.25 zero new products = score 0= normalized score 0
3. Investment in new technol-ogy [techinvest]
Whether firm introduced new technology in past 3 years
Binary value 1 if firm introduced new technology oth-erwise 0 [1 if s501=1; 0 if s501=2] : see Note 1 to Table 10 (at the end of this chapter)
Number of new production processes introduced [numbnewproc]
Number of new processes introduced
The RPED Uganda survey captured this as part of new products introduced: S505F-S505J. We did not com-pute it separately
Introduction of new quality systems such as HACCP or ISO etc [qualitysystems]
Whether firm introduced new quality assurance systems
In the RPED Uganda survey, this variable was not captured. We also left it out of the computations for INNOVARPED
4. Diversification of practices in supplies’ procurement [procure]
Number of changes in procurement practices
Average score on changes made in procurement prac-tices based on responses to RPED Uganda survey sec-tion IIB question 8 (see Note 2 to Table 10 at the end of this chapter)
5. Acquisition of equipment new to the firm [acqequip]
Whether firm introduced equipment [new to the firm]
Binary value 1 if the firm acquired new equipment otherwise 0
[1 if s213b1≠ "0.0" or s213b2 ≠ "0.0" or s213b3 ≠ "0.0"]
6. Interaction [interact]
Number of interactive learning proxies included among top 3 ways of acquiring technology
Average score on interaction : see Note 3 to Table 10 (at the end of this chapter)
7. Payment for knowledge search [licensefees]
Whether firm made pay-ment for new knowledge
Binary value 1 if the firm made payments related to search for knowledge otherwise 0 [1 if s217a5 >"0.0" or s217a6>"0.0" or s217b5 >"0.0"
or s217b6>"0.0" and ≠ to "NA" or "DK"] : see Note 4 to Table 10:
8. Actual investment made with finance available [investscore1]
Level of investment in processes and facilities that facilitate learning & innovation activities
Average investment score on internal efforts : see Note 5 to Table 10
INNOVARPED was computed as: (newprod + prodnorm + techinvest +procure + acqequip + interact + licensefees + investscore)/ 8
34 Through a command to count products listed in S505f till S505j

71
4.3b The Independent Variables
Many of these variables were computed using a similar normalizing approach. There-fore, we did not elaborate the computation of all but a few of them (Table 11).
Table 11: Explanatory Variables used for the Comparative Analysis
N=57 (Food-processing sample)
N=300 (RPED Uganda sample)
Explanatory Variables and Hypothesized signs
Definition of variable Definition of variable
1. Firm Size [sizenorm]: Positive
Number of workers as of end 2001 (normalized values)
Number of workers as of end 2001 [logsize2001]: (log of num-ber of employees: s405b)
2. Export orientation [exportdes]: Positive
Proportion of exports directed to the more demanding European markets (normalized values)
Whether a firm exports or not [ EXPORTS]: binary variable 1 if :(s202d+ s202e) > 0 or (s202a + s202b) > 0]
3. Workers education [workerseduc]: Positive
Highest level of education reported among workers (normalized scores : see note 1 to Table 11(at the end of this chapter)
Highest level of education re-ported among workers [workeducation] (normalized scores for s403b1 up to s403b8: see note 2 to Table 11 (end of this chapter)
4. Technical assistance [tecassist]: Positive
Number of sources in and outside Uganda that provided technical as-sistance to the firm
Hire of expatriates (expatshire=1 if s410e>"0")
5. Ownership [owners] : uncertain
Proportion of non-indigenous/African owners in own-ership structure
Ethnicity of owner (s115d) 35 [ethnicity]
6. Share of bank loans in financial gearing of firm (bank1) : uncertain
Share of bank loans in interest and non-interest finance used for work-ing capital and new investment
Contribution of interest-bearing finance to working capital & new investment [interestbearing]: see note 3 to Table 11
7. Share of advance pay-ments from customers in financial gearing (advpay) : uncertain
Share of advance payments in inter-est and non-interest finance used for working capital and new investment
Contribution of non interest-bearing finance to working capital & new investment [noninterest]: see note 3 to Table 11
8. Type of product proc-essed(q12)
Main product processed (to capture product-specific catalysts& scope for innovation)
Type of manufacturing activity (main product dealt in: code02)
9. Age of firm (age2)
Number of years (squared) since start year of food processing opera-tions in Uganda (normalised values)
Number of years (squared) since start year in Uganda (AGEUganda2) (normalised values)
35 1 if "African" ; 2 if "Asian" ; 3 if "Lebanese/Middle Eastern" ; 4 if European/American" ; 5 if "Other"

72
4.4 The Statistical Model Adopted for Data Analysis
Our dependent variable (INNOVA) measures the intensity of innovation activities. It has a mixture of discrete and continuous properties and takes on values between 0 and 1 because of the restrictions and censoring mechanism employed for its empirical re-alization. Conceptually, the ‘intensity of innovation activities’ can be viewed as the product of an underlying, unobserved propensity or stimulus to innovate. This is a common and largely plausible assumption in the case of models dealing with qualitative dependent variables such as logit or probit models. In both cases, the variable of theoretical in-terest (y*), is unobserved. Instead, what is observed is a dummy variable, y that can take only two values: 1 if y* is greater than zero, 0 otherwise. In this case, y is a bi-nary variable simply coded as “1” or “0” to denote the occurrence or non-occurrence of the phenomenon or attribute in question. This would be more appropriate where one was only interested in whether or not particular innovative changes were intro-duced instead of the intensity of a set of innovation activities. Importantly, our dependent variable does not represent a particular innovative change and restricting its form to the standard “yes” or “no” binary form would result in a loss of information due to the misspecification of the type of data we have. In sum, INNOVA takes on values ranging from 0 and 1 which necessitates choosing an alter-native estimation model. The Tobit model36 is a widely used alternative as it provides a meaningful way of modeling this type of data. The standard Tobit model is based on a latent variable model defined as:
Yi* = Xiβ + εi where, Yi* is the latent unobserved variable (propensity to innovate),
Xi is the vector or set of the independent variables (defined in section 4.3b)
β is the vector of coefficients and the
εi‘s are error terms
The latent variable (propensity to innovate) is only observed if Yi* > 0 so that the ac-tual dependent variable Yi [INNOVA]:
Yi = Yi* if Yi* (same as Xiβ + εi) > 0,
36 According to Gujarati (1995), The Tobit model, developed by James Tobin, is an extension of the probit model. As applied here, one of our interests is to predict each firm’s score on INNOVA in rela-tion to a number of independent variables. But if the firm does not engage in the particular innovative activities selected to constitute INNOVA, we have no data on INNOVA for that firm even though we have the firm’s data on size, personnel education, and export orientation and so on. Thus, the sample is divided into two groups. The first group consists of firms about whom we have information both on INNOVA as well as the independent variables while the second group consists of firms about whom we have information only on the independent variables (say firm size, workers education and others) but not on INNOVA. “A sample in which information is available only for some observations is known as a censored sample” (Gujarati, 1995:572). The scoring procedure we adopted also put restrictions on the values taken by the various proxies constituting INNOVA.

73
Yi = 0, otherwise i.e. if Yi* ≤ 0
The Tobit model will therefore assume that observations in Yi [INNOVA] satisfy Yi = max (Yi*, 0) in estimating a regression model. In our case, the model is:
Tobit: INNOVA= c+β1size+β2exports+β3workerseduc+β4tecassist+β5ethnicity
+β6 interestbearing +β7 noninterest +ε,
where c is a constant and ε the distribution of the error term As with the probit and logit models, the assumption that Yi comes from an underlying regression model (Yi*) implies that an appropriate and more effective method for es-timation is maximum likelihood, not Ordinary Least Squares. The relevant mathe-matical proofs for this as well as the detailed procedure for the estimation of the Tobit model are comprehensively described in most econometrics texts such as Greene (1993). Sigelman and Zeng (1999) provide a helpful review. In short, the Tobit model uses a likelihood function to estimate:
a) the likelihood that the outcome variable Yi [INNOVA] is fully observed or not
b) the predicted score on Yi for outcomes that are fully observed thereby in-dicating and helping to account for variability among the different levels of Yi
As with the OLS model (Ordinary Least Squares), marginal effects computed via the Tobit model depict the relative influence of independent variables on the dependent variable. We adopted and applied the standard Tobit model using the Statistics/Data Analysis package (STATA 7 software).
4.5 Description of the Data
This study used two datasets. The first is from a survey of 57 food-processing firms conducted in Uganda in 2002 while the second is from the RPED Uganda survey con-ducted by the World Bank in 2002. In this section we shall provide some descriptive characteristics of the firms included in both surveys. From Table 12, we can see that the food-processing dataset was smaller and covered a sample of 57 firms from 5 agro-related industries within the food-processing sector. In the RPED sample of 300 firms, 9 industries were covered out of which agro-industry constituted almost 41 percent of the firms in this dataset. Even though the RPED sur-vey did not set out to explicitly examine the factors affecting learning and innovation activities, it is of interest that most of the variables we included were also incorpo-rated in the RPED survey. Reference to this dataset therefore provided a good oppor-tunity for a number of comparative assessments and for the triangulation of the data. An overview of the data from both surveys is provided in Appendix 1.

74
Table 12: The Structure of the Datasets
The Food-processing sample: Uganda RPED sample :Uganda
Author's Survey: 2002
RPED Uganda Survey ,The World Bank : 2002
N= 57 %age in sample
N= 300 %age in sample
Sectors 1. Food-processing a) Fish processing (9) b) Meat processing (6) c) Fruit processing (8) d) Grain processing (25) e) Industrial bakeries (7) f) Fish by-products processing (2)
Total = 57 firms
15.8 10.5 14.0 43.9 12.3 3.5
100 %
1. Agro industry (122) 2. Chemicals and Paints (18) 3. Construction Materials (40) 4. Furniture (47) 5. Metals (21) 6. Paper, Printing, Publishing (23) 7. Plastic (7) 8. Textile and Leather (15) 9. Wood (7) Total = 300 firms
40.7 6.0 13.3 15.7 7.0 7.7 2.3 5.0 2.3
100%
For both datasets, micro and small enterprises37 accounted for over 65 per cent of the sample given that this category often dominates the private enterprise sector of devel-oping countries comparable to Uganda. Close to 80 per cent of the firms were local, owned by Ugandan nationals, were on average 10 years old and both datasets indicate that the majority of workers had achieved only primary or lower secondary schooling. Over 60 per cent of firms included in both surveys were domestic market oriented. Exporting firms were fewer and only a tiny proportion of exporters directed a sizeable portion of their exports to the more demanding Western markets. The majority was male owned and both datasets indicated that only a small proportion received techni-cal assistance. Similarly, only a small proportion of both samples arranged various means to train their workforce. Perhaps one of the notable differences in the two sam-ples is the proportion of firms that had accessed loans. In our food-processing survey, close to 60 per cent of firms had accessed loans in one form or another be it from money lenders, microfinance institutions, and commercial or development banks. The 60 per cent access is not a finding of the study but a reflection of the stratified sam-pling used to include borrowers as one of the strata within the food-processing sam-ple. Nevertheless, both datasets reveal two important aspects of firms' financial be-havior. Firms tend to rely not on one but on a range of sources to meet their financing needs. They combine interest-bearing finance with non-interest-bearing finance to meet the demands for working capital and new investment. Secondly, the data indicated that firms in Uganda relied more on non-interest bearing finance such as trade credit, ad-vance payments from customers, internal cash flow or even intra-firm cash flow movements within the parent firm. This seemed plausible and generally true even for the more developed financial settings where firms often have a wider menu of financ-ing possibilities available to them as they strive to manage their debt-equity ratio.
37 The classification of firm size categories follows the definition we adopted for this thesis. Differ-ences between our definition of firm size and that of the RPED World Bank Program do not affect the specific points made here

75
4.6 Results of the Regression Analysis
The results are presented in Tables 13a, 13b and 14. Applied to the two datasets, the Tobit model shows comparable results and the chi-squared statistics indicate that as a whole, the estimated model provides a reasonably good fit of the data. From the re-gressions reported, we also see that many of the hypothesized variables are important as they significantly influence the probability of undertaking intense innovation ac-tivities. This is true for both the more sector-specific food-processing data and the more diverse RPED data. Obtained signs do not vary from those hypothesized. For instance, in regression #1(Table13a), the negative sign on the coefficient of the export destination variable implies that a lower proportion of exports to the more-demanding markets tended to reduce the probability of intense innovation activities. Regression #1 also shows a negative sign on the coefficient of the variable q12. We previously mentioned (Table 11) that q12 is a proxy variable for the type of processing firm or activity whose codes were as follows: 100= fish processing; 200= meat processing; 300= fruits processing; 400=grain processing; 500=bakery processing; 600=fish by-products processing. The negative sign on q12 therefore indicates that an increase in the assigned value/code of q12 lowers the probability of intense innovation activities. We can also see from regression #3 in Table 13b that the estimated marginal effects of some of the variables are relatively high. For instance, the data shows that a one-point increase in workers’ education (workereduc) increases the probability of intense inno-vation activities by 24 per cent across the food-processing sample and by 23 per cent across the RPED sample. A unit increase in firm size tends to increase the probability by 23 per cent in the food-processing sample and by 4 per cent in the RPED sample.

76
Table 13a: Results of the Regression Analysis
Dependent Variable: Intensity of Innovation activities [INNOVA]
Tobit regressions: Food-processing data Tobit regressions: RPED data
Regression #1: (Coefficients38)
Regression #2 (Coefficients): [without owner-ship variable]
Regression #1: (Coefficients)
Regression #2 (Coefficients): [`without own-ership variable]
The constant 0.33 (4.70) ***
0.32 (4.58) ***
The constant - 0.20 (- 4.43) ***
- 0.17 (- 4.75)***
sizenorm 0.24 0.24 logsize2001 0.04 0.02
( 3.82) *** (3.82)*** ( 3.79) *** (2.55)**
exportdes - 0.16 - 0.20 EXPORTS 0.09 0.06
( -1.80) * (-2.51)** ( 2.64) ** (2.20)**
workerseduc 0.24 0.23 workeducation 0.23 0.23
( 3.36) ** (3.24)** ( 2.02) ** (2.18)**
tecassist 0.16 0.16 expatshire 0.06 0.05
( 2.61) ** (2.63)** ( 1.75)* (1.99)**
owners - 0.06 (dropped ethnicity - 0.02 (dropped
(- 1.00) (dropped) (- 1.02) (dropped)
bank1 0.02 0.03 interestbearing 1.46 1.45
(2.15) ** (2.34)** ( 4.15) *** (4.72)***
advpay - 0.03 - 0.03 noninterest 1.29 1.13
(- 1.84) * (-1.60) ( 7.59) *** (7.63)***
age2 - 0.07 - 0.07 AGEUganda2 - 0.15 - 0.05
(- 0.74) (-0.77) (- 1.31) (- 0.49)
q12 - 0.0004 - 0.0004 code02 0.0003 0.003
(- 2.85) * (-2.77)* ( 0.07) ( 0.79)
LR chi2: (- 2) * Log like-lihood ratio39
75.66 *** 74.66*** 124.69 *** 130.93 ***
No. of Observa-tions
53 53 231 284
Significance levels: *** 1%; ** 5%; * 10%
38 Figures in parentheses are the t-statistics t and P>|t|, a test of the coefficient being zero 39 This is the chi-squared statistic for the fitted model given by (-2) times the log likelihood ratio which is simply a test of the null hypothesis that all coefficients are zero except the constant. The statistic in-dicates how well the fitted model fits the data.

77
Table 13b: Results of the Regression Analysis
Dependent Variable: Intensity of Innovation activities [INNOVA]
Tobit regressions: Food-processing data Tobit regressions: RPED data
Regression #3: [with export destination vari-able in regres-sion] (marginal ef-fects)
Regression #4: [without export dest. variable] (marginal ef-fects)
Regression #3: [with EX-PORTS variable in regression] (marginal ef-fects)
Regression #4: [without EXPORTS variable] (marginal effects)
Coefficient of underlying con-stant
.33 (4.70) ***
.28 (4.20) ***
Coefficient of underlying con-stant
-0.20 (- 4.43) ***
- 0.21 (- 4.44)***
sizenorm 0.23 0.18 logsize2001 0.04 0.04
(3.82)*** ( 3.26) *** ( 3.79) *** (4.04)**
exportdes - 0.16 dropped EXPORTS 0.09 dropped
(-1.80)* dropped ( 2.64) ** dropped
workerseduc 0.24 0.26 workeducation 0.23 0.24
(3.36)*** ( 3.57) *** ( 2.02) ** (2.04)**
tecassist 0.16 0.13 expatshire 0.06 0.09
(2.61)** ( 2.18) ** ( 1.75)* (2.59)**
owners - 0.06 - 0.11 ethnicity - 0.02 - 0.02
(-1.00) (- 1.97)** (- 1.02) (- 0.73)
bank1 0.02 0.02 interestbearing 1.46 1. 59
(2.15)** (1.90) * ( 4.15) *** (4.48)***
advpay - 0.03 - 0.04 noninterest 1.29 1.29
(-1.84)* (- 2.62) ** ( 7.59) *** (7.46)***
age2 - 0.07 - 0.05 AGEUganda2 - 0.15 - 0.14
(- 0.74) (- 0.55) (- 1.31) (- 1.18)
q12 - 0.0004 - 0.0003 code02 0.0003 - 0.002
(- 2.85)** (- 2.20) ** ( 0.07) - ( 0.41)
LR chi2: (- 2) * Log likeli-hood ra-tio(underlying regression)
75.66***
72.50*** 124.69 *** 117.79 ***
No. of Observa-tions
53 53 231 231
Significance levels: *** 1%; ** 5%; * 10% Figures in parentheses are z-statistics, z and P>|z|, a test of the underlying coefficient being zero

78
Regression #3 in Table 13b also indicates that a one-point increase in technical assis-tance increases the probability of intense innovation activities by 16 per cent in the food-processing sample while access to technical assistance tends to increase the probability of INNOVA by 6 per cent in the RPED sample. Across the more sector-specific food processing sample, almost all the control group industries (meat, fruits, grain and bakery processing) were less export-intensive and simple tabulations of IN-NOVA by industry and by export-intensity indicated that they had lower probability for intense innovation activities than the fish processing and exporting industry. In the context of the RPED sample, a shift from non-exporting to exporting status increases the chance of undertaking intense innovation activities by 9 per cent. The ethnicity variable does not pick up any variation across the more diverse RPED sample. With respect to the food-processing sample, however, we find that the ethnic-ity variable improves the performance of the model and picks up some variation when the export destination variable is excluded from the regression as in regression # 4. Its relative effect becomes significant indicating a lower probability (1.97 percentage points) to undertake intense innovation activities across firms headed by local African Ugandans which accords with some of the findings in the earlier reviewed literature. As hypothesized, this might have to do with the persistence of historical habits and practices not favourable to learning and innovation processes although this certainly requires further in-depth case study analysis to gain a better understanding of how the interaction with the more demanding export markets might moderate the negative in-fluence of historical norms and conventions on the firm’s learning and innovation processes. The estimated marginal effects of the financial gearing variables are major, positive and highly significant especially in relation to the RPED dataset. A unit increase in the ratio of non-interest bearing finance to total financing (noninterest), other things remaining unchanged, would increase the probability of INNOVA by about 1.29 per-centage points. Across the RPED sample, a unit increase in the share of interest-bearing finance would increase the probability of INNOVA by about 1.46 percentage points while a share of bank loans in the firm’s financing position tends to increase the probability by about 2 percent across the food-processing sample. However, in relation to the food-processing data, a unit increase in the share of advance payments (by customers) in the financial position of the firm lowers the probability of INNOVA by about 0.03 percentage points. As hypothesized earlier, such payments do provide critical working capital but the general norms and rules (institutions) governing this type of financing might not necessarily offer the flexibility required to undertake in-tense innovation activities. What this tells us is that bank loans and other types of interest-bearing finance are im-portant which in the context of Uganda would imply that in the absence of a func-tional venture capital market, relatively low-cost investment-type loans combined with conventional working capital loans matter for learning and innovation processes. This is probably because they allow firms to make lump sum investments while assist-ing them to meet the day to day operational requirements. But, high-cost loans might cripple innovation processes unless the firm complements them with a variety of non-interest bearing finance such as trade credit, new equity from local or foreign inves-tors or other types of non-interest finance. The nature of this interaction however, be-tween interest-bearing and non interest-bearing finance is still not clear from these

79
aggregate-level results which underlines the need for further in-depth case studies as is presented in the next chapter. Further analysis of the RPED dataset showed two additional factors of importance to learning and innovation processes. Both are learning variables and include the years of prior experience accumulated by the owner in the same industry [indexper] and the proportion of staff trained in required skills [traincov]. What is striking is that when the entire matrix of explanatory factors is restricted to a food-processing sample excluding fish processing and exporting firms, the overall likelihood to observe intense innovation activities (INNOVA) in Table 14 drops from 0.34 in regression #1 to 0.30 (regression #5). With respect to the RPED data, the probability drops from 0.17 to 0.14 (regression # 6) when exporting firms (20 percent of the RPED sample) are excluded from the analysis. Probing this further, we tested the hypothesis that the average predicted probability of INNOVA between exporting and non-exporting firms was the same in the RPED sample, an equality restriction that was easily rejected. For the food-processing dataset, a tabulation of the predicted probability for intense innovation activities was highest for the fish processing indus-try (mean = 0.64) followed by the fruits processing industry (0.407), the meat process-ing industry (0.405), bakeries (0.32) and fish byproducts processing (0.27). The grain processing industry came last at 0.22.

80
Table 14: The Likelihood to Observe Intense Innovation Activities (INNOVA)
Dependent Variable: Intensity of Innovation activities [INNOVA]
Tobit regressions: Food-processing data Tobit regressions: RPED data
Regression #5: without fish processing firms (marginal ef-fects)
Regression #1: already includes fish processing firms (marginal ef-fects)
Regression #1: All RPED firms (marginal effects)
Regression #6: if EX-PORTS==0 (i.e. RPED non-exporters only) (marginal ef-fects)
Coefficient of underlying con-stant
0.39 (5.29)***
0.33 (4.70)***
Coefficient of underlying con-stant
- 0.20 (- 4.43) ***
- 0.31 (- 5.89)***
sizenorm 0.25 0.24 logsize2001 0.04 0.03
(4.40)*** (3.82)*** ( 3.79) *** (3.40)***
exportdes 0.06 - 0.16 EXPORTS 0.09 dropped
(0.44) (-1.80)* ( 2.64) ** dropped
workerseduc 0.21 0.24 workeducation 0.23 0.25
(2.73)** (3.36)*** ( 2.02) ** (1.99)**
tecassist 0.25 0.16 expatshire 0.06 0.04
(3.63)*** (2.61)** ( 1.75)* (1.01)
owners - 0.13 - 0.06 ethnicity - 0.02 - 0.0008
(-1.85)* (-1.00) (- 1.02) (- 0.03)
bank1 0.02 0.02 interestbearing 1.46 2.49
(1.43) (2.15)** ( 4.15) *** (5.97)***
advpay - 0.04 - 0.03 noninterest 1.29 1.65
(- 2.44)** (-1.84)* ( 7.59) *** (8.78)***
age2 - 0.06 - 0.07 AGEUganda2 - 0.15 - 0.22
- 0.67 (- 0.74) (- 1.31) (- 1.45)
q12 - 0.0006 - 0.0004 code02 0.0003 0.003
(-3.66)*** (- 2.85)** ( 0.07) (0.63)
LR chi2: (- 2) * Log likeli-hood ra-tio(underlying regression)
68.35*** 75.66*** 124.69 *** 112.16***
Maximum likeli-
hood for the
whole matrix
0.30 0.34 0.17 0.14
No. of Observa-tions
46 53 231 194
Significance levels: *** 1%; ** 5%; * 10% Figures in parentheses are z-statistics, z and P>|z|, a test of the underlying coefficient being zero

81
Hence, we find that the observed and predicted probability for intense innovation ac-tivities is higher among the more export-oriented industries and within the food-processing sample, it is the export-intensive Nile Perch fish processing industry where the observed and predicted probability for intense innovation activities is highest. However, the detailed case studies discussed in the next chapter shall show that this industry had always been export intensive though not necessarily engaged in intense innovation activities which implies that the higher intensity of innovation activities observed was not simply a matter of strong export orientation or merely the introduc-tion of the activity needed to overcome the SPS related EU ban(s). On the contrary, available empirical material shows that the ability of the fish processing industry to deal with the SPS ban was fundamentally one related to technological change and in-novation. Chapters 6 and 7 will illustrate the wide gulf that existed between the fish processing industry where, the conditions for more intense technological change and innovation activities emerged, and the control group industries where the relevant fac-tors necessary for technological change and innovation were absent. Some studies have found the profit position of a firm to be highly correlated with the probability that the firm undertakes learning and innovation activities some of which might require investment (for example, see Svensson's analysis [2000] based on a dataset in Uganda). To test this result, we included a proxy indicator of a firms' profit position40 in the base model reported in Table 13a. The profit position did not directly pick up any variation in INNOVA even when we considered a change in profits in relation to a firm's initial profit position (in the year 2000). However, further scrutiny showed that the probability to undertake intense innovation activities was signifi-cantly higher among firms with a higher profit position, given the rejection of a sim-ple t-test imposing a restriction on the equality of means. An equality test of the profit position of firms (means) among exporters and non-exporters also indicated that the profit position of exporters was significantly higher than that of non-exporting firms, which implies that the demands placed upon exporting firms enhance the probability that they undertake intense innovation activities as a means of enhancing their posi-tion and growth opportunities in markets. Overall, both the food-processing and RPED samples provide reasonable evidence to support the hypothesis that the workers' education level, size of the firm, technical as-sistance, export market-orientation and financial gearing variables are important for innovation processes. Both interest-bearing finance and non-interest-bearing finance matter. Other variables found important at least from the RPED sample include indus-try experience and trained staff. The ethnicity variable picks up some variation in IN-NOVA in the food-processing sample although it has no discernible effect in the RPED sample. The identified factors are important because they tend to directly and indirectly affect a firms' profit position and hence the probability that it undertakes intense innovation activities.
40 As in Svensson (2000), Profit was computed as gross sales minus total operating costs and interest payments. For each of the 3 years i.e. 2000, 2001 and 2002, operating cost was measured as the total of raw material costs (deflated), electricity, fuel, other, salaries, allowances, administrative costs and additional overheads. In RPED data, interest payments were captured in variable s238A, B and C. To take account of profit in present and past periods, we took cumulative profit for all 3 years normalized

82
Notes to Table 10: Computation of the Dependent Variable (RPED Dataset) Note 1: The RPED Uganda survey (2002) did not ask if firms introduced scientific product analysis/ certification procedures. In the place of this variable, we took data on 'in-vestment in technology' as one of the related proxies constituting INNOVARPED Note 2: It can be deduced that a firm made an innovative change in its procurement practices if the share of raw materials bought from domestic producers increased between 2001 and 2002: [1 if s208c > s208f other wise 0] or where firm switched from domestic to imported inputs to cut costs and/or get better quality supplies [1 if (s208a + s208b) > (s208d + s208e) otherwise 0] Note 3: The RPED Uganda survey (2002) did not capture this as number of actors but it asked for 3 leading ways in which the ‘establishment’ acquired technology: S5061 till S5063. Among others, these alternatives included buyers, suppliers, business associa-tion, trade fairs, study tours, consultants, universities/other organizations and competi-tors. Score 1 was assigned to each of these interactive learning proxies where the re-spondent included any of them among the top 3 ways of acquiring technology. Note 4: RPED Uganda (2002) did not ask if firms made payments for new knowledge on products, process or organizational change but asked whether a firm had paid any li-cense fees or royalties which is one of the ways to acquire knowledge. Note 5: RPED Uganda (2002) did not seek information on actual investments made with fi-nance. Comparable data was obtained from 3 aspects previously not captured in any of the already computed proxies for the INNOVARPED composite. The first was whether ‘adaptation of technology internally’ was one of the 3 most important ways of acquiring technology i.e. if any of S5061-5063 is =5 [invest1=1 if s5061=5 or s5062 = 5 or s5063 =5 otherwise 0]. Investment in internet access S608B is the sec-ond aspect [internet=1 if s608b=1 otherwise 0 if s608b=2]. The third aspect is in-vestment in computers [percent of workforce that use a computer in their jobs: S504:
76 -100% = score 4 = normalized score 1; 51-75% = score 3 = normalized score 0.75; 26-50% = score 2 = normalized score 0.5; 1-25% = score 1= normalized score 0.25; <1% = score 0 = normalized score 0.
Intuitively, all three aspects reflect learning and innovation activities. 'Investscore' was thus computed as: (invest1+internet +computernorm) / 3

83
Notes to Table 11: Explanatory Variables used in the Comparative Analysis Note1: The food-processing dataset contained data on: a) Owners formal education b) Owners' technical education c) Workers' formal general education d) Workers' technical education For each of the above, 6 fixed bands of education were included in the questionnaire:
• university education
• post-A level diploma
• just A-levels (Advanced Level secondary education)
• just O-Levels (Ordinary Level secondary education)
• just Primary leaving Certificate (PLE)
• no PLE The questionnaire recorded the proportion of workers and owners that had attained a certain level of education. Thus for each of the above education bands, categorical data was assembled which permitted scoring and normalization as follows: Highest score = 25; Lowest = 0(zero) score 25 when 100% of workers have university degree: normalized score = 1 score 24 when 76-99% of workers have university degree: normalized score = 0.96 score 23 when 51-75% of workers have university degree: normalized score = 0.92 score 22 when 26-50% of workers have university degree: normalized score = 0.88
score 21 when ≤ 25% of workers have university degree: normalized score = 0.84 score 20 when 100% of workers have post A-level diploma: normalized score = 0.8 score 19 when 76-99% of workers have post A-level diploma: normalized score = 0.76 score 18 when 51-75% of workers have post A-level diploma: normalized score = 0.72 score 17 when 26-50% of workers have post A-level diploma: normalized score = 0.68
score 16 when ≤ 25% of workers have post A-level diploma: normalized score = 0.64 score 15 when 100% of workers have only A-Levels: normalized score = 0.6 score 14 when 76-99% of workers have only A-Levels: normalized score = 0.56 score 13 when 51-75% of workers have only A-Levels: normalized score = 0.52 score 12 when 26-50% of workers have only A-Levels: normalized score = 0.48
score 11 when ≤ 25% of workers have only A-Levels: normalized score = 0.44 score 10 when 100% of workers have only O-Levels: normalized score = 0.4 score 9 when 76-99% of workers have only O-Levels: normalized score = 0.36 score 8 when 51-75% of workers have only O-Levels: normalized score = 0.32 score 7 when 26-50% of workers have only O-Levels: normalized score = 0.28
score 6 when ≤ 25% of workers have only O-Levels: normalized score = 0.24 score 5 when 100% of workers have only PLE: normalized score = 0.2 score 4 when 76-99% of workers have only PLE: normalized score = 0.16 score 3 when 51-75% of workers have only PLE: normalized score = 0.12 score 2 when 26-50% of workers have only PLE: normalized score = 0.08
score 1 when ≤ 25% workers have only PLE: normalized score = 0.04 score 0 when workers have below PLE: normalized score = 0 We took the normalized value of the highest education-band, circled by the firm, as a proxy indicator of workers general education. For example, if the highest education

84
band circled by firm Z was ‘51-75% of workers have only O-levels’, the normalized score for this firm (Firm Z) in respect to workers general education, would be 0.32. The procedure was repeated for workers' technical education. The variable ‘workers education’ is a simple average of the normalized scores for workers' general and tech-nical education. The same approach was adopted to generate a proxy indicator for owners' education. Note 2: The RPED Uganda dataset contained data on workers' education by gender and edu-cation of the head (owner or top manager). As a percentage of the total number of workers (s401) reported in RPED, the variable was comparable to the workers' educa-tion variable even though workers' technical education was not included as in the food-processing sample. The scoring and normalization procedure was as follows: Education of head (RPED dataset): score 1 = code 1(no education) = normalized score = 0 score 2 = code 2(primary school) = normalized score = 0.16 score 3 = code 3(secondary school) = normalized score = 0.33 score 4 = code 4 (vocation training- not included elsewhere) = normalized score = 0.5 score 5 = code 5 (university degree (BA, B.Sc., etc) = normalized score = 0.66 score 6 = code 6 (post-grad degree (Masters, PhD, etc) = normalized score = 0.83 score 7 = code 7 (other university program) = normalized score = 1
Workers' education (RPED dataset): Highest score is 15 and lowest is zero score 15 when 100% of workers have more than undergrad degree: normalized score = 1 score 14 when 76-99% of workers have more than undergrad degree: normalized score = 0.93 score 13 when 51-75% of workers have more than undergrad degree: normalized score = 0.86 score 12 when 26-50% of workers have more than undergrad degree: normalized score = 0.8
score 11 when ≤ 25% of workers have more than undergrad degree: normalized score = 0.73 score 10 when 100% of workers have more than secondary school: normalized score = 0.66 score 9 when 76-99% of workers have more than secondary school: normalized score = 0.6 score 8 when 51-75% of workers have more than secondary school: normalized score = 0.53 score 7 when 26-50% of workers have more than secondary school: normalized score = 0.46
score 6 when ≤ 25% of workers have more than secondary school: normalized score = 0.4 score 5 when 100% of workers have only secondary school: normalized score = 0.33 score 4 when 76-99% of workers have only secondary school: normalized score = 0.26 score 3 when 51-75% of workers have only secondary school: normalized score = 0.2 score 2 when 26-50% of workers have only secondary school: normalized score = 0.13
score 1 when ≤ 25% of workers have only secondary school: normalized score = 0.06 score 0 when workers have only primary school: normalized score = 0
Note 3: Both surveys asked for the percentage contribution of various sources of finance to a firm's operations (working capital and investment). The sources include banks both local and foreign [bankslocal; banksforeign], leasing companies [leasing], develop-ment finance companies and organizations [development], trade credit [tradecr], trade in stock [equitystock], advance payments by customers(food-processing sample), friends and family[friendfamily], money lenders[monylend] and other sources[othfinsource]. The contribution of each source is an average of the reported contribution to working capital, and that to investment capital (the food-processing

85
survey captured similar data even though it did not make this distinction). Averages were normalized as follows: RPED data:
• intern = (s336a1+s336b1num)/200 (normalized average contribution of internal funding/retained earnings to working and investment capital)
• bankslocal = (s336a2+s336b201num) / 200 (normalized average contribution of local commercial banks to working and investment capital)
• banksforeign = (s336a3+s336b3num) /200 (normalized average contribution of foreign commercial banks to working and investment capital)
• leasing = (s336a4+s336b401num) / 200 (normalized average contribution of leas-ing to working and investment capital)
• development = (s336a5+s336b5num)/200 (normalized average contribution of de-velopment loans to working and investment capital)
• tradecr = (s336a6+s336b601num)/200 (normalized average contribution of sup-plier credit to working and investment capital)
• credcards = (s336a7+s336b7num)/200 (normalized average contribution of credit cards to working and investment capital)
• equitystock = (s336a8+s336b801num)/200 (normalized average contribution of stock sales to working and investment capital)
• friendfamily = (s336a9+s336b9num)/200 (normalized average contribution of friends and family to working and investment capital)
• monylend = (s336a10+s336b1001num)/200 (normalized average contribution of money lenders to working and investment capital)
• othfinsource = (s336a11+s336b11num)/200 (normalized average contribution of other sources to working and investment capital)
The variable 'interestbearing' represents the contribution of interest-bearing finance while the variable 'noninterest' represents the contribution of non interest-bearing fi-nance to working capital and new investment41.
• interestbearing (bankslocal + banksforeign + leasing + development + creditcards + monylend) / 6 noninterest = (intern + tradecr + equitystock + friendfamily) / 4
41 RPED data on 'other' financing sources could not be included in the following computation because the data were not captured in a manner that would help clarify whether or not the sources bore interest. While micro finance loans always bear interest, loans from the church, parent or sister company may or may not bear interest yet the category 'other' grouped together all the categories: micro finance and church loans, and loans from parent and sister compa-nies.

86

87
Chapter 5 Case Study Analysis of the Factors
Important for Innovation
5.1 Introduction
In this chapter, our interest is to undertake further in-depth analysis, through case studies, of the aggregate heuristic results previously discussed in Chapter 4. The case studies seek to answer the following question. How did firm size, workers' education level, technical assistance obtained, financial gearing and firm-level institutions affect the intensity of innovation activities introduced (INNOVA)? How did these factors affect what we refer to as the quality42 of the innovation activities introduced? In the first part of the chapter, we use data on INNOVA for the 9 fish processing firms and later, the in-depth cases focus on only a few firms. To evaluate the quality of the changes introduced, we engaged a panel of 5 fisheries scientists who knew the state of the industry and firm-level operations before and after the EU ban(s). Together, we developed qualitative indicators to rate the quality of innovation. This was preceded by weeks of awareness creation, firm visits, record retrieval and scrutiny of company files stored at the offices of DFR. In order to understand the relationship between in-novation intensity, the quality of those innovations, and export performance of firms, these ratings were compared with INNOVA and change in exports per employee (1999-2002). We should clarify that even though the innovation quality indicator and INNOVA are each capturing different aspects of the innovation process, they are re-lated since their construction is based on the same constituent indicators though fur-ther disaggregated in the case of the quality indicator43. INNOVA captures the inten-sity of innovation activities introduced while the quality evaluator captures the quality of those activities, at least from the perspective of 5 fisheries scientists. The in-depth case studies in the last part of the chapter relate to 4 of the 9 fish-processing and exporting firms as these 9 were the only extant firms at the time we conducted this study in 2002. This is therefore an exploratory and heuristic exercise whose purpose is to see if there are any patterns that emerge through simple cross tabulations and what this might mean in terms of our understanding of the innovation process. Using more sophisticated techniques with only 9 firms would not provide any meaningful statistical insights. The case studies examine the nature of the patterns ob-served. They also discuss the internal dynamics of the firm-level subsystem. The pur-pose is to get a better understanding of how and why these firms were able to intro-duce intense innovation activities in the process of coping with the SPS related EU
42 We use the term proficiency and quality inter-changeably to refer to the quality of the changes intro-duced by fish processing firms in the aftermath of the SPS related EU ban (s) 43 This level of disaggregation is possible because we are only considering fish-processing firms for in-depth analysis. While INNOVA was previously computed for both the 9 fish-processing firms and the other firms included in the control group, we did not compute a quality evaluator for firms in the control group. Our interest was to evaluate quality where the intensity of innovation was highest. Thus, the quality evaluator only applies to the fish-processing sector which is the focus of the present case study chapter.

88
ban(s), how they learnt to innovate, what changes they actually made, who made them and what role the various factors (previously analyzed in Chapter 4) played in the process and the nature of their interaction. Let us begin with an overview of the char-acteristics and performance of the nine (9) fish-processing firms that exported fish fillet to the EU market before and after the ban. Later, we shall also describe the char-acteristics of the firms that exited44.
5.2 Firm Characteristics and Market Performance Trends: An Overview
Table 15 shows that out of the nine (9) firms that survived the EU export restrictions, five (5) were foreign owned. Two (2) were owned by Ugandans of Indian origin and another two (2) by indigenous Ugandans.
FIRM A and FIRM B had the highest installed capacities while FIRM I had the least. By 2002, all firms still operated below installed capacity. A look at Chart 4 indicates that all three leading firms in terms of fish procurement were the largest (size) and were all foreign. Table 15: Fish-processing Capacities (tonnes per day) as of 2002
Fish Processing Firms Installed capacity % capacity
utilization45
Ownership
FIRM A 72 83 Foreign
FIRM B 60 58 Foreign
FIRM C 50 60 Foreign
FIRM D 50 50 Ugandan of Indian origin
FIRM E 40 38 Ugandan
FIRM F 40 25 Foreign
FIRM G 30 67 Ugandan of Indian origin
FIRM H 25 72 Foreign
FIRM I 15 67 Ugandan
Source: Adapted from Nsimbe-Bulega and Akankwasa, DFR (2002)
44 All fish-processing firms were shut down in order to restructure. This is the point of departure for this thesis and our interest is to look at whether the ban (s) triggered innovative change or complete closure and why. The analysis therefore included firms that closed following the imposition of the ban(s). Export data pre-dating the EU ban (s) could have provided additional insights had they been more accessible and reliable. This was not so for a number of reasons. First, data collection across Uganda’s fisheries was not a priority before these bans. Second, we had been advised by people in-volved with similar innovation surveys e.g. the NEPAD innovation survey (designed by a team of re-searchers at UNU-MERIT in The Netherlands), that trying to get recall (especially in Africa) beyond a period of 2 years was likely to be unreliable. Indeed, our attempt to assemble longer time-series data on procurements and exports proved unsuccessful but as already mentioned, access to these particular data was not central to our key research questions and motivation to understand whether and why the EU ban (s) had triggered innovative change and the underlying factors of influence. 45As of 2002, fish processing plants in Uganda depended on wild Nile Perch fish supplies captured and landed by small-scale artisan fishers and collectors (traders). Nile Perch supplies have been fluctuating over time and all processing plants have been affected by the old and persistent problem of inadequate fish raw-material. The difference in capacity utilization is therefore, among other things, a reflection of the varying ability of plants to acquire or search out for supplies.

89
From the available data, we also know that the firm that had made the greatest pro-gress in the search for knowledge to process fish by-products was owned by a Ugan-dan of Indian origin. At the time we conducted this study, the main product of fish processing firms was semi-processed fish fillets whose preparation process produced a number of by-products. These included fish frames, trimmings and fat, fish skin and maws. Initially, by-products were merely considered as waste until some local firms emerged to start drying and treating them for export to Hong Kong and Taiwan (China) where they were further processed into local food delicacies. Eventually, fish-processing firms exported some of these by-products directly to various markets.
Chart 4: Market Share by Fish Raw-material Procurement: 1999-2002
H
A
D
C
B
F
G
E I
0%
5%
10%
15%
20%
25%
1999 2000 2001 2002
Market share
Firm H Firm A Firm D Firm C Firm B Firm F Firm G Firm E Firm I
Source: Based on DFR data
At the Ugandan-Indian firm previously mentioned, the value of by-products rose sharply between 2000 and 2002 after it entered into an arrangement with a South Af-rican firm to process leather products out of fish skin. This type of inter-firm collabo-ration and technical assistance from the South Africans must have enhanced the flow of knowledge for innovation activities. In addition, the owners must have interacted with their Indian connections effectively given that they managed to access additional knowledge inputs from their country of origin (India) where they had identified a resident technical expert to assist in the commissioning and running of the fish-skin tannery in Uganda. During the EU ban, firms searched for alternative non-EU markets but many switched back to the EU market after the ban was lifted. They returned to their old buyers but also traded with new buyers within the EU market. Eight out of nine firms (89 per cent) reported more than 5 buyers in the non EU market compared with 2-3 non-EU buyers before 1997. Overall, one of the effects of the EU restrictions was the emer-gence of new fish importers and hence a diversification in the range of buyers that Uganda's fish exporters dealt with, both within the EU and the non-EU market. Firms could have chosen the easier strategy of doing nothing about complying with the very exacting demands of the EU and opted full-scale, for alternative non-EU markets. In-

90
stead, they chose to undertake complex learning activities in order to meet the EU re-quirements partly because there was an incentive to do so. Empirically, fillet exports fetched a higher price in Europe than for example, within the Middle East markets. In Tables 16a - d, firms have been ranked according to four market performance indi-cators; change in levels of fish procurement expenditure; change in export sales per employee; change in by-product sales and change in processing yield46. The results of the ranking are revealing. FIRM I is leading in three of the four performance indica-tors and from Table 15, we saw that this is the firm that had the smallest installed ca-pacity. Together with FIRM E, they were also the smallest in terms of firm size de-fined as number of employees. A closer examination showed that FIRM E had in-creased its processing yield by over 40 per cent while FIRM I’s processing yield in-creased by over 50 per cent from its 1999 level. Compared with other firms, the change at FIRM E and FIRM I was the greatest and an indication that these two local firms sharply upgraded their skills to minimize product loss. FIRM I also substantially increased its level of raw material procurement and export sales between 1999 and 2002. Disregarding FIRM I and FIRM E both of which started from a much lower initial position, firms A and C are at the top of the processing yield and export sales ranks. FIRM A is second after FIRM I in terms of change in the levels of procurement. As we saw from Table 15, firms A and C are both foreign owned and are among the top three in terms of installed capacity.
46 This ratio is not exactly an efficiency measure since it does not capture all saleable output (excludes fish by-products) and all inputs but it estimates how well the firm is able to turn fish raw-material into export products. It was computed as Export Quantity/Procurement Quantity. Elsewhere, we have ar-gued that an increase in yield might be a good measure of producers’ efficiency but not necessarily a good competitive strategy across the more quality driven markets. It should therefore be treated with caution. Besides, when some analysts and policy agencies consider yield as the main performance indi-cator, they deny the importance of measures of dynamic efficiency such as indicators of learning and innovation or even measures of the adaptability of the system.

91
Table 16a: Change in deflated47 procurement expenditure in Uganda Shillings (1999=100)
Fish-processing firm 1999 2000 2001 2002 Average change48
1. Firm I 100 400 946 2227 945
2. Firm A 100 121 467 435 290
3. Firm H 100 129 281 314 225
4. Firm G 100 120 295 285 216
5. Firm B 100 88 310 364 215
6. Firm D 100 148 231 276 211
7. Firm C 100 87 320 269 195
8. Firm E 100 78 255 309 183
9. Firm F 100 - - - -
Source: Based on DFR data
Table 16b: Change in export sales per employee in US $ (1999=100)
Fish-processing firm 1999 2000 2001 2002 Average
change
1. Firm I 100 263 267 982 410
2. Firm A 100 141 359 297 247
3. Firm C 100 96 235 226 172
4. Firm E 100 71 225 295 168
5. Firm B 100 50 167 291 135
6. Firm D 100 107 121 131 119
7. Firm G 100 72 123 188 118
8. Firm H 100 80 140 141 116
9. Firm F -
Source: Based on DFR data
47 Monthly procurement data (raw) were deflated using monthly Consumer Price Index (CPI) values published by Uganda Bureau of Statistics (UBOS) for the period 1999-2002 (published in Background to the Budget). These are general CPI values since fish was not included in the food basket CPI. As computed by UBOS, monthly CPI values measure the degree of change in relative prices of goods and services over the whole field over which households distribute their expenditure. To deflate, each monthly observation in raw form (monthly procurement expenditure) was divided by the corresponding CPI monthly value. Deflated monthly expenditure was then totaled to obtain an annual total 48 For the average change in tables 16a -16d, we took the geometric mean

92
Table 16c: Change in By-Product Sales in Uganda Shillings (1999=100)
Fish-processing firm
1999 2000 2001 2002 Average change
1. Firm G 100 149 457 2292 538
2. Firm E 100 103 591 836 371
3. Firm A 100 250 432 372 343
4. Firm C 100 109 222 200 169
5. Firm B 100 67 128 535 167
6. Firm D 100 193 156 127 156
7. Firm H 100 226 5 219 63
8. Firm I 100 38 49 108 59
9. Firm F - - - - -
Source: Based on DFR data
Table 16d: Change in Processing Yield (export quantity/procurement quantity (1999=100)
Fish-processing firm 1999 2000 2001 2002 Average
change
1. Firm I 100 116 184 179 156
2. Firm E 100 144 145 134 141
3. Firm A 100 103 102 108 104
4. Firm C 100 100 95 100 98
5. Firm G 100 82 81 122 93
6. Firm D 100 88 88 103 93
7. Firm B 100 86 88 91 88
8. Firm H 100 90 102 73 88
9. Firm F - - - - -
Source: Based on DFR data
5.3 Evaluation of Firm-level Improvements: Results of a Rating Exercise
In this section, we discuss the results of an evaluation and rating exercise conducted with five (5) fisheries scientists. Its purpose was to evaluate the quality of the im-provements introduced by fish processing firms in the aftermath of the EU ban(s). There were no better experts to perform this kind of evaluation than the senior fisher-ies officers assembled to perform the task. All were university graduates with varied post-graduate qualifications and an average of 10 years of working experience as fish-eries inspectors. By the very nature of their work, they all had vast, regular access to the industrial fish processing and exporting firms and the information and data accu-

93
mulated from the industry. They inspect and enforce Standard Operating Procedures (SOP) and interact almost on a daily basis with all firms within the industry. All were introduced to the objectives of the study, the key concepts and provided with guide-lines and materials to build awareness and appreciation of the exercise.
5.3.1 The Criteria Used by Fisheries Scientists to Rate Firms
Fish-processing firms were required to comply with several structural and non-structural improvements following the imposition of the EU ban. Core compulsory improvements fell in the sphere of fish handling, plant layout and operational proce-dures on the factory floor. All other improvements related to the alteration of products and procurement were not compulsory. Thus, before embarking on the evaluation ex-ercise, a distinction was made between compulsory and voluntary changes and with the assistance of the scientists; we developed criteria that would form the basis for the individual rating of firms. Each of the compulsory or voluntary changes had to be ac-cepted as important for the growth of the industry (according to fisheries scientists) and to have sufficient distinguishing power between firms. For each of the agreed cri-terion (innovative change), the fisheries scientists rated the quality of the innovations introduced. a) How were we to judge how well a firm had restructured its plant layout?
"…Firms that were built to good standards such as FIRM D had a lighter re-structuring task than those established prior to the formulation of standards such as FIRM H, FIRM G, FIRM F, FIRM E and others" (Mulamba, DFR Senior In-spector, June 2002).
As we would expect, all the survivors of the EU ban had invested heavily in this re-structuring process and achieved a good layout - acceptable by DFR, the competent authority approved by both the EU and the government of Uganda. Thus, the general improvement of plant layout was not considered to have sufficient distinguishing power across the firms. However, there was variation in how well each of the firm's improved-layout permitted the forward motion principle. This is marked as criteria number A1 in Table 17a. The underlying logic of this evaluation criterion is that firms that had introduced a more effective layout would better minimize product loss and have a better processing yield than those with an acceptable but less effective plant layout. b) Improvements in drainage and effluent treatment systems
While many firms had improved their drainage system as part of the overall structural improvements, they faced real difficulties with the improvement of their effluent treatment facilities. First of all, we did not expect firms in Uganda to have invested in R&D to search for effluent treatment technologies. However, DFR officials had indi-cated that even the mere adoption of already known technologies in the form of ac-ceptable effluent treatment systems was a complex process. It required relevant ab-sorptive capacity and knowledge inputs from specialists. Through the national envi-ronmental agency, NEMA, firms were directed to local environmental consulting firms to help design and install an acceptable treatment facility. According to the fish-

94
eries scientists, firms that invested more effort and financial resources into hiring technical experts upgraded their effluent treatment facilities to a higher standard. This underlines the important role played by technical assistance for learning activities. Although fisheries specialists did not consider this indicator to be critical from an in-dustry-growth point of view49, we obtained their assessment of how acceptable the improved effluent systems were, to NEMA, the environmental agency [Indicator A2 in Table 17a]. All fisheries inspectors have access to the periodic assessments con-ducted by NEMA, copies of which are kept on the respective files of firms at the DFR. Indeed, the difference in the rating confirmed that effluent treatment facilities had distinguishing power across firms. c) Changes related to equipment and processes of production
Acquisition of computer-aided devices was not compulsory. However, some firms made efforts to acquire such devices in order to track yield and temperature, for ex-ample. Tracking these two variables was said to be critical for the minimization of product loss. Therefore, given its potential contribution to the growth of the industry and its distinguishing power across firms, we considered acquisition of computer-aided devices to be a useful criterion for evaluation [A3]. Even though all firms had attained a good standard in their equipment layout (since this was compulsory), it was observed that the shift to automated methods such as conveyor belts or packaging equipment had some distinguishing power across firms. However, we had to treat the acquisition of equipment with some caution:
"A firm that manually carries trays of fillets from one section to another might appear to be using backward techniques but in a way has less risk to contaminate an entire batch of products and does not have to import specific food-grade oils besides worrying about maintenance. As observed over time, a plant with more equipment does not necessarily perform better [in markets] than one with less [unless there is a capability to properly maintain such equipment]" (Interview with PFO, DFR-Entebbe, Uganda May 09, 2002).
We took this caveat into account but also observed that 3 out of the 9 firms had made a greater effort than others to shift from manual to automated methods and had ac-quired non-basic equipment. For these firms, the shift to automated methods had opened up new possibilities for further learning processes associated with the mastery of equipment-use including its repairs and maintenance. Besides, the acquisition of equipment such as spiral freezers for "Individual Quick Freezing (IQF)" enhanced product diversification (broader range of products using the same equipment). One of the locally owned firms had not adopted any automated methods or acquired non-basic equipment at all. Given its potential contribution to firm-level learning proc-esses and having been considered important from an industry-growth perspective by fisheries specialists, we regarded the shift to automated methods [A4] and acquisition of non-basic equipment [A5] as useful criteria upon which to evaluate firms. In addi-tion, the standard of equipment layout [A6] was included among the rating criteria as it was considered important for the execution of the cleaning and hygiene mainte-nance program. It also had distinguishing power across firms.
49 This might reflect non-strict enforcement of environmental policy

95
d) HACCP implementation, in-firm knowledge diffusion, in-house laboratory
and sampling capabilities It was agreed among the fisheries scientists that firms did not differ widely in HACCP50 implementation and staff training programs. However, further discussion revealed important qualitative differences in what was learnt and how it was delivered to factory workers as reflected in the quality of HACCP documentation, routine im-plementation and updates of documentation produced by firms. It was further revealed that the more dynamic firms had successfully searched and retained experts from overseas with 'prior experience in preparing firms for the EU export market' while others simply failed to access such expertise (Akankwasa, DFR Senior Inspector, June 2002) - an indication of varying levels of access to critical knowledge inputs. Hence, we included three inter-related but individually important criteria deemed critical for the growth of the industry. All three are learning indicators notably, the standard achieved in undertaking in-house tests [A7]; extent to which the staff structure per-mits continuous training and knowledge diffusion [A8]; and the standard of HACCP execution [A9]. e) Changes related to products, procurement of supplies and organization of pro-
duction
� Introduction of new products:
By the end of our field inquiry (late 2002), none of the 9 firms that survived the EU ban had upgraded their products in the sense of shifting from the mere preparation and export of whole and semi-processed fish products (portions, fillets) to the export of further processed products such as crumbed fish products, perfectly portioned fillets and loins, barbecue sticks, differently packaged fresh and frozen products or even marinated fish products. However, more recent interviews conducted in 2004 indi-cated that with the leadership and assistance of overseas buyers, efforts were under-way by some firms to introduce such products51.
50 HACCP is a standard food safety procedure and stands for Hazard Analysis and Critical Control Point 51 Mytelka has drawn the author’s attention to the importance of this development given that firms in developing countries (or their clusters) sometimes manage to overcome a 1st challenge through net-working, linkages, learning and upgrading but often fail to install a continuous process of learning and innovation that helps them to deal with future challenges (the so-called 1st challenge hypothesis).They do not ‘learn to learn’ or how to collaborate. Interestingly, some fish processing firms in Uganda seem to have continued to learn (beyond the 1st challenge) and the important role played by buyers in this continued learning process has been analyzed by the author in a chapter contribution to a forthcoming book (2005) edited by Oyeyinka and McCormick on African clusters (UNU Press)

96
Table 17a: Criteria used for evaluation of changes introduced by firms
A Changes Related to Process
A1 Extent to which improved layout permits forward motion principle
A2 Efficacy of waste disposal system/ level of acceptability by environmental body
A3 Use of computer-aided devices for critical procedures and processes e.g. tracking yield, temperature etc
A4 Acquisition of automated methods deemed important for operational compliance and effi-ciency e.g. conveyor belts, packing equipment etc
A5 Acquisition of equipment that enhance product diversification e.g. IQF Freezer (spiral freezer)
A6 Standard of equipment layout and ease of implementing cleaning program
A7 Standard achieved in undertaking own checks associated with health control, analytical tests for water, products and swab checks
A8 Staffing structure in relation to efficacy of training and diffusion of knowledge
A9 Standard of HACCP implementation achieved
B Changes Related to Products and Markets
B1 Extent to which firm made successful and failed experiments to utilize by - products since 1997
B2 Extent to which firm searched and increased buyers within EU market since 1997
B3 Extent to which firm searched and increased buyers in non-EU market since 1997
C Changes Related to Organization of Production
C1 Extent to which firm sought knowledge locally unavailable (e.g. hire of experts with prior experience in preparing company for EU market)
C2 Extent to which firm continuously sought technical guidance from local specialist organiza-tions e.g. DFR, UNBS, UNIDO etc
C3 Extent to which firm chose more meaningful financial strategies in view of difficult finan-cial landscape faced by industrial firms in Uganda
C4 Extent to which firm managed to deal with difficulties related to infrastructure and utilities (e.g. investment in own water supply source)
D Changes Related to Procurement
D1 Search and investment efforts to engage in fish farming
D2 Level of maintenance of company’s insulated trucks and boats
D3 Consistent provision of inputs to suppliers such as ice, boats, engines, nets
D4 Adoption of better and more attractive mode of payment to suppliers
D5 Extent to which private landing site fully meets national standards
D6 Efforts to acquire own fish-collection boats
D8 Efforts to expand search for raw-materials (other water bodies)
D9 Solutions for the domestic manufacture of inputs: fish nets, packaging material
Source: Author's field work

97
At the time of our field inquiry in 2002, one of the notable differences across firms was the effort to experiment with adding value to fish by-products for instance through the fish skin tannery previously mentioned. From a learning and innovation perspective, such experiments might have succeeded or failed but whatever the final outcome, they were considered to be an indicator of learning. They were also consid-ered significant for the growth of the industry and had some distinguishing power since not all firms undertook them. The extent to which a firm had undertaken such experiments would therefore be a useful evaluation criterion [B1]. Market diversification was considered to be another important aspect for the growth of the industry. However, we also took into account the importance of sustaining du-rable relations with sophisticated buyers. Thus, the extent to which firms had searched and obtained a wider range of sophisticated overseas buyers was included as addi-tional rating criteria [B2 and B3].
� Procurement and organization-related changes:
The research we conducted across this industry revealed many other improvements introduced in the area of procurement and organization changes. For instance, most foreign firms had developed private fish landing sites to gain greater control over sup-plies as well as the state of SPS conditions at the sites. Firms that had constructed their own sites would receive fish directly from collection boats while others relied on sending their insulated trucks to fishing beaches where they would procure from vari-ous suppliers sometimes at relatively higher prices. Only 3 out of 9 firms had made some initial investment in fish farming to diversify the source of raw material. Mean-while, some firms had sub-contracted local boat builders to construct improved col-lection boats for their suppliers. Some provided fishing inputs such as gill nets to their suppliers on credit against expected fish supplies while others had not yet embarked on such arrangements. One foreign firm had devised a unique payment mode, which gave it a competitive edge in fish raw material procurements, whereby suppliers would receive payment at the beach instead of the old and common payment system where the supplier was paid at the fish-processor's plant. The latter involved paying the supplier after the fish had arrived at the plant, re-weighed, graded and rejects transported back. Organization-related improvements included among the rating crite-ria are marked C1 to C4 while procurement-related rating criteria are marked D1 to D9. Table 17a provides a summary of the criteria used for the evaluation and rating exercise. Each of the 5 fisheries scientists rated all 9 fish processing firms against the criteria listed in Table 17a on a scale of 0 - 4 where;
0 = None (did not undertake change)
1= Low (low level of accomplishment)
2 = Fair (fair level of accomplishment)
3 = Good (good level of accomplishment)
4 = Excellent (excellent level of accomplishment).
98
For each firm, an overall score was computed and normalized using the same formula as before (X i – X min) / (X max – X min)
52. Using these data, we generated summary descriptive statistics and, based on the mean score of each firm on Quality, INNOVA and exports per employee, classified the 9 fish-processing firms into Low and High performance categories. Such summaries can be obtained through any relevant software, in our case STATA 7.53 Using the same procedure, we generated summary descriptive statistics of the export performance indicator, measured as change in exports per employee (Table 16b), and used the mean to group the firms into low and high performance categories. We also grouped them into low and high performance categories according to their score on the intensity of innovation activities (INNOVA) (using data for fish firms in the food dataset: Chapter 4). These cross comparisons are presented in Tables 17b-17e.
52 Table 19 has a total of 24 rating criteria. Each criterion carries a maximum score of 4 and minimum of 0. For each scientist, the maximum score a firm would obtain is 4*24= 96. The minimum is 0. Be-tween all 5 scientists, maximum score a firm would get is 96*5= 480. Minimum is 0. By inserting these maximum and minimum values, the normalized scores on quality ranged between 0 and 1 in order to permit a comparison with INNOVA and normalized exports per employee data. 53 For example, summary statistics of the quality indicator indicated a mean of 0.5460648. It was there-fore possible for the program to list names of firms if quality <=0.5460648. Similarly, it was possible for the program to list firms if quality >0.5460648.

99
Table 17b: Scores of fish-processing firms on INNOVA, Quality and Change in
Exports per employee54 [Total number of firms= 9]
Low High
INNOVA
(Intensity of innovations)
[Mean= 0.6076389]
FIRM E (0.57)
FIRM C (0.52)
FIRM I (0.50)
FIRM F (0.46)
FIRM A (0.76)
FIRM D (0.73)
FIRM B (0.68)
FIRM H (0.63)
FIRM G (0.61)
Quality of innovations
[Mean= 0.5460648]
FIRM B (0.50)
FIRM E (0.49)
FIRM I (0.42)
FIRM G (0.64)
FIRM A (0.61)
FIRM D (0.57)
FIRM C (0.566)
FIRM H (0.562)
FIRM F (0.562)
Change in Exports per Employee
[mean = 0.1651101]
FIRM B (0.14)
FIRM D (0.119)
FIRM G (0.118)
FIRM H (0.116)
FIRM I (0.41)
FIRM A (0.25)
FIRM C (0.172)
FIRM E (0.168)
54 There are two fish supply chains in Uganda, the export supply chain and the domestic-oriented one. The biggest market for Uganda’s fish exports continues to be Europe. Here, the demand for Nile Perch imports is high and market prospects are good especially if the fish is presented in a form that meets the European customer’s needs. The Nile Perch imported from Uganda and her Lake Victoria neighbors is considered to be a close substitute for the restricted cod (gardus morhua- restricted because of fishing management regulations in Europe). The fish has a bland taste, is white after cooking and has no bones. To access the EU market however, exporters must comply with a set of SPS requirements but because European and other demanding markets in the industrialized world are willing and able to pay a high premium for fresh food products compliant with food safety requirements, Uganda’s fish export trade is profitable. It is a business which continues to attract capital investment. And, it is one in which the main actors understand the sanitary and quality demands with which they must comply. In contrast, the domestic market for industrially processed fillets and portions is still very small, underdeveloped and undemanding. Available information indicates that full-sized boned fish rather than fillet fits better into the norms of food preparation and eating habits of most fish consuming households. Moreover, the need to comply with food safety and food handling requirements imposes additional costs making in-dustrially processed fish affordable to only a tiny segment of the domestic market. The size of the do-mestic market for the current range of processed fish products is therefore too small and unremunera-tive to support a viable processing industry - which helps explain why since its emergence in the late 80s, all Nile Perch processing and exporting firms have and continue to aim at the export market. By the time this study was completed in Uganda (2002), fish-processing firms had not yet learned to de-velop relevant products for the domestic markets. Indeed, some of the firms (Firms H and D) that scored highly on INNOVA and low on export performance were among the few that also engaged in the development of trial products such as fish kebabs for the domestic market. This aspect is already captured in the Quality rating score.

100
Table 17c: Intensity of innovations introduced by their Quality
Quality of innovations introduced
INNOVA
(Intensity of Innovations)
Low High
Low FIRM E
FIRM I
FIRM C
FIRM F
High FIRM B
FIRM A
FIRM H
FIRM G
FIRM D
Table 17d: Intensity of innovations introduced by Export Performance55
Export Performance
INNOVA
Low High
Low FIRM F FIRM E
FIRM I
FIRM C
High FIRM H
FIRM B
FIRM G
FIRM D
FIRM A
Table 17e: Quality of innovations by Export Performance
Export performance Quality
Low High
Low FIRM B FIRM E
FIRM I
High FIRM H
FIRM G
FIRM D
FIRM F
FIRM C
FIRM A
55 Measured as the change in export sales per employee (1999-2002)

101
What can we learn from these comparisons?
First of all, we should expect that in firms where innovation activities were both in-tense and of high quality, their export performance should be higher than those with less intense and lower quality innovation. This is however not the case. In Table 17b, we can see that 3 of the 9 firms were high on both INNOVA and Quality but low on export performance. Of the 2 firms (Firm C and FIRM F) that were low on INNOVA and high on Quality, only one(FIRM C) was high on export performance. Only FIRM A (out of 9 firms) was high on everything - that is on INNOVA, Quality and export performance. As we can see from Tables 17c-17e, the 4 high export performers included 2 that were low on both INNOVA and Quality. These are FIRM I and FIRM E. Looking at Table 16d, we can see that these were the two firms that also recorded the highest change in processing yield. Yet, from the interviews we conducted across a cross-section of European buyers in 2004, we learned that
“Indicators such as yield need to be interpreted cautiously. For instance, at the European Seafood Exposition of May 3–5, 2004 (Brussels), most buyers looked favorably upon process-related improvements in the countries that produce Nile Perch, but also complained that as the effort to achieve higher yield increased, so did the discoloration of the fillets. In the end, an increase in yield might be a good measure of producers’ efficiency, but not necessarily a good competitive strategy across quality-driven markets” (Kiggundu 2004).
Since both FIRM I and FIRM E were both low on INNOVA and Quality but ranked highest on change in processing yield and high on export performance (change in ex-ports per employee), we might conclude that both firms tremendously increased their efficiency (in the sense of volume of exports per employee) but not necessarily the quality of exports. This might be so since both engaged less in innovation activities to diversify the range of exports let alone efforts to explore new market niches. In relation to processing yield, we saw from Table 16d that FIRMS A and C (both of which scored high on export performance) either maintained their yield ratio or changed it slightly. Moreover, as we shall see from the in-depth cases, these two firms not only managed to keep the quality of their exports consistent, but also succeeded in reaching higher-value and demanding export market niches. The quality of the inno-vative changes they introduced was also high. All three firms that scored high on INNOVA and Quality but were low on export per-formance either increased their processing yield substantially (especially after the EU ban was lifted) or introduced intense innovation activities to explore new market niches and diversify the range of their export products. All three also invested in in-novation activities whose quality was good. Given their smaller size however, the challenge of combining innovation activities with consistency in export quality and volume to higher-value demanding export market niches proved more difficult to overcome. Intense innovation does not appear to necessarily predict to high export performance (measured as change in exports per employee). In the fish-processing and exporting
102
industry, processing yield is important but an improvement in this ratio seems more effective if the quality of exports is either maintained or improved. Therefore, given a reasonably comparable initial position, we should expect firms that combine high quality innovation activities with high export quality and volumes to high-value mar-kets to perform better (export performance) than those where these aspects are miss-ing. We should however hasten to add that with only 9 firms, these results are heuris-tic and only suggest areas for future research. What follows is a discussion of a few cases that showed the following 4 patterns: o The Innovative Achievers: High on Quality, INNOVA and Export Performance
o The Semi-Innovative Achievers: High on Quality, Low on INNOVA and High on Export Performance
o The Innovative Under-Achievers: High on Quality and INNOVA, Low on Export Per-formance
o The Non-innovative Achievers: Low on Quality and INNOVA and High on Export Per-formance
5.4 Case Studies
The following case studies seek to uncover what factors were present and absent among all four categories; the innovative achievers, the semi-innovative achievers, the
innovative under-achievers and non-innovative achievers. They will also provide an opportunity to uncover the institutional and learning dynamics ‘inside’ the firms. If institutional change, learning and interaction are important aspects of building context specific local systems of learning and innovation, what acquires major importance is a better understanding of the general knowledge and institutional profile of the actors in the system. As with the other actors, knowledge and institutional profiling of the firm-level subsystem would include a mapping of the types of knowledge present and ab-sent across the various categories of firms or their clusters, as well as the general norms and practices that need to be improved or abandoned for more effective interac-tion and learning to occur. From a development perspective, the profiling would have to include a general understanding of the nature and adequacy of existing knowledge, who possesses it and the dynamics surrounding knowledge diffusion and learning. Where does the know-why’, the ‘know-what’ and the ‘know-how’ reside and who is doing and learning what; whether it is the foreign directors, workers, Ugandans in general or a certain ethnic grouping such as Ugandans of Asian origin or whether it is the men, the women or both. Relevant policies, support structures and incentive sys-tems could then be devised or strengthened to improve the knowledge and institu-tional profile in the system.
5.4.1 The Innovative Achievers: The Case of Firm A
A subsidiary of the Kenya-based Alpha Group of companies, FIRM A was registered in Uganda in 1993 to prepare Nile Perch fillets for export. Owners of this firm were non-Ugandan, all male and operated more than four lines of other business. By the end of 2001, the firm had a total workforce of 400 persons, 280 male and 120 female and total investments of up to 4 million US Dollars. The workforce included about 10-15 foreign workers including the director, managers, technical staff and other admin-istrative staff. A majority of the foreign personnel were from India and 40-50 per cent

103
of the reported work force was casual. Women workers were concentrated in low skill positions such as trimming and packing while men dominated the medium and high skill positions, a common observation in related literature and feminist analyses - Rowbotham (1995) for example. While all owners had a university education, less than a quarter of the workforce had a university education. Most did not have formal technical education in food-processing or fish-processing. Initially, frozen fillet products were the main product but later, exports of chilled fillets dominated as the latter fetched a higher price than frozen products. Even prior to 1997, this firm had established itself as one of the mar-ket leaders in fish export sales but this was not because of any superior innovative strategies it had adopted compared with other firms. The main driver of its early mar-ket leadership advantage was its larger investment and working capital base.
Why and how did FIRM A learn to innovate?
Like all other fish-processing firms in Uganda and East Africa, FIRM A had to com-ply with a number of structural and non-structural specifications previously discussed. This firm modified its plant layout and covered the entire factory with insulated pan-els. Structural alterations to preclude pests were made and a local firm was retained to undertake monthly pest control activities. Five new ice plants were established which greatly boosted the in-house ice production capacity to 120 tons a day. The firm changed the drainage line and in 2000, built a new effluent treatment plant. To under-take all the structural improvements, equipment and tools were imported from Europe. Local firms and indigenous Ugandans actively participated in the restructuring. On the non-structural side of things, changes made included the introduction of HACCP, the setting up of an in-house laboratory, development of standard operating proce-dures and manuals, implementation of good manufacturing practices and intensive in-house staff training. These improvements not only dictated a new way of handling and organizing factory floor operations, but also resulted in improved habits on and around the processing line. Beyond basic equipment required for fish-processing operations such as freezers, FIRM A introduced a temperature logger, conveyor belts, machine for Headless and Gutted (H&G) products, a pressurized cleaning system, and ozone treatment system. Machinery and equipment acquired was new and imported. However, the firm was unaware that equipment could be improved through technical adaptations to stretch its life, for example. Most imported equipment was not considered alterable in the sense of minor or major adaptations, especially when presumed to be working well. In the early 1990s, this firm made unsuccessful experiments to process by-products, an indi-cation of internal efforts to learn and upgrade. However, it was the non-Ugandan workers that seemed to have benefited from this technological learning effort. Prior to the EU ban, the main markets for this firm were in the EU. Fish by-products were mainly exported to Japan and East Asian countries. With the improvement in product flow, layout and overall SPS conditions, the firm secured access to new mar-kets which included more importers in the EU market and new buyers in USA, East Asia and the Middle East countries.

104
However, it became increasingly clear that improvements in SPS conditions were simply not enough. For firms like FIRM A that had already innovated in better pro-curement and organizational arrangements, they had to devise even more and better ways to secure and ensure regular supplies. In other words, only those firms that could innovate could sustain their newly gained export markets. For about a year following the lifting of the ban, export sales at this firm continued to grow impressively until mid 2002 when the government of Uganda (GOU) strictly started to enforce legisla-tion outlawing the capture and processing of under-sized Nile Perch ('immature' fish). FIRM A had improved its internal processes of production tremendously but it now had to deal with a worsening situation of fish supplies. Previously, immature fish formed the basis of export sales to the EU. Then in June 2002, the government through the DFR and the President’s Office enhanced efforts to enforce the law against dealing in under-sized fish thereby forcing processing firms to reduce its procurement. For some, the pressure on supplies forced them to search for new markets where the permitted size (by the authorities in Uganda) of Nile Perch was in demand even though such markets offered lower prices than those in the EU. By the time of this study in 2002, some firms were contemplating to concentrate on other lines of business while others had devised new innovative strategies to deal with the emerging challenges. This firm was assigned a high quality score by fisheries scientists, ranking second among 9 firms. Its score on INNOVA was also the highest among all 9 firms. It re-corded one of the highest changes in exports per employee partly because of the im-provements it made in the processing yield and in its organizational and procurement arrangements. FIRM A made substantial investments in fish collection boats and played a key role in testing a new boat prototype (ice-carrying boat) that had been de-signed through a joint intervention between FTI, UNIDO, LVEMP and traditional boat builders. It was also one of the only two fish-processing plants that had signed up, at their own expense, onto UNIDO’s cleaner production program on new ways of reducing waste, water and energy consumption.
Besides better procurement arrangements, plans had already been developed at this firm to switch from prepared to value-added products.
“Until now, we have exported prepared fish fillet to our buyers in Europe who repackage and distribute it under their brand name. Instead, we shall sell branded products under a joint venture arrangement with the present buyers. So, we shall process and package the fillet in small 200-250 gm packets in Uganda, ready to eat and exported in fish cake form. However, DFR is yet to come up with acceptable standards to guide us in this new processing activity."
Asked why these changes were not done before 2002, the response was,
“… There was no need. The supply of raw materials was not that bad. Presently, we cannot get all the supplies we need because of the restrictions on immature fish. Instead, we have to make the best use of the limited supplies by getting into better products. In addition, we have to more seriously consider commercial fish farming. We have set up a farm and we shall be breeding fresh water fish and

105
Tilapia. We are not certain about Nile Perch breeding as it is problematic" (Gen-eral Manager-FIRM A, August 03, 2002).
It then appears that while the trigger to alter processes and procedures of fish-processing came from the enforcement of the EU Directive, the stimulus to introduce new products came from the enforcement of a local Ugandan law. Arguably, process-related change and activities to engage in new products only came about after the strict policing of both international and local regulations (market insti-tutions). In other words, standard setting and enforcement played a central role in the change process that occurred at this firm. However, without the emergence of sys-temic support from intermediaries, standard setting and enforcement could not have been as effective as it was. FIRM A received technical assistance from UNIDO, CDI, Mike Dillon Associates (a foreign firm that assisted with HACCP introduction), UNBS, DFR and FOSRI. In addition, it approached more than five agencies seeking information and expertise on product, process and organizational improvements. It hired local firms to provide consulting services besides active interaction with its competitors through the Fish Processors Association. This firm was one of two local firms selected to participate in the pilot public-sector regional project supported by CFC/FAO/COMESA/LVFO/Uganda/Kenya/Tanzania to process Nile Perch into value-added products.
• What role did the financial gearing position of FIRM A play in this process of change?
Non-interest bearing finance contributed more than interest-bearing finance to the op-erations and investments undertaken by this firm. Finance came mostly from the firm's parent company in Kenya as well as other sister firms. Locally, the firm ob-tained leased equipment for water purification through a leasing company (DFCU). In addition, a local bank extended on-going overdraft facilities. Quite apart from EU related improvements, financial investment was needed for four sets of reasons. First, better procurement and organizational arrangements were needed to secure supplies. Such arrangements included the provision of inputs to sup-pliers, investment in the firm’s own landing site, and a more aggressive effort to ob-tain fish from other water bodies. Firms needed finance to implement such arrange-ments most of which directly translated into better sales performance. Secondly, the introduction of new products such as fish cake, a work-in-progress, would no longer be supported by labour-intensive manual operations as was the case with the prepara-tion of fillet for export. The firm needed to automate the process to ensure consistency in weight, ingredients, size, shape and other product features. This shift from manual to an automated process would require heavy investment in an appropriate structural layout, machinery and equipment and their maintenance. Thirdly, finance would be required to hire a well experienced and qualified expert, for approximately one year, to assist with product development, product launch, staff training, to organize market-ing and undertake trial product development. "Short-term consultants for 2-3 months as would usually be availed through agencies such as UNIDO were said to be less helpful. “Tested product development expertise costs about US 100,000 per annum and such skills are not available locally" (General Manager-FIRM A, August 03, 2002). Fourthly, finance would be needed to develop and breed fish on a commercial basis. Such investment would also include the hire of consultancy services.

106
In sum, almost all the factors previously identified as important for learning and inno-vation activities were present at FIRM A. The emergence of hard institutions provided the impulse for the introduced changes especially in processes. Structural and non-structural improvements introduced were not only new to the firm, but also dictated new habits and practices on the factory floor. However, the EU Directive that was the source of these changes did not place demands on the industry to develop new prod-ucts. Nevertheless, like all other firms, FIRM A found itself with improved product flow, plant layout and SPS conditions but inadequate fish raw material to sustain the newly gained export markets. This pressure on supplies became even tighter when the government started to strictly police the law banning the capture and processing of under-sized Nile Perch. However, prior to the enforcement of this law, FIRM A had already invested in creative procurement and organizational arrangements to deal with the supply problem. It was not only firm size that afforded the opportunities needed to make such procurement and organizational changes. Habits such as management's commitment to the creation of networks through interaction and a continuous search for technical assistance were critical. It was through these deliberate efforts to interact and search for knowledge that FIRM A developed new product development plans that would permit it to utilize the limited fish-catch more effectively. The pressure to innovate in products intensified when supplies of raw material became strictly po-liced. In response, the firm developed innovative strategies and at that point, the role of easy access to non-costly finance could not be underestimated. We find that in order to compensate for local skill shortages, finance assists to buy-in the expertise necessary to train local workers, and to develop products and associated learning activities in addition to acquisition of machinery, equipment and other infra-structural type investments by the firm. In other words, easier access to appropriate financing facilitates access to necessary knowledge inputs. However, not all firms that had similar easy access to non-costly finance invested in better procurement and or-ganizational arrangements or even product development plans. Besides, FIRM A al-ways had relatively easy access to financial sources but only introduced new proc-esses and products after the emergence of institutionally-augmented markets. This would imply that finance facilitates learning and innovation activities better when the other conditions exist. Crucially, such conditions include the right habits and practices such as a commitment and conscious effort by the firm to interact, learn and innovate.
5.4.2 The Semi-Innovative Achievers: The Case of FIRM C
FIRM C started off in Kenya with a firm (Chimkoa Enterprises) producing water proof material such as travel bags, tarpaulins, life jackets, water proof aprons and other associated products. Then, they switched to the manufacture of cooking pans and by the time the Nile perch processing momentum gained root in Uganda in the late 80s/early 90s, the owners had gained sufficient resources to enable them make yet another move, this time into Uganda to process fish for export. Established in Uganda in 1990, the firm started its fish-processing operations in 1992.
“FIRM C started with one fish transportation truck, and then acquired a second, a third and by the end of 2002, it owned up to 20 trucks. Over time, it graduated into bigger and bigger operations, profits were not only re-invested in the fish

107
plant, but also used in three new lines of business" (Quality Assurance Manager, June 22, 2002).
In other words, proceeds from the fish plant facilitated its owners to spin-off 3 other manufacturing entities in Uganda. The first produced polystyrene boxes used by FIRM C’s fish plant and other fish plants to pack fillets while the second manufactur-ing entity produced 'sandwich' and aluminum panels widely used by fish plants for the insulation of premises. The polystyrene box unit generated steam and hot water used at FIRM C's third spin-off, the ice-cream plant, locally famous for its ‘Kool Kool’ bar. For the first time since fish-processing firms had set up in Uganda, the import inten-sity of packaging material reduced substantially. With time, firms increasingly used FIRM C’s locally made boxes to pack frozen fillets for export. Before the EU ban, FIRM C was already one of the largest fish exporters in Uganda. Despite this early market lead and dynamism at its sister firms, our study found that although FIRM C's fish export performance was impressive, this firm was indifferent to the need to un-dertake innovation activities. Out of 9 firms, its score on INNOVA was third from the bottom. Admittedly, interview respondents reported that the other branches of FIRM C were more progressive than its fish plant. By the end of 2001, FIRM C fish plant had an investment of approximately US $ 2 million and a total work force of 350 persons, 250 male and 100 female with about 10 per cent of the workforce engaged in casual work. The firm was fully owned by non-Ugandans, reportedly all male. The knowledge profile was similar to that of many other fish processing firms. Prior to the EU ban, this firm had 5 male foreign workers (2 directors and 3 managers) but by the time of our study in 2002, the number of for-eign workers had grown to 9 males (4 Directors and 5 managers). Ugandan managers had also grown from 2 in 1996 to 5 in 2002 with only one female on the management team. Female workers were fewer than their male counterparts and they were mostly assigned trimming and packing tasks. Owners had university level education but like other firms in this category, 51-75 per cent of the workforce at FIRM C were said to have Ordinary Level secondary education and below. On formal technical education, the pattern was similar. A negligible proportion of workers had obtained formal tech-nical education. Owners did not have formal technical education in food or fish-processing either.
• Why and how did this firm learn to innovate?
The strict policing of the EU Directive triggered a huge change process at FIRM C as conveyed by one of our interviewees. “This fish plant was a very different place be-fore the EU ban" (Quality Assurance Manager, Firm C, June 22, 2002). Under the leadership of a South Korean engineer, the plant was restructured; vermin proof mate-rial introduced and automatic doors were installed. To improve drainage, water gutters were fabricated locally and fitted all around work tables to collect and direct all waste water into a central drainage system. Although a local Ugandan firm recommended by the environmental agency (NEMA) designed the new effluent treatment plant, it was still the Korean engineers who did the actual construction works. Additional freezers were imported along with 4 new ice ‘flaker’ machines to make a total of 7 giving this firm an in-house ice-production capacity of 80 metric tons a day. Assisted by three

108
local technicians, ice making machinery was installed by the Korean engineer. Al-though this firm introduced modern basic items such as automatic hot-air dryers and electric sensor taps instead of knee-operated taps found at many other fish firms, it did not introduce any automated equipment such as high-pressure industrial cleaning gear, conveyor belts or equipment to track yield and temperature. This firm had introduced computers mostly for accounting purposes but was not connected to the internet by the time of our study which must have limited its ability to engage in effective com-munications and routine search activities. The firm introduced all the compulsory re-quirements such as HACCP manuals, standard operating procedures, and staff train-ing activities besides implementing good manufacturing principles. In addition, it was one of the few firms that had signed onto UNIDO's clean production program where firms learnt, at their own expense, methods to cut waste and energy consumption. Although 75 per cent of its export sales went to the EU, FIRM C also diversified its market during and after the ban by acquiring more EU buyers and a few non-EU buy-ers. These newly accessed markets had to be maintained in an environment where supplies were becoming more and more restrictive. In response, the firm introduced one of the best modes of payment to raw material suppliers, introduced required im-provements at its own landing site, provided inputs to suppliers and widened the search for raw materials to other water bodies. It did not invest in own fish collection boats or engage in plans for fish farming. FIRM C did not also attempt to conduct in-house experiments to develop new products. Like other firms, FIRM C had obtained generic technical assistance, from DFR, UNIDO, UNBS and Mike Dillon Associates. However, the firm increasingly became more isolated, interacted less frequently and rarely used the services of local specialist agencies for information or knowledge. Very little was done to enhance the diffusion of key skills to local Ugandans espe-cially in the field of engineering works, repairs and maintenance.
• What role did FIRM C’s financial gearing position play?
This firm relied on internal cash flow including that from sister firms to pay for engi-neering knowledge inputs, to purchase construction material, to finance imports of equipment, train staff and implement all the compulsory process-related changes and to introduce better procurement arrangements. Besides cost-cutting measures such as UNIDO's clean production program, FIRM C was still reluctant to introduce learning and innovation activities at its fish plant. For a firm that demonstrated dynamism and innovativeness in respect to its other business lines, how could we explain its apathy and reluctance to learn and innovate within its fish plant (beyond the introduction of the compulsory requirements)? Having already established a good reputation and market share in the EU market prior to the EU ban of 1997, this foreign firm had a strong incentive to restructure and un-dertake all the compulsory changes. The market outcome was more certain and justi-fied the heavy financial investment made to comply with the compulsory require-ments. In contrast, the market for new products (for example) was still uncertain. Rather than switch resources around from the various lines of its vibrant business into its fish plant, instead the firm adopted a wait and see attitude since there were no product-related directives or standards that such reluctant firms had to face up to. Its processing yield did not vary much from its 1999 level and because the firm suc-

109
ceeded in retaining its sophisticated European buyers, the quality of its exports must have been kept consistently high. Despite its good export performance and initial dynamism to innovate, there were a few things that were absent for FIRM C to sustain the momentum for learning and innovation, at least at the fish plant. First, the size and ownership of Firm C’s struc-ture afforded it some advantages including a financial gearing position that enabled the firm to maintain a light debt-equity ratio. However, the gearing position was not necessarily appropriate for lump sum investments like those associated with new product design and development. Secondly, there was limited interaction with special-ist agencies that could provide information and knowledge. Owners of the firm showed very little interest in interacting with others in the industry even though they permitted the quality manager and a few other workers to attend the frequent activities and seminars arranged within the industry. The available correspondence between DFR and this firm also indicated that this firm had problems trusting some of the DFR officials. Thus, 'institutional' factors in the sense of habits and practices combined to hold back the potential achievements that FIRM C might have accomplished given its size, education level of workers and global linkages.
5.4.3 The Innovative Under-Achievers: The Case of Firm G
Established in 1989, FIRM G was one of the oldest fish-processing firms in Uganda. Owners were Ugandans of Indian origin and operated more than four other lines of business. By the end of 2001, FIRM G had a total investment of US $ 1.4 million and a work force of 334 persons, 268 male compared with only 66 females. Close to 50 per cent of the workers were in the casual category. The knowledge distribution pro-file was similar to that at FIRM A. Since 1996, FIRM G had kept an average of 13 foreign workers (including non-African Ugandans) in vital positions such as director, managers and technical staff although there was an average of 2 local Ugandans in the technical positions. Women tended to be concentrated in trimming, weighing and packing tasks. With an accounting diploma, the managing director had the highest level of education among the owners, who were all family members while 51-75 per cent of the workforce had only primary level education. Hardly any workers had ob-tained formal technical education and many of the owners possessed no formal and relevant technical education. By the time of our study in 2002, this firm was about to complete a new, larger, modern fish plant close to its present location in Jinja. Through a spin off known as the Uganda Fish Skin Tannery Ltd, FIRM G was the only fish-processing firm in Uganda that had embarked on the processing of fish skin into leather products. Why and how did this firm learn to innovate?
"Prior to 1997, nobody bothered about the quality of fillet exports including buyers. Then there was external pressure to meet quality requirements and inter-nal pressure due to supply side constraints. Consequently, one is forced to do something in order to improve the operating margin (Quality Assurance Man-ager, August 08, 2002).
Unlike the newer fish firms that had been built to reasonably good standards, institu-tional changes in export markets triggered a much more extensive restructuring effort to upgrade Firm G’s old plant to the required standard. Interestingly, at every stage of the upgrading process, this firm actively sought technical expertise from sources in

110
and outside Uganda and trained local Ugandans in several aspects of the restructuring process. As mentioned previously, tapping into external knowledge bases is important as it helps the firm to access knowledge locally unavailable. As part of the layout re-structuring, the flow of products and personnel was changed by local contractors and in-house technicians. New vermin control structures were installed and the firm brought in experts from India to install a new water purification system. Using im-ported ice-making machinery from France, a new ice plant was established by in-house non-African technicians. With technical guidance from NEMA, the effluent treatment facility was upgraded too. The firm introduced all the compulsory require-ments such as HACCP manuals, standard operating procedures, in-house staff training schedules besides implementing the voluntary code of good manufacturing principles developed by the fish processors association. Computer equipment was imported to support accounting and general typesetting. Conveyor belts were fabricated locally using imported equipment to ease factory-floor transportation while industrial clean-ing machinery was imported to upgrade the cleaning system. According to interviews with DFR officials, FIRM G was one of those fish firms that continuously made use of technical advice from agencies such as DFR, UNBS, UNIDO and a Scottish firm that assisted with the application of HACCP. Not surprisingly, it obtained the highest score among all 9 firms, on the quality of improvements introduced. This shows that you need both the supply of knowledge and the demand for it in order to make knowl-edge transfers effective. Like other fish-processing firms, FIRM G diversified its market during and after the ban by acquiring more EU buyers and non-EU buyers especially in the Middle East region. However, the new markets had to be maintained subject to growing supply constraints. In response, the firm provided inputs to its so-called priority fish suppli-ers, invested in improvements at its own landing site and widened the search for raw materials to other water bodies. With technical support from a project known as SPEED directed by the United States Agency for International Development, (USAID), the firm also engaged in fish-farming. FIRM G was among the few firms that had developed advanced experiments for product adaptation. In-house trials were made to develop products such as 'frozen skin', 'minced fish meat' and fish meal (interviews, 2002). However all these experi-ments were developed by non-African workers at the plant even though local Ugan-dan workers participated in the process. No R&D was conducted to generate in-house knowledge about these new products. Rather, foreign buyers were the source of in-formation and knowledge. To develop the fish skin tannery, a leather technologist hired from India took close to 2 years to develop, design and select machinery and equipment for the tannery and having not dealt in Nile Perch fish skin before, this In-dian expert had to learn incrementally through adaptation. The Indian technologist selected and purchased required equipment from India, installed and set up the pro-duction line. He recruited local machine operators and trained these but after 2 years, he left the country. Because no local technologist had been trained to take over from the Indian expert, another technologist had to be identified from India. By the time of our field visit, it was this second Indian technologist who largely possessed the ‘know-why’ behind the central operations of the tannery.
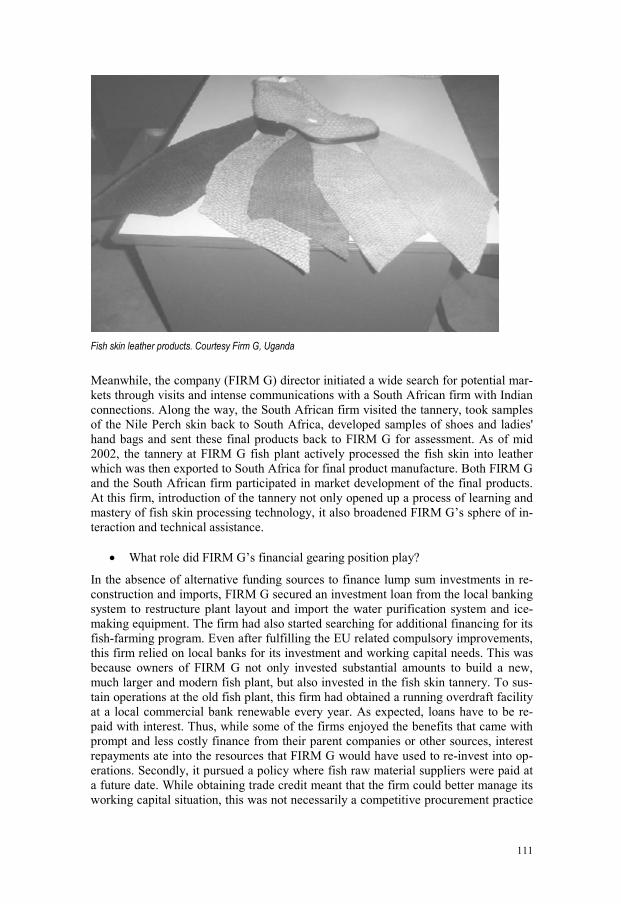
111
Fish skin leather products. Courtesy Firm G, Uganda
Meanwhile, the company (FIRM G) director initiated a wide search for potential mar-kets through visits and intense communications with a South African firm with Indian connections. Along the way, the South African firm visited the tannery, took samples of the Nile Perch skin back to South Africa, developed samples of shoes and ladies' hand bags and sent these final products back to FIRM G for assessment. As of mid 2002, the tannery at FIRM G fish plant actively processed the fish skin into leather which was then exported to South Africa for final product manufacture. Both FIRM G and the South African firm participated in market development of the final products. At this firm, introduction of the tannery not only opened up a process of learning and mastery of fish skin processing technology, it also broadened FIRM G’s sphere of in-teraction and technical assistance.
• What role did FIRM G’s financial gearing position play?
In the absence of alternative funding sources to finance lump sum investments in re-construction and imports, FIRM G secured an investment loan from the local banking system to restructure plant layout and import the water purification system and ice-making equipment. The firm had also started searching for additional financing for its fish-farming program. Even after fulfilling the EU related compulsory improvements, this firm relied on local banks for its investment and working capital needs. This was because owners of FIRM G not only invested substantial amounts to build a new, much larger and modern fish plant, but also invested in the fish skin tannery. To sus-tain operations at the old fish plant, this firm had obtained a running overdraft facility at a local commercial bank renewable every year. As expected, loans have to be re-paid with interest. Thus, while some of the firms enjoyed the benefits that came with prompt and less costly finance from their parent companies or other sources, interest repayments ate into the resources that FIRM G would have used to re-invest into op-erations. Secondly, it pursued a policy where fish raw material suppliers were paid at a future date. While obtaining trade credit meant that the firm could better manage its working capital situation, this was not necessarily a competitive procurement practice

112
given the prevailing supply-side shortages. Other firms had instead devised better modes of prompt payment to fish raw material suppliers and invested in fish transpor-tation boats to permit wider and more competitive raw-material sourcing. Hence, bank loans and overdrafts seem to have played two roles within this firm. On the one hand, the investment loan permitted the firm to comply with compulsory regu-lations and therefore open up access to old and new markets. It also enabled the firm to upgrade through imported equipment. A renewable running-overdraft facility at a local bank was perhaps the only certain financing source available to this firm to boost working capital given the huge financial investments called for at the new plant and at the tannery. On the other hand, the relatively lower export performance com-pared with the innovative achievers must have to do with a lower ability to invest in better procurement arrangements. Given the nature of fillet export processing opera-tions that firms engaged in, the higher the procurement expenditure, the better export sales tended to be and the better the sales performance, the greater the ability to grow its operating margins and create new capital. For firms faced with more costly fi-nance, the act of balancing a healthy cash flow with innovation activities was not an easy one. In as much as FIRM G needed better cash flow to support higher procure-ment expenditure and on-going innovation activities, its ability to generate suitable capital tended to be limited. FIRM G was innovative in many respects but the com-mensurate export performance was low relative to what we might have expected. One of the differences between the innovative achievers and innovative under-achievers like FIRM G was the financial gearing situation. FIRM G’s financial gearing was heavily skewed towards interest-bearing finance while the innovative achievers such FIRM A privileged their gearing position with non-interest bearing finance.
5.4.4 The Non-Innovative Achievers: The Case of FIRM I
With an investment56 of approximately US $ 1.3 million and a workforce of 97 per-sons (including casual workers), this firm was one of the smallest in the industry. Es-tablished in 1992 by indigenous Ugandans, it had a 25 per cent female ownership and two other lines of business. In 2000, the ownership changed to include minority for-eign owners from India who provided a resident foreign director though the managing director position remained with the indigenous Ugandan owners. Apart from the resi-dent director, the firm had only two other foreign workers at the plant, a production manager from India and a chief engineer from Kenya (African Kenyan). These work-ers had all moved from fish-processing firms in Kenya. Similar to the pattern at other firms, the firm employed more male workers than fe-male workers; 69 male compared with 28 female as of the end of 2001. The women were concentrated in the trimming, weighing and packing sections of the factory floor. The owners possessed only ordinary secondary school certificate and below but with no formal technical education. This situation also reflected the majority of the workforce. Only a handful of employees attained the level of university education. Beyond compliance with the EU export requirements; this was another firm that had done little to undertake learning and innovation activities. It ranked low on INNOVA, Quality but given its low initial position, it ranked first on change in exports per em-ployee.
56 As of the end of 2001

113
• Why did this firm fail to undertake more learning and innovation activities?
Following the EU ban of 1997, FIRM I undertook a number of structural and non-structural improvements at its plant. Led by the in-house Kenyan engineer together with the local technicians, the firm set up a maintenance department that worked with local construction firms to execute most of the structural-related works. The factory plant layout was redesigned, processing halls were enlarged, vermin control facilities were erected, the plumbing system was upgraded, new water tanks installed, and the effluent treatment facility was repaired. With generic support from DFR, UNBS and UNIDO, FIRM I had introduced all the compulsory requirements such as HACCP application and manuals, Standard Operat-ing Procedures (SOP), in-house staff training schedules besides implementing the code of good manufacturing principles. This firm had also obtained advice from NEMA and Kampala City Council during the reconstruction period. Besides tools and accessories for the maintenance department and a machine for Headless and Gutted (H&G) products, other equipment such as ice-making equipment, plate freezers, water taps and food grade brushes imported were really basic and related to the minimum compliance requirements. Although this firm had computers, it had not acquired some of the non-basic facilities found at other firms such as spiral freezers. To cope with supply side restrictions, FIRM I had emulated what other firms were doing. It provided inputs such as ice to fish suppliers and introduced prompt methods of payment to suppliers. It had also acquired additional fish trucks. As with the other non-innovative achievers, this firm was unable to make the kind of aggressive im-provements in procurement arrangements that some of the other firms had introduced. It had not invested in fish collection boats, had no plans for fish farming and its land-ing site needed further development. In addition, no in-house experiments for product development had been attempted.
"Most of our markets did not order for new products. If present products were faced with declining demand, we would think of changing products. Besides, there were no successful examples of new product development that we could have adopted and emulated" (Quality Assurance Manager, August 2002).
The implication here is that although there was added impetus to deepen innovation activities into the product development arena, FIRM I seemed impervious to such in-fluences partly because the demonstration of possible product improvements was still lacking. FIRM I was the kind of firm that waited for others to lead so that it could fol-low.
• What role did the financial gearing position of FIRM I play?
The firm scored the lowest on the quality rating. Its INNOVA score was also the low-est. Initially, this firm obtained an investment loan to construct and commission its fish plant. To hire local expertise, purchase materials for restructuring and finance imports, the firm relied on an additional investment loan from a local development bank. It also relied on short-term loans and overdrafts from a commercial bank and on pre-shipment payments from buyers for its working capital base. The maintenance of

114
a credit line at a commercial bank enabled the firm to promptly settle laboratory fees (external laboratories), settle payments to suppliers and pay the wage bill. However, the firm's high debt-equity ratio must have curtailed its ability to grow profit streams and new capital. Similar to the other non-innovative achievers, its gearing position was not necessarily appropriate for the lump sum investments associated with new product design and development or better arrangements for procurements. By size, the firm was also the smallest in the industry.
5.4.5 Characteristics of Firms that Failed to Comply with the EU SPS
Out of 11 firms, only 9 survived the EU ban. 2 firms failed to comply with the new set of rules and simply closed. In this section, we briefly describe their characteristics. Four Squares Ltd. was the first firm in Uganda to be approved for fish processing and exports to the EU. It was a foreign firm with Indian owners and its headquarters were located in Kenya. They also operated a sister company in Uganda dealing in fish. Compared with the other fish processing firms operational in Uganda at the time, the Four Squares plant, based at Kisubi, Entebbe, was small though considered medium-sized by way of its workforce. The firm initially seemed to be well managed. Its plant layout and structure were deemed acceptable and issued with an Establishment Ap-proval Number (EAN.). However, the firm got into major trouble as it became the first to export a contaminated assignment of fish to the EU and thereby prompting the first EU ban on Uganda’s exports. This action was met with a stern reaction from the government and the plant was eventually closed after inspections revealed a number of major inadequacies. At the time, the fish processors association was loosely func-tional. The industry had not also started receiving intense technical assistance. In view of the uphill task to restructure two plants simultaneously, the parent firm decided to concentrate its effort and resources on upgrading its other plant in Uganda partly be-cause the image of Four Squares had been severely damaged. The second firm to close for reasons directly associated to the ban was Clovergem Fish and Foods Ltd previously located in the Entebbe area in Uganda. At the time of the EU ban in 1997, Clovergem was a relatively new firm that had started fish proc-essing operations in 1995 (registered in Uganda in 1993). Its plant had been designed as a modern fish processing outfit to the standards typically found in European or other developed countries. It had modern freezing facilities, a conveyor system and equipment that clearly distinguished it from other firms in Uganda. It was foreign and said to be the largest and most modern across the industry in Uganda. Its management team also possessed technical skills and familiarity with modern fish processing op-erations. However, the firm faced non-trivial management difficulties that we would associate with 'institutional' factors in the sense of norms and habits. According to the key in-formants interviewed, managers at this firm were reluctant to take advice from techni-cal officers at UNBS which was the competent authority at the time. They disregarded advice and had minimal trust in the relevant fisheries officials. Being one of the few high-profile foreign investors in the country, this firm often invoked and relied on po-litical protection from high-clout political offices in Uganda who by their actions, en-abled the firm to become shielded from the realities of the market place. It was subse-quently unable to learn and to discontinue, what were becoming unsuitable habits and
115
practices. By constantly seeking redress from the politicians, this firm’s insufferable defensive behavior alienated even those technical advisors who were most inclined to assist with the rectification of some of the difficulties the firm faced. Its plant was established with the aid of an investment loan from the African Devel-opment Bank (ADB) and also obtained a number of working capital loans. Unfortu-nately, major repayments of some of these loans fell due at a time when the firm was simultaneously required to undertake changes and improvements in order to comply with the EU requirements. This was a problem because the firm was already heavily indebted and could probably not qualify for additional loans from bankers let alone attract additional or new equity. Consequently, it could not match its debt-servicing obligations with the need to make structural and operational improvements at the plant, hence its eventual failure to comply with the EU rules. After its collapse, one of the larger foreign fish processing firms in Uganda attempted to acquire the plant through a new firm known as Igloo Foods but because of the in-herited loan liability, Igloo Foods was soon put under receivership. Recently (2004), the plant was bought and restructured by a new Ugandan firm (Intercontinental Foods Ltd) and as of March 2004, it was in the final stages of obtaining approval to resume production.
5.5 Summing up
We set out to provide an in-depth analysis of the factors previously identified as im-portant for innovation in relation to the intensity of innovation activities (INNOVA). We also described in some detail, the methodology and indicators developed to evalu-ate the quality of these innovation activities. Using a set of scores assigned by fisher-ies scientists, we found that firms differed in the quality with which they had imple-mented change. We grouped the 9 firms in Low and High Performance bands based on export performance data, INNOVA, and quality of innovations introduced. Four broad patterns were observed: the innovative achievers; the semi-innovative achiev-
ers; the innovative under-achievers and, the non-innovative achievers. Almost all the factors previously identified as important for learning and innovation activities were present among the innovative achievers but concluded that finance fa-cilitates innovative change better when the other factors are present. We also find that among the innovative firms, export performance is lower for firms that privilege their financial gearing position with high-cost loans (such as those typically available within under-developed financial systems like in Uganda). Lower export sales affect the ability to grow profit streams and thus the ability to undertake some of the learn-ing and innovation activities. On its own, the competition for market share in export markets failed to bring about learning and innovative change across these relatively large firms. Instead, the pressure to introduce innovative change came from the impo-sition of enforceable standards placed by demanding markets. Similarly, non-market coordinating mechanisms played a vital role in facilitating learning and innovative change. A number of factors important for learning were either absent or limited among the semi-innovative achievers. These firms were early champions of innovation in many respects and their export performance was high. However, they later fell behind in

116
their level of interactive learning. They interacted less and less with providers of tech-nical assistance particularly with the providers in Uganda. Their financial gearing po-sition was not necessarily appropriate for heavy investments. We observed that 'insti-tutional' factors in the sense of habits and practices also restricted learning and inno-vation processes among some firms. One of these institutional factors was related to issues of trust. Many of the factors important for learning and innovation were absent among the non-innovative achievers. For instance, firms in this category were the smallest by firm size. They were both locally owned and had only a few linkages with providers of information and knowledge outside of Uganda. The proportion of workers with higher level education was very low which affected absorptive capacity. One of the firms totally relied on non-interest bearing finance particularly pre-shipment payments from its buyers in Europe while the second firm had a high debt-equity ratio. For both firms, the gearing position constrained operating margins and therefore their ability to undertake some of the learning activities. They however increased both their process-ing yield and exports per employee substantially relative to the other firms that started off at a much higher position. With time, their inability to engage in good quality on-going innovation processes is likely to constrain their ability to sustain high-value market niches. Of the two firms that never survived the EU restrictions, one closed because its image had been severely damaged. Its difficulties had to do with the absence of an effective support system. At the second firm, 'institutional' factors (norms and habits) stifled performance. Managers disregarded received advice and had only minimal trust in the relevant technical officials. The firm often invoked and relied on political protection from high-clout political offices, a practice that shielded it from learning and a need to discontinue other ill-suited habits and practices. Coupled with a high debt-equity ratio, the firm failed to manage its debt burden in the face of hard-hitting EU rules. Overall, the in-depth analysis of the Nile Perch fisheries firm-level subsystem has served to deepen our understanding of the nature of interaction between the various firm-level factors (including institutions) previously identified as important for intense innovation activities. In the next chapter, our interest is to understand, from an inno-vation systems perspective, if learning and innovation processes were or were not tak-ing place in the additional subsystems considered important for innovation. The idea is to get a better understanding of how the key subsystems fitted together to positively or negatively reinforce learning and innovation activities within the Nile Perch fisher-ies innovation system. Given the various factors, previously discussed, the analysis concentrated on the following factors and associated subsystems:
• The subsystem mediating institutions in markets and associated policies (as indicated by the important effect of the variable: export market orientation)
Here, we were interested in mapping the availability of intermediaries working to strengthen or mediate the quality of demand and other pressures from markets (such as competition bureaus, where available) and to examine the nature and intensity of interactive relations between them. Where relevant, we also examined the historical evolution of particular institutions, institutional change processes and how these might have shaped not only the innovation performance of firms but also the innovation ca-pabilities of the system as a whole. We included standard setting bodies; standards’

117
enforcement agencies and associated policies taking into account the reality that na-tional level standards and associated policies are often embedded within a broader global architecture of international trading agreements and measures.
• The subsystem promoting knowledge generation, accessibility, learning and associated policies(as indicated by the important effect of the variables: work-ers' education level, technical assistance, firm size and trained staff)
Our interest was to map the availability of non-firm organizations producing, direct-ing or coordinating relevant flows of knowledge. We examined the nature of institu-tions underlying their modus operandi and how these might have affected the avail-ability of knowledge necessary for learning and innovation processes of firms. This required an exploration of research agendas at relevant research institutes, curricula of relevant departments at universities, vocational education and industry training insti-tutes and, the scope of joint or collaborative programs or initiatives undertaken with other organizations. Within this subsystem, we concentrated on universities, research institutes and relevant industry training institutes but because we were also interested in the distribution of knowledge, we included business associations and development agencies providing technical assistance and coordinating knowledge accessibility. As with other subsystems, key changes in institutions, policies and the role of develop-ment agencies and the government in giving direction to the process of learning and in enhancing knowledge flows from abroad and across various actors in the country were also examined.
• The Bank and NBFI subsystem (as indicated by the important effect of the fi-nancial gearing variables and firm size)
Here, the primary concern was the examination of the rules and procedures, habits and practices defining and directing the financing provided by banks and non-bank inter-mediaries and their suitability for the kind of learning and innovation activities under-taken by firms. In particular, we would examine the scope and nature of institutional innovations (changes in rules and procedures embodied in new or modified financial products) and whether the institutional changes introduced (in the subsystem as a whole) were adequate and appropriate for financing learning and innovation processes of firms. Crucially, we would examine the scope and character of linkages in the sub-system given the potential role they might play in addressing information asymmetry and other related problems.

118

119
Chapter 6 The Nile Perch Fisheries System of
Innovation in Uganda: How did the important subsystems fit together?
6.1 Introduction
This chapter provides an interesting empirical case backing the notion that the likeli-hood for firms to undertake intense learning and innovation activities is high where suitable ‘institutional’ change, relationships and knowledge flows emerge within an innovation system. In the case of Uganda's Nile Perch fisheries, a wide range of knowledge flows, support and inter-relationships across subsystems emerged, ena-bling fish processing and exporting firms to successfully introduce innovative change. Why and how did these flows and inter-relationships emerge? How did the Nile Perch fisheries system transform itself? What was present for this to happen? A number of factors and inter-relationships were critical. They included firm-level characteristics as well as joint efforts across firms, the role of various support organizations (finan-cial and non-financial), local policy making, global buyers and international standard setting bodies. In this chapter, the focus is on how well the conduct and character of intermediaries, inter-relationships and broader institutional changes in the various subsystems interacted to bring about a conducive environment for learning and inno-vation processes. Given the various factors previously identified as important for in-tense innovation activities, the analysis concentrated on the following subsystems:
• The subsystem mediating institutions in markets and associated policies
• The subsystem promoting knowledge generation, accessibility, learning and associated policies
• Sector-based policies and practices
• The Bank and NBFI subsystem The discussion in this chapter should therefore be understood as an attempt to elabo-rate upon the factors, elements and relations outlined in Table 18 below.

120
Table 18: Explanatory Scheme for Innovative Change within the Nile Perch Fisheries
Key Systemic factors Institutional & organizational set-up : The Old
Institutional & organizational set-up : The New
Enhancement of the subsystem mediating market institutions
Weakly supported markets: embedded in ‘soft’ institutions (not closely policed), no trigger & no incen-tive to change
1. Incentive /Trigger to learn & innovate : conditional ban to high-value markets
2. Augmented & ‘hard’ institutions in mar-kets through:
• International Standards [Directive 91/493/EEC & amendments] &
continuous enforcement
• Local standards, regulations & enforce-ment + restrictions on supplies by public agencies
Enhancement of the subsystem for knowl-edge generation, distri-bution & technical sup-port
Knowledge bases in & out of the country inaccessible & disconnected islands of sup-port
• Strong co-ordination of required knowl-edge inputs & flows through public sec-tor agencies
• Stronger intermediaries, interactive knowledge generation & distribution
Some support from the Bank and NBFI subsys-tem
Historical norms & practices of financial system minimally supportive of learning & innovation processes of firms
Improved practices & new services intro-duced but mismatch with innovation re-quirements persist
Sector-based policies & practices (institutions)
Scattered policies & efforts; weak political interest, weak leadership
Higher degree of effort by the state to strengthen sector: political will, decisive & ‘open’ leadership
Firm-level factors • Size
• Institutionally augmented market orientation
• Education & training [workers]
• Technical assistance received
• Financial gearing position
• Ownership/ethnicity & institutions
The chapter is structured as follows. Part One takes a historical perspective to discuss the old set-up of the key subsystems before the Nile Perch fisheries system was trans-formed. We map the availability of relevant intermediaries and examine the nature and intensity of interactive relations between them. Where relevant, we examine the nature of institutions underlying the modus operandi of the intermediaries and how these might have affected the availability of information and knowledge needed by firms. Part Two focuses on the institutional and organizational change processes in the three subsystems.`
6.2 The Institutional and Organizational Set-up of Key Subsystems: The Old
Let us begin with the old subsystem dealing with knowledge distribution and techni-cal support.
6.2.1 The Subsystem Promoting Knowledge Generation, Accessibility and Learning
Prior to the start of upgrading efforts in the late 90s, the system of promotion, diffu-sion, adoption and adaptation of technologies in this sector was in a pitiful state. For

121
instance, there was a dearth of data and information on sustainable yields (the interac-tion between catch and available fish resources). Though owing to limited capabilities and financial difficulties, the Uganda Fresh Water Fisheries Research Organization (UFFRO) was unsuccessful in its mandate to undertake resource evaluation. Instead, two donor-led projects were initiated, in the 90s, to perform the resource evaluation for Lake Victoria and Lake Kyoga, the latter a World Bank funded project. Fish-factory managers interviewed during the course of our fieldwork were unable to ob-tain access to results of such studies. Regulators, needing such results to regulate fish-ing gear were also unable to gain access. Meanwhile, data on fish production was scarce and at times inconsistent. One FAO/UNDP project made some effort to improve the overall fisheries statistical sys-tem and also trained statisticians to improve the data collection process. However, Frielink (1990) was quick to observe that “this… [would] not be as effective as it could be, if statistics [were] not made the responsibility of a separate division within the Fisheries Department” (Frielink, 1990:7). Even with increased research capacity at the Fisheries Research Institute, knowledge flows across research, policy and industry remained difficult. The most visible link between research and fisheries management, at least on paper, was the government aquaculture research station at Kajjansi. How-ever, the station already faced numerous operational difficulties at the time. Commer-cial aquaculture was very limited and subsistence aquaculture remained difficult and unsupported. The zoology department at Makerere University was the major institute producing newly qualified fisheries officers. It however lacked any level of specialized training in capture and farmed fisheries and graduates therefore obtained an inadequate train-ing and a general degree in animal science. Training in aquaculture received far less attention. Interview findings indicated that the zoology department neither created alumni fora to track the placement of its graduates nor found it necessary, at the time, to collaborate with any other training institute as a means of improving the relevance of its courses to the fisheries sector. The food science and technology department at Makerere University started a degree-level course in food science and technology in the 90s. However, collaborative arrangements across the most relevant departments (food science, zoology and veterinary science) simply failed to exist. The Fisheries Training Institute (FTI) offered a 2 year diploma and certificate training in boat and yacht building. However, the institute had focused and geared its courses for future government bureaucrats and as Frielink (1990) had argued, it would have served a greater benefit if the institute had additionally provided short courses to boat-builders, fishermen, mechanics and traders. Surprisingly, the FTI had not only locked out an important group of actors from its courses, the present study found it still iso-lated from other actors. Importantly, there was no evidence that the FTI and the zool-ogy department, the food science and veterinary departments at Makerere University and the food technology unit at Kyambogo polytechnic, had made efforts to improve their level of interaction and strengthen knowledge flows. It follows that the much needed diffusion of skills to fishing communities remained extremely low. Ineffective working habits and practices still prevailed. For example, fishermen would set their gill nets between 6.00 - 8.00 p.m. in the evenings and haul them out the following morning between 5.00-7.00 a.m. (DCI, 1999). Mesh sizes var-

122
ied depending on the type of fish to be caught but once the fish was trapped, it died in the nets, setting into motion a spoilage process. Fishing canoes would take 2-3 hours to reach the shore thus increasing potential damage and spoilage. The canoes were often too small to carry ice, which would help keep the catch fresh. Cleaning of the canoes was infrequent and when undertaken, it was with the use of shore line lake wa-ter, which in itself was probably contaminated with micro-organisms (NARO, 1997 in DCI, 1999). The DCI study further noted that once the fishermen landed the fish, the skill to handle it tended to be unsatisfactory. The fish was often bruised in the process of selling it to collectors who transported it in large open-planked collection vessels to the major landing sites. Here too, more satisfactory handling skills needed to be im-posed. Besides, collection vessels carried both fish as well as human passengers, cre-ating conditions for further contamination. Landing sites were not only lacking in basic sanitary infrastructure, both the govern-ment and private firms felt no sense of urgency to upgrade the existing infrastructure. Thus, fish would often arrive at locations equipped with inadequate sanitary facilities. Ice, potable water, shelter from tropical rains and heat, electricity and lavatories were often unavailable. According to DCI (1997), the only ice used at the landing sites was that supplied by individual processing plants either free of charge or subsidized to fisher persons and procurements agents attached to particular fish processing plants. The government owned ice-making facility (Kampala Ice Plant) supplied only limited amounts of ice. Indeed, availability of clean ice to all who needed it did not, at that time, appear to be an easy obstacle to overcome. From the landing sites, fish was transported to processing plants via insulated trucks containing ice. Inside the trucks, fish would either be transported in a loose form or within boxes and the ice used was not always free of contamination. For example, the 1997 NARO study found a ‘high Total Plate Count of organisms such as Staphylo-coccus aureus’ from swabs taken from the floors of fish transportation trucks (DCI, 1997: 139). However, not all the fish was transported from landing sites by insulated factory trucks. Some was transported to markets on open pick-up vehicles, bicycles, wheelbarrows and public transport. Handling practices were generally poor (Frielink, 1990: 3) and government surveillance almost non-existent. At the processing factories, sanitary, health and environmental conditions also fell be-low international standards. Internal hygiene practices, waste disposal and treatment facilities were inadequate while plant layout and structural design were unsatisfactory. Available laboratories could not undertake all required checks and the opportunity for private laboratory services had not yet been seized. Broadly speaking, the fish handling and processing technology that was widely diffused at the time was relatively ‘low tech’ and certainly did not meet international stan-dards. Perhaps one of the most striking support mechanisms that emerged was the fish proc-essors association, UFPEA. As early as 1992 long before the EU ban, this association debated the threat to Uganda's fish exports even though most fish processors were left unconvinced of the need for immediate restructuring. Nonetheless, UFPEA played a vital role in market research and early attempts at advocacy. However, its stronger

123
influence on policy did not necessarily help to increase the flow of available support to the sector.
6.2.2 The Subsystem Mediating Market Institutions
As early as 1990, the Ugandan government had been warned that “because of the lack of international standards, at that time, and because of the extreme perishable nature of fish, one bad shipment could mean the loss of valuable markets, not only for the supplier involved, but also for the country as a whole…"(Frielink, 1990:8). In addi-tion, attention was drawn to the importance of ‘product and market diversification placing emphasis on the development of high-value added products through the pro-motion of research and development and, supplier-buyer relationships aimed at the development of new products, upgrading packaging and presentation stan-dards’(Frielink, 1990). Later in 1991 when the EU fish standards were established, “Uganda had no prior national standards…” (Ecaat and Odongo, 1999: 104). The Uganda National Bureau of Standards (UNBS) was the government agency charged with inspection of food safety and hygiene throughout many sectors including fisher-ies. Thus, it might be reasonable to assume that UNBS had knowledge and informa-tion about relevant international standards. If it did, it was neither able to develop pragmatic guidelines needed by fisheries inspectors and filleting plants nor use this knowledge to exert pressure upon the Nile Perch fisheries industry to change practices and upgrade technology. Inadequate capacity and other weaknesses at the UNBS inhibited its abilities to dis-charge its previously mandated tasks as the fisheries ‘Competent Authority’. The UNBS and DFR (Department for Fisheries Resources) were both government agen-cies with important responsibilities related to the fish sector but both were account-able to different ministries making it difficult to have a clear line of command. The UNBS came under the Ministry of Tourism, Trade and Industry while the DFR came under the Ministry of Agriculture, Animal Industry and Fisheries (MAAIF). No coor-dinated mechanism existed to facilitate the dissemination of knowledge about hygiene and food safety from technical experts at UNBS or DFR. Yet, this was crucial to the ability of the industry to deal with the problem of the ‘low tech’ fish handling and processing technology used at the time. Either these key public intermediaries were led to believe that the problem would correct itself or were simply unaware of the ef-fects and implications.
6.2.3 Sector-based Policies, Intermediaries and Institutions
The fisheries department was involved in fisheries policy development and implemen-tation since its creation in 1948 and discussions in favour of a development strategy for the fisheries sector were already in progress by 1990 (Frielink, 1990). However, matters regarding policy tended to be scattered in various departmental documents. Crucially, the long list of responsibilities the fisheries department had assigned itself (Frielink,1990) is an indication that the government in Uganda, like many other gov-ernments in sub-Saharan Africa, perceived itself as the main driver of economic activ-ity not only in the fisheries but in other sectors too. In fact, in the 80s and early 90s, the government ran a number of state enterprises and projects including those engaged in the production of fish nets (Uganda Fishnet

124
Manufacturers), fish trawling (the Sino-Ugandan Fisheries Joint Venture with the Chinese), fish processing, 3 fish distribution centers, and a fleet of fish trucks (Uganda Fisheries Industries Limited) and the supply of fishing inputs (EEC funded Artisanal Fisheries Rehabilitation Project). Many of these state outfits ran into man-agement and financial trouble prior to their closure or privatization. The key point is that despite this long history of public investments in the fisheries, no attention was paid to the need to build and support local systems for learning and innovation. Owing to the prudent implementation of the economic stabilization and reform pro-gram since 1987, there was a surge in the flow of bilateral and multi-lateral aid and debt into Uganda and by 1990, it was generally felt that the development of the fish-ing industry was a private sector matter. Inspired by the new climate of free markets and private sector led development, donors started building a case for the creation and strengthening of the policy and support environment within the fisheries and other sectors. In the fisheries, this would be an environment that would encourage profitable and efficient private sector involvement while taking care of conservation and local nutrition objectives. Consequently, a new donor-led strategy for the development of the fisheries sector began to emerge in the early 90s. The main idea was to scale down government involvement to only those activities that warranted public sector interven-tion. These would include sector-level planning and monitoring, resource evaluation and statistics, management measures and enforcement, adaptive research and exten-sion, export promotion and quality control, education and training and rural credit (Frielink, 1990). In particular, the Artisanal Fisheries Rehabilitation Project (AFRP) funded by the EEC suggested a re-organization of the fisheries department into four independent divisions namely a statistics and planning division, a management and law enforcement division, a research and development division and, an extension and training division. In hindsight, it would appear that this effort to sketch out scaled-down tasks for the fisheries department and reorganization was an attempt to build a stronger support system within the sector. However, these early efforts to strengthen and improve policy
coordination were still not attentive to technological improvements required in the fisheries. The inferior fish handling and processing technology that was prevalent did not seem to con-cern relevant government agencies and the donors who, at the time, supported much of the development effort in Uganda. The prolonged economic and political problems in Uganda proved fertile ground for illegal fishing practices and detrimental fishing gear such as small mesh gill nets and seine nets (Ogutu-Ohwayo, 1999). But even after the country had returned to the rule of law in 1987, the right fishing gear did not immediately become available. Law en-forcement officers, mainly DFR extension workers within the districts, did not have surveillance capacity to effectively deal with the situation. A number of management measures and regulations were in place but they were often inconsistent or inade-quately enforced. Mesh size requirements, for instance, varied with each different lake. On lakes Edward and George, the requirement was 5 inches while the country-wide requirement was a lower size mesh limit of 3” (Frielink, 1990: 3). Moreover, the Fish and Crocodile Act of 1964 had not been upgraded to meet changed conditions and requirements of the fish sector (Dhatemwa, 1999). While the failure to enforce laws was often attributed to the paucity of information on available fish stocks, reliable catch statistics, unavailability of craft and, financial difficulties, Frielink observed that

125
the inherent conflict in the roles of field officers to collect statistics, enforce laws and provide extension services at the same time also played a role. Overall, the problem of weak surveillance had to do with a number of factors including inadequate capacity, low levels of interaction to exchange information, legal weaknesses and a lack of po-litical will. At the fisheries department (DFR), inspectors could not adequately perform their du-ties. They lacked guidelines and standard operating practices with regard to the in-spection of fish batches landed, hygiene conditions at landing sites as well as proce-dures for sampling and traceability recording. The situation further worsened follow-ing the introduction of government’s policy on decentralization. District fisheries offi-cers were no longer accountable to the DFR and were subsequently found not to be adhering to the correct instructions relating to the hygienic handling of fish (Inter-views at UNIDO UIP, 2001).
6.2.4 The Old Banking and NBFI Subsystem
Research conducted by the Artisanal Fisheries Rehabilitation Project had already shown that traders in fishing gear were in need of some form of credit services in or-der to import expensive items such as outboard engines and gill nets. Even though the availability of fishing gear improved following the introduction of liberalized markets, the rules and practices followed by lenders did not match the requirements of artisan fishermen. A Uganda Commercial Bank scheme (The defunct Rural Farmers Scheme) to loan out fishing gear had attempted to intervene but its poor repayment record in-evitably contributed to its collapse. According to one of our respondents, the commer-cial banking sector considered the fishing sector simply 'too fishy to lend to'. Broadly speaking, neither the banking system nor the non-bank financial systems (through self-help credit cooperatives for example) were, at the time, able to meet the financial requirements of various actors in the fisheries sector.
6.3 Learning to Change: The New Institutional and Organizational Set-up
In Uganda's fisheries sector, the decision and direction of upgrading technology was dictated by external developments in the international trading environment. Targets for adoption and application of improved technological standards were set by the European Commission (EC) through new fisheries legislation known as Council Di-rective 91/493/EEC. Our explanation of the key dynamics of change can be summed up as follows. Previously, the institutions embedded in the EU export market were ‘soft’ and what happened is that the strict policing of the new standards augmented the institutions in this market. The conditional ban of Uganda’s exports out of high-value markets (the EU) provided the incentive to undertake intense learning and innovation activities. Moreover, re-entering the EU market was very important to the government given Uganda’s very narrow export base and the difficulties of declining global coffee prices faced by the country at the time. Hence, in an unprecedented manner, a number of players, including government, private firms - local and foreign - the fish proces-sors association and international development agencies responded swiftly and deci-sively to resolve the immediate and structural problems that the fish industry faced. Through public-sector led coordination, a new useful form of interaction in the sense

126
of Freeman (1987) and Lundvall (1988; 1992) emerged enabling the fish processing firms to successfully respond to the changes that had occurred in the institutional and organizational set-up. This positive firm-level response was facilitated by a number of factors related to firm size, the education and training of workers, the financial gear-ing position and, importantly, the intensity of technical assistance received. What fol-lows is a discussion of the key institutional and organizational changes that occurred in the various subsystems.
6.3.1 The Emergence of Institutionally-Augmented Markets
In July 1991, Directive 91/493/EEC was established “laying down the health condi-tions for the production and the placing on the market of fishery57 products” (Council Directive of 22 July 1991). The directive was amended each year between 1992 and 1996 and sought to achieve a number of objectives. The first was to articulate the re-quirements for the correct hygienic handling58 of fresh59 and processed60 fishery prod-ucts at all stages of production, storage and transport. The exporting country was as-signed the primary responsibility for ensuring compliance with the requirements laid down in the Directive while competent authorities61 in the EU member states were expected to carry out checks and enforce compliance. Secondly, the Directive sought to harmonize health requirements and to bring about competition on equal terms among EU member states, while ensuring quality products for the consumer (Council Directive, 1991). Measures and health standards laid down were to be applied uni-formly and in an identical manner to ensure the smooth operation of intra-community trade. Thirdly, fishery products from 'third countries'62 intended to be placed on the market of the Community were not to qualify for more favorable arrangements than those applied within the member states. To ensure ‘conditions of equivalence’, a Community procedure was established to inspect conditions of production and the placing on the market of fishery products from third countries. It was argued that these conditions were in harmony with the World Trade Organization (WTO) Sanitary and PhytoSanitary (SPS) agreement since according to the WTO rules, the EC was at liberty to apply such standards as long as it did not discriminate among WTO mem-bers and standards were not higher for imports. Later in 1997, the EC made it a requirement (through Commission Decision 97/296/EC) for all third countries to obtain prior authorization from the Commission before exporting fishery products to the EU. A two-list authorization system was in-troduced. List I authorized countries on a ‘definitive basis to export to the EU after a
57 According to Directive 91/493/EEC, fishery products refer to ‘all sea water or fresh water animals or parts thereof, excluding aquatic mammals, frogs and aquatic animals covered by other community acts’ (Council Directive 91/493, EEC: No. L 268/16) 58 ‘Food hygiene serves to protect the consumer from consuming foods which might be either damaging to health or unpalatable….…[Consequently], legislation concerning hygiene within the food industry has become increasingly tightened’ (FAO EASTFISH and SIPPO, 2000:8). 59 Fresh products refer to any fishery products whether whole or prepared including products packaged under vacuum or in a modified atmosphere, which have not undergone any treatment to ensure preser-vation other than chilling 60 Processed products refer to any fishery products that have undergone a chemical or physical process such as heating, smoking, salting, dehydration, or marinating, etc of chilled or frozen products 61 The term Competent Authority refers to the central authority of a member state or country deemed competent to carry out veterinary checks or any authority to which it has delegated that competence 62 Third country refers to a country outside the EU exporting fishery products to any EU member state

127
compulsory on-the-spot evaluation of the country’s [fish handling and quality assur-ance system]’ while List II catered for countries authorized to export to the EU on a temporary basis (Nathan Associates, 2000). What would it take in order to comply? Briefly, the EU legislation required the gov-ernment to appoint a local competent authority to oversee and manage the inspection process across the fisheries sector. Testing laboratories were to be designated and ap-proved by the EU. Landing sites had to be upgraded by way of their sanitary condi-tions. The government had to ensure better hygiene and handling of fish throughout the supply chain, by fishermen, fish collectors and other transporters in addition to a whole host of improvements at industrial fish-processing plants. More specifically, fish-processing plants would only be certified compliant if they fulfilled requirements in three broad areas notably plant layout; operations and the successful application of HACCP and its inspection. The list of compulsory requirements was long, complex and required major restructuring63 within the industry. In order to show how exacting the EU requirements were for firms with only limited ‘know- why’ and ‘know-what’, let us provide an overview of what it would take for a firm to comply. Obtaining plant certification required a plant layout with working areas sufficient in size to permit adequate hygienic and sanitary conditions. The layout would have to eliminate contamination of the product, clearly separating the clean and dirty working areas. It would need an adequate number of changing rooms, showers and lavatories kept clean and disinfected. Within the fish handling, preparation and processing area, waterproof flooring was required to facilitate easy cleaning, disinfection and drainage. Walls and doors all had to be changed using materials easy to clean. Adequate light-ing, ventilation, hand cleaning and disinfecting facilities were all part of the require-ments. Facilities for cleaning the plant, its equipment and utensils all needed to be in-stalled. The cold rooms, their floors, walls, ceilings and doors all had to be made of material easy to disinfect and clean. It was also a requirement to provide adequate ice production and refrigeration capacity. Plants needed appropriate facilities for protec-tion against vermin and undesirable animals such as rats, cats, dogs, birds and so on. Instruments and working equipment such as cutting tables, containers, conveyor belts and knives were to be corrosion-resistant, easy to clean and disinfect. By-products not destined for human consumption were to be disposed off in a hygienic way. Compli-ance would also require adequate supplies of potable (drinking) water, properly tested for chemical and microbiological pollutants and chlorine levels. Storage tanks were to be cleaned on a regular schedule using an acceptable procedure. In addition, waste water disposal and other waste were to be managed in a hygienic manner. Transporta-tion trucks too were to be cleaned and disinfected in accordance with acceptable pro-cedures. Operational compliance required processing plants to keep facilities and equipment clean and to ensure the personal hygiene of workers. The latter would include the availability of facilities such as laundry rooms to machine wash and disinfect workers' clothing. Workers would need to undergo regular medical examinations. It was vital for plants to boost their ice-production capacity based on potable water stored in clean, clearly designated containers. Water purification facilities would therefore be
63 The list of requirements discussed shortly draws on actual specifications documented in the Fish In-spection Manual developed by the Department for Fisheries Resources, Uganda (DFR, 2000)

128
required. Systems for the evacuation of waste were to be approved by the National Environmental Management Authority (NEMA). Waste was to be disposed off at least once a day, premises cleaned and disinfected after use. Storage of frozen and chilled products would need to be at the correct temperatures, recorded and the record kept for a duration equivalent to the shelf life of the product. Firms also needed to put into place measures for the detection, removal and control of parasites. In addition, they were required to undertake chemical checks on water through laboratory analysis and reporting of TVB-N (Total Volatile Basic Nitrogen) and TMA (Trimethylamine-Nitrogen). Pesticide residue analysis and microbiological checks were also to be un-dertaken. Packaging would need to be compliant with the hygiene rules particularly the US 7, 1993 rule on the labeling of foods. Correct application of the procedures on Hazard Analysis and Critical Control Points (HACCP) was vital and probably one of the very complex changes firms had to un-dergo given the scale and scope of knowledge inputs required. HACCP is a state of the art system used to ensure food safety and quality control. It is an involved, knowl-edge-intensive, documentation and application process aiming to identify and avert food hazards through the identification, monitoring and control of critical points within the fish processing process. Uganda's fish processing and exporting plants were required to design and implement a HACCP manual outlining operational procedures and management safeguards to ensure fish safety and quality for the subsequent approval from the competent author-ity (DFR). To be considered HACCP compliant, evidence was required in twelve dif-ferent areas. The first was evidence to show commitment from the management team towards the HACCP system and the devotion of adequate financial resources towards its implementation and maintenance. Evidence of qualifications from persons who were to be charged with the management and implementation of the HACCP proce-dure was also a necessary requirement. Thirdly, firms were to provide evidence of the product composition. This needed to be reflective of physical and chemical character-istics described in the standard operating manual and upon the introduction of modifi-cations in either the product or production processes, the revision of HACCP records would have to take this into account. The HACCP documentation would also have to include a valid description of the intended use of the product, process flow diagrams, disposition and characteristics of equipment, number and type of processing opera-tions, duration and delays between operations, technical data of operations, conditions of product storage and distribution, changes in process flow and many other finer de-tails. HACCP compliant firms would need to provide evidence showing the correct implementation of ‘hazard analysis’ particularly the identification of all potential haz-ards, cause of each hazard-contamination, re-contamination, survival, multiplication, persistence and details of control measures. In addition, firms had to introduce an ac-ceptable, internal HACCP inspection system. Given its complexity, only qualified personnel were to be designated to manage the whole HACCP process and its review as new changes in product and processes were introduced. Some analysts might not expect resource-based sectors such as Uganda's fish process-ing sector to be based upon diverse knowledge inputs. Such a view would grossly be at odds with what we found in Uganda. The industrial fish processing sector, a natural resource sector, was based on a diverse set of knowledge critical for its ability to
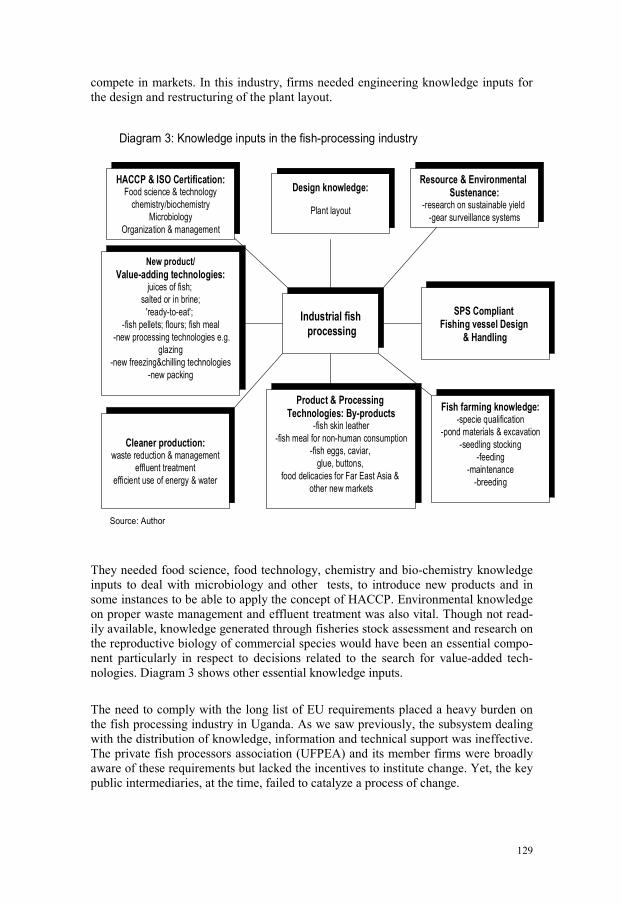
129
compete in markets. In this industry, firms needed engineering knowledge inputs for the design and restructuring of the plant layout.
SPS Compliant Fishing vessel Design
& Handling
Fish farming knowledge:-specie qualification
-pond materials & excavation
-seedling stocking
-feeding
-maintenance
-breeding
Product & Processing Technologies: By-products
-fish skin leather
-fish meal for non-human consumption
-fish eggs, caviar,
glue, buttons,
food delicacies for Far East Asia &
other new markets
New product/
Value-adding technologies:juices of fish;
salted or in brine;
'ready-to-eat';
-fish pellets; flours; fish meal
-new processing technologies e.g.
glazing
-new freezing&chilling technologies
-new packing
Design knowledge:
Plant layout
HACCP & ISO Certification:Food science & technology
chemistry/biochemistry
Microbiology
Organization & management
Resource & Environmental Sustenance:
-research on sustainable yield
-gear surveillance systems
Source: Author
Cleaner production:waste reduction & management
effluent treatment
efficient use of energy & water
Industrial fish processing
Diagram 3: Knowledge inputs in the fish-processing industry
They needed food science, food technology, chemistry and bio-chemistry knowledge inputs to deal with microbiology and other tests, to introduce new products and in some instances to be able to apply the concept of HACCP. Environmental knowledge on proper waste management and effluent treatment was also vital. Though not read-ily available, knowledge generated through fisheries stock assessment and research on the reproductive biology of commercial species would have been an essential compo-nent particularly in respect to decisions related to the search for value-added tech-nologies. Diagram 3 shows other essential knowledge inputs.
The need to comply with the long list of EU requirements placed a heavy burden on the fish processing industry in Uganda. As we saw previously, the subsystem dealing with the distribution of knowledge, information and technical support was ineffective. The private fish processors association (UFPEA) and its member firms were broadly aware of these requirements but lacked the incentives to institute change. Yet, the key public intermediaries, at the time, failed to catalyze a process of change.

130
6.3.1.1 Augmented Market Institutions and the Fish Export Crisis in Uganda
Almost six years after the establishment of Directive 91/493/EEC, neither the relevant EU department had visited Uganda to monitor compliance nor had the government in Uganda made efforts to comply with the directive. Then as we can see in Diagram 4, in February 1997, Spain found salmonellae bacteria in fish exports from Uganda64. Consequently, Spain and Italy imposed a bilateral ban on Uganda’s fish exports. Shortly thereafter, the EU made a decision (April 1997), requiring fresh or frozen Nile Perch exports from all three countries sharing Lake Vic-toria - Uganda, Kenya and Tanzania - to be systematically checked for salmonellae bacteria as it entered the EU market. As Uganda started to learn new ways of dealing with changed exporting conditions, a cholera outbreak hit the country in December 1997. On December 23, 1997 the EU placed a ban on fresh fish imports from Uganda, Kenya, Tanzania and Mozambique due to insufficient measures to control the out-break of cholera (Nathan Associates, 2000). The industry suffered yet another setback when shortly after the November 1998 EU inspection mission, anecdotal evidence pointed to a possible use of agricultural chemicals particularly pesticides to poison fish as a method of fish capture. A self-imposed export ban (March 1999) was an-nounced by Ugandan authorities until the safety of fishery products could be guaran-teed. One month later, the EU suspended imports of fish products from Uganda, Kenya and Tanzania.
64 The chronology of events was first documented in Nathan Associates (2000)
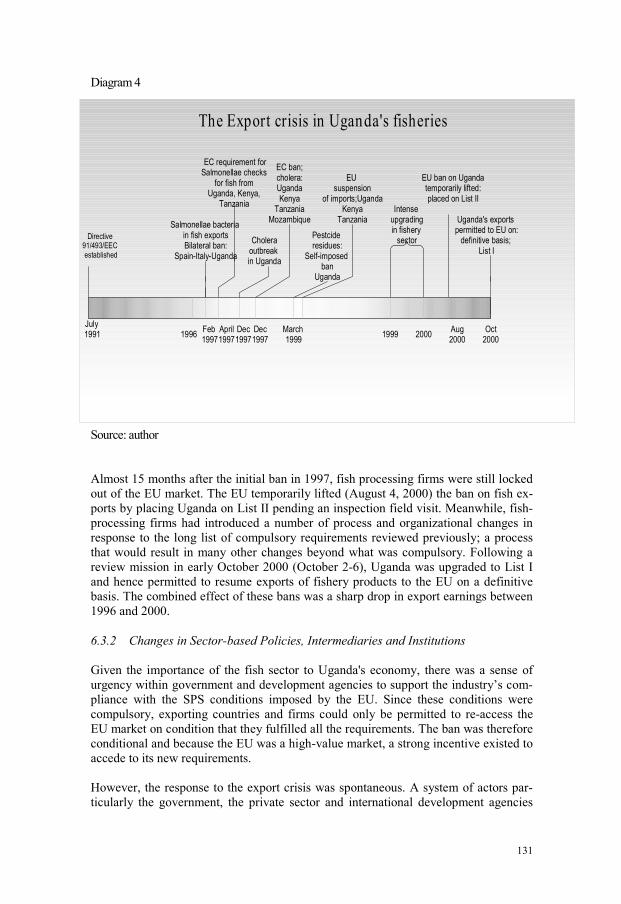
131
Diagram 4
Source: author
Almost 15 months after the initial ban in 1997, fish processing firms were still locked out of the EU market. The EU temporarily lifted (August 4, 2000) the ban on fish ex-ports by placing Uganda on List II pending an inspection field visit. Meanwhile, fish-processing firms had introduced a number of process and organizational changes in response to the long list of compulsory requirements reviewed previously; a process that would result in many other changes beyond what was compulsory. Following a review mission in early October 2000 (October 2-6), Uganda was upgraded to List I and hence permitted to resume exports of fishery products to the EU on a definitive basis. The combined effect of these bans was a sharp drop in export earnings between 1996 and 2000.
6.3.2 Changes in Sector-based Policies, Intermediaries and Institutions
Given the importance of the fish sector to Uganda's economy, there was a sense of urgency within government and development agencies to support the industry’s com-pliance with the SPS conditions imposed by the EU. Since these conditions were compulsory, exporting countries and firms could only be permitted to re-access the EU market on condition that they fulfilled all the requirements. The ban was therefore conditional and because the EU was a high-value market, a strong incentive existed to accede to its new requirements. However, the response to the export crisis was spontaneous. A system of actors par-ticularly the government, the private sector and international development agencies
Salmonellae bacteria in fish exportsBilateral ban:
Spain-Italy-Uganda
Dec1997
April1997
Feb 1997
Dec1997
EC ban;cholera:UgandaKenyaTanzania
Mozambique
March 1999
Pestcide residues:
Self-imposed ban
Uganda
EU suspension
of imports;UgandaKenyaTanzania
1999 2000Aug2000
Oct2000
Directive 91/493/EEC established
July 1991 1996
Intense upgradingin fishery sector
The Export crisis in Uganda's fisheries
EC requirement forSalmonellae checks
for fish from Uganda, Kenya,
Tanzania
Choleraoutbreak in Uganda
EU ban on Ugandatemporarily lifted:placed on List II
Uganda's exports permitted to EU on:definitive basis;
List I

132
worked relentlessly to facilitate compliance with the EU rules but not necessarily to upgrade and build a system for technology support within the fisheries sector. Instead, they spontaneously responded to a hard hitting export crisis in a sector that was very important to Uganda's economy. Similarly, through interviews conducted with offi-cials at the EU’s Directorate of Health and Consumer Protection in Brussels (2004), we could not find any evidence to suggest that in issuing Council Directive 91/493/EEC the EU explicitly and deliberately sought to build technological learning systems in the fisheries sectors of Third Countries. Since its response was not a deliberate effort aimed at building local learning and in-novation systems in the fisheries, the Ugandan government did not establish new or-ganizations to support, coordinate or sustain the process of technological change. However, it promptly created a legal framework that effectively delegated the fisher-ies department (DFR) the remit of rectifying the export crisis. The process of updating laws and regulations in the fisheries sector was accelerated and the new legal frame-work effectively granted powers of surveillance and enforcement to the inspectorate of fish processing standards. After its acquisition of new statutory powers, the DFR soon began to respond to the export crisis. Task committees were initiated to develop national standards in re-sponse to the demands of the Council Directive 91/493/EEC. Now equipped with the power of enforcement and compliance, DFR had the opportunity to enforce compli-ance across all actors within the fish harvesting, distribution, processing and exporting chain. New standard operating procedures were developed for the fisheries inspectors and fish processing plants were inspected and closely monitored. The work of the DFR was often in conjunction with other specialist organizations. The strengthened fish inspection service eventually facilitated entry to the US market, where public au-thorities demanded approved HACCP systems. However, like many other government departments in Uganda, its own financial and human resources fell far too short of its new responsibilities. Key support came from international development agencies par-ticularly, the Uganda Integrated Programme (UIP) run by UNIDO in Uganda which played a vital role in the coordination and the distribution of information and knowl-edge throughout the Nile Perch fisheries system.
6.3.3 The New Subsystem for Knowledge Generation, Distribution and Technical
Support
As a direct response to the fish export crisis, UNIDO UIP played a vital role in man-aging and driving the EU compliance process. It also played a leading role in coordi-nating the process of knowledge diffusion. For example, UIP provided technical assis-tance to the government in preparing quick and effective correspondence with the EU Commission, regarding guarantees put in place by Uganda to meet the EU require-ments. It identified and paid consulting firms (based in Europe) to strengthen HACCP audit systems at DFR, to train fisheries inspectors and quality assurance managers across the industry. With financial support from UNIDO, the DFR obtained equip-ment and a fish inspection manual was published by DFR fish scientists, which set out new and revised standard operating procedures for inspectors. The Lake Victoria En-vironmental Management Program (LVEMP) a project supported by The World Bank provided duty allowances, transportation and other logistical support critical for the effective implementation of the revamped inspection and law enforcement service.

133
One of the critical problems faced by the government was the lack of suitable labora-tories for pesticide residue analysis. Initially, the ‘Government Chemist’ laboratory was put in charge of this problem but was incapable of meeting the EU standards. In-stead, the EU invoked the ‘positive discriminatory treatment’ principle to allow Uganda's fish exports to be tested in European laboratories. This measure would be effective up and until such a time as Uganda would have upgraded the capability of its own laboratories. This was in line with a provision in the WTO - SPS Agreement that required trading partners such as the EU to grant technical assistance to partners in developing countries. Meanwhile, UNIDO UIP financed the process of upgrading in-country laboratories and thus reduced transaction costs associated with overseas laboratory analysis. The UNBS microbiology laboratory was fully equipped and included an internationally acceptable quality management system. UIP also provided support to a Belgian-owned private laboratory, which was later approved by the EU to conduct in-country pesticide residue analysis. In addition, the 'Government Chemist' analytical laboratory was upgraded (Interviews at UNIDO UIP, July 2001). Starting with a few fish processing firms, the UIP also worked towards the adoption of ISO 9002-2002 quality management systems and by the end of 2002, almost all firms had achieved the standard. The fish processors association was also strength-ened and supported by UNIDO to introduce a self-regulatory framework through a voluntary but uniform “Code of Practice”. Why was UNIDO UIP, a public sector agency, able to direct and coordinate the proc-ess of learning so effectively? Part of the answer lies within the kind of institutional set-up the programme had de-veloped for itself. The Uganda Integrated Programme (UIP) of the United Nations In-dustrial Development Organization (UNIDO) was designed as an integrated capacity development programme, executed through a cooperative agreement between UNIDO in Vienna, Austria and the Ministry of Tourism, Trade and Industry on behalf of the government of Uganda. It emerged out of a process leading to "UNIDO's Director-General's visit to Uganda in July 1998 during which he promised UNIDO's support to develop a comprehensive industrial sector strategy using UNIDO's new programme and integrated service packages". Uganda became one of the first testing grounds for this new integrated approach. Subsequently, phase I of UIP was implemented in Uganda between March 1999-2002, and has been renewed since. The first phase was supported through a conglomeration of international development assistance (US $ 6.26 million) from the following sources:
• Italy (US$ 1.55 million)
• Norway (US$ 1.38 million)
• UNIDO (US$ 1.06 million)
• Japan (US$ 0.88 million)
• Austria (US$ 0.71 million)
• Denmark (US$ 0.67 million)
134
The programme aligned itself with three key approaches (cum principles) that shaped its strategies. First, it embraced participatory principles because the second principle of sustaining its results very much depended on how well it involved and built capaci-ties of a number of relevant organizations. The third principle was integration:
".. very strong emphasis was placed on the building of synergies within and among the different components of UIP. …UIP has [built] synergies with other programmes with similar objectives….including the Deregulatory Project of DFID on trade licensing, FAO and WHO in the fisheries sector, JICA on skills upgrading and entrepreneurship development through Nakawa Vocational Training Institute, UNDP, the District Promotion Center in the implementation of the Master Craftsman Programme at district levels, and Enterprise Uganda collaboration through investment promotion" (UIP Phase I Report 2002: 6)
At the headquarters in Vienna, the project was overseen by the agro-industries and sectoral support branch of UNIDO and directed by a team of specialists put together to cater for the technical assistance requirements of the various agro-subsectors and related organizational development imperatives. The arrangements for programme execution were unique and remarkably different from many other development assis-tance programs in Uganda. For example, we can see from Table 19 that the pro-gramme executed its objectives through several clusters of expertise composed of for-eign and national specialists in varied subject matter working jointly and learning from each other. Interestingly, the more detailed staff list, we scrutinized, revealed that the composition of coalitions included specialists from research institutes, policy development agen-cies of government, universities, private business and consulting, private sector or-ganizations, local and international development agencies and, support and service organizations. Table 19 also reveals that this programme was not designed to be an implementer but rather a coordinator of coalitions between local and foreign experts, private sector organizations, government agencies and, funding agencies.

135
Table 19: Clusters of expertise under UNIDO's Uganda Integrated Programme
UIP components &
implementation
Executing coalition
Overall direction at UNIDO in Vienna
13 project managers (technical specialists & nationals of various countries) each directing different aspects of the integrated programme: food (team leader); tex-tile; leather; micro, small and medium enterprise; investment promotion; invest-ment promotion unit; information; quality; Uganda National Bureau of Stan-dards; cleaner production
Coordination Unit in Uganda
1 overall national coordinator (local Ugandan) and 1 food component coordinator &national expert (NE) in food inspection and leg-islation supported by 2 secretaries and 2 drivers
Food-industry sub component
12 national experts (NE) covering fish inspection; food technology; food safety(fish); sanitary food inspection; post harvest technology; honey production & marketing; veterinary inspection; food safety(other food sub-sectors); quality systems, quality management systems; boat design and building 11 international experts (IE) covering fishing technology and handling; food safety assurance; good manufacturing principles and HACCP; fruits and vegeta-ble processing; agro-machinery; honey production and marketing; post-harvest and small scale processing technologies; fish inspection management system; quality management systems; assessing US/RAF/95/171 (a specific technical standard)
Textile sub-component
7 NE in garment and new product development; basic and surface design; busi-ness management, marketing and promotion; business plan training, production & implementation; weaving & funds mobilization; management and marketing; dyeing, surface design and cleaner production 1 chief technical advisor (foreign specialist) 1 technical expert in machine maintenance and repair (local) 2 technical assistants in product development; surface design and colour (local) 1 IE in weaving
Leather Sub-component
2 national experts in tannery effluent treatment & 3 international experts
Micro and Small-scale (MSE) Component
13 NE covering engineering; entrepreneurship development; MSE development; master craftsmanship; MSE policy; accounting systems; microfinance; lease fi-nancing; MSE support systems 2 international experts in economics and MSE development
Investment Promo-tion Unit
1 Head(foreign) supported by 2 local officers and 2 secretaries and 1 driver
Uganda Investment Authority (institutional devt.)
4 NE: foreign investors survey 1 NE: telecommunication technologies 1 NE & 1 IE : training consultants in customer care
Uganda Business Information Net-work
2 NE in information systems & networking software 4 IE 1 secretary & 1 driver
Coffee sector 2 NE: strategic plan for development & promotion of coffee 3 IE: technical aspects and marketing
Uganda Cleaner Pro-duction Centre
1 director & 1 deputy(both local) 2 IE
Multi-Purpose vil-lage workshops
3 NE in agro-economics, economics; women entrepreneurship development 1 IE in agricultural machinery/engineering
Source: Compiled by Author from staff list, Annex: UIP Phase 1 Report

136
UIP was a coalition builder and given the way it chose to operate65, it seems safe to conclude that by design, UIP was envisaged to be a catalyst and coordinating agency for interdisciplinary, intra-sectoral as well as inter-sectoral networks, all inspired and directed by the same vision to:
"…fulfill the government objective to increase foreign exchange [earnings] and promote income generating activities for poverty eradication and employment creation. …taking into account "Uganda's commitment to integrate into the global economy and especially with its neighbors in the East African coopera-tion" and realizing that Uganda's "great agricultural resource endowment fa-vours the promotion of agro-based industries with the focus on small and me-dium enterprises that will contribute to poverty eradication" (UNIDO UIP pro-ject material).
The close alignment between UIP's vision, strategies and priorities to the overall pol-icy direction the country had set for itself, was not accidental. It emerged out of years of action-oriented research, discussions and consultations between UNIDO, donors, representatives from government ministries, non-governmental organizations and many other private sector organizations. The very same people were now brought to-gether to join the many interdisciplinary teams and coalitions which were to be the heart and drive of the entire programme. There also existed substantial awareness as to how the various components of the program and the supporting financial modalities all pieced together. The decision to invest in the initial and difficult process of exten-sive consultations, transparency and awareness building and, the interactive practices with which it continued to implement its programme, was far from easy. But it as-sisted UIP to be relevant and responsive not only in meeting the development impera-tives, initially identified at design stage, but also in swiftly adjusting its agenda to ac-commodate unanticipated emergencies and changing circumstances. For instance, it would have been extremely difficult for UIP, a relatively new programme on the Ugandan scene at the time (March 1999), to be considered a legitimate and credible coordinator of the private and public sector response to the fish export crisis had it not been for UIP's in-built flexibility and methods of work. Overall, the UIP seems to have succeeded in creating new interfaces and linkages critical to the ability of Uganda’s Nile perch industry to learn and innovate. It was not only government and international development agencies that extended ser-vices in support of knowledge accessibility and diffusion. For the first time since the start of the industry in Uganda, fish-processing firms jointly searched and explored solutions through the fish processors association (UFPEA). Exploiting the good inter-national networks already established by some members of the association, UFPEA approached CDI (The Center for the Development of Industry), a Brussels based or-ganization working within the EU’s Africa, Caribbean and Pacific (ACP-EU) frame-work for technical assistance. Firms were assisted in implementing the required im-provements to product flow and layout (forward motion principle). CDI experts also made practical demonstrations at the plants, ranging from hygiene control to chemical and microbiological tests, optimal arrangement of premises, waste treatment and the movement of products. Following the initial training activity which benefited all firms
65 Through thematic task forces and committees spanning various sectors as described in UNIDO UIP’s Phase I Implementation Report (2002)

137
in the business association, the CDI arranged a consulting mission where two French companies (IDMER and LPIA) supported a local firm to reorganize its plant layout66. Another consultancy mission was implemented for the “internal refitting of the pro-duction line…”with the objective of reorganizing the flow of products during process-ing, in accordance with the forward motion principle” (CDI, 1996:15). In a third in-tervention, CDI provided start-up assistance to a local firm producing polystyrene boxes used in the packaging of fresh fish exports (CDI Dossier # 1, 1996). Interviews with buyers in Europe highlighted the important advocacy role played by the European importers of Nile Perch. They formed an association (ENPIA) which served as an information broker between the fish processors in Uganda and the Euro-pean Commission in Brussels. It updated EU officials in Brussels with information on the improvements made by fish-processing firms in Uganda and exerted pressure on relevant officials to schedule progress assessment missions to Uganda. The buyers’ association disbanded after the EU had lifted the ban on fish exports from Lake Victo-ria. Although individual buyers provided only limited assistance to enable their pro-ducers to comply with the new EU regulations, the exchange of information between ENPIA and the producers’ association UFPEA proved useful (author's interviews, 2004). The local private sector also participated in the change process. For example, a new firm emerged to provide ISO 9002-2002 quality certification preparation and train-ing67 and local firms were sub-contracted to provide pest control and fumigation ser-vices. Through the provision of joint services, there developed an enhanced interaction be-tween the new and old actors within the fisheries sector. For example, there was a joint effort between the government, donor agencies, fish-processing firms and boat builders to upgrade the fishing canoes and collection boats. With financial support from UNIDO-UIP and The World Bank’s LVEMP, traditional boat builders were trained at the Fisheries Training Institute (FTI), a government training institute that conducts formal courses in boat building. Out of this training process, two pilot boats designed to fulfill food safety and SPS conditions were handed over to UFPEA for trials and further assessment (author’s interviews with FTI and UNIDO UIP, 2001; 2002). The method of delivering services also changed. For example, the government's fish-eries department (DFR), the Uganda National Bureau of Standards (UNBS) and NARO-FOSRI68 conducted joint evaluation visits. These changes in working habits enhanced cross-learning and flows of knowledge to the industry even though the in-dustry still lacked a number of knowledge inputs needed to further upgrade (in prod-ucts for example). Importantly, in the year 2000 a new formal degree-level course in fisheries and aqua-culture designed to meet the manpower requirements of the industry was introduced at Makerere University (with support from a number of agencies including the World
66 Other firms could not easily copy these changes (introduced with the help of experts identified through CDI) as they lacked the tacit knowledge to do so. As we saw in the case studies, each firm had to introduce additional learning activities in order to access the necessary knowledge inputs. 67 Services provided by this training firm were paid for by individual fish processing firms. 68 This is the Food Science and Research Institute(FOSRI) under the National Agricultural Research Organization (NARO)

138
Bank’s LVEMP). This course would not only produce specialized fisheries officers, it would also strengthen collaboration between two university faculties - the zoology department within the faculty of science and the veterinary science faculty, both of whom jointly developed and delivered the course. Thus, it is possible that the fish ex-port crisis contributed to a better understanding that universities needed to be relevant and responsive to the changing needs of industry. This type of response also points to a latent capability of the education system to change when confronted with new chal-lenges, another indication of how the ‘hard’ policing of innovation-enhancing stan-dards could help with the unlocking of obsolete organizational and institutional set-ups (‘cul-de-sacs’). Though it may appear rather ordinary to some readers, such a swift response by an African university is unusual and a lonely example across devel-oping Africa but is to us the exemplar of how key organizations in the system learn to introduce institutional change necessary for the emergence of productive partnerships. It is also unusual that a poor African country would self-impose a ban on its priority exports (in terms of foreign exchange earning capacity). The government of Uganda self-imposed a ban on its fish exports until the safety of fishery products could be guaranteed. This happened in March 1999 following in-country anecdotes that fish-ermen were using pesticides in the fish catching process. Many commentators have since reported that the officials in Uganda were later scorned by some politicians and bureaucrats in the region for initiating and self-imposing this particular ban and in a single-handed fashion without consulting Kenya and Tanzania, the neighbors with whom it shares Lake Victoria. Why would Uganda self-impose such a ban? The sus-tained publication of the problem in the local press resulted in a widespread fear and reluctance by domestic consumers to purchase almost all species of fish from the fish-ing communities. This heightened the political pressure on the central government to intervene, investigate and correct the situation. The government then concluded that in order to obviate a full-blown crisis and total loss of access to the growing and high-value European market, they would need to forfeit the immediate export earnings to establish the facts and where necessary institute corrective measures in the entire fish-eries. Why did the leadership in Uganda decidedly face its difficulties with such forti-tude and not be held back by the supposedly more convenient and defensive practice of non-openness? Breaking away from common habits and practices is not easy. Therefore, why and how the local leadership in Uganda managed to overcome such practices is an interesting subject worthy of further empirical inquiry. However, our conjecture is the following. In many ways, the simultaneous and difficult improvements that occurred in the fish-eries sector mirror the tenacity, sometimes radical measures ongoing in Uganda to steer the country out of its past decay. Having suffered the hardships of a prolonged civil war, economic mismanagement and social dislocation, it is sometimes remarked by commentators and some political leaders, that this post-conflict country now has a chance to rebuild in a manner that permits it to take on a full-scale transformation, not to recreate what was there before but to strengthen and move beyond the positives from the past. This outlook is apparent from the official website and promotional ma-terials of the Uganda Investment Authority (UIA), for example (UIA is Uganda’s of-ficial agency responsible for attracting and facilitating foreign direct investment into the country). Perhaps rallied by this overall national vision, leaders in the fisheries sector chose to respond to the difficulties they faced in a uniquely open, determined and decisive manner that would eventually help the sector to rapidly learn and eventu-ally resume exporting.

139
The situation in neighboring Kenya was very different, as this kind of vision, effort and decisiveness was simply absent at the time (McCormick, 1999). In fact it was only much later, in the first half of 2004 that Kenya's fish exports were upgraded to List I. Consequently, after the ban, many fish processing firms moved from Kenya into Uganda to benefit from access to the EU market which could only be obtained after instituting the kind of changes that Uganda had introduced. What this means is that in addressing institutional factors that stifle learning and inno-vative change, especially in developing countries, we probably should not underesti-mate the importance of the political dimension particularly the formulation of a vision that the majority of people can relate to and in addition, the requirement for a caliber of leadership able to suffer short-term criticism in the interest of diminishing or even rooting out the institutional evils that only perpetuate the learning and innovation dif-ficulties of such countries. Within the Nile Perch fisheries system, the analysis of factors and relations that might have driven the learning and innovation process has so far focused on the firm-level subsystem, the subsystem for knowledge generation, distribution and technical sup-port and, the subsystem mediating market institutions. Given the factors previously identified as important for learning and innovation, the fourth and final subsystem, analyzed in the following section, is the Bank and Non-Bank financial subsystem. The discussion concentrates on what was needed from this subsystem in relation to learn-ing and innovation, what was achieved, what might have been done and why it was not.
6.3.4 Improvements and Missed Opportunities in the Bank and NBFI System
Banks and leasing companies in Uganda provided loans and leases, crucial to the abil-ity of many fish processing firms to restructure. The loans were provided by commer-cial banks as part of what is often called special lines of credit. A number of these credit schemes have been administered through Uganda’s banking system. They have either been established from government’s own resources or financed by loans of the Ugandan government from international financial institutions such as The World Bank and European Investment Bank. The Development Finance Division at the Bank of Uganda has managed a number of them on behalf of the Government of Uganda. However, the illustrative cases discussed in this section show that even when there is a real opportunity for a more effective financial support system to emerge, the persis-tence of historical norms and practices of the banking system tend to stifle the achievement of this result. We shall argue that across Uganda’s banking and non-bank financial system, such norms and practices needed (and still need) to be reversed in order for the system to be more supportive of learning and innovation processes of firms.
6.3.4.1 Case A: Investment Term Credit Refinance Fund (ITCRF)
ITCRF was a brainchild of The World Bank (The Bank) and part of a broader inter-vention known as the Enterprise Development Project (EDP). It aimed to provide in-vestment and financial support and technical assistance to improve the operating envi-ronment of private and public enterprise, generate a supply response from all enter-

140
prises and contribute to reducing budgetary deficits through reducing public enter-prises and improving the performance of viable ones (The World Bank, 1991). The EDP had four components. The first was a line of credit known as the Investment Term Credit Refinance Fund (ITCRF) to meet firms’ needs for investment finance. The idea was to provide financial resources and incentives to the banking system to extend both working capital and investment loans to private and public firms irrespec-tive of whether they were export or domestic-oriented. The second project component was a Technology and Management Fund (TMF) to ease access to improved man-agement and technology through ‘ensuring availability of foreign exchange for peri-odic payments under Technology and Management Contracts (TMC)’ (The World Bank, 1991:25). The third component was a restructuring fund to finance restructuring needs of public enterprise, while the fourth was a technical assistance fund to finance management and technical training, consultant services, equipment and materials for all project components. In total, a loan of US $ 65.6 million, payable over the standard IDA term of 40 years, was extended to the government of Uganda to cover all four project components. In addition, a credit guarantee fund, initially financed by gov-ernment resources (US $1 million), would modify a pre-existing credit guarantee scheme69 for small enterprises. The ITCRF ran between January 1992 and March 1999 and for the first time ever, it provided an opportunity for private banks in Uganda to combine standard commercial banking with investment lending. An amount of US $ 25 million was set aside as a fund (ITCRF) that would refinance70 investment loans to private and public enter-prise made by accredited71 banks and credit institutions. ITCRF loans carried a maxi-mum loan size of US $ 2 million, maximum loan term of 7 years and interest rate charged by accredited banks could not exceed the maximum lending rate for devel-opment loans periodically prescribed by the central bank that is, the Bank of Uganda (BOU).
• ITCRF Performance
71 per cent of ITCRF loans were used by existing firms to import machinery and equipment for expansion and modernization of production. 28 per cent went to start-ups. By loan amount, Table 20 shows that three firms producing beer and soft drinks received the largest chunk of loans (23 per cent of total value). All three firms bor-rowed for growth, either to install additional production lines or import machinery and equipment for expansion of production capacity which as previously observed, does not necessarily imply learning and innovation especially if the imported equipment and machinery is not brand new.
69 The pre-existing scheme, acknowledged to have performed poorly, aimed to facilitate banks to lend to small firms 70 Replenish a pre-determined proportion of a loan sanctioned and disbursed to a firm 71 Accreditation to Bank of Uganda was granted upon satisfactory compliance with all prudential bank-ing regulations issued by BOU, adequacy of capital, adequacy of loan appraisal, documentation and tracking systems and, unqualified certification of annual financial statements by auditors especially with regard to provision for bad debts (World Bank, 1991, BOU-ITRCF circular, 1993)

141
Table 20: ITCRF Loans by Industry (1992-1999)
Industry Number of borrower
firms
Loan amount
(US $)
Drinks and Beverages (Beer and soft drinks)
3 5,704,282
Edible oil & soap production 3 2,012,664
Petroleum & Oil distribution 1 2,011,731
Hotels 3 1,546,130
Broadcasting 2 1,493,125
Education 6 1,467,099
Grain milling 2 1,311,501
Graphics, printing & packaging 3 1,294,858
Bakeries 2 1,122,994
Property development 2 1,038,208
Dairy products 1 1,015,982
Cosmetics 2 886,952
Aluminum rolling 1 798,067
Pharmaceuticals 2 672,997
Roofing sheets and accessories 1 668,656
Leather and Footwear 1 479,914
Industrial/Medical gases 1 360,999
Batteries 1 331,418
Foam mattresses 1 296,573
Paint 1 225,100
Building & construction 1 198,235
Health (Laboratory) 1 99,285
Sanitation Disposal Systems 1 44,458
Total 42 25,081,228
Source: Based on Bank of Uganda-ITCRF records
They all produced goods previously imported, had links with foreign investment, en-joyed a good domestic market share and healthy and regular cash flows that would cover loan repayments. These firms were all large72. In second place was the set of
72 Over 100 workers and investment way over US$ 300,000. Under EDP’s small enterprise Credit Guarantee Fund (CGF), a small firm was defined as one with investment worth US$ 300,000 and be-low. Elsewhere, Ministry of Finance and Economic Planning in Uganda defines a large firm as one with investment worth US$ 100,000, medium firms have investment of US$ 10,000-100,000, small firms have investment of US$ 5,000-10,000 while micro firms have US$ 5,000 and below, worth of investment
142
firms producing edible oil and soap. These firms were also large, borrowed for growth, had links with foreign investment, produced goods previously imported for a vibrant domestic market but relied more on local raw materials. The products that these firms dealt in also assured a quick turnaround of investment and hence a healthy and regular cash flow to service loan repayment. In third place by value of ITCRF loans was a local subsidiary of a transnational oil distribution company, again a large firm with foreign investment links and a vibrant domestic market which assured quick and regular cash flow. Thus, lenders were assured of the firm’s ability to pay back loans. The next category of firms in hotels, broadcasting and education, were all large, owned mainly by local Ugandans, had borrowed for growth and had good market share for the kind of services they provided which assured lenders of a steady cash flow and therefore a predictable ability to pay. The last category - firms that borrowed the least from ITCRF – was a grouping of diverse industries. A majority were smaller firms or start-ups seeking to seize new market opportunities. Coupled with slower cash flow turnaround and probably shorter histories with banks, we might expect that loan officers found it more difficult to ascertain credit risks associated with these new firms. Thus the firms that enjoyed access to ITCRF loans the most were large in size and their investments had shorter product cycles and more specifiable and defined markets - attributes that would help generate quick and regular cash flow to support loan re-payment. Technological learning and innovation activities which tend to have less de-fined market outcomes, attracted less attention among ITCRF participating banks. These findings are consistent with the empirical literature on access to credit espe-cially the studies focused on examining this problem in developing countries. Furthermore, we found that there was almost no distinction in appraisal techniques, cash flow analysis, and risk-sharing and management arrangements for start-ups and for on-going investments. A review of ITCRF documentation did not show distinct criteria for start-ups and for on-going investments an indication that banks used the same appraisal techniques with which they were already familiar. The inability to make this distinction must have made it difficult for firm-level investments, new to the bank, to pass screening tests. In addition, banks barely diversified their knowledge in appraisal techniques, risk-sharing and management. As we would expect, banks already knew a lot about loan assessment with regard to large firms. They also knew a lot about loan assessment with regard to investments with more defined market out-comes and quick cash flow. Similarly, Chart 2 shows that a disproportionate share of ITCRF loans went into eas-ily quantifiable and specifiable loan purposes, particularly the importation of machin-ery and equipment. The latter is historically considered to be a safe purpose for a loan given that banks can easily track such importation through letters of credit and there-fore are able to prevent loan diversion. Banks hardly made loans for activities whose outcomes were more difficult to specify such as investments to adapt imported equipment. This had to do with three possible reasons. First, there was a misconcep-tion that technical knowledge inputs and associated payments for consultancy and training services only mattered at the initial stages of establishing production. Sec-ondly, bankers were unfamiliar with non-conventional loan purposes, such as experi-ments to diversify the use of raw materials and perceived them to be risky. The third reason which is related to the second is that the prescription of purposes eligible for borrowing narrowed the scope of loans that lenders could make.

143
Chart 2: ITCRF by Purpose of Loan
Source: Based on BOU/ITCRF records
Conventionally, banks conduct loan monitoring visits for loan collection purposes or as a marketing strategy to build good relationships with their clients. A review of ITCRF monitoring-visit reports showed that once imported equipment arrived, was installed and production commenced, what the borrowers did to enhance their knowl-edge or improve equipment and production processes, was not something that the lenders were concerned with. Consequently, borrowers were neither encouraged nor supported to engage in technological learning and upgrading activities. What mattered most to lenders was whether a borrower firm was servicing the loan adequately, its employment level and the status of production and markets [in a static sense]( see ITCRF monitoring reports January 1995 and September 1998).
6.3.4.2 Case B: The EIB–Uganda Apex Private Sector Scheme
In May 1995, the Government of Uganda concluded negotiations with the European Investment Bank (EIB) for a loan of Euros 15 million to introduce a new term-lending scheme known as The EIB-Uganda Apex Private Sector Scheme. The scheme had three phases. Apex I was financed by a loan of Euros 15 million, it disbursed 35 loans from 1995 and was exhausted in 1997. Upon renewal, Apex II was based on a higher capital base (loan) of Euros 25 million and disbursed 45 loans between 1997 (part) and 2001. In December 2001, the Apex line of credit was replenished with Euros 40 million. The overall objective of this scheme was to:
“offer long-term credit for establishment and financing of small and medium-sized private sector investments in productive activities which help to increase Uganda’s foreign exchange earnings or develop competitive enterprises serving
5%
7%
1%
4%
Machinery
& working
capital 11%
Machinery/
equipment
72%
Building & construction
Equipment, furniture, fixtures& books
Machinery & construction
Machinery & working capital
Machinery/Equipment
Working capital

144
the domestic market. These include new projects, or expansion, modernization, restructuring, diversification of existing activities, investments promoting en-ergy saving in industries and protection of the environment (pollution control)” (The EIB –Uganda Apex Private Sector Scheme brochure, BOU-DFD: 1)
Just like ITCRF, Apex schemes were managed by the Development Finance Depart-ment (DFD) at the Bank of Uganda (BOU). Similar to ITCRF, interest rates under Apex I and II were based on a 12 month moving average of the 91-day Treasury bill rate. Under Apex III, changes in interest rate policy substantially changed the cost of loans, both for the participating banks and for the borrowers. Instead, of the moving average of the 91-day Treasury bill rate, the rate to participating banks was based on the weighted average of the time-deposit rate for the top 5 commercial banks over the previous 12 months. This came to about 4 per cent per annum down from 7-13 per cent charged to banks under ITCRF. Under Apex I, specifying smallest loan size as Euros 50,000 eliminated many small sized firms from using the scheme. Conse-quently, it was lowered to 10,000 Euros under Apex II only to be raised again to 50,000 Euros under Phase III. This had to do with the difficulties participating banks still faced in coping with the cost and risk associated with making loans to small bor-rowers. The Apex scheme differed from ITCRF in several other ways. While ITCRF was a refinance facility, EIB Apex I was a direct financing facility. This direct mode of financing was said to have substantially reduced red tape. The maximum loan pe-riod for ITCRF loans was 7 years with no minimum period specified. Under EIB Apex, the minimum loan period was 5 years, while the maximum was 12 years. Both Apex I and II had a provision for equity financing. However, no effort was made to identify and build learning and innovative capacities of new and old actors in the field of equity financing. Consequently, only two participating intermediaries already familiar with venture capital operations attempted to invest equity in two firms. One of the firms went into receivership and the equity investment collapsed, leaving only one successful equity investment in a large firm with over 200 employees and annual sales of about Uganda Shillings 4.6 billion (over US $2 million). Not surprisingly therefore, Apex III dropped the idea of equity financing. Instead, it allowed block fi-nancing for small leases through a leasing company, a good example of the partner-ships needed to broaden the sphere and outreach of services in the financial system. Apex III also allowed health and education to be added to the previous list of eligible sectors notably agro industry, manufacturing, horticulture and flower growing, fishing and fish processing, mining and quarrying and tourism. Services related to these sec-tors were also eligible. However, eligible purposes of borrowing had to be tangible investments mostly in the form of machinery and equipment, again sticking to loan purposes that the banking system was already familiar with. Besides investment loans, lenders could also make working capital loans to cover professional services associated with investment activi-ties, for example.

145
Chart 3: Sector Allocation of Apex Funds
Source: Based on BOU- DFD data
Similar to what we saw with ITCRF, it was the larger firms that attracted the largest portion of Apex funds by value, mainly because they could pass the eligibility criteria set under the scheme. It is important to remember that the setting of such eligibility criteria tends to be guided by norms and practices under which banks have historically operated. By sector, Chart 3 shows that manufacturing had the greatest share of Apex funds, followed by services and food-processing (industrial).
6.3.4.3 Did the Introduction of Changes Improve the Financial System of Support?
In 2002, we conducted interviews across Uganda's credit markets to understand the nature of services available, changes introduced and the way these markets were or-ganized.
Contrary to our expectations, 80 per cent of the 15 lenders in this study reported that they had introduced new financial products. One MFI and two banks introduced the
0
5
10
15
20
25
30
Food
proc
essin
g
Floric
ulture
& H
orticu
lture
Hotel &
Safa
ri Lod
ge
Cotton
ginn
ng
Leath
er pro
cess
ing
Manufa
cturin
g
Service
s
Woo
dwork
s
Per
cent
age
Value of Apex Funds Number of Apex facilities

146
highest number of new products. We were interested in tracking who had benefited from the underlying learning process as new products were being introduced. Find-ings show that it was largely non-Ugandan directors working with Ugandan workers who introduced the new products. Short-term foreign consultants played an important role at least in 27 per cent of the cases. Involvement of Ugandans in the process of new product development tended to vary. Across 40 per cent of lenders, a large per-centage of Ugandans (76-100) were involved in the process of new product develop-ment but in another 40 per cent, involvement of Ugandans was limited, an indication of missed opportunities for learning and capability development. One of the banks that introduced the highest number of new products also reported the lowest percent-age of Ugandans involved in the design and development of the financial products. We were surprised by our findings with regard to the modification of existing prod-ucts. This was not because all the modifications introduced were equally good for the customers’ learning and innovation processes but because we had expected to find minimal changes within a historically conventional and not so creative financial sec-tor. An impressive 80 percent of the 15 lenders reported 1 to 4 alterations in products. One bank and one MFI reported over 4 modifications. Ugandan workers and non-Ugandan directors played a vital role in product modification and were assisted by short-term consultants – both Ugandan and non-Ugandan. Most lenders further reported that they had changed their risk-management strategies in the 90s, improved their Management Information System (MIS) and developed manuals for loan policies and procedures. Many of these changes were expected to increase the range and performance of financial services. Surprisingly, slightly over 50 per cent of lenders not only increased budgets towards search and product devel-opment, but also introduced formal clients’ needs assessment. Only 1-2 banks, 1 MFI and moneylenders in our sample seemed not to have made these changes. Loan size limits, repayment frequencies, borrowing cycle rules and loan terms (dura-tion of loan) were changed a number of times in 60-70 per cent of the cases while 73 per cent introduced changes in borrower eligibility criteria, loan processing time and renewal rules. As before, these improvements were missing in only one of the banks and moneylenders. Changes in interest rates, collateral requirement, screening and loan processing procedures were undertaken by an even higher proportion – 80 per cent of lenders. The most common reference for the improvements introduced was best-practice models (80 per cent of lenders) promoted by either the headquarter of-fice of the lender or by public agencies, notably donor-led projects. Interestingly, we found that the location of micro and small-sized firms in clusters made it easier for some of their lenders (such as some Micro Finance Organizations) to extend loan services, track product and other improvements, and to deliver advice. Due to the geographical concentration of these firms in one location, they often un-derstand and know each other's trade reasonably well and can therefore better guaran-tee each other's loans (in case of group-lending methodologies). They closely interact to exchange information even though other advantages often associated with cluster-ing might not emerge. This geographical proximity between firms makes it easier and cheaper for lenders to screen prospective borrowers and better deal with information asymmetry problems. It is cheaper because lenders incur less administrative costs and benefit from a general knowledge of operations within the cluster. On the other hand,
147
clustered micro and small sized firms find it easier to form cohesive and solid borrow-ing groups and use these as a channel for learning and technical assistance events. Groups formed by grain millers of the Gatsby Trust in Mbale, Uganda are a good ex-ample. Paradoxically, the sea change of adaptations introduced by lenders did not relax the major problems with Uganda's financial landscape at least as perceived by the firms included in our sample. The broader RPED data covering 300 firms from 9 different sectors in Uganda provides additional evidence. Only 10 per cent of the RPED firms reported that they wanted to borrow more at prevailing interest rates (credit con-strained). In our food-processing sample, only a few firms were attracted to the kind of loans available. Some simply kept away and relied, instead, on alternative financ-ing possibilities such as other lines of business, trade credits, and advance payments, sources that were useful for some investments but limiting in others. In other words, although lenders had introduced wide ranging improvements to their operations, the fundamental problem of unhealthy73 capital was not yet resolved. Importantly, the kind of interaction and mutually-beneficial partnerships necessary for bearing risks and costs associated with the delivery of more healthy capital had not yet emerged.
6.3.4.4 Learning from Missed Opportunities
An important opportunity for the emergence of an effective financial support system was missed when a decision was made to abandon the Technology Management Fund (TMF), a fund meant to accompany ITCRF funds.
“…The objective of TMF was to enhance the technological and management capabilities of Ugandan enterprises by facilitating payments in foreign exchange or such technical assistance rendered through Technology Management Con-tracts (TMC). At the time of project design, the Fund was thought necessary be-cause of the scarcity of foreign exchange…Over the reporting period, the for-eign exchange market had been liberalized and there was therefore no great need for this fund as originally planned. Access to foreign exchange is now possible to all entrepreneurs requiring it. This Fund was therefore not disbursed and was finally cancelled in January 1995. (MFEP- Public Enterprise Reform and Dives-titure Secretariat (PERDS), 1995, ‘Status of Enterprises Development Project (EDP): 22)
Totaling US $ 11.6 million, the fund was intended to finance access to technical assis-tance and technology by firms in Uganda. It was envisaged that TMF would be bene-ficial in three main areas. First, it would enhance the inflow of needed technology and management support by assuring prospective partners of adequate foreign exchange to finance management contracts. Second, it would enable firms to obtain access to a databank and thereby facilitate the search for suitable partners from abroad for TMC. Thirdly, it would resolve the problem of contract processing delays (The World Bank, Staff Appraisal Report 1991).
73 For firms with a potential to innovate, we defined unhealthy capital as that whose conditions often impede the flexibility to promptly seize opportunities and the ability to re-invest cash flow. In addition, such capital tends to pre-maturely eat into sales revenues and profit streams that would otherwise multiply to boost a firm's net worth. Healthy capital includes "patient" debt, "patient" equity or both. For a recent discussion of patient and impatient capital, see Fuller, Akinwande and Sodini (2003)

148
Rather than doing away with the TMF after the foreign exchange regime had im-proved, the charge is that given its overall objective to enhance the technological and management capabilities of Ugandan enterprises, this fund should have been contin-ued under a new mandate focusing on technical and management capability develop-ment. Its cancellation, therefore, provides one more example of the problematic as-sumptions that continue to feed developing country policy. No one would doubt the need to improve the technology and management capabilities of most private sector firms in Uganda and therefore the important role that the TMF would have played. But, the assumption that the supply of foreign exchange for Technology and Man-agement Contracts (TMC) was the only obstacle to improved capabilities had no foundation in reality and seems to have been a misconception for a number of reasons. First, an abundant body of literature emphasizes the need for assiduous efforts, by the firms themselves, to assimilate and translate externally generated knowledge as part of the process of accumulating the local knowledge and competences required for de-velopment. This literature also identifies not one but a set of intervening factors that impede this process especially within developing countries comparable to Uganda. Therefore, unobstructed payment of foreign currency to foreign experts was indeed necessary and important. But it is difficult to see how a much improved and liberal-ized foreign exchange regime could, by itself, resolve the problem of knowing how and where to search and identify relevant sources of knowledge let alone how to ac-cess the tacit elements of the knowledge. It is also difficult to see how a much relaxed foreign exchange regime, without parallel local efforts, would have resolved the non-pecuniary institutional-related obstacles that often inhibit the development of interac-tive links with local and foreign universities, with research institutes, buyers and sup-pliers, and with competitors and other actors of relevance to local capacity enhance-ment. The building of local capacities in Uganda would certainly require much more than a liberalized foreign exchange environment and a reconfigured TMF could have made an important contribution in this direction. Ironically, the progress made with making foreign exchange more accessible also had a crippling effect on the objective to build local capacity. The very support structure that could have served to build ‘collective capacity’ of a ‘systems of actors’ was terminated.74 In consequence, an on-going support system to accompany ITCRF resources was conspicuously absent. New opportunities presented by Apex I, II and III still assumed away the need for a complementary on-going support structure for the borrowers. Instead, the only capac-ity-enhancing structure created under these Apex schemes was through a private con-sulting firm exclusively appointed to enhance the implementation capacity of both the central bank and the commercial banks affiliated to the project. Designated as a Pro-ject Monitoring Unit (PMU), the main function of this firm was to work with “partici-pating banks and borrowers to ensure that terms and conditions of the scheme are met as smoothly as possible” (Deloitte & Touche Tohmatsu, 1999:24). In addition to ar-ranging refresher-training courses for banks in appraisal, credit risk management and monitoring, the PMU took over most of the responsibilities of the Development Fi-nance Division at the central bank, particularly the function of screening loan dossiers submitted by the affiliated commercial banks. However, the support system of which PMU was a part, was simply too inadequate to support learning and innovation activi-ties. It was unable to promote the process of institutional learning and adaptation by
74 For a discussion of the notion of ‘capacity development in a systems sense’, see Hall and Sulaiman (2002)

149
forging the kind of linkages and useful interactions across the financial system such as those previously discussed in Chapter 2 and in addition, failed to stimulate the emer-gence of a parallel and dynamic on-going support structure (outside the financial sys-tem) required to build a collective capacity of firms and other actors to learn and in-novate. What we learn from this is that in the case of countries comparable to Uganda, much as the introduction of improvements at the level of the individual lender is crucial for the emergence of an effective financial support system, what is needed is a collective capacity75 that enables the financial system to deliver the finance with which to under-take relevant learning and innovation activities. One way of building such capacity is to recognize that the stimulation of changes in the ‘institutions’ that govern the modus operandi of financial intermediaries is as important as the pecuniary long-term lending resources that these intermediaries still need76 in order to provide the finance with which to undertake innovation activities. Lenders will have to evolve the right institu-tional climate for developing risk and cost-sharing relationships. This will necessitate new forms of partnerships previously assumed impossible, difficult or distant, and whose actual configuration is difficult to prescribe. New forms of relationships be-tween lenders and firms through their business associations and an enabling ‘institu-tional’ context will also have to be built. In addition, and especially in the case of technologically-lagging countries such as Uganda, a parallel and dynamic on-going support structure (outside the financial system) would be required to build a collective capacity of firms and other actors to innovate. It should be noted that the development of interactive links across banks or between bank and non-bank financial intermediar-ies, and between these and other actors in the system is not a new idea. Much could be learnt from the review we read in Bhatt (1995), of possible linkages and in-built in-centives modeled and adapted around Japan’s pre-industrial banking system. There, lenders learnt to share risk and minimize cost by arranging syndicated loans. Sharing information on borrowers and delegated monitoring were also key aspects of the sys-tem. Notably, syndicated loan arrangements, albeit of a different form, are not new to banks in Uganda.77 What is relatively new is that such arrangements would now have to be undertaken and modified within a much more private rather than state-owned banking industry. In sum, the present study found that the institutions governing the financial services provided by and, through Uganda’s banking system had improved but only minimally relative to the learning and innovation requirements of firms.
6.4 Summing up
Prior to its transformation in the period 1997-2000, Uganda’s Nile Perch fisheries sys-tem of innovation was in a pitiful state and it was the impact of the fish export crisis following the enforcement of SPS imposed by the EU that galvanized actors to intro-duce change. The main impulse for change was provided by the introduction of ‘hard’ institutions in export markets. Crucially, we found that a spontaneous response to new
75 In terms of cooperative relationships to share risk and costs associated with information asymmetry. Examples of such cooperative relationships and shared capacities (e.g. Japan’s immediate post-war main-bank arrangement, Taiwan’s credit layering model and others) were provided in chapter 2. 76 At least until savings deposits of a long-term nature are sufficiently available to permit banks to in-termediate own deposits into long term loans 77 In the 80s, some banks were involved in successful syndicated loan arrangements with the now de-funct crop-marketing boards (Brownbridge and Harvey, 1998).

150
standards set by demanding markets resulted in stronger flows of knowledge and in-ter-relationships which permitted the Nile Perch fisheries system to undertake learn-ing and innovation activities critical to the ability of firms to re-enter the more remu-nerative EU fish export market. In addition, the industry possessed a number of the factors previously identified as important for learning and innovation activities (chap-ters 4 and 5) such as the benefits associated with large firm size, orientation to institu-tionally-augmented markets, a heavier concentration of the higher educated workers and a more suitable financial gearing position. The emergence of stronger flows and inter-relationships was among the important factors present for learning and innova-tion activities to occur mainly because it created a better fit between an improved knowledge accessibility system and the competences necessary for a positive learning and innovation outcome. We did find, however, an uneven emergence of improved flows of knowledge and inter-relationships across the key subsystems. While the ac-tors within the firm-level subsystem and that dealing with knowledge accessibility and technical support learnt to change their old practices, interacted better and became more responsive to the needs of industry, the banking subsystem did not learn and change to the same degree especially in relation to what might have been done to en-hance the learning and innovation process across the Nile Perch fish processing indus-try. The key point is that because learning and innovation was not taking place equally in each of the key subsystems, the fit between these subsystems improved but was weaker than would be the case if all the key subsystems were to have positively rein-forced the learning and innovation process. Needless to say, sustaining the momentum of learning within the key subsystems where more effective learning processes occurred, might be another matter altogether. The industry will have to address major gaps in competences. Specifically, interven-tions promoting the diffusion and adoption of knowledge(s) will have to be balanced by other interventions promoting new competences to generate and apply new knowl-edge. It will have to cement better linkages between the knowledge generation sector, industry and policy if it is to sustain itself and grow. Importantly, the industry will have to address the difficulties associated with the continuing problem of fish supplies particularly the danger of over-fishing, the use of self-damaging fishing practices (Kaelin, Cowx, 2002) and the need for an enhanced fish farming program to meet both the domestic and export needs. Many of these weaknesses can be attributed to learn-ing and innovation difficulties and cannot be resolved through subsystem structures and policies that fail to reinforce each other.
151
Chapter 7 Other Food-Processing Systems of
Innovation in Uganda: A comparative assessment
7.1 Introduction
This chapter compares and contrasts other food-processing systems of innovation in Uganda with that of the Nile Perch fisheries system of innovation. Five food-processing industries (sector-based systems) in Uganda constitute our control group and the main difference between the Nile Perch fisheries and the control group lies in the nature of markets. Even though some of the control group firms exported their products, they generally dealt with domestic and export markets where SPS and prod-uct related standards were either unavailable or not strictly policed. Hence, while we identified the Nile Perch fisheries system ‘with’ institutionally augmented markets, the control group industries discussed here are identified as systems ‘without’ institu-tionally-augmented markets. In chapter 4, it was already established that the intensity of innovation activities (INNOVA) was higher across the Nile Perch fish processing sector than the other food-processing sectors comprising the food dataset. This raises the question of what was present across the Nile Perch fisheries system and absent across the sector-based systems constituting the control group. In this chapter we try to probe this further by examining the differences in the system set-up. In conducting this comparative assessment, our goal is to identify what knowledge flows, inter-relationships, factors and dynamics were present and absent and the effect this might have had on the intensity of innovation activities within the sectors constituting the control group. For each of the five sector-based systems in the control group, we con-centrate on the same subsystems and factors as with the Nile Perch fisheries system:
• The firm-level subsystem
• The subsystem mediating institutions in markets and associated policies
• The subsystem promoting knowledge generation, accessibility, learning and associated policies
• Sector-based policies and practices
• The Bank and NBFI subsystem

152
As with the analysis of the Nile Perch fisheries system, the discussion of the firm-level subsystem within the sectors constituting the control group shall take into ac-count the following factors:
• Size
• Ownership/ethnicity & institutions
• Institutionally augmented market orientation
• Education & training [workers]
• Technical assistance received
• Financial gearing position
We begin by elaborating the scope and intensity of learning and innovation activities introduced by the control group industries. This is followed by a comparative exami-nation of firm-level characteristics after which we explore the conduct and character of the above named subsystems. The last section provides a synthesis and highlights the main observable differences between the Nile Perch fisheries system and other food-processing systems.
7.2 Learning and Innovation Activities Introduced by the Control Group
We previously mentioned that besides the fish-processing sector, we collected firm-level data and industry-level information from five (5) other food-processing sectors in Uganda. These five constitute our control group and include meat processing, fruit-processing, grain milling, bakeries and the fish by-products processing sector. These and the fish-processing sector together constitute our food-processing dataset which was introduced and discussed in chapters 3 and 4. A descriptive analysis of the food dataset was also provided in chapter 4. What follows is an overview of the learning and innovation processes observed across the five sectors within the control group.
7.2.1 Product - related Improvements
The introduction of product-related change was not widespread but many of the firms in the control group were not stagnant. There were on-going incremental changes al-though the contribution of these activities to Uganda’s economy was not as significant as that made by the Nile Perch fisheries system. Meat, fruit and bakery-processing firms reported the highest number of product-related changes. Processed meat products were new to the firms engaged in their pro-duction and new to the local market even though processing technologies used were not new to the world. However, processed meat products were still a replica of foreign meat products, yet to be adapted to local taste and inputs.

153
Courtesy: P. Hautzinger, Uganda Meat Technology Center (2002)
Some fruit-processing firms attempted to adapt internationally diffused technologies to local inputs while others merely prepared drinks out of imported fruit concentrates. Product differentiation and improvements in product presentation were commonly pursued by the fruit-processing and bakery firms to maintain or gain market share given the intense domestic competition especially in the expanding market for bread and pastries.
Product-related change in the grain-milling system mostly took the form of different grades of milled flour. In addition, the more dynamic firms introduced a number of variations in the way the flour was packed (one kilogram pack, five kilogram pack, ten kilogram pack et al). However, it was only a few grain-milling firms that intro-duced such change. The main reason mentioned by more than 40 per cent of grain millers for not introducing improvements was that there was no need for product re-lated change given that products met market requirements. The control group systems introduced product-related improvements as part of their routine factory-floor operations and certainly not through formal R&D, licensing or payment of royalty fees. This was the case in 67 per cent of meat-processing firms, 50 per cent of fruit-processing firms, 16 per cent of grain-milling firms and 57 per cent of bakery firms. Through its resident German technical advisor, the meat technology center provided vital knowledge inputs to some meat processing firms while foreign suppliers and a local private consulting firm were important sources of information and knowledge within the bakery system. The fruit-processing system was perhaps the most constrained with very few sources of information and knowledge bases nec-essary for product-related improvements.
7.2.2 Process and Organizational Related Improvements
The sector-based systems included in our control group rarely introduced new proc-esses. Instead, they made a few modifications. 'No one demanded for change' was the

154
most frequent reason reported for the failure to introduce new techniques especially among meat-processing and grain-milling firms. Inadequate knowledge ranked sec-ond. There were however a few examples of process modification such as redesigning product labels and packaging to alter product presentation, changes in the procedure for preparation to lengthen shelf life, changes in inputs to obtain a product with a dif-ferent taste, changes in factory floor handling to minimize product loss and changes from unsealed to sealed bottle-capping. Just as with the product-related improve-ments, sources of knowledge for modified processes were several and they varied from industry to industry but were largely non-formal.
Given the weak domestic capability to fabricate steel-grade equipment required of food-processing plants, a key problem especially among the smaller firms was the in-ability to import appropriate equipment or to obtain leased equipment. A possibility existed to purchase equipment in used-condition from the domestic scene but this re-quired lump sum resources difficult to obtain. Many firms in the control group also mentioned problems with the identification, selection and installation of the right equipment especially those with which local technicians and repairers were familiar. Overall, acquisition of basic equipment was vital to the operations of firms in the con-trol group and where the right information and knowledge inputs were available, the acquisition of basic equipment separated firms able to diversify the range of products from those that could not. These firms were also better at ensuring consistency in product quality.
However, once equipment was acquired, modifying its structural characteristics was not easy. Some parts and accessories could be fabricated locally but actual modifica-tion of imported equipment was uncommon. To explain this, respondents gave a number of reasons. First, modifications were not deemed necessary when equipment was working well. In other words, they did not seem to be aware that well-functioning equipment was alterable so as to enhance its performance. Secondly, information and knowledge about the nature of possible modifications was largely unavailable. The third reason which is related to the second was the absence of local technicians to fix and alter such imported equipment properly. Overall, the intensity of process-related improvements was much lower among the control group industries than that observed across the Nile Perch fish-processing industry. Similarly, the intensity of improvements in organization and procurement was far lower. With the exception of grain-milling firms and some bakery firms, many firms acquired computers but used them mostly for accounts and word processing. Com-puter-based tracking of productivity and efficiency were rarely undertaken with the exception of a few meat-processing firms.
7.3 The Control Group Firm-Level Subsystem: A Descriptive Overview
Here, the focus is upon those factors that we previously identified as important for learning and innovation processes. They include size, the nature of markets, workers education, technical assistance received, financial gearing and ownership in terms of ethnicity. In this section, what we provide is merely a descriptive overview of the data and our interest is to identify the key differences in the characteristics between firms within the control group and those of the Nile Perch fisheries.

155
7.3.1 Firm size
On average, the four control group sectors were dominated by micro, small and me-dium-sized firms. Of the five, fruit and bakery processing firms had the highest num-ber of workers while grain milling firms had the least as we can see in Table 21.
Table 21: Average Firm Size
Sectors
[N=57]
Market ori-
entation
Total Work-
ers in 2001
(mean)
Casual work-
ers – 2001
(mean)
Male
workers – 2001
(mean)
Female
workers –
2001 (mean)
Meat-processing Domestic 25 4 22 5
Fruit- processing
Domestic 51 38 15 21
Grain-processing Domestic 15 4 8 6
Bakery-processing Domestic 48 27 26 12
Fish-processing Export 261 143 213 72
Other food-processing (fish by-products)
Export 207 n.a. 77 130
Source: Author’s field survey (2000)
7.3.2 Ownership Structure
Even though 77 per cent of all 57 firms were fully owned by indigenous Ugandans, there were important differences to be noted. Across the fish-processing sector, only 2 out of 9 firms were owned by indigenous Ugandans. The remainder was either owned by Ugandans of Indian origin or non-Ugandans. In contrast, our control group had a heavier concentration of indigenous Ugandan ownership. Only 7 per cent of firms (4 firms out of 57) were subsidiaries of foreign firms and three of the four subsidiaries were located in the fish-processing sector while the fourth belonged to the fruit-processing sector. At this foreign fruit-processing firm, an indigenous Ugandan co-owned the firm with an Italian majority of shareholders but overall, joint ventures be-tween Ugandans and foreigners were limited, accounting for only 7 per cent of all the firms in the sample.

156
Table 22: Female Ownership of Food-processing Firms
Female
ownership
Fish
Proc.
[# of
firms]
Meat
Proc.
[# of
firms]
Fruit
Proc.
[# of
firms]
Grain
Proc.
[# of
firms]
Bakeries
[# of
firms]
Fish By-
products
Proc.
[# of
firms]
Total
Percent
None
6 2 1 13 1 0 23 49.68
1-25 per cent
3 0 3 3 3 1 13 15.83
26-50 per cent
0 3 1 1 3 1 9 8.75
51-75 per cent
0 0 1 0 0 0 1 0.05
76-99 per cent
0 0 1 0 0 0 1 0.05
100 per cent
0 1 1 7 0 0 9 25.73
Total
9 6 8 24 7 2 56 100.00
Source: Author’s field survey (2002)
We can also see from Table 22 that industrial food-processing firms were dominated by male owners. Female owned firms were generally smaller in size (number of workers employed) and were more concentrated in the less dynamic78 grain milling sub-sector.
7.3.3 The Nature of Markets
One of the main differences between the Nile Perch fisheries system and the sector-based systems included in the control group is the nature of the markets. For instance, bulk buyers such as hotels and restauran``ts were an important market segment ac-counting for over 50 percent of processed-meat sales (Table 23). Although firms had to meet the specific requirements of these bulk buyers such as regular and prompt de-liveries, these buyers were less demanding than their overseas counterparts within the EU.
78 in terms of the intensity of learning and innovative activities

157
Table 23: Proportion of Sales to Various Markets
Destination of Sales Meat-
processing
Fruit-
processing
Grain-
processing
Bakery-
process-
ing
Other food-
processing
(fish by-
products)
Domestic sales 26-50% 76-99% 76-99% 76-99% none
Sales in bulk to public and private bodies (hospitals, schools, police, World Food Programme et al)
51-75% Under 25% Under 25% Under 25%
none
Sales overseas none none none none 100%
Source: Author’s field survey (2002)
In the fruit-processing sector, the two largest fruit-processing firms included in the study had a wide distribution system (within the country) and bulk buyers such as ho-tels, schools and restaurants accounted for over 75 per cent of sales at least in 30 per cent of the fruit-processing firms. However, both the bulk and retail buyers of fruit juices in the domestic market had far fewer demands than would be the case if fruit-juices were exported to more sophisticated markets overseas.
Within the grain milling system, bulk buyers were not a common destination for sales. One of the main reasons for the unpopularity of domestic bulk buyers was that bulk purchases were often not made on a cash basis. Given the small working-capital base of many grain milling firms, they preferred to deal with ordinary buyers who offered prompt cash payments mainly because locked-up working capital made it difficult for grain-millers to meet the demands of their suppliers for cash payment. Farmers and their agents preferred prompt cash payment for the grain supplied and given seasonal crop shortages, it was important to maintain a responsive relationship with one's sup-plier. Only a few grain milling firms with adequate working capital dealt with the do-mestic bulk-buyer market segment and even where bulk buyers were involved, the demands (if any) placed on grain millers were of the ‘soft’ type.
Historically, the bakery system has always had a wide range of different size bakeries serving the domestic market. State-owned industrial bakeries were the largest until the 90s when private industrial bakeries emerged. Initially dominated by 2-3 private in-dustrial firms such as Hot loaf and FADCA at least in the Kampala area, many more emerged and began to open up promotional outlets in key strategic locations to facili-tate direct interaction with their customers. As with the fruit-juice marketing system, baked products were supplied to grocery and other retail stores. Similarly, bulk buyers such as hotels, fast-food outlets and hospitals were important given the relatively few regular consumers79of bread and confectionery products in the country. However, the domestic market for bread and pastry products was still small and largely undemand-ing.
79 In Uganda, bread happens not to be an essential food item in the local diet(s) and its consumption is more common and regular among the urban and semi-urban non-poor

158
7.3.4 Experience
Firms dealing in fish-related exports were on average older and would therefore be expected to have accumulated more tacit knowledge and to have generally learnt more from a longer history of operations. Table 24: Age of firms in the Control Group
(1)
Sub-sectors
(3)
Mean age (years)
(4)
Standard deviation
Meat-processing 7 6.4
Fruit-processing 8.1 5.3
Grain-processing 5 4.8
Bakeries 9.6 6.2
Fish-processing 10.1 2.2
Fish by-products processing 13.5 2.1
Source: Author’s field survey (2002)
The data in Table 24 show that meat and fruit-processing firms and industrial bakeries were relatively young. Given that grain milling is an old vocation in Uganda, the av-erage firm-age of 5 years indicated in the table is partly a reflection of the high mor-tality rate of micro-sized firms which dominate this sector.
7.3.5 Education Level of Workers
As a traditional industry, food-processing has always been associated with less skill-intensity compared with high-tech sectors. However our findings in Uganda indicate that this situation is changing especially where higher-level technology is employed and a higher quality product is demanded and where this is the case, a highly educated workforce can be advantageous in many respects. As discussed in chapter 2, educa-tion contributes to the capacity to absorb knowledge which makes them more train-able education and formal A-level diplomas were also more concentrated in these ex-porting sectors. Only a few other firms particularly in the meat and fruit-processing sectors had workers with university education and A-level diplomas. Fish processing firms still reported the largest proportion of workers with formal technical education certificates obtained from the Fisheries Training Institute at Entebbe, Uganda. A few fruit-processing firms had workers with formal technical education in food technology obtained from Kyambogo Polytechnic. However, interviews indicated that for some critical production-oriented positions requiring higher formal education, firms gener-ally preferred polytechnic graduates to university graduates (in food science technol-ogy) as the latter tended to be less prepared for factory-floor operations. Generally, formal technical institutes and vocational education centers in Uganda turned out ei-ther too few graduates or graduates in subject matter other than industrial food-processing and a limited number of personnel with the skills to conduct repairs and maintenance. In terms of skill intensity and who provided and learnt what skills, many tasks in the fish and meat-processing sectors, and to a lesser extent fruit-processing, were consid-

159
ered ‘high’ and ‘medium’ skill functions (from the firms’ perspective). Most functions in grain-processing were low-skill. Across all the 5 food-processing sectors, women were found to be disproportionately represented in low-skill tasks especially among fruit-processing firms. Men accounted for a large part of the low-skill workforce in the fish-processing sector because these fish processing plants employed a relatively larger number of male workers to begin with. In sum, the descriptive review of the food-processing dataset indicates that in many ways, fish processing firms differed from other food-processing firms but there were also a number of similarities. We shall return to these later. Let us now turn to the anatomy of the following key subsystems: the subsystem promoting knowledge gen-eration, accessibility, learning and technical assistance; sector based policies and prac-tices; the subsystem concerned with the mediation of markets and, the practices of the banking and NBFI subsystem in relation to the specific characteristics of the control group.
7.4 The Subsystem Promoting Knowledge Generation, Accessibility and Learning
Public support and coordination was more intense within the Nile Perch fisheries sys-tem (Table 25) and as we saw previously, public agencies did not leave the upgrading effort to private-sector players alone. Through their business association, fish process-ing and exporting firms learnt to compete and cooperate simultaneously. They collec-tively agreed to drop past bad practices by jointly developing a code of good manu-facturing practices. This effort was closely guided and supported by public agencies. The association also approached a public agency in Brussels for knowledge inputs. In response, the agency (CDI in Brussels) absorbed a large part of the costs related to the identification and dispatch of private firms and experts who provided industry-wide training and assistance to the exporters in Uganda. Importantly, UNIDO's Uganda In-tegrated Programme (UIP), another public agency did not replace private-sector agents in its remit to coordinate technical assistance. Instead, it searched and assisted to select private providers of needed knowledge inputs.

160
Table 25: Interaction and Source of Learning across all Food-processing Sector-based Systems
Interaction and learn-
ing channels
Fish-
processing
Meat-
processing
Fruit-
processing
Grain-
processing
Bakery-
processing
Fish by-
products
Proc.
No. of sources outside Uganda that gave tech-nical expertise (reported by largest # of firms)
2-3 none 1 none none 4-5
No. of sources inside Uganda that gave tech-nical expertise (reported by largest # of firms)
2 -3 1 1 none 1 2-3
No. of actors ap-proached for technical advice and information (interaction) (reported by largest # of firms)
2 -3 1 2 -3 none 2 -3 2-3
No. of training events sponsored by firm in-house (reported by larg-est # of firms)
more than 5
1-2 3-4 none none more than 5
Percentage of workers and management trained in-house (re-ported by largest # of firms)
86-100% 66-85% 46-65% none 26-45% 86-100%
Percentage of workers and management trained in short external courses (reported by largest # of firms)
6-25% none none none 1-5 %
none
Percentage of workers and management trained externally at firm expense (reported by largest # of firms)
1-5% 1-5% none none 1-5% none
Percentage of workers and management trained by buyers (re-ported by largest # of firms)
none none none none none 1-5%
Percentage of workers and management trained by suppliers (reported by largest # of firms)
none none none none 46-65% none
Percentage of firms whose directors had prior experience in sub-sector processing opera-tions
22% 25% 14% none 33% none
Source: Author’s field survey (2002)
161
It served as a non-market coordinating mechanism, stepping in to perform functions that private agents could not independently achieve such as enabling industry-wide access to the same information, knowledge and crucially, its correct application. In addition, UNIDO UIP coordinated the search for industry-wide solutions and met the costs of accessing knowledge previously unavailable to the industry in addition to en-hancing the capabilities of public and private laboratories and, the government’s fish inspection service. It is therefore not surprising that among all the 5 food-processing sub-sectors studied, internal learning efforts to apply the knowledge made available were much more intense across the Nile Perch fisheries system. Fish processing and exporting firms arranged more in-house training activities and together with the ex-porters of fish-by products, these were the only sectors where buyers provided direct support to their producers. The key point is that both public and private efforts are important elements of an ef-fective knowledge distribution and learning system. In the case of the Nile Perch fish-eries system, both complemented each other and were critical to the ability of the sys-tem to undertake learning and innovation activities. The knowledge distribution and learning subsystem for the systems in our control group was not as effective. First of all, intermediaries were fewer. Secondly, coordi-nating mechanisms for the search of relevant knowledge inputs and its accessibility were either absent or weaker. The third observation, which is related to the first and second, is that the public sector was much less involved in the creation of a knowl-edge distribution and learning system across the systems in the control group and, the kind of complementary approach we observed in respect to the Nile Perch fisheries system was largely absent across the control group. Consequently, formal learning efforts were generally less intense, partly because fewer knowledge inputs were avail-able and accessible. Moreover, the kind of pressure and dynamics that provided the impulse for more training activities, for greater interaction, for the application of knowledge(s) new to the firm, was missing. In Table 25, we can see that the intensity of training activities, and the proportion of workers trained was far lower across the systems in the control group. Learning by interacting was relatively greater across the meat and fruit-processing systems than the bakery system. This is because processed meat products and fruit juices require a relatively higher level of technology and hence more scientific knowledge inputs than bakeries80. In other words, the greater levels of interaction by meat and fruit processors reflect a more intensive search for information and scientific knowledge inputs related to preservation, packing, food safety issues in the handling and marketing of fresh food products as well as labeling and sealing technologies in the case of fruit juices. Within the meat processing system, the source of learning for 4 out of the 6 firms studied was a public sector project supported by a number of partners (FAO, CFC, GTZ/CIM and the government of Uganda). In the early 90s and with support from the Peoples Republic of China, the government set up the Uganda Industrial Research In-stitute (UIRI) under the Department of Industry and Technology within the Ministry of Tourism, Trade and Industry. UIRI started its activities late 1997 with the estab-lishment of a pilot meat-processing plant later named the Uganda Meat Technology Center (UMTC). The latter was set up under the auspices of the FAO-CFC-
80 In many ways, the baking sector can be considered to be a typical low-skill traditional sector

162
GTZ/CIM-GOU81 regional project on "development and promotion of value-added meat products in sub-Saharan Africa"(UIRI brochure). The plant had two wings. The first was commercial and was operated by a private firm using leased industrial meat-processing equipment procured under the project. The second wing was operated as a training facility in modern meat-processing targeting other meat processing firms and food technology students from higher institutions of learning. The training facility was operated by the staff of the Uganda Meat Technology Center/UIRI. Meat prod-ucts were sold on the domestic scene mostly to hotels and restaurants. Expatriates and middle income families accounted for the rest of the sales but this segment constituted only a tiny, though growing section of Uganda's population. Although the FAO-CFC-GTZ/CIM-GOU project did not support all firms, it boosted human resource development and helped to make modern meat-processing knowledge accessible to firms and students. Efforts were also made to diffuse this knowledge to village based group activities in some semi-urban and rural areas of Uganda. Specifi-cally, its resident German technical advisor together with the Ugandan assistants pro-vided vital technical assistance in a number of areas. These included tailor-made train-ing courses in meat-processing, product development and modification of recipes, trial production of new products, emergency assistance in case of machinery break-down, advice on selection of equipment and suppliers, advice on design of production lines, equipment installation and test runs of new equipment and machinery (UMTC project documents). However, while the achievements of the project were in no doubt significant, meat-processing firms were yet to produce processed meat products affordable to a larger section of the domestic market. Crucially, as with the Ivorian (Cote d’ Ivoire) and Tanzanian firms studied by Mytelka(1992) and Wangwe (1992) respectively, the meat technology project focused on ‘reproducing’ meat products found in the grocery stores of the West through production processes heavily dependent on imported spices, additives, casing (to a large extent) and equipment. Little was done to adapt and innovate in products and processes that could reduce import intensity and there-fore, create more jobs. Parallel technical assistance and the kind of research partner-ships discussed in Hall, et al. (2001; 2003) could have been dedicated towards ex-perimentation with the production of local spices and additives, the demonstration of possibilities for equipment repairs and maintenance to local technicians, the demon-stration of possible modifications to imported equipment and so on. Furthermore, in-terviews with the various institutes within the food-processing sector did not generate any evidence to suggest that the FAO-CFC-GTZ/CIM-GOU project had forged close partnerships with other key actors in the food-processing sector such as the food sci-ence and research institute (FOSRI) or the Uganda National Council of Science and Technology (UNCST) and Makerere University. Although students from this Univer-sity’s department of food science and technology and the Kyambogo institute received internship training at the Uganda Meat Technology Center, many more linkages could have been nurtured to develop. For example, efforts could have been deployed to-wards the improvement of curricula at the food technology department of Makerere University based on feedback and activities at the Meat Technology Center. The Min-
81 Partners under this project were German Technical Co-operation (GTZ), Centre for International Migration and Development (CIM), Food and Agricultural Organization (FAO), Common Fund for Commodities (CFC) and, Government of Uganda (GOU). German Development Service (DED) later supported training activities
163
istry of Finance and Economic Planning, responsible for inter-ministry coordination, could have made efforts to promote flows of knowledge and feedback between the Ministry of Tourism, Trade and Industry and other relevant ministries and institutes in the food-processing arena probably through its UNCST or FOSRI. However, inter-views at all these institutes revealed that this role was not being performed. Fruit-processing firms received far less support. Not surprisingly, these firms men-tioned a number of common difficulties that would have been solved if an effective system of knowledge generation, accessibility and learning were available. These in-cluded erratic supplies of inputs, difficulties with equipment selection, installation, repairs and maintenance which underlines the importance of technical assistance to technologically lagging countries and firms such as those typically found in Uganda. Interviews indicated that acceptable food-grade equipment could not be fabricated locally although local technicians had attempted to fabricate accessories and tools for some of the fruit-processing firms included in the study. The lack of knowledge on product development and techniques of production (process) were additional prob-lems. Fruit processing firms did not have the privilege of easier access to knowledge inputs through public-led initiatives such as the Meat Technology Center. The firms interviewed did not belong to any business association. They relied on scattered sources of information and knowledge in and outside Uganda which were often diffi-cult to access. The food science and technology department at Makerere University was found to have engaged in a variety of fruit product-development experiments, particularly jams and some fruit drinks but this was departmental-based research un-dertaken by individual lecturers/scientists and not necessarily an effort by the univer-sity to engage in fruit-related product-development research for industry application. One of these university scientists had privately developed and patented an alcoholic drink, "Omulondo", out of a local wild herb. Interestingly, the university scientists that had picked up interest in fruit product-development had also started to provide some limited technical guidance to at least one of the fruit-processing firms included in this study. However, we should hasten to add that no formal university-industry linkages were mentioned by key informants at the university in terms of commis-sioned research or on-going technical assistance to firms. Within the bakery system, the direction and nature of learning was conditioned by an increased level of competition in the bread and confectionery sub-sector. Although the bakery system was visibly less coordinated and organized than the Nile Perch fisher-ies system, the relatively more demanding domestic market faced by bakery firms clearly influenced the intensity of learning. In particular, bakeries sought knowledge inputs in order to broaden the range of baked products. They sought advice on the identification and selection of equipment, structuring of applications for leased equipment, advice on inputs and processes that could lengthen the shelf life of bread and confectionery products and strategies to cut costs. They closely interacted with their suppliers, particularly the Danish suppliers of yeast. Suppliers from Denmark were found to be a major source of the yeast used by local bakery firms and were an important source of learning within the bakeries system. These foreign suppliers ar-ranged technical assistance missions and promotion events in Uganda to demonstrate the 'superior' effects of their yeast products on product taste, shelf-life and cost, com-pared with yeast from other sources. This was facilitated by the emergence of the bak-ers' business association which served as a forum for solving common difficulties through the exchange of information and knowledge. Besides the business associa-

164
tion, another key actor that emerged was a local consultancy firm established by fresh university graduates to provide technical assistance related to bread and pastry prod-uct-development. One of the directors of this consultancy firm previously worked for a bakery firm in South Africa and had therefore accumulated some knowledge in bread and pastry products. In fact, the local consultancy firm not only served as a lo-cal agent marketing South African bakery equipment in Uganda, but also supported local firms with technical advice on equipment selection, installation, maintenance, plant layout and production organization. It also played a vital role in supporting bak-ery firms to structure applications for equipment leases from DFCU. Firms that set up business deals with the Danish suppliers were further assisted to diversify into new product lines. Besides yeast and equipment suppliers, no other suppliers closely inter-acted with bakery firms to introduce other improvements such as those related to the use of different varieties of flour. The grain milling system lagged behind all others in terms of learning efforts and support. With the exception of a few firms located in the Mbale grain milling cluster, in-house learning activities (formal) were negligible. Especially at the Kisenyi cluster, grain milling firms rarely interacted with formal providers of knowledge inputs for two possible reasons. First, the demand and need for new knowledge was simply not there as firms dealt in milled food staples on the domestic scene whose market was steady and largely undemanding. The second reason which is a consequence of the first and a largely plausible reason is that informal interactions tend to substitute for formal support at this low-tech end of the expectation. This finding is generally true in other contexts and countries. Overall, Table 25 indicates that the food-processing systems constituting our control group attracted very limited technical support from private and public intermediaries. Why was this so? Why would the private yeast suppliers in Denmark closely interact and guide the product upgrading process within Uganda’s bakeries whereas flour sup-pliers in Uganda or in neighboring Kenya interact with the bakeries only minimally? Why would private importers of fish fillet in Europe intensify interactions with their producer partners in Uganda’s Nile Perch fisheries system to develop new product lines while the local and foreign hotels or other buyers of meat processed products in Uganda rarely pursue such ideas and possibilities? These are some of the open-ended questions that we cannot adequately address within this volume but are certainly worth exploring in the future. Here, we shall only concentrate on one general observa-tion which is that the systems in our control group suffered from the flawed practice of delivering islands of support as opposed to integrated learning and innovation sys-tems. Let us clarify what we mean by this. In developing countries comparable to Uganda, one often finds a concentration of technical support and services to particular industries, or even parts of that industry. Similarly, it is not uncommon to find a concentration of services being provided to particular firm-size cohorts neglecting the inter-dependencies that frequently define the character of enterprise operations. For example, the creation of export-processing zones often creates islands of exporters rarely linked to local industry. The creation of technology diffusion projects at local research institutes might enhance learning and innovation activities within the meat-processing system but fail to build the innovative capability of industries producing its inputs. Therefore, even as current policy in Uganda continues to emphasize export-led growth and development, the point is that

165
exporting and import-competing industry are inter-dependent and therefore need to be developed in tandem. In the case of the 57 firms we studied across Uganda’s food-processing systems, it was only the export-oriented fish-processing sector that re-ceived significant technical assistance and within it, attempts had been made to sup-port all actors including boat builders, policy makers, regulators, the fishing group and many others as discussed previously. In contrast, existing providers of formal techni-cal support paid less attention to domestic-oriented sectors. More importantly, there was a tendency to provide knowledge inputs in a disconnected manner only to parts of a system instead of building inter-linked knowledge generation, accessibility and learning subsystems that would serve the entire sector-based system. The meat-processing system is a good example of a system that received partial support. Related to this was the tendency to expect that private sector providers would emerge to provide the required technical support and services and that those activities would coordinate themselves probably through market forces. As we have already empha-sized, and drawing from the experience of the Nile Perch fisheries system, private sec-tor players did not resolve their learning difficulties alone. We also noted that public and private efforts need not replace each other but should instead work to complement each other’s efforts in building effective knowledge accessibility and learning subsys-tems. Empirically, we found that where public agencies served as the main conduit for knowledge accessibility and learning such as the case of the meat processing system, results were good though minimal in the sense of multiplying jobs created and broad-ening markets. Besides, not all meat processing firms included in our small sample obtained access to available knowledge bases and services. Overall, there was an ab-sence of services to make knowledge accessible. Industry-wide training services of the type found in the Nile Perch fisheries system were absent. Moreover, across the latter, service providers designed learning inputs in a manner that responded to spe-cific demands from markets. Technical assistance was shaped by international rules and regulations set by public agencies in overseas markets. Providers of technical as-sistance (TA) therefore had explicit benchmarks and indicators upon which they could measure how much had been learnt and mastered. The overall indicator of TA effec-tiveness was compliance with the requirements of the market (the EU). Such guide-lines were missing across our control group. However, we should emphasize that these industry-wide public-led interventions only emerged in the aftermath of EU related demands and the subsequent actions taken by public and private actors to comply. The public-led interventions opened up new op-portunities for private providers to deliver services whose need was not felt before. We find that both factors, that is, demanding markets and intense public efforts there-fore have a significant role to play in the emergence and sustenance of an effective subsystem promoting knowledge generation, accessibility and learning.
7.5 The Subsystem Mediating Market Institutions across Systems in the Control
Group
We reviewed available food-related standards developed by the Uganda National Bu-reau of Standards (UNBS), the body legally mandated to develop and enforce compli-ance with quality requirements. Standards had been developed for processing opera-tions in the fish-processing, fruit processing and partly the grain milling sector. How-ever, it was only in respect to the fish-processing sector that all the vital standards for

166
processing fish were compulsory and strictly enforced. Ironically, milled grain is a main food provision for schools, hospitals, households and others in the country. Therefore, one might expect strict sanitary and quality standards to be in place to guard against potential health hazards. However, none of our respondent grain milling firms was familiar with standards for milled grain. None had ever been denied certifi-cation for failure to comply with national standards. In the fruits sector for example, standards related to ‘fruits, vegetables and derived products in general’ were likely to stimulate improvements in processes of production but these standards were stated as voluntary. Standards for non-alcoholic drinks and beverages all had compulsory legal status but unlike the fish-processing operations, there was no separate entity in Uganda designated to enforce compliance. Similarly, standards related to ‘cereals, pulses and derived products’ were either stated as compulsory but not enforced, vol-untary or there was no mention of their legal status. Besides standards developed spe-cifically for the branded meat product known as “luncheon meat”, we did not find any evidence that standards were available for the kind of products and processing opera-tions that the meat-processing and bakery firms in our sample were engaged in. What this tells us is that in contrast with the Nile Perch fisheries system, process standards were either unavailable or softly policed. Importantly, we observed that some of the industries such as fruit processing and bakeries experienced growing competition but such pressure was not aggressive enough to galvanize change in terms of more intense learning and innovation activities. No competition bureau existed within the country at the time we conducted this study. Importantly, additional pressure and support in the form of institutional and organizational dynamics as experienced within the Nile Perch fisheries system was simply absent across the control group.
7.6 Practices of the Bank and Non-Bank Financial Subsystem in relation to the
Characteristics of the Control Group
It was earlier determined that the financial gearing position82 of a firm significantly influenced the intensity of learning and innovation activities. The data available also indicate that fish processing firms had access to a wider range of financing sources than other food-processing firms included in the control group. Using data from the food-processing dataset, this section examines why the range of financing sources was wider and subsequently, why the financial gearing position of fish processing firms was more suitable for intense learning and innovation activities.
7.6.1 The Range of Available Financial Sources
The characteristics of the control group, particularly their relatively smaller size, im-posed limitations on the range of accessible financial intermediaries. For the smaller of these firms, the most common source of external finance was the non-bank finan-cial system. Let us briefly explore through two case studies how the ‘institutions’ in Uganda’s non-bank financial system have evolved and how well the improvements have matched the learning and innovation requirements of firms.
82 This was defined as the ratio of non-interest bearing finance to interest-bearing finance

167
Case 1: Lease Financing in Uganda
As a specialized financial service, the history of leasing is relatively short. It was first established in 1952 in The US, spread to Japan and Europe in the 60s and by 1998, leasing had been established in over 85 countries, including over 50 developing coun-tries (MFPED, Deregulation Project/ USAID SPEED, 2002: 7). There are two forms of leasing; finance leasing and operating leases. With finance leasing, the lessee iden-tifies and chooses equipment. It is then bought by a lessor and used by the lessee for a significant period of its useful life in exchange for lease rentals. That is, one party uses an asset (lessee) owned by the other (lessor) in exchange for specified rental payments during the lease period. Assets typically leased include various types of plant and machinery, vehicles and any other equipment used for industrial, commer-cial and agricultural purposes. In an operating lease contract, lessees can only make short-term use of equipment the leasing company has at hand. A typical example is car rentals.

168
Table 26: Sector allocation of DFCU Leasing transactions: 1995 – 2002(September)
Leases -Value in
Uganda Shillings
Number of
leases
Average size of
leases (U Shs)
4 w/d vehicles 457,407,816 16 28,587,989
Agricultural 535,914,283 4 133,978,571
Agro-processing 1,013,605,402 14 72,400,386
Bakery 369,374,509 10 36,937,451
Buses & coaches 11,830,222,094 73 162,057,837
Cars 1,285,050,468 91 14,121,434
Communication 278,954,269 11 25,359,479
Construction 1,850,553,194 18 102,808,511
Dairy 1,531,860,547 17 90,109,444
Forestry & timber 802,374,133 12 66,864,511
Forklift trucks 18,648,814 1 18,648,814
Fuel tankers 409,536,996 10 40,953,700
Heavy trucks & trailers 12,308,184,124 82 150,099,806
Light trucks 5,106,288,461 172 29,687,724
Manufacturing 526,998,942 8 65,874,868
Medical 516,162,386 14 36,868,742
Mining 572,770,468 1 572,770,468
Miscellaneous 375,933,479 10 37,593,348
None 12,986,540 1 12,986,540
Office / computer 241,594,913 6 40,265,819
Printing 3,574,543,700 29 123,260,128
Textile 37,812,809 1 37,812,809
Tractors 436,815,410 11 39,710,492
Total 44,093,593,756 612
Source: Based on DFCU Leasing records; Note: 2002 data only covers January - 30 September 2002; Here, we use the term ‘value’ in the place of ‘cost’ of equipment used by DFCU leasing in its records
In Uganda, leasing was introduced at the end of 1994, with the establishment of the Uganda Leasing Company Limited owned by several local and international devel-opment and financial organizations. Faced with the prevailing difficulties in the legis-lative framework particularly in respect of the Investment Code, Value Added Tax Act and Finance Act of 1997, this leasing company was only able to establish itself at the end of 1997. In 1999, the company’s merger with its principal shareholder,

169
DFCU83 expanded the scale and scope of lease financing in Uganda. A review of DFCU leasing data showed that 41 leasing transactions were made prior to 1999 com-pared with a total of 571 leasing transactions between 1999 and 2002 (as of Septem-ber) and our fieldwork confirmed that by the end of 2002, DFCU leasing was still the single most important player in Uganda’s leasing industry. A number of substantial changes have been introduced since. They include the Small Lease Purchase Pro-gramme (SLPP) with support from DFID, the British international development agency; the risk-sharing scheme ‘for small leases’ supported by a guarantee facility facilitated by both the DFID and the American development agency via USAID SPEED and, at the initiative of the DFCU Leasing General Manager, a group-based micro leasing scheme focused on bee-keeping and collective honey marketing among rural based communities84. Table 26 indicates that DFCU leasing had made 612 finance leases by the time of our visit (30 September 2002). We can also see from this data a concentration of leases (Chart 5) towards the acquisition of vehicles (various types). Out of 612 leasing trans-actions, 172 were for light trucks. The second largest number of leases went to cars while heavy trucks and trailers, buses and coaches came third and fourth respectively. Of a total of 612 leasing transactions, 62 per cent were of an amount below Uganda Shillings 50 million85 (about US $ 26,000 in 2002) of which only 90 leases (15 per cent) were of an amount below Uganda Shillings 10 million (about US $ 5,300 in 2002). Thus, while 62 per cent of the total leases went to the 50 million lease-size co-hort, it was the relatively larger firms within that cohort that received the largest chunk of leases. A closer look at the data indicates wide variation in lease allocations. The smallest value transaction was Shillings 0.5 million while the largest was 1500 times as much (Shillings 785 million), an indication that lease amounts are flexibly determined to match the lessee’s asset requirements. As one of our respondents re-marked, “…a lease is a very flexible finance tool that can match any cash flow needs of lessees” (Interview respondent, DFCU Leasing, Kampala-Uganda, October 2002). From Table 26 and chart 5, we can conclude that vehicle leasing not only dominated the leasing portfolio, it also stood out from the rest, exceeding leases in manufacturing and processing equipment by a disproportionately large margin. This seeming bias towards vehicles has to do with their quicker and easier appraisal process, easier secu-rity arrangements often enhanced by comprehensive insurance cover and the avail-ability of domestic skills to ensure vehicle repairs and maintenance. In addition, vehi-cles facilitate the transportation and marketing activities of firms and hence the cash
83 DFCU was first renamed DFCU Limited and later, the DFCU Group. Registered and domiciled in Uganda, the shareholding structure included the Commonwealth Development Corporation (CDC) Group Plc (35.3 per cent), the Germany DEG (24.7 per cent), International Finance Corporation (IFC) and the Uganda Development Corporation on behalf of the Government of Uganda (18.5 per cent). In July 1999, DFCU acquired Uganda Leasing Company Limited (100 percent shareholding) and renamed it DFCU Leasing Limited. In May 2000, it acquired Gold Trust Bank (100 per cent shareholding) which was renamed DFCU Bank Limited and in September 2000, it acquired Rwenzori Properties Limited (62.67 per cent shareholding). In January 2001, it also consolidated its 50 per cent sharehold-ing in the HFCU (Housing Finance Company of Uganda Limited), a credit institution dealing in mort-gages. 84 As of 30 September when we interviewed at this intermediary 85 A cut off point of Shillings 50 million was used to infer ‘small leases’ in the Deregulation Pro-ject/USAID SPEED, 2002:43- Appendix 4). The Small Lease Purchase Programme (SLPP) sponsored by DFID’s Financial Deepening Challenge Fund (FDCF) through DFCU Leasing (since 2002) speci-fied Pound Sterling 25,000 or Shillings 60 million as maximum lease facility for the SLPP.

170
flow with which to settle lease rentals. Notwithstanding, these advantages should not, in our view, provide a sufficient justification for the dislocation of leases away from manufacturing and processing.
Chart 5: Sector allocation of DFCU leasing transactions
Source: Based on DFCU Leasing data
Importantly, we found that much as this leasing company had performed well against its set objectives, it had also adopted a rather passive instead of a pro-active stance towards supporting the lessees to engage in technological learning and innovation ac-tivities. For instance, as with most banks in Uganda, the leasing company simply waited for customers to apply for leases instead of pro-actively creating awareness, exchanging information, explaining possibilities for innovation let alone providing technical assistance to lease applicants either directly or indirectly through relation-ships and links with suitable intermediaries. The practice was to generally assume that prospective lessees would surmount the obstacles they faced to correctly identify and choose the equipment they needed and thereafter approach the lessor to arrange a leas-ing facility. However, our interviews within the control group indicated that the firms had much less capability than was generally assumed. It is therefore no coincidence that within the control group, the bakery and diary industries obtained leases the most. As previously mentioned, a local private consulting firm affiliated to a South African supplier, closely supported bakery firms to evaluate, specify and source equipment, to interact with appropriate suppliers and to structure lease applications. Similarly, the Dairy Development Authority (DDA) played a vital role in guiding and enforcing regulations across dairy firms particularly in enacting the requirement to replace ru-dimentary items for milk storage with refrigeration equipment in the form of ‘milk-coolers’. DDA also assisted with the identification and specification of appropriate equipment.
0
5
10
15
20
25
30
4 W/D VEHICLES
AGRO-PROCESSING
BUSES & COACHES
COMMUNICATION
DAIRY
FORKLIFT TRUCKS
HEAVY TRUCKS & TRAILERS
MANUFACTURING
MINING
NONE
PRINTING
TRACTORS
Percentage
Percentage of leases made (number)
Percentage of leases made (value)
171
What is the likelihood that DFCU leases contribute to innovation in firms?
Financial leasing is often said to offer firm-level advantages that cannot be matched by conventional bank lending especially in developing countries. “…Leasing enables borrowers without well-developed balance sheets or credit histories (especially new or small firms) to use capital equipment in cases where they would not be able to access traditional bank lending” (MFPED, Deregulation Project/ USAID SPEED, 2002: 41). In particular, leasing companies (lessor) tie repayments to cash flow cycles of firms, structuring repayments to match the timing and cash flow patterns of the firm, which is good for innovation. Generally the inbuilt flexibility means that repayment periods can be very short or long extending to 4 or 5 years. The lessee (receiver of the lease) could therefore start off with much smaller payments followed by larger regular in-stallments as the cash flow improves. Grace periods suspending repayment could also be included to cover periods of restricted cash flow. In other words, “ the leasing company focuses on the lessee’s ability to generate cash flow- to service lease pay-ments, rather than its credit history, assets or capital base” (MFPED, Deregulation Project/ USAID SPEED, 2002:15). Consequently, the processing time for leases tends to be much shorter than bank loans, a feature that permits firms to promptly seize op-portunities. Ideally, longer and flexible repayment patterns would permit the firm (lessee) to mas-ter the use of leased assets, learning to get the best out of such assets, adapting and improving them in a variety of ways. However, this might not happen for two reasons. The first concerns property-rights of the asset. “…the essential feature of leasing which distinguishes it from other forms of credit instruments is retention of ownership of the asset by the lessor” (MFPED, Deregulation Project/ USAID SPEED, 2002:41). Under a finance lease, the lessor calculates the lease rentals to cover the full cost of the asset together with interest, administration charges and a margin so that at the end of the lease period, the lessor has recovered everything. The lessee bears costs related to maintenance and insurance in addition to the risk of obsolescence. But this is not enough to transfer ownership of the leased asset to the lessee. At the end of the pri-mary lease period, the lessor still legally owns the asset although the lessee has the right to buy the asset for a nominal fee. The lessor also has the right to sell the asset to a third party whereupon it would be entitled to keep a large proportion (up to 99 per cent) of the proceeds (MFPED, Deregulation Project/ USAID SPEED, 2002:41). Such obscure institutions (property rights) make it difficult for lessees to introduce altera-tions or improvements on assets that they do not own (weak incentives). Secondly, where a lessor merely engages in the business of leasing, free of deliberate and on-going efforts in support of lessees to adapt, improve and make the best use of leased assets, leasing might increase production capacity and operational skills but fail to en-hance technological capabilities.
Case 2: The Gatsby Trust
Uganda Gatsby Trust (Gatsby) is an initiative of the Technology faculty at Makerere University (Uganda) which promotes university-industry linkages with small-scale enterprises. Established in 1994, this unique initiative set out to “assist in developing the technological base of the small enterprise sector in Uganda and enabling growth of such enterprises” (Uganda Gatsby Trust brochure). It is registered as a local non-governmental organization and is affiliated to the Gatsby Charitable Foundation

172
(GCF) in the United Kingdom who provided an endowment fund. Firms organize themselves into ‘Gatsby clubs’ that serve as the main framework through which ser-vices are delivered in the major but also smaller towns in Uganda. Club size varies but each club has between 16-100 members. By 2002, Gatsby Trust had over 12 Gatsby clubs countrywide. Through the clubs, Gatsby delivers courses in subjects such as en-trepreneurship, business planning, management, quality improvement, costing, credit management, fabrication, motor vehicle repair, foundry and others. Gatsby clubs are also encouraged to exhibit their products in a showroom located in their respective towns. Gatsby also provides extension services to diagnose problems of firms and help prepare business plans. University faculty (Faculty of Technology) visit firms examine current status of operations, machinery and workers and conduct on-site ap-praisal. A business plan is then developed including the specification of a firm’s re-quirements, cash flow analysis and loan repayment schedule. This process assists firms to reassess their operations and plans and also enables them to learn about a range of possibilities for overcoming obstacles to technological upgrading. The learn-ing process is further supported through deliberate efforts to enhance knowledge flows between university faculty and small-scale firm operators. At the Faculty of Technology, engineering students not only get attached to small scale firms for intern-ship, but are also required (final year) to design and produce ‘appropriate technology proto-types’ for possible development into marketable technologies to the small en-terprise sector (Uganda Gatsby Trust brochure and field interviews, 2002).
Besides non-financial support to firms, Gatsby Trust runs a revolving loan scheme “from which Gatsby Club members can access loan finance to meet their working capital needs and/or purchase machinery to improve their technologies”. The scheme is based on the peer-group lending mechanism comprised of small self-selected groups of four people from the same Gatsby Club where group members guarantee each other’s loans. Typically, such schemes start off with small loan amounts expand-ing loan size progressively as the client builds credit history and loan management capabilities. At Gatsby Trust, loan size varies from Uganda Shillings 3 million (about US Dollars 1600) to Shillings 15 million (about US Dollars 9400) depending on the seniority of the client in the loan cycle. There are a number of benefits that firms de-rive from the kind of support delivered by this intermediary. First, the provision of relatively larger loans opens up new opportunities for firms within the Gatsby sphere to obtain adequate capital with which to acquire machinery and equipment. Second, the practice of tying principal loan repayment to cash flow cycles of firms enables firms not to pre-maturely eat into working capital as they service repayments. Loan repayment periods vary between 1 to 2 years, definitely not long-term but somewhat reasonable to permit limited re-investment of revenues for firms that have shorter product cycles. The financial arm of Gatsby Trust is an example of what we would call a promising small enterprise development/financial organization. The problem is that there are not many of these in Uganda.

173
Table 27: Industry Classification of Uganda Gatsby Loans86 as of October, 2002
Total loans
(value in
Shillings)
Proportion of
loans to male
borrowers
(value)
Proportion of
loans to female
borrowers
(value)
Total
number of
loans
Male share
(number of
loans)
Female
share
(number
of loans)
Animal feeds 4,500,000 4,500,000 2 2
Poultry production 4,500,000 4,500,000 3 3
Printing 9,000,000 6,000,000 3,000,000 3 2 1
Clay works 6,500,000 6,500,000 3 3
Metal fabrication 32,500,000 32,500,000 11 11
Electronic assembly 13,500,000 13,500,000 4 4
Food processing-maize milling
89,500,000 58,500,000 31,000,000 28 15 13
Construction 12,000,000 6,000,000 6,000,000 4 2 2
Motor vehicle garage works
5,000,000 5,000,000 2 2
Furniture mak-ing/carpentry
60,000,000 57,000,000 3,000,000 20 17 3
Textiles/tailoring 80,400,000 32,000,000 48,400,000 26 8 18
Services 41,100,000 24,500,000 16,600,000 15 8 7
Leather products 11,000,000 6,000,000 5,000,000 4 3 1
Coffee farming & processing
2,500,000 2,500,000 1 1
Animal rearing (zero-grazing)
700,000 700,000 1 1
TOTAL 372,700,000 254,500,000 118,200,000 127 78 49
Source: Based on Uganda Gatsby Trust - Loan records as of October 28, 2002 and excludes initial loan fund of Shs. 250 million channeled through the defunct Cooperative Bank
Table 27 indicates that food processing (maize milling) pulled the largest proportion of Gatsby loans both by value and number of loans. The textiles/tailoring sector came second. The data also indicate that the loan scheme has tended to include more male borrowers than female (68 per cent of the total value of loans and 61 per cent of the 127 loans as of October 2002).
86 It was only Uganda Gatsby Trust that could provide a gender breakdown of borrowers mostly be-cause other lenders do not often track gender-desegregated data. Surprisingly, besides Uganda Gatsby Trust and CERUDEB, other MFIs in the sample did not always track activities and therefore sectors their borrowers (members of groups) were engaged in.

174
What is the likelihood that Gatsby loans and services contribute to innovation
in firms?
The Gatsby Trust chose not to deal with micro enterprises probably because of its “no trade-loans policy”.
“Firms must add value and have potential to compete in markets. …We support transformation in the production chain, encourage processing of raw material into final products…” (Interview, Uganda Gatsby Trust, August 24, 2002).
Consequently, Gatsby Trust provides services to ‘the missing middle’ defined by Gatsby as firms not serviced by microfinance organizations but still too small and un-able to provide collateral for the kind of loans provided by the banking system. For firms within Gatsby’s reach, the provision of relatively larger loans opens up new op-portunities to obtain adequate capital with which to acquire enterprise assets particu-larly machinery and equipment. In addition, the practice of tying principal loan re-payment to cash flow cycles of firms enables firms not to pre-maturely eat into work-ing capital as they service repayments. Loan repayment periods vary between 1 to 2 years, definitely not long-term but somewhat reasonable to permit limited re-investment of sales revenues for firms that have shorter product cycles. Importantly, Gatsby Trust has set up a university-based support system to enhance technological knowledge flows and services to small-scale firms. It complements this with a loan scheme that facilitates the acquisition of equipment and other materials and therefore opens up an opportunity for learning and innovation activities where such equipment is essential. Ironically, a large proportion of Gatsby loans has gone to the grain-milling sector where the stimulus and potential to innovate is only limited. We could also not find sufficient evidence indicating that university faculty, through the Gatsby Trust, often demonstrated what the possibilities were for modifying the structural characteristics of the equipment acquired in order to enhance its productiv-ity, for example. Interestingly, when the eventual realization of a UNIDO grant to support a machine leasing programme at Gatsby Trust failed to occur, the Trust took the initiative to introduce some of its clients to DFCU Leasing for leasing facilities. Entailed in this linkage was the expectation that the small-scale lessees at DFCU Leasing would receive training, business planning support and technical extension services from Gatsby Trust while DFCU leasing provided the required leases. In spite of its potential usefulness as a means of sharing risk and costs in ways that would en-courage longer-term technological learning processes, this arrangement remained in-formal and was not supported to further develop. In sum, we find that the institutions in the non-banking financial subsystem had im-proved but did not yet adequately support learning and innovation processes within many of the firms included in the control group. Overall, Table 28 indicates that fish-processing firms generally secured access to more sources of finance than firms in the control group but as we mentioned previ-ously, the need and urgency for additional finance in terms of loans and leases only emerged when Nile Perch processors and exporters were required to restructure before they could re-access the EU market.

175
From Table 28, we can also see that the percentage of commercial bank sources out of the total sources accessed was about 50 per cent among fish processors while on aver-age, the comparable figure across the control group firms was 33 per cent. Firms un-able to access commercial bank intermediaries or other interest-bearing facilities (such as leases or micro finance loans) privileged their financial gearing position with non interest-bearing finance. Trade credit contributed the most to sales among the control group, followed by other lines of business and advance payments, in that or-der. However, these non-interest-bearing funds clearly had their limits and could not be relied upon to finance investment. This also applied to some of the grain milling firms that obtained microfinance loans. The larger of these reported that microfinance organizations (MFIs) could not exceed pre-set limits and therefore, these intermediar-ies (MFIs) could not be relied upon to finance expansion and emergencies.

176
Table 28: Accessibility of Financing Intermediaries
Percentage of firms that used intermediary (since the mid 90s) out of total weighted sample of
firms87 in sector
Intermediary Fish Meat Fruit Grain Bakery By-prods
Commercial Banks
Allied Bank 0 0 0 0 0 0
Barclays Bank 11 0 0 0 0 0
Bank of Baroda 11 17 0 0 0 0
Cairo Bank 0 0 0 0 0 0
CERUDEB 0 0 12 4 28 0
Citibank 0 0 0 0 0 0
Crane Bank 11 0 0 0 0 0
DFCU Bank 0 0 0 0 14 0
Diamond Trust Bank 11 0 0 4 0 0
National Bank of Kigezi 0 0 0 0 0 0
Nile Bank 0 0 0 0 0 0
Orient Bank 11 0 0 0 0 0
Stanbic Bank 11 17 0 0 0 0
TransAfrica Bank 0 0 0 0 0 0
Standard Chartered Bank 0 0 0 4 0 50
Tropical Africa Bank 0 17 0 0 14 0
Development Banks
EADB 0 17 0 0 0 0
Foreign capital through IDA/World Bank 0 0 12 0 0 0
UDB 11 0 0 0 0 0
Credit Institutes
HFCU 0 0 0 0 0 0
Stanbic International 0 0 0 0 0 0
Mercantile Finance 0 0 0 0 0 0
Stanhope 0 0 0 0 0 0
Imperial Finance 0 0 0 0 0 0
Capital Finance 0 17 0 0 0 0
Interstate 0 0 0 0 0 0
Other credit Institutes 0 0 0 0 0 0
Micro Finance Organizations (MFI)
UMU 0 0 0 28 0 0
FINCA 0 0 0 0 0 0
87 Total weighted sample of processing firms is as follows: Fish firms:9;Meat firms:18;Fruit firms:8; Grain milling firms:1750;Bakery firms:201;Fish By-product firms:2;Total=1990 firms

177
Percentage of firms that used intermediary (since the mid 90s) out of total weighted sample of
firms87 in sector
Intermediary Fish Meat Fruit Grain Bakery By-prods
Gatsby Trust 0 0 0 20 0 0
Other MFI 0 0 0 8 0 0
Leasing intermediaries
DFCU Leasing 11 0 0 0 71 0
EADB Leasing 0 0 0 0 0 0
Money lender 0 0 0 4 0 0
Non-interest-bearing sources of finance
Friend or relative 0 0 0 12 0 0
Trade credit 22 67 50 32 43 0
Advance payments from buyers 44 0 12 16 14 0
Other lines of business (sister firms) 33 67 25 20 28 50
Total # of sources/intermediaries ac-cessed
11 7 5 11 7 2
% of commercial bank sources out of total
54% 43% 20% 27% 43% 50%
Source: Author’s field survey (2002)
Therefore, the main factor accounting for the difference between the financial gearing position of Nile Perch processors and that of the firms in the control group was that the former had more alternatives for securing finance due to their wider linkages and larger firm size. They were able to choose and combine different forms of finance in ways that made their financial gearing position more suitable for learning and innova-tion activities. In contrast, the firms in the control group had fewer alternatives and many were relatively smaller compared with fish processing firms. Given their narrow range of financing possibilities, they tended to privilege their gearing position with non-interest-bearing finance or other forms of financing which could not accommo-date some of the necessary activities required for learning and innovation. Commercial banks were more accessible to fish processors because these firms pos-sessed characteristics that matched better with the historical norms and practices of banks, compared with the firms of the control group. In a general sense, the norms and practices of Uganda’ s banking subsystem tend to favour the larger firm as well as loan purposes that are easily defined such as the importation of machinery and equip-ment. In the case of the Nile Perch fisheries system, the institutional changes intro-duced within the system created a strong impulse to undertake learning and innova-tion activities and this demand came from relatively large-sized firms, whose products had an established market, which would assure lenders of regular cash flows needed for loan repayment. All this made it easier for the fish processing firms to pass eligi-bility norms and lending practices of the banking system. In other words, the charac-teristics and requirements of fish processing firms matched better, although still minimally, with the norms and practices of the banking and non-banking subsystem. In contrast, the impulse and support to intensify learning activities were absent across the control group. In addition, the institutional changes in the norms and practices in-troduced in the banking and non-banking subsystem were insufficient to accommo-

178
date the specific characteristics and learning requirements of many of the firms in the control group.
7.7 Synthesis
This section provides a synthesis of the factors present within the Nile Perch fisheries system and absent within the systems of the control group. From the synthesis, we can identify three sets of factors that account for the observed difference in INNOVA. The first relates to differences in firm level characteristics while the second relates to dy-namics that trigger or act as an incentive for institutional and organizational change. The third concerns differences in the set-up and changes in the key subsystems that affect learning and innovation activities. A detailed discussion of all three sets of fac-tors has been provided in the present and previous chapters. Table 29 provides a summary. Firms in the fish-processing and exporting industry had more foreign and non-Ugandan owners, well connected to regional and global sources of information and knowledge inputs. They were larger and had a higher concentration of educated work-ers. Such characteristics made it easier for these firms to learn and acquire inputs nec-essary for innovation activities. Besides enabling them to attract workers with higher levels of education, their larger size also enabled secured access to a wider range of possibilities for interest and non-interest bearing finance. However, these characteristics did not translate into more innovative behavior until a conditional ban resulting from the introduction of augmented market institutions was placed by the EU on Uganda’s fish exports. This was the main source of dynamics in the Nile Perch fisheries system and, coupled with the institutional and organizational improvements in the set-up of the key subsystems for learning, and the competences at firm level, explains the ability of Uganda’s Nile Perch fisheries system to undertake intense learning and innovation activities. This interplay of factors was absent across the other food-processing systems.

179
Table 29: A Comparison of the Nile Perch Fisheries System and Systems in the Control Group
The Nile Perch fisheries system Other food-processing systems in control group
Firm characteristics
Firm size & technical assistance
• Medium and large
• More intense technical assistance
• Micro, small and medium, few large
• Less intense technical assistance
Ownership : Ethnicity and gender of owner
• Larger presence of foreign ownership
• Concentration of ownership among Ugan-dans of Indian origin
• Predominantly male owned
• Low intensity of foreign ownership
• Heavier concentration of indigenous Ugandan ownership
• Predominantly male owned, female ownership concentrated in grain milling industry but firm size smaller
Nature of markets Demanding, institutionally augmented Non-demanding, not institutionally augmented
Workers education • Majority of workers had primary or ele-mentary secondary schooling but indus-try had highest concentration of workers with university education and formal A-level diplomas
• Largest proportion of workers with for-mal technical education certificates
• Majority of workers had primary or elementary secondary schooling. Only a few other firms particularly in the meat and fruit-processing sectors had workers with university education and A-level diplomas
• Only a few fruit-processing firms had workers with formal technical education certificates
The trigger, dynamics, source of pressure to introduce change
Subsystem mediating market institutions
Conditional ban to high-value markets result-ing from augmented & ‘hard’ institutions in markets through:
• International Standards [Directive 91/493/EEC & amendments] &
continuous enforcement
• Local standards, regulations & enforce-ment + restrictions on supplies by public agencies
‘Soft’ market institutions:
• Meat-processing industry: Opportunity to tap new and growing market but undemanding
• Expanding but weakly demanding domestic market for bakery sector
• Opportunity to import substitute in an expand-ing but undemanding market for fruit-processing sector
• Grain milling sector: Larger market share in undemanding markets
Subsystem promoting the generation and accessibility of knowledge and learning
Technical assistance, support system and source of learning
• Systemic, strong co-ordination through public efforts
• Technical/scientific sources of learning available and accessible
• Own learning efforts strong
• Non-systemic, disconnected islands of support
• Technical/scientific sources of learning limited to a few firms
• Own learning efforts weak
Sector-based policies and practices
High degree of effort by the state to strengthen sector: political will, decisive & ‘open’ leadership in the aftermath of EU re-strictions
Less degree of effort by the state to strengthen sec-tors
The bank and non-bank subsystem
Financial support sys-tem, range of financing possibilities and finan-cial gearing
• System is minimally supportive of learn-ing and innovation; banking system suf-fers from lock in associated with histori-cal norms and practices
• bank loans more accessible
• wider range of interest and non-interest bearing financing possibilities
• Combined different forms of finance in ways that made their financial gearing position more suitable for learning and innovation activities
• system is minimally supportive
• bank loans less accessible because firm charac-teristics fail to match with norms and practices of banks
• narrower range of financing possibilities
• Privileged their gearing position with non-interest-bearing finance or other forms of fi-nancing unsuitable for potential learning and innovation activities if impulse and support for more intense learning was present

180

181
Chapter 8 Conclusions and Policy Inferences
From 1997, the European Union (EU) imposed and enforced a set of Sanitary and PhytoSanitary (SPS) standards on Uganda’s fish exports. This led to a conditional ban of one of Uganda’s important exports and a subsequent crisis within the fish process-ing and export industry when the required SPS could not be met. In response, the fish processing and exporting industry successfully engaged in learning and innovation activities. These were not radical but had a crucial impact upon Uganda’s economy. Data on fish exports from Uganda show a sharp rise in value beginning 2000/2001. We associated this increase in export values to the re-entry into demanding, but high-value markets. Re-entry was only possible after accomplishment and certification of improvements in structural plant lay out and processing standards as specified by the European Commission. Based on international norms and guided by EU standards, national level standards were developed by the Department for Fisheries Resources (DFR) in Uganda. The process of executing these improvements embodied process-related technological change, learning and innovation. Some of these were compul-sory while others were not but it is these improvements that transformed Uganda's fish industry and helped it to regain its position within the high-value export markets. The study sought answers to two inter-related questions. First, what was the nature of the response following the EU ban(s) and how can we explain such a response? Sec-ondly, what factors explain the ability of Uganda’s fish processing and exporting in-dustry to learn and innovate and how do these factors interact with each other to affect innovation? As an analytical tool, the study adopted the innovation systems approach which is still evolving but firmly rooted in several strands of established theory. While the ap-proach partly derives its explanatory power from its holistic approach, this also pre-sents some difficulties in trying to apply the approach to empirical work, especially in judging what the most important factors, actors and relationships are and therefore what sets of factors and relations need to be examined in greater detail. For the pre-sent study, we assembled a firm-level dataset and applied basic statistical tools of analysis as a means of identifying some of the important subsystems, elements and relations that needed to be examined in some further detail. At this level of analysis, we expected firm size, market orientation to more demanding markets, personnel education, the intensity of received technical assistance, the finan-cial gearing position of firms, and firm-level institutions (beliefs, habits, practices) to significantly influence learning and innovation activities and used the variable ethnic-ity of firm owner (or head) to capture the difference in firm-level institutions. This was stated as hypothesis number 1 in Chapter 2 and from the analysis conducted in Chapter 4 and the in-depth case studies in chapter 5, we find that both the food-processing and RPED samples provide reasonable evidence to support the hypothesis that the workers' education level, size of the firm, access to technical assistance, ex-port market-orientation and financial gearing variables are important for innovation processes. Interest-bearing finance and non-interest-bearing finance are both impor-

182
tant and complementary and the important dynamic is how well a firm balances both types of financing. The ethnicity variable picked up some variation in INNOVA in the food-processing sample although it had almost no discernible effect in the RPED sample. The factors identified as important for innovation served as guideposts or pointers to the key elements and subsystems and therefore provided the framework for a focused and more detailed examination of the ability of the system to undertake processes of learning and innovation. Most anatomies of the strengths and weaknesses of innova-tion systems rarely include an empirical review of enterprise level competences and factors of influence and a common weakness of empirical firm-capability studies is they do not take into account the workings of the innovation system as a whole. Our methodological approach not only combined these two approaches, but also made an attempt to bring the developing country literatures on firm-capabilities, innovation systems and enterprise finance closer to each other. In order to demonstrate that the factors, relations and dynamics identified were able to reasonably explain the ability of fish processing firms to learn and innovate, we adopted the ‘without’ control group approach. Here, the key conceptual guide was demanding markets or what we have labeled institutionally-augmented markets. Five food-processing industries (sector-based systems) in Uganda constituted the control group population and though some of the firms exported their products, they dealt with domestic and export markets where SPS and product related standards were ei-ther unavailable or not strictly policed. Hence, while we identified the Nile Perch fisheries system ‘with’ institutionally augmented markets, the control group industries were identified as systems ‘without’ institutionally-augmented markets. The focus upon ‘sector-based systems’, as presented in this study, reflects the idea that sectors differ regarding the institutional set up, support structures, adaptation of the system and in the firm competences necessary for learning and innovation. Drawing upon innovation systems literature, we expected the intensity of innovation activities to derive from the interaction between the functioning and dynamics of the system set-up, the organizational and ‘institutional’ architecture and firm level-factors. We hypothesized a significant difference in the intensity of innovation activi-ties between systems with and without institutionally-augmented markets (Hypothesis number 2 in chapter 2). Indeed, we find that differences in the nature of markets help define differences in the intensity of learning and innovation activities across the vari-ous sector-based systems examined in Chapter 7. Within the food-processing dataset, the predicted probability of INNOVA was highest for the fish processing and export-ing industry. Furthermore, the comparative study of the fisheries (Chapter 6) and the five other sector-based systems demonstrated that the imposition of Sanitary and Phy-toSanitary standards (SPS) by the European Union (EU) had positive effects by stimu-lating the emergence of unprecedented inter-relationships and flows of knowledge, which when combined with the subsequent institutional and organizational improve-ments that occurred in the set-up of the key subsystems for learning, and the compe-tences at the firm level, explain the ability of Uganda’s Nile Perch fisheries system to undertake intense learning and innovation activities. This interplay of factors was ab-sent across the other food-processing systems.

183
We find that success in terms of the introduction of innovative activity depends on the degree to which the set-up and dynamics of various key subsystems in the support system and firm-level competences (including firm-level institutions) bring to bear on one another to promote learning and innovation. Notably, the case studies in chapter 5 and the discussion in Chapters 6 and 7 showed that though the Nile Perch exporting industry always enjoyed the benefits associated with firm size, a wider range of fi-nancing possibilities, export orientation and other favourable characteristics, it was the flows and inter-relationships that emerged within the Nile Perch fisheries system that created a better fit between an improved support system and the firm-level com-petences necessary for a positive learning and innovation outcome. The detailed ex-amination of the Nile Perch fisheries system provided by chapter 6 and, the compara-tive assessment of the control group systems in chapter 7 thus support the hypothesis that the likelihood for developing country firms to undertake intense learning and in-novation activities is high where suitable institutional change, relationships and knowledge flows emerge within an innovation system (Hypothesis number 3 in Chap-ter 2). Within Uganda’s Nile Perch fisheries system, the in-depth case studies discussed in chapter 5 support the conclusion that the key force of change was the introduction of augmented and ‘hard’ institutions in export markets and the subsequent conditional ban (s) imposed by the EU. The institutions embedded in the EU export market were previously ‘soft’ and because of the strict policing of the new standards, these institu-tions moved from ‘soft’ to ‘hard’. A conditional ban of Uganda’s fish products from the high-value EU market served as an incentive to the effect that the industry was favorably disposed to the introduction of intense learning and innovation activities. Moreover, re-entering the EU market was important to the government given Uganda’s very narrow export base and the difficulties of falling global commodity prices. Hence, in an unprecedented manner, a number of players, including the gov-ernment, private firms - local and foreign - the fish processors association and interna-tional development agencies responded swiftly and decisively to resolve the immedi-ate and structural problems that the fish industry faced. Through public-sector led co-ordination, a new useful form of interaction emerged enabling the fish processing firms to successfully respond to the changes that had occurred in the institutional and organizational set-up. Hence, we attribute the ability of the Nile Perch fisheries sys-tem in Uganda to engage in learning and innovation processes to the interplay be-tween institutional and organizational changes in the subsystem mediating market in-stitutions, in the subsystem dealing with knowledge distribution and coordination, as-sociated sector-based policies, and to some limited extent institutional changes in the finance subsystem in addition to a number of firm-level factors. The latter include the size composition of firms, orientation to institutionally-augmented markets, access to technical assistance, the financial gearing position of firms, personnel education and firm-level institutions. The emergence of flows of knowledge, support structures and inter-relationships was crucial to the ability of fish processing and exporting firms to successfully introduce innovative change. The study refutes the view of innovation as a linear process driven by the supply of research and development (R&D). In the case of Uganda’s Nile Perch processing in-dustry, technology was not transferred from research institutes and developed and ap-plied in a linear fashion. Instead, technological learning and overall upgrading was dictated by institutional changes in the international trading environment and facili-

184
tated by the institutional and organizational improvements and interactive relation-ships that were introduced in the system following the imposition of EU restrictions and their enforcement. We also find that in the case of developing country firms such as those in Uganda, assisted learning through public efforts, comparable to the effort and role played by MITI in Japan (Freeman, 1988), is a necessary prerequisite for effective learning and innovation activities even where private industry is dominated by relatively medium and large sized firms. In the case of Uganda’s fish processing firms, the strict policing of technical standards provided an important impulse for learning and innovation processes. The creation of an effective legal and regulatory framework was an impor-tant element of the assisted learning environment. In addition, capacity development inputs from public and private agencies were required for institutional change, to build awareness of technical and organizational possibilities, to identify sources of knowledge and absorb some of the associated costs of local and foreign expertise, to demonstrate technological and organizational possibilities and in promoting the diffu-sion of generic knowledge such as HACCP principles, germane to other food-related industries. Moreover, as of 2004, the fish processing industry in Uganda was dominated by a cer-tain kind of internationalized firm, headquartered in Kenya for example, and not nec-essarily the type of global foreign firms often associated with superior technology. These are the types of regional foreign firms that initially demonstrated the possibili-ties for industrial fish preparation and export but when the EU placed a ban on Uganda’s fish, technical assistance for technology adoption and upgrading was as much required by the foreign internationalized firm as the local firm. A typical re-gional firm headquartered in Kenya and operating in Uganda is likely to have less competence in research and development, product design and global marketing for example. Even where closer linkages with the more sophisticated or global buyers open up new possibilities to access new knowledge, in product development for ex-ample, the flow of knowledge from the global to the regional or local firm, especially in the guarded competencies of design and marketing, tends to be difficult in the ab-sence of stronger local systems and the capacity to absorb, produce and use knowl-edge. Indeed, the fisheries case supports the view that learning and innovation processes do not occur at arms-length. In our specific case, both the impulse and the support neces-sary for learning and innovation processes grew out of augmented and organized mechanisms involving complementary private and public effort. The imposition of SPS standards yielded a stronger form of pressure to learn and upgrade and spurred the emergence of an improved support system. The support structure consisted in a joint effort between the government, international development agencies, the industry association, some buyers, local and, foreign private firms. Government played a cen-tral role in sustaining the pressure on firms to maintain standards. However, the re-sponse was spontaneous and not part of a well coordinated public policy to innovate. Hence, a number of improvements occurred in the industry but critical linkages, rein-forcements and further structural improvements were not introduced. It is therefore possible that without well targeted incentives, continued pressure and assisted learn-ing through public support, the momentum for learning and innovation processes might simply erode with time.
185
Assigning an important role to the public sector does not mean that we are proposing a naïve recreation of the past or are overly optimistic about the capabilities of this sec-tor especially in the developing world. As with many other studies, we are to conclude by reiterating that given the level of development that countries like Uganda are pres-ently at, learning and innovation weaknesses cannot simply be left to correct them-selves. Instead of assisting the public sector in such countries to ‘get out’ or to simply limit its role to the creation of an ‘enabling environment’, it should also be assisted to build the competences necessary to play a prudent role in the process of building in-novation systems, in addition to its conventional roles of developing physical infra-structure, utilities and sustaining good economic conditions. We consider the role of the government and public sector agencies to be vital in many other ways which are also important for the ability to improve and sustain socio-economic growth and development. These include the public sector role in building the capacities necessary for a more effective and dynamic learning innovation system. To be effective, it would need to play a role in reversing undesirable ‘institutions’ in the systems by evolving better reward systems for improved relations based on trust and improved work ethics. Intra-industry flows of knowledge and interaction across all players of relevance to the fisheries sector still needs to be improved. The acquisi-tion of foreign knowledge inputs, their correct application and demonstration of pos-sibilities and the domestic farming of exportable fish varieties are all critical. Re-search collaboration between local and foreign universities is needed to acquire knowledge that is not available or cannot be generated independently. Knowledge ac-cessibility is essential. Recall, that we found the institutions governing the financial services provided by and through Uganda’s banking and non-banking system to have improved but only mini-mally relative to the learning and innovation requirements of firms, these being key actors within the overall system of actors involved in innovation processes. It was therefore concluded that additional efforts, coordinated through relevant agencies and with the support of international development partners, are needed to motivate and build a more dynamic financial innovation system. In the case of countries compara-ble to Uganda, as much as the introduction of improvements at the level of the indi-vidual lender are crucial for the emergence of an effective financial support system, what is needed is a collective capacity that enables the financial system to deliver the finance with which to undertake relevant learning and innovation activities. One way of building such capacity is to recognize that the stimulation of changes in the ‘institu-tions’ that govern the modus operandi of financial intermediaries is as important as the pecuniary resources still needed by these intermediaries for long and medium-term onward lending. Impressive but isolated improvements by lenders will not solve the observed mismatch between what the prevailing financial system offers and what is required in support of learning and innovation processes. Instead, lenders will have to evolve the right institutional climate for developing risk and cost-sharing relationships which will necessitate new forms of partnerships whose actual configuration is diffi-cult to prescribe. New forms of relationships between lenders and firms through their business associations, and an enabling ‘institutional’ context, will also have to be de-veloped. In addition, and especially in the case of technologically-lagging countries such as Uganda, a parallel and dynamic on-going support structure, outside the finan-
186
cial system, would be required to build a collective capacity of firms and other actors to innovate. More specifically, Uganda needs a sharper and elevated focus on the learning and in-novation process as an important driver of economic growth and development. This requires the effective delegation of powers to some form of high-profiled competent authority. A renewed and upgraded Uganda National Council of Science and Tech-nology (UNCST) might serve this purpose. Through unambiguous policy specifica-tion and with the involvement of all relevant actors, the national competent authority on technological upgrading and innovation should provide leadership in a number of areas. These would include; leadership in organizing background research across care-fully selected sector-based systems, evolving standards and ‘hard’ policing mecha-nisms as well as coordinating improvements in other support systems including the development of reward systems and performance targets for learning and innovation, all accompanied by a supporting budget. Technological upgrading solutions will have to take account of sector specific requirements and conditions. In this context, the competent authority should encourage productive relationships across all relevant public and private agencies such as the Investment Authority, banks, government min-istries, universities, business associations, suppliers, buyers, research and training in-stitutes - local and foreign - and others that need to interact better to stimulate and sus-tain learning and innovation processes in various sectors. In other words, the govern-ment might need to restructure and improve the Uganda National Council of Science and Technology in a manner that permits it to coordinate, develop and strengthen na-tional and sector-based systems of innovation. One of the contributions made by this study is the illumination of the important con-tribution standards can make to the process of building learning and innovation sys-tems especially in a developing country setting. Research has however, drawn our at-tention to the counter-productive effects of imposing rigid and inflexible standards. For example, in his analysis of the divergent effects of environmental regulations on technological change, Yarime (2003) observes that while weak environmental regula-tion induces firms to choose end-of-pipe technologies rather than clean technologies, stringent regulation imposed in a rigid and inflexible way does not necessarily en-hance technological change. When firms are asked to abandon the production tech-nology immediately, a wrong technological choice could be made given the large de-gree of uncertainty concerning which technology, among the multiple options that ex-ist, will progress to become the best in the long run. This author thus cautions that stringent regulation would have to be coupled with flexibility which allows sufficient time for R&D and learning (Yarime, 2003: 76-77). Hence, while policy making should obviously encourage other more subtle ways of stimulating learning and inno-vation processes and not consider the introduction of rigid and inflexible ‘hard’ insti-tutions in the form of enforced standards as ‘the answer’, this study suggests a role for the enforcement of innovation-enhancing standards and underlines their relevance for processes of building learning and innovation systems in developing countries.
The review conducted in chapter 2 noted that the literature often offers two opposing perspectives on standards and developing country trade. While the bulk of the litera-ture views “standards as barriers to trade”, an emerging and alternative perspective projects “standards as catalysts”, a view well illustrated by the following quote.

187
“An alternative and less pessimistic view emphasizes the potential opportunities provided by the evolving standards environment and the likelihood that certain developing countries can utilize such opportunities to their competitive advan-tage. From this perspective, many of the emerging public and private standards are viewed as a necessary bridge between increasingly demanding consumer re-quirements and the participation of distant (and international)suppliers. Many of these standards provide a common language within the supply chain and pro-mote confidence for consumers in food product safety. Without that confidence, the market for these products cannot be maintained, let alone increased, in turn jeopardizing international trade….[C]ompliance with food safety and agricul-tural health standards may well provide a powerful incentive for the moderniza-tion of developing country export supply chains and give greater clarity to the necessary and appropriate management functions of government….[V]ia in-creased attention to the spread of ‘good practices’ in agriculture and food manu-facture, there may be spillovers into domestic food safety and agricultural health, to the benefit of the local population and domestic producers. Part of the costs of compliance could be considered necessary investments, while an array of foreseeable and unforeseeable benefits might arise from the adoption of dif-ferent technologies or management systems. Rather than degrading the compara-tive advantage of developing countries, enhancement of capacity to meet stricter standards could, potentially, create new forms of competitive advantage” (Jaf-fee and Henson(2004:3).
The present study offers a much broader perspective of standards because our re-search supports the conclusion that the process of compliance with the SPS measures imposed by the EU on Uganda’s fish exports required flows of knowledge, informa-tion and interrelationships spanning a much wider set of actors than those located along the Nile Perch fish supply chain. Enhancement of capacity also included many more actors beyond government and the supply chain. We should also mention that while the emerging view of “standards as catalysts” certainly offers a more balanced view, highlighting both the concerns and potential opportunities provided by the rap-idly changing standards environment, the emphasis still seems to be on the informa-tional role of standards, in ‘providing a common language within the supply chain’ or in promoting the ‘confidence for consumers in food product safety’, for example. While noting their possible role in retarding the innovation process, the view of stan-dards we take is what might be called standards as innovation enhancing. We have drawn upon the work of institutional economists and innovation scholars who empha-size that because markets are institutionally embedded and certainly not pure, market ‘institutions’ matter because they can support, facilitate, slow or hinder market trans-actions, and interactive learning. Hence, following Edquist and Johnson (1997), we looked at standards from an institutional perspective and suggest that standards are not just a matter of addressing the market’s inability to effectively facilitate informa-tion flows or merely a question of non-tariff trade barriers although they have and could be used to serve trade protectionist objectives. From an innovation systems per-spective, the thesis, then, is that because they also augment the quality of demand thereby making markets more demanding and exert pressure on producers to discon-tinue outdated and unsuitable working practices, in addition to the possible stimula-tion of changes in the support system, ‘hard’ standards are an important set of institu-tions that can serve to stimulate and support learning and innovation processes.

188
It has been demonstrated that in the case of developing countries comparable to Uganda, ‘hard’ standards can assist to make markets more demanding or to augment market pressure (institutionally-augmented markets) which is one of the demand-side conditions necessary for sustained learning and innovation processes. We are not the first to advance a demanding markets hypothesis as a factor for technological change and innovation. In an important piece of work edited by Keith Pavitt (1980), the fol-lowing story of Britain’s loss of industrial vitality in the period 1850-1950 is of rele-vance.
“Walker attributes the persistence of the [British] problem to the cushioning ef-fects of the Empire, providing both market outlets for British products unable to compete elsewhere in the world, and financial income to prop up a shaky bal-ance of payments on the current account…Freeman [Christopher] talks of a ‘narrow-minded complacent insularity [by the British] reflected in the unwill-ingness to learn from others’…” (Pavitt, 1980:13). [Walker (1980) writes:] ‘…We have to examine two interacting sets of explanations, the one proposing that circumstances internal to the British society and economy stood in the way of change, the other that the incentive to innovate and modernize production was lacking…[I]imperial expansion provides the most persuasive explanation for the lack of urgency over industrial modernization…[F]acing rising tariff barriers and strong competition in Europe and the USA, British manufactures found a ready and relatively profitable market for their goods in the less developed re-gions of the world….By 1913 around two-thirds of Britain’s exports were going to the semi-industrial and non-industrial regions of the world… [This]… inhib-ited modernization in two principal ways. Firstly, the cultural, institutional and economic protection prevailing in Empire markets discouraged risk-taking and removed much of the pressure to improve international competitiveness…with the [implication that] …manufactures could [comfortably] maintain their alle-giance to outdated production methods…Secondly, the Empire reinforced many of the features of British society that stood in the way of change…[and] …was substantially responsible for the avoidance of crises [and demands] of the sever-ity that afflicted many other industrial economies…” (Walker, 1980:19-33).
At issue here is the point that it is not simply a question of exports for exports sake (market shares) or just a matter of exporting to earn foreign exchange or expand jobs. On this point, Larry Westphal’s observations from some of his work on South Korea and Taiwan are instructive.
‘Exports [do] matter for an economy’s technological development…significant transfers of technology occurs most effectively and efficiently sometimes: if at all, only -- in the context of export activity. [They ‘matter profoundly for eco-nomic and technological development, this because they directly and indirectly affect the transfer and effective assimilation of technology as well as the acquisi-tion of innovative capabilities’ (Westphal, 2001:23)]. A plausible alternative hy-pothesis is that exports …expose firms to a far more vigorously competitive en-vironment (than may be found on the domestic market, where there is always some degree of “natural” protection); it is this competition, not directly related to technology transfers, which leads to greater productivity growth’ (Westphal, 2000:7).

189
The ability of markets (whether export or domestic) to exert demands on producers, to continuously improve products and processes or production organization, matters a great deal for innovation and sustained good economic performance. In the preceding British story, the authors also identify a number of other complementary conditions that were absent for innovation by the British at the time. They include deficiencies in the education system and the prolonged neglect of scientific and technical subjects; a laissez–faire attitude towards industrialization at a time when British private industry was weak and unresponsive to the growing need for competitiveness; social and la-bour-related rigidities, and opposition to modernization in preference of craft tech-niques; illusions of continued Anglo-Saxon domination and supremacy which bred complacency, inaction and so on. The story we have told of Uganda’s Nile Perch fisheries seemingly has a lot in com-mon with the demanding markets hypotheses advanced way back in 1980 by Walker, Keith Pavitt and others in relation to the weak innovative performance of Britain and her loss of industrial vitality in the period 1850-1950. Similarly, Westphal (2000) points to the importance of more vigorous market pressures in export markets as a factor for technological capability development. Porter (1990) also stressed the char-acter of demand as one of the important factors for competitiveness. The historical antecedents to our story could therefore be traced back to these and related variants of the demanding markets hypotheses. However, the ideas developed in the present volume present a somewhat different and more systemic variant of the demanding markets hypothesis. As previously men-tioned, we find that ‘hard’ standards can assist to make markets more demanding. On the supply-side, the pressure exerted on producers provokes a discontinuation of older working practices, beliefs and illusions (institutions) that might be difficult to extin-guish in the absence of equally effective pressure and incentives for change. This study has also shown that ‘hard’ standards can spur changes in the support system es-pecially where they impose pressure on policy and relevant actors in the system to address the kind of organizational and institutional deficiencies similar to the ones that exacerbated Britain’s weaknesses to innovate (in the period 1850-1950). In other words, this study finds that well enforced standards did matter for systemic upgrading of the Nile Perch and other food processing industries we examined. They might mat-ter for systemic learning and innovation processes across many other industries. It should also be remarked that innovation-enhancing standards will be more effective where a suitable institutional and organizational set-up and firm-level competences are developed. It is this interplay of factors that is crucial for learning and innovation processes to emerge and develop and as we have stressed in this study, public agen-cies have an important role in promoting and ensuring that such interplay develops, that capacities of all relevant actors in the system are enhanced and that the benefits are diffused to other sector-based innovation systems. In this context, it is of interest to note that UNIDO’s Uganda Integrated Programme decided to adopt the Nile Perch fisheries approach as a precedent for the upgrading of other food industries in Uganda. More specifically, it identified and focused on four sectors with export potential and within them 13 food-processing enterprises (other than fish) willing to introduce HACCP and GMPs (Good Manufacturing Principles). The four sectors are dairy, meat and poultry, fruits and vegetables, and bakery. Coor-

190
dinating the diffusion of the lessons learnt from the fish industry to other food indus-tries is a good example of the type of public-led coordination required to stimulate learning and flows of knowledge. However, it is essential that research be conducted to examine factors that might explain the success or failure of learning and innovation processes in the four sectors where the Nile Perch industry experience was emulated. The Nile Perch fisheries case also raises the question of why public and private efforts succeed in building stronger learning systems in respect to some industries but are less successful in respect to others. For example, a number of initiatives have been intro-duced to rehabilitate and grow Uganda’s fish farming industry. The industry made some progress in the 90s but has not succeeded in putting farmed fish on global mar-kets. It has also been unsuccessful in relaxing the persistent problem of inadequate fish supplies for export processing. Despite efforts by the government and interna-tional public agencies, many other industries such as vanilla production and export have also not been as successful. We could not find any innovation systems studies discussing the strengths, weaknesses and potential of the sector-based systems re-cently prioritized by Uganda’s strategic priority exports initiative (MFPED, 2001). The use of an innovation systems framework for sector-based diagnostics would help determine the mechanisms, support structures and policies necessary for the promo-tion of learning and innovation activities not only for the benefit of Uganda, but equally for other comparable developing countries.

191
Samenvatting (Summary in Dutch)
Deze studie beschrijft een positief en interessant voorbeeld van hoe een technologisch zwakke industrie in sub-Saharan Afrika (SSA) met succes heeft ingespeeld op globale veranderingen in technologie en in concurrentie verhoudingen, en daarmee afwijkt van het impliciet sombere beeld dat vaak in bijbehorende hedendaagse literatuur wordt geschetst. Eind jaren negentig legde de Europese Unie (EU) de Sanitary and PhytoSanitary (SPS) standaarden op aan de visuitvoer van Oeganda. Dit leidde tot een voorwaarde-lijk verbod van een van de belangrijkste export producten van Oeganda, omdat de visverwerkende en -exporterende industrie niet aan de nieuwe export eisen kon vol-doen. Hierdoor kwam de industrie hardhandig terecht in een handelscrisis: voor een langere periode werden de visverwerkingsfirma's uitgesloten van hun grootste en meest winstgevende exportmarkt. De export opbrengsten gingen omlaag in dezelfde periode waarin de opbrengsten van de traditionele goederenuitvoer (koffie in bijzon-der) ook omlaag gingen. De visverwerkingsfabrieken moesten gedwongen sluiten om te herstructureren. Banen gingen verloren en de visgemeenschappen verloren hun hoofdbron van levensonderhoud. Deze combinatie van factoren leidde tot een nieuwe type druk om technologische verbeteringen in te voeren. Als reactie hierop ontwik-kelde de visverwerking en export industrie van Oeganda met succes een aantal leer- en innovatieactiviteiten, en dit resulteerde in aanzienlijke opbrengsten voor de economie van Oeganda. De focus van deze thesis ligt op het verklaren van het ver-mogen van de visverwerkende en export industrie van Oeganda om te leren en te in-noveren in een typische omgeving van een ontwikkelingsland. Hoofdstuk 1 introduceert het onderwerp en de benadering van de studie, geeft een overzicht van de theoretische argumentatie en schetst de structuur van de studie. Hoofdstuk 2 gaat in op het analytische kader. Het begint met een overzicht van de theoretische en empirische literatuur en definieert een aantal belangrijke concepten. Het analytische kader voor deze studie is afkomstig van de literatuur over innovatie-systemen. Er is in het bijzonder gekozen voor een lijn van analyse die Mytelka (2003) “op sector-gebaseerde systemen” noemt. Het concept “instituties” is van centraal belang voor de analyse en is gedefinieerd als gemeenschappelijke gewoonten, rou-tines, gevestigde praktijken, regels of wetten die relaties en interactie tussen mensen regelen. De organisaties worden gezien als actoren, spelers of “formele structuren met een expliciet doel” zoals bedrijfsverenigingen, internationale ontwikkeling-sagentschappen, universiteiten en banken. Het kader van analyse dat in het tweede deel van hoofdstuk 2 wordt uitgewerkt is geïnspireerd op het werk van Edquist en Johnson (1997). Volgens deze auteurs, zijn: “... sommige organisaties direct verant-woordelijk voor het creëren van instellingen. Er zijn, bijvoorbeeld, speciale organisa-ties gericht op het zetten van standaarden die technische normen formuleren of bep-alen, welke instituties zijn, in onze betekenis van de term...” (pagina 60). In navolging hierop beschouwt onze studie normen en standaarden als onderdeel van het concept “institutions”. Een verandering in SPS normen vertegenwoordigt een “institutionele

192
verandering”. Ons theoretisch conceptualiseringsproces is ook beïnvloed door de in-stitutionele opvatting dat, omdat de markten in de praktijk worden institutioneel geor-ganiseerd en ingebed zijn, zij niet ook zuiver kunnen zijn. Deze studie gaat in op het concept van ‘veeleisende markten’ in termen van institu-tionele en innovatiesystemen, en claimt dat het verschil tussen veeleisende en minder veeleisende markten ligt in het evenwicht tussen wat Edquist en Johnson (1997) “harde” en “zachte” instellingen genoemd hebben, die transacties in die markten reguleren. In de context van de huidige studie, dienen de ‘harde’ instituties, zoals het strikte controleren van de EU SPS standaarden, om de kwaliteit van de vraag te ver-sterken, die daardoor de zwak geformuleerde vraag van gebruikers substitueert. Uit conceptuele overwegingen en met het oog op beleidsvorming moeten wij dergelijke normen bekijken als potentieel nuttige instellingen om de kwaliteit van markten te versterken. In het proces van het voldoen aan sterkere eisen van klanten maken pro-ducenten een eind aan oudere regels, gewoonten en praktijken die niet meer wenselijk kunnen zijn voor het leerproces en innovatie. Wij introduceren de term “institutionally augmented markets” om het fenomeen te beschrijven dat het gevolg is van de intro-ductie van gunstige praktijken, verordeningen en beleid en waarbij interactie dient om de kwaliteit van markten te verbeteren. Het theoretische terrein dat het vermogen van de visverwerkende industrie in Oeganda om te vernieuwen verklaart, bestaat uit vier subsystemen. De eerste van de vier is het zogeheten subsysteem op bedrijfsniveau De meeste overzichten van de sterke en zwakke punten van innovatiesystemen bevat-ten zelden een empirisch overzicht van bekwaamheden en factoren van invloed op bedrijfsniveau. Bovendien ontdekten we dat een gemeenschappelijke zwakheid van empirische studies naar bedrijfscapaciteit in ontwikkelingslanden is dat zij geen rekening houdt met de werkingen van het innovatiesysteem als geheel. Deze studie combineert beide benaderingen. De studie betoogt dat de integratie van de analytische benaderingen ontwikkeld voor gedrag en competenties op bedrijfsniveau in het onder-zoek naar innovatiesystemen een aanscherping van de analytische principes en het verklaringsvermogen de innovatiesystemen benadering mogelijk maakt. De andere drie belangrijke geïdentificeerde subsystemen zijn het subsysteem bemiddelende in-stellingen in markten, het systeem dat kennisgeneratie, toegankelijkheid en het leren, en het financiële subsysteem. Onze methodologie bestond uit het onderzoeken van vis- en andere voedselbereid-ingsfirma's in Oeganda in 2002 met de hulp van een vragenlijst. Het onderzoek om-vatte de volledige populatie van de verwerkingsfirma's van post-verbods-visverwerkingsbedrijven (9). Wij verkregen informatie over twee firma's die gesloten waren. Het Nijlbaars visserijsysteem werd geïdentificeerd als een systeem met “insti-tutionally augmented markets,” terwijl de industrieën van de controlegroep geïden-tificeerd werden als systemen zonder “institutionally augmented markets”. De contro-legroep bestond uit 48 firma's van de vlees-, fruit-, bakkerij, visbijproducten en graanverwerkende sectoren in Oeganda. De gegevens over deze 57 firma’s noemen we de voedselbereidings-dataset. Bij het gebruik van deze gegevens hebben we een regressieanalyse gedaan om de relatieve invloed van verschillende onafhankelijke variabelen op de intensiteit van innovatieactiviteiten (INNOVA) te schatten. Het laatstgenoemde is een samengestelde maat van innovatieactiviteiten die wij ontwik-kelden om onze analytische inspanning te helpen. INNOVA is onze afhankelijke vari-abele en de opbouw er van wordt uitgewerkt in hoofdstuk 4. Wij hebben ook re-gressies gedaan, gebruikmakend van gegevens verzameld door het Regional Program

193
on Enterprise Development (RPED) van de Wereldbank in Washington D.C. worden samengesteld. Dit was nodig om triangulatie te kunnen doen, om de data en de verkregen resultaten van onze kleine selectie (57 bedrijven in de voedselbereiding, met inbegrip van bedrijven in de visverwerking) met elkaar te vergelijken. De RPED selectie omvatte 300 firma's die 9 sectoren omvatten. Naast de assemblage van gegevens van het ondernemingsniveau werden informatie en geaggregeerde gegevens bijeengezocht uit drie subsystemen die als belangrijk bestempeld werden. Tijdens per-soonlijke interviews werden controlelijsten gebruikt voor de belangrijkste methode. Dit werk werd aangevuld door diepgaande analyses van 8 firma’s in de visverwerk-ing. Bovendien schakelden wij een commissie van 5 visserijwetenschappers in om de kwaliteit van innovatieactiviteiten geïntroduceerd door de visverwerkingfirma’s te evalueren. Wij ondekten dat vanaf 1997, de Europese Unie (EU) een reeks Sanitair en Phyto-Sanitary normen (SPS) aan de visexport van Oeganda oplegde en afdwong. Dit leidde tot een voorwaardelijk verbod van één van de belangrijkste export producten van Oe-ganda en een verdere crisis binnen de visverwerking en uitvoer industrie toen aan vereiste SPS vereisten niet kon worden voldaan. Als gevolg hiervan begon de vis-verwerking en export industrie van Oeganda met succes aan leer- en innovatieac-tiviteiten. Deze waren niet radicaal maar hadden een essentiële invloed op de econo-mie van Oeganda. Wij relateerden deze verhoging van de exportwaarden aan de herin-troductie van veeleisende, maar hoogwaardige markten. Herintreding was slechts mogelijk na verwezenlijking en certificatie van verbeteringen die door de Europese Commissie worden gespecificeerd. Het proces om deze verbeteringen uit te voeren betekende technologische verandering, leren en innovatie. In de analyse die in Hoofdstuk 4 wordt uitgevoerd en de diepgaande case studies in hoofdstuk 5 vinden wij redelijk bewijsmateriaal om de stelling te steunen dat het het scholingsniveau van de arbeiders, de grootte van de firma, de toegang tot technische bijstand, de oriëntatie op de export markt en een aantal financiële variabelen belangrijk zijn voor het innova-tieproces. De rentedragende en niet-rentedragende financiën zijn beide belangrijk en zijn complementair; wat van belang is, is dat een bedrijf beide soorten financiering goed in evenwicht houdt. De etniciteit variabele vertoonde enige variatie in INNOVA in de steekproef van de voedselverwerkende industrie, maar had bijna geen waarn-eembaar effect in de RFED steekproef. In de dataset van de voedselbereidende industrie was de voorspelde waarschi-jnlijkheid van INNOVA het hoogst voor de visverwerkende en export industrie. Ge-baseerd op de casestudies uitgewerkt in hoofdstuk 5 en op de bespreking in de hoofdstukken 6 en 7, schrijven wij het vermogen van het de visserijsysteem van de Nijlbaars in Oeganda tot leer- en innovatieprocessen toe aan de interactie tussen insti-tutionele en organisatorische veranderingen in een aantal subsystemen. Het gaat daar-bij om het subsysteem van intermediërende markt instituties, het subsysteem van ken-nisdistributie en coördinatie, sector-gebaseerd beleid, en tot op zekere hoogte het fi-nanciële subsysteem waar bepaalde institutionele veranderingen plaatsvonden, naast een aantal factoren op bedrijfsniveau. De totstandkoming van kennisstromen, steun-structuren en interrelaties was essentieel voor het vermogen van bedrijven in de vis-verwerking en export om innovatieve verandering met succes te introduceren. Wij concluderen daarom dat de succesvolle introductie van innovatieve activiteit afhangt van de mate waarin de opmaak en dynamiek van verschillende subsysemen in het ondersteuningssysteem (met inbegrip van instellingen op bedrijfsniveau) elkaar

194
dichter bij elkaar brengen. Deze interactie van factoren ontbrak binnen de controle-groep. De studie weerlegt het idee van innovatie als lineair proces dat door het aanbod van onderzoek en ontwikkeling (R&D) wordt aangestuurd. In het geval van de Nijlbaars verwerkende industrie in Oeganda werd het technologische leren en de algemene ver-betering gedicteerd door institutionele veranderingen in het internationale handelmi-lieu, en vergemakkelijkt door institutionele en organisatorische verbeteringen en de interactieve verhoudingen die in het systeem werden geïntroduceerd. In de visserij sector kwam technologische verandering niet vanzelf tot stand door onzichtbare marktinvloeden. De druk en urgentie om de lange traditie van het in-houden van investering in lokale technologische verandering te overwinnen kwamen voort uit de handhaving van EU richtlijn 91/493/EEC. Normen en standaarden oe-fenden grote druk uit om te verbeteren, en stimuleerden de opkomst van een beter ondersteuningssysteem. De ondersteuningsstructuur bestond uit een gezamenlijke in-spanning van de overheid, de internationale ontwikkelingsagentschappen, de indus-trievereniging, sommige kopers, en lokale en buitenlandse privé firma's. De overheid speelde een centrale rol in het laten doorwerken van de druk op firma's om normen te handhaven. Desalniettemin was de respons reactief en niet deel van een goed ge-coördineerd pro-actief openbaar beleid om de achterstand op technologische normen van ontwikkelde landen in te lopen of ze voorbij te streven. Vandaar dat er een aantal verbeteringen in de industrie ontstonden, maar kritieke verbindingen en verdere structurele verbeteringen werden niet geïntroduceerd. Het is mogelijk dat zonder goed-gerichte aansporingen, voortdurende druk, en openbare steun, de impuls voor technologische verandering in de industrie in de loop van de tijd simpelweg zal eroderen. De instellingen die de financiële diensten regelen die door en via het non-banking sys-teem van Oeganda worden verleend zijn verbeterd, maar slechts minimaal met be-trekking tot de het leren en de innovatiebehoeften van firma's. Met steun van ontwik-kelingspartners zullen de geldschieters nog het juiste institutionele klimaat moeten scheppen voor het ontwikkelen van risico en kostenverdelingsverhoudingen. Hiervoor zullen nieuwe vormen van samenwerking nodig zijn. Één van de bijdragen van deze studie is het verhelderen van de belangrijke bijdrage die normen en standaarden aan het innovatieproces kunnen geven, vooral in een om-geving zoals in een ontwikkelingsland. In het overzicht gegeven in hoofdstuk 2 werd opgemerkt dat de literatuur vaak twee tegengestelde perspectieven op standaarden en handel in ontwikkelingslanden biedt. Terwijl het grootste deel van de literatuur “stan-daarden als handelsbelemmeringen” ziet, komen in het alternatieve perspectief "stan-daarden als katalysatoren" uit projecten te voorschijn (Jaffee en Henson 2004). De huidige studie biedt een veel breder perspectief op normen en standaarden. Wij bekeken normen en standaarden vanuit een institutioneel perspectief en betogen ook dat de standaarden niet alleen een kwestie zijn van het onvermogen van de markt om zich effectief te richten op het vergemakkelijken van informatiestromen. Het is niet (alleen) een kwestie van ‘non-tariff’ handelsbelemmeringen, hoewel standaarden ge-bruikt zijn en kunnen worden om protectionistische doelstellingen te dienen. De stel-ling in deze studie is dat standaarden de kwaliteit van vraag vergroten waardoor mark-ten veeleisender worden. Ze oefenen bovendien druk uit op producenten om ver-

195
ouderde en ongeschikte arbeidspraktijken te beëindigen. Het onderzoek heeft echter de aandacht op de averechtse gevolgen van het opleggen van stijve en onbuigbare verordeningen gevestigd (Yarime 2003). Beleidsvorming zou duidelijk andere, meer subtiele manieren moeten aanmoedigen om leer- en innovatieprocessen te bevorderen, maar daarnaast suggereert deze studie een rol voor de handhaving van innovatie-verbeterende normen en standaarden. Wij zijn niet de eersten om uit te gaan van een veeleisende markthypothese als factor voor technologische verandering en innovatie. Het verhaal dat wij verteld hebben heeft schijnbaar overeenkomsten met de veeleisende markthypothesen die reeds in de tachtiger jaren door Walker, Keith Pavitt en anderen werden opgesteld met betrekking tot de zwakke innovatie prestaties van Groot-Brittannië en haar verlies van industriële vitaliteit tijdens periode 1850-1950. Op dezelfde manier richt Westphal (2000) zich op het belang van krachtigere marktdruk in exportmarkten als factor voor de ontwik-keling van technologische capabiliteit. Porter (1990) beklemtoonde ook het karakter van de vraag als één van de belangrijke factoren voor concurrentievermogen. De his-torische antecedenten van ons verhaal konden worden teruggevonden in deze en ver-wante varianten van de veeleisende marktenhypothesen. De ideeën die in dit volume worden ontwikkeld stellen echter een enigszins verschillende, systemische variant van de veeleisende marktenhypothese voor. Zoals eerder vermeld vinden wij dat harde normen en standaarden kunnen bijdragen om markten veeleisend te maken. Aan de aanbod-kant leidt de druk die op producenten wordt uitgeoefend tot het beëindigen van oudere arbeidspraktijken, aannames en illusies (instituties) die moeilijk te beëin-digen zouden zijn in afwezigheid van een dergelijke efficiënte druk en prikkels voor verandering. Deze studie heeft ook aangetoond dat de harde normen en standaarden veranderingen in het onderssteunningssysteem kunnen stimuleren. Wij kennen een rol toe aan normen en standaarden bij het opbouwen van innovatiesystemen. Oeganda moet het belang van innovatie meer en scherper erkennen als een zeer belangrijke drijver van economische groei en ontwikkeling. Publieke instellingen spe-len een belangrijke rol bij het bevorderen van de vereiste interactie van factoren en bij het zorgen voor verspreiding en adoptie van de voordelen door andere sectorale inno-vatiesystemen. In Oeganda kan dit de effectieve delegatie van bevoegdheden aan één of andere vorm van hoog-geprofileerde bevoegde instantie inhouden - misschien de geherstructureerde Nationale Raad voor de Wetenschap en Technologie van Oeganda, die nauwer samen zou moeten werken met de onlangs opgerichte Nationale Plannende Instantie (NPA). De opdracht zou moeten zijn nationale en op sector-gebaseerde sys-temen van innovatie te coördineren, ontwikkelen en versterken. Deze thesis levert een bijdrage aan het groeiende assortiment van ideeën over hoe het innovatieproces in de context van een ontwikkelingsland kan worden bevorderd en ondersteund.

196

197
Appendix 1: Description of the data
Food- processing dataset (2002) RPED Uganda dataset (2002)
Firm Characteristics Total Observations=57 %
Total Observations=300 % of sample
1. Firm Size (No. of workers: 2001)
Large (>100) 11 19.3 32 10.7 Medium (51-100) 7 12.3 21 7.0 Small (10-50) 17 29.8 123 41.0 Micro (<10) 22 38.6 116 38.7
Data unavailable 2.6 2. Age88 (mean)
10 years 13 years
3. Ownership Local 47 82.5 238 79.3 Foreign 10 17.5 62 20.7
4. Highest education level of workers
76-99% of workers had primary or lower sec-ondary education (only O-Levels89)
51-75% of workers had only lower secondary schooling
5. Highest education level of owners
In 70% of firms, high-est level of education was only A-levels90
6. Market orientation Domestic 35 61 240 80.0 Exports 22 39 60 20.0
7. Export Intensity (over 50% of sales revenue is from exports)
n.a. 29 firms 9.7
8. Export experience (years) n.a. 1.5 9. Export destination to demand-
ing Western markets EU : 9 firms USA : 4 firms
15. 8 6.9
West Europe & North America:14 firms
5% sold 50-100% of their ex-ports to these mar-kets
88 Since set-up in Uganda. Age refers to age of establishment interviewed. Age of parent, where differ-ent, is not reported in this table
89 Ordinary level secondary education 90 Advanced level secondary education
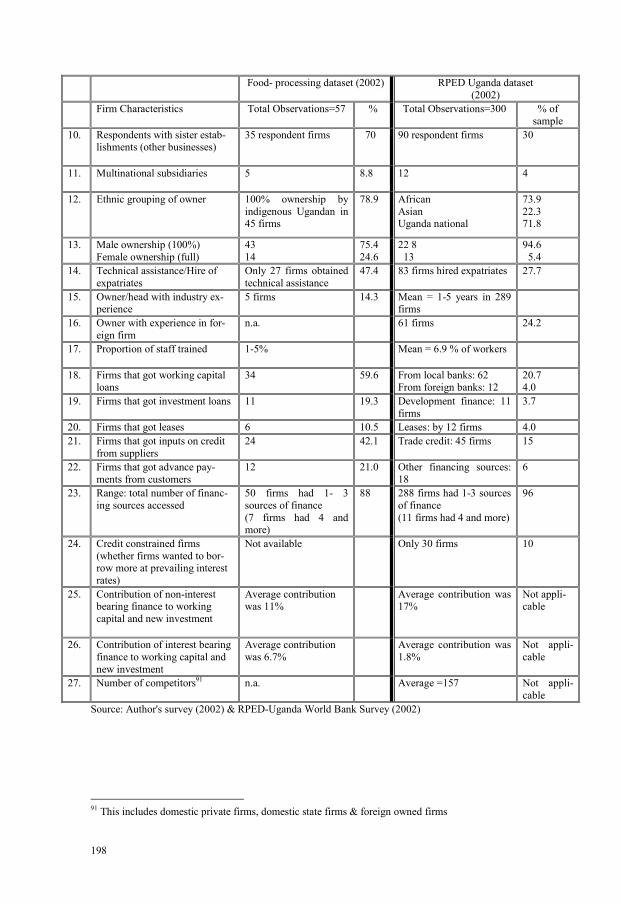
198
Food- processing dataset (2002) RPED Uganda dataset (2002)
Firm Characteristics Total Observations=57 %
Total Observations=300 % of sample
10. Respondents with sister estab-lishments (other businesses)
35 respondent firms
70 90 respondent firms 30
11. Multinational subsidiaries
5 8.8 12 4
12. Ethnic grouping of owner 100% ownership by indigenous Ugandan in 45 firms
78.9 African Asian Uganda national
73.9 22.3 71.8
13. Male ownership (100%) Female ownership (full)
43 14
75.4 24.6
22 8 13
94.6 5.4
14. Technical assistance/Hire of expatriates
Only 27 firms obtained technical assistance
47.4 83 firms hired expatriates 27.7
15. Owner/head with industry ex-perience
5 firms 14.3 Mean = 1-5 years in 289 firms
16. Owner with experience in for-eign firm
n.a. 61 firms 24.2
17. Proportion of staff trained
1-5%
Mean = 6.9 % of workers
18. Firms that got working capital loans
34 59.6 From local banks: 62 From foreign banks: 12
20.7 4.0
19. Firms that got investment loans 11 19.3 Development finance: 11 firms
3.7
20. Firms that got leases 6 10.5 Leases: by 12 firms 4.0 21. Firms that got inputs on credit
from suppliers 24 42.1 Trade credit: 45 firms 15
22. Firms that got advance pay-ments from customers
12 21.0 Other financing sources: 18
6
23. Range: total number of financ-ing sources accessed
50 firms had 1- 3 sources of finance (7 firms had 4 and more)
88 288 firms had 1-3 sources of finance (11 firms had 4 and more)
96
24. Credit constrained firms (whether firms wanted to bor-row more at prevailing interest rates)
Not available Only 30 firms 10
25. Contribution of non-interest bearing finance to working capital and new investment
Average contribution was 11%
Average contribution was 17%
Not appli-cable
26. Contribution of interest bearing finance to working capital and new investment
Average contribution was 6.7%
Average contribution was 1.8%
Not appli-cable
27. Number of competitors91
n.a. Average =157 Not appli-cable
Source: Author's survey (2002) & RPED-Uganda World Bank Survey (2002)
91 This includes domestic private firms, domestic state firms & foreign owned firms

199
References
Andersen, E.S. and Lundvall, B.A. (1997). “National Innovation Systems and the Dynamics of the Di-vision of Labour”, in Edquist, C. (ed.), Systems of Innovation: Technologies, Institutions and Or-ganizations, London, Pinter
Arrow, K. (1962). “The Economic Implications of Learning by Doing”, Review of Economic Studies, XXIX (80)
Arocena, R., Sutz, J. (2000). “Interactive Learning Spaces and Development Policies in Latin Amer-ica”, DRUID Working Paper 00-13, Department of Business Studies, Aalborg, Denmark
Aryeetey, E.and Udry, C. (1997). “The Characteristics of Informal Financial Markets in Sub-Saharan Africa”, Journal of African Economies, Supplement to Vol. 6 (1), 161-203
Bank of Uganda, (1998). “Investment Term Credit Refinance Fund (ITCRF), Monitoring Report, Sep-tember 1998”,Report. Development Finance Division, Bank of Uganda
Bank of Uganda, (1993). “Investment Term Credit Refinance Fund & Credit Guarantee Fund Circular”. Report. Development Finance Division, Bank of Uganda
Bell, R.M. (1984). “Learning and the Accumulation of Industrial Technological Capability in Develop-ing Countries”, in Fransman, M. & King K.(eds.) Technological Capability in the Third World, London, Macmillan
Bell, R.M. and Pavitt, K. (1993). “Accumulating Technological Capability in Developing Countries”, Industrial and Corporate Change 2 (2)
Bhatt, V.V, (1995). Financial Systems, Innovations and Development, Sage Publications, New Delhi/Thousand Oaks/London
Biggs, T.S. (1991). "Heterogeneous Firms and Efficient Financial Intermediation in Taiwan”, in Roe-mer, M. and Jones, C. (eds.), Developing Countries: Parallel, Fragmented and Black, Interna-tional Center for Economic Growth, San Francisco pp. 167-97
Biggs, T., Manju Shah, M., and Pradeep Srivastava, P. (1995). “Technological Capabilities and Learn-ing Mechanisms in African Enterprises”, AFT Technical Paper no. 288 The World Bank, Wash-ington D.C.
Biggs T., and Srivastava, P. (1996). “Structural Aspects of Manufacturing in Sub-Saharan Africa: Find-ings from a Seven Country Enterprise Survey”, AFT Discussion Paper no.346, The World Bank, Washington D.C.
Biggs, T. and Raturi, M. (1997). “Productivity and Competitiveness of African Manufacturing”, RPED Paper no. 080, The World Bank, Washington D.C.
Bigsten, A. (2000). "Globalization and Income Inequality in Uganda: Poverty and Income Inequality in Developing Countries", Paper written for the Conference on A Policy Dialogue on the Effects of Globalization, 30 November-1 December 2000, OECD Paris
Bigsten, A. and Kayizzi-Mugerwa, S. (1999). Crisis, Adjustment and Growth in Uganda: A Study of Adaptation in an African Economy, New York, St. Martin's Press
Brownbridge, M. and Harvey C. (1998). Banking in Africa, Oxford, James Currey
Center for the Development of Industry (CDI), (1996). "Lake Fishing in Uganda, The Nile Perch Dos-sier Nr. 1", CDI, Brussels
Chema, S., Gilbert, E., Roseboom, J. (2003). Report. “A Review of Key Issues and Recent Experiences in Reforming Agricultural Research. ISNAR Research Report 24”. The Hague: ISNAR, (also available at www.isnar.cgiar.org/publications/catalog/rr.htm)

200
Christensen, J.L. (1992). “The Role of Finance in National Systems of Innovation”, in Lundvall, B.A. (ed.), National Systems of Innovation: Towards a Theory of Innovation and Interactive Learning, London, Pinter
Coase, R. (1988). The Firm, the Market and the Law, Chicago and London, University of Chicago Press
Cohen, W. & Levinthal, D. (1989). “Innovation and Learning: The Two Faces of R&D”, Economic Journal, 99(397): 569-570
Dalum, B., Johnson, B. and Lundvall, B.A. (1992). “Public Policy in the Learning Society” in Lund-vall, B.A. (ed.), National Systems of Innovation: Towards a Theory of Innovation and Interactive Learning, London, Pinter
Deloitte & Touche Tohmatsu, (1999). “Investment Term Credit Refinance Fund (ITCRF), Implementa-tion Completion Review Final Report”, Report. Development Finance Division, Bank of Uganda
David, P and Foray D. (1995). “Assessing and Expanding the Science and Technology Knowledge Base”, STI Review, 16:13-68
Deraniyagala, S. (1994). “Technical Change and Efficiency in Sri Lanka’s Manufacturing Sector”, Ph.D. Thesis, Oxford, Oxford University
Deraniyagala, S. and Semboja, H. (1999). “Trade Liberalization, Firm Performance and Technology Upgrading in Tanzania” in Lall, S. (ed.), The Technological Response to Import Liberalization in sub-Saharan Africa, London: Macmillan.
Development Consultants International (DCI) in association with IDC and Incafex Consultants Ltd. (1999). "Uganda Fisheries Master Plan Study", Report. Ministry of Agriculture, Animal Industry and Fisheries (MAAIF), Republic of Uganda
Department of Fisheries Resources (DFR), (2000). "Manual of Standard Operating Procedures for Fish Inspection and Quality Assurance", Ministry of Agriculture, Animal Industry and Fisheries (MAAIF), Republic of Uganda
Dhatemwa, C. M. (1999). “Harmonization of the Roles and Regulations of the Fishery Industry in Uganda”, Report. The United Nations, Food and Agricultural Organization (FAO)/Government of Uganda
Dolan C., Humphrey J., and Harris-Pascal, C. (1999). "Horticulture Commodity Chains: The impact of the UK market on the African fresh vegetable industry", IDS Working Paper 96, Brighton: Insti-tute of Development Studies, University of Sussex
Dosi, G. and Orsenigo, L. “Coordination and transformation: an overview of structures, behaviours and change in evolutionary environments,” in Dosi, G., Freeman, C., Nelson, R., Silverberg, G. and Soete, L. (eds.) (1988).Technical Change and Economic Theory, London, Pinter
EASTFISH and SIPPO, (2000). Guide to Hygiene within the Fish Industry, Fachpresse Verlag, Ham-burg Germany
Ecaat, J. and Odong, I. (1999). "Investigating Quality Control Issues in the Fisheries Sector" in Ba-hiigwa, G. and Muramira, E. (eds.), Capacity Building for Integrating Environmental Considera-tions in Development Planning and Decision-Making with particular reference to The Fishing In-
dustry in Uganda, Economic Policy Research Center (EPRC), Kampala, Uganda
Edquist, C. (1995). “Government technology procurement as an instrument of technology policy”, in Teubal, M, Foray, D., Justman, M and Zuscovitch (eds.), Technological Infrastructure Policy (TIP): An International Perspective, Dordrecht/Boston/London, Kluwer
Edquist, C. (1997). “Introduction” in Edquist, C. (ed.), Systems of Innovation, Technologies, Institu-tions and Organizations. London, Pinter
Edquist, C. and Johnson, B. (1997). “Institutions and Organizations in Systems of Innovation” in Ed-quist, C. (ed.) Systems of Innovation, Technologies, Institutions and Organizations. London, Pin-ter
Ernst, D., Ganiatsos, T. and Mytelka, L. (eds.) (1998). Technological Capabilities and Export Success in Asia, Routledge, London for the United Nations-UNCTAD

201
European Union, Council Directive 91/493/EEC, "Laying Down the Health Conditions for the Produc-tion and the Placing on the Market of Fishery Products, 22 July 1991”, Official Journal L 268, 24/09/1991 P. 0015 - 0034, EU, Brussels
Fransman, M. and King, K. (eds.) (1984). Technological Capability in The Third World, London, Macmillan
Freeman, C. (1987). Technology and Economic Performance: Lessons from Japan, London, Pinter
Freeman, C. (1988). “Japan: a new national system of innovation?” in Dosi, G., Freeman, C., Nelson, R., Silverberg, G., and Soete, L. (eds.), Technical Change and Economic Theory, London: Pinter
Freeman, C. and Soete L. (1997). Economics of Industrial Innovation, London, Pinter
Frielink, A.B. (1990). Report. "Fisheries Development in Uganda", EuroConsult for Artisanal Fisheries Rehabilitation Project, Ministry of Agriculture, Animal Industry and Fisheries (MAAIF), Repub-lic of Uganda
Fuller, D.B., Akinwande, A.I. and Sodini, C.G. (2003). “Leading, Following or Cooked Goose? Inno-vation Successes and Failures in Taiwan's Electronics Industry”, Industry and Innovation 10 (2):179
Geheb, K. (1997). “The regulators and the regulated: fisheries management, options and dynamics in Kenya's Lake Victoria Fishery”. Unpublished D.Phil. Thesis, University of Sussex, Falmer, Brighton, U.K. Reprinted as LVFRP Technical Document No. 10. LVFRP/TECH/00/10. The Socio-economic Data Working Group of the Lake Victoria Fisheries Research Project, Jinja
Gereffi, G. (1994). "The Organization of Buyer-Driven Global Commodity Chains: How US Retailers Shape Overseas Production Networks", in Gereffi, G. and Korzeniewicz, M. (eds.), Commodity Chains and Global Capitalism, London, Praeger
Graham, M. (1929). A Report on the Fishing Survey of Lake Victoria 1927-1928, and Appendices, London SW1, Crown Agents for the Colonies, Millbank
Green, C., Kimuyu, P., Manos, R. and Murinde, V. (2002). “How do Small Firms in Developing Coun-tries Raise Capital? Evidence from a Large-Scale Survey of Kenyan Micro and Small Scale En-terprise”, Economic Research Paper No. 02/6, Department of Economics, Loughborough Univer-sity. Internet: available at http://www.lboro.ac.uk/departments/ec/Reasearchpapers/2002/6-02/erp02-6.pdf
Greene, W. (1993). Econometric Analysis, Second Edition, New York, Macmillan
Gregersen, B. (1992). “The Public Sector as a Pacer in National Systems of Innovation” in Lundvall, B.A (ed.), National Systems of Innovation: Towards a Theory of Innovation and Interactive Learning, London, Pinter
Gujarati, D. (1995). Basic Econometrics, Third Edition, New York, McGraw-Hill
Hall, A. (2004). "Elements of an Agricultural Innovation System", United Nations University-Institute for New Technologies (UNU-INTECH)/Technical Centre for Agricultural and Rural Co-operation ACP-EU (CTA) workshop 8-14 February, 2004, UNU-INTECH, Maastricht, The Netherlands
Hall, A., Sivamohan, M., Clark, N., Taylor, S., and Bockett, G. (2001). "Why Research Partnerships Really Matter: Innovation Theory, Institutional Arrangements and Implications for Developing New Technology for the Poor", World Development 29(5): 783 – 797.
Hall A. and Sulaiman R. (2002). “Application of the innovation systems framework in North-South research”, The International Journal of Technology Management & Sustainable Development 1 (3): 182-195
Hall, A., Yoganand, B., Sulaiman, R., and Clark, N. (eds.) (2003). “Post-harvest innovations in innova-tion: reflections on partnership and learning”, The Department for International Development (DFID) Crop Post-Harvest Programme (CPHP), South Asia, c/o International Crops Research In-stitute for the Semi-Arid Tropics (ICRISAT), India and Natural Resources International, Kent, UK
Helmsing, B. (2001). “The Importance of Innovation for Small Enterprise Development” in Van Dijk, P, Sandee, H. (eds.), The Importance of Innovation for Small Enterprise Development, Edgar Ellen
202
Hulme, D. and Mosley, P. (1996). Finance against Poverty, Volume 1: Analysis and Recommendations, London, Routledge
Henson, S. and Mitullah, W. (2004). "Kenyan Exports of Nile Perch: The Impact of Food Safety Stan-dards on an Export-Oriented Supply Chain", World Bank Policy Research Working Paper 3349, The World Bank, Washington DC
Holmgren, T., Kasekende, L., Atingi-Ego, M., Ddamulira, D. (2001). "Aid and Reform in Uganda" in Shantayanan Devarajan, David R. Dollar, Torgny Holmgren (eds.), Aid in Africa, The World Bank, Washington, D.C: 101-163
Humphrey, J. and Schmitz, H. (2000). "Governance and Upgrading: Linking Industrial Cluster and Global Value Chain Research", IDS Working Paper 120, Brighton: Institute of Development Studies, University of Sussex
Iversen E. (2000). “Raising Standards: Innovation and the Emerging Global Standardization Environ-ment for ICT”, STEP Working Paper ISSN 1501-0066, Studies in Technology, Innovation and Economic Policy (STEP), Oslo Norway
Jaffee and Henson, (2004). “ Standards and Agro-Food Exports from Developing Countries, Rebalanc-ing the Debate”, Policy Research Working Paper 3348, The World Bank, Washington D.C.
James, J and Romijn, H. (1997). “The Determinants of Technological Capability: A Cross-Country Analysis”, Oxford Development Studies, 25(2)
Kaelin, A., Cowx, I. (2002). Report. "Outline of the Path Forward in Uganda's Fisheries Sector". Paper prepared for the Presidential Conference on Export Competitiveness February 12, 2002 by An-drew J. Kaelin, The COMPETE Project (USAID); Ian G. Cowx, on behalf of the European Com-mission. Internet: available at www.usaid.or.ug
Kaplinsky, R. and Morris, M.(2003). "A Handbook for Value Chain Research," prepared for the Inter-national Development Research Center (IDRC). Internet: available at www.ids.ac.uk/ids/global
Kasekende, L. & Ssemogerere, G. (1994). "Exchange Rate Unification and Economic Development: The Case of Uganda, 1987-92", World Development, 22 (8), 1183-1198
Khunder, N. (1989). “Technology Adaptation and Innovations in the Informal Sector of Dhaka, Bang-ladesh”, World Employment Research Working Paper, ILO, Geneva
Kiggundu, R. (2004). "Learning to Change: Why the fish processing clusters in Uganda learned to up-grade" in Oyelaran-Oyeyinka, B. and McCormick, D.(eds.) (forthcoming). The African Cluster: Pattern, Practice, and Policies for Upgrading, UNU Press
Lall, S. (1987). Learning to Industrialize. The Acquisition of Technological Capability by India, Lon-don, Macmillan
Lall, S. (1992). "Technological Capabilities and Industrialization", World Development, 20(2): 165-186
Lall, S., (ed.) (1999). The Technological Response to Import Liberalization in Sub-Saharan Africa, London, Macmillan, for the United Nations University, INTECH
Langdon, S. (1982). “Indigenous Technological Capacity in Africa: The Case of Textiles and Wood Products in Kenya”, International workshop on Facilitating Indigenous Technological Capacity, May 1982, Center of African Studies, Edinburgh University, Edinburgh
Latsch, W. and Robinson, P. (1999). “Technology and the Responses of Firms to Adjustment in Zim-babwe”, in Lall, S. (ed.), The Technological Response to Import Liberalization in sub-Saharan Africa, London: Macmillan
Lundvall, B.A. (1988). "Innovation as an Interactive Process: From User-Producer Interaction to the National System of Innovation," in Dosi, G., Freeman, C., Nelson, R., Silverberg, G., and Soete, L. (eds.), Technical Change and Economic Theory, London: Pinter
Lundvall, B.A. (ed.) (1992). National Systems of Innovation: Towards a Theory of Innovation and In-teractive Learning, London, Pinter
Lundvall, B. A. (1996). “The Social Dimension of the Learning Economy”, Danish Research Unit for Industrial Dynamics (DRUID) Working Paper No. 96-1
Malerba, F., (1992). “Learning by Firm and Incremental Technical Change”, Economic Journal, 102

203
McCormick, D. (1999). "African Enterprise Clusters and Industrialization: Theory and Reality", World Development, 27(9):1531-1551
Metcalfe, S. (1995). “The Economic Foundations of Technology Policy: Equilibrium and Evolutionary Perspectives”, in Stoneman, P., Handbook of the Economics of Innovation and Technological Change, Oxford, UK: Blackwell
Ministry of Finance, Planning and Economic Development (MFPED) (2000). Report. "Medium-Term Competitiveness Strategy for the Private Sector 2000-2005", The Republic of Uganda
Ministry of Finance, Planning and Economic Development (MFPED), Statistical Abstracts 1996; 1999; 2000; 2001; 2002, Uganda Bureau of Statistics, The Republic of Uganda
Ministry of Finance, Planning and Economic Development (MFPED) and Ministry of Agriculture, Animal Industry and Fisheries (MAAIF) (2001). Report. “Government Interventions to Promote Production, Processing and Marketing of Selected Strategic Exports", The Republic of Uganda
Ministry of Finance, Planning and Economic Development (MFPED), (1999). Background to the Budget 1999/2000: The Challenges of Poverty Eradication and Private Sector Development, The Republic of Uganda
Ministry of Finance, Planning and Economic Development (MFPED), (2000). Background to the Budget 2000/2001: Increasing Efficiency in Poverty Reduction Service delivery through Output Oriented Budgeting, The Republic of Uganda
Mitullah, W. (1999). "Lake Victoria's Nile Perch Fish Cluster: Institutions, Politics and Joint Action", IDS Working Paper 87, Brighton: Institute of Development Studies, University of Sussex
Morrissey, O. and Rudaheranwa, N. (1998). "Ugandan Trade Policy and Export Performance in the 1990s", Research Paper No. 98/12, Centre for Research in Economic Development and Interna-tional Trade (CREDIT), University of Nottingham, UK
Mytelka, L. (1985). “Stimulating Technology Transfer: The case of textiles in Africa” in: Rosenberg, N. and Frischtak, C. (eds.), International Technology Transfer, Concepts, Measures and Com-parisons, Praeger, New York, 77-126
Mytelka, L. (1992). “Ivorian industry at the Cross-roads”, in Stewart F., Lall, S., Wangwe S. (eds.), Alternative Development Strategies in sub-Saharan Africa, London, Macmillan
Mytelka, L. (1996a). “Competition, Innovation and Competitiveness: a framework for analysis”, in Mytelka (ed.) Competition, Innovation and Competitiveness in Developing Countries, OECD De-velopment Center, Paris
Mytelka, L., and Tesfachew, T. (2000). “The Role of Policy in promoting enterprise learning during early Industrialisation: Lessons for African Countries”, Cambridge Journal of Economics
Mytelka, L. (2000). "Local Systems of Innovation in a Globalized World Economy", Industry and In-novation, 7(1):15-32
Mytelka, L. (2003). "The Dynamics of Catching Up. The Relevance of an Innovation System Approach in Africa", in Muchie, M., Gammeltoft, P., Lundvall, B.A. (eds.), Putting Africa First, The Mak-ing of African Innovation Systems, Aalborg University Press, Aalborg, Denmark
Mytelka, L. (2004). "Methodology Notes, Agricultural Innovation Systems in ACP countries" United Nations University-Institute for New Technologies(UNU-INTECH)/Technical Centre for Agricul-tural and Rural Co-operation ACP-EU (CTA) workshop 8-14 February, 2004, UNU-INTECH, Maastricht, The Netherlands
Mugume, A. and Obwona, M. (2001). “Credit Accessibility and Investment Decisions in Uganda’s Manufacturing Sector: An Empirical Investigation”, Economic Policy Research Center (EPRC), Research Series No. 27, Kampala, Uganda
Namisi, P. (2000). "Socio-economic implications of the fish export trade on the fishers and fisheries of Lake Victoria in Uganda", Unpublished Masters dissertation submitted to National University of Ireland, Cork. Published as: Namisi, P.W., 2001, Socio-economic implications of the fish export trade on the fishers and fisheries of Lake Victoria in Uganda. LVFRP Technical Document No.14. LVFRP/TECH/01/14. Jinja, Socio-economic Data Working Group of the Lake Victoria Fisheries Research Project.

204
Narula, R. (2004). “Understanding absorptive capacities in an ‘innovation systems’ context: conse-quences for economic and employment growth”, MERIT-Infonomics Research Memorandum Se-ries 2004-003, Maastricht Economic Research Institute on Innovation and Technology (MERIT), Maastricht, The Netherlands
Nathan Associates Inc (1998). Report. "Restrictions on Uganda’s Fish Exports to the European Un-ion(EU)" USAID-PSF Trade Policy Capacity Building Project, United States Agency for Interna-tional Development/Private Sector Foundation, Kampala, Uganda
Nelson, R. and Winter, S. (1977). “In search of Useful Theory of Innovation”, Research Policy, 36-76
Nelson R. and Winter, S. (1982). An Evolutionary Theory of Economic Change, Cambridge, Harvard University Press
Nelson, R. (ed.) (1993). National Innovation Systems: A Comparative Analysis, Oxford, Oxford Uni-versity Press
Nelson, R. and Rosenberg, N. (1993). “Technical innovation and national systems”, in Nelson, R. (ed.), National Systems of Innovation: A Comparative Study, Oxford, Oxford University Press
Ngahu, C. (1999). “Technological Innovations used to overcome the problem of Resource Scarcity in Small-Scale Enterprises: Implications for Policy”, Africa Technology Policy Studies (ATPS) Working paper no. 12, Nairobi, Kenya
Nissanke, M. (1998). “Financing Enterprise Development and Export Diversification in Sub-Saharan Africa”, UNCTAD Special Studies No. 8
Nissanke, M. and Aryeetey, E. (1998). Financial Integration and Development; Liberalization and Re-form in sub-Saharan Africa, Routledge, London
North, D. (1990). Institutions, Institutional Change and Economic Performance, Cambridge, Cam-bridge University Press
North, D. (1991). “Institutions”, Journal of Economic Perspectives, 5(1):97-112
Nsimbe-Bulega and Wadanya, J. (1999). "Fish Processing for Export and Utilization of By-Products" in Bahiigwa, G. and Muramira, E.(eds.), Capacity Building for Integrating Environmental Con-siderations in Development Planning and Decision-Making with particular reference to The Fish-ing Industry in Uganda, Economic Policy Research Center (EPRC), Kampala Uganda: 48-57
Nsimbe-Bulega and Akankwasa, A. (2002). Report. "The Status of The Nile Perch Fishery and the Po-tential for Production and Marketing of Nile Perch Value Added Products in Uganda", CFC/FAO/COMESA Project on The Production and Marketing of Value-Added Fishery Products in East and Southern Africa Phase I: Uganda Country Report, Lake Victoria Fisheries Organiza-tion (LVFO), Jinja, Uganda
Ogutu-Ohwayo, R. (1999). "The Impact of Nile Perch Harvesting on Fish and Fisheries in Uganda" in Bahiigwa, G. and Muramira, E.(eds.), Capacity Building for Integrating Environmental Consid-erations in Development Planning and Decision-Making with particular reference to The Fishing Industry in Uganda, Economic Policy Research Center (EPRC), Kampala Uganda: 27-47
Oyelaran-Oyeyinka B., Laditan, G.O.A. and Esubiyi, A.O. (1996). “Industrial Innovation in Sub-Saharan Africa: the Manufacturing Sector in Nigeria”, Research Policy 25: 1081-1096
Oyelaran-Oyeyinka, B. (1997a). "Technological Learning in African Industry: A study of Engineering Firms in Nigeria", Science and Public Policy, 24(5): 289-364
Oyelaran-Oyeyinka, B. (1997b). “Nnewi: An Emergent Industrial Cluster in Nigeria”, Technopole Pub-lishers, Ibadan, Nigeria
Oyelaran-Oyeyinka, B. (2000). “Technology and Institutions for Private Small and Medium Firms: The Engineering Industry in Nigeria”, ATPS Working Paper 15, African Technology Policy Studies, Nairobi, Kenya
Oyelaran-Oyeyinka, B. (2003). “Human Capital and Systems of Innovation in Africa” in Muchie, M., Gammeltoft, P., Lundvall, B.A. (eds.), Putting Africa First, The Making of African Innovation Systems, Aalborg University Press, Aalborg, Denmark
Pavitt, K. (ed.) (1980). Technical Innovation and British Economic Performance, London, Macmillan

205
Pavitt, K. (1984). “Sectoral Patterns of Technical Change: Towards Taxonomy and a Theory”, Re-search Policy 13, 343-373
Penrose, E.T. (1959). The Theory of the Growth of the Firm, Oxford, Basil Blackwell
Polanyi, M. (1967).The Tacit Dimension, Garden City, New York, Doubleday Anchor
Porter, M. E. (1990). The Competitive Advantage of Nations, New York, The Free Press
Rasiah, R. (2004). “Technological Intensities in East and Southeast Asian Electronics Firms: Does Network Strength Matter?” Oxford Development Studies 32 (3), Carfax Publishing
Reinikka R. and Svensson J. (1999a). "Confronting Competition: Investment Response and Constraints in Uganda", Policy Research Working Paper No. 2245, World Bank, Washington D.C.
Romijn, H., 1996, Acquisition of Technological Capability in Small firms in Developing Countries, Ph.D. Thesis, Center for Economic Research, Tilburg University, The Netherlands (published as: Romijn, H. (1999). Acquisition of Technological Capability in Small Firms in Developing Coun-tries, Macmillan and St. Martin’s Press, London and New York)
Romijn, H. (2001). “Small enterprise development in developing countries: Innovation or Acquisition of Technological Capabilities?” in, Van Dijk, M. P., Sandee, H. (eds.), The Importance of Innova-tion for Small Enterprise Development, Edgar Ellen
Rosenberg, N. (1976). Perspectives on Technology, Cambridge, Cambridge University Press
Rosenberg, N. (1982). Inside the Black Box: Technology and Economics, Cambridge, Cambridge Uni-versity Press
Rowbotham S. (1995). “Feminist Approaches to Technology: Women’s values or a gender lens?’ in Mitter S. and Rowbotham S. (eds.), Women Encounter Technology, Changing Patterns of Em-ployment in the Third World, London, Routledge
Saviotti, P.P. (1997). “Innovation Systems and Evolutionary Theories in Innovation” in Edquist, C. (ed.), Systems of Innovation: Technologies, Institutions and Organizations, London, Pinter
Sandee, H. (1995). "Innovation Adoption in Rural Industry: Technological Change in Roof Tile Clus-ters in Central Java", PhD thesis, Vrije Universiteit, Amsterdam
Schmitz, H. (1997). "Collective Efficiency and Increasing Returns", IDS Working Paper 50, Brighton: Institute of Development Studies, University of Sussex (revised version: Schmitz, H.(1999). "Col-lective efficiency and increasing returns", Cambridge Journal of Economics, 23(4): 465-483
Schmitz, H. and Knorringa, P. (1999). "Learning from Global Buyers", IDS Working Paper 100, Brigh-ton: Institute of Development Studies, University of Sussex
Schneider, D. (1999). "The Role of Buyers in the Development of the Hotel Furniture Industry in Kenya", IDS Working Paper 93, Brighton: Institute of Development Studies, University of Sussex
Schumpeter, J.A. (1934). The theory of economic development, Cambridge, Harvard University Press
Schumpeter, J.A. (1942), Capitalism, socialism and democracy, New York, McGraw-Hill
Sigelman, L. and Zeng, L. (1999) “Analyzing Censored and Sample-Selected Data with Tobit and Heckit Models”, Political Analysis 8(2), The Society for Political Methodology. Internet: avail-able at http://polmeth.wustl.edu/polanalysis/PA82-167-182.pdf
Stewart, F. (1981). “International Technology Transfer: Issues and Policy Options” in Streeten, P. and Jolly, R. (eds.) Recent Issues in World Development, Oxford, Pergamon Press
Ssemogerere G. (1997). "Trade Liberalization and Economic Development in Uganda: 1965-1995", African Economic Research Consortium (AERC) Nairobi, Kenya
Stamp, M. (1993). "Study of the effectiveness of policies, facilities and incentives for investment pro-motion in Uganda", Uganda Investment Authority, Kampala, Uganda
Stamp, M. (1993). "Study of Resource Endowments and Comparative Advantage: Uganda" Uganda Investment Authority, Kampala, Uganda
Steel, W.F. and Webster, L. (1991). “Small enterprises in Ghana: Responses to adjustment”, Industry Series Paper no 33, World Bank, Washington D.C.

206
Stiglitz, J. and Weiss A. (1981). “Credit Rationing in Markets with Imperfect Information”, American Economic Review 71/LXXI, 393-410
The World Bank, (1991). “Staff Appraisal Report, The Republic of Uganda, Enterprise Development Project, Octo-ber 31, 1991”. Report No. 9739-UG, Industry and Energy Division Eastern Africa Department, The World Bank
Uganda Leasing Company Limited, (1999). Report. “Equipment Leasing: Your Questions Answered”, Uganda Leasing Company, Uganda
UNCTAD (2001). "Transfer of Technology Policies: Case studies on Ghana, Kenya, Tanzania and Uganda", UNCTAD, United Nations, Geneva
UNIDO, Uganda Integrated Programme (UIP) (2002). ‘Phase I Report’, UNIDO UIP Uganda
UNU-INTECH, (2004). “Designing a Policy-Relevant Innovation Survey for NEPAD” [A Methodo-logical and Conceptual Approach to Innovation Systems Surveys in Africa}, United Nations Uni-versity-Institute for New Technologies (UNU-INTECH), Maastricht, The Netherlands
Walker, W. (1980). “Britain’s Industrial Performance 1850-1950: A failure to Adjust”, in Pavitt, K. (ed.) (1980). Technical Innovation and British Economic Performance, London, Macmillan
Yarime, M. (2003). “From End-of-Pipe Technology to Clean Technology: Effects of Environmental Regulation on Technological Change in the Chlor-Alkali Industry in Japan and Western Europe”, PhD Thesis, United Nations University Institute for New technologies(UNU-INTECH) and Maas-tricht Economic Research Institute on Innovation and Technology (MERIT) of the University of Maastricht, Maastricht, The Netherlands
Wangwe, S. (1992). “Building Indigenous Technological Capacity: A study of selected industries in Tanzania” in: Stewart, F., Lall, S., and Wangwe, S. (eds.) Alternative Development Strategies in Sub-Saharan Africa, London, Macmillan
Westphal, L. (2001). “Technology Strategies for Economic Development in a Fast Changing Global Economy”, Paper for the Symposium double issue, Economics of Innovation and New Technol-ogy (2002, 1&2); symposium on "The Political Economy of Technology Policy in Developing Countries”. Internet: available at http://www.bu.edu/econ/ied/neudc/papers/westphal-final.pdf
Westphal, L. (2000). “Industrialization Meets Globalization: Uncertain Reflections on East Asian Ex-perience”. Internet. Available at: http://www.swarthmore.edu/SocSci/lwestph1/downloads/IMG-Fnl.pdf
Wignaraja, G. and Ikiara, G. (1999). “Adjustment, Technological Capabilities and Enterprise Dynamics in Kenya” in Lall, S. (ed.), The Technological Response to Import Liberalization in sub-Saharan Africa, London: Macmillan
Wignaraja, G. (2002). "Firm Size, Technological Capabilities and Market-Oriented Policies in Mauri-tius" Oxford Development Studies, 30 (1): 87-104
Worthington, M. (1932). "A Report on the Fisheries of Uganda: Investigated by the Cambridge Expedi-tion to the East African Lakes, 1930-31", London SW1 Millbank, Crown Agents for the Colonies

207
Curriculum Vitae
Rose Nantongo Kiggundu was born in Uganda on 13 December 1962. She received her Bachelor of Science in Economics and Geography from Makerere University, Kampala, Uganda in 1985. She briefly took up a teaching assignment in Kenya and returned to Uganda in 1987 to take up a job offer as banking officer - and later as credit analyst - at the Uganda Commercial Bank. In 1990, she obtained her Master of Science degree in National Development, Project Planning and Analysis from the University of Bradford in The United Kingdom. For over 4 years, she worked for a microfinance organization in Uganda known as The Uganda Women’s Finance and Credit Trust (UWFCT at the time). Inspired by the process leading to the pre-Beijing African regional conference on gender equality and development held in Dakar-Senegal late in 1994 and the associated 5th United Nations World Conference held in Beijing China in 1995, Rose left the UWFCT in 1995 to create a pro-gender economic policy research, training and advocacy NGO named CEEWA-Uganda (The Council for Economic Empowerment of Women in Uganda). As the first chairperson of its Board of Directors, she currently sits on the panel of advisees and is a distinguished lifetime member of this immensely grown and influential non-government organiza-tion. Rose has served on the boards of other organizations in and outside Uganda. In the capacity as senior manager at PricewaterhouseCoopers/USAID PRESTO Project in Uganda, she was responsible for establishing and maintaining dialogue with policy makers, funding agencies, collaborators and all outreach activities. She executed mi-crofinance training courses and participated in the joint evaluation process of grant applications submitted by Micro Finance Organizations. She has consulted for many organizations including The World Bank in Washington D.C. Her research interests include innovation and developing country agriculture, livestock innovation processes and, innovation in the financial sector. She is the mother of three dearly loved boys - Arnold, Adrian and Adolph Kawuba.