innovation through ambidexterity: how to achieve the...
TRANSCRIPT
1
Innovation through Ambidexterity: How to Achieve the Ambidextrous
Organization
Constantinos Markides
London Business School
Sussex Place, Regent’s Park
London, NW1 4SA, United Kingdom
Phone: (+44) 20- 7000 8740
Fax: (+44) 20- 7000 7001
E Mail: [email protected]
and
Wenyi Chu
National Taiwan University
50, Lane 144, Keelung Road, Sec. 4
Taipei, TAIWAN
Phone: (+886) 2 2362 5008
Fax: (+886) 2 2362 5379
E Mail: [email protected]
2
Innovation through Ambidexterity: How to Achieve the Ambidextrous
Organization
ABSTRACT
It has long been recognized in the literature that the pursuit of radical or disruptive innovation by
established firms poses an organizational challenge for the firm. This is because the skills,
structures, processes and mindsets required for exploiting the existing business are fundamentally
different and often conflict with those required for radical innovation (i.e. exploration). This has
led researchers to propose the need for “ambidextrous” organizations—companies capable of
achieving efficiency in their existing business while at the same time having the strategic foresight
to innovate and explore new businesses. Past research has found some support for a positive
relationship between performance and the ability to be ambidextrous. There is, however, little
evidence on how a firm can actually achieve ambidexterity. In this paper, we explore the issue of
ambidexterity in the context of diversified firms. Specifically, we examine diversified firms that
need to manage divisions that face conflicting demands for integration and responsiveness. Not all
divisions of a diversified firm face such conflicting demands, so we focus on only those divisions
that do. These divisions must be given autonomy to be locally responsive but must also be
centrally controlled to allow for the efficient exploitation of interdependencies with the parent (and
other divisions in the diversified firm). We use theory to propose ways by which a diversified firm
could achieve such ambidexterity in its handling of these divisions. We then utilize questionnaire
data from the 100 biggest business Groups in Taiwan to empirically test our hypotheses. We find
that granting operational autonomy to separate divisions while centralizing strategic and financial
controls promotes the achievement of ambidexterity. We also find that ambidexterity could be
promoted through the use of strong values, rotation of managers and internal training programs.
3
Innovation through Ambidexterity: How to Achieve the Ambidextrous
Organization
The ability of a firm to exploit its current business while exploring new territory (in terms of new
technologies, markets, products or business models) has long been recognized as a critical source
of competitive success (Eisenhardt and Martin, 2000; March, 1991; Thompson, 1967; Tushman
and O’Reilly, 1996; Quinn and Cameron, 1988.) The need to achieve a “balance” between these
two distinct activities has been proposed in a wide range of management areas, including
organization theory (e.g. Holmqvist, 2004), managerial economics (e.g. Ghemawat and Costa,
1993), international business (e.g. Bartlett and Ghoshal, 1989) and strategic management (e.g.
Winter and Szulanski, 2001).
However, achieving this balance is a “central paradox of administration.” (Thompson, 1967, p.15)
This is because the skills, mindsets, structures and processes required to achieve exploitation of the
current business are fundamentally different and often conflict with those required to achieve
exploration. For example, in a classic study Burns and Stalker (1961) proposed that organizations
developing new products (i.e. exploring) should be organic, whereas organizations engaged in
exploiting their existing businesses should be mechanistic. Several other studies have shown that
exploration and exploitation require substantially different structures, processes, skills and
strategies that appear contradictory and difficult to combine (Benner and Tushman, 2003;
Levinthal and March, 1993; March, 1991; Sheremata, 2000; Tushman and O’Reilly, 1996).
Organizations that are capable of achieving the appropriate balance between exploitation and
exploration have been labeled “ambidextrous” organizations (e.g. Duncan, 1976; Tushman and
O’Reilly, 1996). Recent studies have empirically tested the relationship between organizational
performance and the ability to be ambidextrous and have generally found a positive relationship
(e.g. Adler, Goldoftas and Levine, 1999; Ahuja and Lampert, 2001; Benner and Tushman, 2002;
Gibson and Birkinshaw, 2004; He and Wong, 2004; McDonough and Leifer, 1983). But whereas

4
the need for and the beneficial effects of achieving ambidexterity have been recognized, little work
has been done on exactly how organizations could achieve ambidexterity.
Most authors have viewed the achievement of ambidexterity as a structural issue (e.g. Christensen
1997; Duncan, 1976; Tushman and O’Reilly, 2004). For example, Duncan (1976) proposed that
organizations achieve ambidexterity by putting in place “dual structures” so that certain divisions
focus on alignment while others focus on adaptation. Similarly, Christensen and Raynor (2003)
proposed that established companies could only pursue a disruptive innovation in a separate unit,
away from the interference of the parent company. O’Reilly and Tushman (2004) suggested that
ambidextrous organizations create separate units to pursue new opportunities but keep the same
general manager to manage both the new unit and the parent company.
Recently, attention has begun to shift towards non-structural elements of ambidexterity such as
culture and values, incentives, mindsets and strategic foresight (e.g. Adler, Goldoftas and Levine,
1999; Ahuja and Lampert, 2001; Costanzo, 2004; Eisenhardt and Martin, 2000; Gibson and
Birkinshaw, 2004; MacKay and McKiernan, 2004; Siggelkow and Levinthal, 2003; Siggelkow
and Rivkin, 2005; Volberda, 1996). Our paper builds upon this tradition and proposes several non-
structural strategies that firms could pursue in order to achieve ambidexterity. In other words, over
and above creating separate units, what else must a firm do to achieve ambidexterity? For the
purposes of this research, we take ambidexterity to mean the ability of a firm to simultaneously
achieve decentralization and centralized control.
The context of a diversified firm provides a perfect setting to explore this question. This is
because the separate units already exist in a diversified firm. Many, though not all, may be
pursuing strategies or may be facing external environments that require them to have as much
autonomy from the parent as possible (so as to achieve local responsiveness). But these same
units may also need to be integrated with the parent or with other divisions within the portfolio so
as to exploit synergies with each other. The question then is: “how could the corporate parent
provide autonomy to these divisions while at the same time exercising centralized control over
them?”

5
In this paper, we utilize questionnaire data from the 100 biggest business groups in Taiwan1 to
explore how these diversified firms achieve this kind of ambidexterity. To collect the necessary
data, we have administered two questionnaire surveys: one at corporate headquarters and one at
division level. Because we have been granted access to the divisions of these diversified groups
(as well as the CEO of the Group at corporate HQs), most of the data that we use in this paper
comes from the general managers who actually run the divisions. As a result, we can determine
what kind of environment each division is facing or what kind of strategy it is pursuing. This in
turn will allow us to identify those divisions that are facing situations of strategic ambiguity—a
situation that demands ambidextrous behaviors by the corporate parent. In addition, since we have
been given data on each division’s performance, we will be able to assess whether our predictions
as to how these divisions should be managed lead to superior performance.
THEORY AND HYPOTHESES
Organizational ambidexterity has been defined as the ability of a firm to manage demands in its
task environment that are in conflict or require trade-offs (e.g. Duncan, 1976; Gibson and
Birkinshaw, 2004; Tushman and O’Reilly, 1996). The academic literature has identified numerous
instances when a firm would be required to reconcile (if not eliminate) difficult trade-offs—for
instance, following a differentiation strategy while adopting a low-cost one as well; exploiting the
current business while exploring new ones; investing in current versus future projects; managing a
mature business as well as a new, emerging business. Within diversified firms, a situation that
requires the reconciliation of difficult trade-offs arises when divisions within the portfolio face
conflicting strategic imperatives—for example, a division might require autonomy from the parent
to pursue its own strategy but at the same time has to integrate with the parent to allow for the
efficient exploitation of synergies with other divisions. As we argue below, several such situations
may present themselves in a diversified firm and our thesis is that the corporate parent must
1 Our use of Taiwanese firms is opportunistic: as a part of a major research project, we have been granted
unprecedented access to divisional level data in some of the most prestigious business groups in Taiwan. Thus, unlike most of the previous studies on this subject that gathered their data at the headquarters level, we have detailed data for

6
become ambidextrous if it is to reconcile such conflicting demands.
The need for ambidexterity in diversified firms
Past academic work on diversification has argued that since different divisions within the same
multi-business firm often face different levels of volatility in their external environments and often
pursue different business level strategies, then the administrative mechanisms that corporate
headquarters use to manage these divisions—such as evaluation and incentive systems—should
differ accordingly (e.g. Govindarajan, 1988; Govindarajan and Fisher, 1990; Gupta, 1987; Gupta
and Govindarajan, 1986; Hill, 1990). Several empirical studies have provided evidence that
suggests that such a differentiated approach towards divisions is indeed possible (e.g. Chu l997;
Ghoshal and Nohria, 1989; Govindarajan and Fisher, 1990; Gupta and Govindarajan.1986;
Lioukas, Bourantas and Papadakis, 1993).
More specifically, it has been argued and shown empirically that different divisions within the
same multi-business firm do indeed receive different degrees of autonomy (from corporate
headquarters) to take strategic, financial and operational decisions. Several studies have found
that the divisions that received the most autonomy were those which: (l) faced a volatile
environment; (2) followed a differentiation strategy; and (3) did not share resources and were not
interdependent with other divisions in the company (e.g. Chu, 1997; Govindarajan, 1988; Gupta,
1987). It has been further shown that under these three conditions, divisions that are granted
decision-making autonomy perform better than divisions that are not given autonomy (Chu, 1997;
Lioukas et al., 1993).
The rationale for the existence of a positive relationship between autonomy and these three
contingency factors is well accepted in the literature. A central proposition of organizational
theory (e.g. Lawrence & Lorsch, 1967; Thompson, 1967) is that there is no one best way to
organize and that the different ways of organizing are not equally effective. Building on this
principle, the information processing perspective argues that the main purpose of organizational
each division.
7
design is to enable each sub-unit to cope with its information processing requirements, which are
determined by task uncertainty. Because of variations in environmental uncertainty, different
organizations need different arrangements to be able to deal with their information processing
requirements (Galbraith, 1973, 1977; Nadler & Tushman, 1988).
Following the classic work of Burns & Stalker (1961), Woodward (1965), and Lawrence & Lorsch
(1967), Galbraith (1973) argued that the greater the uncertainty and/or diversity of the task, the
greater the amount of information needed to be processed during the decision making and task
execution in order to achieve a given level of performance. Therefore, uncertainty is the core
concept upon which the organization design frameworks are based. Theoretically, there are at least
two sources of uncertainty: uncertainty of external environment (Burns & Stalker, l961), and
uncertainty of task (Perrow, 1967). Thus the appropriate design of organizational structure is
contingent upon these two contextual variables.
With regard to the uncertainty of external environment, it has been well established by authors
such as Thompson (1967) and Lawrence and Lorsch (1967) that the structures of organizations are
and should be differentiated according to the characteristics of the external environments they face.
This argument is obviously applicable to multi-business firms: different divisions compete in
different industries and thus face different levels of environmental uncertainty. A division that
competes in an industry with high environmental complexity needs a more decentralized
organization if it is to deal effectively with the high information processing requirement it faces
and react quickly and flexibly to environmental changes; conversely, for divisions that compete in
industries which are characterized by low levels of complexity, a more centralized control system
could be adopted (Govindarajan, 1986).
Furthermore, the competitive strategies adopted by divisions influence the task uncertainty faced
by them (Porter, 1985, 1987). As a result, their information processing needs will differ
accordingly: a division that follows a differentiation strategy faces a higher level of uncertainty in
its task environment because this strategy requires innovation and dynamism to be effective
(Porter, 1987). Therefore, such a division would benefit from high degrees of autonomy and

8
decentralization (Govindarajan, 1986; Gupta, 1987). On the other hand, a division that follows a
low cost strategy faces a more stable task environment. Therefore, such a division requires less
autonomy so that corporate HQs can monitor divisional operations more closely to ensure that
costs are controlled efficiently.
In summary, the information processing perspective suggests two main contingency factors
influencing how much autonomy different divisions receive (or should receive) from corporate
headquarters: the environmental complexity faced by divisions and the competitive strategy
adopted by each division. High environmental complexity and a differentiation strategy are argued
to be associated with higher divisional autonomy.
A different motivation for structural differentiation within diversified firms has been proposed by
authors such as Pfeffer(1981), Pfeffer and Salancik (1978) and Porter (1985). Their position is
based on resource sharing and interdependencies among divisions.
Resource sharing refers to the extent to which a focal division shares functional activities (such as
marketing, manufacturing, R&D, and human capital) with other divisions within a firm (Vancil,
1980). Resource sharing among divisions could be a source of value for diversified firms,
especially for the related diversified and vertically integrated ones (i.e. Porter, 1987). This is
because high resource-sharing may yield a synergistic cost advantage in that the divisions can
access the shared resource at a lower cost than they would have if they each had to acquire it
separately (Gupta & Govindarajan, 1986; Porter,1985). In addition, resource sharing can enhance
differentiation by contributing to the uniqueness of an activity and by lowering its cost (Porter,
1985).
Resource sharing is not cost free. It requires extensive coordination and cooperation among
divisions, activities that require the active involvement of corporate headquarters (McCann &
Fery, 1979). In addition, resource sharing and coordination imply loss of divisional autonomy,
constrained flexibility and distorted performance accountability (Gupta and Govindarajan, 1986).
9
Resource sharing has the following implication for how HQs should manage divisions: since
different divisions can have different levels of resource sharing with each other, then the
administrative mechanisms that the corporate HQs uses to manage these divisions should differ
accordingly. When a division’s level of resource sharing is high, the need for central coordination
is strong and a more centralized control style is suggested. Conversely, when inter-divisional
resource sharing is low, a decentralized HQ-division relationship is proposed.
Overall, therefore, we would expect that divisions that receive the most autonomy will be those
which: (1) face a volatile environment; (2) follow a differentiation strategy; and (3) do not share
resources and are not interdependent with other division in the company. These predictions have
been supported empirically (e.g. Chu, 1997; Govindarajan, 1988; Gupta, 1987). It has been further
shown that under these 3 conditions, divisions that are granted decision-making autonomy perform
better than divisions that are not given autonomy (Chu, 1997).
While these propositions are well accepted in the diversification literature, they also give rise to an
interesting and unexplored conundrum. Namely, what happens in situations where a division faces
conflicting strategic imperatives? For example, how should HQs manage a division facing a
volatile environment that is also very interdependent with other divisions in the group? Theory
suggests that because of the volatility of its environment, this division should be granted
autonomy; but because of high interdependence with other divisions, it should be centrally
controlled and given little autonomy.
This is an example of what Hamel and Prahalad (1983, p.341) have called "situations of strategic
ambiguity”—that is, situations where divisions face conflicting demands for integration and
responsiveness which makes management of these divisions especially difficult. It is exactly the
kind of situation that, as we have argued in this paper, requires the corporate parent to adopt
ambidextrous behaviors. Several such situations may present themselves. For example, a division
in a stable (mature) business that is following a differentiation strategy faces a situation of strategic
ambiguity. The same is true for a division in a volatile business that has adopted a cost leadership
strategy. In fact, given the three contingency variables identified above, we could come up with

10
eight possible scenarios of strategic ambiguity. While we do not want to pretend that these are the
only instances when strategic ambiguity may creep in, it appears that such situations happen often
enough in practice to warrant further examination.
Situations such as these have been identified and examined in the multinational literature. For
example, Bartlett and Ghoshal's (1989) examination of the management of the "transnational"
organization tackled exactly this issue. Similar issues have also been explored by Hamel and
Prahalad (1983) and by Prahalad and Doz (1987). Our goal here is to use the insights that have
emerged from this literature on multinationals to study this phenomenon within a diversified firm.
Given the three contingency variables that we identified above as influencing how much autonomy
each division will receive, we can identify eight possible strategic scenarios that a specific division
may be facing at any given time. The eight possible scenarios along with their organizational
implications are presented in table 1. It should be clear from table 1 that six of these scenarios
(Nos. 1, 2, 3, 5, 7, 8) represent situations of strategic ambiguity that would require ambidextrous
behaviors from the corporate parent.
------------------------
Put table 1 here
------------------------
The discussion so far leads us to propose our first hypothesis. Given the organizational
implications outlined in table 1, we would expect that divisions facing scenario (4)—that is
volatile environment, differentiation strategy and low interdependence—will be given the highest
level of autonomy; while divisions facing scenario (6)—that is stable environment, cost strategy
and high interdependence—will be given the least amount of autonomy. The other divisions
facing any one of the other six scenarios will have intermediate levels of autonomy. Therefore:
Hypothesis 1: Divisions facing scenario (4) will have statistically significant higher levels of
autonomy relative to divisions facing scenarios (1), (2), (3), (5), (7), (8) which in turn will have
higher levels of autonomy relative to divisions facing scenario (6).

11
It is important at this point to stress that we do not believe that these 8 scenarios are the only
possible ones that a division might face. We ended up with eight scenarios because we started out
with three contingency variables. It is possible to identify from the literature even more variables
that might influence how much autonomy a division gets. Every additional contingency variable
will double the possible scenarios facing a division. For example, even the addition of one more
contingency variable will give rise to 16 possible scenarios. However, we decided to focus on just
the three contingency variables because they are, according to the literature, the most important
factors influencing how much autonomy each division gets. In addition, our goal is not to identify
every possible scenario that a division might face. Rather, we want to argue that it is possible for a
division to face strategically ambiguous scenarios—whether they face one or ten such scenarios is
not important. We further want to examine how such situations are handled. We turn to this topic
next.
Managing Strategic Ambiguity
The management and reconciliation of conflicting demands is not easy. In fact, there has been a
lot of discussion in the academic literature as to whether internal organizational tensions, such as
those between low cost and differentiation, can ever be effectively reconciled. For example, Porter
(1996) has argued that the trade-off between low cost and differentiation strategies is
insurmountable.
The primary solution offered to solve this problem is to keep the two strategies physically separate in
two distinct organizations. This is the “innovator’s solution” that’s primarily associated with
Christensen’s (1997) work on disruptive innovation but other academics have advocated it as well
(e.g. Burgelman and Sayles, 1986; Gilbert and Bower, 2002). Even Porter (1996) has come out in
favor of this strategy. Despite arguing that most companies that attempt to compete with dual
strategies will likely fail, he has also proposed that: “…companies seeking growth through
broadening within their industry can best contain the risks to strategy by creating stand-alone units,
each with its own brand name and tailored activities.” (Porter, 1996, page 77).
This structural solution has found some support in the academic literature (e.g. Tushman, Smith,

12
Wood, Westerman and O’Reilly, 2004). However, it has also been argued that finding the
appropriate structure may be only part of the solution and that we should also look for non-structural
elements of ambidexterity (e.g. Gibson and Birkinshaw, 2004). Here, we propose that the
multinational literature could offer several insights on how situations of strategic ambiguity could be
managed within diversified firms. In fact, Ghoshal and Nohria (1993, p. 33) suggest that: “Our
argument [that the complexity of a firm’s structure must match the complexity of its environment]
can easily be extended…to any multidivisional firm.”
The most relevant proposition stemming from this literature is that multinationals which operate in
markets where the forces for national responsiveness are as strong as the forces for global
integration, will require the “transnational” form of organization to be effective (see for example
Bartlett and Ghoshal, 1989; and Ghoshal and Nohria, 1989). This structure allows each subsidiary
the freedom to differentiate itself according to local demands but at the same time “…overlays the
distinctly structured relationships with a dominant overall integrative mechanism—whether
through strong centralization, formalization, or normative integration.” (Ghoshal and Nohria,
1993: 28)
Therefore, the basic proposition is to find ways to grant the division enough autonomy to make
operational decisions suitable for its environment while at the same time making sure that
integrative mechanisms are in place to exploit interdependencies. There is no one best way to
achieve this but one possibility may be to follow the suggestion of Williamson (1975) and Hill
(1988) and grant the divisions operational autonomy while maintaining central control over
strategic and financial matters . This proposition is in the spirit of the “transnational” solution
and allows for a delicate balance to be struck between divisional autonomy on the one hand and
central control on the other. Therefore:
Hypothesis 2: Among divisions facing strategic ambiguity, those that display high operational
autonomy but low strategic and financial autonomy will outperform all other divisions.
Another insight that has emerged from the multinational literature is that “…structure may be a

13
relatively ineffective tool for managing strategic responsibility, particularly when the firm faces
strategic ambiguity. Management must use other tools at its disposal, including systems, corporate
values and culture, and positioning assignment of key people.” (Hamel and Prahalad, 1983: 347).
This insight suggests two other possible mechanisms for managing strategic ambiguity in
diversified firms. The first mechanism is a strong culture or strong shared values. Creating strong
shared values and beliefs among the managers of divisions and headquarters enables the corporate
center to grant autonomy to divisions without fear that the divisions will pursue their own interests
at the expense of the group as a whole. As Ouchi (1980: 138) noted: “common values and beliefs
provide the harmony of interests that erase the possibility of opportunistic behavior.” Furthermore,
as argued by Barnard (1939), shared values enhance the sense of mutual interdependence in the
organization and can therefore facilitate the corporate center in its attempts to exploit synergies
among divisions, even when these divisions enjoy decision-making autonomy. The useful role of
shared values as a mechanism for managing headquarter-division relations has been demonstrated
in recent studies by Chu (1997) and Nohria and Ghoshal (1994). Therefore:
Hypothesis 3: Among divisions facing strategic ambiguity, those that belong to corporations which
display high shared values will outperform all others.
The second mechanism for managing strategic ambiguity in diversified firms is the firm’s
organizational context. For Prahalad and Doz (1981: 5), context means the “…blending of
organizational structure, information systems, measurement and reward systems and career
planning and a fostering of common organizational culture.” For Hamel and Prahalad (1983: 347)
it means: “…sophisticated management of systems, the corporate cultural milieu and people.” The
argument is that divisions could be given decision-making autonomy and still kept integrated
within the group through a variety of integrative mechanisms such as high and continuous
communication, transfer of managers across functions and divisions, common training of people
and the development of a strong culture. Therefore:
Hypothesis 4-1: Among divisions facing strategic ambiguity, those with high levels of

14
communication will outperform all others.
Hypothesis 4-2: Among divisions facing strategic ambiguity, those with a high level of transfer of
managers will outperform all others.
Hypothesis 4-3: Among divisions facing strategic ambiguity, those with a high level of training
programs will outperform all others.
DATA AND METHODOLOGY
The Sample
The top 100 business groups in Taiwan were asked to participate in this research. These are the
largest and most diversified companies in Taiwan and together account for more than 35% of the
country’s GNP. A total of 34 business groups agreed to participate. We tested for response bias by
comparing the size (assets and number of employees) and profitability (ROA, net profit rate and
ROE) of those business groups that agreed to participate versus those groups that did not want to
participate. No response bias was detected for either profitability or size.
The 34 participating groups had a total of 186 Divisions. Data was collected via two
questionnaires: one was completed in a face-to-face meeting with the CEO of the participating
business group; and one was sent to the 186 divisional general managers of these 34 groups. The
divisional questionnaire was distributed either by senior staff members at HQ (who helped with
contacting divisions, distributing questionnaires and following up); or if HQ did not want to
actively participate, the divisional general manager was contacted directly and notified that HQ
had already agreed to participate. The draft questionnaires were first tested on two divisional
general managers and three senior HQ staff from five business groups, before the final ones were
distributed.
Of the 186 divisional general managers who received questionnaires, 148 (80%) responded. In
total, 136 (73%) responses were usable. On average, the responding managers had worked for
their business groups for 18.8 years and for their current divisions for 13.4 years.
15
The Variables
Data was collected to calculate the following variables:
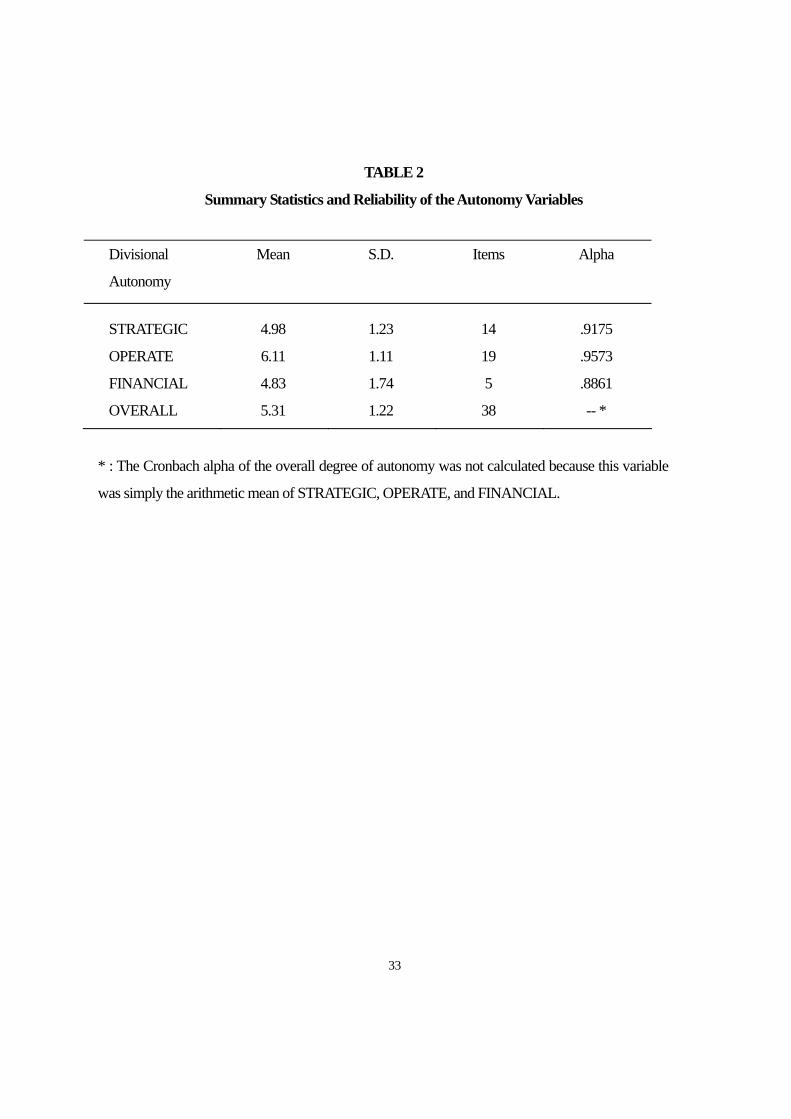
Autonomy Granted to Divisions: Based on instruments developed by Hill (1988), we measured
the degree of autonomy given to divisions to take strategic, financial and operational decisions.
Using data from the divisional questionnaire, we constructed three composite scales from the
responses to 38 questions (cf. Hill, 1988): OPERATE, STRATEGIC, and FINANCIAL. The
scale OPERATE measured head office involvement in the operating decisions of the divisions. It
was constructed from the responses to 19 questions. STRATEGIC measured the extent to which
strategic controls were centralized. It was constructed from the responses to 14 questions.
Similarly, FINANCIAL measured the extent to which the head office exercised centralized
financial controls over divisions based upon abstract profit criteria. It was constructed from the
responses to five questions.
The three scales ranged in value from 1 to 7. A value of 1 indicated that: “HQ makes decisions
without prior consultation of the divisions” while a value of 7 indicated that: “Divisions make
decisions without prior consultation of the HQ”. High scores indicated a high degree of
decentralization of control over strategic, operational and financial decisions. The overall degree
of decentralization was measured by averaging the mean scores of these three scales. Summary
statistics as well as the results of Cronbach Alpha reliability tests are shown in Table 2.
------------------------
Put table 2 here
------------------------
Divisional Performance: Consistent with the arguments of Gupta & Govindarajan (1984) and
Govindarajan (1988), we measured the performance of a division as its actual performance relative
to what HQ expected from the division, rather than as an absolute figure. Data was collected at the
divisional level on the following performance items: gross profit, profit growth, labor productivity,

16
return on sales, return on investment, development of new products, sales growth, market share,
cash flow from operations, capacity utilization, cost control, personnel development, company
image, and customer satisfaction. For each of these 14 items, respondents were asked to rate their
divisional performance relative to the HQ’s expectation on a seven-point scale, ranging from “Not
satisfactory at all” (=1) to “Outstanding” (=7). A straight average of these dimensions was used as
the measure. Values ranged from 1.86 to 7.00, with a mean of 4.14 (Cronbach Alpha = .9324).
Since the divisional managers were asked to rate their performance, we expected this answer to be
biased upwards (i.e. the managers would report that their performance was better than what it
really was). However, we did not consider this a problem because we did not expect any
divisional manager to be systematically more biased than others (i.e. we expected all to be biased
and in the same direction). To make sure of this, we utilized the data collected through the
CEO/HQs questionnaire: we first classified the divisions into two groups—one group contained all
the divisions which were rated as “performing very well” by their corporate HQs and one group
contained those divisions which were rated as “not performing well” by their corporate HQs. We
then compared the answers (as regards their performance) of divisions that HQs considered as
performing well against the answers of divisions whose HQs did not think they were performing
well. As expected, the difference in responses between the two types of divisions was not
statistically significant.
We tested for bias in another way: from the questionnaire survey conducted with the CEO at
corporate headquarters, we had objective data on the performance of each business group that
participated in this study. Specifically, we had objective data for each Group’s return on Assets
(ROA); return on equity (ROE); net profit rate (PR); and sales growth (GS). We therefore
compared the responses of divisions that belonged to profitable groups against the responses of
divisions that came from unprofitable groups. Again, the difference in responses with respect to
the performance variable were not statistically significant.
Independent Variables: Data was collected for a number of independent variables. These
variables include the three contingency variables (environmental complexity faced by each

17
division, competitive strategy of each division, and resource sharing among divisions), as well as
shared values, communication, rotation of managers, and training programs. The independent
variables were operationalized using a variety of instruments. Details on how each variable was
constructed are presented in the Appendix.
Scenarios of Strategic Ambiguity
In order to test Hypothesis 1, we need to classify divisions into the eight scenarios of table 1. For
example, divisions which face a volatile environment, follow a differentiation strategy and are
highly interdependent with other divisions should be placed in scenario 1. On the other hand,
divisions which face a stable environment, follow a differentiation strategy and have low
interdependence with other divisions should be placed in scenario 8.
We carried out this classification as follows: divisions were first ranked according to the
complexity of their environment. Those divisions that had a complexity score above the median
were placed in the “volatile environment” group whereas divisions that had a complexity score
below the median were placed in the “stable environment” group. Next, divisions were ranked
according to their competitive strategy scores: those that had scores below the median in the
competitive strategy score were placed in the “Low cost” group while those that had scores above
the median were placed in the “Differentiation” group. Finally, divisions were ranked according to
their resource-sharing scores: those that had scores below the median in the resource-sharing score
were placed in the “Low” interdependence group while those that had scores above the median
were placed in the "High” interdependence group2. The divisions were then classified into
scenarios on the basis of table 1. The results of this classification are summarized in table 3.
-----------------------
Put table 3 here
2 The use of the median as our cut-off point is obviously subjective. Ideally, we would have liked to perform sensitive analysis by using different cut-off points (such as the mean or quartiles). Unfortunately, the use of any cut-off point other than the median results in scenarios with too few divisions in them to make the statistical analysis meaningful. We therefore use only the median out of necessity.

18
-----------------------
EMPIRICAL RESULTS
Our first hypothesis proposed that divisions facing scenario (4)—that is, volatile environment,
differentiation strategy and low interdependence-- will be given significantly higher levels of
autonomy than divisions facing scenarios (1), (2), (3), (5), (7), (8), which in turn will be given
higher levels of autonomy than divisions facing scenario (6). One-way ANOVA and Duncan’s
tests were employed to compare the differences in autonomy granted to the different divisions.
The results are shown in table 4.
-------------------
Put table 4 here
-------------------
There were 19 divisions facing scenario (4) and their mean levels of strategic, operational and
financial autonomy were 5.76, 6.57 and 5.79 respectively. By contrast, there were 97 divisions
facing scenarios (1), (2), (3), (5), (7) and (8) and their respective mean levels of autonomy were
5.02, 6.17 and 4.84—all significantly lower than the corresponding values for the divisions in
scenario (4)--- as proposed by Hypothesis one. Similarly, there were 20 divisions facing scenario
(6) and their mean levels of strategic, operational and financial autonomy were 4.23, 5.61 and 3.97
respectively. Again, these values were significantly lower than the corresponding values for
divisions in the other scenarios—exactly what our first hypothesis proposed. Similar results were
obtained when the overall autonomy given to divisions was examined. Thus, hypothesis one is
strongly supported by the data.
To test the remaining hypotheses, we used only the sub-sample of divisions which faced strategic
ambiguity –that is, the 97 divisions facing scenarios 1, 2, 3, 5, 7, and 8. Our second hypothesis
proposed that among divisions facing strategic ambiguity, those that received high operational
autonomy but low strategic and financial autonomy should perform better than all other divisions.

19
To empirically test this, we had to classify divisions according to the degree of autonomy that they
received from HQs and then determine whether what they received was “appropriate” or not (as
proposed by hypothesis 2).
We first used the mean value of strategic, financial and operational autonomy that each division
received as the cut-off point: divisions receiving more autonomy than the mean were classified as
receiving “high” autonomy, whereas divisions receiving less autonomy than the mean were
classified as receiving “low” autonomy. Next, all divisions receiving high operational but low
strategic and financial autonomy were classified as receiving “appropriate” autonomy from HQs
(as proposed by our hypothesis). Using this method, we classified 13 divisions as receiving
“appropriate” autonomy. Finally, the performance of those divisions placed in the “Appropriate”
group was compared to the performance of all other divisions (84 in total).
To make sure that our results did not depend on the actual cut-off point used, we also utilized three
other cut-off points to determine whether a division received “high” or “low” autonomy: first,
divisions receiving more autonomy than the median value of strategic, financial and operational
autonomy were classified as receiving “high” autonomy, whereas divisions receiving less than the
median were classified as receiving “low” autonomy. Second, divisions in the top quartile (of each
category of autonomy) were classified as receiving “high” autonomy whereas divisions in the
bottom quartile were classified as receiving “low” autonomy. Finally, divisions in the top one-
third (of each category of autonomy) were classified as receiving “high” autonomy whereas
divisions in the bottom one-third were classified as receiving “low” autonomy. Once the “high”
and “low” classifications were made, divisions were placed in the “Appropriate” group (as
proposed by our hypothesis) in the same manner as before--divisions which had high operational
and low strategic and low financial autonomy were classified in the “Appropriate” group while all
others were placed in the “inappropriate” group. The performance of those divisions placed in the
“appropriate” group was then compared to the performance of those divisions placed in the
“inappropriate” group. According to hypothesis two, there should be a statistically-significant
difference in the performance of the two groups.

20
Table 5 shows the results of this analysis. Row (A) shows the results when the mean is used as the
cut-off point. Row (B) shows the results when the median is used as the cut-off point. Row (C)
shows the results when divisions are placed in the top one-third and bottom-one third. Row (D)
shows the results when divisions are placed into quartiles.
-------------------------------
Put table 5 here
-------------------------------
Obviously, the third and fourth methods of classification result in groups that contain too few
observations for any meaningful analysis. However, the groups that result from the first two methods
contain enough observations for meaningful comparisons to be made. In both cases, the divisions
placed in the “Appropriate Autonomy” group have performance which is much higher (at the 0.1
level) to the performance of all other divisions. This result provides strong support for our second
hypothesis.
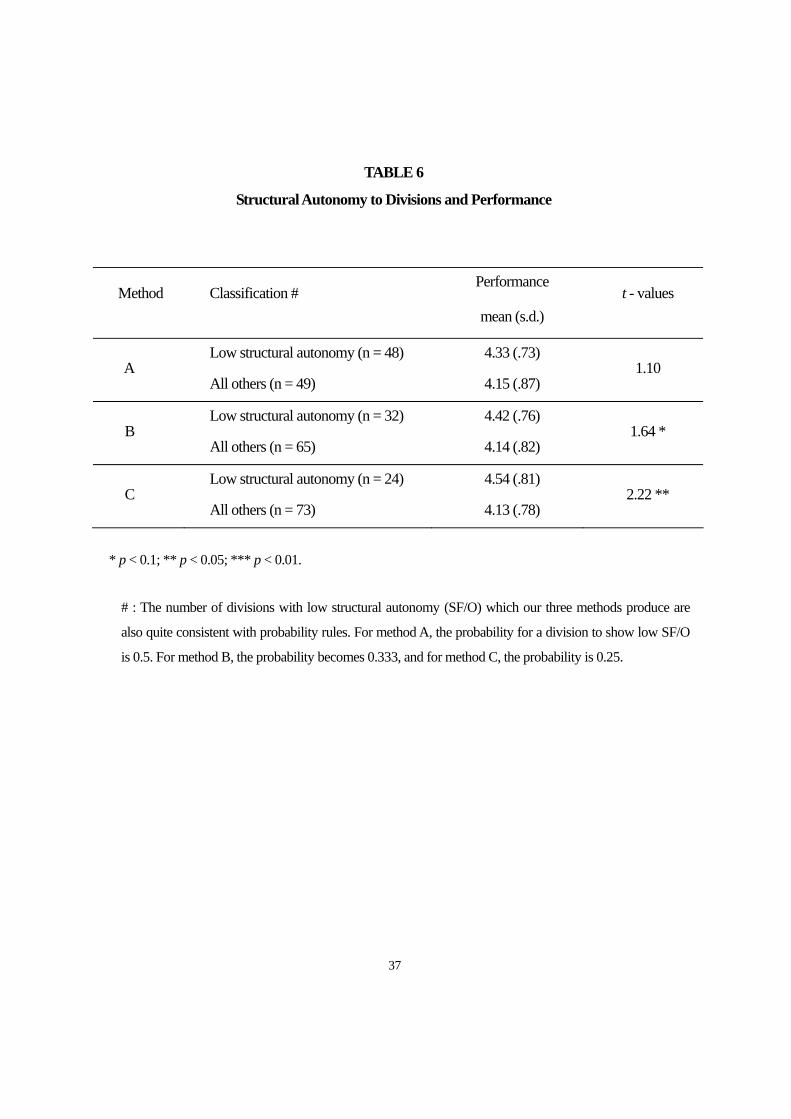
We also tested this hypothesis in another way. Our basic proposition is that divisions facing strategic
ambiguity should be given high operational but low strategic and financial autonomy. For each
division, therefore, we calculated the variable “structural autonomy” as the product of [STRATEGIC ×
FINANCIAL× (1÷OPERATE)]. Based on our proposition, we would expect that those divisions
facing strategic ambiguity would benefit from having lower levels of “structural autonomy”. This
expectation was supported through simple regression analysis: when divisional performance was
regressed against “structural autonomy”, the beta coefficient of “structural autonomy” came out as –
0.174 and statistically significant at the 1% level. This implied that the lower the “structural
autonomy” to divisions, the higher their performance.
Further tests were carried out by ranking the 97 divisions according to their “structural autonomy”
values. Those placed in the bottom quartile were classified as receiving “appropriate” structural
autonomy, while those placed in the top quartile were classified as receiving “inappropriate” structural
autonomy. For sensitivity analysis purposes, different cut-off points were used as well. As before, the
sample median was used as a cut-off point: those divisions with a “structural autonomy” value below

21
the sample median were classified as receiving “appropriate” structural autonomy while those above
the median were classified as receiving “inappropriate” structural autonomy. In addition, those
divisions in the bottom one third of structural autonomy values were classified as receiving
“appropriate” autonomy while those in the top one third were classified as receiving “inappropriate”
autonomy. The performance of the divisions placed in the “appropriate” group was then compared to
the performance of those divisions placed in the “inappropriate” group. The results are shown in table
6.
-------------------------------
Put table 6 here
-------------------------------
Row (A) shows the results when the median is used as the cut-off point. Row (B) shows the results
when divisions are placed in the top one-third and bottom one-third. Row (C) shows the results when
divisions are placed into quartiles. In all cases, the performance of divisions placed in the low (i.e.
appropriate) structural-autonomy group is higher than the performance of divisions placed in the high
(i.e. inappropriate) structural-autonomy group. In two of the three cases, the difference is statistically
significant. Again, these results are in general support of our second hypothesis.
Our third hypothesis proposed that among divisions facing strategic ambiguity, those that belonged to
corporations which displayed high shared values will outperform all others. To test for this, we had to
sort the 97 divisions into two groups: a group that contained the divisions that had high shared values
and a group that had divisions with low shared values. To do this, we employed the same
methodology as before: first, all divisions were ranked according to their “shared values” index;
second, they were classified into the two groups using the same four cut-off points as before (mean,
median, upper and lower one-third and quartiles). Finally, the performance of divisions placed in the
“high” shared-values group was compared to the performance of divisions placed in the “low” shared-
values group. The results are shown in table 7.
-------------------------
put table 7 here
22
-------------------------
No matter which cut-off point is used to separate the divisions, the same result stands out: in situations
of strategic ambiguity, divisions displaying high shared values outperform all others. This result
provides strong support for Hypothesis H3.
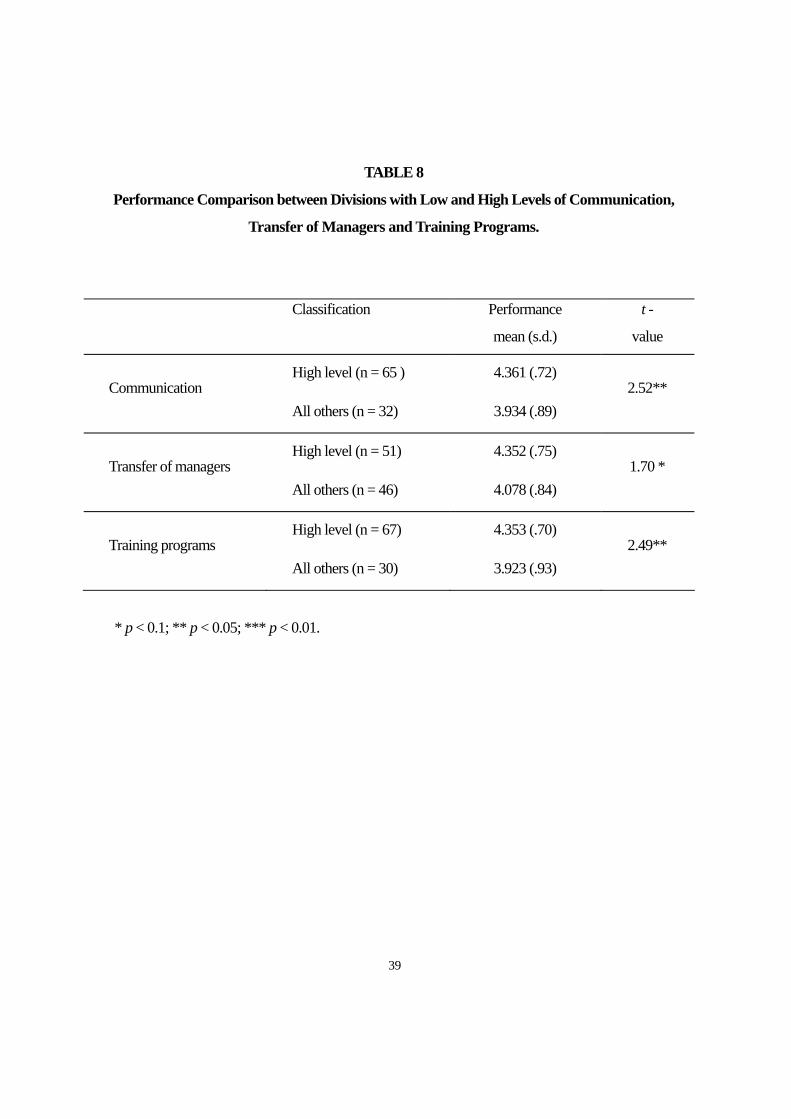
Finally, our fourth hypothesis proposed that divisions with high levels of communication, training and
transfer of people will outperform all others. To test this, we used the median value for each one of
these variables as our cut-off point to assign divisions into “high” and “low” groups. The performance
of divisions in the two groups were then compared, as before. The results are shown in table 8.
-------------------------
put table 8 here
-------------------------
As predicted by Hypothesis 4, divisions with high levels of communication, training and transfer of
people tend to outperform all other divisions. The difference in performance is statistically significant
and in support of H4.
SUMMARY AND CONCLUSION
In this paper, we examined the issue of ambidexterity within the context of diversified firms.
Specifically, we proposed that ambidexterity is the ability of an organization to pursue two
disparate things at the same time. Within a diversified firm, such a situation arises when divisions
face conflicting strategic imperatives, forcing the corporate parent to reconcile two disparate
demands: granting autonomy to the division while exercising central control. We, therefore,
explored how the corporate parent could achieve this kind of ambidexterity.
We proposed a variety of non-structural mechanisms that could be used by corporate HQs to
effectively control divisions facing conflicting strategic imperatives. Using insights from the
multinational literature (e.g. Bartlett and Ghoshal, 1989), we argued that the corporate center
should grant these divisions operational autonomy while centralizing strategic and financial

23
decisions so as to achieve coordination and integration within the firm. In addition to this
autonomy solution, we proposed a cultural solution (conceptualized as shared values in this paper)
to resolve the strategic ambiguity dilemma. We argued that the existence of strong, shared values
within the organization would allow corporate headquarters to grant autonomy to divisions without
losing control over them. In addition, we proposed that frequent communication, frequent rotation
of managers, and corporate-sponsored training programs could all be employed as integrative
mechanisms so that on the one hand, divisions could have a lot of decision-making autonomy
while on the other hand, they can remain integrated within the firm.
Our evidence from 136 divisional general managers in 34 Taiwanese business groups suggests that
different divisions receive different levels of decision-making autonomy from corporate centers,
depending on the strategic scenarios faced by them. In addition, we found that divisions facing
scenarios of strategic ambiguity would be better served if they are given operational autonomy but
controlled centrally when it comes to strategic or financial issues. We also found evidence that
strong, shared values can help in managing strategic ambiguity. Finally, we found that the use of
communication, rotation of managers, and training programs can have a positive impact on the
performance of divisions facing strategic ambiguity. All these findings contribute to the emerging
literature on how to manage internal differentiation within diversified firms.
We believe that our findings are relevant not only for the diversification literature but also for the
literature on ambidextrous organizations. Most of the discussion on how to achieve ambidextrous
organizations has focused on finding the appropriate structure that would allow the firm to pursue
seemingly disparate and conflicting activities (e.g. Christensen, 1997; Duncan, 1976; O’Reilly and
Tushman, 2004). Yet, organization theory would suggest that structure is only one of the elements
of the organizational “context” that underpins the strategy of a firm (e.g. Ghoshal and Bartlett,
1994). Our research has uncovered several non-structural solutions that promote ambidexterity in
the firm. Future research should try to explore what other components of a firm’s organizational
context facilitate the adoption of ambidextrous behaviors by the firm.

24
REFERENCES
Adler, P., Goldoftas, B. and Levine, D. 1999. Flexibility versus Efficiency? A case study of model
changeovers in the Toyota production system. Organization Science, 10 (1): 43-68.
Ahuja, G. and Lampert, C.M. 2001. Entrepreneurship in the Large Corporation: A Longitudinal
Study of how established firms create breakthrough inventions. Strategic Management
Journal, 22: 521-543.
Barnard, C. 1939. The Function of the Executive, Harvard University Press, Cambridge, MA
Bartlett, C. A. and Ghoshal, S. 1989. Managing Across Borders. Harvard Business School Press,
Boston.
Benner, M. and Tushman, M. 2002. Process Management and Technological Innovation: A
Longitudinal Study of the Photography and Paint Industries. Administrative Science
Quarterly, 47: 676-706.
Benner, M. and Tushman, M. 2003. Exploitation, Exploration and Process Management: The
Productivity Dilemma Revisited. Academy of Management Review, 28 (2): 238-256.
Burgelman, R. and Sayles, L. 1986. Inside Corporate Innovation. New York: free Press.
Burns, T. and Stalker, G. M. 1961. The Management of Innovation. London: Tavistock
Publications.
Christensen, C. 1997. The Innovator’s Dilemma. Boston, MA: HBS Press.
Christensen, C. and Raynor, M. 2003. The Innovator’s Solution. Boston, MA: HBS Press.
Chu, W. 1997. “Internal Differentiation in Diversified Companies,” paper presented at the
Academy of Management Annual Conference, Boston, August 1997.
Costanzo, L.A. (2004): “Strategic foresight in a High Speed Environment,” Special Issue on
Organizational Foresight, Haridimos Tsoukas and Jill Shepherd (eds.), Futures, 36, 137-144.
Duncan, R.B. 1976. The ambidextrous organization: Designing dual structures for innovation. In
R.H. Kilmann, L.R. Pondy and D. Slevin (eds.): The Management of Organization, Vol. 1:
167-188, New York: North-Holland.
Eisenhardt, K. and Martin, J. 2000. Dynamic Capabilities: What are They? Strategic Management
Journal, 21: 1105-1121.
Galbraith, J. 1973. Designing Complex Organizations, Addison-Wesley.
25
Galbraith, J. 1977. Organization Design. Mass: Addison Wesley.
Ghemawat, P. and Costa, J. 1993. The Organizational Tension Between Static and Dynamic
Efficiency. Strategic Management Journal, 14: 59-73.
Ghoshal, S. and Bartlett, C. 1994. Linking Organizational Context and managerial action: The
dimensions of quality of management. Strategic Management Journal, 15: 91-112.
Ghoshal, S. & Nohria, N. 1989. Internal Differentiation within Multinational Corporations,
Strategic Management Journal, 10: 323-337.
Gibson, C.B. and Birkinshaw, J. 2004. The antecedents, consequences and mediating role of
organizational ambidexterity. Academy of Management Journal, 47 (2): 209-226.
Gilbert, C. and Bower, J. 2002. Disruptive Change: When trying harder is part of the problem.
Harvard Business Review, May: 94-101.
Govindarajan, V. 1988. A Contingency Approach to Strategy Implementation at Business-Unit
Level: Integrating Administrative Mechanism with Strategy. Academy of Management
Journal, 31: 826-853.
Govindarajan, V. & Fisher, J. 1990. Strategy, Control System, and Resource Sharing: effects on
Business-Unit Performance. Academy of Management Journal, 33: 259-285.
Gupta, A. K. and Govindarajan, V. 1984. Business Unit Strategy, Managerial Characteristics, and
Business Unit Effectiveness. Academy of Management Journal, 27: 25-41.
Gupta, A. K. & Govindarajan, V. 1986. Resource Sharing Among SBUs: Strategic Antecedents
and Administrative Implications. Academy of Management Journal, 29: 695-714.
Gupta, A. K. 1987. SBU strategies, Corporate-SBU Relations, and SBU Effectiveness in Strategy
Implementation. Academy of Management Journal, 30: 477-500.
Hamel, G. & Prahalad, C. K., 1983. Managing Strategic Responsibility in the MNC. Strategic
Management Journal, 4: 341-351.
He, Z. and Wong, P. 2004. Exploration Vs Exploitation: An Empirical Test of the Ambidexterity
Hypothesis. Organization Science, 15 (4): 481-494.
Hill, C. W. L. 1988. Corporate Control Type, Strategy, Size and Financial Performance. Journal of
Management Studies, 25: 403-417.
Hill, C.W.L. 1990: The functions of the Head Quarters Units in Multibusiness Firms? Working
paper, September 1990, Seattle: University of Washington.

26
Lawrence, P. R. & Dyer, D. 1983. Renewing American Industry, Free Press: New York.
Lawrence, P. R. and Lorsch, J. W. 1967. Organization and Environment: Managing Differentiation
and Integration. Harvard Business School Press, Boston.
Levinthal, D.A. and March, J.G. 1993. The myopia of learning. Strategic Management Journal,
14: 95-112.
Lioukas, S., Bourantas, D. and Papadakis, V. 1993. Decision making autonomy in state-owned
enterprises, Organization Science, Vol. 4, pp. 135-153.
MacKay, B. and McKiernan, P. 2004: “Exploring Strategy context with foresight,” European
Management Review, Special Edition, 1: 69-77.
March, J. 1991. Exploration and Exploitation in Organizational Learning. Organization Science. 2:
71-87.
McCann, J. E. & Fery, D. L. 1979. An Approach for Assessing and Managing Inter-Unit
Interdependency. Academy of Management Review, 4: 113-119.
McDonough, E.F. and Leifer, R. 1983. Using simultaneous Structures to cope with Uncertainty.
Academy of Management Journal, 26 (4): 727-735.
Nadler, D. A. and Tushman, M. L. 1988. Strategic Organization Design: Concepts, Tools &
Process, Scott, Foreman & Company.
Nohria, N, & Ghoshal, 1994. Differentiation Fit and Shared Values: Alternatives for Managing
Headquarters-Subsidiary Relations, Strategic Management Journal, 15: 491-502.
O’Reilly III C.A. and Tushman, M. 2004. The Ambidextrous Organization. Harvard Business
Review, April, 74-81.
Ouchi, W. G. 1980. Markets, Bureaucracies, and Clan. Administrative Science Quarterly, 25: 129-
141.
Perrow, C. 1967. A Framework for the Comparative Analysis of Organizations. American
Sociological Review, 32(2): 194-208.
Pfeffer, J. 1981. Power in Organizations. Boston: Pitman.
Pfeffer, J. and Salancik, G. R. 1978. The External Control of Organizations: A Resource
Dependency Perspective. New York: Harper & Row.
Porter, M. E. 1985. Competitive Strategy. The Free Press, New York.
Porter, M. E. 1987. From Competitive Advantage to Corporate Strategy. Harvard Business Review,
27
May-June: 43-60.
Porter, M.E. 1996. What is Strategy? Harvard Business Review, November-December: 61-78.
Prahalad, C. K. & Doz, Y. L. 1981. An Approach to Strategic Control in MNCs’. Sloan
Management Review, Summer: 5-19.
Prahalad, C. K. & Doz, Y. L. 1987. The Multinational Mission: Balancing Local Demands and
Global Vision. Free Press: New York..
Pugh, D. S., Hickson, D. F., Hinings, C. R. and Turner, C. 1968. Dimensions of Organization
Control. Administrative Science Quarterly, June: 65-105.
Quinn, R. and Cameron, K. 1988. Paradox and Transformation. Cambridge, MA: Ballinger
Publications.
Sheremata, W.A. 2000. Centrifugal and Centripetal forces in radical new product development
under time pressure. Academy of Management Review, 25 (2): 389-408.
Siggelkow, N. and Levinthal, D.A. 2003. Temporarily divide to conquer: Centralized,
decentralized and reintegrated organizational approaches to exploration and adaptation.
Organization Science. 14 (6): 650-669.
Siggelkow, N. and Rivkin, J.W. 2005. Speed and Search: Designing organizations for turbulence
and complexity. Organization Science, 16 (2): 101-122.
Thompson, J.D. 1967. Organizations in Action, New York: McGraw-Hill.
Tushman, M. and O’Reilly III C. A. 1996. Ambidextrous organizations. California Management
Review, 38 (4): 8-30.
Tushman, M., Smith, W., Wood, R., Westerman, G. and O’Reilly, C. 2004. Innovation Streams and
Ambidextrous Organization Designs, Working Paper, Harvard Business School.
Vancil, R. F. 1980. Decentralization: Managing Ambiguity by Design. Homewood, IL: Dow-
Jones, Irwin.
Volberda, H.W. 1996. Toward the Flexible Form: How to Remain Vital in Hypercompetitive
Environments. Organization Science. 7 (4): 359-374.
Williamson, O. E. 1975. Markets and Hierarchies, MacMillan, New York.
Winter, S.G. and Szulanski, G. 2001. Replication as Strategy. Organization Science. 12: 730-743.
Woodward, J. 1965. Industrial Organization: Theory and Practice. London: Oxford University
Press.

28

29
APPENDIX
Measurement of Independent Variables
Environmental Complexity faced by each division: This variable was operationalized as the
degree of technical dynamism that each division faced in its industrial environment. Technical
dynamism was proposed by Lawrence & Dyer (1983) as an important constituent of
environmental information complexity. Respondents were asked to indicate the speed of technical
innovation in their main industry, ranging from “Extremely rapid” (=7) to “Extremely slow” (=1).
The higher the score, the more dynamic the environment they faced. The mean score was 4.62.
Competitive Strategy of each division: Each division’s competitive strategy (low-cost or
differentiation—Porter, 1985) was calculated as follows: using a seven-point response scale
ranging from significantly lower (=1) to significantly higher (=7), divisional general managers
were asked to position their products relative to their competitors on the following three
dimensions: percentage of sales spent on research and development, product quality, and product
features. Divisions with higher-than-average combined scores were classified as following the
differentiation strategy; divisions with lower scores were identified with the low cost strategy.
Scores ranged from 3.33 to 7.00, with a mean score of 5.07 (Cronbach Alpha = .7805).
Resource Sharing among Divisions: Following the measure developed by Gupta &
Govindarajan (1986), resource sharing was defined as the importance and extent of resource
sharing between a division and other divisions in terms of the following eight functions:
manufacturing, marketing/sales, R&D, purchasing, human capital, financing, governance liaison,
and other administrative activities. Two questions, both with a seven-point response scale, were
asked for each of the functions. The first question collected data on a function’s importance in
implementing the competitive strategy of a division, ranging from “not important at all” (=1) to
“extremely important” (=7). The second question collected data on the extent to which a division
shared resources with other divisions in each function, ranging from “none” (=1) to “a very great
deal” (=7). Using as weights the data on the importance of the various functions on strategic
implementation, we then developed a weighted-average measure of a division’s degree of resource
30
sharing with other divisions. The higher the weighted-average score, the higher the level of
resource sharing that existed. Scores ranged from 0.86 to 5.63, with a mean of 3.57 (Cronbach
Alpha = .8511).
Shared Values: This variable was operationalized as the combination of two items: (a) the extent
to which corporate HQs emphasized the development and management of organizational value
systems, and (b) the extent to which organizational members recognized the existence of these
values. Thirteen questions were developed: ten items tried to capture the extent to which a firm
used functions such as recruitment, selection, socialization processes, rites, ceremonies and rituals
to develop and manage its value systems; and three items estimated the degree to which
organizational members recognized the existence of organizational values. A seven-point scale
was used to ask the respondents to provide information on their degree of agreement on the 13
statements, ranging from “Strongly disagree” (=1) to “Strongly agree” (=7). A mean score for the
13 items was calculated as the measure for “shared values” in our statistical analysis. The higher
the mean score, the higher the degree of shared values within the firm. Scores ranged from 4.19 to
6.19, with a mean of 5.46 (Cronbach Alpha = .7508).
Communication: Divisional managers were asked how much and how often communication took
place between a division and its corporate center. Respondents were asked to answer this on a
seven-point scale, ranging from “Never” (=1) to “Very Frequently” (=7). The higher the score, the
higher the level of communication a division had. Scores ranged from 1 to 7, with a mean of 5.27.
Transfer of Managers: A single question asked the respondents to indicate how much and how
frequently rotation of managers across divisions within the firm happened. A seven-point scale was
used, ranging from “It never happens” (=1) to “It happens very frequently” (=7). The higher the
score, the higher the frequency of transfer of managers that the division had. Scores ranged from 1
to 7, with a mean of 4.43.
Training Programs: Divisional managers were asked to indicate how frequently they trained their
employees by enrolling them in company training programs. A seven-point scale was used,

31
ranging from “Never” (=1) to “Very Frequently” (=7). The higher the score, the higher the level of
training programs that a division offered. Scores ranged from 1 to 7, with a mean of 4.98.

32
TABLE 1
Three Contingency Variables and Eight Possible Scenarios That a Division Might Face
Scenario Environmental
Conditions
Competitive
Strategy
Interdependence
among Divisions
Strategic
Ambiguity
1 Volatile Differentiation High Yes
2 Volatile Cost High Yes
3 Volatile Cost Low Yes
4 Volatile Differentiation Low No
5 Stable Cost Low Yes
6 Stable Cost High No
7 Stable Differentiation High Yes
8 Stable Differentiation Low Yes
33
TABLE 2
Summary Statistics and Reliability of the Autonomy Variables
Divisional
Autonomy
Mean S.D. Items Alpha
STRATEGIC 4.98 1.23 14 .9175
OPERATE 6.11 1.11 19 .9573
FINANCIAL 4.83 1.74 5 .8861
OVERALL 5.31 1.22 38 -- *
* : The Cronbach alpha of the overall degree of autonomy was not calculated because this variable
was simply the arithmetic mean of STRATEGIC, OPERATE, and FINANCIAL.

34
TABLE 3
Number of Divisions in Each Strategic Scenario
Scenarios Number
of Divisions
Percentage
(%)
Strategic
Ambiguity
1 23 16.9 Yes
2 15 11.0 Yes
3 18 13.2 Yes
4 19 14.0 No
5 20 14.7 Yes
6 20 14.7 No
7 11 8.1 Yes
8 10 7.4 Yes
Total 136 100%

35
TABLE 4
Autonomy Given to Divisions Placed in the Different Scenarios
Scenarios One-way
ANOVA
Duncan’s
4
(n = 19)
1, 2, 3, 5, 7, 8
(n = 97)
6
(n =20) F value Sig. F test *
STRATEGIC mean (s.d.) 5.76 (1.08) 5.02 (1.15) 4.23 (1.18) 8.738 .000
4 > (1, 2, 3, 5, 7, 8)
(1, 2, 3, 5, 7, 8) >6
4 > 6
OPERATE mean (s.d.) 6.57 (.74) 6.17 (1.07) 5.61 (1.09) 4.252 .016
(1, 2, 3, 5, 7, 8) > 6
4 > 6
FINANCIALmean (s.d.) 5.79 (1.34) 4.84 (1.75) 3.97 (1.62) 5.716 .004
4 > (1, 2, 3, 5, 7, 8)
(1, 2, 3, 5, 7, 8) > 6
4 > 6
OVERALL mean (s.d.) 6.04 (.96) 5.34 (1.19) 4.60 (1.07) 7.707 .001
4 > (1, 2, 3, 5, 7, 8)
(1, 2, 3, 5, 7, 8) > 6
4 > 6
* : Relations shown here are those with statistical significance at the p < 0.05 level.

36
TABLE 5
Managing Strategic Ambiguity: Divisional Autonomy and Performance
Method Classification # Performance
mean (s.d.) t - values
A Appropriate autonomy (n = 13)
All others (n = 84)
4.59 (.92)
4.18 (.78) 1.72 *
B Appropriate autonomy (n = 14)
All others (n = 83)
4.57 (.89)
4,18 (.78) 1.68 *
C Appropriate autonomy (n = 3)
All others (n = 94)
4.48 (1.09)
4.23 (.80) .52
D Appropriate autonomy (n = 0)
All others (n = 97)
-- --
* p < 0.1; ** p < 0.05; *** p < 0.01.
# : The number of divisions with appropriate autonomy which our four methods produce are quite
consistent with probability rules. For method A, the probability for a division to show appropriate
autonomy is 0.5×0.5×0.5 = 0.125 (i.e. low STRATEGIC and high OPERATE and low
FINANCIAL). The same is true for method B. For method C, the probability becomes 0.037
(0.333×0.333×0.333), while for method D, the probability is 0.0156 (0.25×0.25×0.25).
37
TABLE 6
Structural Autonomy to Divisions and Performance
Method Classification # Performance
mean (s.d.) t - values
A Low structural autonomy (n = 48)
All others (n = 49)
4.33 (.73)
4.15 (.87) 1.10
B Low structural autonomy (n = 32)
All others (n = 65)
4.42 (.76)
4.14 (.82) 1.64 *
C Low structural autonomy (n = 24)
All others (n = 73)
4.54 (.81)
4.13 (.78) 2.22 **
* p < 0.1; ** p < 0.05; *** p < 0.01.
# : The number of divisions with low structural autonomy (SF/O) which our three methods produce are
also quite consistent with probability rules. For method A, the probability for a division to show low SF/O
is 0.5. For method B, the probability becomes 0.333, and for method C, the probability is 0.25.

38
TABLE 7
Performance Comparison between Divisions with High Shared Values and All Others
Method Classification Performance
mean (s.d.)
t - value
A High shared values (n = 49)
All others (n = 48)
4.367 (.82)
4.099 (.77) 1.67 *
B High shared values (n = 47)
All others (n = 50)
4.381 (.84)
4.098 (.76) 1.76 *
C High shared values (n = 31)
All others (n = 66)
4.439 (.88)
4.139 (.75) 1.73 *
D High shared values (n = 24)
All others (n = 73)
4.521 (.88)
4.141 (.76) 2.04 **
* p < 0.1; ** p < 0.05; *** p < 0.01.
39
TABLE 8
Performance Comparison between Divisions with Low and High Levels of Communication,
Transfer of Managers and Training Programs.
Classification Performance
mean (s.d.)
t -
value
Communication High level (n = 65 )
All others (n = 32)
4.361 (.72)
3.934 (.89) 2.52**
Transfer of managers High level (n = 51)
All others (n = 46)
4.352 (.75)
4.078 (.84) 1.70 *
Training programs High level (n = 67)
All others (n = 30)
4.353 (.70)
3.923 (.93) 2.49**
* p < 0.1; ** p < 0.05; *** p < 0.01.