innovations in v6.5 functional safety & graph editor · you can already define a part failure...
TRANSCRIPT

© 2013 APIS IT GmbH | IQ Software Update Tutorial – Excerpt: Functional Safety & Graph-Editor 1
Innovations in V6.5 Functional Safety &
Graph Editor
2013-07-15
© 2013 APIS IT GmbH | IQ Software Update Tutorial – Excerpt: Functional Safety & Graph-Editor 2
Copyright / authors:
Version: July 01, 2013
Authors: Training team of APIS Informationstechnologien GmbH
Copyright © 2013, APIS Informationstechnologien GmbH
---
Excerpt from the training material: Chapter „Funktional Safety“ and „Graph-Editor“
Deutsch
Alle in dieser Schulungsunterlage enthaltenen Angaben sind ohne Gewähr und können ohne wei-
tere Benachrichtigung geändert werden. Die APIS Informationstechnologien GmbH geht hiermit
keinerlei Verpflichtung ein. Die in dieser Schulungsunterlage beschriebene Software ist auf Basis
eines Lizenzvertrags geliefert.
Alle Rechte sind weltweit vorbehalten. Diese Schulungsunterlage darf, auch auszugsweise, ohne
ausdrückliche schriftliche Erlaubnis der APIS Informationstechnologien GmbH weder vervielfältigt,
weitergegeben, umgeschrieben, in einer Datenbank gespeichert oder in irgendeine Sprache über-
setzt werden. Die Vervielfältigung ist weder elektronisch, noch mechanisch, magnetisch oder ma-
nuell erlaubt.
Einschränkung der Gewährleistung
Die APIS Informationstechnologien GmbH übernimmt keine Haftung für die Vollständigkeit und
Richtigkeit des Inhalts sowie für die Leistungen der erwähnten Software. Herausgeber und Autoren
können für fehlerhafte Angaben und deren Folgen weder eine juristische Verantwortung noch ir-
gendeine Haftung übernehmen.
English
All data contained in this training course document are not guaranteed and can be changed with-
out any notification. APIS Informationstechnologien GmbH hereby holds no obligation. The soft-
ware described in this training course document is supplied on the basis of a license agreement.
All rights are reserved worldwide. This training course documentation must not be copied, redis-
tributed, rewritten, stored in a database or translated into another language without the express
written permission of APIS Informationstechnologien GmbH. The duplication in any manner is not
permitted.
Limited warranty
APIS Informationstechnologien GmbH cannot guarantee the completeness and correctness of the
content and / or functionality of the mentioned software. Publishers and authors cannot be held le-
gally responsible for incorrect data and their consequences.
© 2013 APIS IT GmbH | IQ Software Update Tutorial – Excerpt: Functional Safety & Graph-Editor 3
IQ Software: Update tutorial
This seminar is to provide the participants with an introduction in the material innovations of ver-
sion 6.5 compared to the previous version 6, which allow for an even more effective use of the al-
ready known software features. For this purpose, it is urgently required for the participants to al-
ready have a basic knowledge of how to operate the IQ Software (V6). The tutorial therefore does
by no means claim to fully explain the IQ software systems. For further information on the opera-
tion of IQ software systems, please refer to the software’s help function. Handling of the software’s
help function in general requires basic knowledge of the IQ Software terminology.
You will find more details on other seminars and workshops on the internet at
http://www.apis.de/en/training.
The present document is intended for you to study privately in addition to the seminar. You can
take your time to read about the core issues from the seminar and implement them together with
what you have already learned in your daily work. It is recommended that you take your own notes
during the seminar.
Our lecturers always try to promptly answer questions arising during the seminar. So there will be
changes in the course and content represented in the documents, depending on the respective
training situation. You should therefore make your own notes as already mentioned.
Should a slide or presentation be illegible or an explanation incomprehensible, please approach
your lecturer immediately.
We would like to remind you to retrieve your voicemail messages at the end of each seminar day –
we do not want you to miss any important information.
We wish you success and optimal results in this tutorial.
Note:
The male terminology is used for both genders in this tutorial document, simply to improve reada-
bility. The wording used is of course intended to equally address the female participants. Thank
you for your understanding.

© 2013 APIS IT GmbH | IQ Software Update Tutorial – Excerpt: Functional Safety & Graph-Editor 4
1 Functional Safety innovations
1.1 Specification of standard: IEC 61508 or ISO 26262
IQ Software has so far supported the two Functional Safety standards IEC 61508 and ISO 26262.
The respective dialogs in the software did not make any differentiation between the two standards.
That is why some of the input fields have double names (e.g. SIL/ASIL) and the user has to find
out the meaning for himself based on the current context (see figure).
You can now use the radio button in the Document settings (menu Tools | Document set-
tings) in the Functional Safety category to choose which of the two standards is to be the
basis of your analysis (see figure).
As a result, the information texts of the input fields correspond to the set standard (e.g. instead of
SIL/ASIL, now ASIL). Furthermore, clicking on the button No entry will open the risk graph related to
the respective standard, where you select the required SIL or ASIL categorization with the mouse
and confirm with Ok. The following figures show the input dialog and the risk graph respectively for
both standards.
Figure 1: Input dialog and risk graph for ISO 26262

© 2013 APIS IT GmbH | IQ Software Update Tutorial – Excerpt: Functional Safety & Graph-Editor 5
Figure 2: Input dialog and risk graph for IEC 61508
By clicking on the Cross button, you cancel an already assigned SIL or ASIL categorization and re-
set the status to No entry.
1.2 Failure rate for system element
You can already define a part failure rate for a system element in the FMEDA form by entering the
required value in the column FIT. This information has so far been available in the FMEDA form
only. It is now possible to define the so-called part failure rate in the Properties dialog of the re-
spective system element. For this purpose, highlight the required system element in any editor and
select the context menu item Properties. On the Functional Safety tab, define the failure rate. If
the display option Functional Safety Parameters is enabled in the current editor, the part
failure rate is also shown. In the structure list e.g., the failure rate in brackets precedes the name of
the system element (see figure).
1.3 Define function as safety goal and SIL/ASIL categorization
Usually, you record the safety goals derived in the hazard and risk analysis by means of functions
in the IQ Software. The new Graph Editor provides numerous filtering options with regard to
safety goals. To enable IQ Software to distinguish between functions acting as safety goals and
"normal" functions, a new attribute called Is safety goal was integrated in the Properties dialog
(Functional Safety tab) of a function.
At first, enter the required safety goal by means of a function. Then select the context menu item
Functional Safety Parameters. By clicking on the button No entry, you can use the displayed
risk graph to make a SIL or ASIL categorization. This is an optional feature, which has no effect on
the Functional Safety calculations!
Define the function to be a safety goal by ticking the option Is safety goal (see figure). IQ
Software now regards all the associated failures as safety-critical failures (abbreviated in the

© 2013 APIS IT GmbH | IQ Software Update Tutorial – Excerpt: Functional Safety & Graph-Editor 6
Graph Editor as SCF). If these failures also have an (A)SIL > QM they are so-called dangerous-
safety-critical failures (abbreviated in the Graph Editor as DSCF).
The filtering options regarding Functional Safety in the Graph Editor are directly or indirectly
based on the function attribute Is safety goal. To successfully use them, you need to consistently
enable this attribute by ticking it for the respective functions. The Graph Editor itself will be ex-
plained in more detail in a separate chapter.
1.4 Define fault tolerance time as well as fault detection and fault reac-tion time
To calculate the quantitative parameters of Functional Safety, record the negated safety goals as
top failures and afterwards define the target values using the context menu item Functional
Safety parameters. You can specify the so-called fault tolerance time (FTT) as another target
value for this (see figure). All the functions involved in the safety mechanism need to be completed
within this specified period of time.
If the safety mechanism exceeds this specified time, the safety goal is regarded as violated.

© 2013 APIS IT GmbH | IQ Software Update Tutorial – Excerpt: Functional Safety & Graph-Editor 7
A safety mechanism usually consists of so-called failure detection (in IQ: error detection) as well as
failure reaction (in IQ: error response). Both are derived from a function respectively and can be
integrated as separate objects in failure nets in the IQ Software. A certain period of time is required
for their execution. That is why you can define a fault detection time for the object error detection
and a fault reaction time for the object error response. For this purpose, highlight the respective ob-
ject, select the context menu item Functional Safety parameters and enter the time in the
corresponding input field (fault detection time or fault reaction time) (see figure).
You can later conduct a target/actual performance comparison for the time in the Graph Editor,
with the IQ Software comparing according to the following formula:
FTT ≤ incoming failure path with maximum total (of time) of fault detection time(s) and fault reac-
tion time(s)
If you derive several failure detections or failure reactions from one function, there is the possi-
bility to define a processing time for the function in the section Functional Safety parame-
ters. It will then be passed on as the fault detection time to all the related failure detections or as
the fault reaction time to all the related failure reactions. Thus, it is not necessary to define the time
for each failure detection or failure reaction separately. The processing time will be passed on only,
if there is no fault detection time available yet for the failure detection or no fault reaction time
available yet for the failure reaction.
1.5 Attribute: Error detection required/not required
Your failure nets contain a variety of failures, for which you need to decide within the scope of
Functional Safety, whether or not a safety mechanism is required. That is why you can now choose
the necessity of error detection for a failure via the attribute Error detection is to be one of the three
conditions required, not required and undefined. For this purpose, highlight the respective failure,

© 2013 APIS IT GmbH | IQ Software Update Tutorial – Excerpt: Functional Safety & Graph-Editor 8
select the context menu item Properties and then switch to the Attributes tab. Enable the re-
quired condition using the radio button (see figure).
This attribute has no effect on the Functional Safety calculations! You can create filters though,
which search for all failures requiring or not requiring error detection. For this purpose, the new cri-
terion No error detection required equals was included on the filtering level Failure in
the category Mechatronic criteria (see figure).
© 2013 APIS IT GmbH | IQ Software Update Tutorial – Excerpt: Functional Safety & Graph-Editor 9
2 Graph Editor
The Graph Editor is a new additional editor, which is able to represent structural interrelations
as well as interrelations of function and failure nets. Thus, it combines the three editors Struc-
ture Tree, Function Net, and Failure Net in one editor. Primarily analyses in the field of
Functional Safety and of mechatronic systems have shown that an integrated analytical tool is re-
quired. The Graph Editor provides numerous options for analysis purposes, depending on the
context, which exceed the previously known features of the IQ Software by far. This becomes pri-
marily apparent in the representation and analysis of interrelations between functions and failures
respectively.
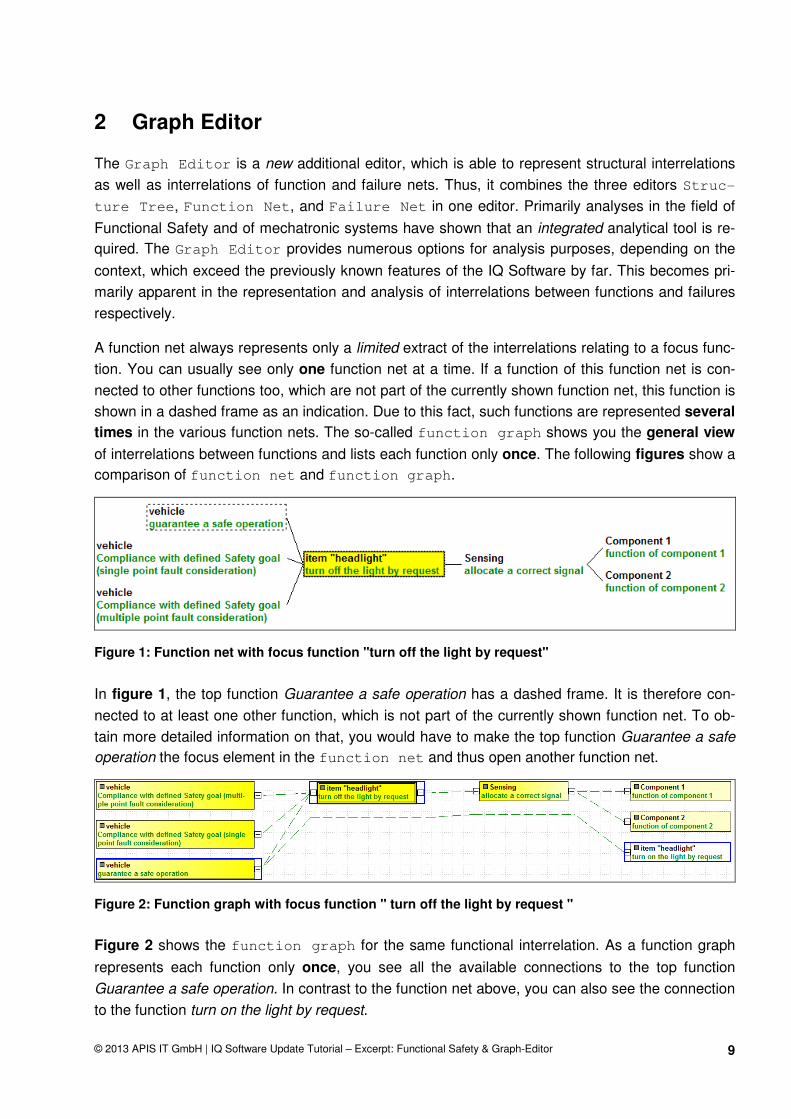
A function net always represents only a limited extract of the interrelations relating to a focus func-
tion. You can usually see only one function net at a time. If a function of this function net is con-
nected to other functions too, which are not part of the currently shown function net, this function is
shown in a dashed frame as an indication. Due to this fact, such functions are represented several
times in the various function nets. The so-called function graph shows you the general view
of interrelations between functions and lists each function only once. The following figures show a
comparison of function net and function graph.
Figure 1: Function net with focus function "turn off the light by request"
In figure 1, the top function Guarantee a safe operation has a dashed frame. It is therefore con-
nected to at least one other function, which is not part of the currently shown function net. To ob-
tain more detailed information on that, you would have to make the top function Guarantee a safe
operation the focus element in the function net and thus open another function net.
Figure 2: Function graph with focus function " turn off the light by request "
Figure 2 shows the function graph for the same functional interrelation. As a function graph
represents each function only once, you see all the available connections to the top function
Guarantee a safe operation. In contrast to the function net above, you can also see the connection
to the function turn on the light by request.

© 2013 APIS IT GmbH | IQ Software Update Tutorial – Excerpt: Functional Safety & Graph-Editor 10
A failure net again represents only a limited extract of the interrelations relating to a focus failure.
You can usually see only one failure net at a time. If a failure of this failure net is connected to oth-
er failures too, which are not part of the currently shown failure net, this failure is shown in a
dashed frame as an indication. Due to this fact, such failures are represented several times in the
various failure nets. The so-called failure graph shows you the general view of the interrela-
tions between failures and lists each failure only once. The following figures show a comparison
of failure net and failure graph.
Figure 3: Failure net with focus failure "turn off the light without request"
In figure 3, the base failure open has a dashed frame. It is therefore connected to at least one
other failure, which is not part of the currently shown failure net. To obtain more detailed infor-
mation on that, you would have to make the base failure open the focus element in the failure
net and thus open another failure net.
Figure 4: Failure graph with focus failure " turn off the light without request"
Figure 4 shows the failure graph for the same failure interrelation. As a failure graph repre-
sents each failure only once, you see all the available connections to the base failure open. In con-
trast to the failure net above, you can also see the connection to the failure MPF: latent failure dur-
ing sensing as well as its effect.
Similar to function and failure nets, the function graphs and failure graphs can be cross-structural.
The following chapters will introduce the Graph Editor step by step.
2.1 Open the Graph Editor
Open the Graph Editor by selecting the item Graph Editor from the Editors menu. Alterna-
tively, you can also use the Graph Editor icon from the left toolbar.
© 2013 APIS IT GmbH | IQ Software Update Tutorial – Excerpt: Functional Safety & Graph-Editor 11
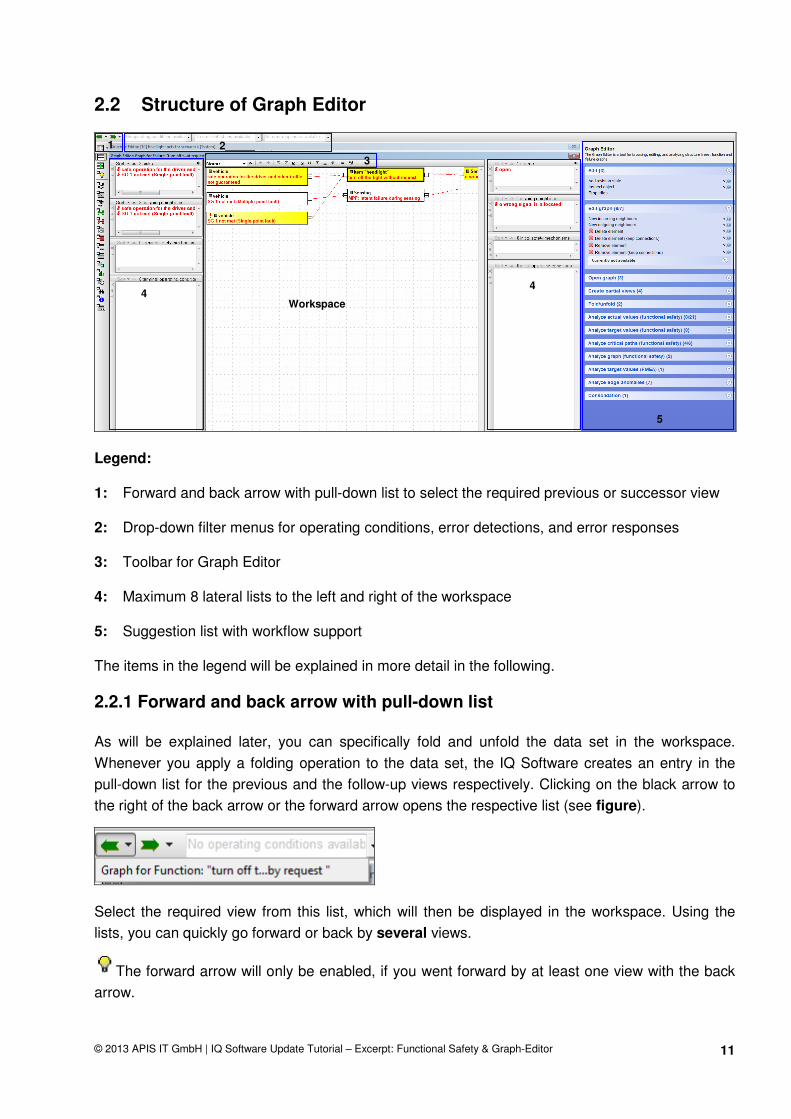
2.2 Structure of Graph Editor
Legend:
1: Forward and back arrow with pull-down list to select the required previous or successor view
2: Drop-down filter menus for operating conditions, error detections, and error responses
3: Toolbar for Graph Editor
4: Maximum 8 lateral lists to the left and right of the workspace
5: Suggestion list with workflow support
The items in the legend will be explained in more detail in the following.
2.2.1 Forward and back arrow with pull-down list
As will be explained later, you can specifically fold and unfold the data set in the workspace.
Whenever you apply a folding operation to the data set, the IQ Software creates an entry in the
pull-down list for the previous and the follow-up views respectively. Clicking on the black arrow to
the right of the back arrow or the forward arrow opens the respective list (see figure).
Select the required view from this list, which will then be displayed in the workspace. Using the
lists, you can quickly go forward or back by several views.
The forward arrow will only be enabled, if you went forward by at least one view with the back
arrow.
Workspace
1 2
3
4 4
5
© 2013 APIS IT GmbH | IQ Software Update Tutorial – Excerpt: Functional Safety & Graph-Editor 12
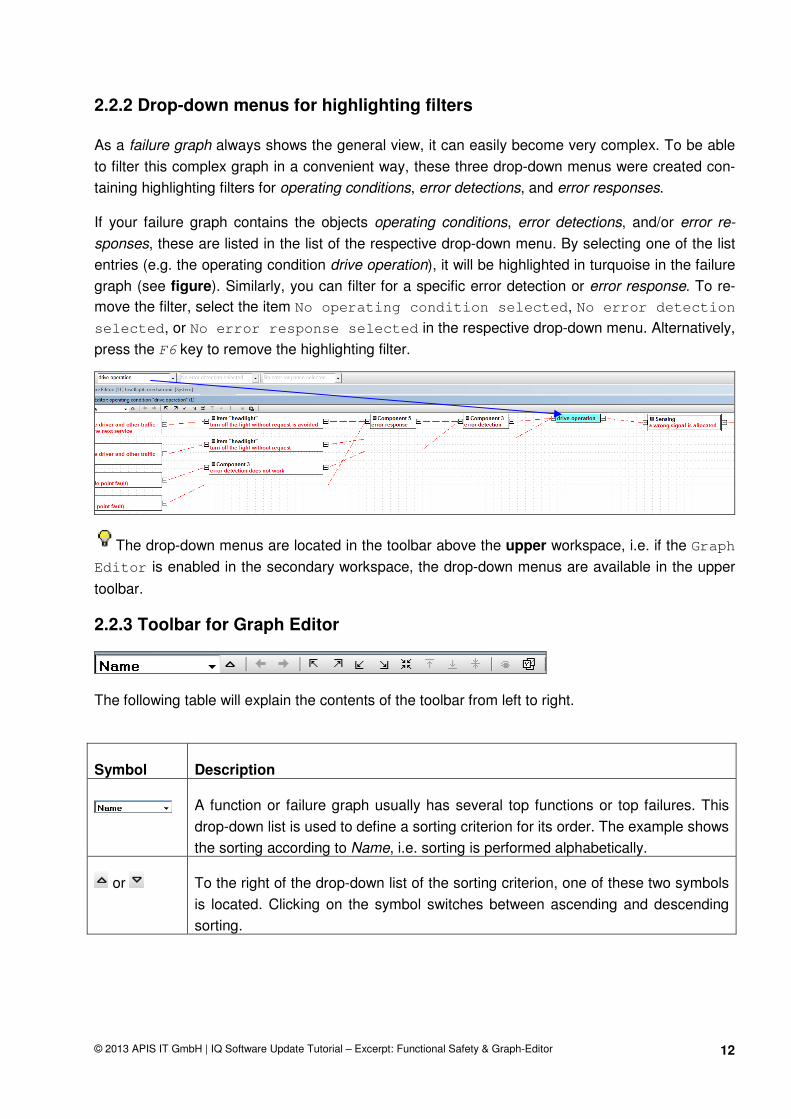
2.2.2 Drop-down menus for highlighting filters
As a failure graph always shows the general view, it can easily become very complex. To be able
to filter this complex graph in a convenient way, these three drop-down menus were created con-
taining highlighting filters for operating conditions, error detections, and error responses.
If your failure graph contains the objects operating conditions, error detections, and/or error re-
sponses, these are listed in the list of the respective drop-down menu. By selecting one of the list
entries (e.g. the operating condition drive operation), it will be highlighted in turquoise in the failure
graph (see figure). Similarly, you can filter for a specific error detection or error response. To re-
move the filter, select the item No operating condition selected, No error detection
selected, or No error response selected in the respective drop-down menu. Alternatively,
press the F6 key to remove the highlighting filter.
The drop-down menus are located in the toolbar above the upper workspace, i.e. if the Graph
Editor is enabled in the secondary workspace, the drop-down menus are available in the upper
toolbar.
2.2.3 Toolbar for Graph Editor
The following table will explain the contents of the toolbar from left to right.
Symbol Description
A function or failure graph usually has several top functions or top failures. This
drop-down list is used to define a sorting criterion for its order. The example shows
the sorting according to Name, i.e. sorting is performed alphabetically.
or To the right of the drop-down list of the sorting criterion, one of these two symbols
is located. Clicking on the symbol switches between ascending and descending
sorting.

© 2013 APIS IT GmbH | IQ Software Update Tutorial – Excerpt: Functional Safety & Graph-Editor 13
Symbol Description
IQ Software memorizes all former focus objects in the Graph Editor. Use the
back and forward arrows to go from the current focus element to previous or fol-
lowing focus elements.
Note: The forward arrow is only enabled, if you have clicked at least once on the
back arrow.
As the graphs can become very complex (see figure), there are various icons for
navigation in the graph. This icon moves the focus element (blue frame) to the top
left corner of the graph (see figure).
The focus element is moved to the top right corner of the graph (see figure).
The focus element is moved to the bottom left corner of the graph.
The focus element is moved to the bottom right corner of the graph.

© 2013 APIS IT GmbH | IQ Software Update Tutorial – Excerpt: Functional Safety & Graph-Editor 14
Symbol Description
The focus element is moved to the center of the graph (see figure).
The graph representation groups the different objects in columns. If an element in
a column is highlighted, this icon moves the focus element to the beginning of this
column (see figure).
The graph representation groups the different objects in columns. If an element in
a column is highlighted, this icon moves the focus element to the end of this col-
umn.
The graph representation groups the different objects in columns. If an element in
a column is highlighted, this icon moves the focus element to the center of this
column.
Clicking on the icon opens the Properties dialog for the current focus element.
Opens the Display options of the Graph Editors. The number of available
display options depends on the current type of graph (structure graph, function
graph, failure graph). The failure graph provides the maximum number of options.
2.2.4 Side lists on the left and/or right of the workspace
The graphs quickly become very complex. If the current focus element is somewhere in the middle
columns, you had to scroll on the X-axis to the left or right for a relatively long time to be able to
see e.g. all the connected top failures or base failures. The various side lists show you certain con-
text information on the current focus element instead.
In the Display options of the Graph Editor (menu View | Display options) in the cate-
gory Side lists options, you define the lists to be displayed by ticking them. The lists availa-

© 2013 APIS IT GmbH | IQ Software Update Tutorial – Excerpt: Functional Safety & Graph-Editor 15
ble in the display options depend on the current type of graph (structure graph, function graph, fail-
ure graph). The failure graph provides a maximum of 8 lists. A maximum of 4 lists is provided for
the structure graph and the function graph.
The following table explains the purpose of the 8 lists. In general, the left side lists refer to the con-
text information in the graph to the left of the focus element (also called sink, terminal, or outgoing).
The right side lists refer to the context information in the graph to the right of the focus element
(also called source, initial, or incoming).
Name of list Description
Sinks Shows all top elements for the focus element (root, top function, or top failure)
Outgoing neigh-
bours
Lists all elements directly connected to the focus element in the direction of ef-
fects (one level to the left)
Terminal safety
mechanisms
The objects error detection and error response are regarded as safety mecha-
nisms. If error detections and/or error responses are available in the direction of
effects, starting at the focus element, they are listed.
Terminal operat-
ing conditions
If operating conditions are available, starting at the focus element, in the direc-
tion of effects, they are listed.
Sources Shows all base elements for the focus element (respectively last structure level,
base functions, or base failures (root causes)).
Incoming neigh-
bours
Lists all elements directly connected to the focus element in the direction of
causes (one level to the right)
Initial safety
mechanisms
The objects error detection and error response are regarded as safety mecha-
nisms. If error detections and/or error responses are available in the direction of
causes, starting at the focus element, they are listed.
Initial operating
conditions
If operating conditions are available, starting at the focus element, in the direc-
tion of causes, they are listed.
Please note that selecting these lists in the Display options specifies only the content of the
lists. To be able to see the lists, you need to hide or show them as required in the View menu of
the Graph Editor by selecting the corresponding item (see figure).
© 2013 APIS IT GmbH | IQ Software Update Tutorial – Excerpt: Functional Safety & Graph-Editor 16
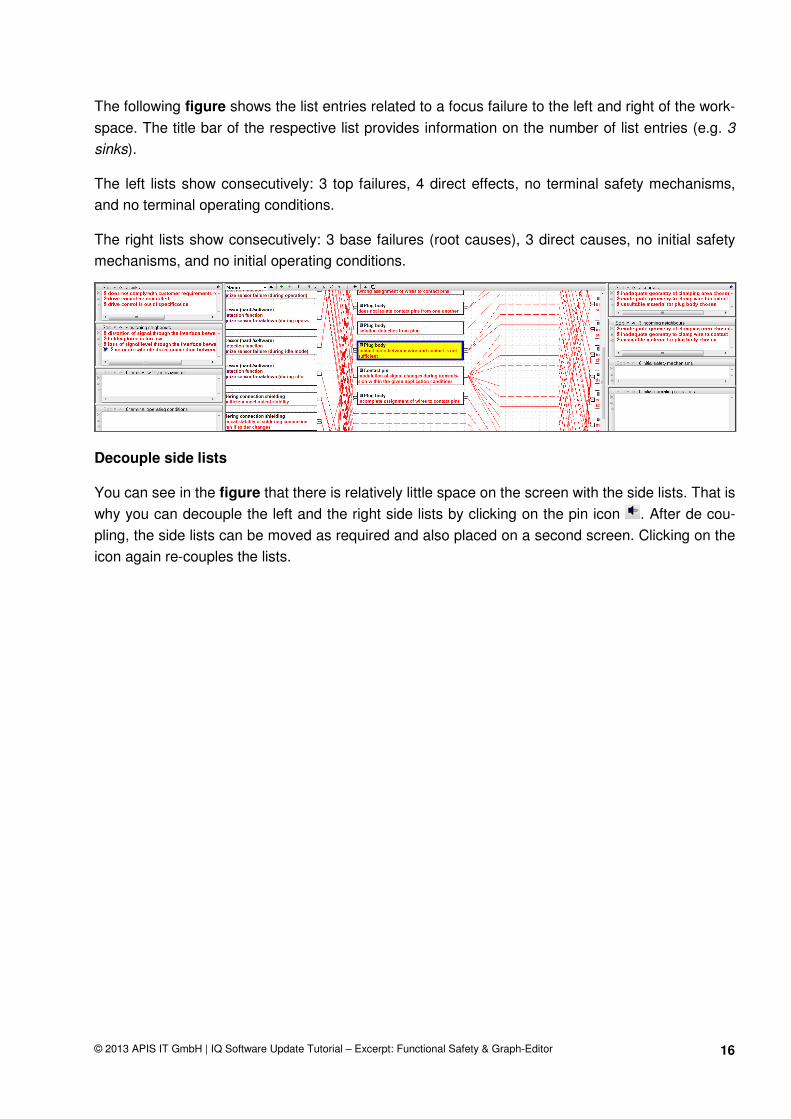
The following figure shows the list entries related to a focus failure to the left and right of the work-
space. The title bar of the respective list provides information on the number of list entries (e.g. 3
sinks).
The left lists show consecutively: 3 top failures, 4 direct effects, no terminal safety mechanisms,
and no terminal operating conditions.
The right lists show consecutively: 3 base failures (root causes), 3 direct causes, no initial safety
mechanisms, and no initial operating conditions.
Decouple side lists
You can see in the figure that there is relatively little space on the screen with the side lists. That is
why you can decouple the left and the right side lists by clicking on the pin icon . After de cou-
pling, the side lists can be moved as required and also placed on a second screen. Clicking on the
icon again re-couples the lists.

© 2013 APIS IT GmbH | IQ Software Update Tutorial – Excerpt: Functional Safety & Graph-Editor 17
Use list entries for synchronization
After having highlighted a list entry, you can use the items Synchronize secondary work-
space or Synchronize primary workspace from the Windows menu and thus synchronize
to the top or bottom workspace. Power users can use the shortcuts (Ctrl+Q or Shift+Ctrl+Q)
for these items.
You can also synchronize from the decoupled lists.
Sort list entries
Clicking on the arrows above each list ( ) sorts the entries in this list in ascending or de-
scending order. The black arrow shows the current sorting order.
Other options for list entries
As soon as you have highlighted an entry in a list, three icons on the left will be enabled for this list
(see figure).
The following table explains their meaning.
Symbol Description
Folds the current graph so that only the connecting path between the highlighted
list entry and the current focus element is shown (see figure before and after).
Only the connection from the list entry drive control is out of specification to the fo-
cus element does not protect the conductor from mechanical and chemical influ-
ences is visible. The plus signs to the left and right of an object indicate that ob-
jects are folded in the current view.
This icon opens the Properties dialog for the highlighted list entry.
The icon changes the focus element in the graph to become the list entry.
© 2013 APIS IT GmbH | IQ Software Update Tutorial – Excerpt: Functional Safety & Graph-Editor 18
2.2.5 Suggestion list and workflow support
IQ Software provides you with various concepts of operation to edit your data. These include menu
items, context menu items, toolbar icons, as well as shortcuts. Depending on the editor and the
context, the menu lists are possibly quite comprehensive, and beginners in particular do not always
know the effect of a certain command.
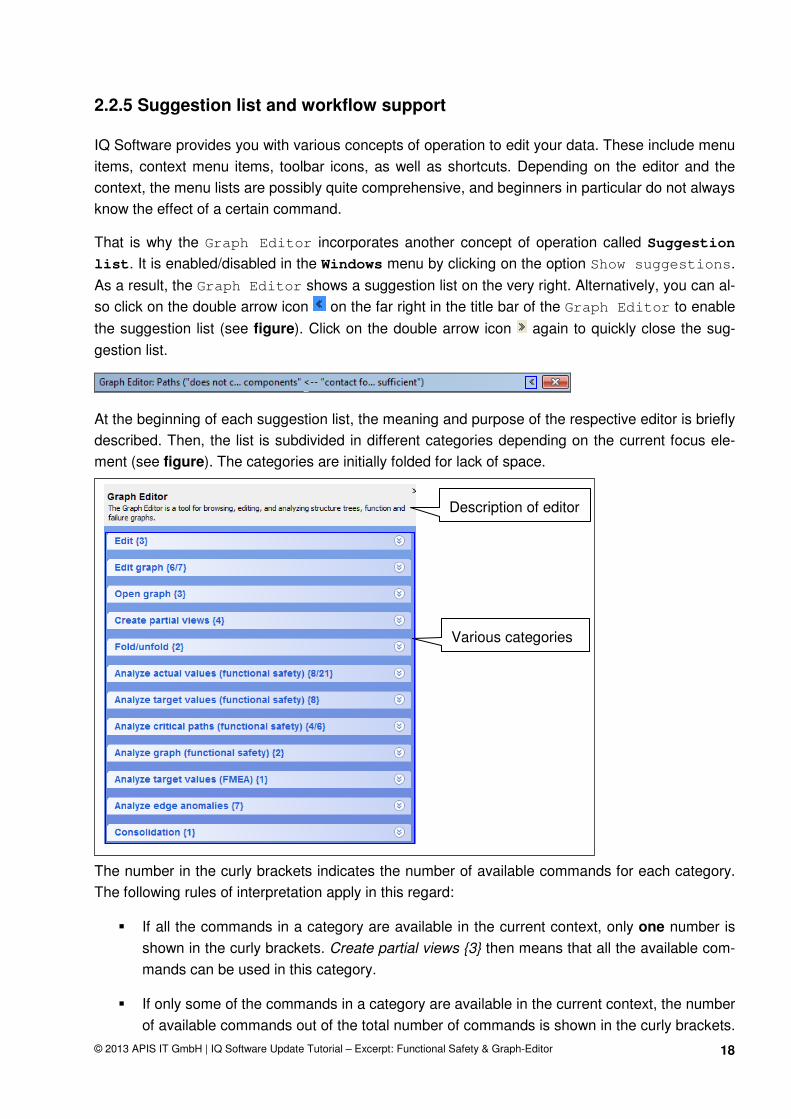
That is why the Graph Editor incorporates another concept of operation called Suggestion
list. It is enabled/disabled in the Windows menu by clicking on the option Show suggestions.
As a result, the Graph Editor shows a suggestion list on the very right. Alternatively, you can al-
so click on the double arrow icon on the far right in the title bar of the Graph Editor to enable
the suggestion list (see figure). Click on the double arrow icon again to quickly close the sug-
gestion list.
At the beginning of each suggestion list, the meaning and purpose of the respective editor is briefly
described. Then, the list is subdivided in different categories depending on the current focus ele-
ment (see figure). The categories are initially folded for lack of space.
The number in the curly brackets indicates the number of available commands for each category.
The following rules of interpretation apply in this regard:
� If all the commands in a category are available in the current context, only one number is
shown in the curly brackets. Create partial views {3} then means that all the available com-
mands can be used in this category.
� If only some of the commands in a category are available in the current context, the number
of available commands out of the total number of commands is shown in the curly brackets.
Description of editor
Various categories
© 2013 APIS IT GmbH | IQ Software Update Tutorial – Excerpt: Functional Safety & Graph-Editor 19
Edit graph {6/7} then means that 6 commands out of the available 7 commands can be
used in this category. Analyze actual values (functional safety) {0/19} in contrast means
that none of the 19 possible commands can be used in this category.
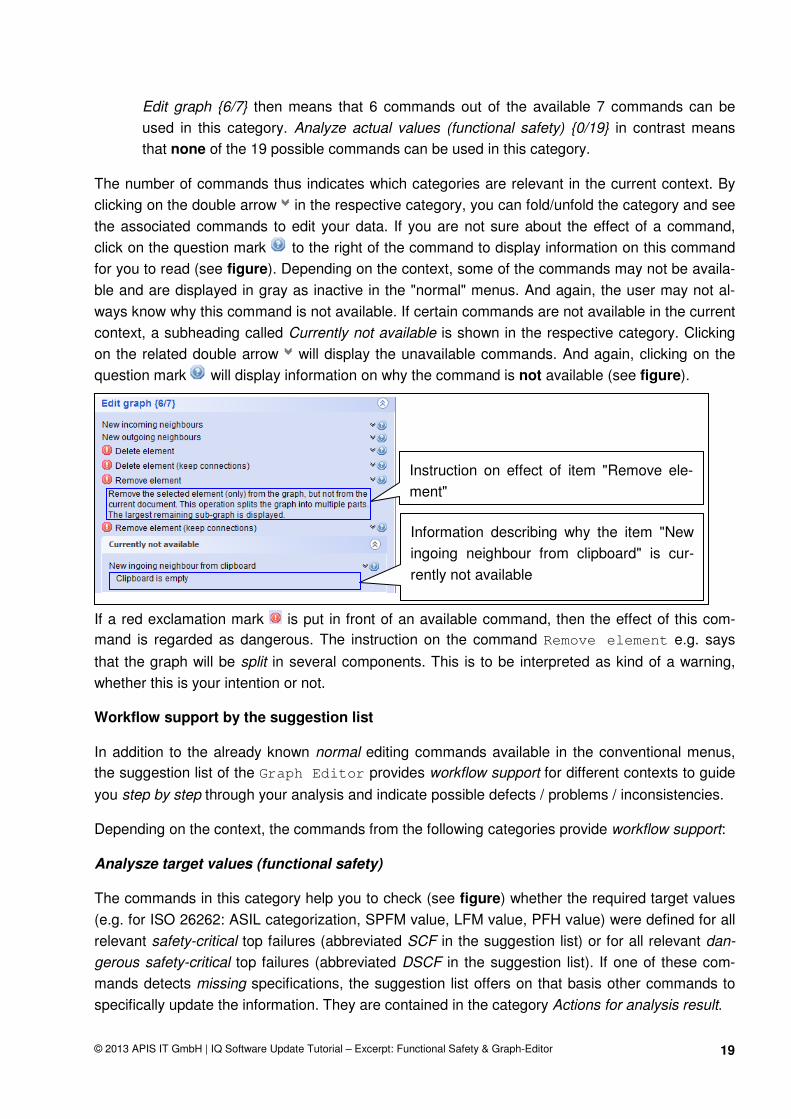
The number of commands thus indicates which categories are relevant in the current context. By
clicking on the double arrow in the respective category, you can fold/unfold the category and see
the associated commands to edit your data. If you are not sure about the effect of a command,
click on the question mark to the right of the command to display information on this command
for you to read (see figure). Depending on the context, some of the commands may not be availa-
ble and are displayed in gray as inactive in the "normal" menus. And again, the user may not al-
ways know why this command is not available. If certain commands are not available in the current
context, a subheading called Currently not available is shown in the respective category. Clicking
on the related double arrow will display the unavailable commands. And again, clicking on the
question mark will display information on why the command is not available (see figure).
If a red exclamation mark is put in front of an available command, then the effect of this com-
mand is regarded as dangerous. The instruction on the command Remove element e.g. says
that the graph will be split in several components. This is to be interpreted as kind of a warning,
whether this is your intention or not.
Workflow support by the suggestion list
In addition to the already known normal editing commands available in the conventional menus,
the suggestion list of the Graph Editor provides workflow support for different contexts to guide
you step by step through your analysis and indicate possible defects / problems / inconsistencies.
Depending on the context, the commands from the following categories provide workflow support:
Analysze target values (functional safety)
The commands in this category help you to check (see figure) whether the required target values
(e.g. for ISO 26262: ASIL categorization, SPFM value, LFM value, PFH value) were defined for all
relevant safety-critical top failures (abbreviated SCF in the suggestion list) or for all relevant dan-
gerous safety-critical top failures (abbreviated DSCF in the suggestion list). If one of these com-
mands detects missing specifications, the suggestion list offers on that basis other commands to
specifically update the information. They are contained in the category Actions for analysis result.
Instruction on effect of item "Remove ele-
ment"
Information describing why the item "New
ingoing neighbour from clipboard" is cur-
rently not available

© 2013 APIS IT GmbH | IQ Software Update Tutorial – Excerpt: Functional Safety & Graph-Editor 20
If the name of the command does not tell you anything about its effect, please click on the
question mark next to the command and read the explanatory information.
Analyze actual values (functional safety)
The commands in this category help you to check (see figure) whether the required actual values
(e.g. for ISO 26262: failure rate, DCSPF, DCLF) were defined for all relevant safety-critical base fail-
ures as well as possibly available error detections and error responses. If one of these commands
detects missing specifications, the suggestion list offers on that basis other commands to specifi-
cally update the information. They are contained in the category Actions for analysis result.
If the name of the command does not tell you anything about its effect, please click on the
question mark next to the command and read the explanatory information.
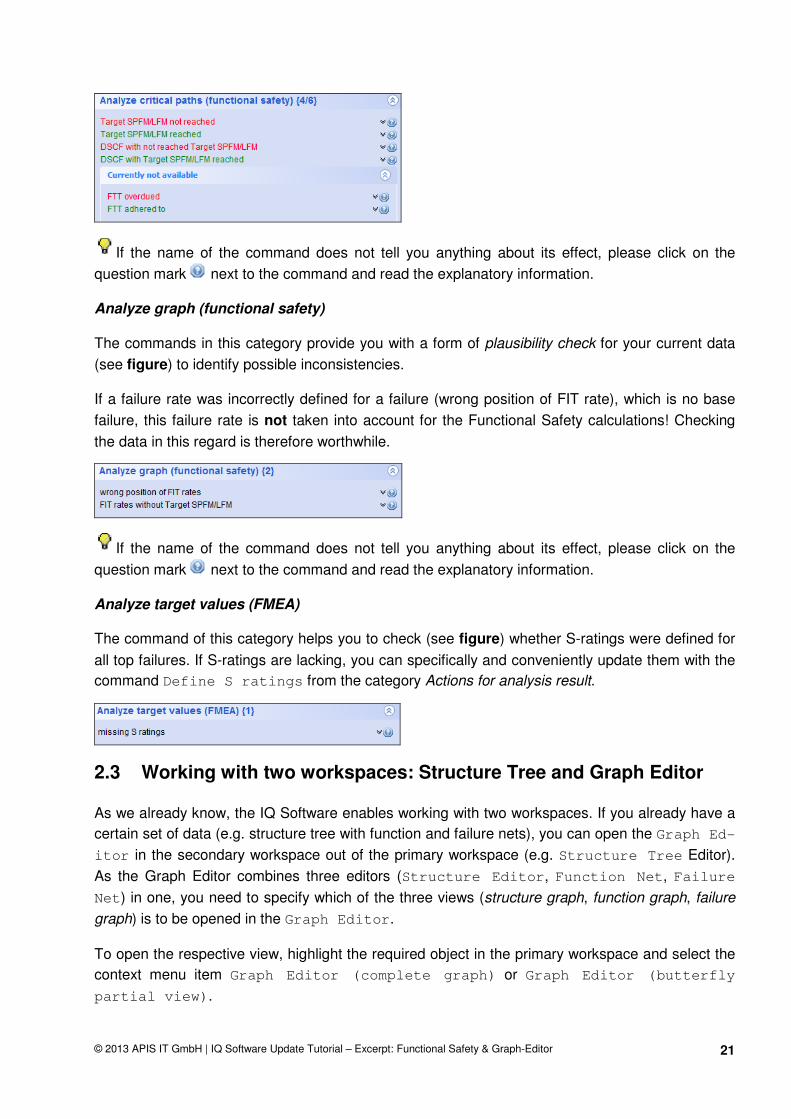
Analyze critical paths (functional safety)
The commands in this category help you to check (see figure) whether the defined target values
for all relevant safety-critical top failures are complied with according to the current design.
© 2013 APIS IT GmbH | IQ Software Update Tutorial – Excerpt: Functional Safety & Graph-Editor 21
If the name of the command does not tell you anything about its effect, please click on the
question mark next to the command and read the explanatory information.
Analyze graph (functional safety)
The commands in this category provide you with a form of plausibility check for your current data
(see figure) to identify possible inconsistencies.
If a failure rate was incorrectly defined for a failure (wrong position of FIT rate), which is no base
failure, this failure rate is not taken into account for the Functional Safety calculations! Checking
the data in this regard is therefore worthwhile.
If the name of the command does not tell you anything about its effect, please click on the
question mark next to the command and read the explanatory information.
Analyze target values (FMEA)
The command of this category helps you to check (see figure) whether S-ratings were defined for
all top failures. If S-ratings are lacking, you can specifically and conveniently update them with the
command Define S ratings from the category Actions for analysis result.
2.3 Working with two workspaces: Structure Tree and Graph Editor
As we already know, the IQ Software enables working with two workspaces. If you already have a
certain set of data (e.g. structure tree with function and failure nets), you can open the Graph Ed-
itor in the secondary workspace out of the primary workspace (e.g. Structure Tree Editor).
As the Graph Editor combines three editors (Structure Editor, Function Net, Failure
Net) in one, you need to specify which of the three views (structure graph, function graph, failure
graph) is to be opened in the Graph Editor.
To open the respective view, highlight the required object in the primary workspace and select the
context menu item Graph Editor (complete graph) or Graph Editor (butterfly
partial view).

© 2013 APIS IT GmbH | IQ Software Update Tutorial – Excerpt: Functional Safety & Graph-Editor 22
The following principles apply:
� If the object highlighted in the primary workspace is a system element, then the structure
graph view will be opened in the Graph Editor.
� If the object highlighted in the primary workspace is a function, a characteristic, or a re-
quirement, then the function graph view will be opened in the Graph Editor.
� If the object highlighted in the primary workspace is a failure, then the failure graph view will
be opened in the Graph Editor.
I.e., you define the initial view in the Graph Editor by means of the highlighted object type in the
primary workspace.
The command Graph Editor (complete graph)shows you the entire graph for the focus ob-
ject (marked with a blue frame for clarification) in the Graph Editor (see figure).
The command Graph Editor (butterfly partial view)shows you only a part of the en-
tire graph in the Graph Editor (see figure).
Butterfly view means: Show all precursors and successors connected to the focus object (marked
with a blue frame for clarification) and hide the other parts of the graph.
In the sample butterfly view above, three objects are hidden (marked by a red frame for clarifica-
tion).
You can synchronize as usual between the two workspaces.
2.4 Guidelines for correct interpretation of graphs
There are several things you need to know in order to interpret a graph in the right way. They will
be explained in the following.
2.4.1 Plus and minus signs
A minus sign is initially located to the left and/or the right of each object in the Graph Editor,
depending on the current context (see figure). A minus sign means that all the direct precursors or
direct successors are visible.

© 2013 APIS IT GmbH | IQ Software Update Tutorial – Excerpt: Functional Safety & Graph-Editor 23
By clicking with the mouse on a minus, you can specifically fold all direct precursors or direct suc-
cessors. A plus sign then indicates that elements are folded (see figure). In the example, the
cause open is hidden for the failure a wrong signal is allocated. That is why a plus sign is located
on the right side of this failure.
Clicking on the plus sign will unfold the corresponding part of the graph and as a result, there is
again a minus sign .
2.4.2 Connecting lines (edges)
There are three different possibilities in the graphs, what the connections (edges) between objects
may look like. The following table explains them.
Line type Description
If two objects are connected by a continuous line, deleting this connection does not
split the graph in two parts.
If two objects are connected by a dashed line, deleting this connection does split the
graph in two parts.
The suggestion list provides commands to filter the graph for critical paths according
to the respective filter criterion. The critical paths are indicated by turquoise connect-
ing lines (continuous line or dashed line) within the graph.
2.4.3 Color of selection: color gradient starting at the focus element
The graphs can quickly become very complex. To facilitate the navigation, the Graph Editor
does not only highlight the selected focus element in the defined color of selection (e.g. yellow), but
also all the precursors and/or successors connected to this element and all objects connected to
the precursors/successors applying to the focus element as well (see figure). This color gradient
provides you with an initial overview of the connections of the focus element.
© 2013 APIS IT GmbH | IQ Software Update Tutorial – Excerpt: Functional Safety & Graph-Editor 24
In the example, the focus element (blue frame) is highlighted in yellow. The relevant precursors
and successors are highlighted in yellow too, but the yellow color becomes lighter with the distance
from the focus element increasing. The function turn off the light by request is neither directly nor
indirectly connected to the focus element and has therefore by default a white background.
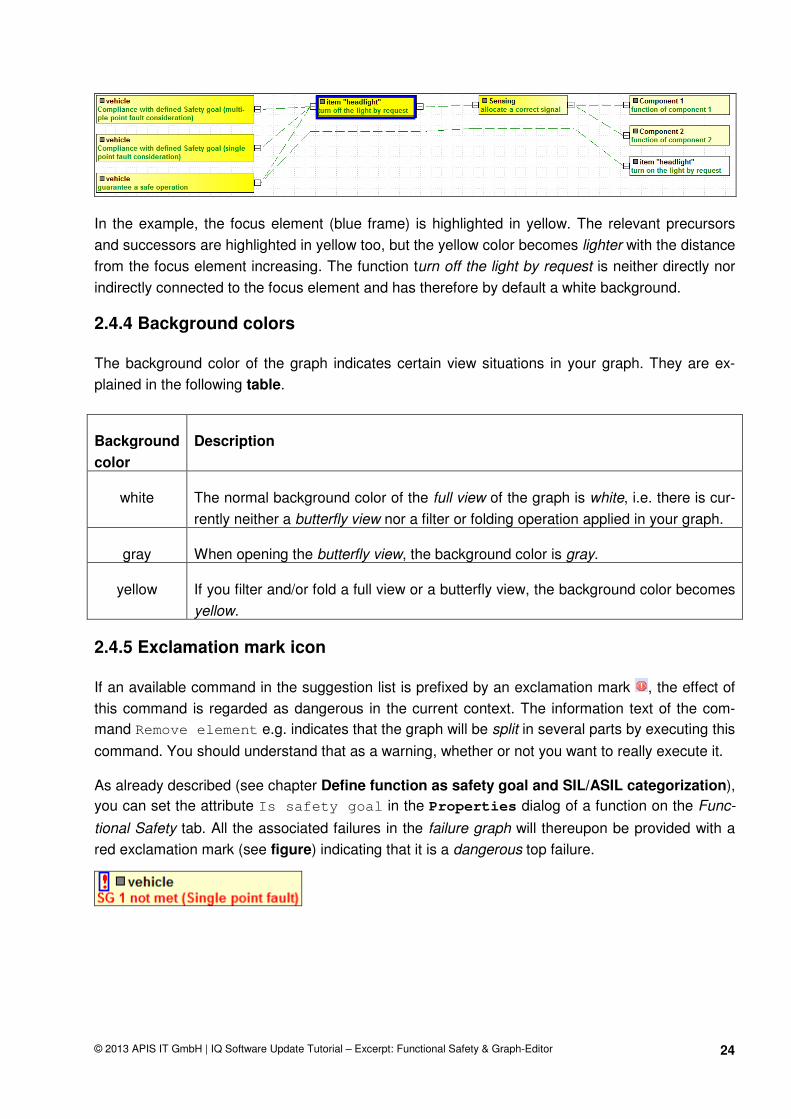
2.4.4 Background colors
The background color of the graph indicates certain view situations in your graph. They are ex-
plained in the following table.
Background
color
Description
white The normal background color of the full view of the graph is white, i.e. there is cur-
rently neither a butterfly view nor a filter or folding operation applied in your graph.
gray When opening the butterfly view, the background color is gray.
yellow If you filter and/or fold a full view or a butterfly view, the background color becomes
yellow.
2.4.5 Exclamation mark icon
If an available command in the suggestion list is prefixed by an exclamation mark , the effect of
this command is regarded as dangerous in the current context. The information text of the com-
mand Remove element e.g. indicates that the graph will be split in several parts by executing this
command. You should understand that as a warning, whether or not you want to really execute it.
As already described (see chapter Define function as safety goal and SIL/ASIL categorization),
you can set the attribute Is safety goal in the Properties dialog of a function on the Func-
tional Safety tab. All the associated failures in the failure graph will thereupon be provided with a
red exclamation mark (see figure) indicating that it is a dangerous top failure.

© 2013 APIS IT GmbH | IQ Software Update Tutorial – Excerpt: Functional Safety & Graph-Editor 25
2.5 Create partial views
The suggestion list of the Graph Editor provides a category called Create partial views (see
figure).
If the name of the command does not tell you anything about its effect, please click on the
question mark next to the command and read the explanatory information.
Using the partial view commands, you can conveniently and specifically show/hide the precursors
and/or successors of a selected focus element to be able to concentrate better on a certain section
in the graph. You create a so-called partial view based on the original graph.
The following figures show at first the original graph with the focus element turn off the light with-
out request and then the result of the partial view Show outgoing paths.
The plus sign to the right of the focus element indicates the folded sections.
Clicking with the mouse on the plus sign unfolds certain section again as required. You may
need to press the plus sign several times in succession to return to the initial view. You can return
very quickly to the initial view by executing the item Open complete view from the View catego-
ry in the suggestion list.
If your initial view in the Graph Editor was the butterfly view, the item Open complete
view will return you to the butterfly view.
© 2013 APIS IT GmbH | IQ Software Update Tutorial – Excerpt: Functional Safety & Graph-Editor 26
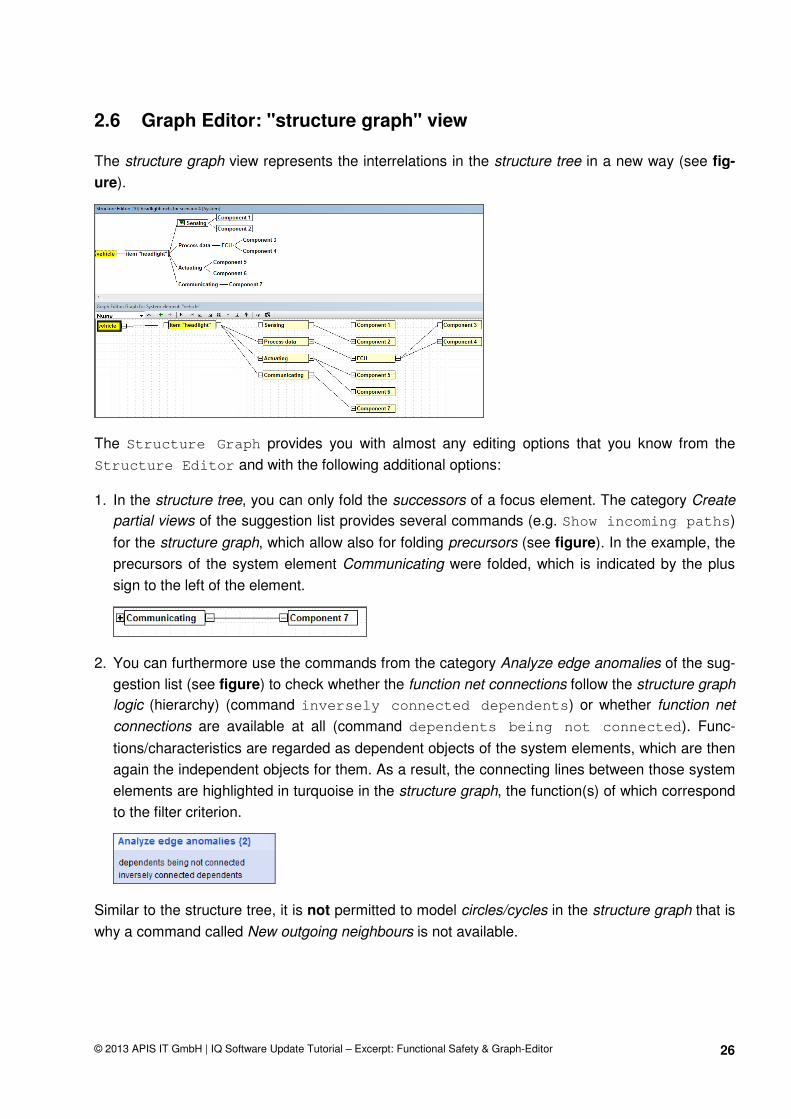
2.6 Graph Editor: "structure graph" view
The structure graph view represents the interrelations in the structure tree in a new way (see fig-
ure).
The Structure Graph provides you with almost any editing options that you know from the
Structure Editor and with the following additional options:
1. In the structure tree, you can only fold the successors of a focus element. The category Create
partial views of the suggestion list provides several commands (e.g. Show incoming paths)
for the structure graph, which allow also for folding precursors (see figure). In the example, the
precursors of the system element Communicating were folded, which is indicated by the plus
sign to the left of the element.
2. You can furthermore use the commands from the category Analyze edge anomalies of the sug-
gestion list (see figure) to check whether the function net connections follow the structure graph
logic (hierarchy) (command inversely connected dependents) or whether function net
connections are available at all (command dependents being not connected). Func-
tions/characteristics are regarded as dependent objects of the system elements, which are then
again the independent objects for them. As a result, the connecting lines between those system
elements are highlighted in turquoise in the structure graph, the function(s) of which correspond
to the filter criterion.
Similar to the structure tree, it is not permitted to model circles/cycles in the structure graph that is
why a command called New outgoing neighbours is not available.
© 2013 APIS IT GmbH | IQ Software Update Tutorial – Excerpt: Functional Safety & Graph-Editor 27
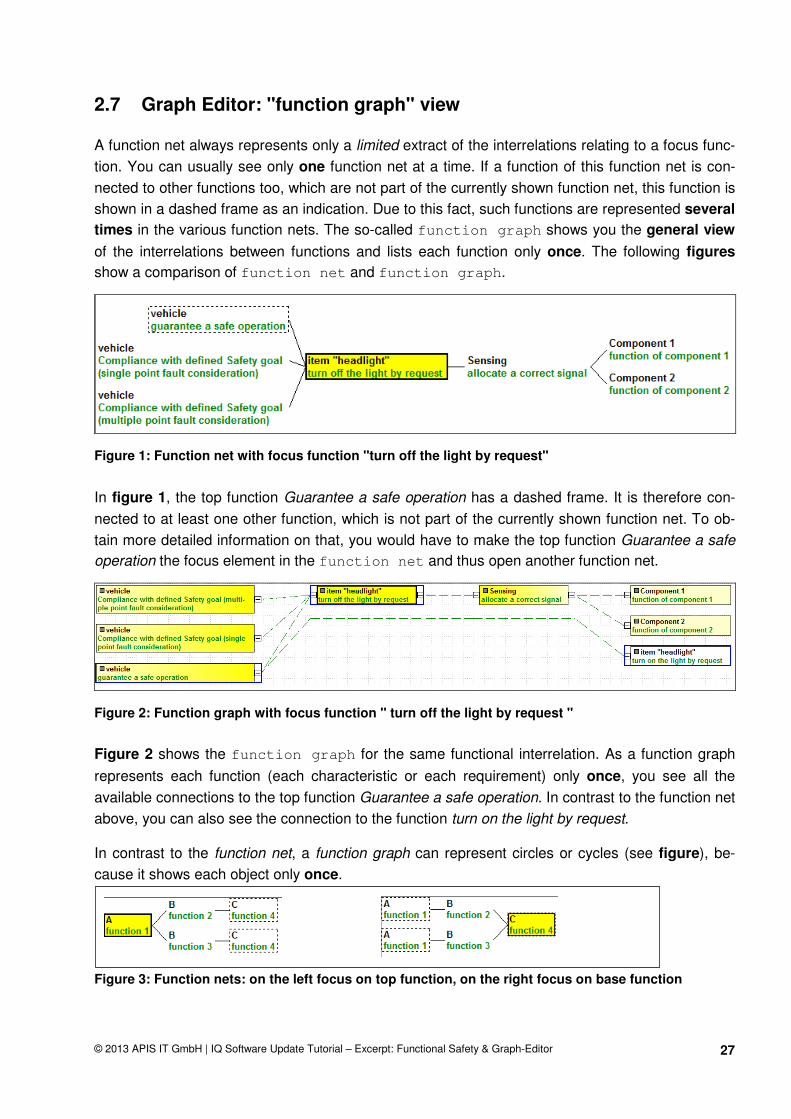
2.7 Graph Editor: "function graph" view
A function net always represents only a limited extract of the interrelations relating to a focus func-
tion. You can usually see only one function net at a time. If a function of this function net is con-
nected to other functions too, which are not part of the currently shown function net, this function is
shown in a dashed frame as an indication. Due to this fact, such functions are represented several
times in the various function nets. The so-called function graph shows you the general view
of the interrelations between functions and lists each function only once. The following figures
show a comparison of function net and function graph.
Figure 1: Function net with focus function "turn off the light by request"
In figure 1, the top function Guarantee a safe operation has a dashed frame. It is therefore con-
nected to at least one other function, which is not part of the currently shown function net. To ob-
tain more detailed information on that, you would have to make the top function Guarantee a safe
operation the focus element in the function net and thus open another function net.
Figure 2: Function graph with focus function " turn off the light by request "
Figure 2 shows the function graph for the same functional interrelation. As a function graph
represents each function (each characteristic or each requirement) only once, you see all the
available connections to the top function Guarantee a safe operation. In contrast to the function net
above, you can also see the connection to the function turn on the light by request.
In contrast to the function net, a function graph can represent circles or cycles (see figure), be-
cause it shows each object only once.
Figure 3: Function nets: on the left focus on top function, on the right focus on base function

© 2013 APIS IT GmbH | IQ Software Update Tutorial – Excerpt: Functional Safety & Graph-Editor 28
Figure 4: Corresponding function graph
The function graph provides you with almost any editing options that you know from the
Function Net Editor and additional options. A few of them will be introduced in the following:
1. In the function net, you can only fold the successors of a focus element. The category Create
partial views of the suggestion list provides several commands (e.g. Show incoming paths)
for the function graph, which allow also folding precursors (see figure). In the example, the pre-
cursors of the system element turn of the light by request were folded, which is indicated by the
plus sign to the left of the element.
2. You can furthermore use the commands from the category Analyze edge anomalies of the sug-
gestion list (see figure) to check whether the failure net connections follow the function net
connections (hierarchy) (command inversely connected dependents) or whether func-
tion net connections are available at all (command dependents being not connected).
Failures are regarded as dependent objects of the functions (characteristics or requirements),
which are then again the independent objects for them. As a result, the connecting lines be-
tween those functions are highlighted in turquoise in the function graph, the failure(s) of which
correspond to the filter criterion. In certain data constellations, the command Redundant con-
nections is available to identify whether two objects are connected with each other by more
than one path (redundant connections). If required, you can delete the redundant connection.
2.8 Graph Editor: "failure graph" view
A failure net again represents only a limited extract of the interrelations relating to a focus failure.
You can usually see only one failure net at a time. If a failure of this failure net is connected to oth-
er failures too, which are not part of the currently shown failure net, this failure is shown in a
dashed frame as an indication. Due to this fact, such failures are represented several times in the
various failure nets. The so-called failure graph shows you the general view of the interrela-
tions between failures and lists each failure only once. The following figures show a comparison
of failure net and failure graph.
© 2013 APIS IT GmbH | IQ Software Update Tutorial – Excerpt: Functional Safety & Graph-Editor 29
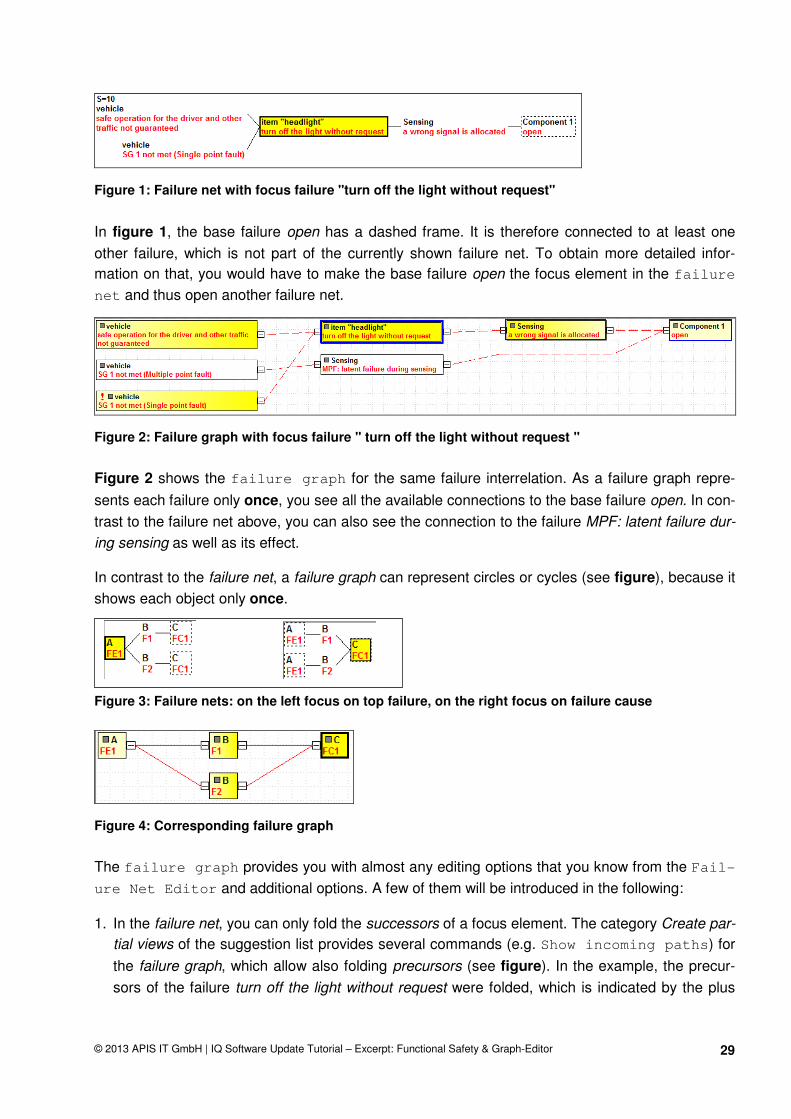
Figure 1: Failure net with focus failure "turn off the light without request"
In figure 1, the base failure open has a dashed frame. It is therefore connected to at least one
other failure, which is not part of the currently shown failure net. To obtain more detailed infor-
mation on that, you would have to make the base failure open the focus element in the failure
net and thus open another failure net.
Figure 2: Failure graph with focus failure " turn off the light without request "
Figure 2 shows the failure graph for the same failure interrelation. As a failure graph repre-
sents each failure only once, you see all the available connections to the base failure open. In con-
trast to the failure net above, you can also see the connection to the failure MPF: latent failure dur-
ing sensing as well as its effect.
In contrast to the failure net, a failure graph can represent circles or cycles (see figure), because it
shows each object only once.
Figure 3: Failure nets: on the left focus on top failure, on the right focus on failure cause
Figure 4: Corresponding failure graph
The failure graph provides you with almost any editing options that you know from the Fail-
ure Net Editor and additional options. A few of them will be introduced in the following:
1. In the failure net, you can only fold the successors of a focus element. The category Create par-
tial views of the suggestion list provides several commands (e.g. Show incoming paths) for
the failure graph, which allow also folding precursors (see figure). In the example, the precur-
sors of the failure turn off the light without request were folded, which is indicated by the plus
© 2013 APIS IT GmbH | IQ Software Update Tutorial – Excerpt: Functional Safety & Graph-Editor 30
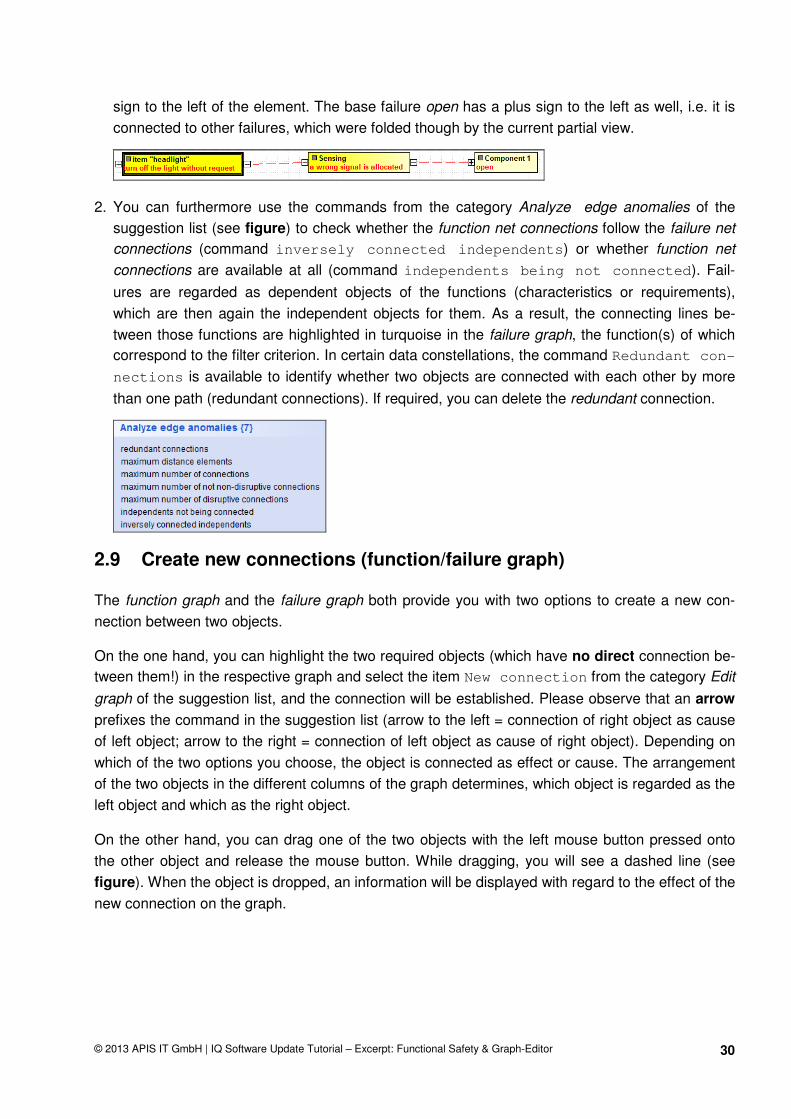
sign to the left of the element. The base failure open has a plus sign to the left as well, i.e. it is
connected to other failures, which were folded though by the current partial view.
2. You can furthermore use the commands from the category Analyze edge anomalies of the
suggestion list (see figure) to check whether the function net connections follow the failure net
connections (command inversely connected independents) or whether function net
connections are available at all (command independents being not connected). Fail-
ures are regarded as dependent objects of the functions (characteristics or requirements),
which are then again the independent objects for them. As a result, the connecting lines be-
tween those functions are highlighted in turquoise in the failure graph, the function(s) of which
correspond to the filter criterion. In certain data constellations, the command Redundant con-
nections is available to identify whether two objects are connected with each other by more
than one path (redundant connections). If required, you can delete the redundant connection.
2.9 Create new connections (function/failure graph)
The function graph and the failure graph both provide you with two options to create a new con-
nection between two objects.
On the one hand, you can highlight the two required objects (which have no direct connection be-
tween them!) in the respective graph and select the item New connection from the category Edit
graph of the suggestion list, and the connection will be established. Please observe that an arrow
prefixes the command in the suggestion list (arrow to the left = connection of right object as cause
of left object; arrow to the right = connection of left object as cause of right object). Depending on
which of the two options you choose, the object is connected as effect or cause. The arrangement
of the two objects in the different columns of the graph determines, which object is regarded as the
left object and which as the right object.
On the other hand, you can drag one of the two objects with the left mouse button pressed onto
the other object and release the mouse button. While dragging, you will see a dashed line (see
figure). When the object is dropped, an information will be displayed with regard to the effect of the
new connection on the graph.
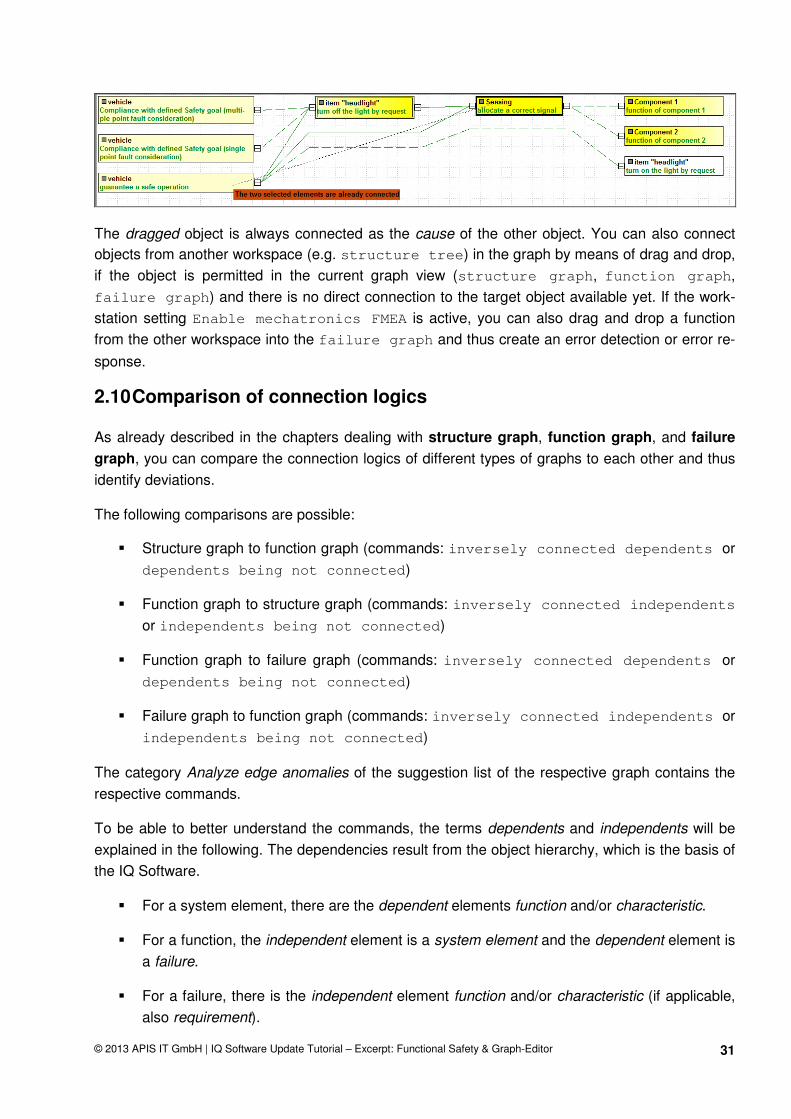
© 2013 APIS IT GmbH | IQ Software Update Tutorial – Excerpt: Functional Safety & Graph-Editor 31
The dragged object is always connected as the cause of the other object. You can also connect
objects from another workspace (e.g. structure tree) in the graph by means of drag and drop,
if the object is permitted in the current graph view (structure graph, function graph,
failure graph) and there is no direct connection to the target object available yet. If the work-
station setting Enable mechatronics FMEA is active, you can also drag and drop a function
from the other workspace into the failure graph and thus create an error detection or error re-
sponse.
2.10 Comparison of connection logics
As already described in the chapters dealing with structure graph, function graph, and failure
graph, you can compare the connection logics of different types of graphs to each other and thus
identify deviations.
The following comparisons are possible:
� Structure graph to function graph (commands: inversely connected dependents or
dependents being not connected)
� Function graph to structure graph (commands: inversely connected independents
or independents being not connected)
� Function graph to failure graph (commands: inversely connected dependents or
dependents being not connected)
� Failure graph to function graph (commands: inversely connected independents or
independents being not connected)
The category Analyze edge anomalies of the suggestion list of the respective graph contains the
respective commands.
To be able to better understand the commands, the terms dependents and independents will be
explained in the following. The dependencies result from the object hierarchy, which is the basis of
the IQ Software.
� For a system element, there are the dependent elements function and/or characteristic.
� For a function, the independent element is a system element and the dependent element is
a failure.
� For a failure, there is the independent element function and/or characteristic (if applicable,
also requirement).

© 2013 APIS IT GmbH | IQ Software Update Tutorial – Excerpt: Functional Safety & Graph-Editor 32
2.11 New input collector
The new input collector was already described in a separate chapter (chapter New input collector
in General innovations). That is why the following only provides a brief summary and indicates
the particularities when using it in the Graph Editor.
In contrast to the customary input collector, the new input collector provides you with the following
additional items for newly entered objects depending on the context:
� Definition, to which superordinate object the new object is to be anchored
� A shared input collector to quickly collect functions, product and process characteristics
without having to work with different input collectors
� A shared input collector to quickly collect failures and the mechatronic objects operating
condition, error detection and error response without having to work with different input col-
lectors
� If structure variants are available, variants can be assigned in the input collector.
You can currently access this new input collector only by executing one of the following com-
mands from the suggestion list on the right side of the Graph Editor:
� Add system elements
� Add functions and characteristics
� Add requirements
� Add failures
A special feature is the input collector for failures in the Graph Editor with the Failure graph
view. In the figure, the item New incoming neighbour was executed in the failure graph and a
new failure was entered. You can assign the mechatronic object types operating condition, error
detection, or error response to this object, if required. So there are a shared input collector for fail-
ures and the mechatronic objects in this context and you do not have to work with several input
collectors. As it is not clear, when creating a new object in the failure graph, to which superordinate
object it is to be anchored, you can define the anchorage via a radio button as well. In the example
shown in the figure, a new neighbour called New cause was defined for the focus failure a wrong
signal is allocated. On the basis of the function net and the function graph respectively of the asso-
ciated focus function allocate a correct signal, IQ Software lists the directly connected functions in
the direction of causes in the Define anchor category. They can then be used to anchor the new
failure. As a result, the new failure is saved with the assigned function as a dependent object.

© 2013 APIS IT GmbH | IQ Software Update Tutorial – Excerpt: Functional Safety & Graph-Editor 33
Figure: Graph Editor: Define object type and anchorage for new failure
2.12 Graph Editor for Functional Safety and Mechatronics
2.12.1 Workflow support by filters
The suggestion list of the Graph Editor provides a form of workflow support for the analysis in
the field of Functional Safety und mechatronic systems with the following categories:
Analyze target values (functional safety)
Object types including
mechatronic objects
Selection of a function for
anchorage

© 2013 APIS IT GmbH | IQ Software Update Tutorial – Excerpt: Functional Safety & Graph-Editor 34
Analyze actual values (functional safety)
Analyze critical paths (functional safety)
Analyze graph (functional safety)
To be able to specifically apply the filters of these categories, you should know the following inter-
relations and specifications, on which the filters are based:
1. Function with safety goal status and (dangerous) safety-critical failures ((D)SCF)
All filters regarding functions with safety goal status filter according to the attribute Is safety
goal, to be enabled in the Properties dialog of a function on the Functional Safety tab. This ac-
tivation furthermore results in the related failures to be regarded as safety-critical failures (abbrevi-
ated SCF). If an additional (A)SIL > QM is assigned to the SCF, this is called a dangerous safety-
critical failure (abbreviated DSCF).
Filters regarding DSCF therefore only find matches, if the superordinate function has the attribute
Is safety goal and an ASIL categorization > QM was assigned to the function.

© 2013 APIS IT GmbH | IQ Software Update Tutorial – Excerpt: Functional Safety & Graph-Editor 35
2. Complete safety mechanism
A complete safety mechanism is available for a dangerous safety-critical top failure (DSCF), if any
of the incoming paths contains error detection and error response, i.e. all filters regarding safety
mechanisms check, based on the dangerous top failure (DSCF), whether the object type error de-
tection followed by the object type error response is available on the incoming paths of the fail-
ure graph. So you need to make sure that the safety mechanism is connected to the relevant top
failure (DSCF) as an incoming path.
The following example of connections, in which the DSCF has the name SG1 not met (single point
fault), is for your better understanding.
Figure 1: Failure net: Safety mechanism connected to DSCF
Figure 2: Failure graph: Safety mechanism connected to DSCF
3. DC values (DCSPF, DCLF)
The filter regarding DC rates check only the object type error detection for the availability of a DC
value. DC values of other objects (e.g. failure) are not considered. You should therefore define the
DC values for error detections only!
4. Multiple point failures (MPF)
Multiple point failures (MPF) are the failures of the objects error detection and error response. They
must in turn be connected to the relevant top failure (DSCF) in the failure graph. Only if these
conditions are met, filters regarding MPF will find corresponding results. The following figure
shows an example to make it clearer, in which the top failure SG1 not met (single point fault) cor-
responds to the DSCF and the failure error detection does not work corresponds to the MPF.

© 2013 APIS IT GmbH | IQ Software Update Tutorial – Excerpt: Functional Safety & Graph-Editor 36
Figure 1: Failure net: Multiple point failure (MPF) connected to DSCF
Figure 2: Failure graph: Multiple point failure (MPF) connected to DSCF
5. Target/actual performance comparison for fault tolerance time
You can use the filters regarding FTT to check whether your time target is complied with by the de-
fined safety mechanisms.
For this purpose, define at first the so-called fault tolerance time (FTT) as a target value for the rel-
evant top failure (failure of function with safety goal status), afterwards the fault detection times for
the associated error detections and the fault reaction times for the associated error responses (see
chapter Define fault tolerance time as well as fault detection and fault reaction time). All the
functions involved in the safety mechanism must be finished within the FTT target. If the safety
mechanism exceeds the time target, then the safety goal is regarded as violated.
For each top failure, all the incoming paths in the failure graph are checked according to the
following formula, and it is thus decided, whether the FTT target is met:
FTT ≤ incoming failure path with maximum (time) total of fault detection time(s) and fault reaction
time(s)
2.12.2 Failure graph: Representation of calculated failure rates and calculat-
ed times
If the failure graph is open in the Graph Editor, you can specify in the Display options
(menu View | Display options) in the Edge options category, whether you want to see the fail-
ure rates or the processing times at the connecting lines (edges).
If you choose the option failure rate (see figure 1), the failure fraction that was undetected by er-
ror detection is shown in red and the failure fraction detected by error detection in green at the
edges. In the example, you can see the propagation of the failure rate from right to left. The base
failure open, which is not shown in the figure for lack of space, has a failure rate of 10 FIT and is
connected to the failure a wrong signal is allocated. These 10 FIT are entirely passed onto the fur-

© 2013 APIS IT GmbH | IQ Software Update Tutorial – Excerpt: Functional Safety & Graph-Editor 37
ther edges in direction of causes until a error detection is defined with a DC value (in the example:
DCSPF = 99%). From then on, you see the detected share in the failure rate (here: 9.9 FIT) in green
above the edge and the remaining undetected share in the failure rate (here: 0.1 FIT) in red below
the edges.
Figure 1: Detected (green) and undetected (red) failure rates at the edges
If a failure has several incoming edges with red or green values, they are added and shown at the
outgoing edge(s).
If you choose the option processing times (see figure 2), you see the minimum total of processing
times of all incoming paths in green above the edges and the maximum total of processing times
of all incoming paths in red below the edges.
The processing time is the total of the fault detection and fault reaction times.
In the example, a fault detection time of 2 ms was defined for the error detection and a fault reac-
tion time of 3 ms for the error response. And again, you can see the propagation of the times from
right to left. As of the error detection, you see initially the fault detection time of 2 ms and then as of
the error response the total of both times at the amount of 5 ms.
Figure 2: Minimum time total (green) and maximum time total (red) at the edges
If a failure has several incoming edges with red or green values, they are added and shown at the
outgoing edge(s).