innovative approaches to cooperative finance: income distribution and equity management farmer...
TRANSCRIPT

Innovative Approaches to Cooperative Finance:Income Distribution and
Equity Management
Farmer Cooperatives Conference
by David Barton
November 4, 2011Radisson Plaza Hotel
Minneapolis, Minnesota

Overview• Theme: Innovative Approaches to Cooperative Finance• Objective: Identify and implement the most effective
financial strategies based on five core beliefs1. Understanding the principles of co-op finance is the
foundation of successful innovation2. Research and case studies are enormously informative and
useful3. Expertise of finance practitioners (bankers, accountants,
consultants) is crucial4. Successful innovation experiences of co-op leaders is the
“Good Housekeeping Seal” of reliability and approval5. Agricultural co-ops in Kansas and the Midwest have made
substantial progress in the last 35 years, but have substantial room for improvement
• Speakers Roles: Educate and persuade based on principles, research and case study facts
2

Agenda• Today is mostly about Synthesis
• Synthesis is the converse of analysis but to get to synthesis we have relied on analysis
• Co-op finance decision framework is a synthesis of co-op principles or business model with business finance principles or model
• Best innovative finance practices of co-ops: what and why
• Worst innovative finance practices of co-ops: what and why
• Six cornerstones of financial success
• Questions and discussion
3
Co-op Finance Decision Framework Integrates Co-op Theory and
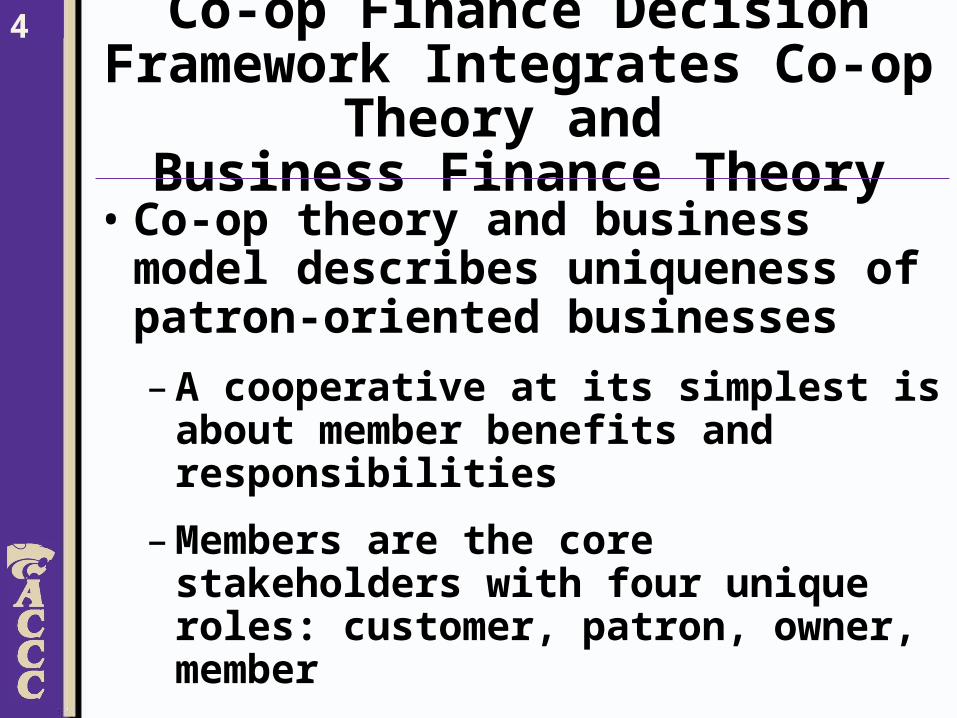
Business Finance Theory• Co-op theory and business model describes
uniqueness of patron-oriented businesses– A cooperative at its simplest is about member
benefits and responsibilities
– Members are the core stakeholders with four unique roles: customer, patron, owner, member
– Non-members may or may not be allowed to be a customer, patron or owner
4

Co-op Finance Decision Framework Integrates Co-op Theory and Business Finance Theory
• Business finance decision framework addresses three interrelated decisions– Income generation and distribution– Asset investment portfolio– Financing mix of debt and equity
• Co-op finance decision framework combines (synthesizes) the standard business framework with the unique co-op business model – Changes the orientation from investor-owned to
patron-owned– Modifies and supplements the standard financial
information– Modifies the decision criteria, such as income
distribution and balance sheet management
5

Cooperative Description: Focus on Benefits and Responsibilities
A cooperative is a business operated primarily to provide benefits to members through marketing transactions and through a distribution of patronage earnings from these transactions; in return, members have a responsibility to provide ownership capital and exercise member control (governance).
6

Four Unique Roles
Roles Function Action1. Customer Marketing or Buy/Sell
Profit Generation Transactions
Most say the customer role is predominant. Serving customers is the end and the roles of patron, owner and member are means to the end.
Which role is predominant in members’ minds?
4. Member Control Vote
3. Owner Ownership Investment &Redemption
2. Patron Profit Distribution Patronage RefundsPer Unit Retains
Challenge: Inherent conflict of interest between customer, patron and owner roles.
7

Co-op Finance Decision Framework Integrates Co-op Theory and Business Finance Theory
• Co-op finance decision framework has five key interrelated focal points– Profitability or income generation– Income distribution– Asset management– Balance sheet management– Patron equity investment management
• Co-op finance decisions should be made within a strategic thinking framework by asking four questions:– Where are we?– Where do we want to go?– How do we get there?– What decisions need to be made now?
8
Best Innovative Practices: Policies for Five Key Interrelated Focal Points
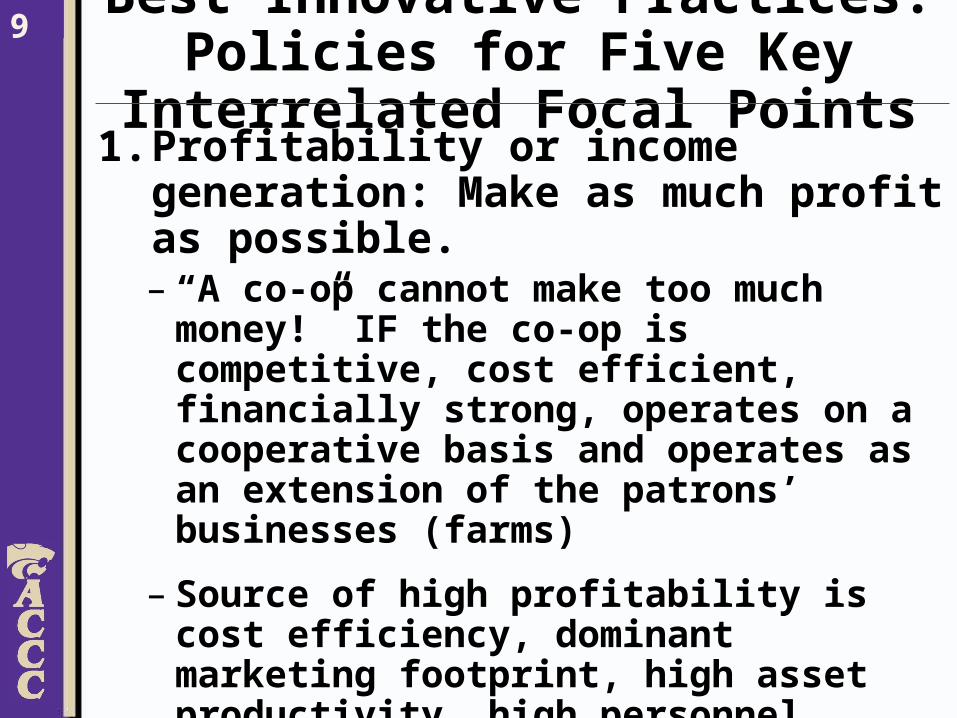
1. Profitability or income generation: Make as much profit as possible.– “A co-op cannot make too much money!” IF the
co-op is competitive, cost efficient, financially strong, operates on a cooperative basis and operates as an extension of the patrons’ businesses (farms)
– Source of high profitability is cost efficiency, dominant marketing footprint, high asset productivity, high personnel productivity
9
Best Innovative Practices: Policies for Five Key Interrelated Focal Points
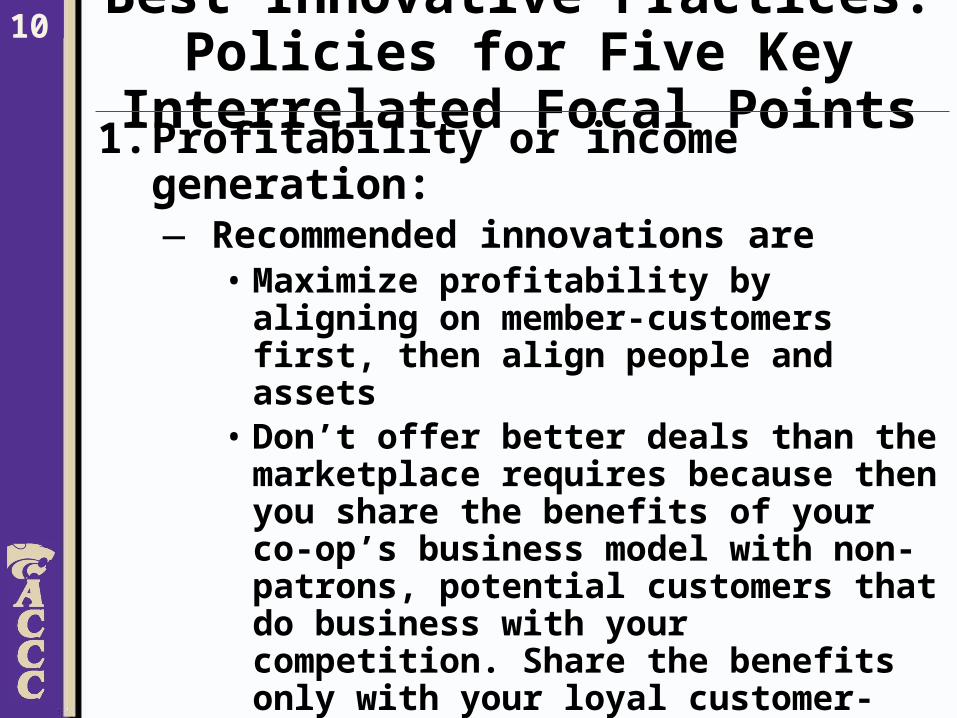
1. Profitability or income generation: — Recommended innovations are
• Maximize profitability by aligning on member-customers first, then align people and assets
• Don’t offer better deals than the marketplace requires because then you share the benefits of your co-op’s business model with non-patrons, potential customers that do business with your competition. Share the benefits only with your loyal customer-patrons.
• Don’t encourage neighboring co-ops to beat each other up in the marketplace. It looks like a blood sport and the only blood being spilled is farmers’ blood. Who wins and who loses?
10
Best Innovative Practices: Policies for Five Key Interrelated Focal Points
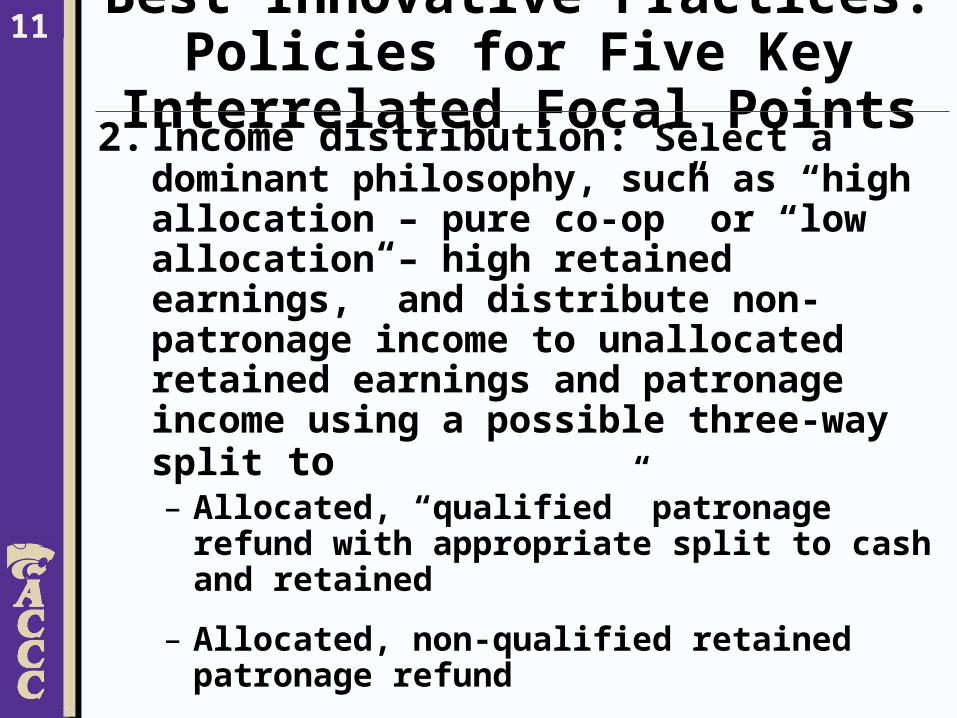
2. Income distribution: Select a dominant philosophy, such as “high allocation – pure co-op” or “low allocation – high retained earnings,” and distribute non-patronage income to unallocated retained earnings and patronage income using a possible three-way split to– Allocated, “qualified” patronage refund with
appropriate split to cash and retained
– Allocated, non-qualified retained patronage refund
– Unallocated, not qualified retained earnings
11

Best Innovative Practices: Policies for Five Key Interrelated Focal Points
2. Income distribution: Examples– Model co-op without Section 199
• High qualified allocation (pure co-op)• High non-qualified allocation (pure co-op)• High retained earnings (unallocated)
– CPI “mixed philosophy” of 50-50-50 or 25-30-70• Without Section 199• With Section 199
12

Operating 40%
Regional
Other
Total 100% $540,000 60%
100% $540,000 60%
0% $040%
90% $540,0000%
0% $0 60%
40%
60%
0% $0 0%
40%
10% $60,000
0%
100% $60,000 77%
23%
Patronage Income Sources: Cash Patronage Refunds (P-Q)
Barton Co-op Income Distribution Model: Model Co-op Case 1 (S1): High Allocation and Moderate Cash Patronage
Source Allocation Tax Deductability Distribution as:
$300,000 $216,000
$300,000Qualified
$0 Retained Patronage Refunds (P-Q)
Unallocated Not Qualified Net Retained Earnings (P-NQ)
$600,000 $324,000
Allocated Patronage Refunds
Net Retained Patronage Refunds (P-NQ)
Nonqualified $0
Income Taxes (P-NQ)
$0Patronage
Dividends (P-NQ)$0
$0 $0
Income Taxes (P-NQ)$0
Total Income Cash Patronage Refunds (NP-NQ)
Dividends (NP-NQ)
100% $0$600,000
Allocated Patronage Refunds
Not Qualified Retained Patronage Refunds (NP-NQ)
$0 $0
Income Taxes (NP-NQ)$0
Nonpatronage
Income Taxes (NP-NQ)$13,600
$0
Unallocated Not Qualified Net Retained Earnings (NP-NQ)$60,000 $46,400
13

Operating 40%
Regional
Other
Total 100% $0 60%
0% $0 60%
0% $040%
90% $540,0000%
100% $540,000 60%
40%
60%
0% $0 0%
40%
10% $60,000
0%
100% $60,000 77%
23%
Patronage Income Sources: Cash Patronage Refunds (P-Q)
Barton Co-op Income Distribution Model: Model Co-op Case 3 (S3): Very High Retained Earnings (No Allocation)
Source Allocation Tax Deductability Distribution as:
$300,000 $0
$300,000Qualified
$0 Retained Patronage Refunds (P-Q)
Unallocated Not Qualified Net Retained Earnings (P-NQ)
$600,000 $0
Allocated Patronage Refunds
Net Retained Patronage Refunds (P-NQ)
Nonqualified $0
Income Taxes (P-NQ)
$0Patronage
Dividends (P-NQ)$0
$540,000 $324,000
Income Taxes (P-NQ)$216,000
Total Income Cash Patronage Refunds (NP-NQ)
Dividends (NP-NQ)
100% $0$600,000
Allocated Patronage Refunds
Not Qualified Retained Patronage Refunds (NP-NQ)
$0 $0
Income Taxes (NP-NQ)$0
Nonpatronage
Income Taxes (NP-NQ)$13,600
$0
Unallocated Not Qualified Net Retained Earnings (NP-NQ)$60,000 $46,400
14
Operating 40%
Regional
Other
Total 0% $0 60%
100% $540,000 60%
100% $540,00040%
90% $540,0000%
0% $0 60%
40%
60%
0% $0 0%
40%
10% $60,000
0%
100% $60,000 77%
23%
Patronage Income Sources: Cash Patronage Refunds (P-Q)
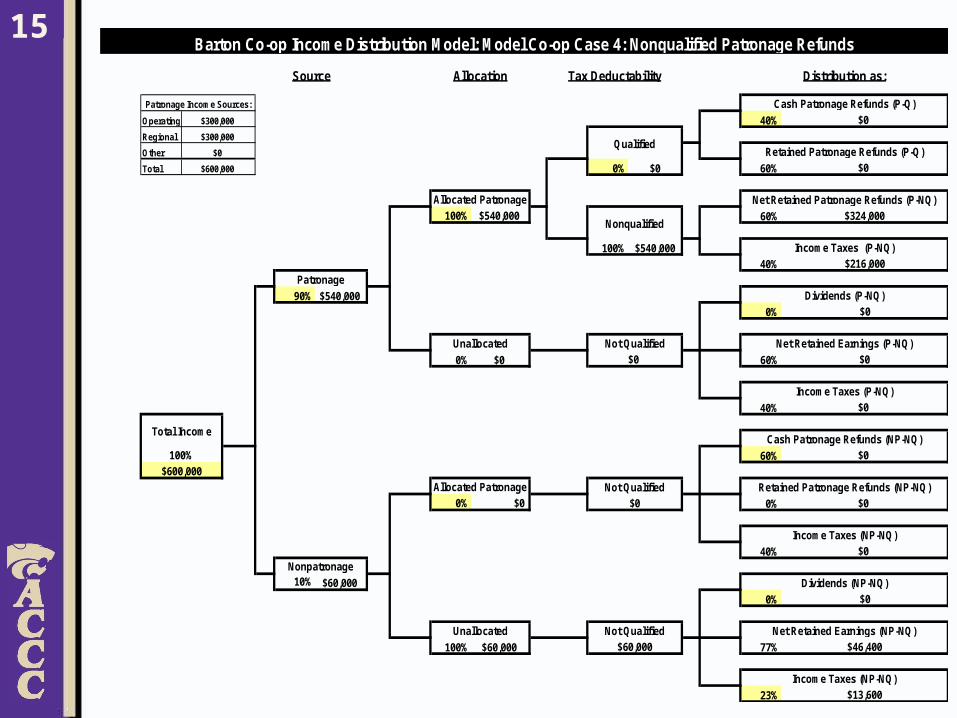
Barton Co-op Income Distribution Model: Model Co-op Case 4: Nonqualified Patronage Refunds
Source Allocation Tax Deductability Distribution as:
$300,000 $0
$300,000Qualified
$0 Retained Patronage Refunds (P-Q)
Unallocated Not Qualified Net Retained Earnings (P-NQ)
$600,000 $0
Allocated Patronage Refunds
Net Retained Patronage Refunds (P-NQ)
Nonqualified $324,000
Income Taxes (P-NQ)
$216,000Patronage
Dividends (P-NQ)$0
$0 $0
Income Taxes (P-NQ)$0
Total Income Cash Patronage Refunds (NP-NQ)
Dividends (NP-NQ)
100% $0$600,000
Allocated Patronage Refunds
Not Qualified Retained Patronage Refunds (NP-NQ)
$0 $0
Income Taxes (NP-NQ)$0
Nonpatronage
Income Taxes (NP-NQ)$13,600
$0
Unallocated Not Qualified Net Retained Earnings (NP-NQ)$60,000 $46,400
15

50%
100% $375,000 50%
50% $375,000 58.5%
0% $0
41.5%
75% $750,000
0%
50% $375,000 58.5%
41.5%
0%
0% $0 58.5%
41.5%
25% $250,000
0%
100% $250,000 58.5%
41.5%
$250,000 $146,250
Income Taxes (NP-NQ)
$103,750
Income Taxes (NP-NQ)
$0
NonpatronageDividends (NP-NQ)
$0
Unallocated Not Qualified Net Retained Earnings (NP-NQ)
$1,000,000 Allocated Patronage Refunds
Not Qualified Retained Patronage Refunds (NP-NQ)
$0 $0
Patronage
100%
$0
Unallocated Not Qualified Net Retained Earnings (P-NQ)
$375,000 $219,375
Income Taxes (P-NQ)
$155,625
Total Income Cash Patronage Refunds (NP-NQ)
$0
Dividends (P-NQ)
$187,500
Qualified Retained Patronage Refunds (P-Q)
$187,500
Nonqualified $0
Income Taxes (P-NQ)
$0
Allocated Patronage Refunds
Net Retained Patronage Refunds (P-NQ)
Cash Patronage Refunds (P-Q)
Barton Cooperative Income Distribution Model: CPI S4 FYE Distribution Policy "50-50-50"
Source Allocation Tax Deductability Distribution as:
16

30%
100% $747,000 70%
83% $747,000 58.5%
0% $0
41.5%
90% $900,000
0%
17% $153,000 58.5%
41.5%
0%
0% $0 58.5%
41.5%
10% $100,000
0%
100% $100,000 58.5%
41.5%
Cash Patronage Refunds (P-Q)
Barton Cooperative Income Distribution Model: CPI S5 FYE Distribution Policy "25-30-70"
Source Allocation Tax Deductability Distribution as:
Nonqualified $0
Income Taxes (P-NQ)
$0
Allocated Patronage Refunds
Net Retained Patronage Refunds (P-NQ)
$224,100
Qualified Retained Patronage Refunds (P-Q)
$522,900
Patronage
100%
$0
Unallocated Not Qualified Net Retained Earnings (P-NQ)
$153,000 $89,505
Income Taxes (P-NQ)
$63,495
Total Income Cash Patronage Refunds (NP-NQ)
$0
Dividends (P-NQ)
$1,000,000 Allocated Patronage Refunds
Not Qualified Retained Patronage Refunds (NP-NQ)
$0 $0
NonpatronageDividends (NP-NQ)
$0
Unallocated Not Qualified Net Retained Earnings (NP-NQ)
$100,000 $58,500
Income Taxes (NP-NQ)
$41,500
Income Taxes (NP-NQ)
$0
25% total income to unallocated
17

100.00% $0 100.00% $0 0.00%
32.68% $4,000,000 100.00% $4,000,000 100.00%
0.00% $0 100.00% $0 100.00%
100.00%
90.00% $12,240,000
100.00% $4,000,000
0.00%
32.68% $4,000,000 58.65%
0.00% $0
41.35%
0.00%
34.64% $4,240,000 100.00% $4,240,000 83.57%
16.43%
0.00%
0.00% $0 100.00% $0 58.65%
41.35%
10.00% $1,360,000
0.00%
88.97% $1,210,000 100.00% $1,210,000 83.57%
16.43%
11.03% $150,000 100.00% $150,000 100.00% $150,000
Allocated Patronage Refunds
Nonpatronage S199 Is Tax Deductible Net Retained Earnings - No Tax
$198,747
Income Taxes (NP-NQ)
Net Retained Earnings (NP-NQ)Not Qualified
$1,011,253
$0
Dividends (NP-NQ)
Allocation Tax Deductability Distribution as:
Allocated Patronage Refunds S199
Passthrough S199 Deductions
Nonpatronage Income
Income Taxes (P-NQ)
$696,435
Barton Cooperative Income Distribution Model with Section 199: CPI 2010
Unallocated
Not Qualified
Cash Patronage Refunds (NP-NQ)$0
Retained Patronage Refunds (NP-NQ)
$0
Income Taxes (NP-NQ)
$0
Net Retained Patronage Refunds (P-NQ)
Cash Patronage Refunds (P-Q)
Source
$0
Patronage Income
$13,600,000
100.00%
$4,000,000
$0
Income Taxes (P-NQ)
Retained Patronage Refunds (P-Q)
Dividends (P-NQ)
Nonqualified
Allocated Patronage Refunds
Qualified
Not Qualified
Total Income
Net Retained Earnings (P-NQ)Unallocated
$0
$0
$3,543,565
$0
Retained Patronage Refunds - NQ - No TaxNonqualified S199
Qualified S199
Unallocated S199 Not Qualified S199 Retained Earnings - No Tax
$0
$4,000,000
S199 Passthrough Deductions
18

Best Innovative Practices: Policies for Five Key Interrelated Focal Points
2. Income distribution: Factors to consider when making choices…• Co-op philosophy: pure or pragmatic• Balance sheet management objectives• Equity structure objectives and risks• Equity redemption objectives• Perception of patron• Rate of profitability• Tax benefits: single taxation, tax incentives like
Section 199• After-tax cash flow to patrons (Co-op is an
extension of the members’ farms)
19

Best Innovative Practices: Policies for Five Key Interrelated Focal Points
2. Income distribution: Recommended innovations• Adopt the philosophy, “A co-op cannot make too
much money!”• Pay out to patrons the surplus or residual
working capital (cash) not needed in the cooperative enterprise as cash patronage refunds or cash redemptions of retained equity (PUR or RPR).
• Pay high enough cash patronage to cover patrons’ taxes.
• Switch from qualified to non-qualified distributions, if possible.
20

Best Innovative Practices: Policies for Five Key Interrelated Focal Points
3. Asset management: Manage each major asset category and key sub-categories in a proactive way to account for financial interrelationships and tradeoffs between balance sheet risk (gain/loss of asset) and income risk (gain/loss of operating income)– Asset categories
• Current assets: cash, receivables inventory
• Investments (External equity interests with low to high control such as regionals and JVs)
• Fixed assets
21

Best Innovative Practices: Policies for Five Key Interrelated Focal Points
3. Asset management: Factors to consider when making asset investment choices for your unique company
• Business model and strategies
• Balance sheet management objectives
• Equity management objectives
• Rate of profitability
• Risk of asset investment
22

Best Innovative Practices: Policies for Five Key Interrelated Focal Points
3. Asset management: Recommended innovations– Invest only in high profit assets and work assets hard.
Asset growth, especially fixed asset growth, is a major driver of financial performance and cash flow to patrons.
– Invest wisely in people and fixed assets. In the past grain marketing and farm supply co-ops have over-invested in fixed assets and under-invested in people, but going forward many may also be under investing in fixed assets (speed and space demands).
– Eliminate or fix low profit operations. Many co-ops have lacked enough discipline to eliminate or fix losers for political reasons, resulting in one set of patrons subsidizing another set of patrons, a violation of the “operation at cost” fundamental principle underlying the cooperative business model. This is a very destructive business strategy.
23

Best Innovative Practices: Policies for Five Key Interrelated Focal Points
4. Balance Sheet Management: Manage balance sheet accounts (given income generation, income distribution and asset growth objectives and outcomes) to achieve financial targets and derive a total equity redemption budget that is split between all eligible equity classes in a fair and equitable way– Liquidity targets (cash flow and working capital)– Solvency targets (debt to equity or equity to assets)– Desired balance of short-term and long-term debt– Desired equity structure
• Allocated/Unallocated balance• Allocated structure: characteristics (permanent, semi-
permanent, revolving), classes (common, preferred, book credits), exchange/redemption rules, and priority of claims
24
Best Innovative Practices: Policies for Five Key Interrelated Focal Points
4. Balance Sheet Management: Redemption budget calculation and split to eligible allocated equity classes— Model co-op redemption budget
calculation example
— CPI redemption budget split to eligible equity classes example
25

Beginning Assets $10,000,000+ Change in Cash (current assets) $0+ Change in Investments $0+ Change in Fixed Assets $0= Ending Assets $10,000,000
Beginning equity to assets 60%Ending equity to assets desired 60%
Beginning Equity Balance $6,000,000+ New Retained Equity (Allocated) $324,000+ New Retained Earnings (Unallocated) $46,400+ New Common Stock Sales $0+ New Preferred Stock Sales $0= Maximum Equity Available $6,370,400- Ending Equity Desired $6,000,000
= Redemption Budget $370,400
Redemption Budget Calculation
Note: New equity allows co-op to redeem old equity, increase solvency or finance growth.
26

CPI Redemption Budget Split To Eligible Equity Classes
Equity Class and Description
Amount Percent CategoryES Out
AP/O Age & % Inside
AP/PRF
InsideBC
PP In
AmountEquity
PercentResidual Split Rule
Class A COMMON STOCK $181,400.00 0.83% Fixed 1:ES
Class B CERT PART $249,812.50 1.14% Fixed 1:ES
Class F MEC-2000 FORWARD $3,784,356.82 17.25% Flexible 1:ES 2:age 65 (85%) 3:X years $3,784,356.82 18.35% 18.00%
Class G OVER 65-65 $813,933.21 3.71% Fixed 1:ES 2:5 years
Class H LONG TERM INVESTMENT-24 $690,208.56 3.15% Flexible 1:ES 2:X% $690,208.56 3.35% 3.00%
Class I OLD HC STOCK CREDITS-18 $5,321,133.26 24.26% Flexible 1:ES 2:age 65 (85%) 3:X years $5,321,133.26 25.81% 26.00%
Class L MINDEN STOCK CREDITS-71 $1,471,123.88 6.71% Flexible 1:ES 2:age 70 (85%) 3:X years $1,471,123.88 7.14% 7.00%
Class N MINDEN INACTIVE EQUITY- $40,335.66 0.18% Frozen
Class P MEC - OLD SUTTON $2,554,891.24 11.65% Flexible 1:ES 2:age 65 (85%) 3:X years $2,554,891.24 12.39% 13.00%
Class Q MEC - SUTTON RESTRICTED $34,278.75 0.16% Frozen
Class R MEC - SUTTON REGIONAL $340,558.36 1.55% Flexible 1:ES 2:X% $340,558.36 1.65% 2.00%
Class S MEC-FARMERS UNION GAS/O $1,473,377.77 6.72% Flexible 1:ES 2:X% $1,473,377.77 7.15% 7.00%
Class T MEC - OLD MIDLAND $4,982,387.31 22.71% Flexible 1:ES 2:age 68 (100%) 3:X years $4,982,387.31 24.17% 24.00%
TOTAL: $21,937,797.32 100.00% $20,618,037.20 100.00% 100.00%
Table 1-X6.S3 & S4 Revised. CPI Equity Redemption Program
Beginning Equity: 2008 Equity Redemption Policy: Claim on Redemption Budget Residual (Outside or Inside) and Priority by Method (P:M)
Flexible Equity Redemption Budget Split1
1 Five flexible classes (F, I, L, P, T) receive age of patron (AP/O) redemptions directly or indirectly by a transfer to another class and are assumed to be eligible to receive additional redemptions using a revolving fund if funds are available. Three flexible classes (H, R and S) that previously received only estate settlements and are assumed to be eligible to receive PP redemptions if funds are available. In S3 and S4 a total equity redemption budget is calculated prior to any redemptions. First priority estate settlement redemptions for all classes are fixed or "outside the residual budget" and they are made and deducted from the total redemption budget to determine a residual equity redemption budget. If a residual remains, it is split as noted to each of the eligible equity classes. For each class, second priority age of patron redemptions or percentage pool redemptions and the third priority revolving fund redemptions are made until the residual budget for that class is expended. S3 and S4 differ from S1 by moving the second priority AP/O and PP redemptions from "outside" to "inside" the residual redemption budget for each class. S3 and S4 differ from S2 by changing the three classes from fixed to flexible and allowing a percentage pool redemption to facilitate redeeming all equity in those classes.
27
Best Innovative Practices: Policies for Five Key Interrelated Focal Points
4. Balance Sheet Management: Factors to consider when making choices– Capital structure decision principles: cost of capital (economic
not accounting cost), risk and profitability– Co-op philosophy: pure (co-op is extension of members’
farms) or pragmatic (co-op is a firm)– Equity management philosophy, given the current starting
place and desired ending place– Level of complexity you can understand and communicate:
understanding more critical than speed; journey must go full circle, from naïve or simple-minded into complexity then back to simplified wisdom such as equity management choice between “easy in, hard out” or “hard in, easy out”
– Ability to see big picture instead of small partial picture: For example, tying regional patronage and investment to income distribution and equity management tends to “compartmentalize” instead of “synthesize”.
28

Best Innovative Practices: Policies for Five Key Interrelated Focal Points
4. Balance Sheet Management: Recommended innovations– Err on the side of smaller than ideal fixed asset
investments. Work the existing assets hard.– Err on the side of higher than necessary liquidity
and solvency to protect the future viability of the co-op.
– Choose what works best from among many income distribution and equity management combinations.
– Don’t buy the alarmist view of some that operating as a “pure” co-op by distributing all patronage income to patrons in allocated form is unsustainable.
29

Best Innovative Practices: Policies for Five Key Interrelated Focal Points
5. Patron Equity Investment: Manage each patron’s equity investment to achieve high proportionality of investment.– Strive to achieve ideal characteristics of owner equity
investment: proportionality, liquidity, appreciable equity value– Strive to achieve ideal co-op financial model: new generation
cooperative– Deal with imperfect characteristics of traditional co-op equity
investment in a practical way that include limitations on proportionality, liquidity and value appreciation.
– Select high performing equity redemption methods where ranking, from lowest to highest, is:
• Estate settlements and other specials (ES)• Age of patron oldest first (AP/O)• Age of patron prorate (AP/P)• Revolving fund (RF)• Base capital (BC)
30

Best Innovative Practices: Policies for Five Key Interrelated Focal Points
5. Patron Equity Investment: Recommended innovations
— As a minimum, adopt a very good redemption program using a revolving fund method (e.g., ES+RF) with a very flexible length and strict redemption budget.
— If possible, adopt an excellent redemption program using a base capital method (e.g., ES+BC) with a very flexible rate of redemption to over-invested patrons and strict redemption budget.
— Never use the AP/O redemption method in redemption programs. If now using AP/O phase it out and phase in RF or BC using a win-win transition program. If necessary, restructure equity records with incorrect or missing year retained information to facilitate use of the RF method.
31

Worst Innovative Practices: They May Sound Good Or Be Popular But Beware Their Major Drawbacks
1. Co-ops are non-profit companies operating on a “service at cost” basis that don’t need to or should not try to make profits like other businesses. Therefore low profitability is acceptable or preferred.
2. Co-ops are unique businesses with the grand purpose of improving society. Therefore, co-ops should focus more on social causes and less on economic performance than other businesses.
3. Co-ops should “correct market failure” by having the lowest possible margins and best prices possible instead of just competitive prices. This will force other businesses to have better prices for the benefit of all farmers, not just patrons of my co-op.
32
Worst Innovative Practices: They May Sound Good Or Be Popular But Beware Their Major Drawbacks
4. Co-ops should redeem a patron-owner’s equity at the age of retirement, such as 65, on the grounds it is the best redemption program possible, or is...
5. Regional retained patronage refunds should be separated from local earnings by creating a separate and corresponding class of allocated “regional” equity.
6. Permanent equity that never has to be redeemed is preferred over allocated, revolving equity which is expected to be redeemed someday. Therefore, regional retained patronage refund income (booked as a “regional investment” asset) should be distributed to patrons as a separate allocated, “non-qualified” retained patronage refund and classified as an equity class that never will be redeemed except upon dissolution of the local co-op.
33

7. Patron-owners should only be required to have a small allocated equity investment in the co-op (e.g., $5 to $100). All other equity created from patronage income from operations should be distributed in unallocated form.
8. Little or no income is needed from local operations if the co-op expects or hopes to receive high regional patronage refund income and joint venture income.
9. The co-op needs to accept lower profits, liquidity and solvency to be able to grow sales and assets and to provide patrons with better services (like “speed and space”) and better prices than the competition.
Worst Innovative Practices: They May Sound Good Or Be Popular But Beware Their Major Drawbacks
34

Primary Recommended Innovations: Six Cornerstones of Financial Success1. Be cost efficient, be price and service competitive,
make as much profit as possible and always have a strong balance sheet.
2. Be creative in income distribution by evaluating the full array of options, including use of non-qualified distributions, and by considering patron perceptions and after-tax cash flow.
3. Invest only in highly productive people and assets. Eliminate low performers sooner instead of later.
35

Primary Recommended Innovations: Six Cornerstones of Financial Success4. Use balance sheet management to give owners what is
left over after protecting the co-op with strong liquidity and solvency policies and by distributing as much cash as possible to the patron-owners as a consequence of calculating a redemption budget and/or cash patronage refund budget.
5. Manage patron equity accounts by calculating a strict redemption budget for each “revolving” equity class. Then maintain flexibility and proportionality by using a preferred redemption method, such as a revolving fund or base capital.
6. Custom fit a finance strategy to your co-op based on the many options available consistent with co-op finance principles and your co-op’s unique circumstances.
36
Four Overarching Guidelines1. Apply the Goldilocks Rule: Find the policies that
are “just right” for your future success, not too few and simple, not too many and complex.
2. Understand trade-offs: — Don’t let “perfect” be the enemy of “good.”
— Don’t let “good enough” stop you from seeking “continuous improvement.”
3. Control your destiny (Bryan)
4. Help good triumph over evil (Socrates)
37
“Destiny is no matter of chance…
it is a matter of choice.”
William Jennings Bryan
38

“There is only one good,
knowledge,
and one evil, ignorance.”
Socrates
39

Questions and
Discussion
40