innovative geotechnical investigation and construction procedures … · the csb includes four...
TRANSCRIPT

Innovative Geotechnical Investigation and Construction Procedures for the Foundations of the New Champlain Bridge, Montreal
Louis D’Amours, Eng., M.A.Sc., Vice-President, Business Development, SNC-Lavalin Inc. Simon Grenier, P.Eng., Ph.D., Project Manager, SNC-Lavalin Inc.
Paper prepared for presentation at the Innovation in Geotechnical and Materials Engineering Session
of the 2017 Conference of the Transportation Association of Canada
St. John’s, NL
Presentation will be done in English

ABSTRACT The replacement of the actual Champlain Bridge crossing the Saint-Lawrence River at the height of Montréal and Brossard in the province of Quebec, Canada was tendered as a PPP project. The design of the new bridge required extensive geotechnical investigations in order to use construction techniques adapted to the timeline specified in the contract.
Firstly, innovating investigation techniques that were used to determine the sound rock level for the installation of the pier foundation footings for the main bridge will be presented.
Secondly, large scale in situ tests, using an Osterberg cell which were carried out to optimize the caissons design of the main tower will be described.
Finally, the results of these investigations will be presented and the construction techniques put in place in order to allow quality control during construction of the foundations.
1

1. Project Description and Schedule
1.1 General Description The New Champlain Bridge Corridor Project is divided in two parts, the “Bridge” which includes the new Champlain Bridge crossing of the St. Lawrence River from the west abutment on the Nun’s Island (Ile-des-Sœurs (ÎdS)) to the east abutment in Brossard, and the “Highway” which includes the remaining infrastructures of the project (highways, roads, retaining walls, bicycle paths, etc.) in Quebec , Canada. The investigation for the “Highway” will not be discussed in this paper, only the investigation performed for the “Bridge”.
More precisely, the project consists in the construction of a new bridge about 50 meters north of the existing Champlain Bridge. The new bridge will be approximately 3.3 km long and comprises three consecutive structures: a West Approach structure, a Cable Stayed Bridge (CSB), and an East Approach structure (see Figure 1).
The West Approach extends about 2 kilometers from ÎdS to the CSB. lt spans between 26 foundations (W02 to W27) along its length, which consist of shallow foundations bearing on rock. The West Abutment (WA) will be supported on drilled shafts socketed in rock (1.18-meter diameter rock socket).
The CSB is 529 meters long and crosses an existing Seaway Navigation Channel between an existing dike and Îles de la Couvée (ÎdC). The CSB includes four spans between foundations W02, W01, the Main Span Tower (MST), E01, and E02. The MST, W01, W02, and E01 foundations will be supported on drilled shaft groups (1.18-meter diameter rock socket) penetrating the overburden till and socketed into bedrock. Foundation E02 consists of shallow foundations bearing on bedrock.
The East Approach extends approximately 762 meters to the east towards the Brossard Shore and includes three types of foundations. Five foundations (E02 to E06) will be on shallow foundation bearing on bedrock; foundation E07 will be founded on a 2 by 3 group of drilled shafts socketed in rock (1.18-meter diameter socket); and three foundations (E08 to E10) will be founded on groups of 0.4-meter diameter driven piles. The East Abutment (EA) will be supported on drilled shafts socketed in rock (1.18-meter diameter socket).
Figure 1: General Location of the site
2

1.2 Project Challenges In itself, this project had its share of challenges. The main ones can be listed as follows:
• High level of expectation for durability : 125 years; • Environmental considerations (fish habitat, water, air, noise); • Fast track mode for the design/construction; • Project in an urban area; • Important offshore investigations; • Prescriptive architectural design; • Difficult access to the water; • Involvement of many partners and stakeholders. • Use of precast segments for the construction of the piers
The challenges for the geotechnical investigation were also very important, such as:
• Boring offshore with limited access to the river; • Boring onshore (island) with no ground access; • Very strict environmental specifications (no sediment in water, biodegradable oil and fluids for drill rig); • Site investigation and reporting to be done in a limited time (2½ months); • Considerations of many stakeholders on site: Transport Canada, St. Lawrence Seaway, Federal Bridge
Agency, Hydro-Quebec, project partners (construction and design).
1.3 Champlain Bridge Foundations The location of the foundations of the “Bridge” is shown in Figure 2.
Île-des-Soeurs Seaway Brossard
Figure 2: New Champlain Bridge
Loads for abutments and the Cable Stayed Bridge (CSB) being very important are designed with caissons socketed in bedrock while the other piers, located offshore are founded on conventional footings on the sound bedrock.
The foundations of the CSB consisted of 42 drilled shafts socketed in bedrock as shown on Figure 3.
West Approach 26 Foundations 2.1 km
Cable Stayed Bridge (CSB) 4 Foundations
East Approach 9 Foundations 800 m
3

Figure 3: Foundations on Drilled Shaft
The offshore piers, were designed as conventional footings on bedrock as shown in Figure 4.
Figure 4: Conventional Footing on Bedrock
42 Drilled shaft (φ1,2 m x 14,7 m)
Dimensions: 8 x 10 m to 11 x 11 m
Fixed Level of Footing on Sound Bedrock
Rock
Architectural prescribed Fixed location Tolerance = 20 mm
4

Because the concept for the construction of the piers is an assemblage on site of independent pre-cast segments at a predetermined locations, and also because the architectural specifications require a prescribed fixed location of the beginning of the “W” structure, it became obvious that the level of the footings needed to be known in advance, to begin the production of the precast concrete segment in order to meet the delivery date of the “Bridge”.
Hence the determination of the competent bedrock level for these footings was on the critical path and that everything had to be carried out so that we could have the exact level of the competent bedrock with the highest-bearing capacity.
1.4 Summary of Field and Laboratory Work The geotechnical site investigation work consisted in a total of 96 borings, among which 68 borings were planned offshore. Also, 6 cone penetration tests and 7 seismic cone penetration tests (SCPT) were performed onshore.
As part of the investigation work, optical and acoustical televiewer surveys and dilatometer tests were performed into the bedrock in 66 borings. P&S sonic waves and downhole tests were performed respectively in 9 and 6 borings. Laboratory tests were carried out on representative soil and rock samples to determine their physical characteristics and geotechnical properties. In addition, core logging and point load tests were carried out to assess the rock mass properties. The potential of sulfur attack of soil and rock on concrete was also investigated.
2. Site General Geology The site general geology consists of a thin till deposit of 1.2 to 3.6 meters resting on bedrock, as shown on Figure 5.
In the seaway area, thick fills were encountered on the dikes. The thickness varied between 2.5 and 6.9 meters.
The Ile-des-Soeurs area (west abutment) consists of a thick fill over the till deposit.
The Brossard area (east abutment) presents a thin fill (0.3 to 1.3 meters) overlying a silty clay deposit (1.40 to 4.5 meters) which rests on the same till deposit.
The bedrock consists of a shale, weathered and fractured at the surface in depths varying from 0.3 to 5.4 meters.
5
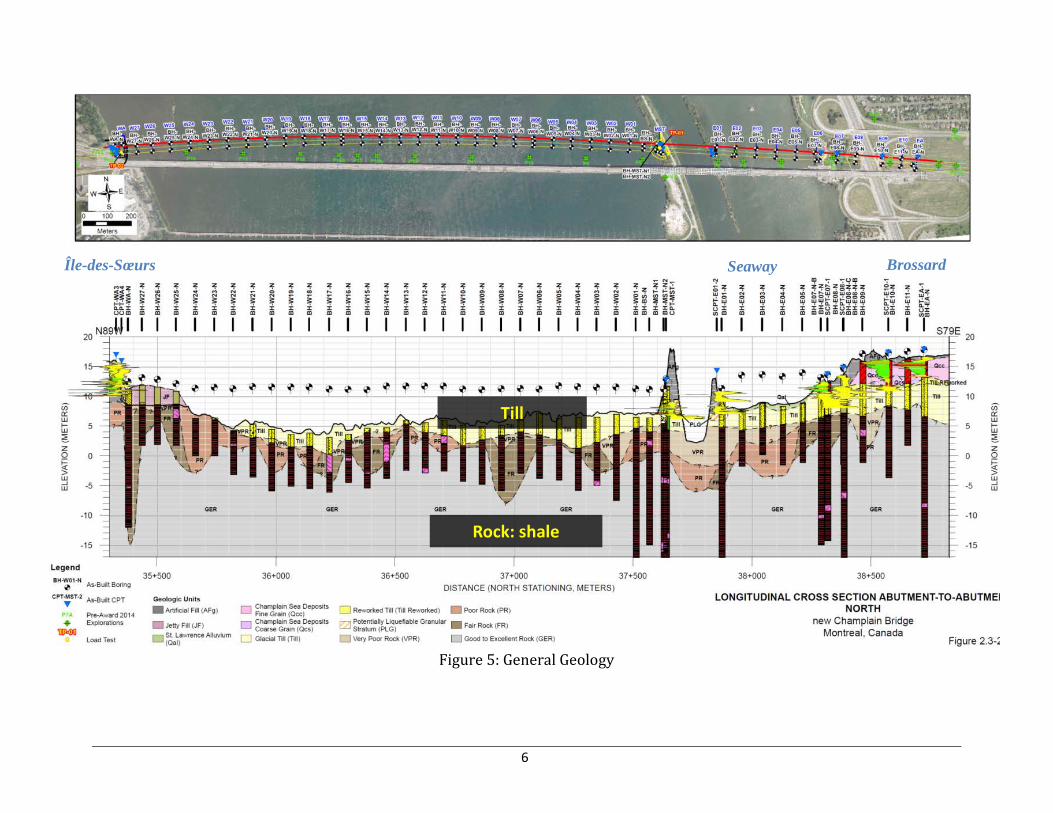
Figure 5: General Geology
Île-des-Sœurs Seaway Brossard
Till
Rock: shale
6

3. Field Geotechnical Investigations
3.1 Field Work The fieldwork for the project was carried out between May 4th and July 9th, 2015.
The investigation program consisted in a total of 99 borings totaling 1600 meters of drilling, six cone penetration tests (CPT) and seven seismic cone penetration tests (SCPT). Among the 99 borings, 62 were performed with 3 drill rigs installed on barges. Up to 7 drill rigs were in operation simultaneously with periods where 2 shifts per day were used. In summary, the field work is shown in the Table 1.
Table 1: Summary of Investigation Program
Structure Number of foundation unit Location Number of
boreholes Other investigations
West Abutment 1 Onshore 4 P&S wave, downhole, dilatometer, televiewer
Piers (west approach) 26 20 Offshore
6 Onshore 53 Televiewer
Cable Stay Bridge 4 11 Offshore 5 Onshore 16 P&S wave, downhole,
dilatometer, televiewer Piers
(east approach) 9 9 Offshore 14 Onshore 23 P&S wave, down hole,
televiewer
East Abutment 1 3 Onshore 3 P&S wave, downhole, dilatometer. televiewer
In the overburden, the boreholes were advanced by different methods; 1) simultaneous drilling of NW casing and a tricone or a NQ3 core barrel, 2) drilling of PW casing and PQ3 core barrel and 3) simultaneous drilling of HW casing and a HQ core barrel.
For onshore and offshore foundation units expected to be founded on driven piles and drilled shafts, the overburden was generally sampled with a Standard 51 mm O.D. split spoon sampler, according to ASTM Standard D 1586-84 for the Standard Penetration Test (SPT). It provides the penetration resistance ‟N″ value of the soils, commonly used to determine the compactness of granular soils. Exceptionally, the first sample was taken by means of a N caliber split spoon sampler with an outside diameter of 64 mm.
Moreover, the intact undrained shear strength (sur) of the silty clay was measured using a Nilcon vane apparatus. These measurements were taken at depth intervals of 0.5 to 1.0 m. The remoulded undrained shear strength (sur) of the silty clay was also measured using the same apparatus after performing 20 revolutions of the vane blades.
For offshore foundation units expected to be founded on spread footings, the overburden was generally sampled without interruption by means of a N caliber split spoon sampler.
In order to enhance recovery in the till deposit and locate more precisely, the interface between the till and the shale bedrock, a special drilling technique with the PQ3 core barrel having a special designed diamond core bits was used to optimize the recovery of almost intact samples in one core length of the till, the fractured and altered rock surface and the bedrock with a better quality underneath. This technique proved to be very useful in establishing the limits between these geologic elements. Figure 7 shows a good sample of such a core.
In order to obtain high quality bedrock samples, the boreholes were continued using mainly PQ3 diamond core bits (diameter 83 mm).
7
The investigation program included in situ tests (dilatometer tests, optical and acoustic televiewer surveys and P&S waves logging and downhole tests) in the borings. These tests were conducted at the end of drilling before removing the casing. Downhole tests were also performed in 4 boreholes after the installation of a grouted PVC liner.
Also, PW size casing was advanced into bedrock, beyond the upper fractured zone, to provide stability during coring and in situ tests (dilatomer, televiewer, downhole and P&S waves logging).
The methodology and equipment used for the various in situ tests are described in the following sections.
3.1.1 Dilatometer Tests Dilatometer tests were conducted in the rock using a Probex device, which consists of a cylindrical probe that expands under an applied inflating pressure in the radial direction in the borehole. The applied pressure and change in the probe volume were monitored in order to provide the short term deformation modulus (Ed) of the rock. The tests were performed following ASTM D4719-07 Standard (Standard Test Methods for Prebored Pressuremeter Testing in Soils) as the device is equivalent to a pressuremeter used for tests in soils.
3.1.2 Televiewer Surveys Optical and acoustic televiewer surveys were carried out in 66 of the boreholes.
Surveys were carried out with acoustic (ABI) and optical (OBI) televiewers manufactured by Advanced Logic Technologies S.A. For both probes, the vertical survey resolution was set at 1.67 mm per pixel. The horizontal resolution for the optical survey was set at 1º per pixel (1.07 mm per pixel inside a PQ3 sized borehole and 0.66 mm per pixel inside a NQ3-sized borehole). The horizontal resolution for the acoustic survey was set at 1.25° per pixel (1.34 mm per pixel inside a PQ3-size borehole and 0.83 mm per pixel inside a NQ3 size borehole).
The speed of the surveys were adapted to get such high resolution.
3.1.3 Geophysical Investigation Geophysical investigations works were performed to determine the shear wave (S wave) velocity (Vs) in the overburden and in the bedrock. Two geophysical methods were used in this project: the sonic method (P&S waves logging) and the downhole method.
The sonic method was first used to determine continuous Vs profile in the bedrock. The sonic method consists of an ultrasonic transmitter and three high frequency receivers, aligned 0.5 m apart, that are lowered down to the bottom of the borehole. When the probe is pulled to the surface, ultrasonic pulses are generated every 5 cm and the receivers record the incoming seismic waves.
This method was efficient to locate the fractured zones, as well as the numerous intrusive rock intercepted by the boreholes. However, in reason of the relatively low value of the shear wave (S wave) velocity in the Utica shale, this formation could be considered as a "slow formation". In some cases where the shear wave velocity of the rock is close to the borehole fluid velocity (in this case around 1,440 m/sec, the velocity of compression wave (P wave) in water at 10° C), it was then sometimes difficult to correctly identify the S wave in more fractured zones. When S wave value was below the P wave velocity of the filling fluid, the decision was made to use the downhole method instead, using impact from the surface, to measure the S wave in the boreholes.
The methodology followed for the downhole seismic method met the requirement of ASTM D 7400-08 standard, entitled “Standard Test Methods for Downhole Seismic Testing”. The seismic downhole method was used to acquire the data for the whole length of the borehole. To measure the seismic velocity using the downhole method, a seismic source (shear wave hammer) is placed on the surface of the ground at a distance of approximately 1 m from the borehole and is maintained in place using the weight of the recording truck or the drill. A reference geophone is implanted at a distance of 15 cm from the borehole. The data collected by this
8

sensor provides a way to monitor the quality of the signal and the accuracy of the triggering device. The probe consisting of a triaxial sensor (three geophones oriented in three directions) is locked in the borehole at a predetermined elevation. An impact is then produced at the surface with the shear wave hammer and the seismic waves are picked up by the probe clamped in the borehole and is recorded by the seismograph. From the seismogram, the time of arrival of both P&S waves are computed. The in-hole probe is then unlocked and lowered to the next test location (the testing depth interval is normally 1.0 m). The process is then repeated until the required depth has been reached. From these measurements, a time-depth curve is reconstructed for both P&S waves and the seismic velocities are computed for each depth intervals.
3.1.4 Cone Penetration Tests A total of six cone penetration tests (CPT) and seven seismic cone penetration tests (SCPT) were carried out. The latter allows in addition to CPT data the measurement of the shear wave velocity in the soil.
The CPTs and SCPTs were carried out using an Adara piezocone probe, which measures and records the following three parameters at 2 cm intervals: corrected tip resistance (qt), pore pressure measured at the cone (u2) and friction sleeve resistance (fs).
The following steps were performed prior to each CPT and SCPT:
1. Saturation of the pore pressure transducer;
2. Conditioning of the probe temperature;
3. Initial baselines taken after the probe temperature has stabilized. When taking the initial baselines, the probe is left hanging so that no load is being applied to the load cells.
The piezocone was pushed down in the ground by increments of 1.0 m (corresponding to the length of one CPT rod). Dissipation of excess pore pressure and shear wave velocity measurements were also measured.
3.1.5 Shear Wave Measurement (SCPT) A total of seven seismic cone penetration tests (SCPT) were carried out during a Standard cone penetration test using a built-in geophone inside the piezocone probe. The shear wave source consists of a steel beam pushed down in the ground by the weight of the drill rig and a hammer with a contact trigger as shown on Figure 6. At each 1.0 m depth interval, a polarized shear wave is generated by hitting one end of the steel beam horizontally with the hammer in the direction of the longitudinal axis; a shear wave with reverse polarity is also generated by hitting the other end of the steel beam. The shear waves are collected and processed by an oscilloscope incorporated in the data acquisition system.
9

Figure 6: Layout of Downhole Seismic Cone System
3.2 Laboratory Work Rock core samples were inspected and logged by an experienced geologist. A detailed record of the rock descriptions, which included pertinent geotechnical information such as: Rock Quality Designation (RQD); total core recovery (%); weathering state or alteration; discontinuity density and orientation; point load tests and other information as deemed pertinent or identified during the drilling process was produced.
Soil and rock samples were submitted to the laboratory tests and chemical analyses indicated in Table 2.
Table 2: Laboratory Tests Laboratory Test Quantity
Geotechnical Purposes • Particle size analysis by sieving and washing on 80 µm sieve 131
• Particle size analysis by hydrometer test 17
• Water content 13
• Atterberg limits 13
• Rock unit weight 193
• Rock unconfined compression test 150
• Rock unconfined compression test with measurement of the deformation modulus 43
• Joint shear strength of rock sample (DS test) 21
• CERCHAR abrasiveness index on rock samples 3 Aggressiveness of Soils and Water to Concrete Purposes • pH 14
• Resistivity 14
• Chloride 14
• Sulfur 10
• Sulphate 4
10

The determination of the point load strength index (Is(50)) of rock core samples was carried out at the field laboratory by a geologist according to ASTM D5731 - 08 Standard “Standard Test Method for Determination of the Point Load Strength Index of Rock and Application to Rock Strength Classifications”. The point load strength test is used as an index test for strength classification of rock materials. The test results should not be used for design or analytical purposes. Rock samples were tested axially by application of concentrated load through a pair of truncated, conical platens. The test was performed with the PIL-7 apparatus. The load strength indexes were corrected for the size of the rock core samples.
The CERCHAR Abrasiveness Index (CAI) was determined on rock samples following ASTM D7625-10 Standard “Standard Test Method for Laboratory Determination of Abrasiveness of Rock Using the CERCHAR Method” and using steel styluses with a Rockwell Hardness Scale (RHS) of 55. The CAI classification is indicated in Table 3 for a steel stylus with a RHS of 55.
Table 3: Classification of CERCHAR Abrasiveness Index Abrasiveness Average CAI (RHS = 55)
Very low 0.30 – 0.50 Low 0.50 – 1.00
Medium 1.00 – 2.00 High 2.00 – 4.00
Extreme 4.00 – 6.00 Quartzitic 6.0 – 7.0
3.3 Drilled Shaft Load Testing Two O-cell tests were performed by Loadtest USA on drilled shafts performed by Forage Camille Blais &Fils. Figure 9 shows a typical load cell installation
On July 1st, 2015, a test was performed on a drilled shaft at the main span tower. The 1.180 mm diameter by 19.55-meter deep pile socketed in rock had been completed on June 23, 2015. Subsurface conditions at the test pile location consist primarily of till overburden underlain by altered, poor and fair rock.
The maximum sustained bidirectional load applied to the pile was 40.72 MN. At the maximum load, the displacements above and below the O-cell assembly were 4.81 mm and 12.85 mm, respectively. Unit side shear data calculated from strain gages indicated a mobilized average net side shear of 1,530 kPa in the rock socket. The maximum applied unit end-bearing is calculated to be 32,466 kPa. Unit values correspond to the above respective displacements.
On August 25, 2015, another test was performed at the drilled shaft at the west abutment. The 1.180 mm diameter by 9.97-meter deep pile socketed in rock was completed on August 13, 2015. Subsurface conditions at the test pile location consist primarily of till overburden underlain by altered, poor and fair rock.
The maximum sustained bidirectional load applied to the shaft was 23.86 MN. At the 32-minute reading of the maximum sustained load, the displacements above and below the O-cell assembly were 20.86 mm and 8.21 mm, respectively. Unit side shear data calculated from strain gages indicated a maximum mobilized average net side shear of 1,259 kPa between the O-cell and Strain Gage Level 4 (rock socket average). The maximum applied unit end-bearing is calculated to be 20,076 kPa. Unit values correspond to the above respective displacements.
11

4. Results of the Investigations
4.1 For the pier’s footing on rock As mentioned in Section 1, the exact elevation of the competent bedrock needed to be assessed to satisfy the project schedule.
For this purpose, the combination of PQ-3 coring system with an adapted drilling technique and core bits with the optical and acoustical televiewer results permitted us to establish the level of competent bedrock with a high level of confidence. The objectives and benefits of each technic are listed in Table 4.
Rock socket
O-Cell
12

Table 4: Objectives and Benefits
PQ3 Core Drill Optical and Acoustic Camera • Optimize the recovery and quality of shale cores • Optimizing structural rock assessment • Defining the rock level • Locate joints, inclination and openings • Define altered rock thickness • Evaluate the bearing capacity coefficient Ksp (0.07
to 0.27) • Establish accurate rock level
Figures 7 and 8 show these benefits. These results also give a higher value of Ksp. This value combined with the value uniaxial compressive resistance of cores gave higher bearing capacity values.
Figure 7: Example of PQ3 Core
Figure 8: Example of Televiewer results and Structural Description of Cores
REC.
Till Roc (RQD 38%)
13

4.2 For Drilled Shafts at MST and Abutment The O-Cell test results permitted optimization of the design of the drilled shafts. The results of the test performed at the MST is shown on Figure 10. The optimized design criteria are:
• Optimized peak capacity (20 to 30% instead of 10%): o qt = 14.0 MPa
• Optimized Φ: o 0.6 instead of 0.4
• Optimized friction capacity: o C = 1.26 instead of C = 0.63 to 1.41
Figure 9: O-Cell Test Results
These results permitted to reduce by 40% the rock socket, generating important cost savings.
For the design of lateral loads on drilled shaft, the dilatometer tests (Figure 10) were also used of help to optimize the evaluation of the modulus of the rock mass compared to the modulus of rock intact in the shale of good to excellent quality
• E - Dilatometer: 3.2 to 10.8 MPa • E - Laboratory: 4.3-16.1 MPa
14

Figure 10: Dilatometer Test Results
With these results, P-Y curves of lateral resistance in the shale were established as a function of shale quality and compressive strength as shown in figure 11.
Figure 11: P-Y Curves Test Results
5. Construction of Foundations
5.1 Main Span Tower (Cable-Stayed Bridge) Figure 12 shows the drilled shaft being constructed. No specific construction methods were used. The contractor Bauer did most of the drilling of these shafts. Figure 13 shows the construction of the piers of the MST.
Borehole : BH-MST-N2 Depth : 23 m
15

Figure 12: Drilling of caissons Figure 13: Construction of the Main Pier
5.2 Superficial Foundations of Piers The construction of the superficial footing of the offshore piers was not conventional and is described in detail in the following sections.
5.2.1 Excavation Process The relevant environmental conditions to respect are summarized below:
• Construction activities likely to cause serious damage to the fish could not be performed between April 16 and June 1st.
• lmplement effective measures to limit the supply of sediments from the construction site to the aquatic environment and ensure their maintenance (turbidity barriers, berms, sediment traps, sedimentation ponds, etc.). The measures must remain effective at all times including during the temporary site closures or periods of floods and heavy rains.
• Excavated soil material must be disposed of above the high-water line level. If required, confine material s (e.g. waterproof membrane, sediment barrier) so as to prevent the supply of sediments to the aquatic environment.
• When work must be carried out in water, isolate the work area to work dry or limit the supply of sediment to the aquatic environment (e.g.: cofferdams, temporary diversions, containment and pumping, turbidity curtains).
• Promote the usage of turbidity barriers to confine the suspended sediments in the work area. Deploy turbidity barrier vigilantly such that the imprisonment of fish within the confined area is limited.
• Restrictions on the use of explosives are not listed in this method statement since SSL does not plan on using any explosives.
Below is the step-by-step construction sequence for the marine excavation operations, including explanatory diagrams.
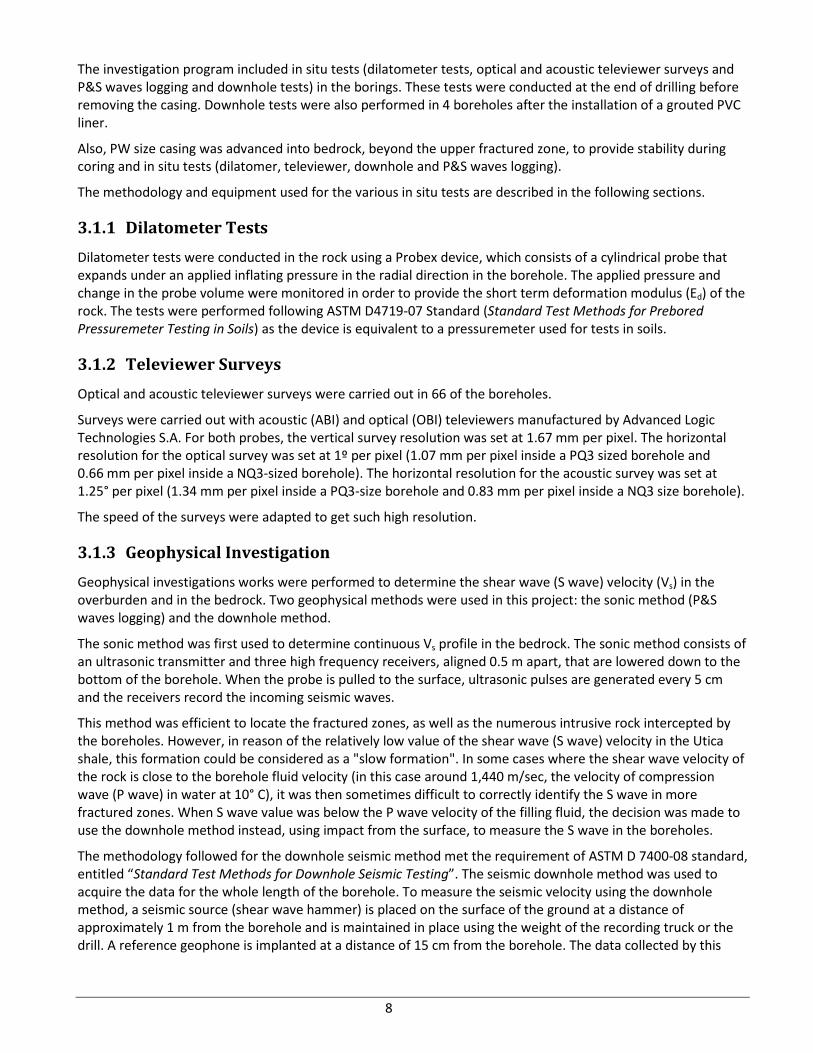
The marine excavation was carried out with an excavation barge (where the excavator is located), a dredging barge with a steel current deflector, which created a pool to excavate within, and a scow barges (see Figure 17) as shown in Figures 14 to 18.
16

Figure 14: Excavation Barge and Dredging Barge
Figure 15: Excavation Barge and Dredging Barge
Figure 16: Scow barge Design
17
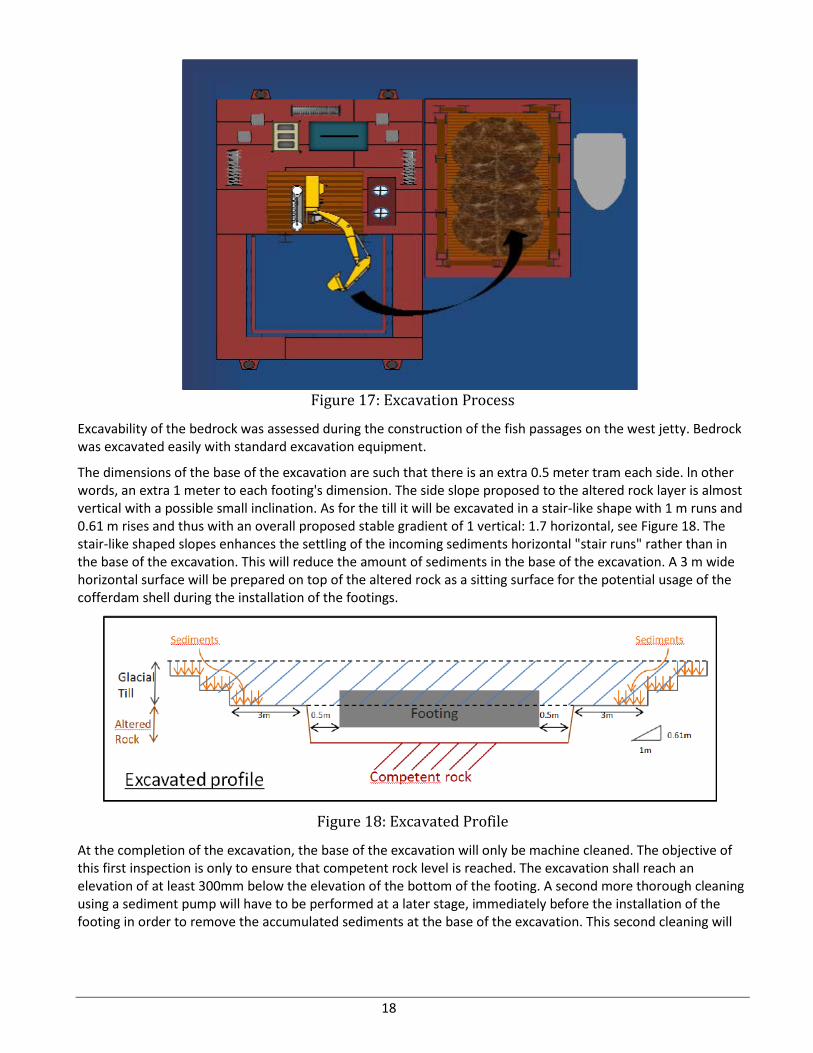
Figure 17: Excavation Process
Excavability of the bedrock was assessed during the construction of the fish passages on the west jetty. Bedrock was excavated easily with standard excavation equipment.
The dimensions of the base of the excavation are such that there is an extra 0.5 meter tram each side. ln other words, an extra 1 meter to each footing's dimension. The side slope proposed to the altered rock layer is almost vertical with a possible small inclination. As for the till it will be excavated in a stair-like shape with 1 m runs and 0.61 m rises and thus with an overall proposed stable gradient of 1 vertical: 1.7 horizontal, see Figure 18. The stair-like shaped slopes enhances the settling of the incoming sediments horizontal "stair runs" rather than in the base of the excavation. This will reduce the amount of sediments in the base of the excavation. A 3 m wide horizontal surface will be prepared on top of the altered rock as a sitting surface for the potential usage of the cofferdam shell during the installation of the footings.
Figure 18: Excavated Profile
At the completion of the excavation, the base of the excavation will only be machine cleaned. The objective of this first inspection is only to ensure that competent rock level is reached. The excavation shall reach an elevation of at least 300mm below the elevation of the bottom of the footing. A second more thorough cleaning using a sediment pump will have to be performed at a later stage, immediately before the installation of the footing in order to remove the accumulated sediments at the base of the excavation. This second cleaning will
18

be further explained. Although the excavation will be left opened for a few months before concreting, the potential of softening of the shale is very low due to the fact that the excavation will always be submerged.
The elevation of the bearing stratum at each foundation location will be verified with the GPS mounted on the excavator to ensure that footings bear on the competent rock level as determined in the geotechnical investigation report, Competent Rock Level. The whole footprint of the footing will be viewed in a systematic grid system with the recorded elevation data.
The bottom of the excavation will be inspected using a camera mounted on the excavator by a geotechnical engineer to ensure that the footings are bearing on the competent rock as determined in the geotechnical investigation report.
Following the placement of the precast footing and prior to placing of the concrete tremie, another inspection with the camera is planned to ensure that the bottom of the excavation is clean as required.
5.2.2 Installation of Underwater Foundations on Competent Rock The footing installation work method consisted of lifting the prefabricated footing (Figure 19) and installing the footing at the base of the excavation at the exact predetermined location, as shown on Figure 20. The footing rested actually on 3 hydraulic adjustable legs to adjust level with precision, as shown on Figures 21 and 22. Once the footing is in the right position, concrete is poured by tremie to fill the space between the rock and the footing.
Figure 19: Prefabricated Surface Foundation
19

Figure 20: Installation of Underwater Foundations at Competent Rock
Figure 21: Pier Layout Diagram
20
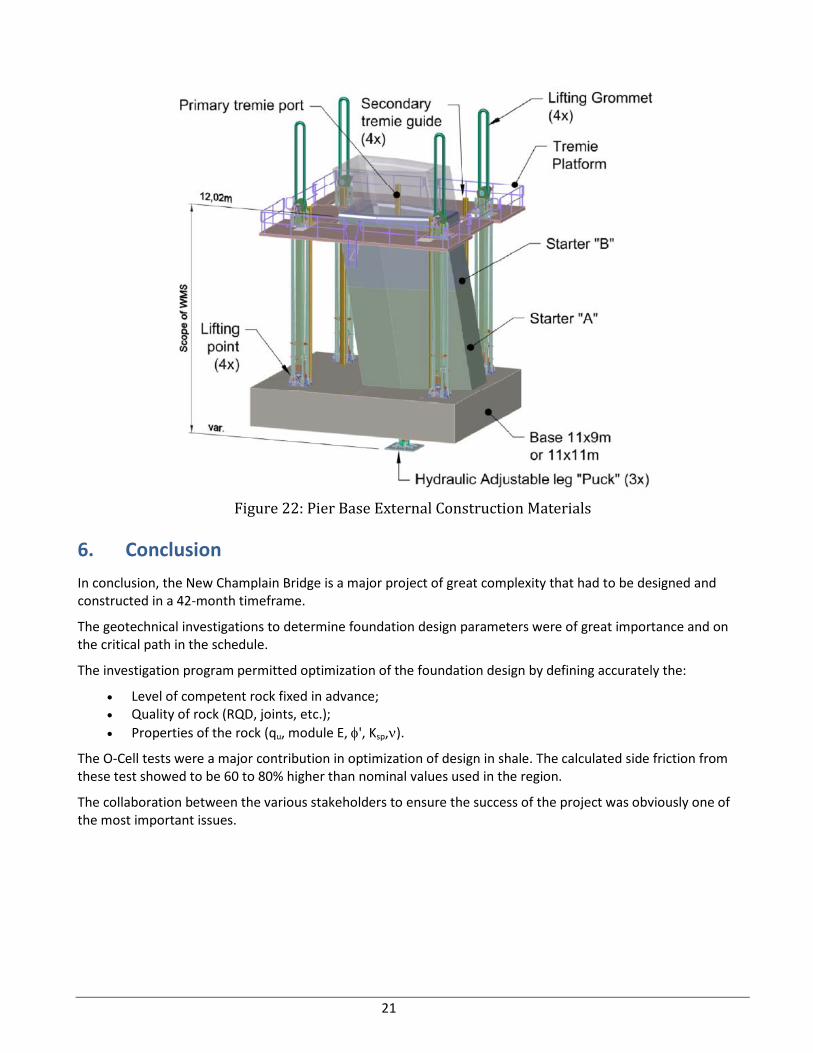
Figure 22: Pier Base External Construction Materials
6. Conclusion In conclusion, the New Champlain Bridge is a major project of great complexity that had to be designed and constructed in a 42-month timeframe.
The geotechnical investigations to determine foundation design parameters were of great importance and on the critical path in the schedule.
The investigation program permitted optimization of the foundation design by defining accurately the:
• Level of competent rock fixed in advance; • Quality of rock (RQD, joints, etc.); • Properties of the rock (qu, module E, φ', Ksp,ν).
The O-Cell tests were a major contribution in optimization of design in shale. The calculated side friction from these test showed to be 60 to 80% higher than nominal values used in the region.
The collaboration between the various stakeholders to ensure the success of the project was obviously one of the most important issues.
21