innovative technology reduces mercury emissions · pdf fileinnovative technology reduces...
TRANSCRIPT
INNOVATIVE TECHNOLOGY REDUCES MERCURY EMISSIONS TO KEEP OHIO’S
SEWAGE SLUDGE INCINERATORS HOT AND COSTS COOL
The Road to SSI MACT Compliance for Cincinnati and Cleveland
Connor Smith (Black & Veatch), Scott Reed (Black & Veatch), Robin Rupe (Northeast Ohio Regional Sewer District), Sara Cramer (Metropolitan Sewer District of Greater Cincinnati)
ABSTRACT
Effective March 21, 2016, all Sewage Sludge Incinerators (SSIs) were required to be in compliance with the United States Environmental Protection Agency (USEPA) Maximum Achievable Control Technology (MACT) air pollutant emissions standards.
At the Northeast Ohio Regional Sewer District’s (NEORSD) Southerly Wastewater Treatment Center (WWTC) and the Metropolitan Sewer District of Greater Cincinnati’s (MSDGC) Mill Creek Wastewater Treatment Plant (WWTP), an analysis of historical feed-sludge mercury data from approximately 2012 to present, coupled with each facility’s most recent incinerator emissions tests, confirmed that additional emissions controls were required for each of the two facility’s combined six fluidized bed incinerators (FBIs) (three at each facility) to consistently bring the incinerators into compliance with the new regulations, more specifically with mercury emissions limits. Without the addition of enhanced emissions controls focused on mercury removal, each facility would likely not have been able to demonstrate consistent compliance with the new rule subsequent to the associated March 2016 regulatory compliance deadline, potentially resulting in the loss of permit to incinerate sludge. This loss of permit would have resulted in NEORSD and MSDGC needing to institute hauling programs to direct an average of 120+ dry tons per day (dtpd) of dewatered sludge cake from each facility to landfill. This operation was deemed by both institutions to not only be cost prohibitive, but also to be unsustainable.
Traditionally, fixed bed granular activated carbon (GAC) adsorbers have been used to reduce mercury emissions for incinerators operating existing wet scrubber emissions control systems like those at Southerly WWTC and Mill Creek WWTP. However, both NEORSD and MSDGC recognized the potential of a newer proprietary mercury removal technology, known as Sorbent Polymer Composite (SPC) absorption, which as part of several successful pilot studies was demonstrating significant mercury removal in emissions from municipal SSIs. When compared to large fixed bed GAC adsorbers, the SPC absorption vessels not only offered notable capital cost savings, but also required less ancillary equipment, leading to lower overall facility operations and maintenance (O&M) costs and greater ease of retrofitting the SPC vessel systems within the existing incinerator building space.
Following careful analysis, both NEORSD and MSDGC ultimately decided to install new SPC absorption vessel systems for each of their three respective FBIs. In early 2016, following installation of the new emissions controls systems, each of the SSIs underwent official SSI MACT compliance testing. This testing demonstrated that all six of the incinerators were in compliance with all regulated emissions limits, including mercury. Furthermore, all testing was complete prior to the March 21, 2016 regulatory compliance deadline, which was a significant accomplishment given the compressed time frame to analyze, design, install, and commission the
371
WEF Residuals and Biosolids Conference 2017
Reprinted with permission from Residuals and Biosolids 2017 Specialty Conference, Copyright © 2017. Water Environment Federation, Alexandria, Virginia.

SPC vessel systems following publishing of the SPC technology pilot study results in 2014. Results and ongoing monitoring of the SPC technology’s effectiveness are discussed herein.
KEYWORDS
Incineration, sewage sludge, fluidized bed, regulatory, air pollution control
INTRODUCTION
Regulatory Requirements
On March 21, 2011, the United States Environmental Protection Agency (USEPA) published Title 40 Code of Federal Regulations (CFR) Part 60 – Standards of Performance for New
Stationary Sources and Emissions Guidelines for Existing Sources: Sewage Sludge Incineration
Units; Final Rule, and thereby established more stringent air pollutant emissions standards for both pre-existing and planned future sewage sludge incinerators (SSIs) under a “model rule” (referred to herein as the SSI Maximum Achievable Control Technology (MACT) rule). In summary, the model rule stipulated that affected utilities were required to demonstrate compliance within a five year window (i.e. no later than March 21, 2016) or otherwise by an earlier date per an approved State Plan (refer to 40 CFR Part 60, §60.5245). In the State of Ohio, which did not submit a separate State Plan, March 21, 2016 was considered as the applicable final compliance deadline for all affected utilities operating SSIs.
Under the model rule, a distinction between SSIs that would be classified as “existing” versus “new” was included. This distinction was notable in that it represented a sharp difference in the level of compliance required for regulated air pollutants. In summary, an SSI classified as “new” would have stricter emissions limits when compared to an SSI classified as “existing,” and would therefore likely require additional emissions control to maintain air pollutant emissions compliance. Requirements for classifying SSIs as either “existing” or “new” were defined as follows”
• Existing SSIs: Multiple hearth incinerators (MHIs) and fluidized bed incinerators (FBIs)where construction commenced on or before October 14, 2010.
• Modified SSIs: Existing MHIs and FBIs which undergo modifications later thanSeptember 21, 2011 and meet one or both of the following two criteria:
o The cumulative cost of changes over the life of the SSI exceeds 50 percent (50%)of the original cost of building (construction the SSI) and installing the SSI (notincluding land cost) updated to current dollars. A summary of what items arewithin the boundary of the SSI and thus used to calculate these costs was initiallyprovided under 40 CFR Part 60, §60.4775.
o Any physical change in the SSI or change in the method of operating the SSI thatincreases the amount of any air pollutant emitted for which Section 129 of theClean Air Act or Section 111 of the Clean Water Act has established standards.
Modified SSIs under the above definition will be required to meet “new” MHI or “new” FBI air pollutant emissions limits.
• New SSIs: MHIs and FBIs for which construction commenced after October 14, 2010.
For reference, air pollutant emissions limits set by the model rule for “existing” and “new” MHIs and FBIs are provided in Table 1.
372
WEF Residuals and Biosolids Conference 2017
Reprinted with permission from Residuals and Biosolids 2017 Specialty Conference, Copyright © 2017. Water Environment Federation, Alexandria, Virginia.

Table 1. SSI MACT Regulated Air Pollutants and Emissions Limits for
Pollutant1 Units1
EMISSIONS LIMITS
“Existing” MHIs3
“New” MHIs4 “Existing” FBIs3 “New” FBIs4
Particulate Matter (PM) mg/dscm 80 18 9.6
Hydrogen Chloride (HCl) ppmvd 1.2 1.2 0.51 0.24
Carbon Monoxide (CO) ppmvd 3,800 52 64 27
PCDD/PCDF, TEQ2 ng/dscm 0.32 0.0022 0.10 0.0044
PCDD/PCDF, TMB2 ng/dscm 5.0 0.045 1.2 0.013
Mercury (Hg) mg/dscm 0.28 0.15 0.037 0.0010
Oxides of Nitrogen (NOx) ppmvd 220 210 150 30
Sulfur Dioxide (SO2) ppmvd 26 26 15 5.3
Cadmium (Cd) mg/dscm 0.095 0.0024 0.0016 0.0011
Lead (Pb) mg/dscm 0.30 0.0035 0.0074 0.00062
1 All tested parameters corrected to 7% O2 2 Compliance with PCDD (Polychlorinated Dibenzodioxins) and PCDF (Polychlorinated Dibenzofurans) limits for TEQ (Toxic Equivalency Basis) or TMB (Toxic Mass Basis) is required, not both.
3 40 CFR Part 60 Subpart MMMM (“Existing”) 4 40 CFR Part 60 Subpart LLLL (“New”)
Air pollutant emissions limits set forth under the model rule, which took effect March 21, 2016 as previously noted, are enforceable by Federal Implementation Plan (FIP) 40 CFR Part 62
Subpart LLL, RIN 2060-AR77.
Utility Background
In the State of Ohio, several utilities operated MHIs and FBIs prior to the promulgation of the SSI MACT rule. Some of these utilities have since chosen, for a variety of reasons, to discontinue operation of their incineration facilities rather than invest in the upgrades needed to ensure compliance with the rule requirements. On the other hand, the Northeast Ohio Regional Sewer District (NEORSD) and the Metropolitan Sewer District of Greater Cincinnati (MSDGC) each chose to continue operation of their existing incineration facilities at the Southerly WWTC and the Mill Creek WWTP, respectively.
The decision to continue operation of existing incinerators was made by each utility, in part, due to the alternative requirement for each to haul an average of 120+ dry tons per day (dtpd) of dewatered sludge cake to landfill, which was deemed not only to be cost prohibitive, but also to be unsustainable. As a result, NEORSD and MSDGC separately initiated efforts to determine which upgrades would be required to ensure consistent compliance with the SSI MACT rule, and subsequently to implement the required upgrades. These efforts are discussed in detail herein.
373
WEF Residuals and Biosolids Conference 2017
Reprinted with permission from Residuals and Biosolids 2017 Specialty Conference, Copyright © 2017. Water Environment Federation, Alexandria, Virginia.
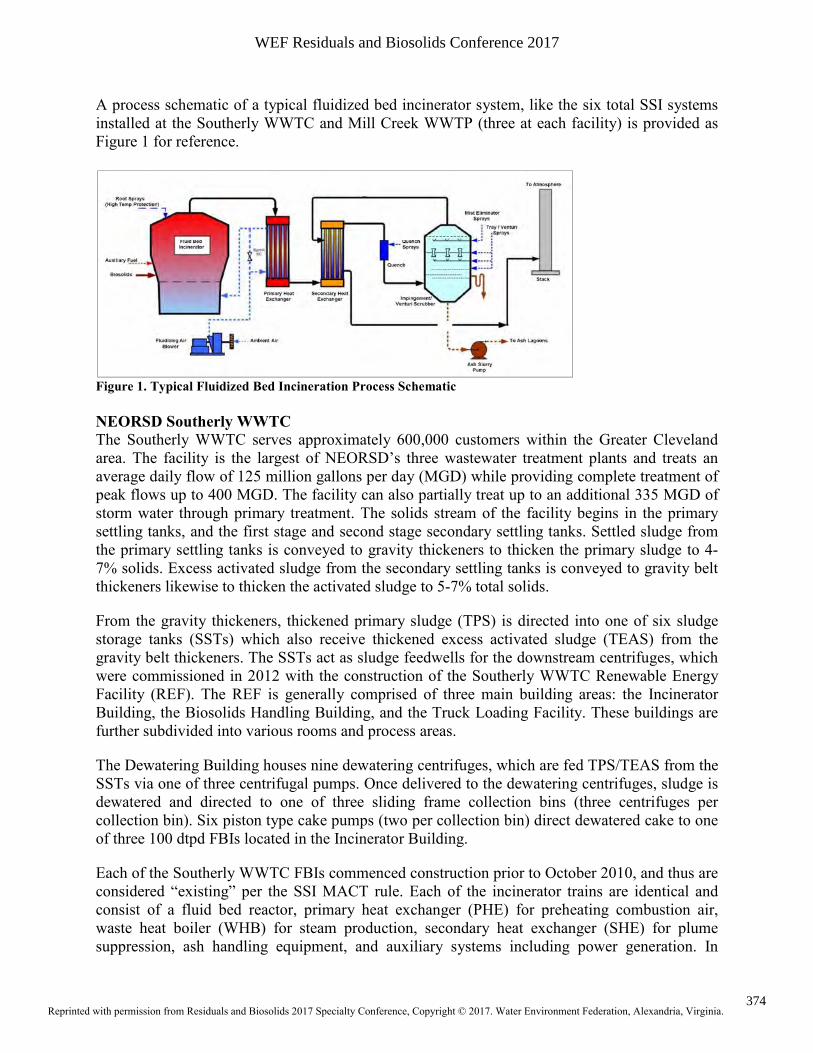
A process schematic of a typical fluidized bed incinerator system, like the six total SSI systems installed at the Southerly WWTC and Mill Creek WWTP (three at each facility) is provided as Figure 1 for reference.
Figure 1. Typical Fluidized Bed Incineration Process Schematic
NEORSD Southerly WWTC
The Southerly WWTC serves approximately 600,000 customers within the Greater Cleveland area. The facility is the largest of NEORSD’s three wastewater treatment plants and treats an average daily flow of 125 million gallons per day (MGD) while providing complete treatment of peak flows up to 400 MGD. The facility can also partially treat up to an additional 335 MGD of storm water through primary treatment. The solids stream of the facility begins in the primary settling tanks, and the first stage and second stage secondary settling tanks. Settled sludge from the primary settling tanks is conveyed to gravity thickeners to thicken the primary sludge to 4-7% solids. Excess activated sludge from the secondary settling tanks is conveyed to gravity belt thickeners likewise to thicken the activated sludge to 5-7% total solids.
From the gravity thickeners, thickened primary sludge (TPS) is directed into one of six sludge storage tanks (SSTs) which also receive thickened excess activated sludge (TEAS) from the gravity belt thickeners. The SSTs act as sludge feedwells for the downstream centrifuges, which were commissioned in 2012 with the construction of the Southerly WWTC Renewable Energy Facility (REF). The REF is generally comprised of three main building areas: the Incinerator Building, the Biosolids Handling Building, and the Truck Loading Facility. These buildings are further subdivided into various rooms and process areas.
The Dewatering Building houses nine dewatering centrifuges, which are fed TPS/TEAS from the SSTs via one of three centrifugal pumps. Once delivered to the dewatering centrifuges, sludge is dewatered and directed to one of three sliding frame collection bins (three centrifuges per collection bin). Six piston type cake pumps (two per collection bin) direct dewatered cake to one of three 100 dtpd FBIs located in the Incinerator Building.
Each of the Southerly WWTC FBIs commenced construction prior to October 2010, and thus are considered “existing” per the SSI MACT rule. Each of the incinerator trains are identical and consist of a fluid bed reactor, primary heat exchanger (PHE) for preheating combustion air, waste heat boiler (WHB) for steam production, secondary heat exchanger (SHE) for plume suppression, ash handling equipment, and auxiliary systems including power generation. In
374
WEF Residuals and Biosolids Conference 2017
Reprinted with permission from Residuals and Biosolids 2017 Specialty Conference, Copyright © 2017. Water Environment Federation, Alexandria, Virginia.
addition, each incinerator train was initially constructed with emissions controls sufficient to meet regulatory requirements for air pollutant emissions prior to the more stringent requirements under the SSI MACT rule. The existing emissions controls for each FBI consists of a quench and an impingement EnviroCare (ECI) VenturiPak wet scrubber with multiple fixed venturis.
MSDGC Mill Creek WWTP
The Mill Creek WWTP treats an average flow of 130 MGD and serves the City of Cincinnati and central Hamilton County, Ohio. It is the largest of MSDGC’s three major wastewater treatment plants and has a firm capacity of 430 MGD through preliminary and primary treatment and 240 MGD through secondary treatment. The solids process stream for the facility begins in the primary settling basins and secondary clarifiers. Settled sludge from the primary settling basins is conveyed to gravity thickeners to thicken the primary sludge to 4-7% total solids. Waste activated sludge (WAS) from the secondary clarifiers is conveyed to thickening centrifuges, which thicken the activated sludge to 5-7% total solids.
From the gravity thickeners, thickened primary sludge (TPS) is directed into a common sludge
feed header. This header also conveys the centrifuge thickened waste activated sludge (TWAS)
to promote in-line blending of the combined thickened sludge (TPS/TWAS). TPS/TWAS may be
transferred directly to the dewatering sludge feedwells, or first to one of twelve sludge storage
tanks (former digester tanks), where TPS/TWAS is then pumped to the dewatering sludge
feedwells in the Dewatering Building.
The dewatering sludge feedwells temporarily hold TPS/TWAS prior to it being pumped by one
of seven progressing cavity pumps to one of six dewatering centrifuges. Centrifuge dewatered
sludge cake is then directed to one of three live bottom collection bins. Six piston cake pumps,
two per collection bin, direct dewatered cake to the three 96 dtpd FBIs located in the adjacent
Incinerator Building.
Similar to the Southerly WWTC FBIs, the Mill Creek WWTP FBIs commenced construction prior to October 2010, and thus are considered “existing” per the SSI MACT rule. Each of the incinerator trains are also identical and consist of a fluid bed reactor, PHE, SHE, ash handling equipment and auxiliary systems. The Mill Creek WWTP incinerators are not used to generate power as are the Southerly WWTC incinerators, and thus are not equipped with WHBs. Similar to the Southerly WWTC incinerators; each of the Mill Creek WWTP incinerators was initially constructed with a quench and an impingement ECI VenturiPak wet scrubber.
Initial Compliance Evaluations
NEORSD and MSDGC each separately engaged Black & Veatch in late 2013 to assess the
effectiveness of existing emissions controls (i.e. ECI VenturiPak wet scrubbers) equipment for
the Southerly WWTC and Mill Creek WWTP FBIs to meet the more stringent air pollutant
emissions standards under the SSI MACT rule. Black & Veatch’s role included coordination,
review, and interpretation of historical and newly collected data in preparation for the design and
implementation of enhanced emissions controls improvements.
375
WEF Residuals and Biosolids Conference 2017
Reprinted with permission from Residuals and Biosolids 2017 Specialty Conference, Copyright © 2017. Water Environment Federation, Alexandria, Virginia.

Initial compliance evaluations for both NEORSD and MSDGC followed similar paths, and each primarily relied on the results of previous and new emissions compliance tests to assess the effectiveness of existing emissions controls to meet the SSI MACT rule’s requirements.
More specifically, in early 2014, NEORSD contracted a third party testing agency to assist in conducting Self-Evaluation Engineering Studies (i.e. unofficial emissions compliance tests) for each of the Southerly WWTC FBIs. These studies were conducted from March 25-26, 2014 and July 22, 2014, June 4-6, 2014, and June 20, 2014 for Southerly WWTC FBIs No. 3, No. 2, and No. 1, respectively. As previously noted, the goal of these studies was to compare air pollutant emissions levels for each of the incinerators against the respective SSI MACT rule’s air pollutant emissions limits.
In general, the testing methods utilized during NEORSD’s Self-Evaluation Engineering Studies and during similar efforts conducted by MSDGC (discussed later herein) were in conformance with those required per 40 CFR Part 60 Subpart MMMM, and as summarized in Table 2.
Table 2. Required SSI MACT Resting Analytes and Methods for Existing FBIs
Analyte1 Averaging Methods & Sampling Duration
3 Sampling Method
3
Particulate Matter (PM) Average of three runs
Minimum 1 dscm per run EPA Method 5, 26A, or 29
Hydrogen Chloride (HCl) Average of three runs
Minimum 1 dscm per run EPA Method 26A
Carbon Monoxide (CO) Average of three runs
Minimum one hour duration per run EPA Method 10, 10A, or 10B
PCDD/PCDF, TEQ2 Average of three runs
Minimum 1 dscm per run EPA Method 23
PCDD/PCDF, TMB2 Average of three runs
Minimum 1 dscm per run EPA Method 23
Mercury (Hg) Average of three runs
Method 29: Minimum 1 dscm per run Method 30B: As specified
EPA Method 29, 30B, or ASTM D6784-02
Oxides of Nitrogen (NOx) Average of three runs
Minimum one hour duration per run Method 7 or 7E
Sulfur Dioxide (SO2) Average of three runs
Method 6: Minimum 60L per run Method 6C: Minimum one hour duration per run
Method 6, 6C, or ANSI/ASME PTC 19.10-
1981
Cadmium (Cd) Average of three runs
Minimum 1 dscm per run EPA Method 29
Lead (Pb) Average of three runs
Minimum 1 dscm per run EPA Method 29
Fugitive Ash Emissions Three 1-hour observation periods EPA Method 22
1 All tested parameters corrected to 7% O2 2 Compliance with PCDD and PCDF limit for TEQ or TMB is required, not both 3 40 CFR Part 60 Subpart MMMM
376
WEF Residuals and Biosolids Conference 2017
Reprinted with permission from Residuals and Biosolids 2017 Specialty Conference, Copyright © 2017. Water Environment Federation, Alexandria, Virginia.

Similarly to NEORSD, MSDGC contracted a separate third party testing agency to perform unofficial emissions compliance tests for one FBI at the Mill Creek WWTP (FBI No. 3). This testing occurred February 4-7, 2013. Note that MSDGC opted only to test a single FBI at Mill Creek WWTP given that historical, official emissions compliance test results were also available for each of the Mill Creek WWTP FBIs from their commissioning in 2010.
The following provides a summary of the initial findings of the initial compliance evaluations for NEORSD and MSDGC.
NEORSD Southerly WWTC
Summary emissions testing results for each of the early-2014 Self-Evaluation Engineering Studies conducted by NEORSD are presented in Tables 3 through 6. Note that each table also indicates the level of compliance achieved for each pollutant per the SSI MACT rule for existing FBIs, indicated as “Percent of Allowable.” Rows, which show bolded text indicate those pollutants which were found to either be non-compliant (above the associated MACT limit) or which were considered approaching non-compliant (>75% of the allowable limit).
Table 3. Southerly WWTC FBI No. 1 Emissions Compliance Test Results – June 2014
Pollutant Measured
Average1,6
Allowable
2 Units
3 Percent (%) of Allowable
6
Particulate Matter (PM)
2.0 18 mg/dscm 11.1
Hydrogen Chloride (HCl)5
- 0.51 ppmvd -
Carbon Monoxide (CO)
24.5 64 ppmvd 38.3
PCDD/PCDF, TEQ4,5
- 0.10 ng/dscm -
PCDD/PCDF, TMB4 - 1.2 ng/dscm -
Mercury (Hg) 0.0352 0.037 mg/dscm 95.1
Oxides of Nitrogen (NOx)
44.2 150 ppmvd 29.5
Sulfur Dioxide (SO2) 22.8 15 ppmvd 152.0
Cadmium (Cd) <0.00057 0.0016 mg/dscm <35.6
Lead (Pb) <0.00047 0.0074 mg/dscm <6.4 1 Based on average of three test runs conducted in June 2014 for Southerly WWTC FBI No. 1 2 SSI MACT rule air pollutant emissions limits for “existing” FBIs 3 All test parameters tested to 7% O2 4 Compliance with PCDD and PCDF limit for TEQ or TMB is required, not both 5 HCL and PCDD/PCDF not tested for FBI No. 1 during June 2014 testing 6 “<” symbol indicates that the compound was not present in quantities above the Minimum Detection Limit (MDL) for at least one sample
377
WEF Residuals and Biosolids Conference 2017
Reprinted with permission from Residuals and Biosolids 2017 Specialty Conference, Copyright © 2017. Water Environment Federation, Alexandria, Virginia.

Table 4. Southerly WWTC FBI No. 2 Emissions Compliance Test Results – June 2014
Pollutant Measured
Average1,6
Allowable
2 Units
3 Percent (%) of Allowable
6
Particulate Matter (PM)
1.87 18 mg/dscm 10.4
Hydrogen Chloride (HCl)5
<0.151 0.51 ppmvd <29.6
Carbon Monoxide (CO)
7.74 64 ppmvd 12.1
PCDD/PCDF, TEQ4,5
0.00047 0.10 ng/dscm 0.5
PCDD/PCDF, TMB4 - 1.2 ng/dscm -
Mercury (Hg) 0.040 0.037 mg/dscm 108.1
Oxides of Nitrogen (NOx)
103.1 150 ppmvd 68.7
Sulfur Dioxide (SO2) 10.7 15 ppmvd 71.3
Cadmium (Cd) <0.0015 0.0016 mg/dscm <93.8
Lead (Pb) <0.00047 0.0074 mg/dscm <6.4 1 Based on average of three test runs conducted in June 2014 for Southerly WWTC FBI No. 2 2 SSI MACT rule air pollutant emissions limits for “existing” FBIs 3 All test parameters tested to 7% O2 4 Compliance with PCDD and PCDF limit for TEQ or TMB is required, not both 5 PCDD/PCDF TEQ tested for FBI No. 2 during June 2014 testing 6 “<” symbol indicates that the compound was not present in quantities above the MDL for at least one sample
Table 5. Southerly WWTC FBI No. 3 Emissions Compliance Test Results – March 2014
Pollutant Measured
Average1,6
Allowable
2 Units
3 Percent (%) of Allowable
6
Particulate Matter (PM)
2.77 18 mg/dscm 15.4
Hydrogen Chloride (HCl)5
0.158 0.51 ppmvd 31.0
Carbon Monoxide (CO)
9.28 64 ppmvd 14.5
PCDD/PCDF, TEQ4,5
0.0130 0.10 ng/dscm 13.0
PCDD/PCDF, TMB4 - 1.2 ng/dscm -
Mercury (Hg) 0.0297 0.037 mg/dscm 80.3
Oxides of Nitrogen (NOx)
44.5 150 ppmvd 29.5
Sulfur Dioxide (SO2) 34.8 15 ppmvd 232.0
Cadmium (Cd) <0.00091 0.0016 mg/dscm <56.9
378
WEF Residuals and Biosolids Conference 2017
Reprinted with permission from Residuals and Biosolids 2017 Specialty Conference, Copyright © 2017. Water Environment Federation, Alexandria, Virginia.

Pollutant Measured
Average1,6
Allowable
2 Units
3 Percent (%) of Allowable
6
Lead (Pb) <0.00017 0.0074 mg/dscm <2.3 1 Based on average of three test runs conducted in March 2014 for Southerly WWTC FBI No. 3 2 SSI MACT rule air pollutant emissions limits for “existing” FBIs 3 All test parameters tested to 7% O2 4 Compliance with PCDD and PCDF limit for TEQ or TMB is required, not both 5 PCDD/PCDF TEQ tested for FBI No. 3 during March 2014 testing 6 “<” symbol indicates that the compound was not present in quantities above the MDL for at least one sample
Table 6. Southerly WWTC FBI No. 3 Emissions Compliance Test Results – July 2014
Pollutant Measured
Average1,6
Allowable
2 Units
3 Percent (%) of Allowable
6
Particulate Matter (PM)
0.0018 18 mg/dscm 0.0
Hydrogen Chloride (HCl)5
- 0.51 ppmvd -
Carbon Monoxide (CO)
26.2 64 ppmvd 40.9
PCDD/PCDF, TEQ4,5
- 0.10 ng/dscm -
PCDD/PCDF, TMB4 - 1.2 ng/dscm -
Mercury (Hg) <0.034 0.037 mg/dscm 91.9
Oxides of Nitrogen (NOx)
41.2 150 ppmvd 27.5
Sulfur Dioxide (SO2) <19.0 15 ppmvd <126.7
Cadmium (Cd) <0.00033 0.0016 mg/dscm <20.6
Lead (Pb) <0.00142 0.0074 mg/dscm 19.2 1 Based on average of three test runs conducted in July 2014 for Southerly WWTC FBI No. 3 2 SSI MACT rule air pollutant emissions limits for “existing” FBIs 3 All test parameters tested to 7% O2 4 Compliance with PCDD and PCDF limit for TEQ or TMB is required, not both 5 HCL and PCDD/PCDF not tested for FBI No. 3 during July 2014 testing 6 “<” symbol indicates that the compound was not present in quantities above the MDL for at least one sample
As shown in Tables 3 through 6, pollutants that were shown to exhibit emissions levels higher than their associated SSI MACT limits were mercury (Hg) and sulfur dioxide (SO2). In addition, cadmium (Cd) was shown to test above the allowable limit for two of the nine test runs conducted (three per testing event), resulting in an average tested concentration of approximately 94% of the allowable limit for FBI No. 2. All other analytes measured well within the allowable limits per the SSI MACT rule, and were thus considered as being sufficiently controlled by existing air pollutant emissions controls systems.
379
WEF Residuals and Biosolids Conference 2017
Reprinted with permission from Residuals and Biosolids 2017 Specialty Conference, Copyright © 2017. Water Environment Federation, Alexandria, Virginia.
MSDGC Mill Creek WWTP
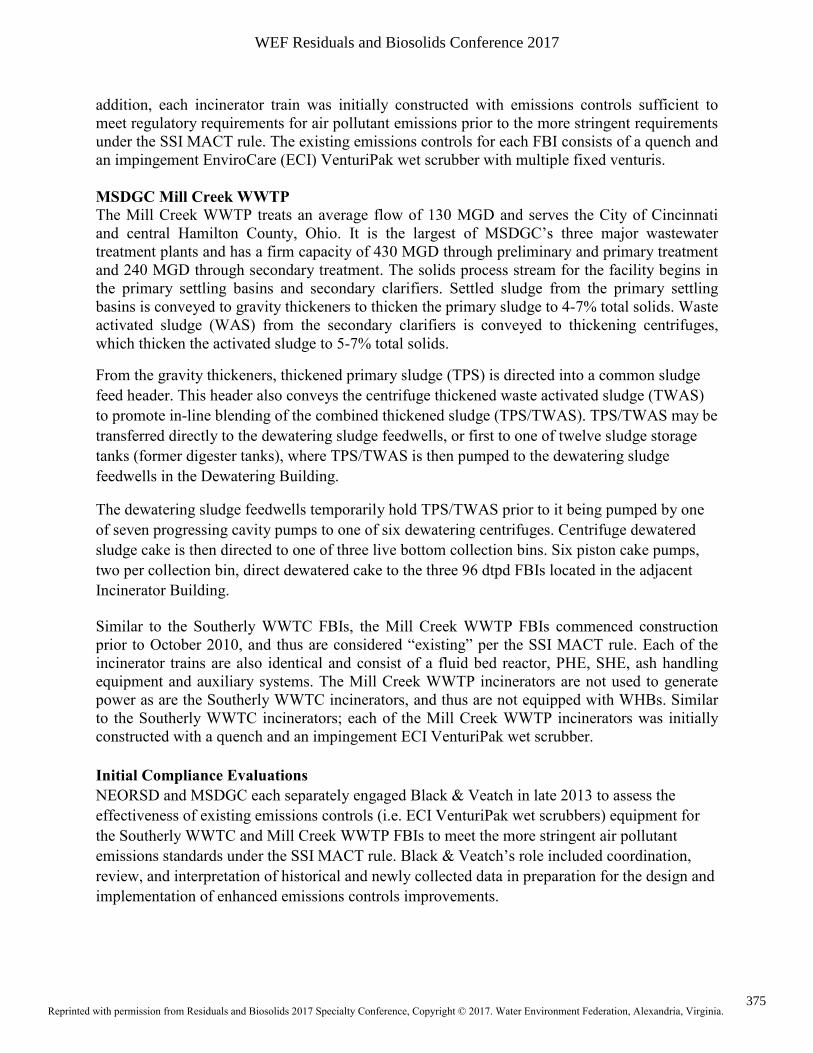
Summary emissions testing results for the early-2013 emissions compliance testing conducted by MSDGC for Mill Creek WWTP FBI No. 3 are provided in Table 7, which displays the level of compliance achieved for each pollutant per the SSI MACT rule for existing FBIs, indicated as “Percent of Allowable.”
Table 7. Mill Creek WWTP FBI No. 3 Emissions Compliance Test Results – February 2013
Pollutant Measured
Average1,5
Allowable
2 Units
3 Percent (%) of Allowable
5
Particulate Matter (PM)
0.882 18 mg/dscm 4.9
Hydrogen Chloride (HCl)
0.0916 0.51 ppmvd 18.0
Carbon Monoxide (CO)
1.2 64 ppmvd 1.9
PCDD/PCDF, TEQ4
0.0058 0.10 ng/dscm 5.6
PCDD/PCDF, TMB4 0.0663 1.2 ng/dscm 5.5
Mercury (Hg) 0.0350 0.037 mg/dscm 94.6
Oxides of Nitrogen (NOx)
61.2 150 ppmvd 40.8
Sulfur Dioxide (SO2) 2.09 15 ppmvd 13.9
Cadmium (Cd) <0.000416 0.0016 mg/dscm <26.0
Lead (Pb) 0.000896 0.0074 mg/dscm 12.1 1 Based on average of three test runs conducted in February 2013 for Mill Creek WWTP FBI No. 3 2 SSI MACT rule air pollutant emissions limits for “existing” FBIs 3 All test parameters tested to 7% O2 4 Compliance with PCDD and PCDF limit for TEQ or TMB is required, not both 5 “<” symbol indicates that the compound was not present in quantities above the MDL for at least one sample
As displayed upon Table 7, mercury was found to be the only tested parameter above or near respective limits per the SSI MACT rule. On average, mercury emissions during the February 2013 testing were 95% of allowable, with one test reporting mercury levels at 99.6% of allowable.
As previously indicated, in addition to the February 2013 emissions test results for Mill Creek WWTP FBI No. 3, official emissions test data from the commissioning of the Mill Creek WWTP incinerators were reviewed. These results are based on tests conducted in May, July, and September 2010 for Mill Creek WWTP incinerators No. 2, No. 3, and No. 1, respectively. Note that the 2010 emissions test results were conducted to establish compliance with a separate set of emissions standards, and as such do not include all regulated air pollutants under the SSI MACT rule; refer to Tables 8 through 10.
380
WEF Residuals and Biosolids Conference 2017
Reprinted with permission from Residuals and Biosolids 2017 Specialty Conference, Copyright © 2017. Water Environment Federation, Alexandria, Virginia.
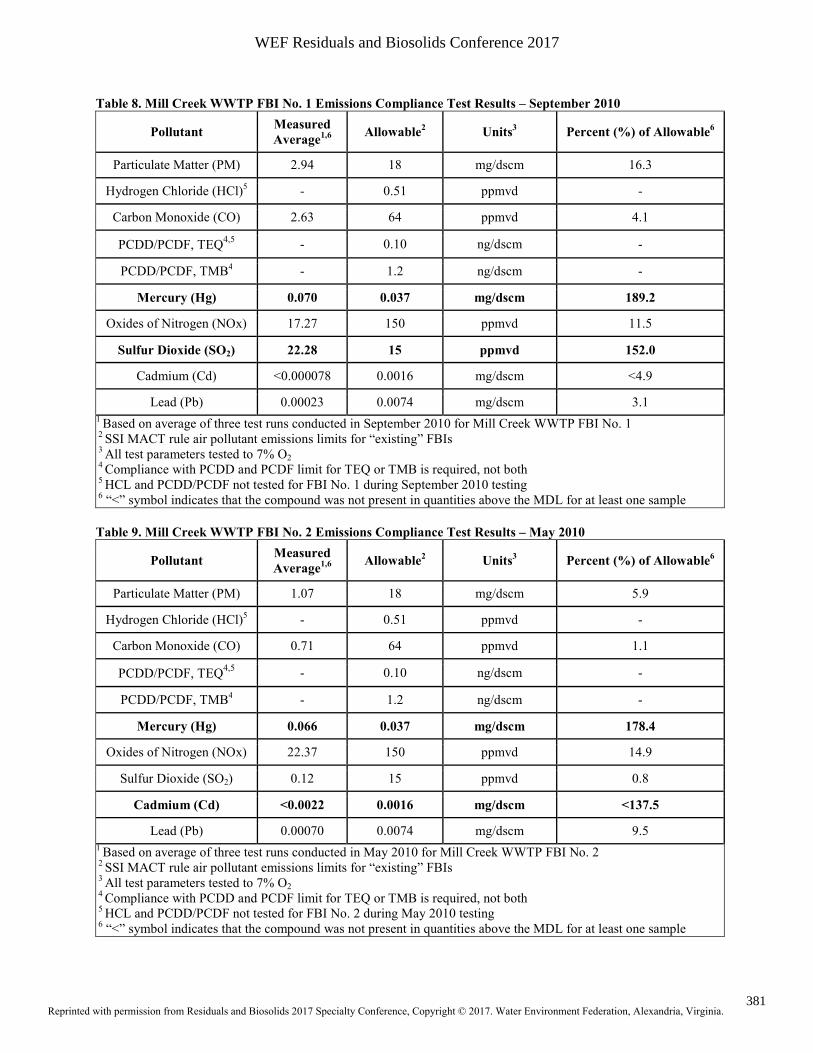
Table 8. Mill Creek WWTP FBI No. 1 Emissions Compliance Test Results – September 2010
Pollutant Measured
Average1,6
Allowable
2 Units
3 Percent (%) of Allowable
6
Particulate Matter (PM) 2.94 18 mg/dscm 16.3
Hydrogen Chloride (HCl)5 - 0.51 ppmvd -
Carbon Monoxide (CO) 2.63 64 ppmvd 4.1
PCDD/PCDF, TEQ4,5
- 0.10 ng/dscm -
PCDD/PCDF, TMB4 - 1.2 ng/dscm -
Mercury (Hg) 0.070 0.037 mg/dscm 189.2
Oxides of Nitrogen (NOx) 17.27 150 ppmvd 11.5
Sulfur Dioxide (SO2) 22.28 15 ppmvd 152.0
Cadmium (Cd) <0.000078 0.0016 mg/dscm <4.9
Lead (Pb) 0.00023 0.0074 mg/dscm 3.1 1 Based on average of three test runs conducted in September 2010 for Mill Creek WWTP FBI No. 1 2 SSI MACT rule air pollutant emissions limits for “existing” FBIs 3 All test parameters tested to 7% O2 4 Compliance with PCDD and PCDF limit for TEQ or TMB is required, not both 5 HCL and PCDD/PCDF not tested for FBI No. 1 during September 2010 testing 6 “<” symbol indicates that the compound was not present in quantities above the MDL for at least one sample
Table 9. Mill Creek WWTP FBI No. 2 Emissions Compliance Test Results – May 2010
Pollutant Measured
Average1,6
Allowable
2 Units
3 Percent (%) of Allowable
6
Particulate Matter (PM) 1.07 18 mg/dscm 5.9
Hydrogen Chloride (HCl)5 - 0.51 ppmvd -
Carbon Monoxide (CO) 0.71 64 ppmvd 1.1
PCDD/PCDF, TEQ4,5
- 0.10 ng/dscm -
PCDD/PCDF, TMB4 - 1.2 ng/dscm -
Mercury (Hg) 0.066 0.037 mg/dscm 178.4
Oxides of Nitrogen (NOx) 22.37 150 ppmvd 14.9
Sulfur Dioxide (SO2) 0.12 15 ppmvd 0.8
Cadmium (Cd) <0.0022 0.0016 mg/dscm <137.5
Lead (Pb) 0.00070 0.0074 mg/dscm 9.5 1 Based on average of three test runs conducted in May 2010 for Mill Creek WWTP FBI No. 2 2 SSI MACT rule air pollutant emissions limits for “existing” FBIs 3 All test parameters tested to 7% O2 4 Compliance with PCDD and PCDF limit for TEQ or TMB is required, not both 5 HCL and PCDD/PCDF not tested for FBI No. 2 during May 2010 testing 6 “<” symbol indicates that the compound was not present in quantities above the MDL for at least one sample
381
WEF Residuals and Biosolids Conference 2017
Reprinted with permission from Residuals and Biosolids 2017 Specialty Conference, Copyright © 2017. Water Environment Federation, Alexandria, Virginia.

Table 10. Mill Creek WWTP FBI No. 3 Emissions Compliance Test Results – July 2010
Pollutant Measured
Average1,6
Allowable
2 Units
3 Percent (%) of Allowable
6
Particulate Matter (PM) 2.48 18 mg/dscm 13.8
Hydrogen Chloride (HCl)5
- 0.51 ppmvd -
Carbon Monoxide (CO) 15.54 64 ppmvd 24.3
PCDD/PCDF, TEQ4,5
- 0.10 ng/dscm -
PCDD/PCDF, TMB4 - 1.2 ng/dscm -
Mercury (Hg) 0.057 0.037 mg/dscm 154.1
Oxides of Nitrogen (NOx)
31.65 150 ppmvd 21.1
Sulfur Dioxide (SO2) 13.61 15 ppmvd 90.7
Cadmium (Cd) <0.0001354 0.0016 mg/dscm <8.5
Lead (Pb) 0.00054 0.0074 mg/dscm 7.3
1 Based on average of three test runs conducted in July 2010 for Mill Creek WWTP FBI No. 3 2 SSI MACT rule air pollutant emissions limits for “existing” FBIs 3 All test parameters tested to 7% O2 4 Compliance with PCDD and PCDF limit for TEQ or TMB is required, not both 5 HCL and PCDD/PCDF not tested for FBI No. 3 during July 2010 testing 6 “<” symbol indicates that the compound was not present in quantities above the MDL for at least one sample
As shown in Tables 7 through 10, pollutants that were shown to exhibit emissions levels higher than their associated SSI MACT limits were mercury, sulfur dioxide, and cadmium. All other analytes measured well within the allowable limits per the SSI MACT rule, and were thus considered as being sufficiently controlled by existing air pollutant emissions controls systems.
Note that elevated levels of sulfur dioxide and cadmium for various 2010 tests were at least in part attributed to process water restrictions to existing air emissions controls devices.
Mercury Emissions Controls
Elevated levels of sulfur dioxide and cadmium observed during various testing events for the
Southerly WWTC and Mill Creek WWTP FBIs were addressed via separate improvements to the
existing EnviroCare VenturiPak wet scrubbers already installed for each FBI at these facilities.
These improvements are not the topic of this discussion, and are thus not included herein.
Aside from elevated emissions of sulfur dioxide and cadmium, data reviewed during the initial
compliance evaluations strongly pointed towards the requirement for enhanced mercury
emissions controls for FBIs at both Southerly WWTC and Mill Creek WWTP. As such, the
following provides a brief review of the sources of mercury in SSI applications alongside a
summary of technologies considered by the project teams to address mercury emissions at
Southerly WWTC and Mill Creek WWTP.
382
WEF Residuals and Biosolids Conference 2017
Reprinted with permission from Residuals and Biosolids 2017 Specialty Conference, Copyright © 2017. Water Environment Federation, Alexandria, Virginia.

The source of mercury in SSI exhaust gasses is the solids generated within the wastewater
treatment facility. Unlike most metals which typically drop out of the incineration process with
the ash, and which are removed in the wet scrubber or other particulate removal technology,
mercury can exist in the following three forms following incineration:
• Particulate Mercury: Mercury entrained with the ash and particulate matter. This
fraction of the total mercury is removed in the wet scrubber and sent to the wet ash
lagoon with other metals and particulates. A very small portion of the total mercury is in
this form.
• Elemental Mercury: Mercury is volatilized by combustion. As the gaseous elemental
mercury is cooled through the remaining processes, it may react with other components
of the flue gas to form oxidized gaseous mercury. This form of mercury is soluble in
water and can be partially removed in the wet scrubber.
• Oxidized Gaseous Mercury: Elemental mercury which is oxidized by exhaust gas
components such as: halogens (chlorine, fluorine, and bromine); oxides of sulfur such as
sulfur dioxide (SO2) and sulfur trioxide (SO3); and nitrogen such as nitrogen dioxide
(NO2).
In most wastewater treatment plants, only a fraction of the elemental mercury is oxidized.
Therefore, a fraction of the mercury discharged from the incineration process remains in the
elemental form. Although some of the oxidized mercury can be captured by wet scrubber
technologies (such as the EnviroCare VenturiPak wet scrubbers installed at Southerly WWTC
and Mill Creek WWTP) this form of mercury removal is very inefficient. As such, proven
technologies used for mercury removal include powder activated carbon (PAC) injection for
plants with dry ash systems and fixed bed granular activated (GAC) scrubbers for wet ash
systems (both the Southerly WWTC and Mill Creek WWTP FBIs use wet ash systems).
PAC Injection
Figure 2 illustrates a summary process schematic for a typical PAC injection system. Typical
systems include PAC storage and handling components (not shown on Figure 2), PAC injection
towers, fabric filters, and spent PAC truck loading equipment. For SSI applications, PAC
injection has historically been installed upstream of the wet scrubber and used as the primary
means for removing both ash and mercury. For such installations, dry ash handling is used.
Because the Southerly WWTC and Mill Creek WWTP FBIs currently operate with a wet ash
handling system to direct ash slurry to lagoons, use of a PAC injection system train would
require the system to be installed downstream of the existing wet scrubber and after the SHE to
minimize impact on current ash handling practices. As such, the existing SHE would be re-used
to re-heat the exhaust gases above dew point temperatures before entering the fabric filter. The
fabric filter bags are expected to form a PAC layer on the surface of each bag essential for gas-
solid contact with the carbon for mercury adsorption. The PAC would need to be fed to the
exhaust gases on a continuous basis to maintain this layer for proper mercury adsorption. Note
that PAC injection is typically capable of achieving a mercury reduction of ~85%.
383
WEF Residuals and Biosolids Conference 2017
Reprinted with permission from Residuals and Biosolids 2017 Specialty Conference, Copyright © 2017. Water Environment Federation, Alexandria, Virginia.
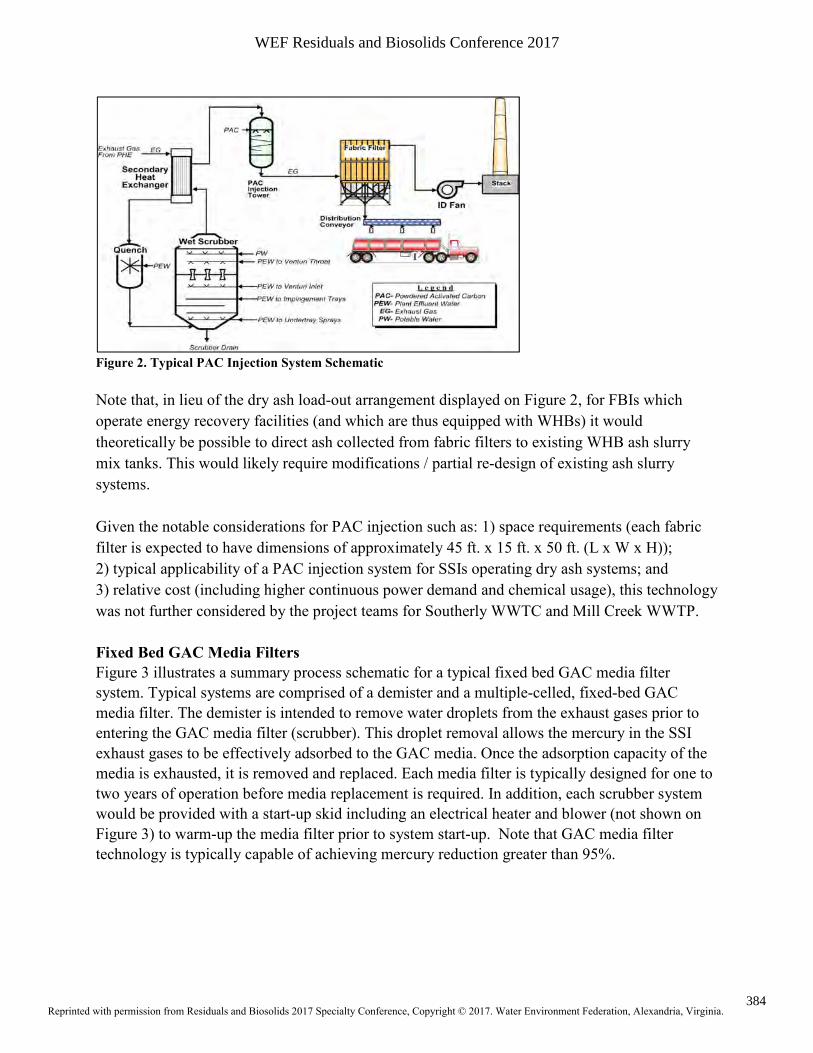
Figure 2. Typical PAC Injection System Schematic
Note that, in lieu of the dry ash load-out arrangement displayed on Figure 2, for FBIs which
operate energy recovery facilities (and which are thus equipped with WHBs) it would
theoretically be possible to direct ash collected from fabric filters to existing WHB ash slurry
mix tanks. This would likely require modifications / partial re-design of existing ash slurry
systems.
Given the notable considerations for PAC injection such as: 1) space requirements (each fabric
filter is expected to have dimensions of approximately 45 ft. x 15 ft. x 50 ft. (L x W x H));
2) typical applicability of a PAC injection system for SSIs operating dry ash systems; and
3) relative cost (including higher continuous power demand and chemical usage), this technology
was not further considered by the project teams for Southerly WWTC and Mill Creek WWTP.
Fixed Bed GAC Media Filters
Figure 3 illustrates a summary process schematic for a typical fixed bed GAC media filter
system. Typical systems are comprised of a demister and a multiple-celled, fixed-bed GAC
media filter. The demister is intended to remove water droplets from the exhaust gases prior to
entering the GAC media filter (scrubber). This droplet removal allows the mercury in the SSI
exhaust gases to be effectively adsorbed to the GAC media. Once the adsorption capacity of the
media is exhausted, it is removed and replaced. Each media filter is typically designed for one to
two years of operation before media replacement is required. In addition, each scrubber system
would be provided with a start-up skid including an electrical heater and blower (not shown on
Figure 3) to warm-up the media filter prior to system start-up. Note that GAC media filter
technology is typically capable of achieving mercury reduction greater than 95%.
384
WEF Residuals and Biosolids Conference 2017
Reprinted with permission from Residuals and Biosolids 2017 Specialty Conference, Copyright © 2017. Water Environment Federation, Alexandria, Virginia.

Figure 3. Typical GAC System Schematic
A benefit of the fixed bed GAC media technology is its ability to achieve superior mercury
removal efficiencies when compared to other options discussed herein. A potential future change
in regulations (requiring greater than 90% mercury removal) could be supported by the GAC
system. As a result, GAC system manufacturers currently operating in the municipal SSI market
(Carbon Process & Plant Engineering (CPPE) and Air Pollution Control Technologies, Inc.
(APC)) are typically willing to provide performance guarantees designed to meet mercury limits
for FBIs classified as “existing” and “new” per the SSI MACT rule
Downsides to the GAC media technology include space requirements (each tower is expected to
have dimensions of approximately 12 ft. in diameter and up to 40 ft. high); these dimensions
would likely require that such systems be installed in standalone building for existing
installations). Another notable downside for this technology is its relative cost compared to other
options, as discussed herein.
Sorbent Polymer Composite (SPC) Media Technology
Near to the beginning of evaluation efforts conducted by the project teams for Southerly WWTC and
Mill Creek WWTP, an alternative to the PAC and GAC systems was identified. Previously unproven
in the municipal SSI market, this alternative was a proprietary system offered by EnviroCare
International (ECI) and W.L. Gore utilizing Sorbent Polymer Composite (SPC) media. At the onset of
the evaluation efforts, this technology had undergone two pilot tests in SSI applications, and was
being evaluated by a number of other utilities also operating SSIs.
The SPC media technology can be retrofitted as part of existing EnviroCare wet scrubbers or
may be provided as a standalone unit. The system utilizes a proprietary media bed comprised of
SPC media modules, which have the capability of capturing both the ionized and elemental
forms of mercury from SSI exhaust gases. In contrast to GAC media scrubbers, the sorbent
media modules are tolerant of water saturated gas streams and do not require a separate demister
or a re-heating step upstream. It is important to note that the SPC’s mercury removal efficiency
is a function of media bed depth provided with each installation, or the number of sequential
385
WEF Residuals and Biosolids Conference 2017
Reprinted with permission from Residuals and Biosolids 2017 Specialty Conference, Copyright © 2017. Water Environment Federation, Alexandria, Virginia.
layers of SPC media modules provided. Similar to GAC media scrubbers, the sorbent media
modules need to be replaced on an average bi-annual basis depending on inlet mercury loading
and volume of the media bed. To measure performance of the sorbent bed over time, periodic
media or gas grab samples are required; samples are analyzed to determine remaining life of the
media bed.
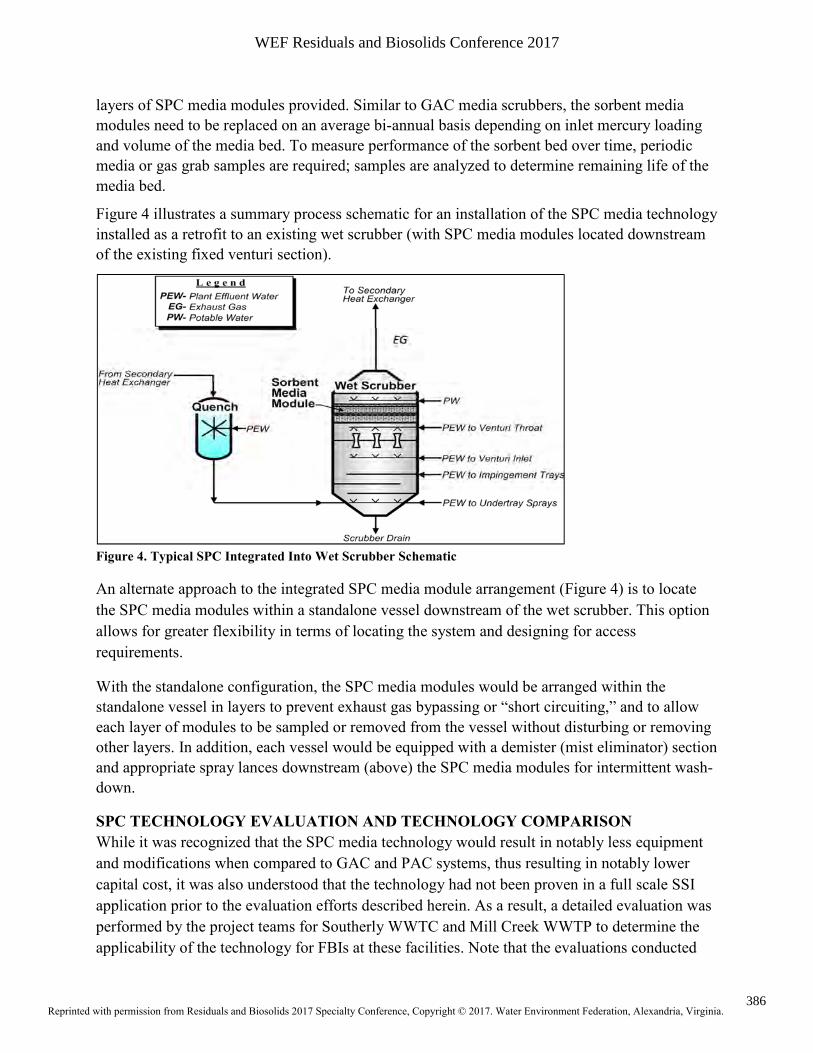
Figure 4 illustrates a summary process schematic for an installation of the SPC media technology
installed as a retrofit to an existing wet scrubber (with SPC media modules located downstream
of the existing fixed venturi section).
Figure 4. Typical SPC Integrated Into Wet Scrubber Schematic
An alternate approach to the integrated SPC media module arrangement (Figure 4) is to locate
the SPC media modules within a standalone vessel downstream of the wet scrubber. This option
allows for greater flexibility in terms of locating the system and designing for access
requirements.
With the standalone configuration, the SPC media modules would be arranged within the
standalone vessel in layers to prevent exhaust gas bypassing or “short circuiting,” and to allow
each layer of modules to be sampled or removed from the vessel without disturbing or removing
other layers. In addition, each vessel would be equipped with a demister (mist eliminator) section
and appropriate spray lances downstream (above) the SPC media modules for intermittent wash-
down.
SPC TECHNOLOGY EVALUATION AND TECHNOLOGY COMPARISON
While it was recognized that the SPC media technology would result in notably less equipment
and modifications when compared to GAC and PAC systems, thus resulting in notably lower
capital cost, it was also understood that the technology had not been proven in a full scale SSI
application prior to the evaluation efforts described herein. As a result, a detailed evaluation was
performed by the project teams for Southerly WWTC and Mill Creek WWTP to determine the
applicability of the technology for FBIs at these facilities. Note that the evaluations conducted
386
WEF Residuals and Biosolids Conference 2017
Reprinted with permission from Residuals and Biosolids 2017 Specialty Conference, Copyright © 2017. Water Environment Federation, Alexandria, Virginia.

for both facilities were similar in nature, and ultimately yielded similar conclusions. As a result,
for the purposes of this discussion, only specific details associated with the NEORSD evaluation
are provided.
In order to assess the level of compliance offered by the SPC technology in relation to Southerly
WWTC’s FBIs specifically, the project team conducted a review of the Self-Evaluation
Engineering Study emissions testing results previously presented herein and of an extensive set
of historical inlet biosolids mercury concentrations provided by NEORSD. This process resulted
in an estimation of emissions compliance failure probability with the use of the SPC technology:
• 124 data points representing inlet-biosolids mercury concentrations (collected byNEORSD) were compiled. Of these, 23 were taken by NEORSD as background test dataduring test runs for each of the Self-Evaluation Engineering Studies for FBIs No. 1, No.2, and No. 3 (refer to Tables 3 through 6).
• A comparison of the reported mercury emissions test results, biosolids feed rates, andstack discharge flow rates during each study, and of the inlet biosolids mercuryconcentrations provided by NEORSD during testing, was performed as a calibration for amercury emissions model developed by the project team. It was determined that theexisting Southerly WWTC ECI VenturiPak wet scrubbers are capable of capturingapproximately 25% of the total mercury (i.e. the mercury is contained in the ash slurryeffluent). As previously referenced, note that the wet scrubber efficiency in terms ofmercury capture will vary depending on the form of mercury present in the exhaust gases,as only ionized forms can be effectively removed by water. Note also that mercuryconcentrations can vary seasonably and with the weather, or depending on the type andquantity of influent industrial discharge.
• Utilizing the calibrated mercury emissions model, the project team evaluated variousmercury removal efficiencies across individual layers of SPC media modules todetermine the total mercury removal efficiency required to ensure compliance with theSSI MACT rule.
SPC Compliance Analysis Results
Inlet biosolids mercury concentrations generated from the analysis of grab samples collected by
NEORSD were compiled and sorted chronologically from January 2011 to June 2014 (latest data
available during the evaluation). Note that this period begins after the point at which dental
amalgam traps were required for dental facilities (starting in 2010), meaning that the mercury
removal benefits resultant from this change are captured within the data set. Overall results are
presented in Figure 5.
Note that the average inlet mercury concentration observed over the January 2011 to June 2014
period was ~0.57 mg Hg / kg biosolids, while the maximum was ~0.99 mg Hg / kg biosolids.
Note also that the standard deviation of the data set was calculated as ~0.14 mg Hg / kg
biosolids. This data indicates that Southerly WWTP FBI inlet mercury concentrations are highly
variable and unpredictable, as is typical for municipal wastewater treatment facilities.
387
WEF Residuals and Biosolids Conference 2017
Reprinted with permission from Residuals and Biosolids 2017 Specialty Conference, Copyright © 2017. Water Environment Federation, Alexandria, Virginia.

Figure 5. Inlet Biosolids Mercury Concentrations – January 2011 through June 2014
Utilizing the inlet biosolids mercury concentrations presented in Figure 5, in addition to the
operations data collected by NEORSD during each of the Self-Evaluation Engineering Studies, a
model calibration of predicted incinerator exhaust gas mercury concentrations (mg / dscm
corrected to 7% O2) was performed. This calibration, performed over 23 inlet-biosolids mercury
concentrations taken during the studies, indicated that the existing Southerly WWTC ECI
VenturiPak wet scrubbers are capable of capturing approximately 25% of the total mercury in the
incinerator-exhaust-gas stream.
Assuming 25% total mercury reduction across the existing wet scrubbers, the calibrated model
was then extended to the additional 101 inlet-biosolids mercury concentration data points
provided to the project team by NEORSD. Assuming no additional mercury removal equipment
is provided for Southerly WWTC’s FBIs, exhaust gas mercury concentrations downstream of the
wet scrubbers were predicted for each historical inlet concentration. The results of this analysis
are presented in Figure 6.
0.000
0.200
0.400
0.600
0.800
1.000
1.200
No
v-1
0
Jun
-11
De
c-1
1
Jul-
12
Jan
-13
Au
g-1
3
Ma
r-1
4
Se
p-1
4
Inle
t B
ioso
lid
s M
erc
ury
Co
nte
nt
(mg
Hg
/ k
g s
lud
ge
)
Inlet Biosolids Sampling Date
388
WEF Residuals and Biosolids Conference 2017
Reprinted with permission from Residuals and Biosolids 2017 Specialty Conference, Copyright © 2017. Water Environment Federation, Alexandria, Virginia.
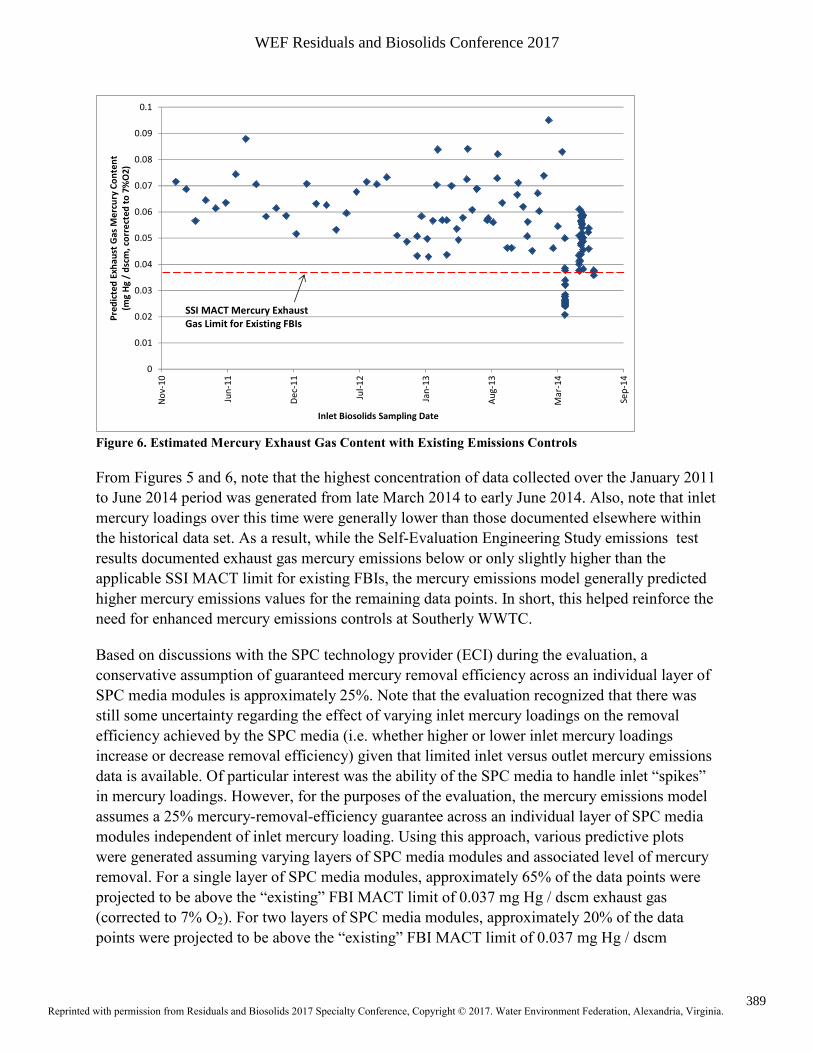
Figure 6. Estimated Mercury Exhaust Gas Content with Existing Emissions Controls
From Figures 5 and 6, note that the highest concentration of data collected over the January 2011
to June 2014 period was generated from late March 2014 to early June 2014. Also, note that inlet
mercury loadings over this time were generally lower than those documented elsewhere within
the historical data set. As a result, while the Self-Evaluation Engineering Study emissions test
results documented exhaust gas mercury emissions below or only slightly higher than the
applicable SSI MACT limit for existing FBIs, the mercury emissions model generally predicted
higher mercury emissions values for the remaining data points. In short, this helped reinforce the
need for enhanced mercury emissions controls at Southerly WWTC.
Based on discussions with the SPC technology provider (ECI) during the evaluation, a
conservative assumption of guaranteed mercury removal efficiency across an individual layer of
SPC media modules is approximately 25%. Note that the evaluation recognized that there was
still some uncertainty regarding the effect of varying inlet mercury loadings on the removal
efficiency achieved by the SPC media (i.e. whether higher or lower inlet mercury loadings
increase or decrease removal efficiency) given that limited inlet versus outlet mercury emissions
data is available. Of particular interest was the ability of the SPC media to handle inlet “spikes”
in mercury loadings. However, for the purposes of the evaluation, the mercury emissions model
assumes a 25% mercury-removal-efficiency guarantee across an individual layer of SPC media
modules independent of inlet mercury loading. Using this approach, various predictive plots
were generated assuming varying layers of SPC media modules and associated level of mercury
removal. For a single layer of SPC media modules, approximately 65% of the data points were
projected to be above the “existing” FBI MACT limit of 0.037 mg Hg / dscm exhaust gas
(corrected to 7% O2). For two layers of SPC media modules, approximately 20% of the data
points were projected to be above the “existing” FBI MACT limit of 0.037 mg Hg / dscm
0
0.01
0.02
0.03
0.04
0.05
0.06
0.07
0.08
0.09
0.1
No
v-1
0
Jun
-11
De
c-1
1
Jul-
12
Jan
-13
Au
g-1
3
Ma
r-1
4
Se
p-1
4
Pre
dic
ted
Exh
au
st G
as
Me
rcu
ry C
on
ten
t
(mg
Hg
/ d
scm
, co
rre
cte
d t
o 7
%O
2)
Inlet Biosolids Sampling Date
SSI MACT Mercury Exhaust
Gas Limit for Existing FBIs
389
WEF Residuals and Biosolids Conference 2017
Reprinted with permission from Residuals and Biosolids 2017 Specialty Conference, Copyright © 2017. Water Environment Federation, Alexandria, Virginia.

exhaust gas (corrected to 7% O2). For three layers of SPC media modules, only two data points
(~1.6%) were projected to be above the “existing” FBI MACT limit of 0.037 mg Hg / dscm
exhaust gas (corrected to 7% O2). Note, however, that a number of other data points were also
close to this limit. Lastly, a plot was generated for four layers of SPC media modules. Under this
scenario, as shown on Figure 7, no data points were projected to be above the existing FBI
MACT limit of 0.037 mg Hg / dscm exhaust gas (corrected to 7% O2).
Figure 7. Estimated Mercury Exhaust Gas Content with Four SPC Media Layers
Considering the results of this evaluation, the project team concluded that the SPC media
technology was a viable option for providing adequate control of mercury emissions in exhaust
gas to meet the SSI MACT standard for existing FBIs at Southerly WWTC, as long as an
appropriate number of layers of SPC media modules are provided and maintained. Note that a
similar conclusion was generated for the FBIs at the Mill Creek WWTP.
Comparison of Mercury Removal Technologies
From the discussion above, two alternative mercury removal technologies (GAC media and SPC
media) were identified as viable for providing the required enhanced mercury emissions controls
to bring the Southerly WWTC FBIs and Mill Creek WWTP FBIs into compliance with the
applicable SSI MACT standard for FBIs classified as “existing.” Table 11 provides a summary
comparison of these two technologies.
0
0.01
0.02
0.03
0.04
0.05
0.06
0.07
0.08
0.09
0.1
No
v-1
0
Jun
-11
De
c-1
1
Jul-
12
Jan
-13
Au
g-1
3
Ma
r-1
4
Se
p-1
4
Pre
dic
ted
Ex
ha
ust
Ga
s M
erc
ury
Co
nte
nt
(mg
Hg
/ d
scm
, co
rre
cte
d t
o 7
%O
2)
Inlet Biosolids Sampling Date
Estimated [Hg] with
Existing Controls
Estimated [Hg] with 4
Layers of SPC Modules
SSI MACT Mercury Exhaust
Gas Limit for Existing FBIs
390
WEF Residuals and Biosolids Conference 2017
Reprinted with permission from Residuals and Biosolids 2017 Specialty Conference, Copyright © 2017. Water Environment Federation, Alexandria, Virginia.
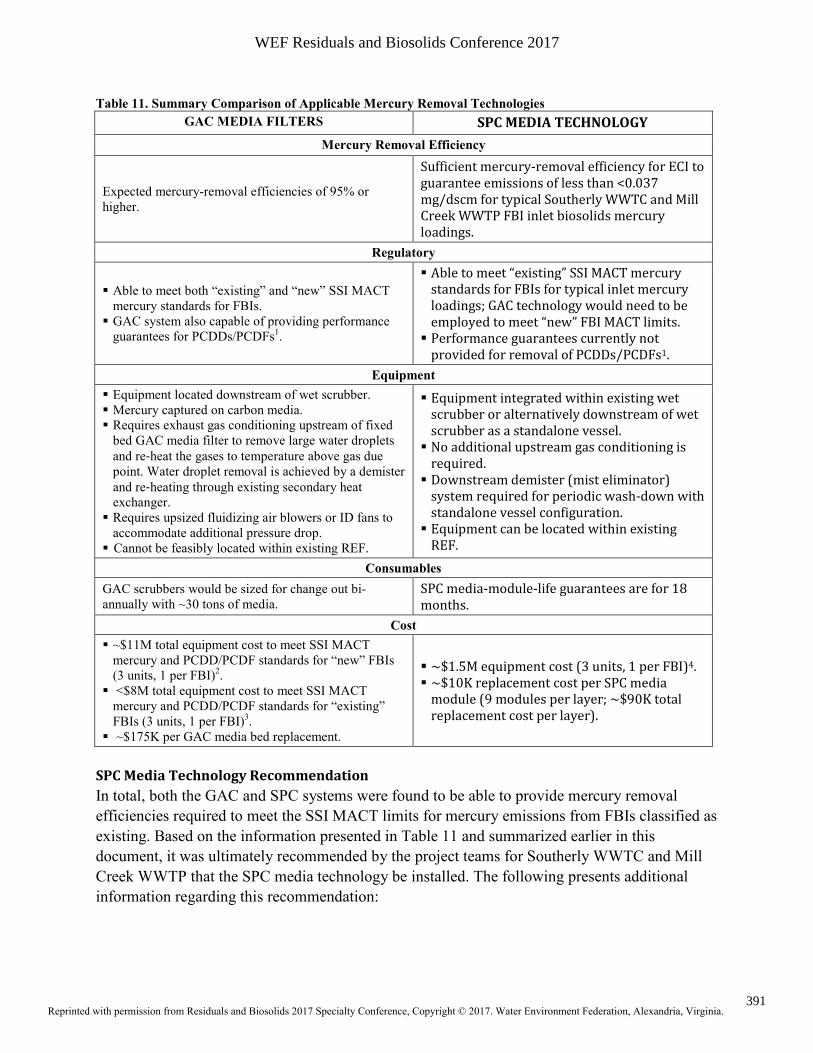
Table 11. Summary Comparison of Applicable Mercury Removal Technologies
GAC MEDIA FILTERS SPC MEDIA TECHNOLOGY
Mercury Removal Efficiency
Expected mercury-removal efficiencies of 95% or higher.
Sufficient mercury-removal efficiency for ECI to guarantee emissions of less than <0.037 mg/dscm for typical Southerly WWTC and Mill Creek WWTP FBI inlet biosolids mercury loadings.
Regulatory
� Able to meet both “existing” and “new” SSI MACTmercury standards for FBIs.
� GAC system also capable of providing performanceguarantees for PCDDs/PCDFs1.
� Able to meet “existing” SSI MACT mercurystandards for FBIs for typical inlet mercuryloadings; GAC technology would need to beemployed to meet “new” FBI MACT limits.
� Performance guarantees currently notprovided for removal of PCDDs/PCDFs1.
Equipment
� Equipment located downstream of wet scrubber.� Mercury captured on carbon media.� Requires exhaust gas conditioning upstream of fixed
bed GAC media filter to remove large water droplets
and re‐heat the gases to temperature above gas duepoint. Water droplet removal is achieved by a demister
and re‐heating through existing secondary heatexchanger.
� Requires upsized fluidizing air blowers or ID fans toaccommodate additional pressure drop.
� Cannot be feasibly located within existing REF.
� Equipment integrated within existing wetscrubber or alternatively downstream of wetscrubber as a standalone vessel.
� No additional upstream gas conditioning isrequired.
� Downstream demister (mist eliminator)system required for periodic wash-down withstandalone vessel configuration.
� Equipment can be located within existingREF.
Consumables
GAC scrubbers would be sized for change out bi-annually with ~30 tons of media.
SPC media-module-life guarantees are for 18 months.
Cost
� ~$11M total equipment cost to meet SSI MACTmercury and PCDD/PCDF standards for “new” FBIs(3 units, 1 per FBI)2.
� <$8M total equipment cost to meet SSI MACTmercury and PCDD/PCDF standards for “existing”FBIs (3 units, 1 per FBI)3.
� ~$175K per GAC media bed replacement.
� ~$1.5M equipment cost (3 units, 1 per FBI)4.� ~$10K replacement cost per SPC media
module (9 modules per layer; ~$90K totalreplacement cost per layer).
SPC Media Technology Recommendation
In total, both the GAC and SPC systems were found to be able to provide mercury removal
efficiencies required to meet the SSI MACT limits for mercury emissions from FBIs classified as
existing. Based on the information presented in Table 11 and summarized earlier in this
document, it was ultimately recommended by the project teams for Southerly WWTC and Mill
Creek WWTP that the SPC media technology be installed. The following presents additional
information regarding this recommendation:
391
WEF Residuals and Biosolids Conference 2017
Reprinted with permission from Residuals and Biosolids 2017 Specialty Conference, Copyright © 2017. Water Environment Federation, Alexandria, Virginia.
• Reduced system complexity. The GAC media technology system requires gas-
conditioning steps, including upstream demister and exhaust gas reheat equipment, in
addition to ancillary equipment, such as GAC media filter start-up heater skids.
Furthermore, installation of new ID fans (in the case of Mill Creek WWTP) or upgrades
to the existing ID fans (in the case of Southerly WWTC) were determined to be required
to address additional pressure losses presented by the new system. In comparison, the
SPC media technology only requires standalone SPC media module containment vessels
located downstream of the existing wet scrubbers. This is due to low-pressure drop across
each layer of SPC media modules (1/8 to 1/3 in. w.c.).
• Reduced space requirements. The SPC media technology can be housed entirely within
the existing building space. Given the notably large footprints of the GAC system media
filters, they cannot be feasibly installed within the existing building and would need to be
housed within a new superstructure addition adjacent to the incinerator buildings for
Southerly WWTC and Mill Creek WWTP.
• Enhanced future mercury-removal efficiency. While the SPC media technology does
not provide mercury removal performance up to that provided by the GAC media
technology (i.e. greater than 95% percent mercury removal, meeting existing and new
SSI MACT requirements), the proposed layout allows for additional layers of SPC media
to be installed to achieve greater mercury removal efficiency in the future. Note that with
ECI’s 2014 pilot at Asheville, NC, a five-layer arrangement of SPC media modules has
resulted in greater than 90% mercury-removal efficiency. Based on these results, ECI
preliminarily offered a 70% performance guarantee for mercury removal across a five-
layer system.
• Cost savings. The SPC media technology appears to be about a quarter of the equipment
cost required for the GAC media technology (not including installation, building
modifications, new superstructure, ductwork, or ancillary equipment and controls).
RESULTS
SPC Media Technology Installation and Testing
Based on the information presented herein, and in considering the recommendation of the project teams, both NEORSD and MSDGC ultimately chose to install the SPC media technology for each of their respective three FBIs at Southerly WWTC and Mill Creek WWTP.
In-line with the findings of SPC technology evaluations conducted by the project teams, NEORSD chose to install a three layer standalone SPC media vessel for each FBI, with space to house an additional two layers of SPC media modules in the future, if required. MSDGC on the other hand chose to install a five-layer standalone SPC media vessel for each FBI, with space to house an additional two layers of modules. Note that MSDGC’s decision to install an initial five layers of modules was based on elevated mercury loadings seen throughout the MSDGC service area, including at other wastewater treatment facilities, which may in the future direct dewatered sludge cake to Mill Creek WWTP for disposal.
Pictures of the final NEORSD and MSDGC SPC vessel installations are provided as Figure 8.
392
WEF Residuals and Biosolids Conference 2017
Reprinted with permission from Residuals and Biosolids 2017 Specialty Conference, Copyright © 2017. Water Environment Federation, Alexandria, Virginia.

Figure 8. Typical SPC Vessel Installation (Southerly WWTC Left, Mill Creek WWTP Right)
Official Emissions Testing Results
Official SSI MACT rule air pollutant emissions compliance testing was conducted by both NEORSD and MSDGC in late 2015 through early 2016. Final results for testing are provided in Table 12 for Southerly WWTC FBIs No. 1, 2, and 3, and in Table 13 for Mill Creek WWTP FBIs No. 1, 2, and 3, respectively. Note that each table presents the results as a representation of compliance achieved for each pollutant per the SSI MACT rule for existing FBIs, indicated as “Percent of Allowable.”
Table 12. Southerly WWTC FBI No. 1, 2, and 3 Official Compliance Testing – Dec 2015 through Feb 2016
Pollutant Units Allowable2,3
PERCENT (%) OF ALLOWABLE
1,3,5
FBI No. 1 FBI No. 2 FBI No. 3
Particulate Matter (PM)
mg/dscm 18 6% 6% 5%
Hydrogen Chloride (HCl)
ppmvd 0.51 <5% <35% <18%
Carbon Monoxide (CO)
ppmvd 64 <2% <4% <2%
PCDD/PCDF,
TEQ4 ng/dscm 0.10 4% 5% 18%
PCDD/PCDF, TMB4
ng/dscm 1.2 7% <1% <1%
Mercury (Hg) mg/dscm 0.037 38% 8% 18%
Oxides of Nitrogen (NOx)
ppmvd 150 53% 68% 40%
Sulfur Dioxide (SO2)
ppmvd 15 <54% <39% <57%
Cadmium (Cd) mg/dscm 0.0016 <11% <16% <19%
Lead (Pb) mg/dscm 0.0074 4% 10% 4%
393
WEF Residuals and Biosolids Conference 2017
Reprinted with permission from Residuals and Biosolids 2017 Specialty Conference, Copyright © 2017. Water Environment Federation, Alexandria, Virginia.

Pollutant Units Allowable2,3
PERCENT (%) OF ALLOWABLE
1,3,5
FBI No. 1 FBI No. 2 FBI No. 3
1 Results based on average of three test runs conducted for respective FBIs 2 SSI MACT rule air pollutant emissions limits for “existing” FBIs 3 All test parameters tested to 7% O2 4 Compliance with PCDD and PCDF limit for TEQ or TMB is required, not both 5 “<” symbol indicates that the compound was not present in quantities above the Minimum Detection Limit (MDL) of the analytical method for at least one sample fraction
Table 13. Mill Creek WWTP FBI No. 1, 2, and 3 Official Compliance Testing – Dec 2015 through Feb 2016
Pollutant Units Allowable2,3
PERCENT (%) OF ALLOWABLE
1,3,5
FBI No. 1 FBI No. 2 FBI No. 3
Particulate Matter (PM)
mg/dscm 18 11% 7% 8%
Hydrogen Chloride (HCl)
ppmvd 0.51 <6% <4% <5%
Carbon Monoxide (CO)
ppmvd 64 4% 11% <1%
PCDD/PCDF,
TEQ4 ng/dscm 0.10 2% 9% 4%
PCDD/PCDF, TMB4
ng/dscm 1.2 2% 20% 7%
Mercury (Hg) mg/dscm 0.037 3% 7% 33%
Oxides of Nitrogen (NOx)
ppmvd 150 24% 27% 12%
Sulfur Dioxide (SO2)
ppmvd 15 <1% 1% <1%
Cadmium (Cd) mg/dscm 0.0016 <4% <5% <9%
Lead (Pb) mg/dscm 0.0074 35% 23% 8% 1 Results based on average of three test runs conducted for respective FBIs 2 SSI MACT rule air pollutant emissions limits for “existing” FBIs 3 All test parameters tested to 7% O2 4 Compliance with PCDD and PCDF limit for TEQ or TMB is required, not both 5 “<” symbol indicates that the compound was not present in quantities above the Minimum Detection Limit (MDL) of the analytical method for at least one sample fraction
Notable in the results presented within Tables 12 and 13 is that one incinerator each for Southerly WWTC and Mill Creek WWTP exhibited reduced mercury capture (i.e. Southerly WWTC FBI No. 1 and Mill Creek WWTP FBI No. 3) when compared to testing results for the other incinerators at each facility, respectively. Additional data collected by MSDGC during official compliance testing offers some explanation as to this variation as discussed following Table 15. In summary, MSDGC opted to perform additional testing for the concentration of mercury and sulfur dioxide within gasses inlet to each SPC vessel. The primary purpose for this testing was to ensure performance guarantees provided by the SPC technology provider were
394
WEF Residuals and Biosolids Conference 2017
Reprinted with permission from Residuals and Biosolids 2017 Specialty Conference, Copyright © 2017. Water Environment Federation, Alexandria, Virginia.

met (i.e. evaluate air pollutant removal efficiencies across the SPC vessels). Sulfur dioxide was tested in addition to mercury given that pilot information provided by ECI indicated some level of sulfur dioxide removal across the SPC media modules.
Comparison of inlet versus outlet mercury and sulfur dioxide exhaust gas concentrations are provided in Table 14 for each of the Mill Creek WWTP FBIs.
Table 14. Mill Creek WWTP FBI SPC Vessel Performance Evaluation
Pollutant Units
FBI No. 11,2,3
FBI No. 21,2,3
FBI No. 31,2,3
Inlet Outlet
Percent
(%)
Removal
Inlet Outlet
Percent
(%)
Removal
Inlet Outlet
Percent
(%)
Removal
Mercury (Hg) mg/dscm 0.0340 0.0009 97.4 0.0499 0.0027 94.6 0.0312 0.012 61.5
Sulfur Dioxide (SO2)
ppmvd <0.91 <0.2 78.0 1.32 0.104 92.1 1.91 <0.1 >94.9
1 Results based on average of three test runs conducted for respective FBIs 2 All test parameters tested to 7% O2 3 “<” symbol indicates that the compound was not present in quantities above the Minimum Detection Limit (MDL) of the analytical method for at least one sample fraction
As shown in Table 14, inlet mercury levels to the SPC vessels for each Mill Creek WWTP FBI were consistent, ranging from 0.0312 to 0.0499 mg/dscm (corrected to 7% O2). However, while resultant mercury removal efficiencies across the SPC vessels for FBI No. 1 and No. 2 were also consistent, the mercury removal percentage across the SPC vessel for FBI No. 3 was much lower. This can at least in part be attributed to a “break in” period required by the SPC technology manufacturer for the SPC media. In summary, the manufacturer states that a month (or so) is required for the SPC media to settle in on a long-term removal efficiency. As a result, test results for Mill Creek WWTP FBIs No. 1 and No. 2, which were collected for systems that had been in operation for less than two weeks, demonstrate higher mercury-removal efficiencies within the SPC media “break in” period. On the other hand, test results for Mill Creek WWTP FBI No. 3, which were collected after the system had been online for over a month, demonstrate lower mercury-removal efficiencies after the “break in” period. Figure 9, provided by ECI, provides pilot data that indicate anticipated long-term mercury removal across the SPC media. Note that towards the beginning of the SPC media life cycle, removal efficiencies hover around 95%, while after the “break in” period, efficiencies drop to a somewhat consistent ~80% level.
395
WEF Residuals and Biosolids Conference 2017
Reprinted with permission from Residuals and Biosolids 2017 Specialty Conference, Copyright © 2017. Water Environment Federation, Alexandria, Virginia.
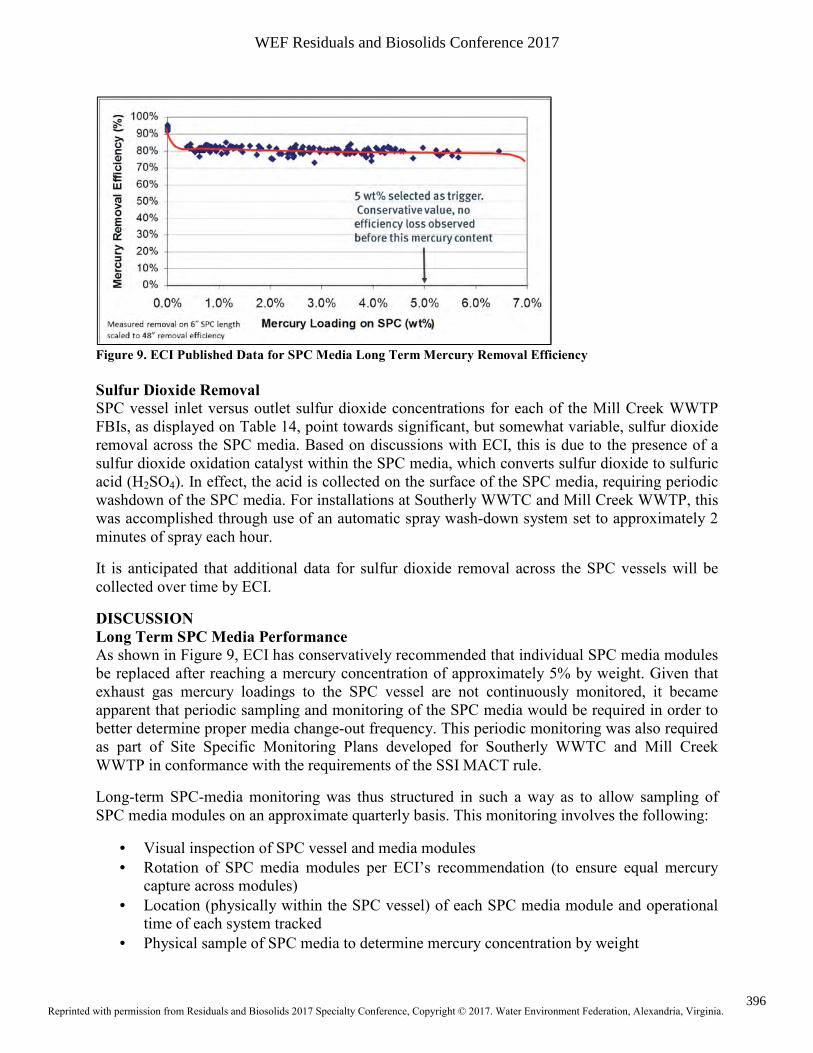
Figure 9. ECI Published Data for SPC Media Long Term Mercury Removal Efficiency
Sulfur Dioxide Removal
SPC vessel inlet versus outlet sulfur dioxide concentrations for each of the Mill Creek WWTP FBIs, as displayed on Table 14, point towards significant, but somewhat variable, sulfur dioxide removal across the SPC media. Based on discussions with ECI, this is due to the presence of a sulfur dioxide oxidation catalyst within the SPC media, which converts sulfur dioxide to sulfuric acid (H2SO4). In effect, the acid is collected on the surface of the SPC media, requiring periodic washdown of the SPC media. For installations at Southerly WWTC and Mill Creek WWTP, this was accomplished through use of an automatic spray wash-down system set to approximately 2 minutes of spray each hour.
It is anticipated that additional data for sulfur dioxide removal across the SPC vessels will be collected over time by ECI.
DISCUSSION
Long Term SPC Media Performance
As shown in Figure 9, ECI has conservatively recommended that individual SPC media modules be replaced after reaching a mercury concentration of approximately 5% by weight. Given that exhaust gas mercury loadings to the SPC vessel are not continuously monitored, it became apparent that periodic sampling and monitoring of the SPC media would be required in order to better determine proper media change-out frequency. This periodic monitoring was also required as part of Site Specific Monitoring Plans developed for Southerly WWTC and Mill Creek WWTP in conformance with the requirements of the SSI MACT rule.
Long-term SPC-media monitoring was thus structured in such a way as to allow sampling of SPC media modules on an approximate quarterly basis. This monitoring involves the following:
• Visual inspection of SPC vessel and media modules
• Rotation of SPC media modules per ECI’s recommendation (to ensure equal mercurycapture across modules)
• Location (physically within the SPC vessel) of each SPC media module and operationaltime of each system tracked
• Physical sample of SPC media to determine mercury concentration by weight
396
WEF Residuals and Biosolids Conference 2017
Reprinted with permission from Residuals and Biosolids 2017 Specialty Conference, Copyright © 2017. Water Environment Federation, Alexandria, Virginia.

• Gas phase carbon trap (EPA Method 30B) samples taken to determine mercury removalacross SPC media modules
Results of the most recent sampling/testing for Southerly WWTC and Mill Creek WWTP are provided in the following sections.
NEORSD Southerly WWTC
Table 15 provides pertinent information as to the operation of each Southerly WWTC FBI and respective SPC vessel since commissioning in 2015.
Table 15. Southerly WWTC SPC Vessel Operational Information
FBI No. 1 FBI No. 2 FBI No. 3
SPC Vessel Installation Date 12/03/15 11/16/15 12/31/15
Startup Date 12/20/15 11/20/15 1/7/16
Dry Tons of Sludge Fired 14,901.3 7,868.4 8,497.5
Hour of Operation 5,293.6 3,000.5 2,819.9
Average Feed Rate (ton/hour) 2.81 2.62 3.01
As shown on Table 15, FBI No. 1 has been in operation for the longest of the three Southerly WWTC FBIs since commissioning of the SPC vessels in early 2016. As a result, it would be anticipated that the SPC media contained within this incinerator’s SPC vessel would exhibit the highest levels of mercury concentration by weight. This is correlated via the information presented in Table 16 below.
Summary results for ECI’s inspection and sampling of the Southerly WWTC SPC vessels, which occurred October 18-19, 2016, are provided below. Physical media sampling was not conducted for the SPC vessel for FBI No. 2 due to that incinerator being in-service during the inspection period.
Each of the Southerly WWTC SPC vessels was initially installed with three layers of SPC media modules. The first layer (“Layer 1”) within each SPC media module is the layer through which inlet gasses pass first, and is located at the bottom of each SPC vessel. Table 16 indicates the remaining mercury adsorption capacity of each layer of SPC media modules, as determined by ECI during the October 18-19, 2016 sampling.
Each module was assumed capable of adsorbing up to 1.5 pounds prior (5% by weight) before requiring replacement. Through physical sampling of the SPC media and performance of testing to determine mercury content, remaining mercury adsorption capacity was determined.
Table 16. Southerly WWTC SPC Vessel Remaining SPC Media Mercury Adsorption Capacity
FBI No. 1 FBI No. 2 FBI No. 3
Layer 1 Remaining Capacity 90% Not Tested 92%
Layer 2 Remaining Capacity 93% Not Tested 95%
Layer 3 Remaining Capacity 95% Not Tested 95%
Based on the findings presented in Table 16, which represent ~10 months of operation for each of the Southerly WWTC SPC vessels, ECI has indicated that the SPC media modules appear to be operating as expected in terms of mercury capture. ECI has indicated that an estimate of
397
WEF Residuals and Biosolids Conference 2017
Reprinted with permission from Residuals and Biosolids 2017 Specialty Conference, Copyright © 2017. Water Environment Federation, Alexandria, Virginia.
remaining life of the SPC media modules will be made following the next quarterly sampling/testing event.
Unfortunately, during the October 18-19, 2016 sampling by ECI, it was discovered by ECI that EPA Method 30B (carbon trap sampling) to determine mercury removal across each layer of SPC media modules will not be effective for the SPC vessels at Southerly WWTC. This is due to a high negative pressure across the SPC vessels, which are installed immediately upstream of induced draft (ID) fans in the incinerator process train. As a result, the carbon contained within the standard Method 30B sample tubes was disrupted in most of the traps, and in some cases, the carbon was completed evacuated from the tube into the SPC vessel. For this reason, no data is currently available for mercury removal across each layer of SPC media modules for the October sampling event. ECI has indicated that modifications to the sampling methodology will be made, and sampling performed in coordination with NEORSD in the near term. Data will be appended to this document as it becomes available.
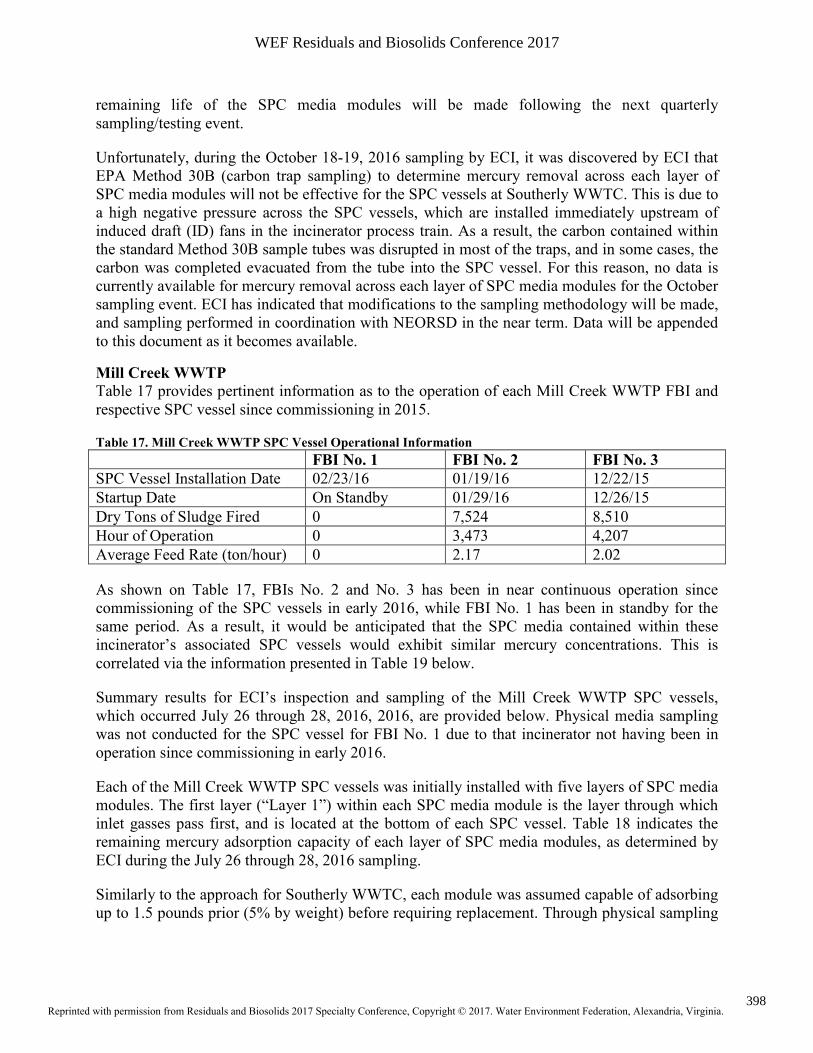
Mill Creek WWTP
Table 17 provides pertinent information as to the operation of each Mill Creek WWTP FBI and respective SPC vessel since commissioning in 2015.
Table 17. Mill Creek WWTP SPC Vessel Operational Information
FBI No. 1 FBI No. 2 FBI No. 3
SPC Vessel Installation Date 02/23/16 01/19/16 12/22/15
Startup Date On Standby 01/29/16 12/26/15
Dry Tons of Sludge Fired 0 7,524 8,510
Hour of Operation 0 3,473 4,207
Average Feed Rate (ton/hour) 0 2.17 2.02
As shown on Table 17, FBIs No. 2 and No. 3 has been in near continuous operation since commissioning of the SPC vessels in early 2016, while FBI No. 1 has been in standby for the same period. As a result, it would be anticipated that the SPC media contained within these incinerator’s associated SPC vessels would exhibit similar mercury concentrations. This is correlated via the information presented in Table 19 below.
Summary results for ECI’s inspection and sampling of the Mill Creek WWTP SPC vessels, which occurred July 26 through 28, 2016, 2016, are provided below. Physical media sampling was not conducted for the SPC vessel for FBI No. 1 due to that incinerator not having been in operation since commissioning in early 2016.
Each of the Mill Creek WWTP SPC vessels was initially installed with five layers of SPC media modules. The first layer (“Layer 1”) within each SPC media module is the layer through which inlet gasses pass first, and is located at the bottom of each SPC vessel. Table 18 indicates the remaining mercury adsorption capacity of each layer of SPC media modules, as determined by ECI during the July 26 through 28, 2016 sampling.
Similarly to the approach for Southerly WWTC, each module was assumed capable of adsorbing up to 1.5 pounds prior (5% by weight) before requiring replacement. Through physical sampling
398
WEF Residuals and Biosolids Conference 2017
Reprinted with permission from Residuals and Biosolids 2017 Specialty Conference, Copyright © 2017. Water Environment Federation, Alexandria, Virginia.
of the SPC media and performance of testing to determine mercury content, remaining mercury adsorption capacity was determined.
Table 18. Mill Creek WWTP SPC Vessel Remaining SPC Media Mercury Adsorption Capacity
FBI No. 1 FBI No. 2 FBI No. 3
Layer 1 Remaining Capacity 100% 96% 99%
Layer 2 Remaining Capacity 100% 98% 98%
Layer 3 Remaining Capacity 100% 98% 99%
Layer 4 Remaining Capacity 100% 99% 99%
Layer 5 Remaining Capacity 100% 99% 99%
Based on the findings presented in Table 18, which represent ~6-7 months of operation for the SPC vessels for Mill Creek WWTP FBIs No. 2 and No. 3, ECI has indicated that the SPC media modules appear to be operating as expected in terms of mercury capture. ECI has indicated that an estimate as to the remaining life of the SPC media modules will be made following the next quarterly sampling/testing event.
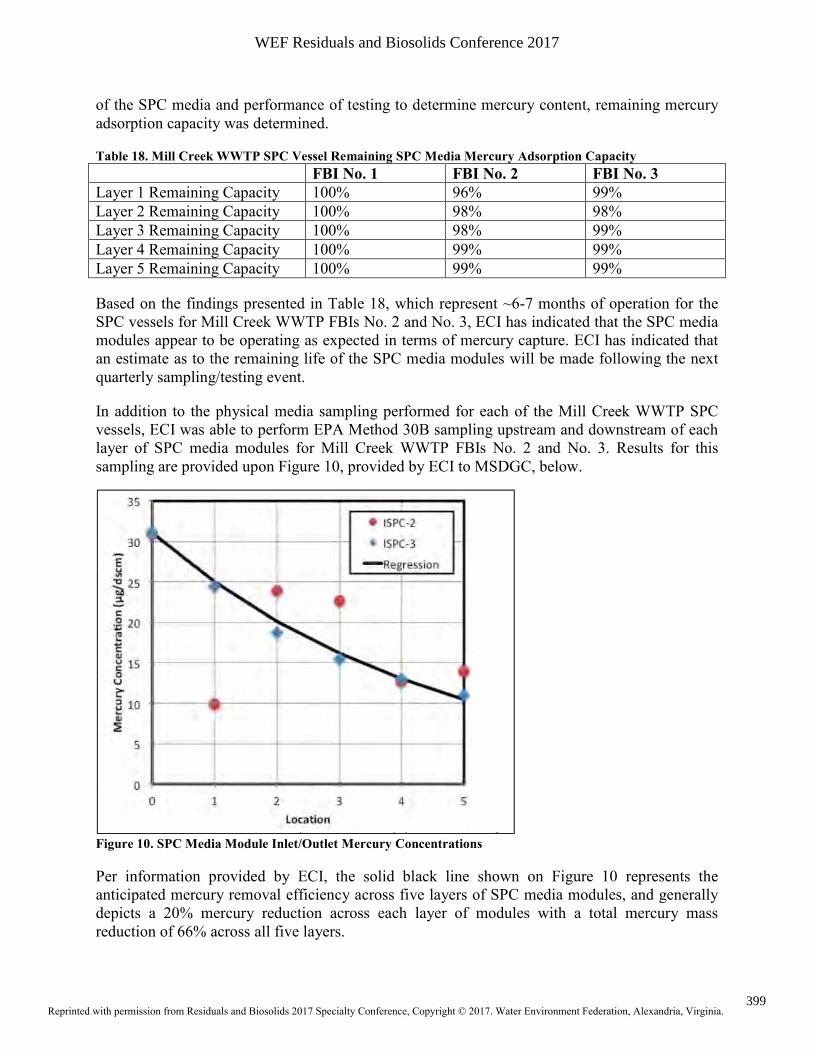
In addition to the physical media sampling performed for each of the Mill Creek WWTP SPC vessels, ECI was able to perform EPA Method 30B sampling upstream and downstream of each layer of SPC media modules for Mill Creek WWTP FBIs No. 2 and No. 3. Results for this sampling are provided upon Figure 10, provided by ECI to MSDGC, below.
Figure 10. SPC Media Module Inlet/Outlet Mercury Concentrations
Per information provided by ECI, the solid black line shown on Figure 10 represents the anticipated mercury removal efficiency across five layers of SPC media modules, and generally depicts a 20% mercury reduction across each layer of modules with a total mercury mass reduction of 66% across all five layers.
399
WEF Residuals and Biosolids Conference 2017
Reprinted with permission from Residuals and Biosolids 2017 Specialty Conference, Copyright © 2017. Water Environment Federation, Alexandria, Virginia.
From Figure 10, it is clear that the EPA Method 30B sampling for FBI No. 3’s SPC vessel revealed mercury reduction across each layer of SPC media modules along the expected trend, with a total mercury reduction observed at approximately 65%. In reviewing data from official emissions compliance tests presented previously herein, note that Mill Creek FBI No. 3 previously tested at approximately 61% mercury removal across the SPC vessel. The findings of the subsequent EPA Method 30B sampling appear to confirm that, following the break-in period for the SPC media, approximately 60-70% mercury removal can be expected across five layers of SPC media modules.
While sampling for SPC vessel for FBI No. 3 aligned well with anticipated results, data for FBI No. 2’s SPC vessel did not appear to correlate very well at all. Based on discussions with ECI, it is unclear why this is. Another iteration of EPA Method 30B is planned in the short term to further evaluate this. Data will be appended to this document as it becomes available.
CONCLUSION
The new SPC vessels at the Southerly WWTC and Mill Creek WWTP have now been in operation for about a year. The information presented herein has demonstrated that the decision by NEORSD and MSDGC to install this technology has, to-date, been a good one in terms of achieving compliance with the SSI MACT rule requirements. In addition, in comparison to the GAC technology, it is anticipated that the chosen approach resulted in at least $15M - $20M in capital savings for both NEORSD and MSDGC.
Since completion of the SPC vessel installations at Southerly WWTC and Mill Creek WWTP, several other facilities have installed the technology. Installations include facilities in New York, North Carolina, Virginia, and Washington State. In addition, a number of other utilities are currently in evaluation stages to determine the applicability of the technology for their MHI or FBI systems.
Long-term monitoring of the SPC technology’s performance will be critical in determining the long-term effectiveness, longevity of SPC media modules and associated change out frequency, and any unforeseen operational issues that could arise over time. For now, all information appears to point toward a technology that is capable of providing the required SSI exhaust-gas mercury-removal efficiencies required to comply with the SSI MACT rule for FBIs classified as “existing” and MHIs classified as “existing” or “new.”
REFERENCES
"New Mercury and SO2 Control Technology by EnviroCare and W.L. Gore." Envirocare International | Engineered Solutions for Pollution Control. EnviroCare International, n.d. Web. 12 Jan. 2017.
400
WEF Residuals and Biosolids Conference 2017
Reprinted with permission from Residuals and Biosolids 2017 Specialty Conference, Copyright © 2017. Water Environment Federation, Alexandria, Virginia.