innovative technology verification report xrf - clu-in
TRANSCRIPT
United States Office of Research and EPA/540/R-06/003 Environmental Protection Development February 2006 Agency Washington, DC 20460
Innovative Technology Verification Report
XRF Technologies for Measuring Trace Elements in Soil and Sediment
Niton XLi 700 Series
XRF Analyzer
EPA/540/R-06/003 February 2006
Innovative Technology
Verification Report
Niton XLi 700 Series XRF Analyzer
Prepared by
Tetra Tech EM Inc.
Cincinnati, Ohio 45202-1072
Contract No. 68-C-00-181 Task Order No. 42
Dr. Stephen Billets Characterization and Monitoring Branch
Environmental Sciences Division Las Vegas, Nevada 89193-3478
National Exposure Research Laboratory Office of Research and Development
U.S. Environmental Protection Agency

_____________________________________________________________________________
ii
Notice This document was prepared for the U.S. Environmental Protection Agency (EPA) Superfund Innovative Technology Evaluation Program under Contract No. 68-C-00-181. The document has been subjected to the Agency’s peer and administrative review and has been approved for publication as an EPA document. Mention of corporation names, trade names, or commercial products does not constitute endorsement or recommendation for use.

_____________________________________________________________________________
iii
Foreword The U.S. Environmental Protection Agency (EPA) is charged by Congress with protecting the nation’s natural resources. Under the mandate of national environmental laws, the Agency strives to formulate and implement actions leading to a compatible balance between human activities and the ability of natural systems to support and nurture life. To meet this mandate, EPA’s Office of Research and Development (ORD) provides data and scientific support that can be used to solve environmental problems, build the scientific knowledge base needed to manage ecological resources wisely, understand how pollutants affect public health, and prevent or reduce environmental risks. The National Exposure Research Laboratory is the Agency’s center for investigation of technical and management approaches for identifying and quantifying risks to human health and the environment. Goals of the laboratory’s research program are to (1) develop and evaluate methods and technologies for characterizing and monitoring air, soil, and water; (2) support regulatory and policy decisions; and (3) provide the scientific support needed to ensure effective implementation of environmental regulations and strategies. EPA’s Superfund Innovative Technology Evaluation (SITE) Program evaluates technologies designed for characterization and remediation of contaminated Superfund and Resource Conservation and Recovery Act (RCRA) sites. The SITE Program was created to provide reliable cost and performance data to speed acceptance and use of innovative remediation, characterization, and monitoring technologies by the regulatory and user community. Effective monitoring and measurement technologies are needed to assess the degree of contamination at a site, provide data that can be used to determine the risk to public health or the environment, and monitor the success or failure of a remediation process. One component of the EPA SITE Program, the Monitoring and Measurement Technology (MMT) Program, demonstrates and evaluates innovative technologies to meet these needs. Candidate technologies can originate within the federal government or the private sector. Through the SITE Program, developers are given an opportunity to conduct a rigorous demonstration of their technologies under actual field conditions. By completing the demonstration and distributing the results, the Agency establishes a baseline for acceptance and use of these technologies. The MMT Program is managed by ORD’s Environmental Sciences Division in Las Vegas, Nevada. Gary Foley, Ph.D. Director National Exposure Research Laboratory Office of Research and Development

______________________________________________________________________________
iv
Abstract
The Niton XLi 700 Series (XLi) XRF Services x-ray fluorescence (XRF) analyzer was demonstrated under the U.S. Environmental Protection Agency (EPA) Superfund Innovative Technology Evaluation (SITE) Program. The field portion of the demonstration was conducted in January 2005 at the Kennedy Athletic, Recreational and Social Park (KARS) at Kennedy Space Center on Merritt Island, Florida. The demonstration was designed to collect reliable performance and cost data for the XLi analyzer and seven other commercially available XRF instruments for measuring trace elements in soil and sediment. The performance and cost data were evaluated to document the relative performance of each XRF instrument. This innovative technology verification report describes the objectives and the results of that evaluation and serves to verify the performance and cost of the XLi analyzer. Separate reports have been prepared for the other XRF instruments that were evaluated as part of the demonstration. The objectives of the evaluation included determining each XRF instrument’s accuracy, precision, sample throughput, and tendency for matrix effects. To fulfill these objectives, the field demonstration incorporated the analysis of 326 prepared samples of soil and sediment that contained 13 target elements. The prepared samples included blends of environmental samples from nine different sample collection sites as well as spiked samples with certified element concentrations. Accuracy was assessed by comparing the XRF instrument’s results with data generated by a fixed laboratory (the reference laboratory). The reference laboratory performed element analysis using acid digestion and inductively coupled plasma – atomic emission spectrometry (ICP-AES), in accordance with EPA Method 3050B/6010B, and using cold vapor atomic absorption (CVAA) spectroscopy for mercury only, in accordance with EPA Method 7471A. The Niton XLi portable analyzer features a choice of either a full suite of traditional isotope (the XLi) or a miniaturized x-ray tube (the XLt which was evaluated in a separate report) for rapid chemical characterization of soils, sediment, and other thick homogeneous samples. The pre-set factory calibration allows simultaneous analysis of up to 25 elements, including all eight Resource Conservation and Recovery Act (RCRA) metals, in bulk materials with no requirement for site-specific calibrations or standards. Whether testing is performed in situ (directly onto the ground) or ex situ (bagged or prepared samples), sophisticated software automatically compensates for matrix variations from sample to sample, allowing the operator to simply “point and shoot” any bulk sample without unnecessary data entry or additional calibrations capability is also available. Niton’s XLi 700 Series analyzers are easy to operate, light weight, ergonomic, and are an advanced isotope-based environmental XRF instrument. Niton offers various isotope options to best optimize performance for the environmental application.
This report describes the results of the evaluation of the XLi analyzer based on the data obtained during the demonstration. The method detection limits, accuracy, and precision of the instrument for each of the 13 target analytes are presented and discussed. The cost of element analysis using the XLi analyzer is compiled and compared to both fixed laboratory costs and average XRF instrument costs.
______________________________________________________________________________
v
Contents Chapter Page Notice............................................................................................................................................................ ii Foreword...................................................................................................................................................... iii Abstract ........................................................................................................................................................ iv Acronyms, Abbreviations, and Symbols....................................................................................................... x Acknowledgements.................................................................................................................................... xiv 1.0 INTRODUCTION ...........................................................................................................................1
1.1 Organization of this Report.................................................................................................1 1.2 Description of the SITE Program .......................................................................................2 1.3 Scope of the Demonstration................................................................................................2 1.4 General Description of XRF Technology ...........................................................................3 1.5 Properties of the Target Elements.......................................................................................4
1.5.1 Antimony ...............................................................................................................5 1.5.2 Arsenic ..................................................................................................................5 1.5.3 Cadmium................................................................................................................5 1.5.4 Chromium ..............................................................................................................5 1.5.5 Copper....................................................................................................................5 1.5.6 Iron.........................................................................................................................6 1.5.7 Lead .......................................................................................................................6 1.5.8 Mercury..................................................................................................................6 1.5.9 Nickel.....................................................................................................................6 1.5.10 Selenium ................................................................................................................6 1.5.11 Silver......................................................................................................................7 1.5.12 Vanadium...............................................................................................................7 1.5.13 Zinc ........................................................................................................................7
2.0 FIELD SAMPLE COLLECTION LOCATIONS............................................................................9 2.1 Alton Steel Mill Site ...........................................................................................................9 2.2 Burlington Northern-ASARCO Smelter Site...................................................................11 2.3 Kennedy Athletic, Recreational and Social Park Site......................................................11 2.4 Leviathan Mine Site.........................................................................................................12 2.5 Navy Surface Warfare Center, Crane Division Site ........................................................12 2.6 Ramsay Flats–Silver Bow Creek Site ..............................................................................13 2.7 Sulphur Bank Mercury Mine Site ....................................................................................13 2.8 Torch Lake Superfund Site ..............................................................................................14 2.9 Wickes Smelter Site.........................................................................................................14 3.0 FIELD DEMONSTRATION........................................................................................................15
3.1 Bulk Sample Processing ..................................................................................................15 3.1.1 Bulk Sample Collection and Shipping................................................................15 3.1.2 Bulk Sample Preparation and Homogenization ..................................................15 3.2 Demonstration Samples ...................................................................................................17 3.2.1 Environmental Samples ......................................................................................17 3.2.2 Spiked Samples...................................................................................................17 3.2.3 Demonstration Sample Set..................................................................................17

______________________________________________________________________________
vi
Contents (Continued) Chapter Page 3.3 Demonstration Site and Logistics ....................................................................................20 3.3.1 Demonstration Site Selection..............................................................................20 3.3.2 Demonstration Site Logistics..............................................................................20 3.3.3 EPA Demonstration Team and Developer Field Team Responsibilities ............21 3.3.4 Sample Management During the Field Demonstration.......................................21 3.3.5 Data Management ...............................................................................................22 4.0 EVALUATION DESIGN.............................................................................................................23 4.1 Evaluation Objectives ......................................................................................................23 4.2 Experimental Design........................................................................................................23 4.2.1 Primary Objective 1 – Method Detection Limits................................................24 4.2.2 Primary Objective 2 – Accuracy.........................................................................25 4.2.3 Primary Objective 3 – Precision .........................................................................26 4.2.4 Primary Objective 4 – Impact of Chemical and Spectral Interferences..............27 4.2.5 Primary Objective 5 – Effects of Soil Characteristics ........................................28 4.2.6 Primary Objective 6 – Sample Throughput ........................................................28 4.2.7 Primary Objective 7 – Technology Costs ...........................................................28 4.2.8 Secondary Objective 1 – Training Requirements ...............................................28 4.2.9 Secondary Objective 2 – Health and Safety .......................................................29 4.2.10 Secondary Objective 3 – Portability ...................................................................29 4.2.11 Secondary Objective 4 – Durability....................................................................29 4.2.12 Secondary Objective 5 – Availability .................................................................29 4.3 Deviations from the Demonstration Plan.........................................................................29 5.0 REFERENCE LABORATORY ...................................................................................................31 5.1 Selection of Reference Methods ......................................................................................31 5.2 Selection of Reference Laboratory ..................................................................................32 5.3 QA/QC Results for Reference Laboratory.......................................................................33 5.3.1 Reference Laboratory Data Validation ...............................................................33 5.3.2 Reference Laboratory Technical Systems Audit ................................................34 5.3.3 Other Reference Laboratory Data Evaluations ...................................................34 5.4 Summary of Data Quality and Usability..........................................................................36 6.0 TECHNOLOGY DESCRIPTION ................................................................................................39 6.1 General Description .........................................................................................................39 6.2 Instrument Operations during the Demonstration............................................................40 6.2.1 Setup and Calibration..........................................................................................40 6.2.2 Demonstration Sample Processing .....................................................................42 6.3 General Demonstration Results .......................................................................................43 6.4 Contact Information.........................................................................................................43
______________________________________________________________________________
vii
Contents (Continued)
Chapter Page 7.0 PERFORMANCE EVALUATION ..............................................................................................45 7.1 Primary Objective 1 – Method Detection Limits.............................................................45 7.2 Primary Objective 2 – Accuracy and Comparability .......................................................49 7.3 Primary Objective 3 – Precision ......................................................................................55 7.4 Primary Objective 4 – Impact of Chemical and Spectral Interferences...........................55 7.5 Primary Objective 5 – Effects of Soil Characteristics .....................................................55 7.6 Primary Objective 6 – Sample Throughput .....................................................................61 7.7 Primary Objective 7 – Technology Cost..........................................................................61 7.8 Secondary Objective 1 – Training Requirements ............................................................61 7.9 Secondary Objective 2 – Health and Safety.....................................................................62 7.10 Secondary Objective 3 – Portability ................................................................................63 7.11 Secondary Objective 4 – Durability.................................................................................63 7.12 Secondary Objective 5 – Availability ..............................................................................63 8.0 ECONOMIC ANALYSIS ............................................................................................................65 8.1 Equipment Costs ..............................................................................................................65 8.2 Supply Costs ....................................................................................................................65 8.3 Labor Costs ......................................................................................................................66 8.4 Comparison of XRF Analysis and Reference Laboratory Costs .....................................67 9.0 SUMMARY OF TECHNOLOGY PERFORMANCE .................................................................69 10.0 REFERENCES ............................................................................................................................75 APPENDICES Appendix A: Verification Statement Appendix B: Developer Discussion Appendix C: Data Validation Summary Report Appendix D: Developer and Reference Laboratory Data Appendix E: Statistical Data Summaries
______________________________________________________________________________
viii
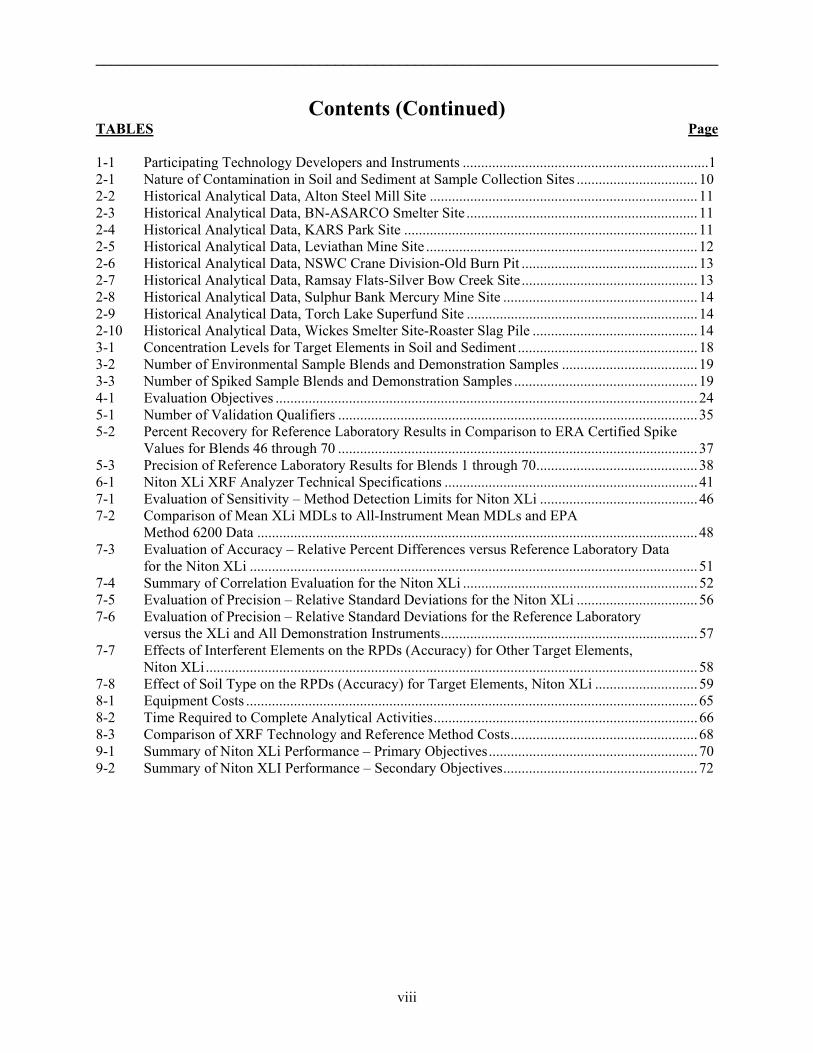
Contents (Continued) TABLES Page 1-1 Participating Technology Developers and Instruments ...................................................................1 2-1 Nature of Contamination in Soil and Sediment at Sample Collection Sites .................................10 2-2 Historical Analytical Data, Alton Steel Mill Site .........................................................................11 2-3 Historical Analytical Data, BN-ASARCO Smelter Site ...............................................................11 2-4 Historical Analytical Data, KARS Park Site ................................................................................11 2-5 Historical Analytical Data, Leviathan Mine Site ..........................................................................12 2-6 Historical Analytical Data, NSWC Crane Division-Old Burn Pit ................................................13 2-7 Historical Analytical Data, Ramsay Flats-Silver Bow Creek Site ................................................13 2-8 Historical Analytical Data, Sulphur Bank Mercury Mine Site .....................................................14 2-9 Historical Analytical Data, Torch Lake Superfund Site ...............................................................14 2-10 Historical Analytical Data, Wickes Smelter Site-Roaster Slag Pile .............................................14 3-1 Concentration Levels for Target Elements in Soil and Sediment .................................................18 3-2 Number of Environmental Sample Blends and Demonstration Samples .....................................19 3-3 Number of Spiked Sample Blends and Demonstration Samples ..................................................19 4-1 Evaluation Objectives ...................................................................................................................24 5-1 Number of Validation Qualifiers ..................................................................................................35 5-2 Percent Recovery for Reference Laboratory Results in Comparison to ERA Certified Spike Values for Blends 46 through 70 ..................................................................................................37 5-3 Precision of Reference Laboratory Results for Blends 1 through 70............................................38 6-1 Niton XLi XRF Analyzer Technical Specifications .....................................................................41 7-1 Evaluation of Sensitivity – Method Detection Limits for Niton XLi ...........................................46 7-2 Comparison of Mean XLi MDLs to All-Instrument Mean MDLs and EPA Method 6200 Data ........................................................................................................................48 7-3 Evaluation of Accuracy – Relative Percent Differences versus Reference Laboratory Data for the Niton XLi ..........................................................................................................................51 7-4 Summary of Correlation Evaluation for the Niton XLi ................................................................52 7-5 Evaluation of Precision – Relative Standard Deviations for the Niton XLi .................................56 7-6 Evaluation of Precision – Relative Standard Deviations for the Reference Laboratory versus the XLi and All Demonstration Instruments......................................................................57 7-7 Effects of Interferent Elements on the RPDs (Accuracy) for Other Target Elements, Niton XLi......................................................................................................................................58 7-8 Effect of Soil Type on the RPDs (Accuracy) for Target Elements, Niton XLi ............................59 8-1 Equipment Costs ...........................................................................................................................65 8-2 Time Required to Complete Analytical Activities........................................................................66 8-3 Comparison of XRF Technology and Reference Method Costs...................................................68 9-1 Summary of Niton XLi Performance – Primary Objectives.........................................................70 9-2 Summary of Niton XLI Performance – Secondary Objectives.....................................................72

______________________________________________________________________________
ix
Contents (Continued) FIGURES Page 1-1 The XRF Process .............................................................................................................................4 3-1 Bulk Sample Processing Diagram ................................................................................................16 3-2 KARS Park Recreation Building ..................................................................................................20 3-3 Work Areas for the XRF Instruments in the Recreation Building................................................21 3-4 Visitors Day Presentation .............................................................................................................21 3-5 Sample Storage Room...................................................................................................................22 6-1 Niton XLi 700 Series Analyzer Set Up for Ex-Situ Analysis.......................................................40 6-2 Niton Technician Using a Stainless Steel Scoop to Fill a Sample Cup ........................................42 6-3 Instrument Setup with Samples Awaiting Analysis......................................................................43 7-1 Linear Correlation Plot for Niton XLi Showing High Correlation for Selenium .........................50 7-2 Linear Correlation Plot for Niton XLi Showing Low Correlation and Variable Bias For Vanadium ...............................................................................................................................53 8-1 Comparison of Labor Requirements for the XLi versus Other XRF Instruments ........................67 9-1 Method Detection Limits (sensitivity), Accuracy, and Precision of the Niton XLi in Comparison to the Average of All Eight XRF Instruments......................................................73
______________________________________________________________________________
x
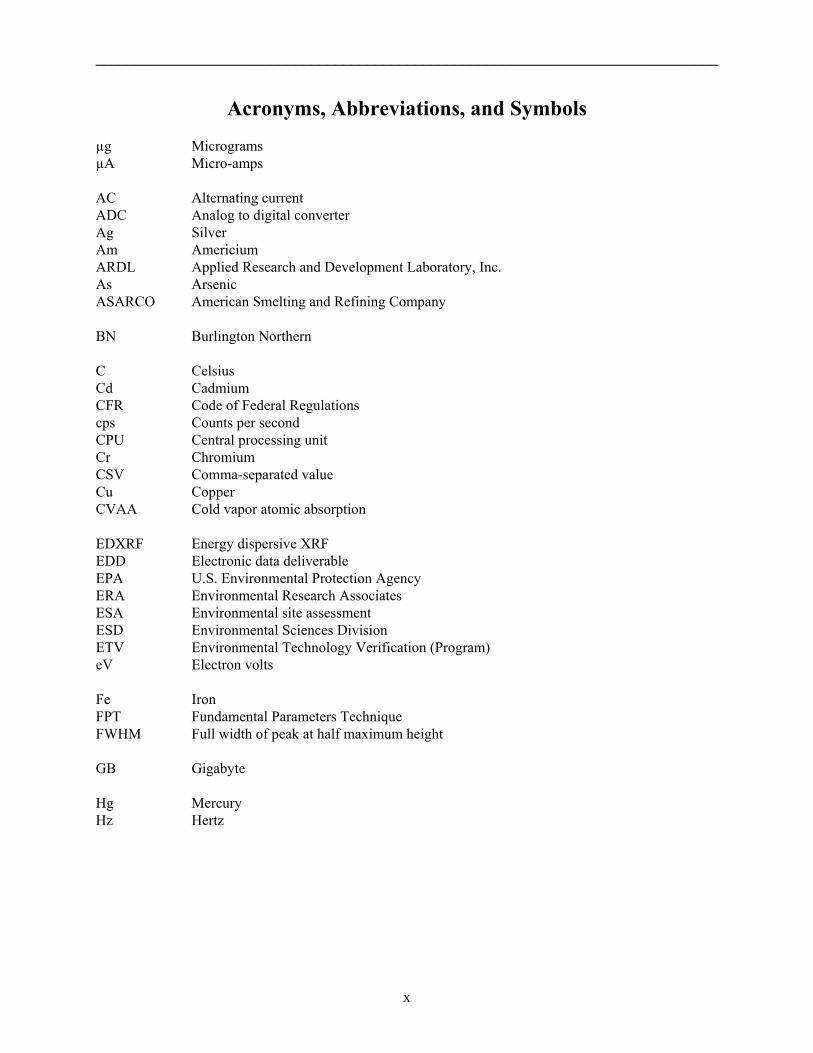
Acronyms, Abbreviations, and Symbols µg Micrograms µA Micro-amps AC Alternating current ADC Analog to digital converter Ag Silver Am Americium ARDL Applied Research and Development Laboratory, Inc. As Arsenic ASARCO American Smelting and Refining Company BN Burlington Northern C Celsius Cd Cadmium CFR Code of Federal Regulations cps Counts per second CPU Central processing unit Cr Chromium CSV Comma-separated value Cu Copper CVAA Cold vapor atomic absorption EDXRF Energy dispersive XRF EDD Electronic data deliverable EPA U.S. Environmental Protection Agency ERA Environmental Research Associates ESA Environmental site assessment ESD Environmental Sciences Division ETV Environmental Technology Verification (Program) eV Electron volts Fe Iron FPT Fundamental Parameters Technique FWHM Full width of peak at half maximum height GB Gigabyte Hg Mercury Hz Hertz

______________________________________________________________________________
xi
Acronyms, Abbreviations, and Symbols (Continued) ICP-AES Inductively coupled plasma-atomic emission spectrometry ICP-MS Inductively coupled plasma-mass spectrometry IR Infrared ITVR Innovative Technology Verification Report KARS Kennedy Athletic, Recreational and Social (Park) keV Kiloelectron volts kg Kilograms KSC Kennedy Space Center kV Kilovolts LEAP Light Element Analysis Program LiF Lithium fluoride LIMS Laboratory information management system LOD Limit of detection mA Milli-amps MB Megabyte MBq Mega Becquerels MCA Multi-channel analyzer mCi Millicuries MDL Method detection limit mg/kg Milligrams per kilogram MHz Megahertz mm Millimeters MMT Monitoring and Measurement Technology (Program) Mo Molybdenum MS Matrix spike MSD Matrix spike duplicate NASA National Aeronautics and Space Administration NELAC National Environmental Laboratory Accreditation Conference NERL National Exposure Research Laboratory Ni Nickel NIOSH National Institute for Occupational Safety and Health NIST National Institute for Standards and Technology NRC Nuclear Regulatory Commission NSWC Naval Surface Warfare Center ORD Office of Research and Development OSWER Office of Solid Waste and Emergency Response
______________________________________________________________________________
xii
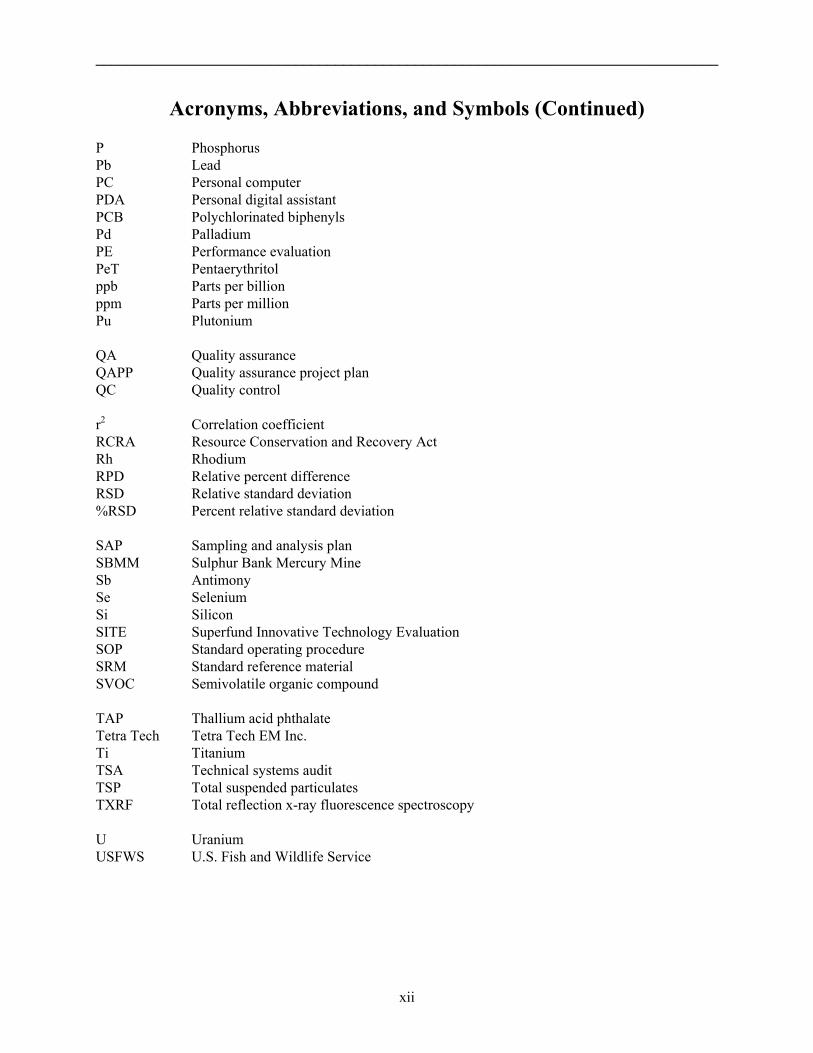
Acronyms, Abbreviations, and Symbols (Continued) P Phosphorus Pb Lead PC Personal computer PDA Personal digital assistant PCB Polychlorinated biphenyls Pd Palladium PE Performance evaluation PeT Pentaerythritol ppb Parts per billion ppm Parts per million Pu Plutonium QA Quality assurance QAPP Quality assurance project plan QC Quality control r2 Correlation coefficient RCRA Resource Conservation and Recovery Act Rh Rhodium RPD Relative percent difference RSD Relative standard deviation %RSD Percent relative standard deviation SAP Sampling and analysis plan SBMM Sulphur Bank Mercury Mine Sb Antimony Se Selenium Si Silicon SITE Superfund Innovative Technology Evaluation SOP Standard operating procedure SRM Standard reference material SVOC Semivolatile organic compound TAP Thallium acid phthalate Tetra Tech Tetra Tech EM Inc. Ti Titanium TSA Technical systems audit TSP Total suspended particulates TXRF Total reflection x-ray fluorescence spectroscopy U Uranium USFWS U.S. Fish and Wildlife Service

______________________________________________________________________________
xiii
Acronyms, Abbreviations, and Symbols (Continued) V Vanadium V Volts VOC Volatile organic compound W Watts WDXRF Wavelength-dispersive XRF WRS Wilcoxon Rank Sum XRF X-ray fluorescence Zn Zinc

______________________________________________________________________________
xiv
Acknowledgements
This report was co-authored by Dr. Greg Swanson and Dr. Mark Colsman of Tetra Tech EM Inc. The authors acknowledge the advice and support of the following individuals in preparing this report: Dr. Stephen Billets and Mr. George Brilis of the U.S. Environmental Protection Agency’s National Exposure Research Laboratory; David Mercuro and Laura Stupi of Niton Analyzers, A Division of Thermo Electron Corporation; and Dr. Jackie Quinn of the National Aeronautics and Space Administration (NASA), Kennedy Space Center (KSC). The demonstration team also acknowledges the field support of Michael Deliz of NASA KSC and Mark Speranza of Tetra Tech NUS, the consultant program manager for NASA.
______________________________________________________________________________________
1
Chapter 1
Introduction
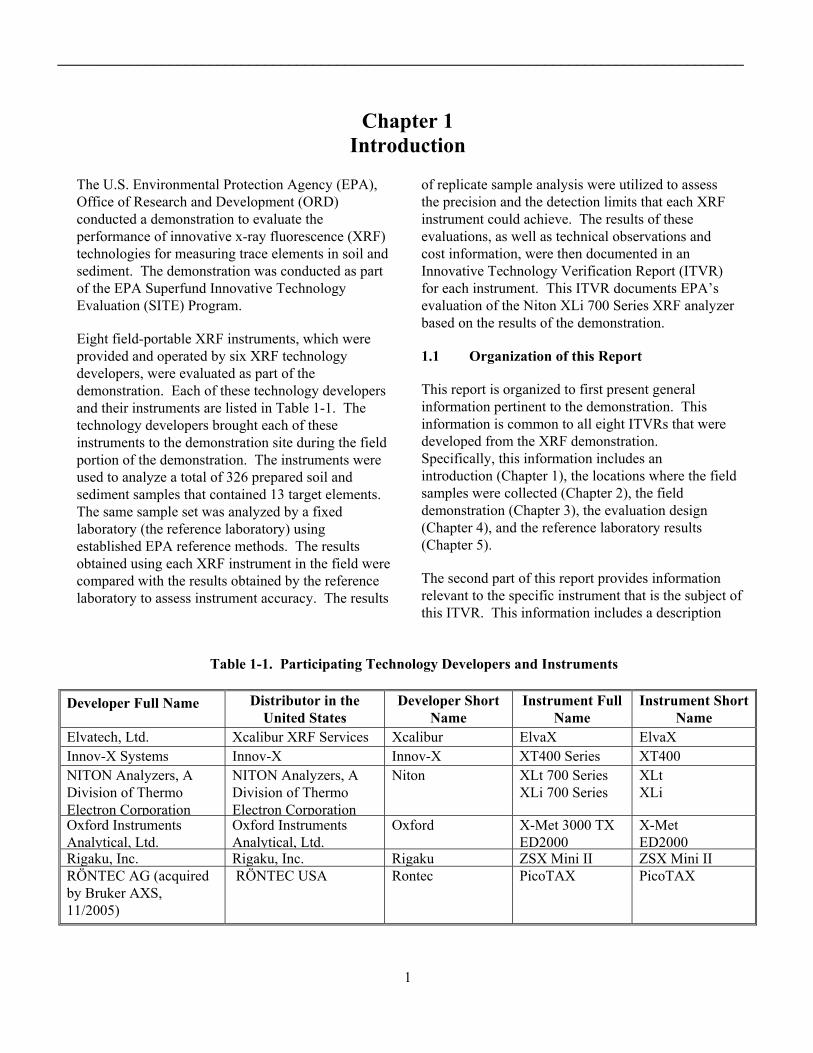
The U.S. Environmental Protection Agency (EPA), Office of Research and Development (ORD) conducted a demonstration to evaluate the performance of innovative x-ray fluorescence (XRF) technologies for measuring trace elements in soil and sediment. The demonstration was conducted as part of the EPA Superfund Innovative Technology Evaluation (SITE) Program.
Eight field-portable XRF instruments, which were provided and operated by six XRF technology developers, were evaluated as part of the demonstration. Each of these technology developers and their instruments are listed in Table 1-1. The technology developers brought each of these instruments to the demonstration site during the field portion of the demonstration. The instruments were used to analyze a total of 326 prepared soil and sediment samples that contained 13 target elements. The same sample set was analyzed by a fixed laboratory (the reference laboratory) using established EPA reference methods. The results obtained using each XRF instrument in the field were compared with the results obtained by the reference laboratory to assess instrument accuracy. The results
of replicate sample analysis were utilized to assess the precision and the detection limits that each XRF instrument could achieve. The results of these evaluations, as well as technical observations and cost information, were then documented in an Innovative Technology Verification Report (ITVR) for each instrument. This ITVR documents EPA’s evaluation of the Niton XLi 700 Series XRF analyzer based on the results of the demonstration.
1.1 Organization of this Report
This report is organized to first present general information pertinent to the demonstration. This information is common to all eight ITVRs that were developed from the XRF demonstration. Specifically, this information includes an introduction (Chapter 1), the locations where the field samples were collected (Chapter 2), the field demonstration (Chapter 3), the evaluation design (Chapter 4), and the reference laboratory results (Chapter 5).
The second part of this report provides information relevant to the specific instrument that is the subject of this ITVR. This information includes a description
Table 1-1. Participating Technology Developers and Instruments
Developer Full Name Distributor in the United States
Developer Short Name
Instrument Full Name
Instrument Short Name
Elvatech, Ltd. Xcalibur XRF Services Xcalibur ElvaX ElvaX Innov-X Systems Innov-X Innov-X XT400 Series XT400 NITON Analyzers, A Division of Thermo Electron Corporation
NITON Analyzers, A Division of Thermo Electron Corporation
Niton XLt 700 Series XLi 700 Series
XLt XLi
Oxford Instruments Analytical, Ltd.
Oxford Instruments Analytical, Ltd.
Oxford X-Met 3000 TX ED2000
X-Met ED2000
Rigaku, Inc. Rigaku, Inc. Rigaku ZSX Mini II ZSX Mini IIRÖNTEC AG (acquired by Bruker AXS, 11/2005)
RÖNTEC USA Rontec PicoTAX PicoTAX
__________________________________________________________________________________
2
of the instrument (Chapter 6), a performance evaluation (Chapter 7), a cost analysis (Chapter 8), and a summary of the demonstration results (Chapter 9).
References are provided in Chapter 10. A verification statement for the instrument is provided as Appendix A. Comments from the instrument developer on the demonstration and any exceptions to EPA’s evaluation are presented in Appendix B. Appendices C, D, and E contain the data validation summary report for the reference laboratory data and detailed evaluations of instrument versus reference laboratory results.
1.2 Description of the SITE Program
Performance verification of innovative environmental technologies is an integral part of EPA’s regulatory and research mission. The SITE Program was established by the EPA Office of Solid Waste and Emergency Response and ORD under the Superfund Amendments and Reauthorization Act of 1986. The overall goal of the SITE Program is to conduct performance verification studies and to promote acceptance of innovative technologies that may be used to achieve long-term protection of human health and the environment. The program is designed to meet three primary objectives: (1) identify and remove obstacles to development and commercial use of innovative technologies; (2) demonstrate promising innovative technologies and gather reliable information on performance and cost to support site characterization and cleanup; and (3) maintain an outreach program to operate existing technologies and identify new opportunities for their use. Additional information on the SITE Program is available on the EPA ORD web site (www.epa.gov/ord/SITE).
The intent of a SITE demonstration is to obtain representative, high-quality data on the performance and cost of one or more innovative technologies so that potential users can assess a technology’s suitability for a specific application. The SITE Program includes the following program elements:
• Monitoring and Measurement Technology (MMT) Program – Evaluates technologies that sample, detect, monitor, or measure hazardous
and toxic substances. These technologies are expected to provide better, faster, or more cost-effective methods for producing real-time data during site characterization and remediation studies than can conventional technologies.
• Remediation Technology Program –
Demonstrates innovative treatment technologies to provide reliable data on performance, cost, and applicability for site cleanups.
• Technology Transfer Program – Provides and disseminates technical information in the form of updates, brochures, and other publications that promote the SITE Program and the participating technologies.
The demonstration of XRF instruments was conducted as part of the MMT Program, which is administered by the Environmental Sciences Division (ESD) of the National Exposure Research Laboratory (NERL) in Las Vegas, Nevada. Additional information on the NERL ESD is available on the EPA web site (www.epa.gov/nerlesd1/). Tetra Tech EM Inc. (Tetra Tech), an EPA contractor, provided comprehensive technical support to the demonstration.
1.3 Scope of the Demonstration
Conventional analytical methods for measuring the concentrations of inorganic elements in soil and sediment are time-consuming and costly. For this reason, field-portable XRF instruments have been proposed as an alternative approach, particularly where rapid and cost-effective assessment of a site is a goal. The use of a field XRF instrument for elemental analysis allows field personnel to quickly assess the extent of contamination by target elements at a site. Furthermore, the near instantaneous data provided by field-portable XRF instruments can be used to quickly identify areas where there may be increased risks and allow development of a more focused and cost-effective sampling strategy for conventional laboratory analysis.
EPA-sponsored demonstrations of XRF technologies have been under way for more than a decade. The first SITE MMT demonstration of XRF occurred in 1995, when six instruments were evaluated for their

__________________________________________________________________________________
3
ability to analyze 10 target elements. The results of this demonstration were published in individual reports for each instrument (EPA 1996a, 1996b, 1998a, 1998b, 1998c, and 1998d). In 2003, two XRF instruments were included in a demonstration of field methods for analysis of mercury in soil and sediment. Individual ITVRs were also prepared for each of these two instruments (EPA 2004a, 2004b).
Although XRF spectrometry is now considered a mature technology for elemental analysis, field-portable XRF instruments have evolved considerably over the past 10 years, and many of the instruments that were evaluated in the original demonstration are no longer manufactured. Advances in electronics and data processing, coupled with new x-ray tube source technology, have produced substantial improvements in the precision and speed of XRF analysis. The current demonstration of XRF instruments was intended to evaluate these new technologies, with an expanded set of target elements, to provide information to potential users on current state-of-the-art instrumentation and its associated capabilities.
During the demonstration, performance data regarding each field-portable XRF instrument were collected through analysis of a sample set that included a broad range of soil/sediment types and target element concentrations. To develop this sample set, soil and sediment samples that contain the target elements of concern were collected in bulk quantities at nine sites from across the U.S. These bulk samples of soil and sediment were homogenized, characterized, and packaged into demonstration samples for the evaluation. Some of the batches of soil and sediment were spiked with selected target elements to ensure that representative concentration ranges were included for all target elements and that the sample design was robust. Replicate samples of the material in each batch were included in the final set of demonstration samples to assess instrument precision and detection limits. The final demonstration sample set therefore included 326 samples.
Each developer analyzed all 326 samples during the field demonstration using its XRF instrument and in accordance with its standard operating procedure. The field demonstration was conducted during the week of January 24, 2005, at the Kennedy Athletic,
Recreational and Social (KARS) Park, which is part of the Kennedy Space Center on Merritt Island, Florida. Observers were assigned to each XRF instrument during the field demonstration to collect detailed information on the instrument and operating procedures, including sample processing times, for subsequent evaluation. The reference laboratory also analyzed a complete set of the demonstration samples for the target elements using acid digestion and inductively coupled plasma-atomic emission spectrometry (ICP-AES), in accordance with EPA Method 3050B/6010B, and using cold vapor atomic absorption (CVAA) spectroscopy (for mercury only) in accordance with EPA Method 7471A. By assuming that the results from the reference laboratory were essentially “true” values, instrument accuracy was assessed by comparing the results obtained using the XRF instrument with the results from the reference laboratory. The data obtained using the XRF instrument were also assessed in other ways, in accordance with the objectives of the demonstration, to provide information on instrument precision, detection limits, and interferences.
1.4 General Description of XRF Technology
XRF spectroscopy is an analytical technique that exposes a solid sample to an x-ray source. The x-rays from the source have the appropriate excitation energy that causes elements in the sample to emit characteristic x-rays. A qualitative elemental analysis is possible from the characteristic energy, or wavelength, of the fluorescent x-rays emitted. A quantitative elemental analysis is possible by counting the number (intensity) of x-rays at a given wavelength.
Three electron shells are generally involved in emissions of x-rays during XRF analysis of samples: the K, L, and M shells. Multiple-intensity peaks are generated from the K, L, or M shell electrons in a typical emission pattern, also called an emission spectrum, for a given element. Most XRF analysis focuses on the x-ray emissions from the K and L shells because they are the most energetic lines. K lines are typically used for elements with atomic numbers from 11 to 46 (sodium to palladium), and L lines are used for elements above atomic number 47 (silver). M-shell emissions are measurable only for
__________________________________________________________________________________
4
metals with an atomic number greater than 57 (lanthanum).
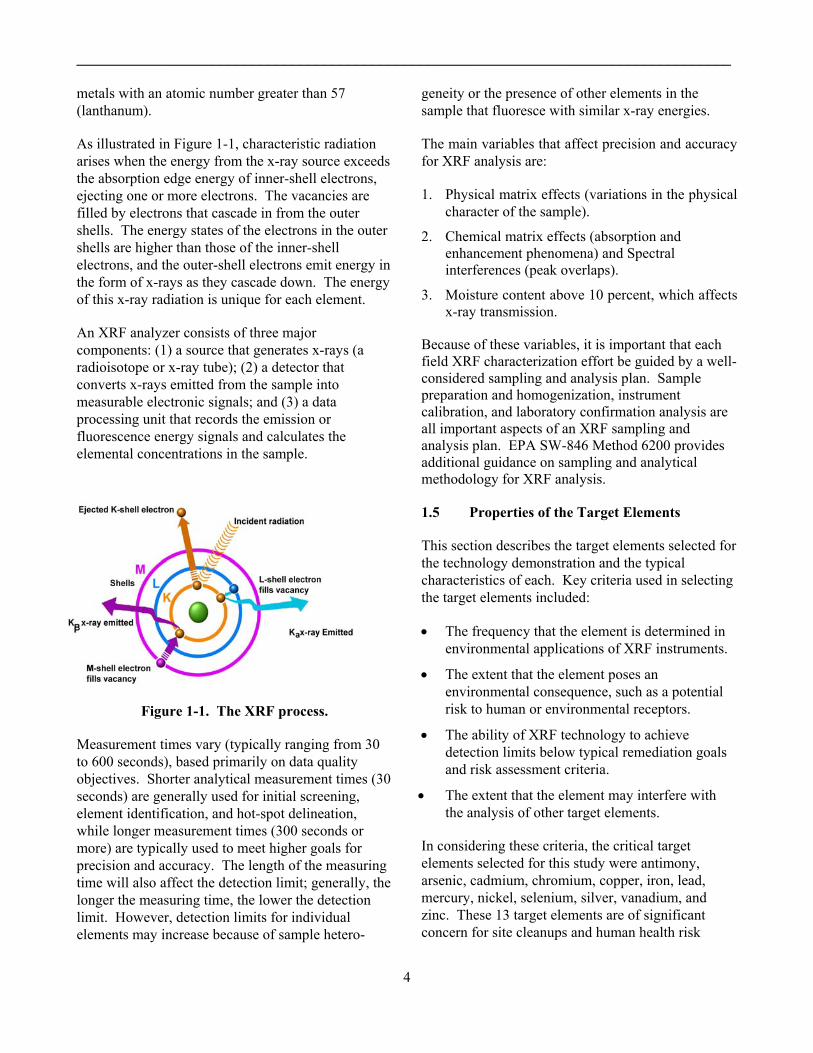
As illustrated in Figure 1-1, characteristic radiation arises when the energy from the x-ray source exceeds the absorption edge energy of inner-shell electrons, ejecting one or more electrons. The vacancies are filled by electrons that cascade in from the outer shells. The energy states of the electrons in the outer shells are higher than those of the inner-shell electrons, and the outer-shell electrons emit energy in the form of x-rays as they cascade down. The energy of this x-ray radiation is unique for each element.
An XRF analyzer consists of three major components: (1) a source that generates x-rays (a radioisotope or x-ray tube); (2) a detector that converts x-rays emitted from the sample into measurable electronic signals; and (3) a data processing unit that records the emission or fluorescence energy signals and calculates the elemental concentrations in the sample.
Figure 1-1. The XRF process.
Measurement times vary (typically ranging from 30 to 600 seconds), based primarily on data quality objectives. Shorter analytical measurement times (30 seconds) are generally used for initial screening, element identification, and hot-spot delineation, while longer measurement times (300 seconds or more) are typically used to meet higher goals for precision and accuracy. The length of the measuring time will also affect the detection limit; generally, the longer the measuring time, the lower the detection limit. However, detection limits for individual elements may increase because of sample hetero-
geneity or the presence of other elements in the sample that fluoresce with similar x-ray energies.
The main variables that affect precision and accuracy for XRF analysis are:
1. Physical matrix effects (variations in the physical character of the sample).
2. Chemical matrix effects (absorption and enhancement phenomena) and Spectral interferences (peak overlaps).
3. Moisture content above 10 percent, which affects x-ray transmission.
Because of these variables, it is important that each field XRF characterization effort be guided by a well-considered sampling and analysis plan. Sample preparation and homogenization, instrument calibration, and laboratory confirmation analysis are all important aspects of an XRF sampling and analysis plan. EPA SW-846 Method 6200 provides additional guidance on sampling and analytical methodology for XRF analysis.
1.5 Properties of the Target Elements
This section describes the target elements selected for the technology demonstration and the typical characteristics of each. Key criteria used in selecting the target elements included:
• The frequency that the element is determined in environmental applications of XRF instruments.
• The extent that the element poses an environmental consequence, such as a potential risk to human or environmental receptors.
• The ability of XRF technology to achieve detection limits below typical remediation goals and risk assessment criteria.
• The extent that the element may interfere with the analysis of other target elements.
In considering these criteria, the critical target elements selected for this study were antimony, arsenic, cadmium, chromium, copper, iron, lead, mercury, nickel, selenium, silver, vanadium, and zinc. These 13 target elements are of significant concern for site cleanups and human health risk
__________________________________________________________________________________
5
assessments because most are highly toxic or interfere with the analysis of other elements. The demonstration therefore focused on the analysis of these 13 elements in evaluating the various XRF instruments.
1.5.1 Antimony
Naturally occurring antimony in surface soils is typically found at less than 1 to 4 milligrams per kilogram (mg/kg). Antimony is mobile in the environment and is bioavailable for uptake by plants; concentrations greater than 5 mg/kg are potentially phytotoxic and concentrations above 31 mg/kg in soil may be hazardous to humans. Antimony may be found along with arsenic in mine wastes, at shooting ranges, and at industrial facilities. Typical detection limits for field-portable XRF instruments range from 10 to 40 mg/kg. Antimony is typically analyzed with success by ICP-AES; however, recovery of antimony in soil matrix spikes is often below quality control (QC) limits (50 percent or less) as a result of loss through volatilization during acid digestion. Therefore, results using ICP-AES may be lower than are obtained by XRF.
1.5.2 Arsenic
Naturally occurring arsenic in surface soils typically ranges from 1 to 50 mg/kg; concentrations above 10 mg/kg are potentially phytotoxic. Concentrations of arsenic greater than 0.39 mg/kg may cause carcinogenic effects in humans, and concentrations above 22 mg/kg may result in adverse noncarcinogenic effects. Typical detection limits for field-portable XRF instruments range from 10 to 20 mg/kg arsenic. Elevated concentrations of arsenic are associated with mine wastes and industrial facilities. Arsenic is successfully analyzed by ICP-AES; however, spectral interferences between peaks for arsenic and lead can affect detection limits and accuracy in XRF analysis when the ratio of lead to arsenic is 10 to 1 or more. Risk-based screening levels and soil screening levels for arsenic may be lower than the detection limits of field-portable XRF instruments.
1.5.3 Cadmium
Naturally occurring cadmium in surface soils typically ranges from 0.6 to 1.1 mg/kg; concentrations greater than 4 mg/kg are potentially phytotoxic. Concentrations of cadmium that exceed 37 mg/kg may result in adverse effects in humans. Typical detection limits for field-portable XRF instruments range from 10 to 50 mg/kg. Elevated concentrations of cadmium are associated with mine wastes and industrial facilities. Cadmium is successfully analyzed by both ICP-AES and field-portable XRF; however, action levels for cadmium may be lower than the detection limits of field-portable XRF instruments.
1.5.4 Chromium
Naturally occurring chromium in surface soils typically ranges from 1 to 1,000 mg/kg; concentrations greater than 1 mg/kg are potentially phytotoxic, although specific phytotoxicity levels for naturally occurring chromium have not been documented. The variable oxidation states of chromium affect its behavior and toxicity. Concentrations of hexavalent chromium above 30 mg/kg and of trivalent chromium above 10,000 mg/kg may cause adverse health effects in humans. Typical detection limits for field-portable XRF instruments range from 10 to 50 mg/kg. Hexavalent chromium is typically associated with metal plating or other industrial facilities. Trivalent chromium may be found in mine waste and at industrial facilities. Neither ICP-AES nor field-portable XRF can distinguish between oxidation states for chromium (or any other element).
1.5.5 Copper
Naturally occurring copper in surface soils typically ranges from 2 to 100 mg/kg; concentrations greater than 100 mg/kg are potentially phytotoxic. Concentrations greater than 3,100 mg/kg may result in adverse health effects in humans. Typical detection limits for field-portable XRF instruments range from 10 to 50 mg/kg. Copper is mobile and is a common contaminant in soil and sediments. Elevated concentrations of copper are associated with mine wastes and industrial facilities. Copper is successfully analyzed by ICP-AES and XRF;

__________________________________________________________________________________
6
however, spectral interferences between peaks for copper and zinc may affect the detection limits and accuracy of the XRF analysis.
1.5.6 Iron
Although iron is not considered an element that poses a significant environmental consequence, it interferes with measurement of other elements and was therefore included in the study. Furthermore, iron is often used as a target reference element in XRF analysis.
Naturally occurring iron in surface soils typically ranges from 7,000 to 550,000 mg/kg, with the iron content originating primarily from parent rock. Typical detection limits for field-portable XRF instruments are in the range of 10 to 60 mg/kg. Iron is easily analyzed by both ICP-AES and XRF; however, neither technique can distinguish among iron species in soil. Although iron in soil may pose few environmental consequences, high levels of iron may interfere with analyses of other elements in both techniques (ICP-AES and XRF). Spectral interference from iron is mitigated in ICP-AES analysis by applying inter-element correction factors, as required by the analytical method. Differences in analytical results between ICP-AES and XRF for other target elements are expected when concentrations of iron are high in the soil matrix.
1.5.7 Lead
Naturally occurring lead in surface soils typically ranges from 2 to 200 mg/kg; concentrations greater than 50 mg/kg are potentially phytotoxic. Concentrations greater than 400 mg/kg may result in adverse effects in humans. Typical detection limits for field-portable XRF instruments range from 10 to 20 mg/kg. Lead is a common contaminant at many sites, and human and environmental exposure can occur through many routes. Lead is frequently found in mine waste, at lead-acid battery recycling facilities, at oil refineries, and in lead-based paint. Lead is successfully analyzed by ICP-AES and XRF; however, spectral interferences between peaks for lead and arsenic in XRF analysis can affect detection limits and accuracy when the ratio of arsenic to lead is 10 to 1 or more. Differences between ICP-AES and XRF results are expected in the presence of high
concentrations of arsenic, especially when the ratio of lead to arsenic is low.
1.5.8 Mercury
Naturally occurring mercury in surface soils typically ranges from 0.01 to 0.3 mg/kg; concentrations greater than 0.3 mg/kg are potentially phytotoxic. Concentrations of mercury greater than 23 mg/kg and concentrations of methyl mercury above 6.1 mg/kg may result in adverse health effects in humans. Typical detection limits for field-portable XRF instruments range from 10 to 20 mg/kg. Elevated concentrations of mercury are associated with amalgamation of gold and with mine waste and industrial facilities. Native surface soils are commonly enriched by anthropogenic sources of mercury. Anthropogenic sources include coal-fired power plants and metal smelters. Mercury is too volatile to withstand both the vigorous digestion and extreme temperature involved with ICP-AES analysis; therefore, the EPA-approved technique for laboratory analysis of mercury is CVAA spectroscopy. Mercury is successfully measured by XRF, but differences between results obtained by CVAA and XRF are expected when mercury levels are high.
1.5.9 Nickel
Naturally occurring nickel in surface soils typically ranges from 5 to 500 mg/kg; a concentration of 30 mg/kg is potentially phytotoxic. Concentrations greater than 1,600 mg/kg may result in adverse health effects in humans. Typical detection limits for field-portable XRF instruments range from 10 to 60 mg/kg. Elevated concentrations of nickel are associated with mine wastes and industrial facilities. Nickel is a common environmental contaminant at metal processing sites. It is successfully analyzed by both ICP-AES and XRF with little interference; therefore, a strong correlation between the methods is expected.
1.5.10 Selenium
Naturally occurring selenium in surface soils typically ranges from 0.1 to 2 mg/kg; concentrations greater than 1 mg/kg are potentially phytotoxic. Its toxicities are well documented for plants and
__________________________________________________________________________________
7
livestock; however, it is also considered a trace nutrient. Concentrations above 390 mg/kg may result in adverse health effects in humans. Typical detection limits for field-portable XRF instruments range from 10 to 20 mg/kg. Most selenium is associated with sulfur or sulfide minerals, where concentrations can exceed 200 mg/kg. Selenium can be measured by both ICP-AES and XRF; however, detection limits using XRF usually exceed the ecological risk-based screening levels for soil. Analytical results for selenium using ICP-AES and XRF are expected to be comparable.
1.5.11 Silver
Naturally occurring silver in surface soils typically ranges from 0.01 to 5 mg/kg; concentrations greater than 2 mg/kg are potentially phytotoxic. In addition, concentrations that exceed 390 mg/kg may result in adverse effects in humans. Typical detection limits for field-portable XRF instruments range from 10 to 45 mg/kg. Silver is a common contaminant in mine waste, in photographic film processing wastes, and at metal processing sites. It is successfully analyzed by ICP-AES and XRF; however, recovery may be reduced in ICP-AES analysis because insoluble silver chloride may form during acid digestion. Detection limits using XRF may exceed the risk-based screening levels for silver in soil.
1.5.12 Vanadium
Naturally occurring vanadium in surface soils typically ranges from 20 to 500 mg/kg; concentrations greater than 2 mg/kg are potentially phytotoxic, although specific phytotoxicity levels for naturally occurring vanadium have not been documented. Concentrations above 550 mg/kg may result in adverse health effects in humans. Typical detection limits for field-portable XRF instruments range from 10 to 50 mg/kg. Vanadium can be associated with manganese, potassium, and organic matter and is typically concentrated in organic shales, coal, and crude oil. It is successfully analyzed by both ICP-AES and XRF with little interference.
1.5.13 Zinc
Naturally occurring zinc in surface soils typically ranges from 10 to 300 mg/kg; concentrations greater than 50 mg/kg are potentially phytotoxic. Zinc at concentrations above 23,000 mg/kg may result in adverse health effects in humans. Typical detection limits for field-portable XRF instruments range from 10 to 30 mg/kg. Zinc is a common contaminant in mine waste and at metal processing sites. In addition, it is highly soluble, which is a common concern for aquatic receptors. Zinc is successfully analyzed by ICP-AES; however, spectral interferences between peaks for copper and zinc may influence detection limits and the accuracy of the XRF analysis.

__________________________________________________________________________________
8
This page was left blank intentionally.

______________________________________________________________________________________
9
Chapter 2 Field Sample Collection Locations
Although the field demonstration took place at KARS Park on Merritt Island, Florida, environmental samples were collected at other sites around the country to develop a demonstration sample that incorporated a variety of soil/sediment types and target element concentrations. This chapter describes these sample collection sites, as well as the rationale for the selection of each.
Several criteria were used to assess potential sample collection sites, including:
• The ability to provide a variety of target elements and soil/sediment matrices.
• The convenience and accessibility of the location to the sampling team.
• Program support and the cooperation of the site owner.
Nine sample collection sites were ultimately selected for the demonstration; one was the KARS Park site itself. These nine sites were selected to represent variable soil textures (sand, silt, and clay) and iron content, two factors that significantly affect instrument performance.
Historical operations at these sites included mining, smelting, steel manufacturing, and open burn pits; one, KARS Park, was a gun range. Thus, these sites incorporated a wide variety of metal contaminants in soils and sediments. Both contaminated and uncontaminated (background) samples were collected at each site.
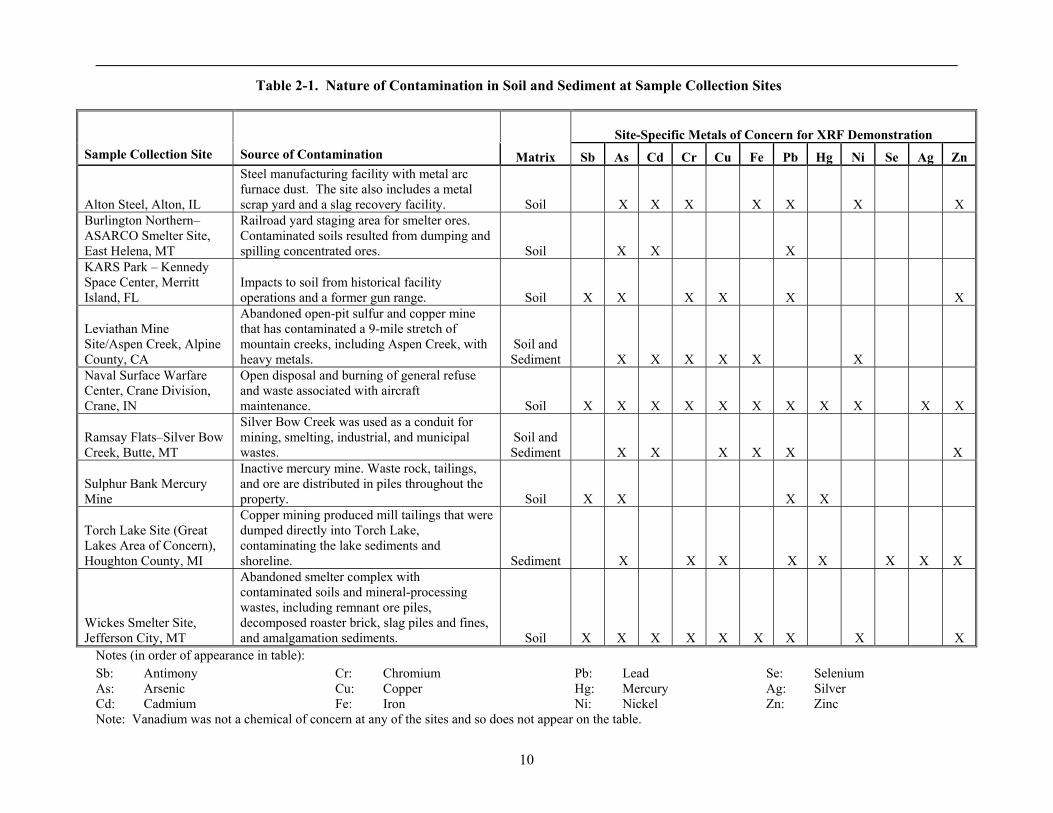
A summary of the sample collection sites is presented in Table 2-1, which describes the types of metal-contaminated soils or sediments that were found at each site. This information is based on the historical data that were provided by the site owners or by the EPA remedial project managers.
2.1 Alton Steel Mill Site
The Alton Steel Mill site (formerly the Laclede Steel site) is located at 5 Cut Street in Alton, Illinois. This 400-acre site is located in Alton’s industrial corridor. The Alton site was operated by Laclede Steel Company from 1911 until it went bankrupt in July 2001. The site was purchased by Alton Steel, Inc., from the bankruptcy estate of Laclede Steel in May 2003. The Alton site is heir to numerous environmental concerns from more than 90 years of steel production; site contaminants include polychlorinated biphenyls (PCBs) and heavy metals. Laclede Steel was cited during its operating years for improper management and disposal of PCB wastes and electric arc furnace dust that contained heavy metals such as lead and cadmium. A Phase I environmental site assessment (ESA) was conducted at the Alton site in May 2002, which identified volatile organic compounds (VOCs), semivolatile organic compounds (SVOCs), total priority pollutant metals, and PCBs as potential contaminants of concern at the site.
Based on the data gathered during the Phase I ESA and on discussions with Alton personnel, several soil samples were collected for the demonstration from two areas at the Alton site, including the Rod Patenting Building and the Tube Mill Building. The soil in the areas around these two buildings had not been remediated and was known to contain elevated concentrations of arsenic, cadmium, chromium, lead, nickel, zinc, and iron. The matrix of the contaminated soil samples was a fine to medium sand; the background soil sample was a sand loam.
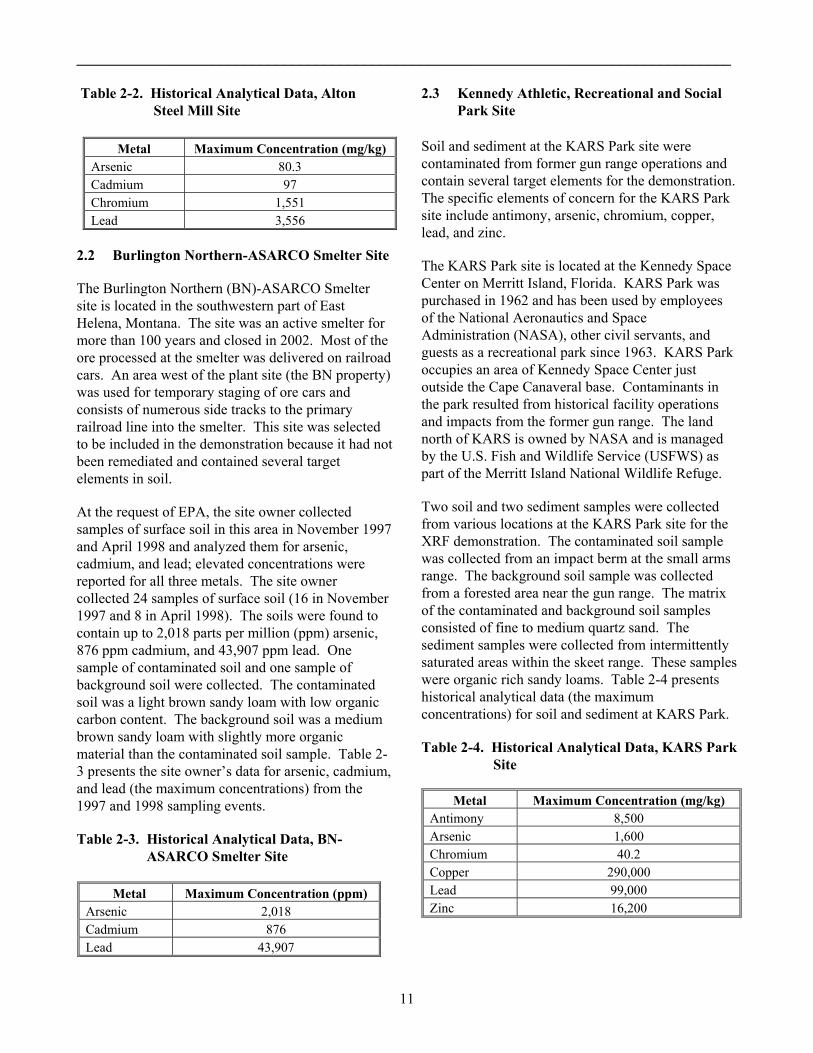
Table 2-2 presents historical analytical data (the maximum concentrations) for some of the target elements detected at the Alton site.
____________________________________________________________________________________________________________
10
Table 2-1. Nature of Contamination in Soil and Sediment at Sample Collection Sites
Site-Specific Metals of Concern for XRF Demonstration
Sample Collection Site Source of Contamination Matrix Sb As Cd Cr Cu Fe Pb Hg Ni Se Ag Zn
Alton Steel, Alton, IL
Steel manufacturing facility with metal arc furnace dust. The site also includes a metal scrap yard and a slag recovery facility. Soil X X X X X X X
Burlington Northern–ASARCO Smelter Site, East Helena, MT
Railroad yard staging area for smelter ores. Contaminated soils resulted from dumping and spilling concentrated ores. Soil X X X
KARS Park – Kennedy Space Center, Merritt Island, FL
Impacts to soil from historical facility operations and a former gun range. Soil X X X X X X
Leviathan Mine Site/Aspen Creek, Alpine County, CA
Abandoned open-pit sulfur and copper mine that has contaminated a 9-mile stretch of mountain creeks, including Aspen Creek, with heavy metals.
Soil and Sediment X X X X X X
Naval Surface Warfare Center, Crane Division, Crane, IN
Open disposal and burning of general refuse and waste associated with aircraft maintenance. Soil X X X X X X X X X X X
Ramsay Flats–Silver Bow Creek, Butte, MT
Silver Bow Creek was used as a conduit for mining, smelting, industrial, and municipal wastes.
Soil and Sediment X X X X X X
Sulphur Bank Mercury Mine
Inactive mercury mine. Waste rock, tailings, and ore are distributed in piles throughout the property. Soil X X X X
Torch Lake Site (Great Lakes Area of Concern), Houghton County, MI
Copper mining produced mill tailings that were dumped directly into Torch Lake, contaminating the lake sediments and shoreline. Sediment X X X X X X X X
Wickes Smelter Site, Jefferson City, MT
Abandoned smelter complex with contaminated soils and mineral-processing wastes, including remnant ore piles, decomposed roaster brick, slag piles and fines, and amalgamation sediments. Soil X X X X X X X X X
Notes (in order of appearance in table): Sb: Antimony Cr: Chromium Pb: Lead Se: Selenium As: Arsenic Cu: Copper Hg: Mercury Ag: Silver Cd: Cadmium Fe: Iron Ni: Nickel Zn: Zinc Note: Vanadium was not a chemical of concern at any of the sites and so does not appear on the table.
__________________________________________________________________________________
11
Table 2-2. Historical Analytical Data, Alton Steel Mill Site
Metal Maximum Concentration (mg/kg)
Arsenic 80.3 Cadmium 97 Chromium 1,551 Lead 3,556
2.2 Burlington Northern-ASARCO Smelter Site
The Burlington Northern (BN)-ASARCO Smelter site is located in the southwestern part of East Helena, Montana. The site was an active smelter for more than 100 years and closed in 2002. Most of the ore processed at the smelter was delivered on railroad cars. An area west of the plant site (the BN property) was used for temporary staging of ore cars and consists of numerous side tracks to the primary railroad line into the smelter. This site was selected to be included in the demonstration because it had not been remediated and contained several target elements in soil.
At the request of EPA, the site owner collected samples of surface soil in this area in November 1997 and April 1998 and analyzed them for arsenic, cadmium, and lead; elevated concentrations were reported for all three metals. The site owner collected 24 samples of surface soil (16 in November 1997 and 8 in April 1998). The soils were found to contain up to 2,018 parts per million (ppm) arsenic, 876 ppm cadmium, and 43,907 ppm lead. One sample of contaminated soil and one sample of background soil were collected. The contaminated soil was a light brown sandy loam with low organic carbon content. The background soil was a medium brown sandy loam with slightly more organic material than the contaminated soil sample. Table 2-3 presents the site owner’s data for arsenic, cadmium, and lead (the maximum concentrations) from the 1997 and 1998 sampling events.
Table 2-3. Historical Analytical Data, BN-ASARCO Smelter Site
Metal Maximum Concentration (ppm)
Arsenic 2,018 Cadmium 876 Lead 43,907
2.3 Kennedy Athletic, Recreational and Social Park Site
Soil and sediment at the KARS Park site were contaminated from former gun range operations and contain several target elements for the demonstration. The specific elements of concern for the KARS Park site include antimony, arsenic, chromium, copper, lead, and zinc.
The KARS Park site is located at the Kennedy Space Center on Merritt Island, Florida. KARS Park was purchased in 1962 and has been used by employees of the National Aeronautics and Space Administration (NASA), other civil servants, and guests as a recreational park since 1963. KARS Park occupies an area of Kennedy Space Center just outside the Cape Canaveral base. Contaminants in the park resulted from historical facility operations and impacts from the former gun range. The land north of KARS is owned by NASA and is managed by the U.S. Fish and Wildlife Service (USFWS) as part of the Merritt Island National Wildlife Refuge.
Two soil and two sediment samples were collected from various locations at the KARS Park site for the XRF demonstration. The contaminated soil sample was collected from an impact berm at the small arms range. The background soil sample was collected from a forested area near the gun range. The matrix of the contaminated and background soil samples consisted of fine to medium quartz sand. The sediment samples were collected from intermittently saturated areas within the skeet range. These samples were organic rich sandy loams. Table 2-4 presents historical analytical data (the maximum concentrations) for soil and sediment at KARS Park.
Table 2-4. Historical Analytical Data, KARS Park Site
Metal Maximum Concentration (mg/kg) Antimony 8,500 Arsenic 1,600 Chromium 40.2 Copper 290,000 Lead 99,000 Zinc 16,200

__________________________________________________________________________________
12
2.4 Leviathan Mine Site
The Leviathan Mine site is an abandoned copper and sulfur mine located high on the eastern slopes of the Sierra Nevada Mountain range near the California-Nevada border. Development of the Leviathan Mine began in 1863, when copper sulfate was mined for use in the silver refineries of the Comstock Lode. Later, the underground mine was operated as a copper mine until a mass of sulfur was encountered. Mining stopped until about 1935, when sulfur was extracted for use in refining copper ore. In the 1950s, the mine was converted to an open-pit sulfur mine. Placement of excavated overburden and waste rock in nearby streams created acid mine drainage and environmental impacts in the 1950s. Environmental impacts noted at that time included large fish kills.
Historical mining distributed waste rock around the mine site and created an open pit, adits, and solution cavities through mineralized rock. Oxygen in contact with the waste rock and mineralized rock in the adits oxidizes sulfur and sulfide minerals, generating acid. Water contacting the waste rock and flowing through the mineralized rock mobilizes the acid into the environment. The acid dissolves metals, including arsenic, copper, iron, and nickel, which creates conditions toxic to insects and fish in Leviathan, Aspen, and Bryant Creeks, downstream of the Leviathan Mine. Table 2-5 presents historical analytical data (the maximum concentrations) for the target elements detected at elevated concentrations in sediment samples collected along the three creeks. Four sediment and one soil sample were collected. One of the sediment samples was collected from the iron precipitate terraces formed from the acid mine drainage. The matrix of this sample appeared to be an orange silty clay loam. A second sediment sample was collected from the settling pond at the wastewater treatment system. The matrix of this sample was orange clay. A third sample was collected from the salt crust at the settling pond. This sample incorporated white crystalline material. One background sediment and one background soil sample were collected upstream of the mine. These samples consisted of light brown sandy loam.
Table 2-5. Historical Analytical Data, Leviathan Mine Site
Metal Maximum Concentration (mg/kg)
Arsenic 2,510 Cadmium 25.7 Chromium 279 Copper 837 Nickel 2,670
2.5 Navy Surface Warfare Center, Crane Division Site
The Old Burn Pit at the Naval Surface Warfare Center (NSWC), Crane Division, was selected to be included in the demonstration because 6 of the 13 target elements were detected at significant concentration in samples of surface soil previously collected at the site.
The NSWC, Crane Division, site is located near the City of Crane in south-central Indiana. The Old Burn Pit is located in the northwestern portion of NSWC and was used daily from 1942 to 1971 to burn refuse. Residue from the pit was buried along with noncombustible metallic items in a gully north of the pit. The burn pit was covered with gravel and currently serves as a parking lot for delivery trailers. The gully north of the former burn pit has been revegetated. Several soil samples were collected from the revegetated area for the demonstration because the highest concentrations of the target elements were detected in soil samples collected previously from this area. The matrix of the contaminated and background soil samples was a sandy loam. The maximum concentrations of the target elements detected in surface soil during previous investigations are summarized in Table 2-6.
__________________________________________________________________________________
13
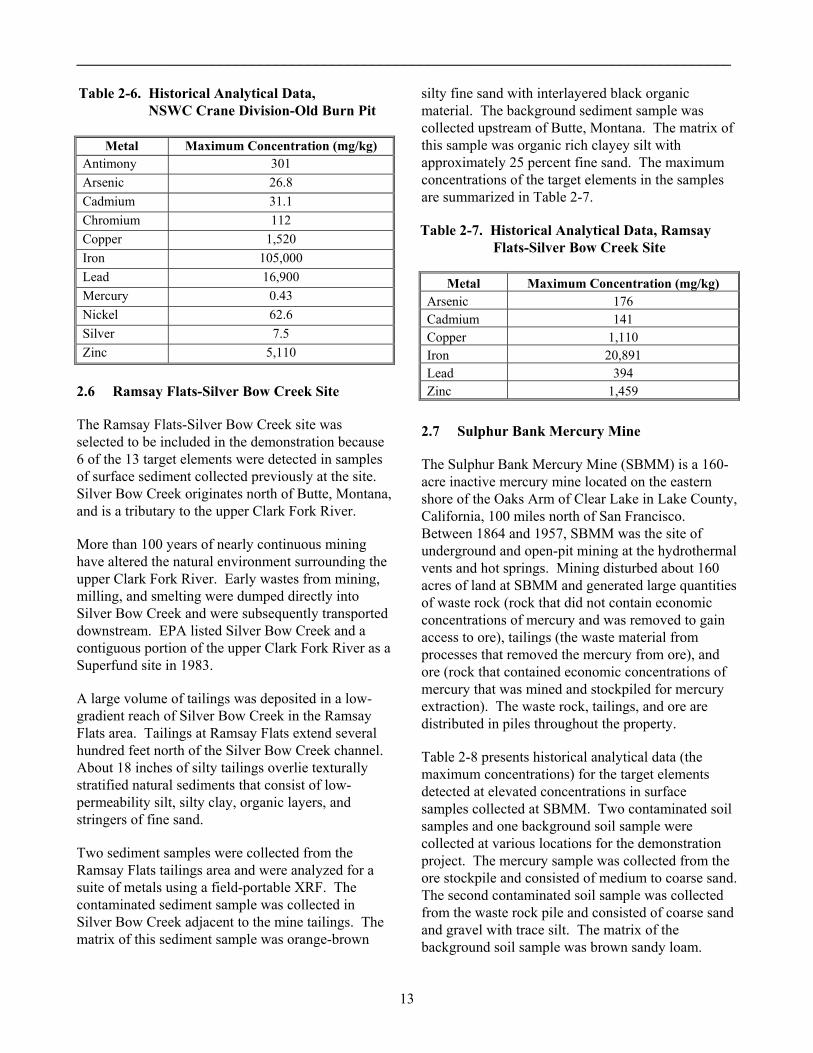
Table 2-6. Historical Analytical Data, NSWC Crane Division-Old Burn Pit
Metal Maximum Concentration (mg/kg) Antimony 301 Arsenic 26.8 Cadmium 31.1 Chromium 112 Copper 1,520 Iron 105,000 Lead 16,900 Mercury 0.43 Nickel 62.6 Silver 7.5 Zinc 5,110
2.6 Ramsay Flats-Silver Bow Creek Site
The Ramsay Flats-Silver Bow Creek site was selected to be included in the demonstration because 6 of the 13 target elements were detected in samples of surface sediment collected previously at the site. Silver Bow Creek originates north of Butte, Montana, and is a tributary to the upper Clark Fork River.
More than 100 years of nearly continuous mining have altered the natural environment surrounding the upper Clark Fork River. Early wastes from mining, milling, and smelting were dumped directly into Silver Bow Creek and were subsequently transported downstream. EPA listed Silver Bow Creek and a contiguous portion of the upper Clark Fork River as a Superfund site in 1983.
A large volume of tailings was deposited in a low-gradient reach of Silver Bow Creek in the Ramsay Flats area. Tailings at Ramsay Flats extend several hundred feet north of the Silver Bow Creek channel. About 18 inches of silty tailings overlie texturally stratified natural sediments that consist of low-permeability silt, silty clay, organic layers, and stringers of fine sand.
Two sediment samples were collected from the Ramsay Flats tailings area and were analyzed for a suite of metals using a field-portable XRF. The contaminated sediment sample was collected in Silver Bow Creek adjacent to the mine tailings. The matrix of this sediment sample was orange-brown
silty fine sand with interlayered black organic material. The background sediment sample was collected upstream of Butte, Montana. The matrix of this sample was organic rich clayey silt with approximately 25 percent fine sand. The maximum concentrations of the target elements in the samples are summarized in Table 2-7.
Table 2-7. Historical Analytical Data, Ramsay Flats-Silver Bow Creek Site
Metal Maximum Concentration (mg/kg) Arsenic 176 Cadmium 141 Copper 1,110 Iron 20,891 Lead 394 Zinc 1,459
2.7 Sulphur Bank Mercury Mine
The Sulphur Bank Mercury Mine (SBMM) is a 160-acre inactive mercury mine located on the eastern shore of the Oaks Arm of Clear Lake in Lake County, California, 100 miles north of San Francisco. Between 1864 and 1957, SBMM was the site of underground and open-pit mining at the hydrothermal vents and hot springs. Mining disturbed about 160 acres of land at SBMM and generated large quantities of waste rock (rock that did not contain economic concentrations of mercury and was removed to gain access to ore), tailings (the waste material from processes that removed the mercury from ore), and ore (rock that contained economic concentrations of mercury that was mined and stockpiled for mercury extraction). The waste rock, tailings, and ore are distributed in piles throughout the property.
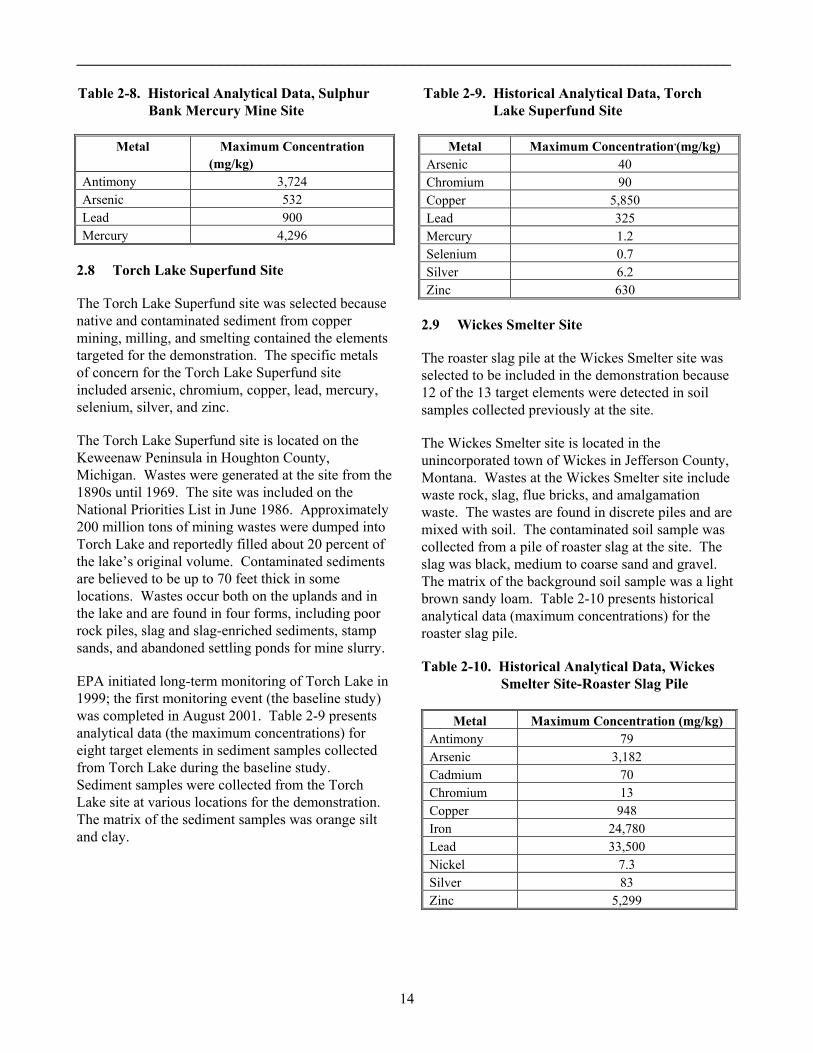
Table 2-8 presents historical analytical data (the maximum concentrations) for the target elements detected at elevated concentrations in surface samples collected at SBMM. Two contaminated soil samples and one background soil sample were collected at various locations for the demonstration project. The mercury sample was collected from the ore stockpile and consisted of medium to coarse sand. The second contaminated soil sample was collected from the waste rock pile and consisted of coarse sand and gravel with trace silt. The matrix of the background soil sample was brown sandy loam.
__________________________________________________________________________________
14
Table 2-8. Historical Analytical Data, Sulphur Bank Mercury Mine Site
Metal Maximum Concentration (mg/kg)
Antimony 3,724 Arsenic 532 Lead 900 Mercury 4,296
2.8 Torch Lake Superfund Site
The Torch Lake Superfund site was selected because native and contaminated sediment from copper mining, milling, and smelting contained the elements targeted for the demonstration. The specific metals of concern for the Torch Lake Superfund site included arsenic, chromium, copper, lead, mercury, selenium, silver, and zinc.
The Torch Lake Superfund site is located on the Keweenaw Peninsula in Houghton County, Michigan. Wastes were generated at the site from the 1890s until 1969. The site was included on the National Priorities List in June 1986. Approximately 200 million tons of mining wastes were dumped into Torch Lake and reportedly filled about 20 percent of the lake’s original volume. Contaminated sediments are believed to be up to 70 feet thick in some locations. Wastes occur both on the uplands and in the lake and are found in four forms, including poor rock piles, slag and slag-enriched sediments, stamp sands, and abandoned settling ponds for mine slurry.
EPA initiated long-term monitoring of Torch Lake in 1999; the first monitoring event (the baseline study) was completed in August 2001. Table 2-9 presents analytical data (the maximum concentrations) for eight target elements in sediment samples collected from Torch Lake during the baseline study. Sediment samples were collected from the Torch Lake site at various locations for the demonstration. The matrix of the sediment samples was orange silt and clay.
Table 2-9. Historical Analytical Data, Torch Lake Superfund Site
Metal Maximum Concentration,(mg/kg) Arsenic 40 Chromium 90 Copper 5,850 Lead 325 Mercury 1.2 Selenium 0.7 Silver 6.2 Zinc 630
2.9 Wickes Smelter Site
The roaster slag pile at the Wickes Smelter site was selected to be included in the demonstration because 12 of the 13 target elements were detected in soil samples collected previously at the site.
The Wickes Smelter site is located in the unincorporated town of Wickes in Jefferson County, Montana. Wastes at the Wickes Smelter site include waste rock, slag, flue bricks, and amalgamation waste. The wastes are found in discrete piles and are mixed with soil. The contaminated soil sample was collected from a pile of roaster slag at the site. The slag was black, medium to coarse sand and gravel. The matrix of the background soil sample was a light brown sandy loam. Table 2-10 presents historical analytical data (maximum concentrations) for the roaster slag pile.
Table 2-10. Historical Analytical Data, Wickes Smelter Site-Roaster Slag Pile
Metal Maximum Concentration (mg/kg)
Antimony 79 Arsenic 3,182 Cadmium 70 Chromium 13 Copper 948 Iron 24,780 Lead 33,500 Nickel 7.3 Silver 83 Zinc 5,299
_______________________________________________________________________________________
15
Chapter 3
Field Demonstration
The field demonstration required a sample set and a single location (the demonstration site) where all the technology developers could assemble to analyze the sample set under the oversight of the EPA/Tetra Tech field team. This chapter describes how the sample set was created, how the demonstration site was selected, and how the field demonstration was conducted. Additional detail regarding these topics is available in the Demonstration and Quality Assurance Project Plan (Tetra Tech 2005).
3.1 Bulk Sample Processing
A set of samples that incorporated a variety of soil and sediment types and target element concentrations was needed to conduct a robust evaluation. The demonstration sample set was generated from the bulk soil and sediment samples that were collected from the nine sample collection sites described in Chapter 2. Both contaminated (environmental) and uncontaminated (background) bulk samples of soil and sediment were collected at each sample collection site. The background sample was used as source material for a spiked sample when the contaminated sample did not contain the required levels of target elements. By incorporating a spiked background sample into the sample set, the general characteristics of the soil and sediment sample matrix could be maintained. At the same time, this spiked sample assured that all target elements were present at the highest concentration levels needed for a robust evaluation.
3.1.1 Bulk Sample Collection and Shipping
Large quantities of soil and sediment were needed for processing into well-characterized samples for this demonstration. As a result, 14 soil samples and 11 sediment samples were collected in bulk quantity from the nine sample collection sites across the U.S. A total of approximately 1,500 kilograms of unprocessed soil and sediment was collected, which yielded more than 1,000 kilograms of soil and sediment after the bulk samples had been dried.
Each bulk soil sample was excavated using clean shovels and trowels and then placed into clean, plastic
5-gallon (19-liter) buckets at the sample collection site. The mass of soil and sediment in each bucket varied, but averaged about 25 kilograms per bucket. As a result, multiple buckets were needed to contain the entire quantity of each bulk sample.
Once it had been filled, a plastic lid was placed on each bucket, the lid was secured with tape, and the bucket was labeled with a unique bulk sample number. Sediment samples were collected in a similar method at all sites except at Torch Lake, where sediments were collected using a Vibracore or Ponar sediment sampler operated from a boat. Each 5-gallon bucket was overpacked in a plastic cooler and was shipped under chain of custody via overnight delivery to the characterization laboratory, Applied Research and Development Laboratory (ARDL).
3.1.2 Bulk Sample Preparation and Homogenization
Each bulk soil or sediment sample was removed from the multiple shipping buckets and then mixed and homogenized to create a uniform batch. Each bulk sample was then spread on a large tray at ARDL’s laboratory to promote uniform air drying. Some bulk samples of sediment required more than 2 weeks to dry because of the high moisture content.
The air-dried bulk samples of soil and sediment were sieved through a custom-made screen to remove coarse material larger than about 1 inch. Next, each bulk sample was mechanically crushed using a hardened stainless-steel hammer mill until the particle size was sub-60-mesh sieve (less than 0.2 millimeters). The particle size of the processed bulk soil and sediment was measured after each round of crushing using standard sieve technology, and the particles that were still larger than 60-mesh were returned to the crushing process. The duration of the crushing process for each bulk sample varied based on soil type and volume of coarse fragments.
After each bulk sample had been sieved and crushed, the sample was mixed and homogenized using a Model T 50A Turbula shaker-mixer. This shaker was

__________________________________________________________________________________
16
capable of handling up to 50 gallons (190 liters) of sample material; thus, this shaker could handle the complete volume of each bulk sample. Bulk samples of smaller volume were mixed and homogenized using a Model T 10B Turbula shaker-mixer that was capable of handling up to 10 gallons (38 liters). Aliquots from each homogenized bulk sample were then sampled and analyzed in triplicate
for the 13 target elements using ICP-AES and CVAA. If the relative percent difference between the highest and lowest result exceeded 10 percent for any element, the entire batch was returned to the shaker-mixer for additional homogenization. The entire processing scheme for the bulk samples is shown in Figure 3-1.
Figure 3-1. Bulk sample processing diagram.
__________________________________________________________________________________
17
3.2 Demonstration Samples
After the bulk soil and sediment sample material had been processed into homogenized bulk samples for the demonstration, the next consideration was the concentrations of target elements. The goal was to create a demonstration sample set that would cover the concentration range of each target element that may be reasonably found in the environment. Three concentration levels were identified as a basis for assessing both the coverage of the environmental samples and the need to generate spiked samples. These three levels were: (1) near the detection limit, (2) at intermediate concentrations, and (3) at high concentrations. A fourth concentration level (very high) was added for lead, iron, and zinc in soil and for iron in sediment. Table 3-1 lists the numerical ranges of the target elements for each of these levels (1 through 4).
3.2.1 Environmental Samples
A total of 25 separate environmental samples were collected from the nine sample collection sites described in Chapter 2. This bulk environmental sample set included 14 soil and 11 sediment samples. The concentrations of the target elements in some of these samples, however, were too high or too low to be used for the demonstration. Therefore, the initial analytical results for each bulk sample were used to establish different sample blends for each sampling location that would better cover the desired concentration ranges.
The 14 bulk soil samples were used to create 26 separate sample blends and the 11 bulk sediment samples were used to create 19 separate sample blends. Thus, there were 45 environmental sample blends in the final demonstration sample set. Either five or seven replicate samples of each sample blend were included in the sample set for analysis during the demonstration. Table 3-2 lists the number of sample blends and the number of demonstration samples (including replicates) that were derived from the bulk environmental samples for each sampling location.
3.2.2 Spiked Samples
Spiked samples that incorporated a soil and sediment matrix native to the sampling locations were created by adding known concentrations of target elements to the background samples. The spiked concentrations were selected to ensure that a minimum of three samples was available for all concentration levels for each target element.
After initial characterization at ARDL’s laboratory, all bulk background soil and sediment samples were shipped to Environmental Research Associates (ERA) to create the spiked samples. The spiked elements were applied to the bulk sample in an aqueous solution, and then each bulk spiked sample was blended for uniformity and dried before it was repackaged in sample bottles.
Six bulk background soil samples were used at ERA’s laboratory to create 12 separate spiked sample blends, and four bulk sediment samples were used to create 13 separate spiked sample blends. Thus, a total of 10 bulk background samples were used to create 25 spiked sample blends. Three or seven replicate samples of each spiked sample blend were included in the demonstration sample set. Table 3-3 lists the number of sample blends and the number of demonstration samples (including replicates) that were derived from the bulk background samples for each sampling location.
3.2.3 Demonstration Sample Set
In total, 70 separate blends of environmental and spiked samples were created and a set of 326 samples was developed for the demonstration by including three, five, or seven replicates of each blend in the final demonstration sample set. Thirteen sets of the demonstration samples, consisting of 326 individual samples in 250-milliliter clean plastic sample bottles, were prepared for shipment to the demonstration site and reference laboratory.
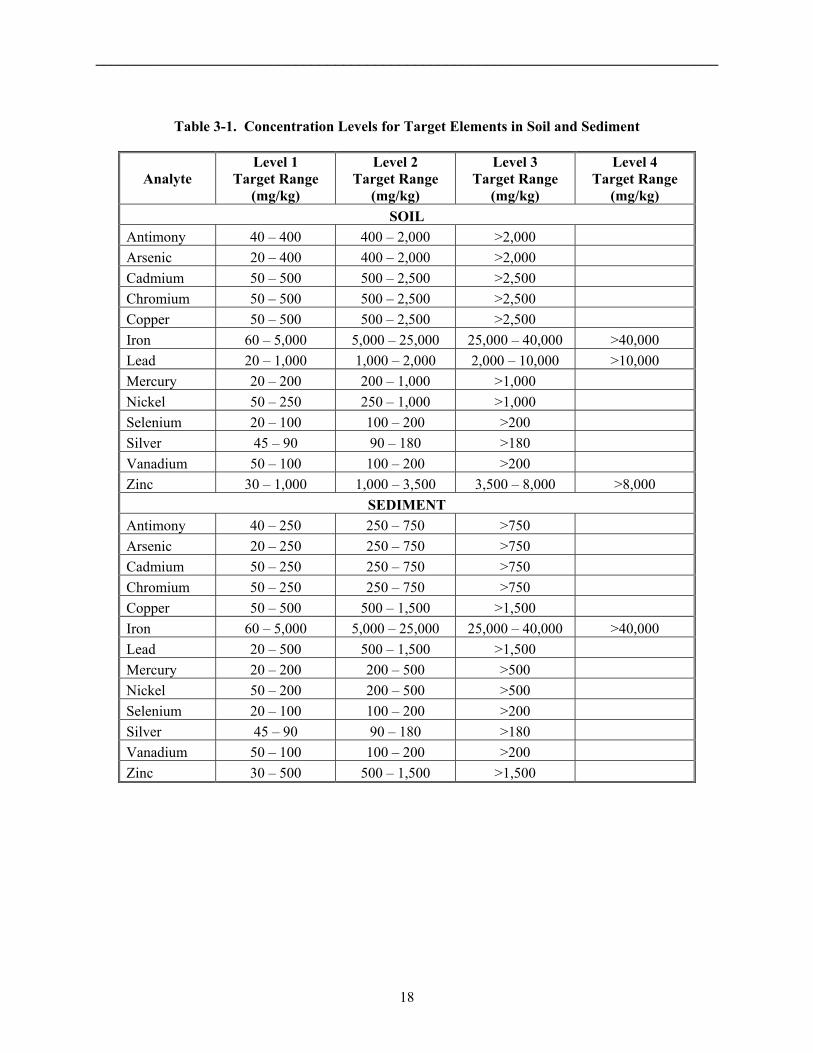
______________________________________________________________________________
18
Table 3-1. Concentration Levels for Target Elements in Soil and Sediment
Analyte Level 1
Target Range (mg/kg)
Level 2 Target Range
(mg/kg)
Level 3 Target Range
(mg/kg)
Level 4 Target Range
(mg/kg) SOIL
Antimony 40 – 400 400 – 2,000 >2,000 Arsenic 20 – 400 400 – 2,000 >2,000 Cadmium 50 – 500 500 – 2,500 >2,500 Chromium 50 – 500 500 – 2,500 >2,500 Copper 50 – 500 500 – 2,500 >2,500 Iron 60 – 5,000 5,000 – 25,000 25,000 – 40,000 >40,000 Lead 20 – 1,000 1,000 – 2,000 2,000 – 10,000 >10,000 Mercury 20 – 200 200 – 1,000 >1,000 Nickel 50 – 250 250 – 1,000 >1,000 Selenium 20 – 100 100 – 200 >200 Silver 45 – 90 90 – 180 >180 Vanadium 50 – 100 100 – 200 >200 Zinc 30 – 1,000 1,000 – 3,500 3,500 – 8,000 >8,000
SEDIMENT Antimony 40 – 250 250 – 750 >750 Arsenic 20 – 250 250 – 750 >750 Cadmium 50 – 250 250 – 750 >750 Chromium 50 – 250 250 – 750 >750 Copper 50 – 500 500 – 1,500 >1,500 Iron 60 – 5,000 5,000 – 25,000 25,000 – 40,000 >40,000 Lead 20 – 500 500 – 1,500 >1,500 Mercury 20 – 200 200 – 500 >500 Nickel 50 – 200 200 – 500 >500 Selenium 20 – 100 100 – 200 >200 Silver 45 – 90 90 – 180 >180 Vanadium 50 – 100 100 – 200 >200 Zinc 30 – 500 500 – 1,500 >1,500
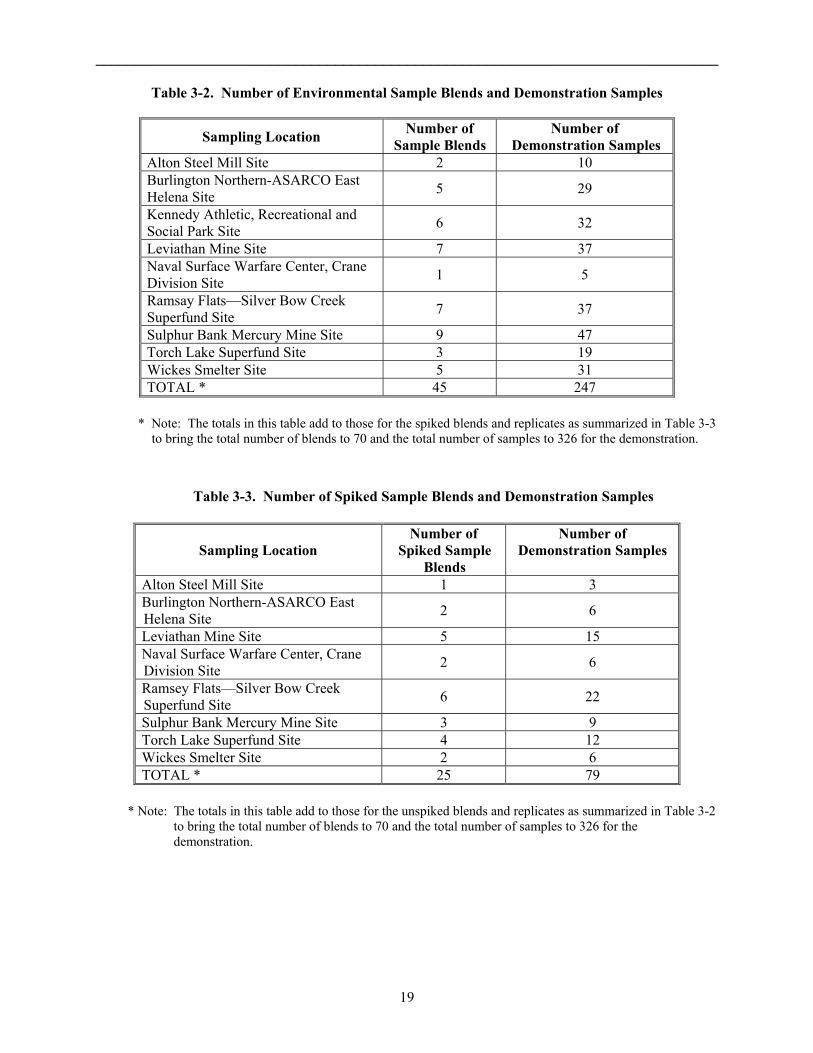
______________________________________________________________________________
19
Table 3-2. Number of Environmental Sample Blends and Demonstration Samples
Sampling Location Number of Sample Blends
Number of Demonstration Samples
Alton Steel Mill Site 2 10 Burlington Northern-ASARCO East Helena Site 5 29
Kennedy Athletic, Recreational and Social Park Site 6 32
Leviathan Mine Site 7 37 Naval Surface Warfare Center, Crane Division Site 1 5
Ramsay Flats—Silver Bow Creek Superfund Site 7 37
Sulphur Bank Mercury Mine Site 9 47 Torch Lake Superfund Site 3 19 Wickes Smelter Site 5 31 TOTAL * 45 247
* Note: The totals in this table add to those for the spiked blends and replicates as summarized in Table 3-3
to bring the total number of blends to 70 and the total number of samples to 326 for the demonstration.
Table 3-3. Number of Spiked Sample Blends and Demonstration Samples
Sampling Location Number of
Spiked Sample Blends
Number of Demonstration Samples
Alton Steel Mill Site 1 3 Burlington Northern-ASARCO East Helena Site 2 6
Leviathan Mine Site 5 15 Naval Surface Warfare Center, Crane Division Site 2 6
Ramsey Flats—Silver Bow Creek Superfund Site 6 22
Sulphur Bank Mercury Mine Site 3 9 Torch Lake Superfund Site 4 12 Wickes Smelter Site 2 6 TOTAL * 25 79
* Note: The totals in this table add to those for the unspiked blends and replicates as summarized in Table 3-2 to bring the total number of blends to 70 and the total number of samples to 326 for the demonstration.
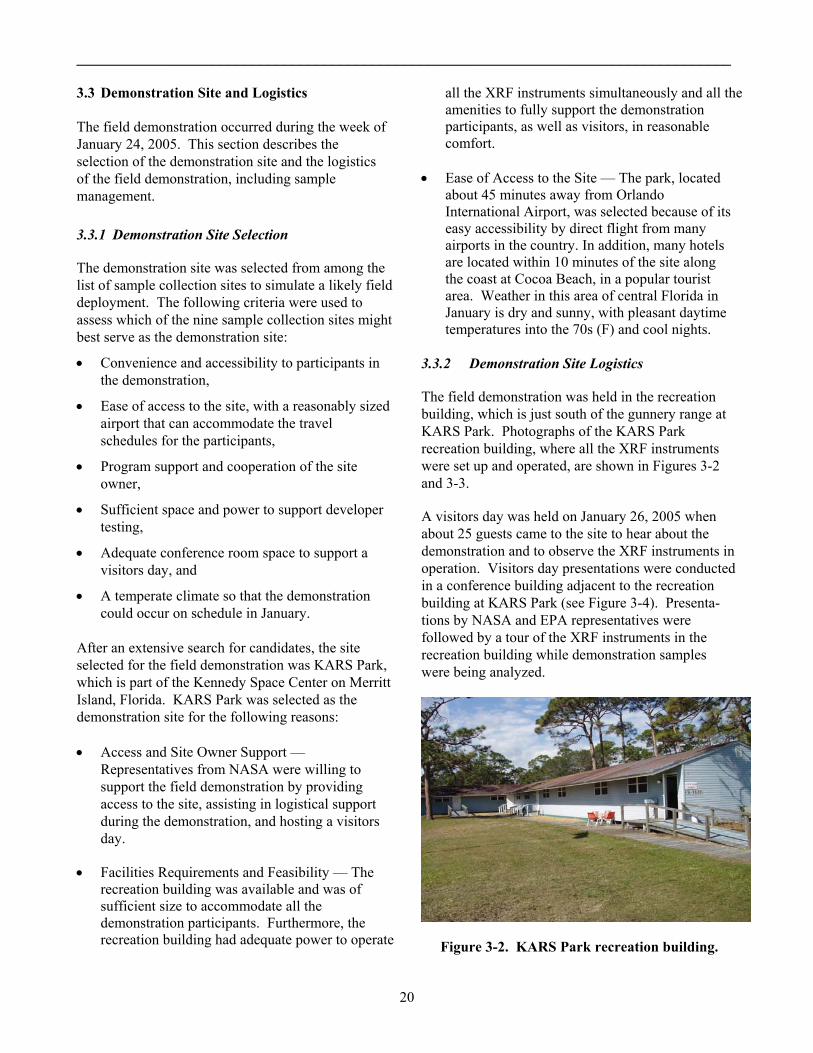
__________________________________________________________________________________
20
3.3 Demonstration Site and Logistics The field demonstration occurred during the week of January 24, 2005. This section describes the selection of the demonstration site and the logistics of the field demonstration, including sample management.
3.3.1 Demonstration Site Selection
The demonstration site was selected from among the list of sample collection sites to simulate a likely field deployment. The following criteria were used to assess which of the nine sample collection sites might best serve as the demonstration site:
• Convenience and accessibility to participants in the demonstration,
• Ease of access to the site, with a reasonably sized airport that can accommodate the travel schedules for the participants,
• Program support and cooperation of the site owner,
• Sufficient space and power to support developer testing,
• Adequate conference room space to support a visitors day, and
• A temperate climate so that the demonstration could occur on schedule in January.
After an extensive search for candidates, the site selected for the field demonstration was KARS Park, which is part of the Kennedy Space Center on Merritt Island, Florida. KARS Park was selected as the demonstration site for the following reasons: • Access and Site Owner Support —
Representatives from NASA were willing to support the field demonstration by providing access to the site, assisting in logistical support during the demonstration, and hosting a visitors day.
• Facilities Requirements and Feasibility — The recreation building was available and was of sufficient size to accommodate all the demonstration participants. Furthermore, the recreation building had adequate power to operate
all the XRF instruments simultaneously and all the amenities to fully support the demonstration participants, as well as visitors, in reasonable comfort.
• Ease of Access to the Site — The park, located about 45 minutes away from Orlando International Airport, was selected because of its easy accessibility by direct flight from many airports in the country. In addition, many hotels are located within 10 minutes of the site along the coast at Cocoa Beach, in a popular tourist area. Weather in this area of central Florida in January is dry and sunny, with pleasant daytime temperatures into the 70s (F) and cool nights.
3.3.2 Demonstration Site Logistics
The field demonstration was held in the recreation building, which is just south of the gunnery range at KARS Park. Photographs of the KARS Park recreation building, where all the XRF instruments were set up and operated, are shown in Figures 3-2 and 3-3.
A visitors day was held on January 26, 2005 when about 25 guests came to the site to hear about the demonstration and to observe the XRF instruments in operation. Visitors day presentations were conducted in a conference building adjacent to the recreation building at KARS Park (see Figure 3-4). Presenta- tions by NASA and EPA representatives were followed by a tour of the XRF instruments in the recreation building while demonstration samples were being analyzed.
Figure 3-2. KARS Park recreation building.
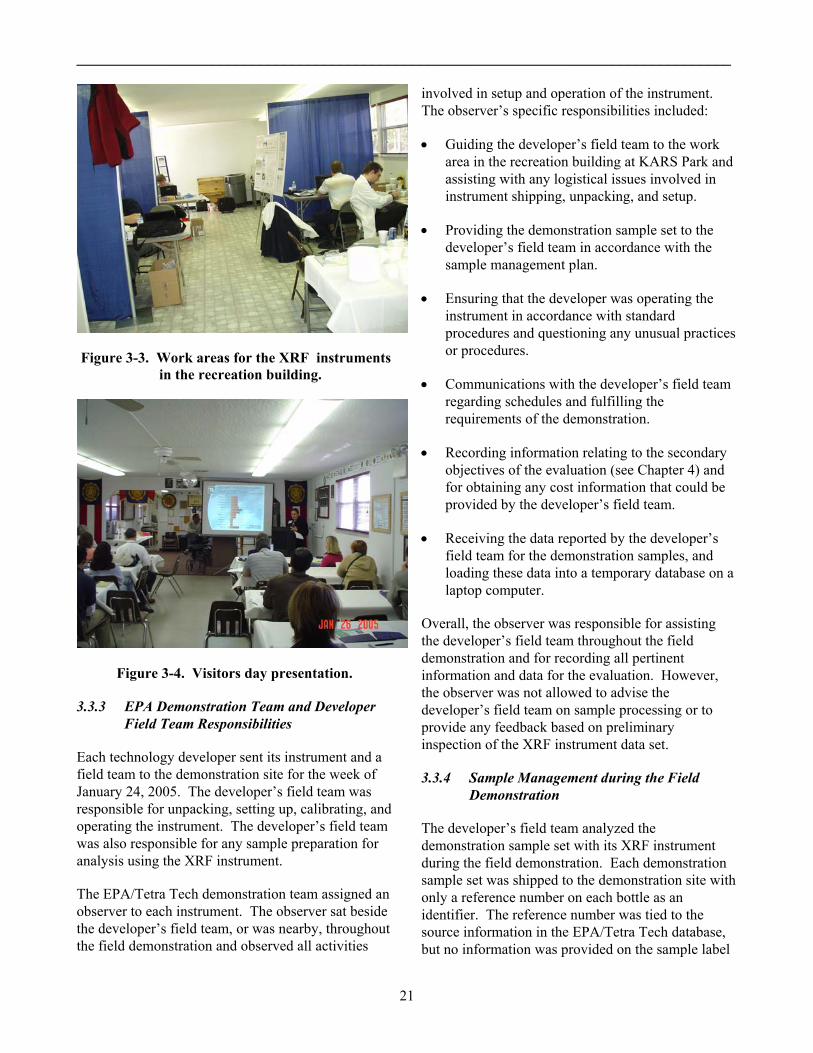
__________________________________________________________________________________
21
Figure 3-3. Work areas for the XRF instruments in the recreation building.
Figure 3-4. Visitors day presentation.
3.3.3 EPA Demonstration Team and Developer Field Team Responsibilities
Each technology developer sent its instrument and a field team to the demonstration site for the week of January 24, 2005. The developer’s field team was responsible for unpacking, setting up, calibrating, and operating the instrument. The developer’s field team was also responsible for any sample preparation for analysis using the XRF instrument.
The EPA/Tetra Tech demonstration team assigned an observer to each instrument. The observer sat beside the developer’s field team, or was nearby, throughout the field demonstration and observed all activities
involved in setup and operation of the instrument. The observer’s specific responsibilities included:
• Guiding the developer’s field team to the work area in the recreation building at KARS Park and assisting with any logistical issues involved in instrument shipping, unpacking, and setup.
• Providing the demonstration sample set to the developer’s field team in accordance with the sample management plan.
• Ensuring that the developer was operating the instrument in accordance with standard procedures and questioning any unusual practices or procedures.
• Communications with the developer’s field team regarding schedules and fulfilling the requirements of the demonstration.
• Recording information relating to the secondary objectives of the evaluation (see Chapter 4) and for obtaining any cost information that could be provided by the developer’s field team.
• Receiving the data reported by the developer’s field team for the demonstration samples, and loading these data into a temporary database on a laptop computer.
Overall, the observer was responsible for assisting the developer’s field team throughout the field demonstration and for recording all pertinent information and data for the evaluation. However, the observer was not allowed to advise the developer’s field team on sample processing or to provide any feedback based on preliminary inspection of the XRF instrument data set.
3.3.4 Sample Management during the Field Demonstration
The developer’s field team analyzed the demonstration sample set with its XRF instrument during the field demonstration. Each demonstration sample set was shipped to the demonstration site with only a reference number on each bottle as an identifier. The reference number was tied to the source information in the EPA/Tetra Tech database, but no information was provided on the sample label

__________________________________________________________________________________
22
that might provide the developer’s field team any insight as to the nature or content of the sample. Spiked samples were integrated with the environmental samples in a random manner so that the spiked samples could not be distinguished.
The demonstration sample set was divided into 13 subsets, or batches, for tracking during the field demonstration. The samples provided to each developer’s field team were randomly distributed in two fashions. First, the order of the jars within each batch was random, so that the sample order for a batch was different for each developer’s field team. Second, the distribution of sample batches was random, so that each developer’s field team received the sample batches in a different order.
The observer provided the developer’s field team with one batch of samples at a time. When the developer’s field team reported that analysis of a batch was complete, the observer would reclaim all the unused sample material from that batch and then provide the next batch of samples for analysis. Chain-of-custody forms were used to document all sample transfers. When the analysis of all batches was complete, the observer assisted the developer’s field team in cleanup of the work area and repackaging the instrument and any associated equipment. The members of the developer’s field team were not allowed to take any part of the demonstration samples with them when they left the demonstration site.
Samples that were not in the possession of the developer’s field team during the demonstration were held in a secure storage room adjacent to the demonstration work area (see Figure 3-5). The storage room was closed and locked except when the observer retrieved samples from the room. Samples were stored at room temperature during the demonstration, in accordance with the quality assurance/quality control (QA/QC) requirements established for the project.
Figure 3-5. Sample storage room.
3.3.5 Data Management
Each of the developer’s field teams was able to complete analysis of all 326 samples during the field demonstration (or during the subsequent week, in one case when the developer’s field team arrived late at the demonstration site because of delays in international travel). The data produced by each developer’s field team were submitted during or at the end of the field demonstration in a standard Microsoft Excel® spreadsheet. (The EPA/Tetra Tech field team had provided a template.) Since each instrument provided data in a different format, the developer’s field team was responsible for reducing the data before they were submitted and for transferring the data into the Excel spreadsheet.
The observer reviewed each data submittal for completeness, and the data were then uploaded into a master Excel spreadsheet on a laptop computer for temporary storage. Only the EPA/Tetra Tech field team had access to the master Excel spreadsheet during the field demonstration.
Once the EPA/Tetra Tech field team returned to their offices, the demonstration data were transferred to an Microsoft Access® database for permanent storage. Each developer’s data, as they existed in the Access database, were then provided to the developer for review. Any errors the developers identified were corrected, and the database was then finalized. All statistical analysis and data evaluation took place on this final database.

__________________________________________________________________________________
23
Chapter 4
Evaluation Design This chapter presents the approach for evaluating the performance of the XRF instruments. Specifically, the sections below describe the objectives of the evaluation and the experimental design.
The Demonstration and Quality Assurance Project Plan (Tetra Tech 2005) provides additional details on the overall demonstration approach. However, some deviations from the plan, involving data evaluation and laboratory audits, occurred after the demonstration plan was written. For completeness, the primary changes to the written plan are documented in the final section of this chapter.
4.1 Evaluation Objectives
The overall purpose of the XRF technology demonstration was to evaluate the performance of various field XRF instruments in detecting and quantifying trace elements in soils and sediments from a variety of sites around the U.S. The performance of each XRF instrument was evaluated in accordance with primary and secondary objectives. Primary objectives are critical to the evaluation and require the use of quantitative results to draw conclusions about an instrument’s performance. Secondary objectives pertain to information that is useful but that will not necessarily require use of quantitative results to draw conclusions about an instrument’s performance.
The primary and secondary objectives for the evaluation are listed in Table 4-1. These objectives were based on:
• Input from MMT Program stakeholders, including developers and EPA staff.
• General expectations of users of field measurement instruments.
• The time available to complete the demonstration.
• The capabilities of the instruments that the developers participating in the demonstration intended to highlight.
4.2 Experimental Design
To address the first four primary objectives, each XRF instrument analyzed the demonstration sample set for the 13 target elements. The demonstration samples originated from multiple sampling locations across the country, as described in Chapter 2, to provide a diverse set of soil and sediment matrices. The demonstration sample set included both blended environmental samples and spiked background samples, as described in Chapter 3, to provide a wide range of concentrations and combinations of elements.
When the field demonstration was completed, the results obtained using the XRF instruments were compared with data from a reference laboratory to evaluate the performance of each instrument in terms of accuracy and comparability (Primary Objective 2). The results for replicate samples were used to evaluate precision in various concentration ranges (Primary Objective 3) and the method detection limits (MDL) (Primary Objective 1). Each of these quantitative evaluations of instrument performance was carried out for each target element. The effect of chemical and spectral interferences and of soil characteristics (Primary Objectives 4 and 5) were evaluated to help explain extreme deviations or outliers observed in the XRF results when compared with the reference laboratory results. A second important comparison involved the average performance of all eight XRF instruments that participated in the demonstration. For the first three primary objectives (MDL, accuracy, precision), the performance of each individual instrument was compared to the overall average performance of all eight instruments. Where the result of the instrument under consideration was less than 10 percent different than the average result for all eight instruments, the result was considered “equivalent.” A similar comparison was conducted with respect to cost (Primary Objective 7). These comparisons were

__________________________________________________________________________________
24
intended to illustrate the performance of each XRF instrument in relation to its peers. The evaluation design for meeting each objective, including data analysis procedures, is discussed in more detail in the sections below. Where specific deviations from these procedures were necessary for the data set associated with specific instruments, these deviations are described as part of the performance evaluation in Chapter 7.
4.2.1 Primary Objective 1 — Method Detection Limits
The MDL for each target element was evaluated based on the analysis of sets of seven replicate samples that contained the target element at concentrations near the detection limit. The MDL was calculated using the procedures found in Title 40
Code of Federal Regulations (CFR) Part 136, Appendix B, Revision 1.11. The following equation was used:
MDL = t(n-1,1-α=0.99)(s) where
MDL = method detection limit t = Student’s t value for a 99
percent confidence level and a standard deviation estimate with n-1 degrees of freedom
n = number of samples s = standard deviation.
Table 4-1. Evaluation Objectives
Objective Description
Primary Objective 1 Determine the MDL for each target element.
Primary Objective 2 Evaluate the accuracy and comparability of the XRF measurement to the results of laboratory reference methods for a variety of contaminated soil and sediment samples.
Primary Objective 3 Evaluate the precision of XRF measurements for a variety of contaminated soil and sediment samples.
Primary Objective 4 Evaluate the effect of chemical and spectral interference on measurement of target elements.
Primary Objective 5 Evaluate the effect of soil characteristics on measurement of target elements.
Primary Objective 6 Measure sample throughput for the measurement of target elements under field conditions.
Primary Objective 7 Estimate the costs associated with XRF field measurements.
Secondary Objective 1 Document the skills and training required to properly operate the instrument.
Secondary Objective 2 Document health and safety concerns associated with operating the instrument.
Secondary Objective 3 Document the portability of the instrument.
Secondary Objective 4 Evaluate the instrument’s durability based on its materials of construction and engineering design.
Secondary Objective 5 Document the availability of the instrument and of associated customer technical support.
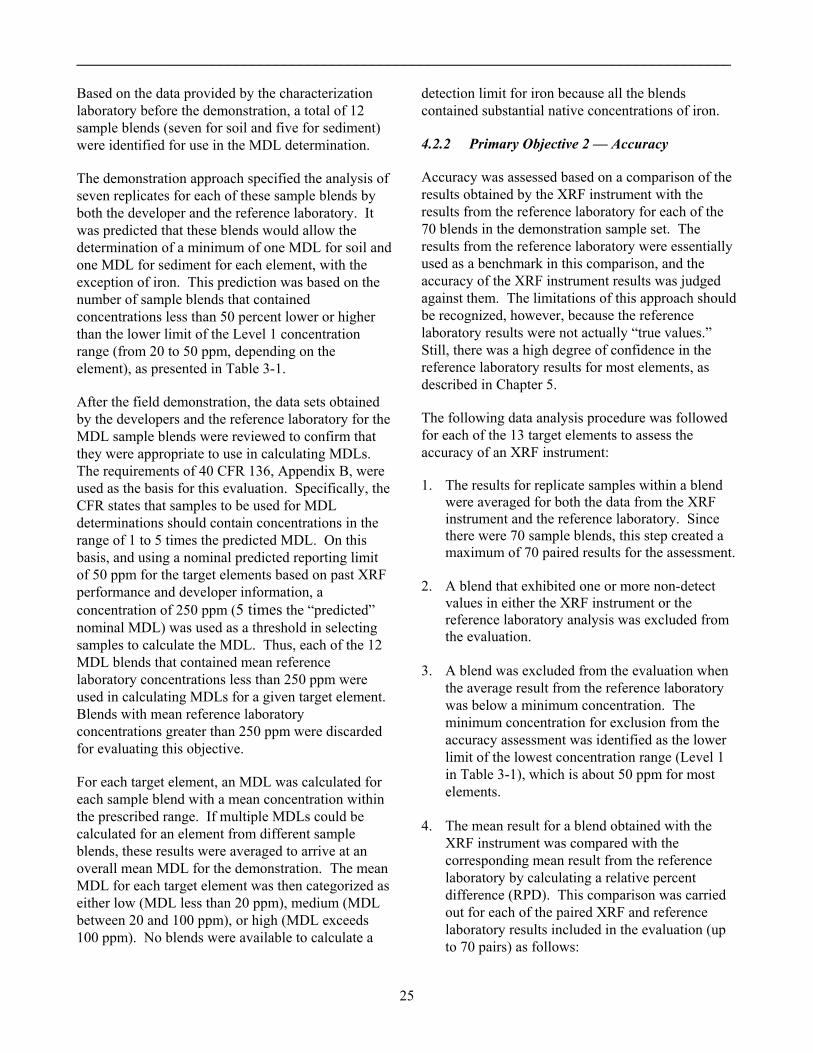
__________________________________________________________________________________
25
Based on the data provided by the characterization laboratory before the demonstration, a total of 12 sample blends (seven for soil and five for sediment) were identified for use in the MDL determination.
The demonstration approach specified the analysis of seven replicates for each of these sample blends by both the developer and the reference laboratory. It was predicted that these blends would allow the determination of a minimum of one MDL for soil and one MDL for sediment for each element, with the exception of iron. This prediction was based on the number of sample blends that contained concentrations less than 50 percent lower or higher than the lower limit of the Level 1 concentration range (from 20 to 50 ppm, depending on the element), as presented in Table 3-1.
After the field demonstration, the data sets obtained by the developers and the reference laboratory for the MDL sample blends were reviewed to confirm that they were appropriate to use in calculating MDLs. The requirements of 40 CFR 136, Appendix B, were used as the basis for this evaluation. Specifically, the CFR states that samples to be used for MDL determinations should contain concentrations in the range of 1 to 5 times the predicted MDL. On this basis, and using a nominal predicted reporting limit of 50 ppm for the target elements based on past XRF performance and developer information, a concentration of 250 ppm (5 times the “predicted” nominal MDL) was used as a threshold in selecting samples to calculate the MDL. Thus, each of the 12 MDL blends that contained mean reference laboratory concentrations less than 250 ppm were used in calculating MDLs for a given target element. Blends with mean reference laboratory concentrations greater than 250 ppm were discarded for evaluating this objective.
For each target element, an MDL was calculated for each sample blend with a mean concentration within the prescribed range. If multiple MDLs could be calculated for an element from different sample blends, these results were averaged to arrive at an overall mean MDL for the demonstration. The mean MDL for each target element was then categorized as either low (MDL less than 20 ppm), medium (MDL between 20 and 100 ppm), or high (MDL exceeds 100 ppm). No blends were available to calculate a
detection limit for iron because all the blends contained substantial native concentrations of iron.
4.2.2 Primary Objective 2 — Accuracy
Accuracy was assessed based on a comparison of the results obtained by the XRF instrument with the results from the reference laboratory for each of the 70 blends in the demonstration sample set. The results from the reference laboratory were essentially used as a benchmark in this comparison, and the accuracy of the XRF instrument results was judged against them. The limitations of this approach should be recognized, however, because the reference laboratory results were not actually “true values.” Still, there was a high degree of confidence in the reference laboratory results for most elements, as described in Chapter 5.
The following data analysis procedure was followed for each of the 13 target elements to assess the accuracy of an XRF instrument:
1. The results for replicate samples within a blend were averaged for both the data from the XRF instrument and the reference laboratory. Since there were 70 sample blends, this step created a maximum of 70 paired results for the assessment.
2. A blend that exhibited one or more non-detect
values in either the XRF instrument or the reference laboratory analysis was excluded from the evaluation.
3. A blend was excluded from the evaluation when
the average result from the reference laboratory was below a minimum concentration. The minimum concentration for exclusion from the accuracy assessment was identified as the lower limit of the lowest concentration range (Level 1 in Table 3-1), which is about 50 ppm for most elements.
4. The mean result for a blend obtained with the
XRF instrument was compared with the corresponding mean result from the reference laboratory by calculating a relative percent difference (RPD). This comparison was carried out for each of the paired XRF and reference laboratory results included in the evaluation (up to 70 pairs) as follows:
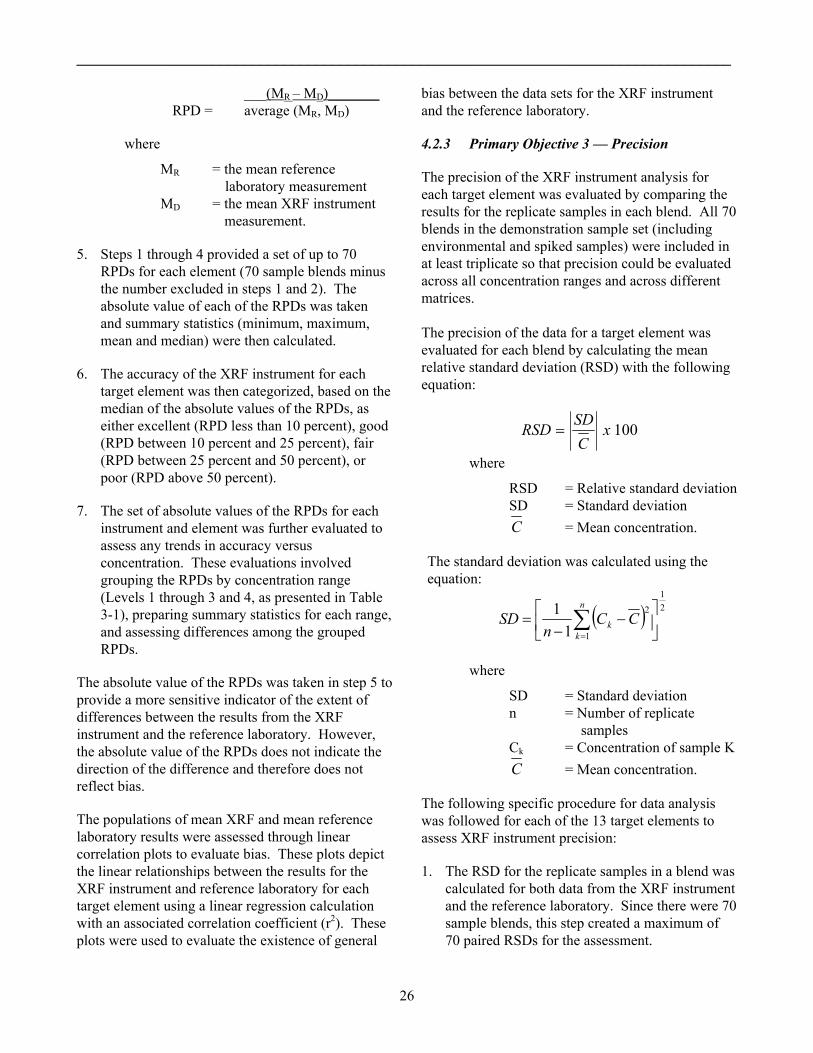
__________________________________________________________________________________
26
___(MR – MD)_______ RPD = average (MR, MD)
where
MR = the mean reference laboratory measurement
MD = the mean XRF instrument measurement.
5. Steps 1 through 4 provided a set of up to 70 RPDs for each element (70 sample blends minus the number excluded in steps 1 and 2). The absolute value of each of the RPDs was taken and summary statistics (minimum, maximum, mean and median) were then calculated.
6. The accuracy of the XRF instrument for each target element was then categorized, based on the median of the absolute values of the RPDs, as either excellent (RPD less than 10 percent), good (RPD between 10 percent and 25 percent), fair (RPD between 25 percent and 50 percent), or poor (RPD above 50 percent).
7. The set of absolute values of the RPDs for each instrument and element was further evaluated to assess any trends in accuracy versus concentration. These evaluations involved grouping the RPDs by concentration range (Levels 1 through 3 and 4, as presented in Table 3-1), preparing summary statistics for each range, and assessing differences among the grouped RPDs.
The absolute value of the RPDs was taken in step 5 to provide a more sensitive indicator of the extent of differences between the results from the XRF instrument and the reference laboratory. However, the absolute value of the RPDs does not indicate the direction of the difference and therefore does not reflect bias.
The populations of mean XRF and mean reference laboratory results were assessed through linear correlation plots to evaluate bias. These plots depict the linear relationships between the results for the XRF instrument and reference laboratory for each target element using a linear regression calculation with an associated correlation coefficient (r2). These plots were used to evaluate the existence of general
bias between the data sets for the XRF instrument and the reference laboratory.
4.2.3 Primary Objective 3 — Precision
The precision of the XRF instrument analysis for each target element was evaluated by comparing the results for the replicate samples in each blend. All 70 blends in the demonstration sample set (including environmental and spiked samples) were included in at least triplicate so that precision could be evaluated across all concentration ranges and across different matrices. The precision of the data for a target element was evaluated for each blend by calculating the mean relative standard deviation (RSD) with the following equation:
100xCSDRSD =
where
RSD = Relative standard deviation SD = Standard deviation C = Mean concentration.
The standard deviation was calculated using the equation:
( ) 21
1
2
11
−
−= ∑
=
n
kk CC
nSD
where
SD = Standard deviation n = Number of replicate
samples Ck = Concentration of sample K C = Mean concentration.
The following specific procedure for data analysis was followed for each of the 13 target elements to assess XRF instrument precision:
1. The RSD for the replicate samples in a blend was calculated for both data from the XRF instrument and the reference laboratory. Since there were 70 sample blends, this step created a maximum of 70 paired RSDs for the assessment.
__________________________________________________________________________________
27
2. A blend that exhibited one or more non-detect values in either the XRF or the reference laboratory analysis was excluded from the evaluation.
3. A blend was excluded from the evaluation when the average result from the reference laboratory was below a minimum concentration. The minimum concentration for exclusion from the precision assessment was identified as the lower limit of the lowest concentration range (Level 1 in Table 3-1), which was about 50 ppm for most elements.
4. The RSDs for the various blends for both the XRF instrument and the reference laboratory were treated as a statistical population. Summary statistics (minimum, maximum, mean and median) were then calculated and compared for the data set as a whole and for the different concentration ranges (Levels 1 through 3 or 4).
5. The precision of the XRF instrument for each target element was then categorized, based on the median RSDs, as either excellent (RSD less than 5 percent), good (RSD between 5 percent and 10 percent), fair (RSD between 10 percent and 20 percent), or poor (RSD above 20 percent).
One primary evaluation was a comparison of the mean RSD for each target element between the XRF instrument and the reference laboratory. Using this comparison, the precision of the XRF instrument could be evaluated against the precision of accepted fixed-laboratory methods. Another primary evaluation was a comparison of the mean RSD for each target element between the XRF instrument and the overall average of all XRF instruments. Using this comparison, the precision of the XRF instrument could be evaluated against its peers.
4.2.4 Primary Objective 4 — Impact of Chemical and Spectral Interferences
The potential in the XRF analysis for spectral interference between adjacent elements on the periodic table was evaluated for the following element pairs: lead/arsenic, nickel/copper, and copper/zinc. The demonstration sample set included multiple blends where the concentration of one of
these elements was greater than 10 times the concentration of the other element in the pair to facilitate this evaluation. Interference effects were identified through evaluation of the RPDs for these sample blends, which were calculated according to the equation in Section 4.2.2, since spectral interferences would occur only in the XRF data and not in the reference laboratory data.
Summary statistics for RPDs (mean, median, minimum, and maximum) were calculated for each potentially affected element for the sample blends with high relative concentrations (greater than 10 times) of the potentially interfering element. These summary statistics were compared with the RPD statistics for sample blends with lower concentrations of the interfering element. It was reasoned that spectral interference should be directly reflected in increased RPDs for the interference samples when compared with the rest of the demonstration sample set.
In addition to spectral interferences (caused by overlap of neighboring spectral peaks), the data sets were assessed for indications of chemical interferences. Chemical interferences occur when the x-rays characteristic of an element are absorbed or emitted by another element within the sample, causing low or high bias. These interferences are common in samples that contain high levels of iron, where low biases for copper and high biases for chromium can result. The evaluations for Primary Objective 4 therefore included RPD comparisons between sample blends with high concentrations of iron (more than 50,000 ppm) and other sample blends. These RPD comparisons were performed for the specific target elements of interest (copper, chromium, and others) to assess chemical interferences from iron. Outliers and subpopulations in the RPD data sets for specific target elements, as identified through graphical means (probability plots and box plots), were also examined for potential interference effects.
The software that is included with many XRF instruments can correct for chemical interferences. The results of this evaluation were intended to differentiate the instruments that incorporated effective software for addressing chemical interferences.
__________________________________________________________________________________
28
4.2.5 Primary Objective 5 — Effects of Soil Characteristics
The demonstration sample set included soil and sediment samples from nine locations across the U.S. and a corresponding variety of soil types and lithologies. The accuracy and precision statistics (RPD and RSD) were grouped by soil type (sample location) and the groups were compared to assess the effects of soil characteristics. Outliers and subpopulations in the RPD data sets, as identified through graphical means (correlation plots and box plots), were also examined for matrix effects.
4.2.6 Primary Objective 6 — Sample Throughput
Sample throughput is a calculation of the total number of samples that can be analyzed in a specified time. The primary factors that affect sample throughput are the time required to prepare a sample for analysis, to conduct the analytical procedure for each sample, and to process and tabulate the resulting data. The time required to prepare and to analyze demonstration samples was recorded each day that demonstration samples were analyzed.
Sample throughput can also be affected by the time required to set up and calibrate the instrument as well as the time required for quality control. The time required to perform these activities was also recorded during the field demonstration.
An overall mean processing time per sample and an overall sample throughput rate was calculated based on the total time required to complete the analysis of the demonstration sample set from initial instrument setup through data reporting. The overall mean processing time per sample was then used as the primary basis for comparative evaluations.
4.2.7 Primary Objective 7 — Technology Costs
The costs for analysis are an important factor in the evaluation and include the cost for the instrument, analytical supplies, and labor. The observer collected information on each of these costs during the field demonstration.
Based on input from each technology developer and from distributors, the instrument cost was established for purchase of the equipment and for daily, weekly,
and monthly rental. Some of the technologies are not yet widely available, and the developer has not established rental options. In these cases, an estimated weekly rental cost was derived for the summary cost evaluations based on the purchase price for the instrument and typical rental to purchase price ratios for similar instruments. The costs associated with leasing agreements were also specified in the report, if available.
Analytical supplies include sample cups, spoons, x-ray film, Mylar®, reagents, and personal protective equipment. The rate that the supplies are consumed was monitored and recorded during the field demonstration. The cost of analytical supplies was estimated per sample from these consumption data and information on unit costs.
Labor includes the time required to prepare and analyze the samples and to set up and dismantle the equipment. The labor hours associated with preparing and analyzing samples and with setting up and dismantling the equipment were recorded during the demonstration. The labor costs were calculated based on this information and typical labor rates for a skilled technician or chemist.
In addition to the assessment of the above-described individual cost components, an overall cost for a field effort similar to the demonstration was compiled and compared to the cost of fixed laboratory analysis. The results of the cost evaluation are presented in Chapter 8.
4.2.8 Secondary Objective 1 — Training Requirements
Each XRF instrument requires that the operator be trained to safely set up and operate the instrument. The relative level of education and experience that is appropriate to operate the XRF instrument was assessed during the field demonstration.
The amount of specific training required depends on the complexity of the instrument and the associated software. Most developers have established training programs. The time required to complete the developer’s training program was estimated and the content of the training was identified.

__________________________________________________________________________________
29
4.2.9 Secondary Objective 2 — Health and Safety
The health and safety requirements for operation of the instrument were identified, including any that are associated with potential exposure from radiation and to reagents. Not included in the evaluation were potential risks from exposure to site-specific hazardous materials or physical safety hazards associated with the demonstration site.
4.2.10 Secondary Objective 3 — Portability
The portability of the instrument depends on size, weight, number of components, power requirements, and reagents required. The size of the instrument, including physical dimensions and weight, was recorded (see Chapter 6). The number of components, power requirements, support structures, and reagent requirements were also recorded. A qualitative assessment of portability was conducted based on this information.
4.2.11 Secondary Objective 4 — Durability
The durability of the instrument was evaluated by gathering information on the warranty and expected lifespan of the radioactive source or x-ray tube. The ability to upgrade software or hardware also was evaluated. Weather resistance was evaluated if the instrument is intended for use outdoors by examining the instrument for exposed electrical connections and openings that may allow water to penetrate.
4.2.12 Secondary Objective 5 — Availability
The availability of the instrument from the developer, distributors, and rental agencies was documented. The availability of replacement parts and instrument-specific supplies was also noted.
4.3 Deviations from the Demonstration Plan
Although the field demonstration and subsequent data evaluations generally followed the Demonstration and Quality Assurance Project Plan (Tetra Tech 2005), there were some deviations as new information was uncovered or as the procedures were reassessed while the plan was executed. These deviations are documented below for completeness and as a supplement to the demonstration plan:
1. An in-process audit of the reference laboratory was originally planned while the laboratory was analyzing the demonstration samples. However, the reference laboratory completed all analysis earlier than expected, during the week of the field demonstration, and thereby created a schedule conflict. Furthermore, it was decided that the original pre-award audit was adequate for assessing the laboratory’s procedures and competence.
2. The plan suggested that each result for spiked samples from the reference laboratory would be replaced by the “certified analysis” result, which was quantitative based on the amount of each element spiked, whenever the RPD between these two results was greater than 10 percent. The project team agreed that 10 percent was too stringent for this evaluation, however, and decided to use 25 percent RPD as the criterion for assessing reference laboratory accuracy against the spiked samples. Furthermore, it was found during the data evaluations that replacing individual reference laboratory results using this criterion would result in a mixed data set. Therefore, the 25 percent criterion was applied to the overall mean RPD for each element, and the “certified analysis” data set for a specific target element was used as a supplement to the reference laboratory result when this criterion was exceeded.
3. Instrument accuracy and comparability in relation to the reference laboratory (Primary Objective 2) was originally planned to be assessed based on a combination of percent recovery (instrument result divided by reference laboratory result) and RPD. It was decided during the data analysis, however, that the RPD was a much better parameter for this assessment. Specifically, it was found that the mean or median of the absolute values of the RPD for each blend was a good discriminator of instrument performance for this objective.
4. Although this step was not described in the plan, some quantitative results for each instrument were compared with the overall average of all XRF instruments. Since there were eight instruments, it was believed that a comparison of

__________________________________________________________________________________
30
this type did not violate EPA’s agreement with the technology developers that one instrument would not be compared with another. Furthermore, this comparison provides an easy-to-understand basis for assessing instrument performance.
5. The plan proposed statistical testing in support of Primary Objectives 4 and 5. Specifically, the Wilcoxon Rank Sum (WRS) test was proposed to assist in evaluating interference effects, and the
Rosner outlier test was proposed in evaluating other matrix effects on XRF data quality (EPA 2000; Gilbert 1987). However, these statistical tests were not able to offer any substantive performance information over and above the evaluations based on RPDs and regression plots because of the limited sample numbers and scatter in the data. On this basis, the use of these two statistical tests was not further explored or presented.

_______________________________________________________________________________________
31
Chapter 5
Reference Laboratory
As described in Chapter 4, a critical part of the evaluation was the comparison of the results obtained for the demonstration sample set by the XRF instrument with the results obtained by a fixed laboratory (the reference laboratory) using conventional analytical methods. Therefore, a significant effort was undertaken to ensure that data of the highest quality were obtained as the reference data for this demonstration. This effort included three main activities:
• Selection of the most appropriate methods for obtaining reference data,,
• Selection of a high-quality reference laboratory, and
• Validation of reference laboratory data and evaluation of QA/QC results.
This chapter describes the information that confirms the validity, reliability, and usability of the reference laboratory data based on each of the three activities listed above (Sections 5.1, 5.2, and 5.3). Finally, this chapter presents conclusions (Section 5.4) on the level of data quality and the usability of the data obtained by the reference laboratory.
5.1 Selection of Reference Methods
Methods for analysis of elements in environmental samples, including soils and sediments, are well established in the environmental laboratory industry. Furthermore, analytical methods appropriate for soil and sediment samples have been promulgated by EPA in the compendium of methods, Test Methods for Evaluating Solid Waste, Physical/Chemical Methods (SW-846) (EPA 1996c). Therefore, the methods selected as reference methods for the demonstration were the SW-846 methods most typically applied by environmental laboratories to soil and sediment samples, as follows:
• Inductively coupled plasma-atomic emission spectroscopy (ICP-AES), in accordance with
EPA SW-846 Method 3050B/6010B, for all target elements except mercury.
• Cold vapor atomic absorption (CVAA) spectroscopy, in accordance with EPA SW-846 Method 7471A, for mercury only.
Selection of these analytical methods for the demonstration was supported by the following additional considerations: (1) the methods are widely available and widely used in current site characterizations, remedial investigations, risk assessments, and remedial actions; (2) substantial historical data are available for these methods to document that their accuracy and precision are adequate to meet the objectives of the demonstration; (3) these methods have been used extensively in other EPA investigations where confirmatory data were compared with XRF data; and (4) highly sensitive alternative methods were less suitable given the broad range of concentrations that were inherent in the demonstration sample set. Specific details on the selection of each method are presented below.
Element Analysis by ICP-AES. Method 6010B (ICP-AES) was selected for 12 of the target elements because its demonstrated accuracy and precision meet the requirements of the XRF demonstration in the most cost-effective manner. The ICP-AES method is available at most environmental laboratories and substantial data exist to support the claim that the method is both accurate and precise enough to meet the objectives of the demonstration.
Inductively coupled plasma-mass spectrometry (ICP-MS) was considered as a possible analytical technique; however, fewer data were available to support the claims of accuracy and precision. Furthermore, it was available in less than one-third of the laboratories solicited for this project. Finally, ICP-MS is a technique for analysis of trace elements and often requires serial dilutions to mitigate the effect of high concentrations of interfering ions or other matrix interferences. These dilutions can introduce the possibility of error and contaminants that might bias the results. Since the matrices (soil

__________________________________________________________________________________
32
and sediment) for this demonstration are designed to contain high concentrations of elements and interfering ions, ICP-AES was selected over ICP-MS as the instrumental method best suited to meet the project objectives. The cost per analysis is also higher for ICP-MS in most cases than for ICP-AES.
Soil/Sediment Sample Preparation by Acid Digestion. The elements in soil and sediment samples must be dissolved from the matrix into an aqueous solution by acid digestion before analysis by ICP-AES. Method 3050B was selected as the preparation method and involves digestion of the matrix using a combination of nitric and hydrochloric acids, with the addition of hydrogen peroxide to assist in degrading organic matter in the samples. Method 3050B was selected as the reference preparation method because extensive data are available that suggest it efficiently dissolves most elements, as required for good overall recoveries and method accuracy. Furthermore, this method was selected over other digestion procedures because it is the most widely used dissolution method. In addition, it has been used extensively as the digestion procedure in EPA investigations where confirmatory data were compared with XRF data.
The ideal preparation reference method would completely digest silicaceous minerals. However, total digestion is difficult and expensive and is therefore seldom used in environmental analysis. More common strong acid-based extractions, like that used by EPA Method 3050B, recover most of the heavy element content. In addition, stronger and more vigorous digestions may produce two possible drawbacks: (1) loss of elements through volatilization, and (2) increased dissolution of interfering species, which may result in inaccurate concentration values.
Method 3052 (microwave-assisted digestion) was considered as an alternative to Method 3050B, but was not selected because it is not as readily available in environmental laboratories.
Soil/Sediment Sample Preparation for Analysis of Mercury by CVAA. Method 7471A (CVAA) is the only method approved by EPA and promulgated for analysis of mercury. Method 7471A includes its own digestion procedure because more vigorous digestion
of samples, like that incorporated in Method 3050B, would volatilize mercury and produce inaccurate results. This technique is widely available, and extensive data are available that support the ability of this method to meet the objectives of the demonstration.
5.2 Selection of Reference Laboratory
The second critical step in ensuring high-quality reference data was selection of a reference laboratory with proven credentials and quality systems. The reference laboratory was procured via a competitive bid process. The procurement process involved three stages of selection: (1) a technical proposal, (2) an analysis of performance audit samples, and (3) an on-site laboratory technical systems audit (TSA). Each stage was evaluated by the project chemist and a procurement specialist.
In Stage 1, 12 analytical laboratories from across the U.S. were invited to bid by submitting extensive technical proposals. The technical proposals included:
• A current statement of qualifications.
• The laboratory quality assurance manual.
• Standard operating procedures (SOP) (including sample receipt, laboratory information management, sample preparation, and analysis of elements).
• Current instrument lists.
• Results of recent analysis of performance evaluation samples and audits.
• Method detection limit studies for the target elements.
• Professional references, laboratory personnel experience, and unit prices.
Nine of the 12 laboratories submitted formal written proposals. The proposals were scored based on technical merit and price, and a short list of five laboratories was identified. The scoring was weighed heavier for technical merit than for price. The five laboratories that received the highest score were advanced to stage 2.

__________________________________________________________________________________
33
In stage 2, each of the laboratories was provided with a set of six samples to analyze. The samples consisted of three certified reference materials (one soil and two sediment samples) at custom spiking concentrations, as well as three pre-demonstration soil samples. The results received from each laboratory were reviewed and assessed. Scoring at this stage was based on precision (reproducibility of results for the three pre-demonstration samples), accuracy (comparison of results to certified values for the certified reference materials), and completeness of the data package (including the hard copy and electronic data deliverables). The two laboratories that received the highest score were advanced to stage 3.
In stage 3, the two candidate laboratories were subjected to a thorough on-site TSA by the project chemist. The audit consisted of a direct comparison of the technical proposal to the actual laboratory procedures and conditions. The audit also tracked the pre-demonstration samples through the laboratory processes from sample receipt to results reporting. When the audit was conducted, the project chemist verified sample preparation and analysis for the three pre-demonstration samples. Each laboratory was scored on identical checklists.
The reference laboratory was selected based on the highest overall score. The weights of the final scoring selection were as follows:
Scoring Element Relative Importance
Audits (on site) 40% Performance evaluation samples, including data package and electronic data deliverable
50%
Price 10% Based on the results of the evaluation process, Shealy Environmental Services, Inc. (Shealy), of Cayce, South Carolina, received the highest score and was therefore selected as the reference laboratory. Shealy is accredited by the National Environmental Laboratory Accreditation Conference (NELAC). Once selected, Shealy analyzed all demonstration samples (both environmental and spiked samples) concurrently with the developers’ analysis during the field demonstration. Shealy analyzed the samples by
ICP-AES using EPA SW-846 Method 3050B/6010B and by CVAA using EPA SW-846 Method 7471A.
5.3 QA/QC Results for Reference Laboratory
All data and QC results from the reference laboratory were reviewed in detail to determine that the reference laboratory data were of sufficiently high quality for the evaluation. Data validation of all reference laboratory results was the primary review tool that established the level of quality for the data set (Section 5.3.1). Additional reviews included the on-site TSA (Section 5.3.2) and other evaluations (Section 5.3.3).
5.3.1 Reference Laboratory Data Validation
After all demonstration samples had been analyzed, reference data from Shealy were fully validated according to the EPA validation document, USEPA Contract Laboratory Program National Functional Guidelines for Inorganic Data Review (EPA 2004c) as required by the Demonstration and Quality Assurance Project Plan (Tetra Tech 2005). The reference laboratory measured 13 target elements, including antimony, arsenic, cadmium, chromium, copper, iron, lead, mercury, nickel, selenium, silver, vanadium, and zinc. The reference laboratory reported results for 22 elements at the request of EPA; however, only the data for the 13 target elements were validated and included in data comparisons for meeting project objectives. A complete summary of the validation findings for the reference laboratory data is presented in Appendix C.
In the data validation process, results for QC samples were reviewed for conformance with the acceptance criteria established in the demonstration plan. Based on the validation criteria specified in the demonstration plan, all reference laboratory data were declared valid (were not rejected). Thus, the completeness of the data set was 100 percent. Accuracy and precision goals were met for most of the QC samples, as were the criteria for comparability, representativeness, and sensitivity. Thus, all reference laboratory data were deemed usable for comparison to the data obtained by the XRF instruments.
__________________________________________________________________________________
34
Only a small percentage of the reference laboratory data set was qualified as undetected as a result of blank contamination (3.3 percent) and estimated because of matrix spike and matrix spike duplicate (MS/MSD) recoveries (8.7 percent) and serial dilutions results (2.5 percent). Table 5.1 summarizes the number of validation qualifiers applied to the reference laboratory data according to QC type. Of the three QC types, only the MS/MSD recoveries warranted additional evaluation. The MS/MSD recoveries for antimony were marginally low (average recovery of 70.8 percent) when compared with the QC criterion of 75 to 125 percent recovery. It was concluded that low recoveries for antimony are common in analysis of soil and sediment by the prescribed methods and likely result from volatilization during the vigorous acid digestion process or spectral interferences found in soil and sediments matrices (or both). In comparison to antimony, high or low recoveries were observed only on an isolated basis for the other target metals (for example, lead and mercury) such that the mean and median percent recoveries were well within the required range. Therefore, the project team decided to evaluate the XRF data against the reference laboratory data for all 13 target elements and to evaluate the XRF data a second time against the ERA certified spike values for antimony only. These comparisons are discussed in Section 7.1. However, based on the validation of the complete reference data set and the low occurrence of qualified data, the reference laboratory data set as a whole was declared of high quality and of sufficient quality to make valid comparisons to XRF data.
5.3.2 Reference Laboratory Technical Systems Audit
The TSA of the Shealy laboratory was conducted by the project chemist on October 19, 2004, as part of the selection process for the reference laboratory. The audit included the review of element analysis practices (including sample preparation) for 12 elements by EPA Methods 3050B and 6010B and for total mercury by EPA Method 7471A. All decision-making personnel for Shealy were present during the TSA, including the laboratory director, QA officer, director of inorganics analysis, and the inorganics laboratory supervisor.
Project-specific requirements were reviewed with the Shealy project team as were all the QA criteria and reporting requirements in the demonstration plan. It was specifically noted that the demonstration samples would be dried, ground, and sieved before they were submitted to the laboratory, and that the samples would be received with no preservation required (specifically, no chemical preservation and no ice). The results of the performance audit were also reviewed.
No findings or nonconformances that would adversely affect data quality were noted. Only two minor observations were noted; these related to the revision dates of two SOPs. Both observations were discussed at the debriefing meeting held at the laboratory after the TSA. Written responses to each of the observations were not required; however, the laboratory resolved these issues before the project was awarded. The auditor concluded that Shealy complied with the demonstration plan and its own SOPs, and that data generated at the laboratory should be of sufficient and known quality to be used as a reference for the XRF demonstration.
5.3.3 Other Reference Laboratory Data Evaluations
The data validation indicated that all results from the reference laboratory were valid and usable for comparison to XRF data, and the pre-demonstration TSA indicated that the laboratory could fully comply with the requirements of the demonstration plan for producing data of high quality. However, the reference laboratory data were evaluated in other ways to support the claim that reference laboratory data are of high quality. These evaluations included the (1) assessment of accuracy based on ERA-certified spike values, (2) assessment of precision based on replicate measurements within the same sample blend, and (3) comparison of reference laboratory data to the initial characterization data that was obtained when the blends were prepared. Each of these evaluations is briefly discussed in the following paragraphs.
Blends 46 through 70 of the demonstration sample set consisted of certified spiked samples that were used to assess the accuracy of the reference laboratory data. The summary statistics from

__________________________________________________________________________________
35
comparing the “certified values” for the spiked samples with the reference laboratory results are shown in Table 5-2. The target for percent recovery was 75 to 125 percent. The mean percent recoveries for 12 of the 13 target elements were well within this accuracy goal. Only the mean recovery for antimony was outside the goal (26.8 percent). The low mean percent recovery for antimony supported the recommendation made by the project team to conduct
a secondary comparison of XRF data to ERA-certified spike values for antimony. This secondary evaluation was intended to better understand the impacts on the evaluation of the low bias for antimony in the reference laboratory data. All other recoveries were acceptable. Thus, this evaluation further supports the conclusion that the reference data set is of high quality.
Table 5-1. Number of Validation Qualifiers.
Number and Percentage of Qualified Results per QC type 1
Method Blank MS/MSD Serial Dilution Element Number Percent2 Number Percent2 Number Percent2
Antimony 5 1.5 199 61.0 8 2.4 Arsenic 12 3.7 3 0.9 10 3.1 Cadmium 13 4.0 0 0 6 1.8 Chromium 0 0 0 0 10 3.1 Copper 1 0.3 0 0 8 2.4 Iron 0 0 0 0 10 3.1 Lead 0 0 34 10.5 11 3.4 Mercury 68 20.9 31 9.5 4 1.2 Nickel 0 0 0 0 10 3.1 Selenium 16 4.9 0 0 3 0.9 Silver 22 6.7 102 31.3 7 2.1 Vanadium 0 0 0 0 9 2.8 Zinc 1 0.3 0 0 10 3.1 Totals 138 3.3 369 8.7 106 2.5
Notes: MS Matrix spike. MSD Matrix spike duplicate. QC Quality control. 1 This table presents the number of “U” (undetected) and “J” (estimated) qualifiers added to the
reference laboratory data during data validation. Though so qualified, these results are considered usable for the demonstration. As is apparent in the “Totals” row at the bottom of this table, the amount of data that required qualifiers for any specific QC type was invariably less than 10 percent. No reference laboratory data were rejected (that is, qualified “R”) during the data validation.
2 Percents for individual elements are calculated based on 326 results per element. Total percents at the bottom of the table are calculated based on the total number of results for all elements (4,238).

__________________________________________________________________________________
36
All blends (1 through 70) were prepared and delivered with multiple replicates. To assess precision, percent RSDs were calculated for the replicate sample results submitted by the reference laboratory for each of the 70 blends. Table 5-3 presents the summary statistics for the reference laboratory data for each of the 13 target elements. These summary statistics indicate good precision in that the median percent RSD was less than 10 percent for 11 out of 13 target elements (and the median RSD for the other two elements was just above 10 percent). Thus, this evaluation further supports the conclusion that the reference data set is of high quality.
ARDL, in Mount Vernon, Illinois, was selected as the characterization laboratory to prepare environmental samples for the demonstration. As part of its work, ARDL analyzed several samples of each blend to evaluate whether the concentrations of the target elements and the homogeneity of the blends were suitable for the demonstration. ARDL analyzed the samples using the same methods as the reference laboratory; however, the data from the characterization laboratory were not validated and were not intended to be equivalent to the reference laboratory data. Rather, the intent was to use the results obtained by the characterization laboratory as an additional quality control check on the results from the reference laboratory.
A review of the ARDL characterization data in comparison to the reference laboratory data indicated that ARDL obtained lower recoveries of several elements. When expressed as a percent of the average reference laboratory result (percent recovery), the median ARDL result was below the lower QC limit of 75 percent recovery for three elements — chromium, nickel, and selenium. This discrepancy between data from the reference laboratory and ARDL was determined to have no significant impact on reference laboratory data
quality for three reasons: (1) the ARDL data were obtained on a rapid turnaround basis to evaluate homogeneity — accuracy was not a specific goal, (2) the ARDL data were not validated, and (3) all other quality measurement for the reference laboratory data indicated a high level of quality.
5.4 Summary of Data Quality and Usability
A significant effort was undertaken to ensure that data of high quality were obtained as the reference data for this demonstration. The reference laboratory data set was deemed valid, usable, and of high quality based on the following:
• Comprehensive selection process for the reference laboratory, with multiple levels of evaluation.
• No data were rejected during data validation and few data qualifiers were added.
• The observations noted during the reference laboratory audit were only minor in nature; no major findings or non-conformances were documented.
• Acceptable accuracy (except for antimony, as discussed in Section 5.3.3) of reference laboratory results in comparison to spiked certified values.
• Acceptable precision for the replicate samples in the demonstration sample set.
Based on the quality indications listed above, the reference laboratory data were used in the evaluation of XRF demonstration data. A second comparison was made between XRF data and certified values for antimony (in Blends 46 through 70) to address the low bias exhibited for antimony in the reference laboratory data.

___________________________________________________________________________________________________________
37
Table 5-2. Percent Recovery for Reference Laboratory Results in Comparison to ERA Certified Spike Values for Blends 46 through 70
Statistic Sb As Cd Cr Cu Fe Pb Hg Ni Se Ag V Zn Number of %R values 16 14 20 12 20 NC 12 15 16 23 20 15 10Minimum %R 12.0 65.3 78.3 75.3 51.7 NC 1.4 81.1 77.0 2.2 32.4 58.5 0.0Maximum %R 36.1 113.3 112.8 108.6 134.3 NC 97.2 243.8 116.2 114.2 100.0 103.7 95.2Mean %R1 26.8 88.7 90.0 94.3 92.1 NC 81.1 117.3 93.8 89.9 78.1 90.4 90.6Median %R1 28.3 90.1 87.3 97.3 91.3 NC 88.0 93.3 91.7 93.3 84.4 95.0 91.3
Notes: 1Values shown in bold fall outside the 75 to 125 percent acceptance criterion for percent recovery. ERA = Environmental Resource Associates, Inc. NC = Not calculated. %R = Percent recovery. Source of certified values: Environmental Resource Associates, Inc. Sb Antimony As Arsenic Cd Cadmium Cr Chromium Cu Copper Fe Iron Pb Lead Hg Mercury Ni Nickel Se Selenium Ag Silver V Vanadium Zn Zinc

___________________________________________________________________________________________________________
38
Table 5-3. Precision of Reference Laboratory Results for Blends 1 through 70
Statistic Sb As Cd Cr Cu Fe Pb Hg Ni Se Ag V Zn Number of %RSDs 43 69 43 69 70 70 69 62 68 35 44 69 70Minimum %RSD 1.90 0.00 0.91 1.43 0.00 1.55 0.00 0.00 0.00 0.00 1.02 0.00 0.99Maximum %RSD 78.99 139.85 40.95 136.99 45.73 46.22 150.03 152.59 44.88 37.30 54.21 43.52 48.68Mean %RSD1 17.29 13.79 12.13 11.87 10.62 10.56 14.52 16.93 10.28 13.24 12.87 9.80 10.94Median %RSD1 11.99 10.01 9.36 8.29 8.66 8.55 9.17 7.74 8.12 9.93 8.89 8.34 7.54 Notes: 1Values shown in bold fall outside precision criterion of less than or equal to 25 %RSD. %RSD = Percent relative standard deviation. Based on the three to seven replicate samples included in Blends 1 through 70. Sb Antimony As Arsenic Cd Cadmium Cr Chromium Cu Copper Fe Iron Pb Lead Hg Mercury Ni Nickel Se Selenium Ag Silver V Vanadium Zn Zinc

________________________________________________________________________________________
39
Chapter 6
Technology Description
The XLi 700 Series XRF analyzer is manufactured by NITON Analyzers, a division of Thermo Electron Corporation (Niton). This chapter provides a technical description of the XLi based on information obtained from Niton and obser-vation of this analyzer during the field demon-stration. This section also identifies a Niton company contact, where additional technical information may be obtained. 6.1 General Description The Niton XLi is a small, field–portable, isotope-based XRF instrument designed for chemical characterization of soils, sediment, and other thick homogeneous samples (plastics and metals). The XLi can be outfitted with various isotope options to best fit the environmental application needs of the customer. Niton offers the XLi with a 40 milliCurie (mCi) 109cadmium (Cd) source for standard elemental analysis of bulk materials. Up to 15 elements can be analyzed using the 109Cd source, including arsenic, chromium, copper, lead, mercury, and zinc. Optional isotope sources that can be fitted into the same analyzer are the 14 mCi 241americium (Am) source and the 20 mCi 55iron (Fe) source. The 241Am source permits analysis for five heavier elements: antimony, barium, cadmium, silver, and tin. The 55Fe isotope source permits analysis of four lighter elements: calcium, potassium, titanium, and vanadium. Niton also manufactures an XLi analyzer with a patented Infiniton isotope source for general analysis of up to 25 elements in bulk material samples. The Infiniton XRF analyzer uses a 30 mCi 241Am source that essentially lasts indefinitely because the source half-life equals 432.2 years. The Infiniton XRF analyzer also includes unique detector settings and software. Other features include an integrated touch-screen display; completely sealed housing to protect the analyzer from moisture and dust; lithium-ion batteries; an integrated bar code reader and virtual keypad; remote operation and custom report
generation capability from a Windows-based PC; a shielded bench-top test stand; and Bluetooth© wireless communication to a laptop or personal data assistant (PDA).
The XLi is factory calibrated to simultaneously analyze up to 25 elements, including all eight Resource Conservation and Recovery Act (RCRA) metals. The analyzer does not require a site-specific, or material-specific, calibration; however, it is capable of handling user-generated empirical calibrations, if required for specific applications.
The XLi is designed to be used as either a hand-held instrument for in situ analysis or as a bench-top instrument, in a test stand with a sample drawer below the instrument, for ex situ analysis (Figure 6-1). To analyze soil samples in the in situ mode, the instrument x-ray window is placed directly on the ground or on soils in a plastic bag. In situ testing with the XLi allows for semi-quantitative assessment of element concentrations at multiple locations or over large areas in a short time. For ex situ analysis, samples are prepared in x-ray sample cups and placed in the sample drawer at the bottom of the test stand, directly beneath the instrument x-ray window. Quantitative ex situ testing involves properly preparing the samples, placing the samples in x-ray sample cups, and analyzing them in a controlled area, typically free from dust and weather extremes. Most field-portable XRF analyses use a combination of in situ and ex situ sample testing.
The XLi can be used to analyze elements under three primary scenarios: (1) bulk sample mode (includes soils, sediments, and metal alloys); (2) thin film mode (includes dust wipes and filters); and (3) plastics mode. Two standard calibrations are provided under the bulk sample mode, one for standard soil samples (optimum for concentrations up to 1%) and one for industrial bulk samples (optimum for concentration from 1 - 100%). Additional user-defined calibrations can be programmed and used under the bulk sample mode. In the thin film mode, the XLi can be used to analyze thin samples (dust wipes) and other filter media (PM10 and PM2.5) for airborne and risk assessment purposes.

__________________________________________________________________________________
40
Figure 6-1. Niton XLi 700 Series analyzer set
up for–ex-situ analysis. XRF analyses using the XLi can fully comply with EPA Method 6200, “Field Portable XRF Spectrometry for the Determination of Elemental Concentrations in Soil and Sediment.” Since XRF analysis is nondestructive, samples analyzed by XRF can be sent to a fixed analytical laboratory for confirmation of results. The technical specifications for the XLi are presented in Table 6-1. The XLi can be shipped via regular ground or air transportation. The packages used to ship do not need to be labeled as radioactive materials because the isotope sources are contained in a shielded and safe-locked unit. Niton has no formal published standard operating procedures for the XLi operations, but recommends that users follow EPA Method 6200 and the instrument user’s manual to ensure that the appropriate protocol is followed. The recommended steps include the following: 1) Insert the battery, turn on system, and allow it
to warm up for 15 minutes.
2) Ensure the date and time is correct. 3) Run the detector calibration program that ensures the
electronics are stable and that the resolution of the detector is appropriate (less than 225 electron volts [eV] for the XLi).
4) Analyze the standard check samples (National
Institute of Standards and Technology [NIST] 2709; NIST 2710; and blank) to ensure proper precision. Repeat this step every 4 to 6 hours, or after a battery exchange and reboot.
5) Download and delete data after 3,000 readings have
been taken. 6.2 Instrument Operations during the
Demonstration The instrument shipped to the demonstration site was a standard XLi with 109Cd, 55Fe, and 241Am sources. The instrument was packed in a Pelican case that was 8 inches tall by 20 inches wide and 16 inches deep. The Pelican case was overpacked in a standard cardboard box with additional packing. One additional large box was needed to hold all the accessories and supplies for routine analysis. A laptop computer is not required for analysis, but was used during the field demonstration for data downloading and to serve as a larger screen for viewing results and for assigning sample numbers. 6.2.1 Set up and Calibration During the field demonstration, the XLi was used in the ex situ, bulk analysis mode. Instrument setup involved placing the unit in the environmental test stand, connecting the analyzer to the laptop computer, and powering up both the analyzer and the computer. As part of the standard analyzer setup routine, the analyzer was initially calibrated using the silver and tungsten shielding on the inside of the shutter to fine-tune the known peaks for these elements.
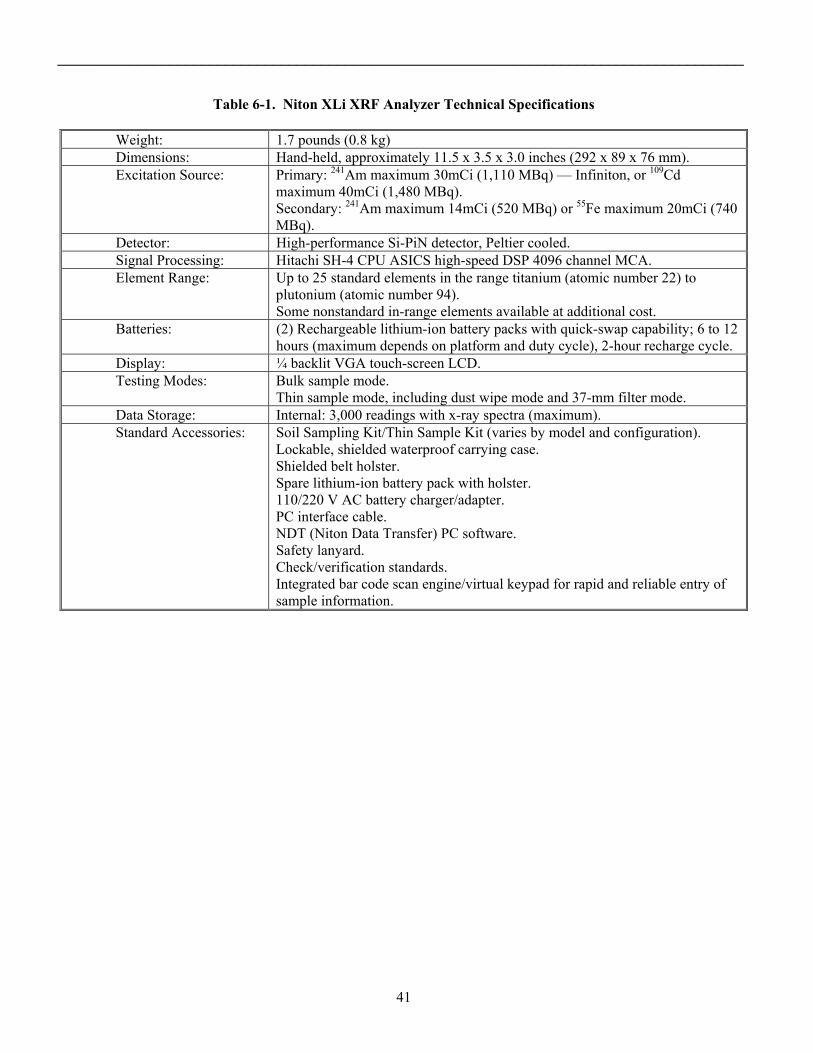
______________________________________________________________________________________
41
Table 6-1. Niton XLi XRF Analyzer Technical Specifications
Weight: 1.7 pounds (0.8 kg) Dimensions: Hand-held, approximately 11.5 x 3.5 x 3.0 inches (292 x 89 x 76 mm). Excitation Source: Primary: 241Am maximum 30mCi (1,110 MBq) — Infiniton, or 109Cd
maximum 40mCi (1,480 MBq). Secondary: 241Am maximum 14mCi (520 MBq) or 55Fe maximum 20mCi (740 MBq).
Detector: High-performance Si-PiN detector, Peltier cooled. Signal Processing: Hitachi SH-4 CPU ASICS high-speed DSP 4096 channel MCA. Element Range: Up to 25 standard elements in the range titanium (atomic number 22) to
plutonium (atomic number 94). Some nonstandard in-range elements available at additional cost.
Batteries: (2) Rechargeable lithium-ion battery packs with quick-swap capability; 6 to 12 hours (maximum depends on platform and duty cycle), 2-hour recharge cycle.
Display: ¼ backlit VGA touch-screen LCD. Testing Modes: Bulk sample mode.
Thin sample mode, including dust wipe mode and 37-mm filter mode. Data Storage: Internal: 3,000 readings with x-ray spectra (maximum). Standard Accessories: Soil Sampling Kit/Thin Sample Kit (varies by model and configuration).
Lockable, shielded waterproof carrying case. Shielded belt holster. Spare lithium-ion battery pack with holster. 110/220 V AC battery charger/adapter. PC interface cable. NDT (Niton Data Transfer) PC software. Safety lanyard. Check/verification standards. Integrated bar code scan engine/virtual keypad for rapid and reliable entry of sample information.

__________________________________________________________________________________
42
Even though a warm-up time is not required, about 5 minutes is recommended to allow the analyzer to equilibrate with ambient conditions. Niton included five calibration and reference samples with the analyzer to be used for calibration. Included were three NIST standards, one RCRA metals reference sample, and one silica blank. The Niton field team also used additional standards and samples with known element concentrations (the pre-demonstration samples) to further evaluate the XLi’s calibration. Individual element results and the error for each value were evaluated to verify that the analyzer was calibrated. The pre-set factory standard calibration for soil was selected for all routine analysis of soil and sediment and included the simultaneous analysis of up to 25 elements. The XLi software allows for empirical calibrations and corrections for any of the 25 elements. However, no empirical calibration or corrections were used during the field demonstration. 6.2.2 Demonstration Sample Processing Niton sent a two person team to the demonstration site to operate the two Niton instruments that were participating in the demonstration. One field team member was assigned to each instrument and completed the sample preparation, analysis, and data reduction for that instrument. Thus, the XLi had a dedicated operator for the entire length of the field demonstration, which showed how a single person could efficiently prepare and analyze samples in the field using the XLi. Before initiating sample processing, each sample set was arranged in numerical order. Custody seals were broken, and the soil samples placed in standard 32-mm sample cups using a small stainless steel spatula (Figure 6-2). The sample cups were filled approximately 1/2 to 2/3 full. Each sample cup was then fitted with a small paper disc, polyester batting material behind the soil, and an end cap. The polyester batting and paper disc were necessary to hold the soil firmly against the upper Mylar® film when the sample cup is inverted. A colored, self-adhesive dot was used to label each sample cup with the proper number and was attached to the bottom of the prepared sample cups. Prepared samples were placed in a queue and analyzed in order (Figure 6-3). To initiate an analysis, the next sample in the queue
was placed in the environmental sample holder and the drawer was closed. The sample analysis was started from the laptop computer that was directly connected to the analyzer. A total of 180 seconds (60 seconds for the 109Cd source, 60 seconds for the 241Am source, and 60 seconds for the 55Fe source) was selected as an appropriate analysis time to simulate the duration a typical customer might choose under normal field conditions. The Niton software automatically sets the actual real time needed to achieve 60 seconds of analysis time based on the age of the isotope source. For example, the actual real time to achieve 60 “source seconds” of analysis would be approximately 120 seconds if an XRF with a 109Cd source that is 18 months old (equal to the half-life of the 109Cd source). The 109Cd and 55Fe sources were approximately 26 months old. The total actual real time to achieve 180 source seconds of analyses for the XLi analyzer used at the demonstration therefore equaled about 330 seconds (5.5 minutes). At the end of the test, the sample number recording screen was viewed on the laptop computer, and then the sample number was entered and the results saved. The Niton data transfer (NDT) software has the option to save the data to the laptop computer simultaneously as the results are saved on the instrument. The data were written to the computer using a comma separated value (CSV) format.
Figure 6-2. Niton technician using a stainless
steel scoop to fill a sample cup.

__________________________________________________________________________________
43
Figure 6-3. Instrument setup with samples
awaiting analysis. 6.3 General Demonstration Results The Niton operator for the XLi analyzed all 326 soil and sediment samples in 4 days using the standard soils calibration in the bulk sample mode. All analyses were completed in the ex situ mode after the soil and sediment materials were placed in the sample cups. Samples with iron results above 50,000 parts per million (ppm) (5 percent) and samples with lead
results above 10,000 ppm (1 percent) were identified for an additional 30-second analysis using the industrial bulk calibration in the bulk sample mode. The industrial bulk calibration is not considered as accurate as the standard soils calibration for elements below approximately 1 percent. However, the industrial bulk calibration is considered more accurate than the standard soils calibration for most elements at concentrations above 1 percent. Iron is a common element in soils and is typically above 10,000 ppm in all soils; therefore, the standard soil calibration range for iron extends to 50,000 ppm. 6.4 Contact Information Additional information on Niton’s XLi 700 Series XRF analyzer is available from the following source:
Mr. Dave Mercuro Niton Analyzers 900 Middlesex Turnpike, Building #8 Billerica, MA 01821 Telephone: (800) 875-1578, Ext. 333 Fax: 978-670-7430 Email: [email protected] Internet: www.niton.com

__________________________________________________________________________________
44
This page was left blank intentionally.
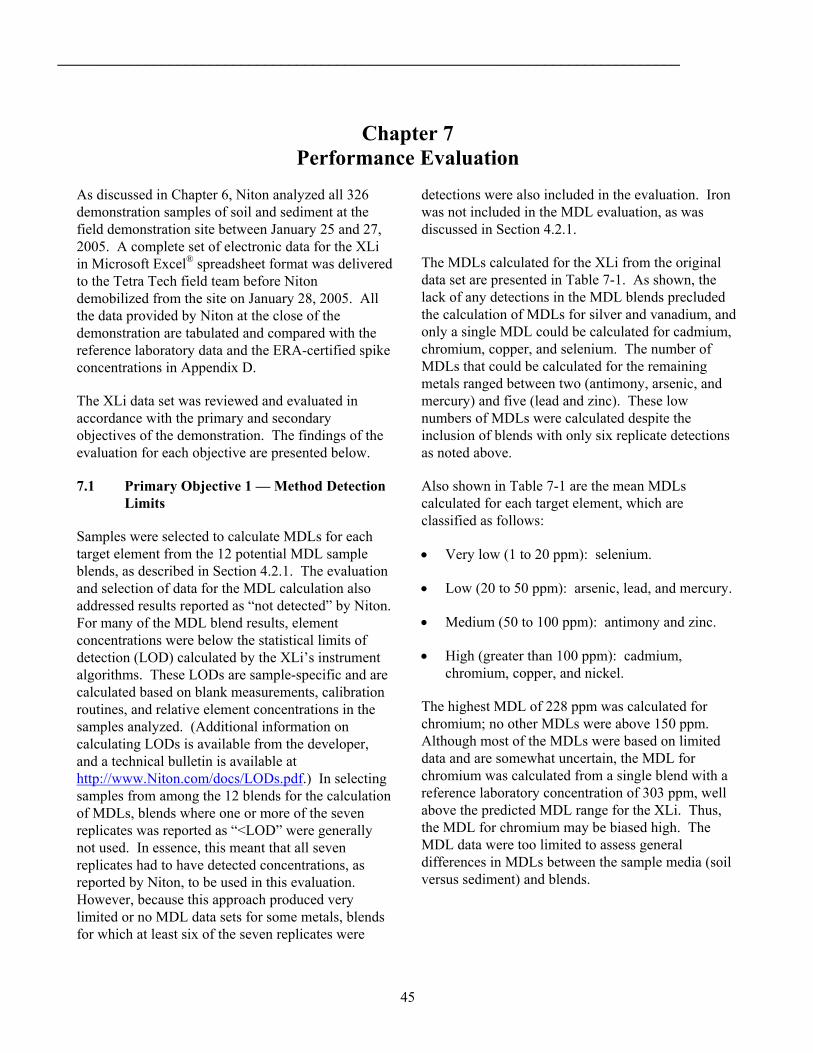
______________________________________________________________________________
45
Chapter 7 Performance Evaluation
As discussed in Chapter 6, Niton analyzed all 326 demonstration samples of soil and sediment at the field demonstration site between January 25 and 27, 2005. A complete set of electronic data for the XLi in Microsoft Excel® spreadsheet format was delivered to the Tetra Tech field team before Niton demobilized from the site on January 28, 2005. All the data provided by Niton at the close of the demonstration are tabulated and compared with the reference laboratory data and the ERA-certified spike concentrations in Appendix D.
The XLi data set was reviewed and evaluated in accordance with the primary and secondary objectives of the demonstration. The findings of the evaluation for each objective are presented below.
7.1 Primary Objective 1 — Method Detection Limits
Samples were selected to calculate MDLs for each target element from the 12 potential MDL sample blends, as described in Section 4.2.1. The evaluation and selection of data for the MDL calculation also addressed results reported as “not detected” by Niton. For many of the MDL blend results, element concentrations were below the statistical limits of detection (LOD) calculated by the XLi’s instrument algorithms. These LODs are sample-specific and are calculated based on blank measurements, calibration routines, and relative element concentrations in the samples analyzed. (Additional information on calculating LODs is available from the developer, and a technical bulletin is available at http://www.Niton.com/docs/LODs.pdf.) In selecting samples from among the 12 blends for the calculation of MDLs, blends where one or more of the seven replicates was reported as “<LOD” were generally not used. In essence, this meant that all seven replicates had to have detected concentrations, as reported by Niton, to be used in this evaluation. However, because this approach produced very limited or no MDL data sets for some metals, blends for which at least six of the seven replicates were
detections were also included in the evaluation. Iron was not included in the MDL evaluation, as was discussed in Section 4.2.1.
The MDLs calculated for the XLi from the original data set are presented in Table 7-1. As shown, the lack of any detections in the MDL blends precluded the calculation of MDLs for silver and vanadium, and only a single MDL could be calculated for cadmium, chromium, copper, and selenium. The number of MDLs that could be calculated for the remaining metals ranged between two (antimony, arsenic, and mercury) and five (lead and zinc). These low numbers of MDLs were calculated despite the inclusion of blends with only six replicate detections as noted above.
Also shown in Table 7-1 are the mean MDLs calculated for each target element, which are classified as follows:
• Very low (1 to 20 ppm): selenium.
• Low (20 to 50 ppm): arsenic, lead, and mercury.
• Medium (50 to 100 ppm): antimony and zinc.
• High (greater than 100 ppm): cadmium, chromium, copper, and nickel.
The highest MDL of 228 ppm was calculated for chromium; no other MDLs were above 150 ppm. Although most of the MDLs were based on limited data and are somewhat uncertain, the MDL for chromium was calculated from a single blend with a reference laboratory concentration of 303 ppm, well above the predicted MDL range for the XLi. Thus, the MDL for chromium may be biased high. The MDL data were too limited to assess general differences in MDLs between the sample media (soil versus sediment) and blends.
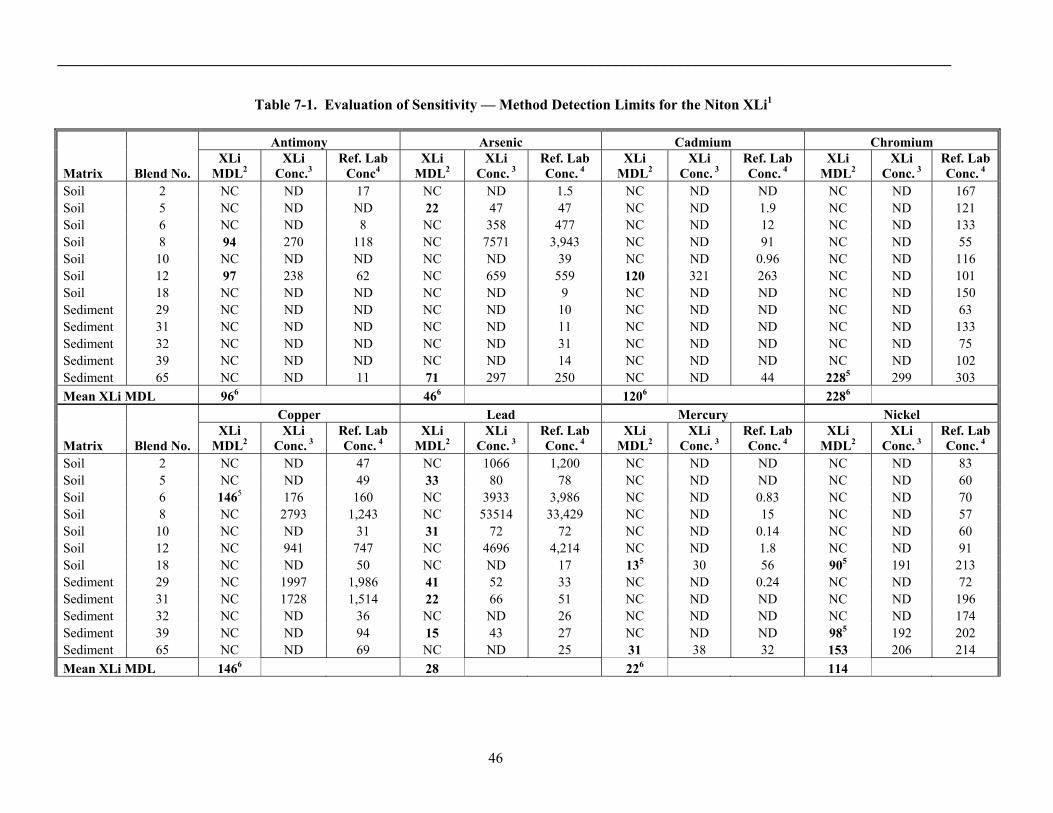
________________________________________________________________________________________________________________
46
Table 7-1. Evaluation of Sensitivity — Method Detection Limits for the Niton XLi1
Antimony Arsenic Cadmium Chromium
Matrix Blend No. XLi
MDL2 XLi
Conc.3 Ref. Lab
Conc4 XLi
MDL2 XLi
Conc. 3 Ref. Lab Conc. 4
XLi MDL2
XLi Conc. 3
Ref. Lab Conc. 4
XLi MDL2
XLi Conc. 3
Ref. Lab Conc. 4
Soil 2 NC ND 17 NC ND 1.5 NC ND ND NC ND 167 Soil 5 NC ND ND 22 47 47 NC ND 1.9 NC ND 121 Soil 6 NC ND 8 NC 358 477 NC ND 12 NC ND 133 Soil 8 94 270 118 NC 7571 3,943 NC ND 91 NC ND 55 Soil 10 NC ND ND NC ND 39 NC ND 0.96 NC ND 116 Soil 12 97 238 62 NC 659 559 120 321 263 NC ND 101 Soil 18 NC ND ND NC ND 9 NC ND ND NC ND 150 Sediment 29 NC ND ND NC ND 10 NC ND ND NC ND 63 Sediment 31 NC ND ND NC ND 11 NC ND ND NC ND 133 Sediment 32 NC ND ND NC ND 31 NC ND ND NC ND 75 Sediment 39 NC ND ND NC ND 14 NC ND ND NC ND 102 Sediment 65 NC ND 11 71 297 250 NC ND 44 2285 299 303 Mean XLi MDL 966 466 1206 2286 Copper Lead Mercury Nickel
Matrix Blend No. XLi
MDL2 XLi
Conc. 3 Ref. Lab Conc. 4
XLi MDL2
XLi Conc. 3
Ref. Lab Conc. 4
XLi MDL2
XLi Conc. 3
Ref. Lab Conc. 4
XLi MDL2
XLi Conc. 3
Ref. Lab Conc. 4
Soil 2 NC ND 47 NC 1066 1,200 NC ND ND NC ND 83 Soil 5 NC ND 49 33 80 78 NC ND ND NC ND 60 Soil 6 1465 176 160 NC 3933 3,986 NC ND 0.83 NC ND 70 Soil 8 NC 2793 1,243 NC 53514 33,429 NC ND 15 NC ND 57 Soil 10 NC ND 31 31 72 72 NC ND 0.14 NC ND 60 Soil 12 NC 941 747 NC 4696 4,214 NC ND 1.8 NC ND 91 Soil 18 NC ND 50 NC ND 17 135 30 56 905 191 213 Sediment 29 NC 1997 1,986 41 52 33 NC ND 0.24 NC ND 72 Sediment 31 NC 1728 1,514 22 66 51 NC ND ND NC ND 196 Sediment 32 NC ND 36 NC ND 26 NC ND ND NC ND 174 Sediment 39 NC ND 94 15 43 27 NC ND ND 985 192 202 Sediment 65 NC ND 69 NC ND 25 31 38 32 153 206 214 Mean XLi MDL 1466 28 226 114
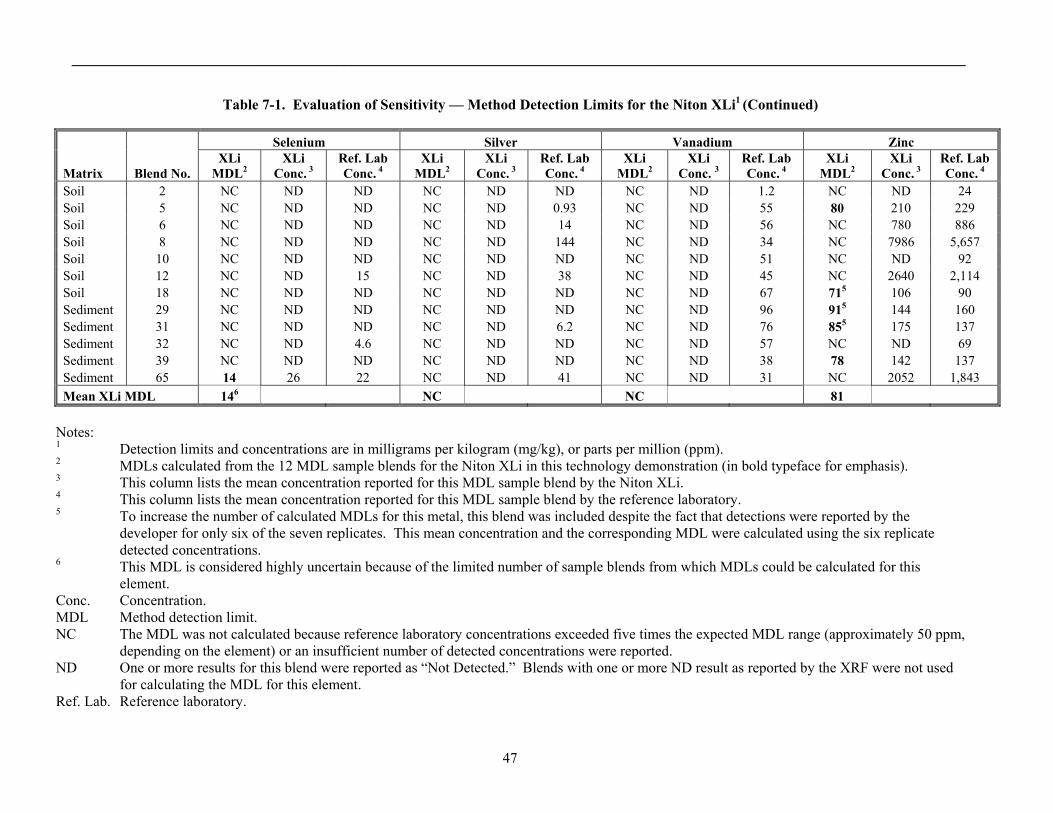
________________________________________________________________________________________________________________
47
Table 7-1. Evaluation of Sensitivity — Method Detection Limits for the Niton XLi1 (Continued)
Selenium Silver Vanadium Zinc
Matrix Blend No. XLi
MDL2 XLi
Conc. 3 Ref. Lab Conc. 4
XLi MDL2
XLi Conc. 3
Ref. Lab Conc. 4
XLi MDL2
XLi Conc. 3
Ref. Lab Conc. 4
XLi MDL2
XLi Conc. 3
Ref. Lab Conc. 4
Soil 2 NC ND ND NC ND ND NC ND 1.2 NC ND 24 Soil 5 NC ND ND NC ND 0.93 NC ND 55 80 210 229 Soil 6 NC ND ND NC ND 14 NC ND 56 NC 780 886 Soil 8 NC ND ND NC ND 144 NC ND 34 NC 7986 5,657 Soil 10 NC ND ND NC ND ND NC ND 51 NC ND 92 Soil 12 NC ND 15 NC ND 38 NC ND 45 NC 2640 2,114 Soil 18 NC ND ND NC ND ND NC ND 67 715 106 90 Sediment 29 NC ND ND NC ND ND NC ND 96 915 144 160 Sediment 31 NC ND ND NC ND 6.2 NC ND 76 855 175 137 Sediment 32 NC ND 4.6 NC ND ND NC ND 57 NC ND 69 Sediment 39 NC ND ND NC ND ND NC ND 38 78 142 137 Sediment 65 14 26 22 NC ND 41 NC ND 31 NC 2052 1,843 Mean XLi MDL 146 NC NC 81
Notes: 1 Detection limits and concentrations are in milligrams per kilogram (mg/kg), or parts per million (ppm). 2 MDLs calculated from the 12 MDL sample blends for the Niton XLi in this technology demonstration (in bold typeface for emphasis). 3 This column lists the mean concentration reported for this MDL sample blend by the Niton XLi. 4 This column lists the mean concentration reported for this MDL sample blend by the reference laboratory. 5 To increase the number of calculated MDLs for this metal, this blend was included despite the fact that detections were reported by the
developer for only six of the seven replicates. This mean concentration and the corresponding MDL were calculated using the six replicate detected concentrations.
6 This MDL is considered highly uncertain because of the limited number of sample blends from which MDLs could be calculated for this element.
Conc. Concentration. MDL Method detection limit. NC The MDL was not calculated because reference laboratory concentrations exceeded five times the expected MDL range (approximately 50 ppm,
depending on the element) or an insufficient number of detected concentrations were reported. ND One or more results for this blend were reported as “Not Detected.” Blends with one or more ND result as reported by the XRF were not used
for calculating the MDL for this element. Ref. Lab. Reference laboratory.

__________________________________________________________________________________
48
The mean MDLs calculated for the XLi are compared in Table 7-2 with the mean LODs reported by Niton for the MDL blends, the mean MDLs for all instruments that participated in the demonstration, and the mean MDLs derived from performance data presented in EPA Method 6200 (EPA 1998e). As shown, the mean MDLs for the XLi varied in comparison to Niton’s LODs and the mean MDLs calculated from EPA Method 6200 data. For antimony and cadmium, the mean MDLs were clearly higher than the LODs and available Method 6200 data. The mean MDLs for arsenic and copper were also somewhat elevated relative to the instrument LODs.
When compared with the results for all eight XRF instruments that participated in the demonstration, the
XLi exhibited high relative mean MDLs for seven of the 10 target elements for which MDLs could be calculated. The only elements for which the XLi had comparable or lower MDLs were lead, mercury, and selenium. Relative to the other demonstration instruments, the XLi also exhibited low detection frequencies in the MDL blends, such that fewer MDLs could be calculated. On this basis, the XLi appears to be less sensitive than many of the other XRF instruments that participated in the demonstration. It is possible that the lower sensitivity of the XLi may relate to its use of isotope sources rather than the x-ray tube sources used by the rest of the demonstration instruments.
Table 7-2. Comparison of XLi MDLs to XLi LODs, All-Instrument MDLs, and EPA Method 6200 Data1
Element Niton XLi
Mean MDLs2 Niton XLi
Mean LODs3
All XRF Instrument
Mean MDLs4 EPA Method 6200
Mean Detection Limits5 Antimony 966 49 61 55 7 Arsenic 466 35 26 92 Cadmium 1206 43 70 NR Chromium 2286 261 83 376 Copper 1466 108 23 171 Lead 28 24 40 78 Mercury 226 25 23 NR Nickel 114 151 50 100 7 Selenium 146 22 8 NR Silver NC 247 42 NR Vanadium NC 297 28 NR Zinc 81 73 38 89
Notes: 1 Detection limits are in units of milligrams per kilogram (mg/kg), or parts per million (ppm). 2 The mean MDLs calculated for this technology demonstration, as presented in Table 7-1. 3 The mean LODs as reported by Niton for the 12 MDL blends. 4 The mean MDLs calculated for all eight XRF instruments that participated in this EPA technology
demonstration. 5 Mean values calculated from Table 4 of Method 6200 (EPA 1998e, www.epa.gov/sw-846). 6 This MDL is considered highly uncertain because of the limited number of sample blends from which MDLs
could be calculated for this element. 7 Only one value reported. EPA U.S. Environmental Protection Agency. LOD Limit of detection. MDL Method detection limit. NC Not calculated. NR Not reported; no MDLs reported for this element.

__________________________________________________________________________________
49
7.2 Primary Objective 2 — Accuracy and Comparability
The number of demonstration sample blends that met the criteria for evaluation of accuracy, as described in Section 4.2.2, was low for some elements. Due primarily to limited instrument sensitivity, as described in Section 7.2.1, only between five and 20 blends were included in the evaluation for chromium, nickel, silver, and vanadium. RPDs between the mean concentrations obtained from the XLi and the reference laboratory were calculated for each blend that met the criteria. Table 7-3 presents the median RPDs for each target element, along with the number of RPD results used to calculate the median. These statistics are provided for all demonstration samples as well as for subpopulations grouped by medium (soil versus sediment) and concentration level (Levels 1 through 4, as documented in Table 3-1). Additional summary statistics for the RPDs (minimum, maximum, and mean) are provided in Appendix E (Table E-1).
Accuracy was classified as follows for the target elements based on the overall median RPDs:
• Very good (median RPD less than 10 percent): selenium.
• Good (median RPD between 10 percent and 25 percent): arsenic, cadmium, chromium, copper, iron, lead, nickel, and zinc.
• Fair (median RPD between 25 percent and 50 percent): none.
• Poor (median RPD greater than 50 percent): antimony, mercury, silver, and vanadium.
The median RPD was used for this evaluation because it is less affected by extreme values than is the mean. (The initial evaluation of the RPD populations showed that they were generally right-skewed or lognormal.) However, the classification of the elements based on accuracy generally stayed the same when the mean rather than the median RPD was used for the evaluation, although the means were slightly higher overall (Table E-1). Review of the median RPDs with respect to media type (soil versus sediment) did not reveal any consistent trends. In some cases the soil RPDs were lower; while in other cases the sediment RPDs were lower. With regard to
concentration range, the low numbers of samples with reported concentrations in the Level 1 range (due to the XLi’s high detection limits) effected the assessment of trends in accuracy. However, the following observations were made:
• A high median RPD was observed in the Level 3 soil samples for arsenic (with concentrations greater than 2,000 ppm). This RPD appeared to be skewed high by the results for sample blends 7 through 9 from the Wickes Smelter site, which contained high concentrations of other elements (such as lead, zinc, and iron).
• The best accuracy for mercury was observed in the Level 1 samples (with concentrations between 20 and 200 ppm) in both the soil and sediment matrices, where median RPDs of less than 50 percent were observed. These samples were generally characterized by very low concentrations of other elements, including elements adjacent to mercury in the periodic table such as cadmium and lead. However, this trend in mercury RPDs is somewhat uncertain due to the low numbers of samples with reported concentrations in the Level 1 concentration range.
The highest overall median RPD for an element was 109 percent (for antimony). Section 5.3.3 discussed how the reference laboratory data for antimony were consistently biased low when compared with the ERA-certified spike concentrations. This effect may be caused by volatilization of the antimony compounds used for spiking, resulting in loss of antimony during the sample digestion process at the reference laboratory. Therefore, Table 7-3 includes a second evaluation of accuracy for antimony, comparing the results from the XLi with the ERA-certified values. As shown, this comparison indicates far better performance for antimony than does the comparison to the reference laboratory results, with median RPDs of less than 10 percent for all media and concentration levels. Furthermore, these results suggest that the XLi may measure antimony in soil and sediment more accurately than the fixed-laboratory reference methods.
As an additional comparison, Table 7-3 also presents the overall average of the median RPDs for all eight
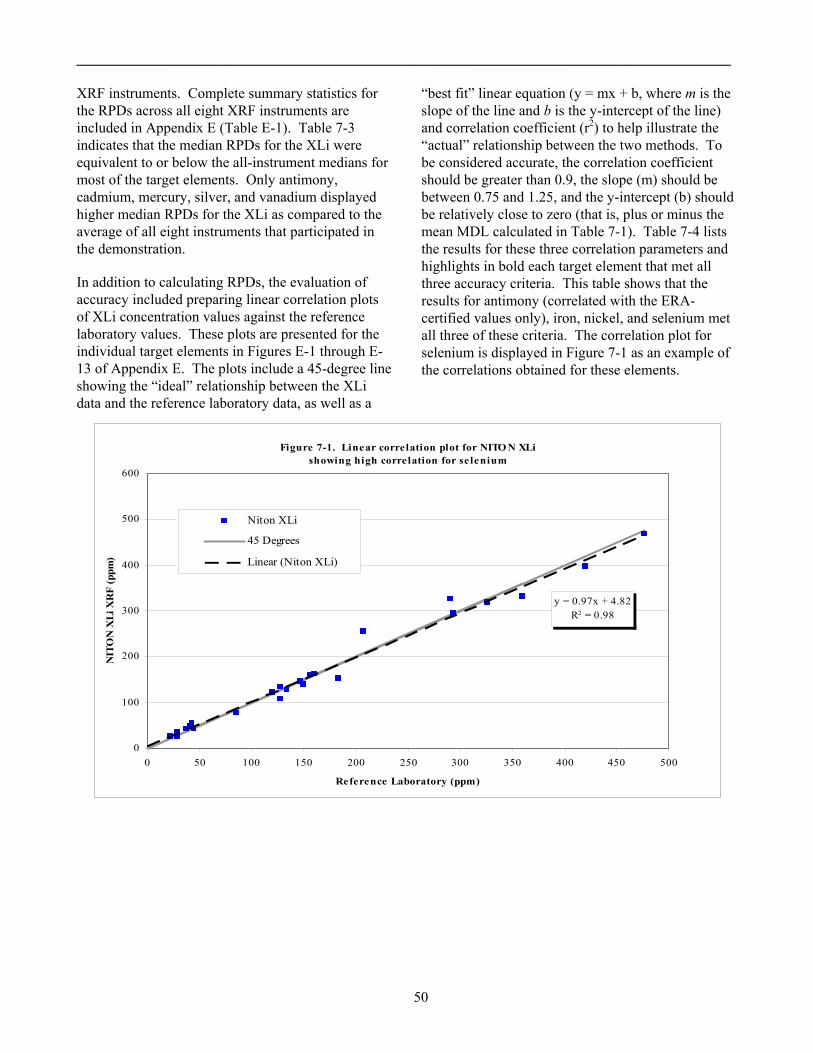
__________________________________________________________________________________
50
XRF instruments. Complete summary statistics for the RPDs across all eight XRF instruments are included in Appendix E (Table E-1). Table 7-3 indicates that the median RPDs for the XLi were equivalent to or below the all-instrument medians for most of the target elements. Only antimony, cadmium, mercury, silver, and vanadium displayed higher median RPDs for the XLi as compared to the average of all eight instruments that participated in the demonstration.
In addition to calculating RPDs, the evaluation of accuracy included preparing linear correlation plots of XLi concentration values against the reference laboratory values. These plots are presented for the individual target elements in Figures E-1 through E-13 of Appendix E. The plots include a 45-degree line showing the “ideal” relationship between the XLi data and the reference laboratory data, as well as a
“best fit” linear equation (y = mx + b, where m is the slope of the line and b is the y-intercept of the line) and correlation coefficient (r2) to help illustrate the “actual” relationship between the two methods. To be considered accurate, the correlation coefficient should be greater than 0.9, the slope (m) should be between 0.75 and 1.25, and the y-intercept (b) should be relatively close to zero (that is, plus or minus the mean MDL calculated in Table 7-1). Table 7-4 lists the results for these three correlation parameters and highlights in bold each target element that met all three accuracy criteria. This table shows that the results for antimony (correlated with the ERA-certified values only), iron, nickel, and selenium met all three of these criteria. The correlation plot for selenium is displayed in Figure 7-1 as an example of the correlations obtained for these elements.
Figure 7-1. Linear correlation plot for NITO N XLi showing high correlation for selenium
y = 0.97x + 4.82R2 = 0.98
0
100
200
300
400
500
600
0 50 100 150 200 250 300 350 400 450 500
Reference Laboratory (ppm)
NIT
ON
XLi
XR
F (p
pm)
Niton XLi
45 Degrees
Linear (Niton XLi)

______________________________________________________________________________________________________________________
51
Table 7-3. Evaluation of Accuracy — Relative Percent Differences versus Reference Laboratory Data for the Niton XLi
Antimony Arsenic Cadmium Chromium Copper Iron Lead Mercury Nickel Selenium Silver Vanadium Zinc Matrix
Sample Group
Statistic Ref Lab
ERA Spike
Soil Level 1 Number 9 -- 7 4 1 4 5 10 3 1 3 0 0 6 Median 105.8% -- 22.9% 18.9% 24.1% 30.0% 4.2% 25.2% 35.0% 25.6% 13.4% NC NC 11.9% Level 2 Number 5 1 4 7 4 8 13 4 7 4 5 0 0 6 Median 117.3% 6.2% 21.1% 19.8% 9.0% 33.5% 25.6% 12.6% 131.6% 13.0% 4.5% NC NC 16.1% Level 3 Number 4 3 4 2 2 2 13 8 2 6 4 3 2 9 Median 103.6% 5.4% 55.7% 22.3% 35.8% 18.9% 4.7% 12.2% 136.9% 9.4% 5.5% 23.7% 47.1% 21.7% Level 4 Number -- -- -- -- -- -- 7 5 -- -- -- -- -- -- Median -- -- -- -- -- -- 9.8% 18.1% -- -- -- -- -- -- All Soil Number 18 4 15 13 7 14 38 27 12 11 12 3 2 21 Median 107.5% 5.8% 25.8% 19.8% 16.1% 28.4% 11.1% 17.8% 125.0% 11.8% 6.9% 23.7% 47.1% 12.7% Sediment Level 1 Number 2 2 9 2 0 3 3 11 2 0 5 0 0 10 Median 137.7% 7.8% 8.3% 26.1% NC 20.5% 19.1% 14.6% 29.3% NC 15.7% NC NC 10.6% Level 2 Number 4 4 4 4 2 4 19 4 4 5 4 0 0 5 Median 127.1% 9.2% 12.3% 18.2% 3.6% 10.4% 22.0% 5.5% 94.2% 12.9% 3.9% NC NC 5.8% Level 3 Number 3 3 2 3 3 10 4 3 3 4 3 2 3 4 Median 94.6% 2.7% 16.6% 21.2% 20.2% 5.1% 36.5% 11.6% 103.4% 7.9% 5.6% 83.4% 64.1% 10.4% Level 4 Number -- -- -- -- -- -- 6 -- -- -- -- -- -- -- Median -- -- -- -- -- -- 19.1% -- -- -- -- -- -- -- All Sediment Number 9 9 15 9 5 17 32 18 9 9 12 2 3 19 Median 111.7% 4.2% 8.8% 20.3% 17.2% 9.6% 19.2% 10.7% 86.6% 9.2% 8.0% 83.4% 64.1% 9.8% All Samples Niton XLi Number 27 13 30 22 12 31 70 45 21 20 24 5 5 40 Median 109.0% 5.4% 15.9% 19.9% 16.6% 13.2% 17.8% 14.6% 103.4% 11.8% 6.9% 54.9% 54.1% 11.2% All Samples All XRF Number 206 110 320 209 338 363 558 392 192 403 195 177 218 471 Instruments Median 84.3% 70.6% 26.2% 16.7% 26.0% 16.2% 26.0% 21.5% 58.6% 25.4% 16.7% 28.7% 38.3% 19.4% Notes: All median RPDs presented in this table are based on the population of absolute values of the individual RPDs. -- No samples reported by the reference laboratory in this concentration ranges. ERA Environmental Resource Associates, Inc. NC Not calculated. Number Number of samples appropriate for accuracy evaluation. Ref Lab Reference laboratory (Shealy Environmental Services, Inc.) RPD Relative percent difference.
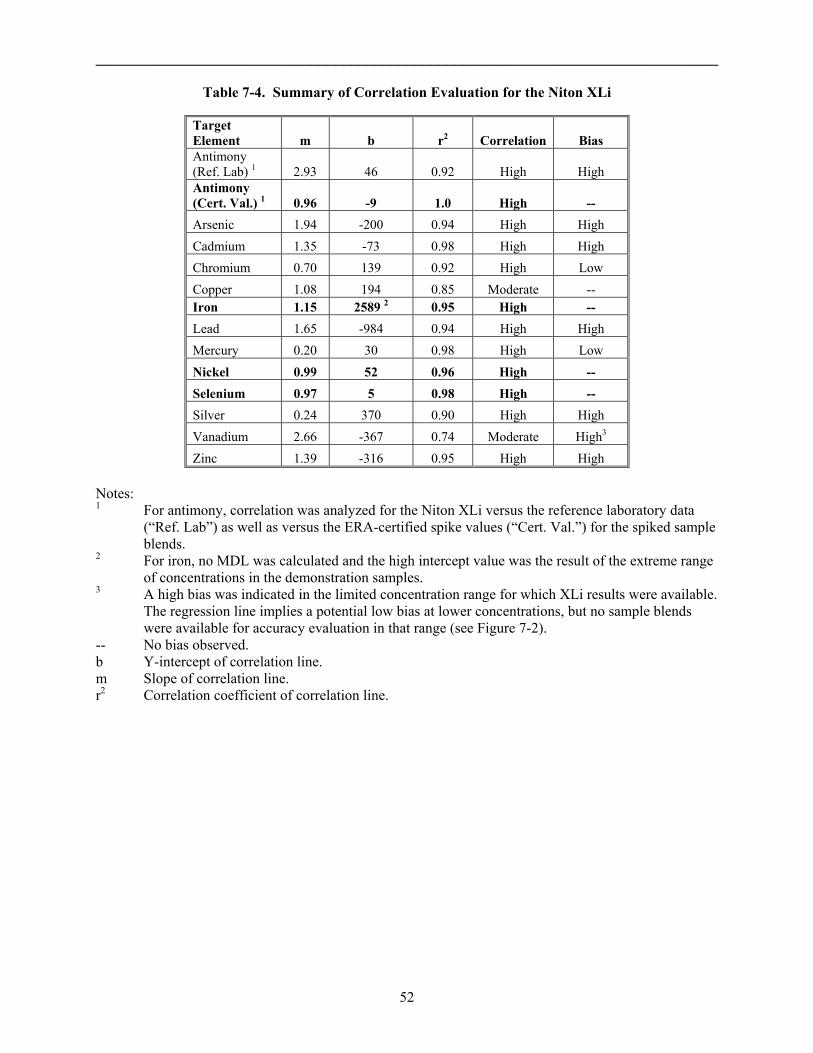
______________________________________________________________________________
52
Table 7-4. Summary of Correlation Evaluation for the Niton XLi
Notes: 1 For antimony, correlation was analyzed for the Niton XLi versus the reference laboratory data
(“Ref. Lab”) as well as versus the ERA-certified spike values (“Cert. Val.”) for the spiked sample blends.
2 For iron, no MDL was calculated and the high intercept value was the result of the extreme range of concentrations in the demonstration samples.
3 A high bias was indicated in the limited concentration range for which XLi results were available. The regression line implies a potential low bias at lower concentrations, but no sample blends were available for accuracy evaluation in that range (see Figure 7-2).
-- No bias observed. b Y-intercept of correlation line. m Slope of correlation line. r2 Correlation coefficient of correlation line.
Target Element m b r2 Correlation Bias Antimony (Ref. Lab) 1 2.93 46 0.92 High High Antimony (Cert. Val.) 1 0.96 -9 1.0 High -- Arsenic 1.94 -200 0.94 High High Cadmium 1.35 -73 0.98 High High Chromium 0.70 139 0.92 High Low Copper 1.08 194 0.85 Moderate -- Iron 1.15 2589 2 0.95 High -- Lead 1.65 -984 0.94 High High Mercury 0.20 30 0.98 High Low Nickel 0.99 52 0.96 High -- Selenium 0.97 5 0.98 High -- Silver 0.24 370 0.90 High High Vanadium 2.66 -367 0.74 Moderate High3 Zinc 1.39 -316 0.95 High High

_______________________________________________________________________________________
53
Figure 7-2. Linear correlation plot for NITO N XLishowing low correlation and variable bias for vanadium
y = 2.66x - 366.85R2 = 0.74
0
100
200
300
400
500
600
700
800
900
1000
0 50 100 150 200 250 300 350 400 450 500
Reference Laboratory (ppm)
NIT
ON
XLi
XR
F (p
pm)
Niton XLi45 Degrees
Linear (Niton XLi)
General observations from the correlation plots are as follows:
• Slopes significantly greater than 1 in conjunction with moderately high correlation coefficients indicated a high bias in the XLi data for arsenic, lead, and zinc. However, further review of the data indicated that removal of high outliers from complex Blends 8 and 9 (Wickes Smelter slag) improved the r2 values and reduced or eliminated the positive bias for these elements.
• Mercury exhibited a high r2 value (0.98) but a low bias (m = 0.2). Removing two extreme Level 4 concentrations (Blends 21 and 22) from the plots produced a much poorer correlation coefficient (in the range of 0.79) without improving the low bias.
• Large deviations from zero were noted in the y-intercepts for lead and iron. Examination of the plots for these elements (Figures E-6 and E-7)
reveals that these deviations were small relative to the extreme range of concentrations in the demonstration samples.
• For antimony, the high bias in relation to the reference laboratory results was greatly diminished when the XLi results were compared to the ERA-certified values. Comparison to the ERA-certified values eliminated the high bias and produced a better correlation (r2 = 1.00). These findings agree with the RPD evaluation above in showing better performance for antimony by the XLi when ERA-certified spike values are used to assess accuracy.
• The regression lines suggested a very high bias for silver and a bias for vanadium that changes with concentration. However, these findings may have been affected by the limited availability of data in the various concentration ranges. Figure 7-2 shows the correlation plot for vanadium as an example. As shown, the XLi results for

______________________________________________________________________________
54
vanadium exhibited a high bias, but the only data available for the evaluation were from blends with reference laboratory concentrations of 300 ppm and above. The lack of XLi results at lower concentrations caused the linear regression line to exhibit a low intercept and high slope, implying a potential low bias at low concentrations.
In conclusion, the evaluations of accuracy showed an acceptable overall level of performance by the XLi for the target elements. Correlations with the reference laboratory were generally high and, for most elements, the median RPDs were better than the average of all eight XRF instruments. Niton’s proven calibration and quantification algorithms for environmental media may have contributed to the high relative level of accuracy attained. However, the low relative sensitivity of the XLi (that is, the high relative MDLs) produced small data sets for silver and vanadium and associated uncertainties in the accuracy evaluation for these elements.
7.3 Primary Objective 3 — Precision
As described in Section 4.2.3, the precision of the XLi was evaluated by calculating RSDs for the replicate measurements from each sample blend. Median RSDs for the various concentration levels and media (soil and sediment), as well as for the demonstration sample set as a whole, are presented in Table 7-5. An expanded set of summary statistics for the RSDs (including minimum, maximum, and mean) is provided in Appendix E (Table E-2).
The RSD calculation revealed a high level of precision for the XLi in that the overall median RSDs were below 15 percent for all target elements in both matrices. The ranges into which the median RSDs fell are further summarized below:
• RSD of 1 percent to 5 percent: iron, lead, and zinc.
• RSD of 5 percent to 10 percent: antimony, arsenic, cadmium, copper, mercury, nickel, selenium, and vanadium.
• RSD of 10 percent to 20 percent: chromium and silver.
• RSD of greater than 20 percent: none.
The median RSDs for the soil and sediment subsets were also less than 15 percent with the exception of silver in sediment (18.4 percent). The median RSDs for sediment were slightly larger for some target elements (chromium, lead, nickel, silver, vanadium, and zinc) than the median RSDs for soil.
The high overall level of precision may have been facilitated by the level of processing (homogenizing, sieving, crushing, and drying) on the sample blends before the demonstration (Chapter 3). This observation is consistent with the previous SITE MMT program demonstration of XRF technologies that occurred in 1995 (EPA 1996a, 1996b, 1998a, 1998b, 1998c, and 1998d). The high level of sample processing applied during both XRF technology demonstrations was necessary to minimize the effects of sample heterogeneity on the demonstration results and on comparability with the reference laboratories. During project design, site investigation teams that intend to compare XRF and laboratory data should similarly assess the need for sample processing steps to manage sample heterogeneity and improve data comparability.
Further review of the median RSDs in Table 7-5 based on concentration range reveals slightly higher RSDs (in other words, lower precision) for the target elements in Level 1 samples when compared with the rest of the data set. This effect was observed for multiple target elements in both soil and sediment, but the effect was difficult to further assess due to the limited numbers of samples available for some elements and concentration levels. However, this observation indicates that, to a minor extent, analytical precision for the XLi may depend on concentration.
As an additional comparison, Table 7-5 also presents the overall average of the median RSDs for all XRF instruments that participated in the demonstration. Additional summary statistics for the RSDs across all eight XRF instruments are included in Table E-2. Table 7-5 indicates that the median RSDs for the XLi were equivalent to or below the all-instrument medians for eight of the 13 target elements. For the

______________________________________________________________________________
55
remaining elements (cadmium, chromium, mercury, selenium, and silver), the median RSDs for the XLi were only slightly above the all-instrument median RSDs.
Table 7-6 presents median RSD statistics for the reference laboratory and compares these to the summary data for the XLi. (Additional summary statistics are provided in Table E-3 of Appendix E.) Table 7-6 indicates that the median RSDs for the XLi were lower than the RSDs for the reference laboratory for nine of the 13 target elements; exceptions included chromium, mercury, silver, and vanadium. Thus, the XLi exhibited slightly better precision overall than the reference laboratory. In comparison, the median RSDs for all XRF instruments were equivalent to or lower than for the reference laboratory for 11 of the 13 target elements (the exceptions included chromium and vanadium).
7.4 Primary Objective 4 — Impact of Chemical and Spectral Interferences
The RPD data from the accuracy evaluation were further processed to assess the effects of interferences. The RPD data for elements considered susceptible to interferences were grouped and compared based on the relative concentrations of potentially interfering elements. Of specific interest for the comparison were the potential effects of:
• High concentrations of lead on the RPDs for arsenic
• High concentrations of nickel on the RPDs for copper (and vice versa), and
• High concentrations of zinc on RPDs for copper (and vice versa).
The rationale and approach for evaluation of these interferents are described in Section 4.2.4.
Interferent-to-element ratios were calculated using the mean concentrations the reference laboratory reported for each blend, classified as low (less than 5X), moderate (5 to 10X), or high (greater than 10X). Table 7-7 presents median RPD data for arsenic, nickel, copper, and zinc that are grouped based on this classification scheme. Additional summary statistics are presented in Appendix E (Table E-4).
The tables confirm significant interference effects of lead on arsenic. Specifically, as lead concentrations increased to greater than 10 times the arsenic concentration, the median RPD for arsenic increased from 12.6 percent (well within the “good” range defined in Section 7.2) to 48.3 percent (at the upper end of the “fair” range). In contrast, high concentrations of copper as a potential interferent do not appear to affect the accuracy of the zinc concentrations. The median RPD for zinc was relatively unchanged between the low interferent-to-element ratio (RPD = 10.5 percent) and the high interferent-to-element ratio (RPD = 11.9 percent). Evaluation of the effects of copper on nickel, nickel on copper, and zinc on copper also do not appear to show significant effects; however, the low number of samples prevents meaningful evaluation.
In presenting statistics for the raw RPDs as well as the absolute values of the RPDs, Table E-4 further shows that the interfering elements appeared to produce an increasingly high bias in the arsenic data (as indicated by lower raw RPDs). The concentrations of copper, nickel, and zinc also displayed a high bias, as indicated by negative raw RPDs. The limited number of detected concentrations for copper, nickel, and zinc when the interferent concentration is moderate to high may be the result of the low bias.
7.5 Primary Objective 5 — Effects of Soil Characteristics
The population of RPDs between the results obtained from the XLi and the reference laboratory was further evaluated against sampling site and soil type. Separate sets of summary statistics were developed for the mean RPDs associated with each sampling site for comparison to the other sites and to the data set for all samples. The site-specific median RPDs are presented in Table 7-8, along with descriptions of soil or sediment type from observations during sampling at each site. Complete RPD summary statistics for each soil type (minimum, maximum, and mean) are presented in Table E-5 of Appendix E
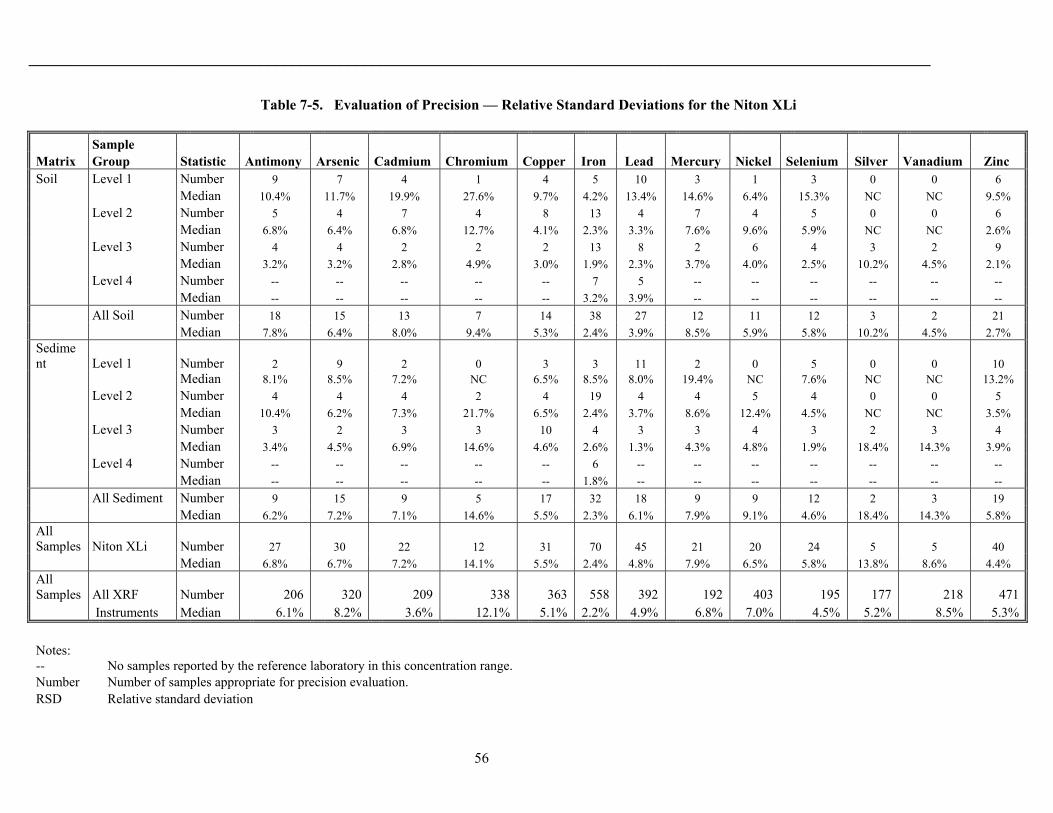
_________________________________________________________________________________________________________________
56
Table 7-5. Evaluation of Precision — Relative Standard Deviations for the Niton XLi
Sample Matrix Group Statistic Antimony Arsenic Cadmium Chromium Copper Iron Lead Mercury Nickel Selenium Silver Vanadium Zinc Soil Level 1 Number 9 7 4 1 4 5 10 3 1 3 0 0 6 Median 10.4% 11.7% 19.9% 27.6% 9.7% 4.2% 13.4% 14.6% 6.4% 15.3% NC NC 9.5% Level 2 Number 5 4 7 4 8 13 4 7 4 5 0 0 6 Median 6.8% 6.4% 6.8% 12.7% 4.1% 2.3% 3.3% 7.6% 9.6% 5.9% NC NC 2.6% Level 3 Number 4 4 2 2 2 13 8 2 6 4 3 2 9 Median 3.2% 3.2% 2.8% 4.9% 3.0% 1.9% 2.3% 3.7% 4.0% 2.5% 10.2% 4.5% 2.1% Level 4 Number -- -- -- -- -- 7 5 -- -- -- -- -- -- Median -- -- -- -- -- 3.2% 3.9% -- -- -- -- -- -- All Soil Number 18 15 13 7 14 38 27 12 11 12 3 2 21 Median 7.8% 6.4% 8.0% 9.4% 5.3% 2.4% 3.9% 8.5% 5.9% 5.8% 10.2% 4.5% 2.7% Sediment Level 1 Number 2 9 2 0 3 3 11 2 0 5 0 0 10 Median 8.1% 8.5% 7.2% NC 6.5% 8.5% 8.0% 19.4% NC 7.6% NC NC 13.2% Level 2 Number 4 4 4 2 4 19 4 4 5 4 0 0 5 Median 10.4% 6.2% 7.3% 21.7% 6.5% 2.4% 3.7% 8.6% 12.4% 4.5% NC NC 3.5% Level 3 Number 3 2 3 3 10 4 3 3 4 3 2 3 4 Median 3.4% 4.5% 6.9% 14.6% 4.6% 2.6% 1.3% 4.3% 4.8% 1.9% 18.4% 14.3% 3.9% Level 4 Number -- -- -- -- -- 6 -- -- -- -- -- -- -- Median -- -- -- -- -- 1.8% -- -- -- -- -- -- -- All Sediment Number 9 15 9 5 17 32 18 9 9 12 2 3 19 Median 6.2% 7.2% 7.1% 14.6% 5.5% 2.3% 6.1% 7.9% 9.1% 4.6% 18.4% 14.3% 5.8% All Samples Niton XLi Number 27 30 22 12 31 70 45 21 20 24 5 5 40 Median 6.8% 6.7% 7.2% 14.1% 5.5% 2.4% 4.8% 7.9% 6.5% 5.8% 13.8% 8.6% 4.4% All Samples All XRF Number 206 320 209 338 363 558 392 192 403 195 177 218 471 Instruments Median 6.1% 8.2% 3.6% 12.1% 5.1% 2.2% 4.9% 6.8% 7.0% 4.5% 5.2% 8.5% 5.3% Notes: -- No samples reported by the reference laboratory in this concentration range. Number Number of samples appropriate for precision evaluation. RSD Relative standard deviation
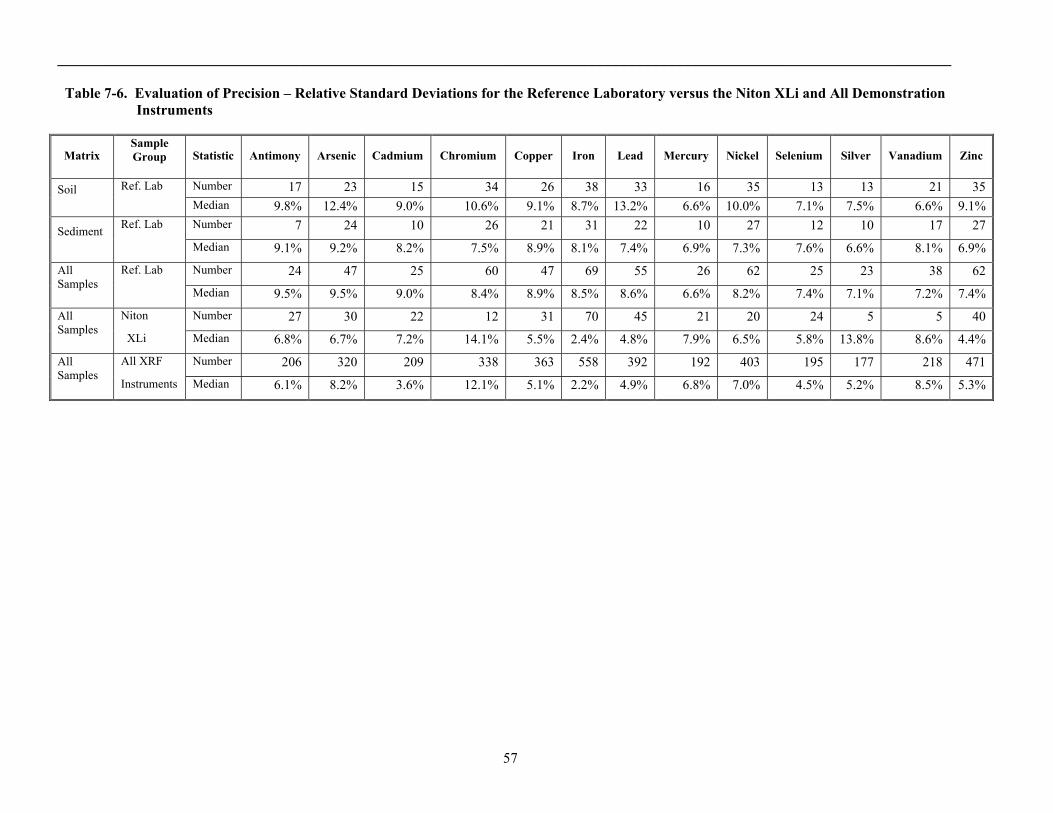
________________________________________________________________________________________________________________
57
Table 7-6. Evaluation of Precision – Relative Standard Deviations for the Reference Laboratory versus the Niton XLi and All Demonstration Instruments
Matrix Sample Group Statistic Antimony Arsenic Cadmium Chromium Copper Iron Lead Mercury Nickel Selenium Silver Vanadium Zinc
Ref. Lab Number 17 23 15 34 26 38 33 16 35 13 13 21 35 Soil Median 9.8% 12.4% 9.0% 10.6% 9.1% 8.7% 13.2% 6.6% 10.0% 7.1% 7.5% 6.6% 9.1% Ref. Lab Number 7 24 10 26 21 31 22 10 27 12 10 17 27 Sediment Median 9.1% 9.2% 8.2% 7.5% 8.9% 8.1% 7.4% 6.9% 7.3% 7.6% 6.6% 8.1% 6.9% Ref. Lab Number 24 47 25 60 47 69 55 26 62 25 23 38 62 All
Samples Median 9.5% 9.5% 9.0% 8.4% 8.9% 8.5% 8.6% 6.6% 8.2% 7.4% 7.1% 7.2% 7.4% Niton Number 27 30 22 12 31 70 45 21 20 24 5 5 40 All
Samples XLi Median 6.8% 6.7% 7.2% 14.1% 5.5% 2.4% 4.8% 7.9% 6.5% 5.8% 13.8% 8.6% 4.4% All XRF Number 206 320 209 338 363 558 392 192 403 195 177 218 471 All
Samples Instruments Median 6.1% 8.2% 3.6% 12.1% 5.1% 2.2% 4.9% 6.8% 7.0% 4.5% 5.2% 8.5% 5.3%
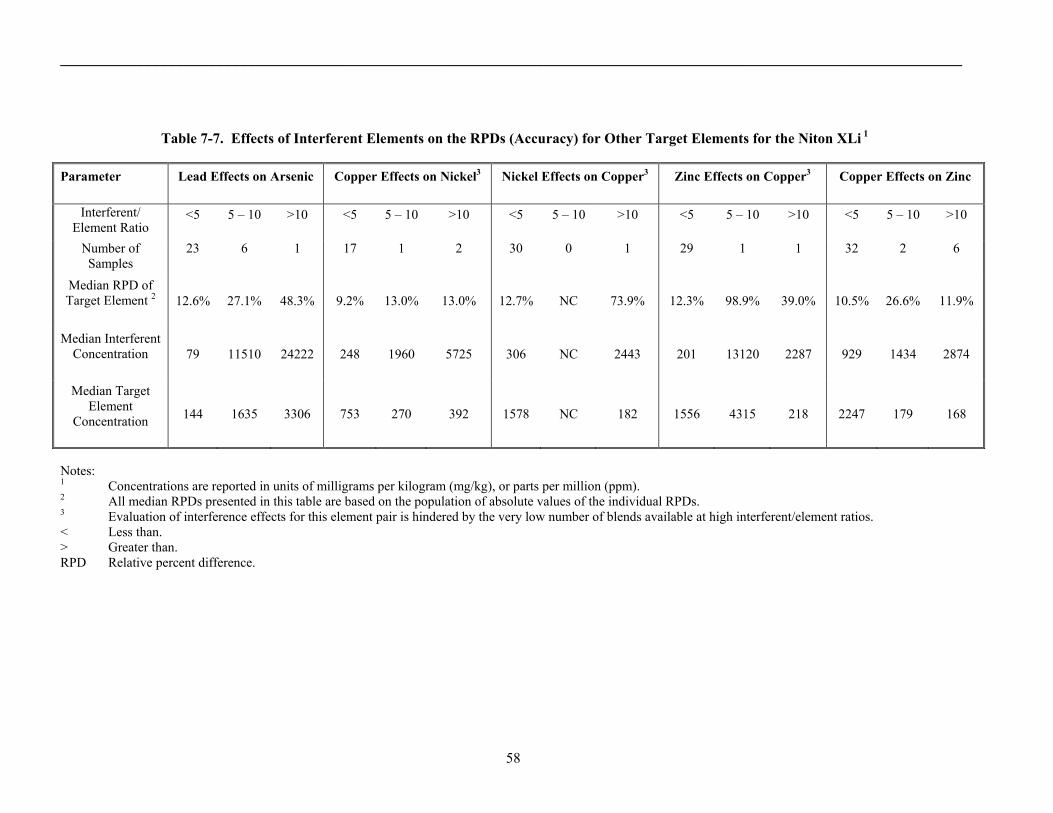
_________________________________________________________________________________________________________________
58
Table 7-7. Effects of Interferent Elements on the RPDs (Accuracy) for Other Target Elements for the Niton XLi 1
Parameter Lead Effects on Arsenic Copper Effects on Nickel3 Nickel Effects on Copper3 Zinc Effects on Copper3 Copper Effects on Zinc
Interferent/ Element Ratio
<5 5 – 10 >10 <5 5 – 10 >10 <5 5 – 10 >10 <5 5 – 10 >10 <5 5 – 10 >10
Number of Samples
23 6 1 17 1 2 30 0 1 29 1 1 32 2 6
Median RPD of Target Element 2 12.6% 27.1% 48.3% 9.2% 13.0% 13.0% 12.7% NC 73.9% 12.3% 98.9% 39.0% 10.5% 26.6% 11.9%
Median Interferent Concentration 79 11510 24222 248 1960 5725 306 NC 2443 201 13120 2287 929 1434 2874
Median Target Element
Concentration 144 1635 3306 753 270 392 1578 NC 182 1556 4315 218 2247 179 168
Notes: 1 Concentrations are reported in units of milligrams per kilogram (mg/kg), or parts per million (ppm). 2 All median RPDs presented in this table are based on the population of absolute values of the individual RPDs. 3 Evaluation of interference effects for this element pair is hindered by the very low number of blends available at high interferent/element ratios. < Less than. > Greater than. RPD Relative percent difference.

_________________________________________________________________________________________________________________
59
Table 7-8. Effect of Soil Type on the RPDs (Accuracy) for Target Elements, Niton XLi1
Antimony Arsenic Cadmium Chromium Copper Iron Lead Matrix Site
Matrix Description Statistic
Soil Number -- -- 2 -- 1 3 3
AS Fine to medium sand (steel processing) Median -- -- 24.6% -- 12.3% 14.8% 11.4%
Soil Number 4 4 5 2 4 7 7
BN Sandy loam, low organic (ore residuals) Median 116.8% 15.7% 16.9% 2.1% 22.5% 20.3% 10.8%
Soil Number 1 1 2 -- 2 3 3
CN Sandy loam (burn pit residue) Median 90.3% 25.8% 18.7% -- 22.9% 25.2% 42.5%
Soil & Number 2 -- -- 1 2 6 6 Sediment
KP Soil: Fine to medium quartz sand.Sed.: Sandy loam, high organic. (Gun and skeet ranges) Median 8.3% -- -- 24.1% 20.7% 9.1% 12.4%
Sediment Number 4 6 5 4 3 12 4
LV Clay/clay loam, salt crust (iron and other precipitates) Median 105.2% 6.4% 20.4% 2.2% 10.1% 26.1% 30.4%
Sediment Number 3 10 4 3 8 13 10
RF Silty fine sand (tailings) Median 94.6% 14.1% 22.7% 20.2% 12.4% 12.0% 9.1%
Soil Number 7 4 1 1 -- 12 1
SB Coarse sand and gravel (ore and waste rock) Median 117.9% 17.4% 27.6% 28.4% -- 4.5% 35.5%
Sediment Number 3 -- 2 -- 7 7 4
TL Silt and clay (slag-enriched) Median 144.9% -- 14.2% -- 6.4% 35.8% 18.9%
Soil Number 3 5 1 1 4 7 7
WS Coarse sand and gravel (roaster slag) Median 78.1% 48.3% 12.2% 15.8% 59.7% 27.5% 18.1%
All Number 27 30 22 12 31 70 45 Median 109.0% 15.9% 19.9% 16.6% 13.2% 17.8% 14.6%
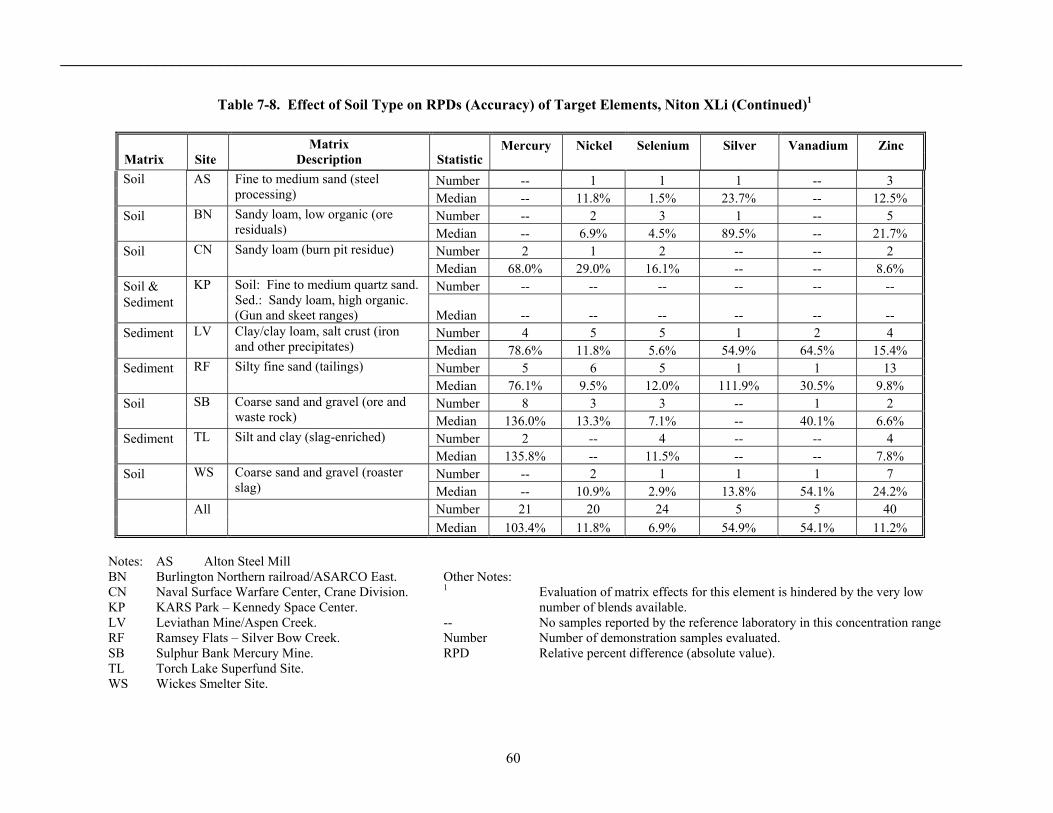
_________________________________________________________________________________________________________________
60
Table 7-8. Effect of Soil Type on RPDs (Accuracy) of Target Elements, Niton XLi (Continued)1
Soil Number -- 1 1 1 -- 3
AS Fine to medium sand (steel processing) Median -- 11.8% 1.5% 23.7% -- 12.5%
Soil Number -- 2 3 1 -- 5
BN Sandy loam, low organic (ore residuals) Median -- 6.9% 4.5% 89.5% -- 21.7%
Soil Number 2 1 2 -- -- 2
CN Sandy loam (burn pit residue) Median 68.0% 29.0% 16.1% -- -- 8.6%
Soil & Number -- -- -- -- -- -- Sediment
KP Soil: Fine to medium quartz sand.Sed.: Sandy loam, high organic. (Gun and skeet ranges) Median -- -- -- -- -- --
Sediment Number 4 5 5 1 2 4
LV Clay/clay loam, salt crust (iron and other precipitates) Median 78.6% 11.8% 5.6% 54.9% 64.5% 15.4%
Sediment Number 5 6 5 1 1 13
RF Silty fine sand (tailings) Median 76.1% 9.5% 12.0% 111.9% 30.5% 9.8%
Soil Number 8 3 3 -- 1 2
SB Coarse sand and gravel (ore and waste rock) Median 136.0% 13.3% 7.1% -- 40.1% 6.6%
Sediment Number 2 -- 4 -- -- 4
TL Silt and clay (slag-enriched) Median 135.8% -- 11.5% -- -- 7.8%
Soil Number -- 2 1 1 1 7
WS Coarse sand and gravel (roaster slag) Median -- 10.9% 2.9% 13.8% 54.1% 24.2%
All Number 21 20 24 5 5 40 Median 103.4% 11.8% 6.9% 54.9% 54.1% 11.2%
Notes: AS Alton Steel Mill
BN Burlington Northern railroad/ASARCO East. Other Notes: CN Naval Surface Warfare Center, Crane Division. 1 Evaluation of matrix effects for this element is hindered by the very low KP KARS Park – Kennedy Space Center. number of blends available. LV Leviathan Mine/Aspen Creek. -- No samples reported by the reference laboratory in this concentration range RF Ramsey Flats – Silver Bow Creek. Number Number of demonstration samples evaluated. SB Sulphur Bank Mercury Mine. RPD Relative percent difference (absolute value). TL Torch Lake Superfund Site. WS Wickes Smelter Site.
Mercury Nickel Selenium Silver Vanadium Zinc Matrix Site
Matrix Description Statistic

__________________________________________________________________________________
61
Another perspective on the effects of soil type was developed by graphically assessing outliers and extreme values in the RPD data sets for each target element. This evaluation focused on correlating these values with sample types or locations for multiple elements across the data set. Outliers and extreme values are apparent in the correlation plots (Figures E-1 through E-13) and are further depicted for the various elements on box and whisker plots in Figure E-14.
Review of Table 7-8 indicates that the median RPDs were highly variable and that trends or differences between sample sites were difficult to discern. Evaluations relative to sampling site were further complicated by the low numbers of samples for many target elements. (Table 7-8 indicates that only one to three samples were available from many sampling sites for evaluation of specific target elements.) The only extremes were for arsenic and copper in blends from the Wickes Smelter site. The median RPDs for arsenic and copper in these blends was in the range of 50 percent as compared to a maximum of 26 percent in the other blends. The soil matrix from this site was described during the demonstration sample collection program (Chapter 2) as roaster slag, consisting of a black, fairly coarse sand and gravel material. This slag is an intermediate product in processing ore, wherein volatile sulfide materials are thermally removed, leaving concentrated heavy elements. In addition to arsenic, copper, and zinc, this matrix was found to contain high concentrations of lead and iron. Effects of the Wickes Smelter sample blends on XRF data quality were noted earlier for arsenic, copper, and other metals in the accuracy evaluation (Section 7.2).
Review of the box and whisker plot (Figure E-14) and the correlation plots from the accuracy evaluation revealed outliers and extreme values that were distributed between four of the nine sampling sites. Along with the Wickes Smelter blends, multiple outliers were traceable to samples from the Torch Lake, Leviathan Mine, and Crane Division sites. However, the evaluation found that sample matrix had a minor effect on the overall accuracy of the XRF data given that the ranges of RPDs observed for the target elements were very broad. The spread in the accuracy results is illustrated on the box and whisker plot in Figure E-14. The plot shows the broad distributions of RPDs and illustrates that no high
outliers or extreme values were identified for antimony, mercury, or silver. Although no specific sampling sites were observed to cause the broad range of RPDs for antimony or silver, further data review indicated that the distribution of RPDs for mercury was affected by a number of high RPDs observed for blends from the Sulphur Bank mine site (Blends 19 through 26).
7.6 Primary Objective 6 — Sample Throughput
Niton provided a single instrument operator during the field demonstration to perform all activities associated with sample preparation, instrumental analysis, and data reduction. The Niton XLi instrument operator was able to analyze all 326 demonstration samples in 4 days at the demonstration site. Once the XLi instrument had been set up and operations had been streamlined, the Niton instrument operator was able to analyze a maximum of 92 samples during an extended work day. Without an extended work day, it was estimated that the Niton instrument operator would have averaged about 62 samples per day.
This estimated sample throughput for a normal working day was similar to that observed for the other instruments that participated in the demonstration (average of 66 samples per day). However, this was a significant achievement give that the other developers utilized two-person or even three-person field teams. A detailed discussion of the time required to complete the various steps of sample analysis using the XLi is included as part of the labor cost analysis in Section 8.3.
7.7 Primary Objective 7 — Technology Costs
The evaluations pertaining to this primary objective are described in Chapter 8, Economic Analysis.
7.8 Secondary Objective 1 — Training Requirements
Technology users must be suitably trained to set up and operate the instrument to obtain the level of data quality required for specific projects. The amount of training required depends on the configuration and complexity of the instrument, along with the associated software.
__________________________________________________________________________________
62
Niton recommends that the XLi operator have a high school diploma and basic on-site operational training. Field or laboratory technicians are generally qualified to operate the XLi. Additional understanding of soil chemical and physical properties would be valuable for preparing site-specific calibrations and for conducting specialty analyses. The operator of the instrument during the demonstration had a B.S. degree in chemistry and over 8 years of XRF instrument experience. The skill level of this operator was higher than is required to operate the XLi.
Niton offers free training on the use of field-portable XRF analyzers for lead and other elements. Most classes are 1 day unless otherwise indicated. Classes are offered often (two to six classes per month) at varying locations throughout the U.S. The course materials include instrument theory, operation, and application. In addition, the course material includes radiation safety training, which some states require for licensing on these instruments. The course covers the following topics:
• Radiation safety
• X-ray fluorescence theory
• Hands-on training for lead-in-paint testing
• Hands-on analysis of coatings for lead and other elements
• On-site analysis of dust wipes, soil (EPA Method 6200), and paint chips
• On-site analysis of worker exposure cassettes for airborne lead (National Institute of Occupational Safety and Health [NIOSH] Method #7702)
• On-site measurement of total suspended particulate (TSP) and fine particulate matter (PM10) filters for air monitoring
Participants are encouraged to bring samples to class to analyze as part of the hands-on exercise for the training. Niton also offers site-specific training by request and will customize the training to the field conditions, matrices, analytes, reporting limits, and data quality levels required for individual project objectives.
Niton has not established written standard operating procedures (SOPs) for the preparation or analysis of soil or sediment samples using the XLi. However, the instrument is accompanied by a clear and detailed operating manual that presents the general steps in analyzing soil and other environmental media. Instrument software is also helpful in directing users with intuitive operating menus. Niton and its distributors offer on-site training and telephone support to instrument users on an informal, as needed basis.
In addition to the general instrument operational instruction and training, the operator and data manager must become familiar with Niton’s data acquisition software loaded onto the instrument. Niton provides a copy of the NDT PC software for each instrument. Although a PC is not required to acquire data, a laptop PC can be useful because the smaller instrument display can be projected onto the larger PC screen for easier viewing. In addition, data can be simultaneously recorded and stored in the PC, thereby maximizing data collection efficiency while minimizing the potential for lost data or transcription errors.
7.9 Secondary Objective 2 — Health and Safety
Included in the health and safety evaluation were the potential risks from: (1) potential radiation hazards from the instrument itself, and (2) exposure to any reagents used in preparing and analyzing the samples. However, the evaluation did not include potential risks from exposure to site-specific hazardous materials, such as sample contaminants, or to physical safety hazards. These factors were excluded because of the wide and unpredictable range of sites and conditions that could be encountered in the field during an actual project application of the instrument.
The XLi holds up to three different radioisotope sources. The following three sources were used during the field demonstration: primary (109Cd) and secondary (55Fe and 241Am). Each instrument is equipped with a trigger locking mechanism and safety measures designed into the hardware and software. The developer reports that risks from exposure to radiation are minimal; the radiation detected from around the instrument during operation has been recorded at 0.1 milliRem per hour.
__________________________________________________________________________________
63
The second potential source of risk to XRF instrument operators is exposure to reagent chemicals. However, for the XLi, there are no risks from reagents used in sample preparation because no chemical reagents are required for sample preparation.
7.10 Secondary Objective 3 — Portability
Portability depends on the size, weight, number of components, and power requirements of the instrument, and the reagents required. The size of the instrument, including physical dimensions and weight, is presented in Table 6-1. The number of components, power requirements, support structures, and reagent requirements are also listed in Table 6-1. Two distinctions were made during the demonstration regarding portability:
(1) The instrument was considered fully portable if the dimensions were such that the instrument could be easily brought directly to the sample location by one person.
(2) The instrument was considered transportable if the dimensions and power requirements were such that the instrument could be moved to a location near the sampling location, but required a larger and more stable environment (for example, a site trailer with AC power and stable conditions).
Based on its dimensions and power requirements, the XLi is defined as fully portable. It is a hand-held unit that can be carried directly to the sampling location for analysis of samples. The XLi is suitable for all types of field analysis, ranging from “point-and-shoot” readings on undisturbed soil surfaces to processed soil samples in plastic bags or sample cups. With an additional instrument stand, the XLi can also be used in a hands-free, bench-top mode. This instrument stand was used during the demonstration.
7.11 Secondary Objective 4 — Durability
Durability was evaluated by gathering information on the instrument’s warranty and the expected lifespan of the radioactive source or x-ray tube. The ability to
upgrade software or hardware also was evaluated. Weather resistance was evaluated by examining the instrument for exposed electrical connections and openings that may allow water to penetrate (for portable instruments only).
The outer construction of the XLi consists of a hard-tooled plastic that is durable, weatherproof, and impact-resistant. The instrument is intrinsically tight and 100 percent waterproof; it can be submerged or dropped in water with no damage to the inner workings of the instrument. The shape of the XLi was designed to fit within pipe portals and process pipes. The external PC can be attached via USB port and cable. If the PC data acquisition system is used, it is recognized that the PC may not be weatherproof and should be used only in a protected environment. In addition, the instrument can be outfitted with wireless communications to further aid in data transfer. However, these modes of operation were not assessed during the demonstration.
Niton provides a 24-month limited warranty for the XLi instrument. The warranty does not cover batteries, radioisotope sources, or accessories. The half-life of the Cd-109 source is about 18 months; the half-life of the Fe-55 source is about 2.74 years; and the half-life of the Am-241 source is about 432 years. As such, the effective lifespan of the cadmium and iron sources is less than 2 years.
7.12 Secondary Objective 5 — Availability
Niton was founded in 1987 and has two offices in the U.S. and one office in Germany. Niton reports sales of more than 1,000 new instruments each year both in the U.S and abroad. The XLi is also available for purchase or rental from a nationwide network of distributors, and many can provide on-site training. The instrument can be repaired, maintained, and calibrated by the distributors or at the factory in Massachusetts. Niton also operates a telephone helpline in both the U.S. and Europe.

__________________________________________________________________________________
64
This page was left blank intentionally.

______________________________________________________________________________________
65
Chapter 8 Economic Analysis
This chapter provides cost information for the Niton XLi 700 Series XRF analyzer. Cost elements that were addressed included instrument purchase or rental, supplies, labor, and ancillary items. Sources of cost information included input from the technology developer and suppliers as well as observations during the field demonstration. Comparisons are provided to average costs for other XRF technologies and for conventional fixed-laboratory analysis to provide some perspective on the relative cost of using the XLi.
8.1 Equipment Costs
Capital equipment costs include either purchase or rental of the XLi and any ancillary equipment that is generally needed for sample analysis. (See Chapter 6 for a description of available accessories.) Information on purchase price and rental cost for the analyzer and accessories was obtained from licensed Niton distributors.
The XLi used at the demonstration costs approximately $42,000, including the three radioactive sources used; 109Cd, 55Fe, and 241Am. The instrument with only the primary source (109Cd) costs approximately $29,000. The base cost includes peripherals such as the instrument stand, covers, communication cables, and 110-volt adapter. A laptop computer is also recommended to manipulate the data but is not included in the base cost. The instrument is available for rental by licensed Niton distributors.
Purchased models include a 2-year warranty. The half–life for the 109Cadium isotope is 18 months. As the unit automatically adjusts for source decay, the useful life of an isotope is based on the user’s throughput requirements. However, most find it necessary to resource every 3-5 years. The half-life for the 55Fe source is 2.74 years; and most find it necessary to replace the x-ray source every 5-8 years. The 241Am source would be expected to last indefinitely because its half-life is 432.2 years.
The purchase price, rental cost, and shipping cost for the XLi compare favorably with the average costs for all XRF instruments that participated in the demonstration, as shown in Table 8-1. Purchase of the instrument could be justified as more cost effective than rental only for field activities that involve more than about 6 months of total field analysis time.
Table 8-1. Equipment Costs
Cost Element Niton XLi
XRF Demonstration
Average 1 Shipping $240 $410 Capital Cost (Purchase)
$42,000 $54,300
Weekly Rental $1,600 $2,813 Autosampler (for Overnight Analysis) N/A N/A
Notes: 1 Average for all eight instruments in the demonstration N/A Not available or not applicable for this
comparison 8.2 Supply Costs
The supplies that were included in the cost estimate include sample containers, Mylar® film, spatulas or scoops, wipes, and disposable gloves. The rate of consumption for these supplies was based on observations during the field demonstration. Unit prices for these supplies were based on price quotes from independent vendors of field equipment.
The XLi was operated for 4 days to complete the analysis of all 326 samples during the field demonstration. The supplies required to process samples were similar for all XRF instruments that participated in the demonstration and were estimated to cost about $245 for 326 samples or $0.75 per sample.

__________________________________________________________________________________
66
8.3 Labor Costs
Labor costs were estimated based on the total time required by the field team to complete the analysis of all 326 samples and the number of people in the field team, while making allowances for field team members that had responsibilities other than sample processing during the demonstration. For example, some developers sent sales representatives to the demonstration to communicate with visitors and provide outreach services; this type of staff time was not included in the labor cost analysis.
While overall labor costs were based on the total time required to process samples, the time required to complete each definable activity was also measured during the field demonstration. These activities included:
• Initial setup and calibration
• Sample preparation
• Sample analysis
• Daily shutdown and startup
• End of project packing
The “total processing time per sample” was calculated as the sum of all these activities assuming that the activities were conducted sequentially; therefore, it represents how much time it would take a single trained analyst to complete these activities. However, the “total processing time per sample” does not include activities that were less definable in terms of the amount of time taken, such as data management and procurement of supplies, and is
therefore not a true total.
The time to complete each activity using the XLi is compared with the average of all XRF instruments in Table 8-2 and with the range of all XRF instruments in Figure 8-1. Specifically, the XLi compared favorably against the other XRF instruments, exhibiting lower-than-average times for all activities except for daily shutdown and startup. The field observer noted that the sample analysis times measured in the demonstration were lengthened by the age of the radioactive sources. The observer estimated that the older sources lengthened the sample analysis time by about 2 minutes per sample.
Table 8-2. Time Required to Complete Analytical Activities1
Activity Niton XLi Average2
Initial Setup and Calibration 30 54 Sample Preparation 2.0 3.1 Sample Analysis 5.5 6.7 Daily Shutdown/Startup 10 10 End of Project Packing 10 43 Total Processing Time per Sample 7.7 10.0
Notes: 1 All estimates are in minutes 2 Average for all eight XRF instruments in the demonstration

______________________________________________________________________________________
67
0 20 40 60 80 100 120 140
Minutes
End of project packing
Daily Shut Down/Start Up
Total Processing Time
Sample Analysis
Sample Preparation
Initial Set up and Calibration
Figure 8-1. Comparison of activity times for the XLi versus other XRF instruments.
The Niton field team expended about 42 labor hours to complete all sample processing activities during the field demonstration using the XLi. This was significantly lower than the overall average of 69 hours for all instruments that participated in the demonstration. The primary reasons that labor hours were lower for the XLi include: • Instrument run times (5.5 minutes) were
significantly less than many other instruments. • The instrument operation was simple enough that
a single technician performed all sample preparation and analysis activities during the demonstration.
• The software-based automation of the XLi
allowed the operator to reduce the data for completed sample batches on a laptop PC while the instrument was processing a new batch.
Instrument run times and labor hours could have been reduced if the radioactive sources used in the instrument were new. 8.4 Comparison of XRF Analysis and
Reference Laboratory Costs
Two scenarios were evaluated to compare the cost for XRF analysis using the XLi with the cost of fixed-laboratory analysis using the reference methods. Both scenarios assumed that 326 samples were to be analyzed, as in the field demonstration. The first scenario assumed that only one element was to be measured in a metal-specific project or application (for example, lead in soil, paint, or other solids) for comparison to laboratory per-metal unit costs. The second scenario assumed that 13 elements were to be analyzed, as in the field demonstration, for comparison to laboratory costs for a full suite of metals.
Niton XLi
Range for all eight XRF instruments
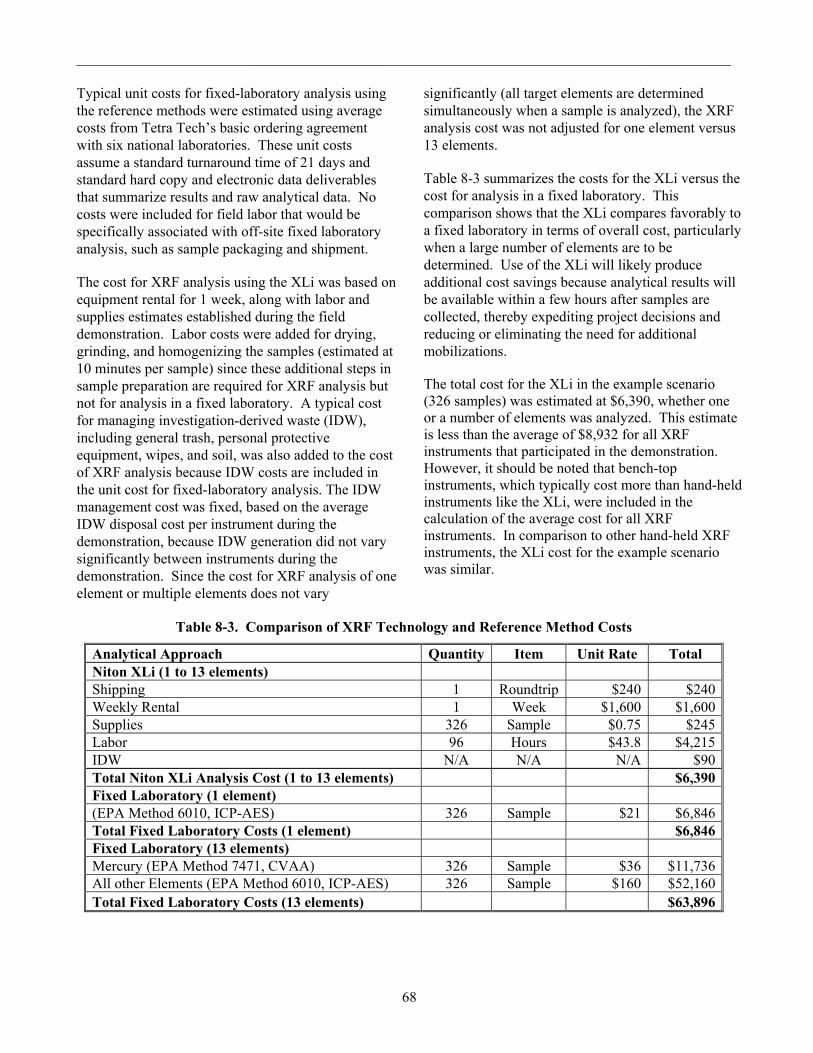
__________________________________________________________________________________
68
Typical unit costs for fixed-laboratory analysis using the reference methods were estimated using average costs from Tetra Tech’s basic ordering agreement with six national laboratories. These unit costs assume a standard turnaround time of 21 days and standard hard copy and electronic data deliverables that summarize results and raw analytical data. No costs were included for field labor that would be specifically associated with off-site fixed laboratory analysis, such as sample packaging and shipment.
The cost for XRF analysis using the XLi was based on equipment rental for 1 week, along with labor and supplies estimates established during the field demonstration. Labor costs were added for drying, grinding, and homogenizing the samples (estimated at 10 minutes per sample) since these additional steps in sample preparation are required for XRF analysis but not for analysis in a fixed laboratory. A typical cost for managing investigation-derived waste (IDW), including general trash, personal protective equipment, wipes, and soil, was also added to the cost of XRF analysis because IDW costs are included in the unit cost for fixed-laboratory analysis. The IDW management cost was fixed, based on the average IDW disposal cost per instrument during the demonstration, because IDW generation did not vary significantly between instruments during the demonstration. Since the cost for XRF analysis of one element or multiple elements does not vary
significantly (all target elements are determined simultaneously when a sample is analyzed), the XRF analysis cost was not adjusted for one element versus 13 elements.
Table 8-3 summarizes the costs for the XLi versus the cost for analysis in a fixed laboratory. This comparison shows that the XLi compares favorably to a fixed laboratory in terms of overall cost, particularly when a large number of elements are to be determined. Use of the XLi will likely produce additional cost savings because analytical results will be available within a few hours after samples are collected, thereby expediting project decisions and reducing or eliminating the need for additional mobilizations.
The total cost for the XLi in the example scenario (326 samples) was estimated at $6,390, whether one or a number of elements was analyzed. This estimate is less than the average of $8,932 for all XRF instruments that participated in the demonstration. However, it should be noted that bench-top instruments, which typically cost more than hand-held instruments like the XLi, were included in the calculation of the average cost for all XRF instruments. In comparison to other hand-held XRF instruments, the XLi cost for the example scenario was similar.
Table 8-3. Comparison of XRF Technology and Reference Method Costs
Analytical Approach Quantity Item Unit Rate Total Niton XLi (1 to 13 elements) Shipping 1 Roundtrip $240 $240Weekly Rental 1 Week $1,600 $1,600Supplies 326 Sample $0.75 $245Labor 96 Hours $43.8 $4,215IDW N/A N/A N/A $90Total Niton XLi Analysis Cost (1 to 13 elements) $6,390Fixed Laboratory (1 element) (EPA Method 6010, ICP-AES) 326 Sample $21 $6,846Total Fixed Laboratory Costs (1 element) $6,846Fixed Laboratory (13 elements) Mercury (EPA Method 7471, CVAA) 326 Sample $36 $11,736All other Elements (EPA Method 6010, ICP-AES) 326 Sample $160 $52,160Total Fixed Laboratory Costs (13 elements) $63,896
______________________________________________________________________________________
69
Chapter 9
Summary of Technology PerformanceThe preceding chapters of this report document that the evaluation design succeeded in providing detailed performance data for the Niton XLi XRF analyzer. All primary and secondary objectives for the performance evaluation were met.
The evaluation design incorporated 13 target elements, 70 distinct sample blends, and a total of 326 samples. The blends included both soil and sediment samples from nine sampling locations. A rigorous program of sample preparation and characterization, reference laboratory analysis, QA/QC oversight, and data reduction supported the evaluation of XRF instrument performance.
One important aspect of the demonstration was the sample blending and processing procedures (including drying, sieving, grinding, and homogenization) that significantly reduced uncertainties associated with the demonstration sample set. These procedures minimized the impacts of heterogeneity on method precision and on the comparability between XRF data and reference laboratory data. In like manner, project teams are encouraged to assess the effects of sampling uncertainty on data quality and to adopt appropriate sample preparation protocols before XRF is used for large-scale data collection, particularly if the project will involve comparisons to other methods (such as off-site laboratories). An initial pilot-scale method evaluation, carried out in cooperation with an instrument vendor, can yield site-specific standard operating procedures for sample preparation and analysis to ensure that the XRF method will meet data quality needs, such as accuracy and sensitivity requirements. A pilot study can also help the project team develop an initial understanding of the degree of correlation between field and laboratory data. This type of study is especially appropriate for sampling programs that will involve complex soil or sediment matrices with high concentrations of multiple elements because the demonstration found that XRF performance was more variable under these
conditions. Initial pilot studies can also be used to develop site-specific calibrations, in accordance with EPA Method 6200, that adjust instrument algorithms to compensate for matrix effects.
The findings of the evaluation of the XLi for each primary and secondary objective are summarized in Tables 9-1 and 9-2. The XLi and the average performance of all eight instruments that participated in the XRF technology demonstration are compared in Figure 9-1. The comparison in Figure 9-1 indicates that, when compared with the mean performance of all eight XRF instruments, the XLi showed:
• Equivalent or better MDLs for two elements, including lead and mercury. (Iron was not included in the MDL evaluation.)
• Equivalent or better accuracy (lower RPDs) for nine of the 13 target elements. (Exceptions include antimony, mercury, silver, and vanadium.). Moreover, when RPDs for antimony are calculated versus sample spike levels rather than reference laboratory data (which may be biased low), accuracy for antimony improves to better than the program as whole.
• Equivalent or better precision (lower RSDs) for eight of the 13 target elements. (Exceptions include cadmium, chromium, mercury, selenium, and silver.)
The XLi is fully portable and can be operated in the hand-held mode at a sampling site. Although good overall performance was observed for this instrument, sensitivity was lower overall (that is, MDLs were higher) than for other XRF analyzers in the performance evaluation, all of which used x-ray tube sources rather than the radioisotope sources used by the XLi. The low sensitivity of the instrument resulted in small data sets for some target elements, creating uncertainty in the findings for some primary objectives.

__________________________________________________________________________________
70
Table 9-1. Summary of Niton XLi Performance – Primary Objectives Objective Performance Summary P1: Method Detection Limits
• A lack of detections in the MDL sample blends precluded the calculation of MDLs for silver and vanadium. The low number of detections in the MDL blends produced limited data for the other target elements as well, increasing the uncertainty associated with the MDL evaluation.
• Mean MDLs for the target elements ranged as follows: o MDLs of 1 to 20 ppm: selenium. o MDLs of 20 to 50 ppm: arsenic, lead, and mercury. o MDLs of 50 to 100 ppm: antimony and zinc. o MDLs of greater than 100 ppm: cadmium, chromium, copper, and nickel.
(Iron was not included in the MDL evaluation.) • The MDLs calculated for the XLi were generally lower than reference MDL data from
EPA Method 6200. Exceptions included antimony and cadmium, where higher MDLs were observed with the XLi.
P2: Accuracy and Comparability
• Median RPDs relative to reference laboratory data revealed the following, with lower RPDs indicating greater accuracy:
o RPDs less than 10 percent: selenium. o RPDs of 10 to 25 percent: arsenic, cadmium, chromium, copper, iron, lead,
nickel, and zinc. o RPDs of 25 to 50 percent: none. o RPDs of greater than 50 percent: antimony, mercury, silver, and vanadium.
• Correlation plots relative to reference laboratory data indicated: o High correlation coefficients (greater than 0.9) for 11 of the 13 target elements. o Low to moderate correlation coefficients for copper and vanadium.
Furthermore, a moderate degree of correlation for mercury was artificially improved by a few extreme concentrations.
o High biases in the XRF data versus the lab data for antimony, arsenic, cadmium, lead, silver, vanadium, and zinc. For a number of these metals, the high biases were largely created by extreme values associated with roaster slag matrixes from the Wickes Smelter site. Low biases were observed for chromium and mercury.
• Data review indicated that the reference laboratory results for some spiked demonstration samples may be biased low for antimony due to the volatility of the spiking compounds used. RPDs for antimony were quite high when the XLi data was compared to the reference laboratory data (median RPD of 109 percent), but improved considerably when compared to certified spike values (median RPD of 5 percent). Thus, the XLi appeared to be more accurate with respect to the true concentration of antimony than the reference laboratory.
• Significant uncertainty was introduced into the accuracy assessment for silver and vanadium because the low sensitivity of the instrument limited the sample blends available for evaluation.
P3: Precision • Median RSDs were good for all elements, as follows: o RSDs less than 5 percent: iron, lead, and zinc. o RSDs of 5 to 10 percent: antimony, arsenic, cadmium, copper, mercury,
nickel, selenium, and vanadium. o RSDs of 10 to 20 percent: chromium and silver. o RSDs greater than 20 percent: none.
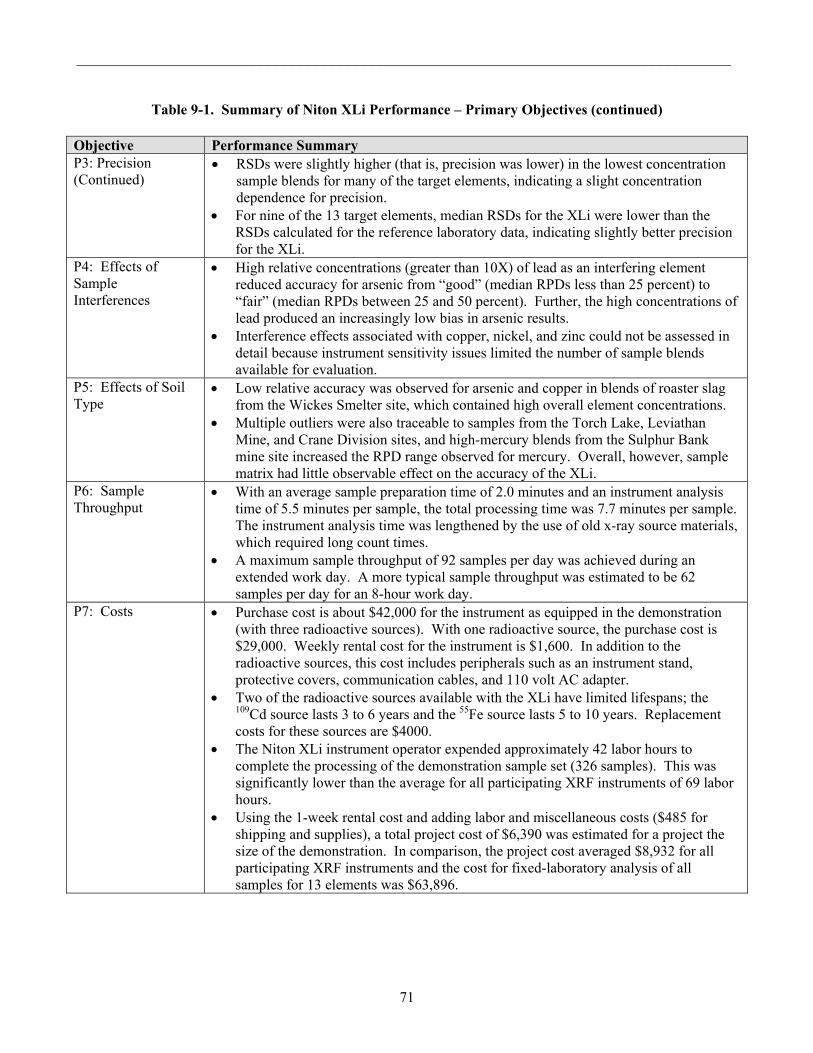
__________________________________________________________________________________
71
Table 9-1. Summary of Niton XLi Performance – Primary Objectives (continued)
Objective Performance Summary P3: Precision (Continued)
• RSDs were slightly higher (that is, precision was lower) in the lowest concentration sample blends for many of the target elements, indicating a slight concentration dependence for precision.
• For nine of the 13 target elements, median RSDs for the XLi were lower than the RSDs calculated for the reference laboratory data, indicating slightly better precision for the XLi.
P4: Effects of Sample Interferences
• High relative concentrations (greater than 10X) of lead as an interfering element reduced accuracy for arsenic from “good” (median RPDs less than 25 percent) to “fair” (median RPDs between 25 and 50 percent). Further, the high concentrations of lead produced an increasingly low bias in arsenic results.
• Interference effects associated with copper, nickel, and zinc could not be assessed in detail because instrument sensitivity issues limited the number of sample blends available for evaluation.
P5: Effects of Soil Type
• Low relative accuracy was observed for arsenic and copper in blends of roaster slag from the Wickes Smelter site, which contained high overall element concentrations.
• Multiple outliers were also traceable to samples from the Torch Lake, Leviathan Mine, and Crane Division sites, and high-mercury blends from the Sulphur Bank mine site increased the RPD range observed for mercury. Overall, however, sample matrix had little observable effect on the accuracy of the XLi.
P6: Sample Throughput
• With an average sample preparation time of 2.0 minutes and an instrument analysis time of 5.5 minutes per sample, the total processing time was 7.7 minutes per sample. The instrument analysis time was lengthened by the use of old x-ray source materials, which required long count times.
• A maximum sample throughput of 92 samples per day was achieved during an extended work day. A more typical sample throughput was estimated to be 62 samples per day for an 8-hour work day.
P7: Costs • Purchase cost is about $42,000 for the instrument as equipped in the demonstration (with three radioactive sources). With one radioactive source, the purchase cost is $29,000. Weekly rental cost for the instrument is $1,600. In addition to the radioactive sources, this cost includes peripherals such as an instrument stand, protective covers, communication cables, and 110 volt AC adapter.
• Two of the radioactive sources available with the XLi have limited lifespans; the 109Cd source lasts 3 to 6 years and the 55Fe source lasts 5 to 10 years. Replacement costs for these sources are $4000.
• The Niton XLi instrument operator expended approximately 42 labor hours to complete the processing of the demonstration sample set (326 samples). This was significantly lower than the average for all participating XRF instruments of 69 labor hours.
• Using the 1-week rental cost and adding labor and miscellaneous costs ($485 for shipping and supplies), a total project cost of $6,390 was estimated for a project the size of the demonstration. In comparison, the project cost averaged $8,932 for all participating XRF instruments and the cost for fixed-laboratory analysis of all samples for 13 elements was $63,896.
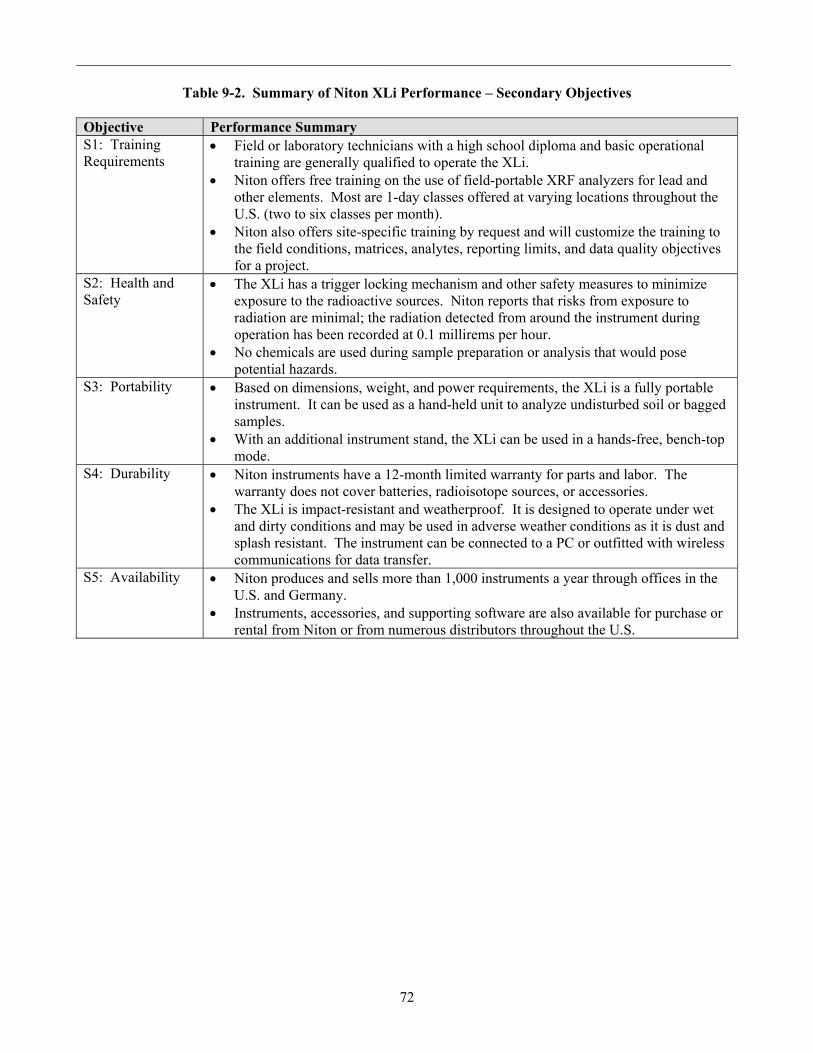
__________________________________________________________________________________
72
Table 9-2. Summary of Niton XLi Performance – Secondary Objectives Objective Performance Summary S1: Training Requirements
• Field or laboratory technicians with a high school diploma and basic operational training are generally qualified to operate the XLi.
• Niton offers free training on the use of field-portable XRF analyzers for lead and other elements. Most are 1-day classes offered at varying locations throughout the U.S. (two to six classes per month).
• Niton also offers site-specific training by request and will customize the training to the field conditions, matrices, analytes, reporting limits, and data quality objectives for a project.
S2: Health and Safety
• The XLi has a trigger locking mechanism and other safety measures to minimize exposure to the radioactive sources. Niton reports that risks from exposure to radiation are minimal; the radiation detected from around the instrument during operation has been recorded at 0.1 millirems per hour.
• No chemicals are used during sample preparation or analysis that would pose potential hazards.
S3: Portability • Based on dimensions, weight, and power requirements, the XLi is a fully portable instrument. It can be used as a hand-held unit to analyze undisturbed soil or bagged samples.
• With an additional instrument stand, the XLi can be used in a hands-free, bench-top mode.
S4: Durability • Niton instruments have a 12-month limited warranty for parts and labor. The warranty does not cover batteries, radioisotope sources, or accessories.
• The XLi is impact-resistant and weatherproof. It is designed to operate under wet and dirty conditions and may be used in adverse weather conditions as it is dust and splash resistant. The instrument can be connected to a PC or outfitted with wireless communications for data transfer.
S5: Availability • Niton produces and sells more than 1,000 instruments a year through offices in the U.S. and Germany.
• Instruments, accessories, and supporting software are also available for purchase or rental from Niton or from numerous distributors throughout the U.S.
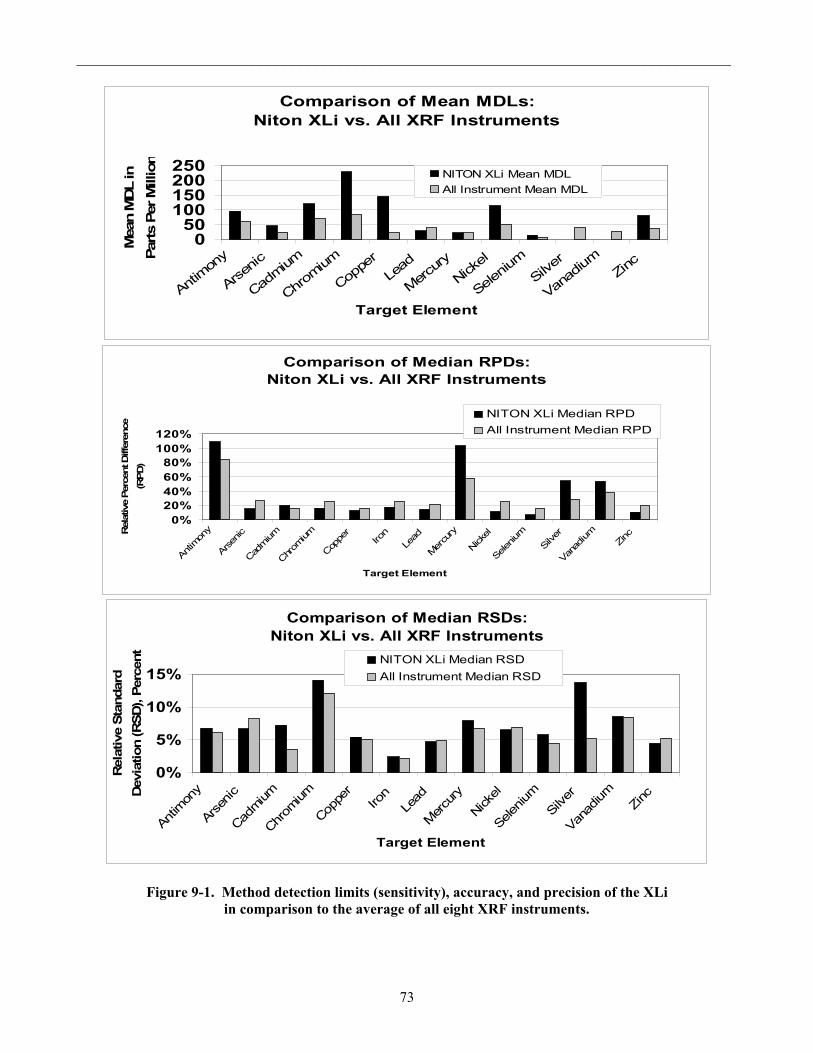
__________________________________________________________________________________
73
Comparison of Mean MDLs: Niton XLi vs. All XRF Instruments
050
100150200250
Antimon
y
Arsenic
Cadmium
Chromium
Coppe
rLe
ad
Mercury
Nickel
Seleniu
mSilv
er
Vanad
ium Zinc
Target Element
Mea
n M
DL
in
Parts
Per M
illio
n
NITON XLi Mean MDLAll Instrument Mean MDL
Comparison of Median RPDs:
Niton XLi vs. All XRF Instruments
0%20%40%60%80%
100%120%
Antimon
y
Arsenic
Cadmium
Chrom
ium
Coppe
rIro
nLe
ad
Mercu
ry
Nickel
Seleniu
mSilv
er
Vanad
ium Zinc
Target Element
Rel
ativ
e Pe
rcen
t Diff
eren
ce
(RPD
)
NITON XLi Median RPDAll Instrument Median RPD
Comparison of Median RSDs:
Niton XLi vs. All XRF Instruments
0%
5%
10%
15%
Antimon
y
Arsenic
Cadmium
Chrom
ium
Coppe
rIro
nLe
ad
Mercury
Nickel
Seleniu
mSilv
er
Vanad
ium Zinc
Target Element
Rel
ativ
e St
anda
rd
Dev
iatio
n (R
SD),
Perc
ent
NITON XLi Median RSDAll Instrument Median RSD
Figure 9-1. Method detection limits (sensitivity), accuracy, and precision of the XLi in comparison to the average of all eight XRF instruments.

______________________________________________________________________________________
74
This page was left blank intentionally.
______________________________________________________________________________________
75
Chapter 10 References
Gilbert, R.O. 1987. Statistical Methods for
Environmental Pollution Monitoring. Van Nostrand Reinhold, New York.
Tetra Tech EM Inc. 2005. Demonstration and
Quality Assurance Plan. Prepared for U.S. Environmental Protection Agency, Superfund Innovative Technology Evaluation Program. March.
U.S. Environmental Protection Agency (EPA).
1996a. TN Spectrace TN 9000 and TN Pb Field Portable X-ray Fluorescence Analyzers. EPA/600/R-97/145. March.
EPA. 1996b. Field Portable X-ray Fluorescence
Analyzer HNU Systems SEFA-P. EPA/600/R-97/144. March.
EPA. 1996c. Test Methods for Evaluating Solid
Waste, Physical/Chemical Methods (SW-846). December.
EPA. 1998a. Environmental Technology
Verification Report; Field Portable X-ray Fluorescence Analyzer, Metorex X-Met 920-MP. EPA/600/R-97/151. March.
EPA. 1998b. Environmental Technology
Verification Report; Field Portable X-ray Fluorescence Analyzer, Niton XL Spectrum Analyzer. EPA/600/R-97/150. March.
EPA. 1998c. Scitect MAP Spectrum Analyzer Field Portable X-Ray Fluorescence Analyzers. EPA/600/R-97/147. March.
EPA. 1998d. Metorex X-MET 920-P and 940 Field
Portable X-ray Fluorescence Analyzers. EPA/600/R-97/146. March.
EPA. 1998e. EPA Method 6200, from “Test
Methods for Evaluating Solid Waste, Physical/Chemical Methods (SW-846), Update IVA. December.
EPA. 2000. Guidance for Data Quality
Assessment: Practical Methods for Data Analysis. EPA QA/G-9 QA00 Update. EPA/600/R-96/084. July.
EPA. 2004a. Innovative Technology Verification
Report: Field Measurement Technology for Mercury in Soil and Sediment - Metorex’s X-MET® 2000 X-Ray Fluorescence Technology. EPA/600/R-03/149. May.
EPA. 2004b. Innovative Technology Verification
Report: Field Measurement Technology for Mercury in Soil and Sediment - Niton’s XLi/XLt 700 Series X-Ray Fluorescence Analyzers. EPA/600/R-03/148. May.
EPA. 2004c. USEPA Contract Laboratory
Program National Functional Guidelines for Inorganic Data Review. Final. OSWER 9240.1-45. EPA 540-R-04-004. October.

APPENDIX A
VERIFICATION STATEMENT
A-1
UNITED STATES ENVIRONMENTAL PROTECTION AGENCY Office of Research and Development
Washington, DC 20460
SITE Monitoring and Measurement Technology Program
Verification Statement
VERIFICATION PROGRAM DESCRIPTION
The U.S. Environmental Protection Agency (EPA) created the Superfund Innovative Technology Evaluation (SITE) Monitoring and Measurement Technology (MMT) Program to facilitate deployment of innovative technologies through performance verification and information dissemination. The goal of this program is to further environmental protection by substantially accelerating the acceptance and use of improved and cost-effective technologies. The program assists and informs those involved in designing, distributing, permitting, and purchasing environmental technologies. This document summarizes the results of a demonstration of the Niton XLi 700 Series portable x-ray fluorescence (XRF) analyzer for the analysis of 13 target elements in soil and sediment, including antimony, arsenic, cadmium, chromium, copper, iron, lead, mercury, nickel, selenium, silver, vanadium, and zinc. PROGRAM OPERATION Under the SITE MMT Program, with the full participation of the technology developers, EPA evaluates and documents the performance of innovative technologies by developing demonstration plans, conducting field tests, collecting and analyzing demonstration data, and preparing reports. The technologies are evaluated under rigorous quality assurance protocols to produce well-documented data of known quality. EPA’s National Exposure Research Laboratory, which demonstrates field sampling, monitoring, and measurement technologies, selected Tetra Tech EM Inc. as the verification organization to assist in field testing technologies for measuring trace elements in soil and sediment using XRF technology. DEMONSTRATION DESCRIPTION The field demonstration of eight XRF instruments to measure trace elements in soil and sediment was conducted from January 24 through 28, 2005, at the Kennedy Athletic, Recreational and Social (KARS) Park, which is part of the Kennedy Space Center on Merritt Island, Florida. A total of 326 samples were analyzed by each XRF instrument, including the XLi, during the field demonstration. These samples were derived from 70 different blends and spiked blends of soil and sediment collected from nine sites across the U.S. The sample blends were thoroughly dried, sieved, crushed, mixed, and characterized before they were used for the demonstration. Some blends were also spiked to further adjust and refine the concentration ranges of the target elements. Between three
TECHNOLOGY TYPE: X-ray Fluorescence (XRF) Analyzer APPLICATION: MEASUREMENT OF TRACE ELEMENTS IN SOIL AND SEDIMENT TECHNOLOGY NAME: XLi 700 Series XRF Analyzer COMPANY: NITON Analyzers, A Division of Thermoelectron ADDRESS: 900 Middlesex Turnpike, Building #8 Billerica, MA 01821 Telephone: (800) 875-1578 Fax: 978-670-7430 Email: [email protected] Internet: www.niton.com

A-2
and seven replicate samples of each blend were included in the demonstration sample set and analyzed by the technology developers during the field demonstration. Shealy Environmental Services, Inc. (Shealy), of Cayce, South Carolina, was selected as the reference laboratory to generate comparative data in evaluation of XRF instrument performance. Shealy analyzed all demonstration samples (both environmental and spiked) concurrently with the developers during the field demonstration. The samples were analyzed by inductively coupled plasma–atomic emission spectroscopy (ICP-AES) using EPA SW-846 Method 3050B/6010B and by cold vapor atomic absorption spectroscopy (CVAA) using EPA SW-846 Method 7471A (mercury only). This verification statement provides a summary of the evaluation results for the Niton XLi 700 Series XRF analyzer. More detailed discussion can be found in the Innovative Technology Verification Report – XRF Technologies for Measuring Trace Elements in Soil and Sediment: Niton XLi XRF Analyzer (EPA/540/R-06/003). TECHNOLOGY DESCRIPTION XRF spectroscopy is an analytical technique that exposes a sample (soil, alloy metal, filters, other solids, and thin samples) to an x-ray source. The x-rays from the source have the appropriate excitation energy that causes elements in the sample to emit characteristic x-rays. A qualitative elemental analysis is possible from the characteristic energy, or wavelength, of the fluorescent x-rays emitted. A quantitative elemental analysis is possible from the number (intensity) of x-rays at a given wavelength. The XLi is a small, field portable isotope-based XRF analyzer designed for chemical characterization of soils, sediment, and other thick homogeneous samples (plastics and metals).. It can be outfitted with various isotope options to best fit the environmental application needs of the customer. Niton offers the XLi with up to a 40 milliCurie (mCi) 109cadmium (Cd) source for standard elemental analyses of up to 15 elements. The instrument used during the demonstration was equipped with a 10mCi source. Optional isotope sources that can be fitted into the same XRF analyzer are the 14 mCi 241Americium (Am) source for heavy elements and the 20 mCi 55Iron (Fe) source for light elements. Also available is a patented “Infiniton” 241Am source for general analysis of up to 25 elements in bulk samples. Other features of the XLi include an integrated touch-screen display; completely sealed housing to protect the analyzer from moisture and dust; lithium-ion batteries; integrated bar code reader and virtual keypad; remote operation and custom report generation capability from a Windows-based PC; shielded bench-top test stand; and Bluetooth wireless communication to a laptop or personal data assistant (PDA). The instrument is factory-calibrated to simultaneously analyze up to 25 elements, but is also capable of handling user-generated empirical calibrations for specific applications. VERIFICATION OF PERFORMANCE Method Detection Limit: MDLs were calculated using seven replicate analyses from each of 12 low-concentration sample blends, according to the procedure described in Title 40 Code of Federal Regulations (CFR) Part 136, Appendix B, Revision 1.11. A mean MDL was further calculated for each element (lower MDLs indicate higher sensitivity). The ranges into which the mean MDLs fell for the XLi are listed below. Silver and vanadium were not detected by the XLi in the MDL blends and could not be evaluated.
Relative Sensitivity Mean MDL Target Elements High 1 – 20 ppm Selenium. Moderate 20 – 50 ppm Arsenic, Lead, and Mercury. Low 50 – 100 ppm Antimony and Zinc. Very Low > 100 ppm Cadmium, Chromium, Copper, and Nickel.
Notes: ppm = Parts per million. Iron was not included in the MDL evaluation.
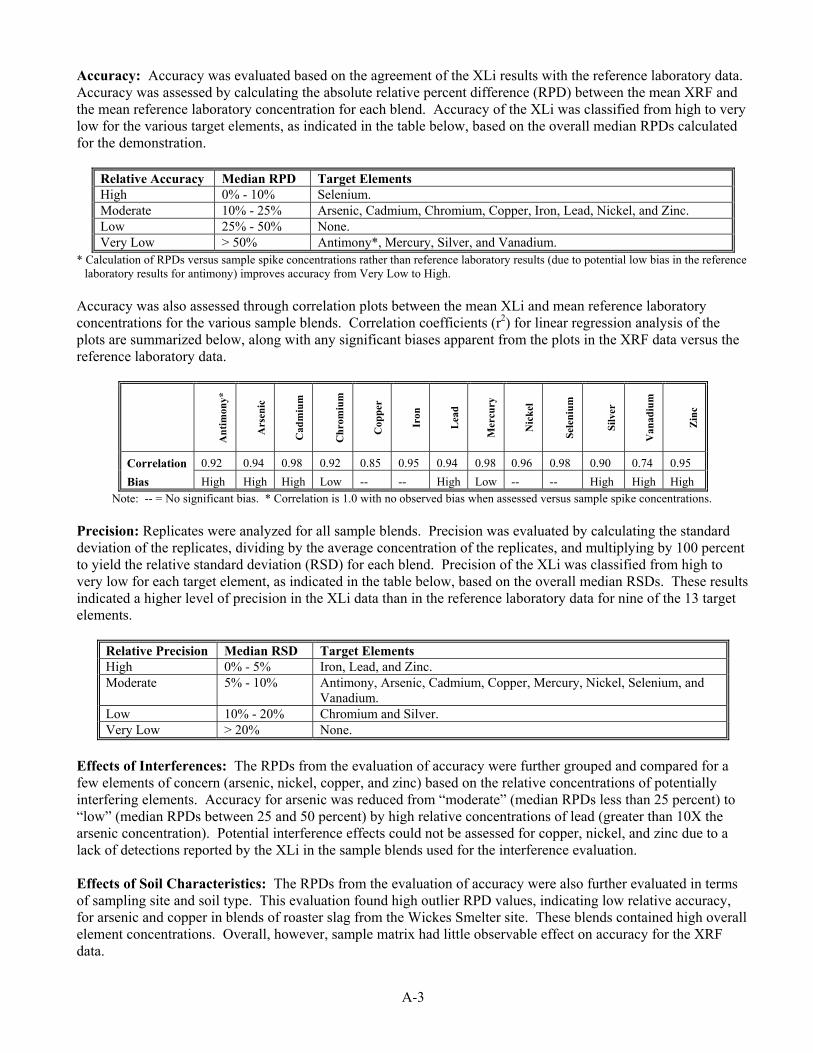
A-3
Accuracy: Accuracy was evaluated based on the agreement of the XLi results with the reference laboratory data. Accuracy was assessed by calculating the absolute relative percent difference (RPD) between the mean XRF and the mean reference laboratory concentration for each blend. Accuracy of the XLi was classified from high to very low for the various target elements, as indicated in the table below, based on the overall median RPDs calculated for the demonstration.
Relative Accuracy Median RPD Target Elements High 0% - 10% Selenium. Moderate 10% - 25% Arsenic, Cadmium, Chromium, Copper, Iron, Lead, Nickel, and Zinc. Low 25% - 50% None. Very Low > 50% Antimony*, Mercury, Silver, and Vanadium.
* Calculation of RPDs versus sample spike concentrations rather than reference laboratory results (due to potential low bias in the reference laboratory results for antimony) improves accuracy from Very Low to High.
Accuracy was also assessed through correlation plots between the mean XLi and mean reference laboratory concentrations for the various sample blends. Correlation coefficients (r2) for linear regression analysis of the plots are summarized below, along with any significant biases apparent from the plots in the XRF data versus the reference laboratory data.
Ant
imon
y*
Ars
enic
Cad
miu
m
Chr
omiu
m
Cop
per
Iron
Lea
d
Mer
cury
Nic
kel
Sele
nium
Silv
er
Van
adiu
m
Zin
c
Correlation 0.92 0.94 0.98 0.92 0.85 0.95 0.94 0.98 0.96 0.98 0.90 0.74 0.95 Bias High High High Low -- -- High Low -- -- High High High
Note: -- = No significant bias. * Correlation is 1.0 with no observed bias when assessed versus sample spike concentrations. Precision: Replicates were analyzed for all sample blends. Precision was evaluated by calculating the standard deviation of the replicates, dividing by the average concentration of the replicates, and multiplying by 100 percent to yield the relative standard deviation (RSD) for each blend. Precision of the XLi was classified from high to very low for each target element, as indicated in the table below, based on the overall median RSDs. These results indicated a higher level of precision in the XLi data than in the reference laboratory data for nine of the 13 target elements.
Relative Precision Median RSD Target Elements High 0% - 5% Iron, Lead, and Zinc. Moderate 5% - 10% Antimony, Arsenic, Cadmium, Copper, Mercury, Nickel, Selenium, and
Vanadium. Low 10% - 20% Chromium and Silver. Very Low > 20% None.
Effects of Interferences: The RPDs from the evaluation of accuracy were further grouped and compared for a few elements of concern (arsenic, nickel, copper, and zinc) based on the relative concentrations of potentially interfering elements. Accuracy for arsenic was reduced from “moderate” (median RPDs less than 25 percent) to “low” (median RPDs between 25 and 50 percent) by high relative concentrations of lead (greater than 10X the arsenic concentration). Potential interference effects could not be assessed for copper, nickel, and zinc due to a lack of detections reported by the XLi in the sample blends used for the interference evaluation. Effects of Soil Characteristics: The RPDs from the evaluation of accuracy were also further evaluated in terms of sampling site and soil type. This evaluation found high outlier RPD values, indicating low relative accuracy, for arsenic and copper in blends of roaster slag from the Wickes Smelter site. These blends contained high overall element concentrations. Overall, however, sample matrix had little observable effect on accuracy for the XRF data.
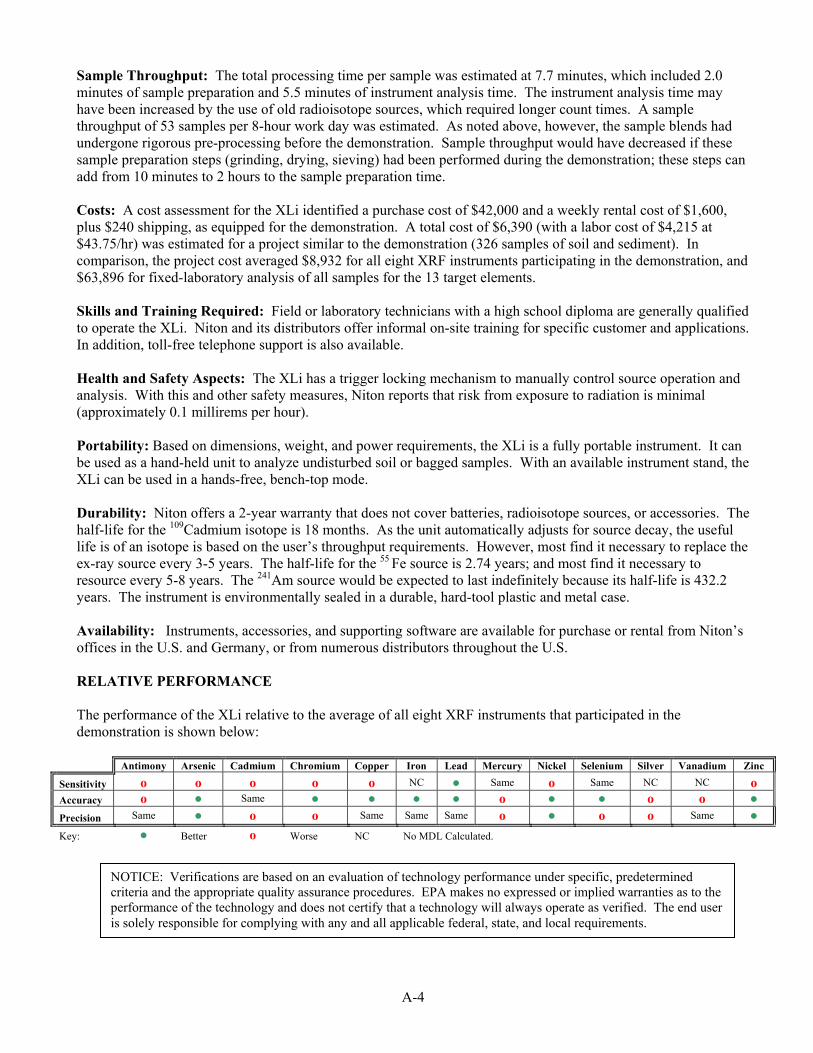
A-4
Sample Throughput: The total processing time per sample was estimated at 7.7 minutes, which included 2.0 minutes of sample preparation and 5.5 minutes of instrument analysis time. The instrument analysis time may have been increased by the use of old radioisotope sources, which required longer count times. A sample throughput of 53 samples per 8-hour work day was estimated. As noted above, however, the sample blends had undergone rigorous pre-processing before the demonstration. Sample throughput would have decreased if these sample preparation steps (grinding, drying, sieving) had been performed during the demonstration; these steps can add from 10 minutes to 2 hours to the sample preparation time. Costs: A cost assessment for the XLi identified a purchase cost of $42,000 and a weekly rental cost of $1,600, plus $240 shipping, as equipped for the demonstration. A total cost of $6,390 (with a labor cost of $4,215 at $43.75/hr) was estimated for a project similar to the demonstration (326 samples of soil and sediment). In comparison, the project cost averaged $8,932 for all eight XRF instruments participating in the demonstration, and $63,896 for fixed-laboratory analysis of all samples for the 13 target elements. Skills and Training Required: Field or laboratory technicians with a high school diploma are generally qualified to operate the XLi. Niton and its distributors offer informal on-site training for specific customer and applications. In addition, toll-free telephone support is also available. Health and Safety Aspects: The XLi has a trigger locking mechanism to manually control source operation and analysis. With this and other safety measures, Niton reports that risk from exposure to radiation is minimal (approximately 0.1 millirems per hour). Portability: Based on dimensions, weight, and power requirements, the XLi is a fully portable instrument. It can be used as a hand-held unit to analyze undisturbed soil or bagged samples. With an available instrument stand, the XLi can be used in a hands-free, bench-top mode. Durability: Niton offers a 2-year warranty that does not cover batteries, radioisotope sources, or accessories. The half-life for the 109Cadmium isotope is 18 months. As the unit automatically adjusts for source decay, the useful life is of an isotope is based on the user’s throughput requirements. However, most find it necessary to replace the ex-ray source every 3-5 years. The half-life for the 55 Fe source is 2.74 years; and most find it necessary to resource every 5-8 years. The 241Am source would be expected to last indefinitely because its half-life is 432.2 years. The instrument is environmentally sealed in a durable, hard-tool plastic and metal case. Availability: Instruments, accessories, and supporting software are available for purchase or rental from Niton’s offices in the U.S. and Germany, or from numerous distributors throughout the U.S. RELATIVE PERFORMANCE The performance of the XLi relative to the average of all eight XRF instruments that participated in the demonstration is shown below:
Antimony Arsenic Cadmium Chromium Copper Iron Lead Mercury Nickel Selenium Silver Vanadium Zinc
Sensitivity о о о о о NC ● Same о Same NC NC о Accuracy о ● Same ● ● ● ● о ● ● о о ● Precision Same ● о о Same Same Same о ● о о Same ● Key: ● Better о Worse NC No MDL Calculated.
NOTICE: Verifications are based on an evaluation of technology performance under specific, predetermined criteria and the appropriate quality assurance procedures. EPA makes no expressed or implied warranties as to the performance of the technology and does not certify that a technology will always operate as verified. The end user is solely responsible for complying with any and all applicable federal, state, and local requirements.

APPENDIX B
DEVELOPER DISCUSSION

B-1
DEVELOPER DISCUSSION
Thermo Electron, NITON analyzers would like to thank the EPA and SITE program for the opportunity to demonstrate our instrument’s effectiveness for trace elemental analysis in soil and sediments. Overall, it proved to be a useful exercise in determining our instrument’s capabilities for field analysis. We would like to thank everyone involved as we found the staff incredibly helpful in ensuring that the performance of our analyzers was appropriately documented. Overall, Thermo Electron feels that the report adequately represents the utility of the NITON analyzers in testing soils and sediments for common contaminants. Our published limits of detection (LOD) for the 13 elements included in this study all correspond well with the results in the report with the exception of cadmium and antimony. The method detection limits (MDL) for cadmium and antimony were reported higher than anticipated. However, given that most of these samples had been intentionally spiked with high levels of various elements, it was not surprising that our performance was inferior to what we typically expect in “real” samples. In this study, samples were required to serve more than one purpose. Instead of merely attempting to determine a detection limit, one sample might be put to the task of LOD and multi-element interference analysis. For elements such as antimony and cadmium, this proved to be a problem for our analyzer. Our analyzers report actual 3 sigma detection limits (<XXX) for a given element instead of a value and error. These LOD’s are sample specific and are calculated by the analyzer’s algorithm. The algorithm is based on the statistical analysis of the background and the relative element concentrations in the sample analyzed. The way in which the SITE group calculates the MDL for any given sample does not allow them to use the <LOD we provide. Therefore, it proved challenging to determine MDLs for some elements when very few of the samples had concentrations high enough to be reported as real numbers. In the case of vanadium and silver, an MDL was not calculated due to insufficient detectable data points. As the data indicates, a few elements showed a bias versus the laboratory data. These biases may exist because our analyzers are factory calibrated using NIST traceable standards. They contain levels typical of what is usually found in real remediation situations. The supplied samples in this evaluation were “real” samples that had been altered and/or spiked to meet certain concentration goals. Whatever the case, system biases can easily be remedied by inserting correction factors directly into the analyzer, a process that is completed in a matter of seconds. Using our CorrectCal software, “on-the-fly” adjustment can be made as needed. Additionally, empirical calibrations can be created and loaded directly onto the analyzer. However, many previously characterized samples are required to set up an empirical calibration for 13 elements. For this evaluation we presented the analyzer in a way that accurately represents the standard off-the-shelf factory calibration and modes of use. The best indicator of an analyzer’s performance is its ability to provide precise results. As the data generated during the SITE program show, the median Relative Standard Deviation (RSD) for the XLi 700 was lower than the RSD calculated for the reference laboratory data for nine of the 13 target elements. Given good precision, and the ability to make site specific adjustments, required accuracy can be easily achieved. To request additional information or an on-site demonstration of this or any of our analyzers, please contact Thermo Electron at 978-670-7460 or visit our website at www.niton.com.

APPENDIX C
DATA VALIDATION SUMMARY REPORT
i
Contents Chapter Page Acronyms, Abbreviations, and Symbols................................................................................................... ii 1.0 INTRODUCTION ...................................................................................................................C-1
2.0 VALIDATION METHODOLOGY.........................................................................................C-1
3.0 DATA VALIDATION.............................................................................................................C-3 3.1 Holding Time.................................................................................................................C-3 3.2 Calibration .....................................................................................................................C-3 3.3 Laboratory Blanks .........................................................................................................C-4 3.4 Laboratory Control Samples..........................................................................................C-5 3.5 Matrix Spike Samples....................................................................................................C-5 3.6 Serial Dilution Results ...................................................................................................C-5 3.7 ICP Interference Check Samples ...................................................................................C-6 3.8 Target Analyte Identification and Quantitation .............................................................C-6 3.9 Quantitation Limit Verification .....................................................................................C-6 4.0 PRECISION, ACCURACY, REPRESENTATIVENESS, COMPLETENESS, AND
COMPARABILITY EVALUATION SUMMARY ................................................................C-6 4.1 Precision ........................................................................................................................C-7 4.2 Accuracy ........................................................................................................................C-7 4.3 Representativeness.........................................................................................................C-7 4.4 Completeness .................................................................................................................C-7 4.5 Comparability ................................................................................................................C-7
5.0 CONCLUSIONS FOR DATA QUALITY AND DATA USABILITY ..................................C-8 6.0 REFERENCES ........................................................................................................................C-8 APPENDIX DATA VALIDATION REPORTS
ii
ABBREVIATIONS AND ACRONYMS
CCV Continuing calibration verification CVAA Cold vapor atomic absorption
DVSR Data validation summary report
EPA U.S. Environmental Protection Agency
FAR Federal acquisition regulations
ICP-AES Inductively coupled plasma-atomic emission spectroscopy ICS Interference check sample ICV Initial calibration verification
LCS Laboratory control sample LCSD Laboratory control sample duplicate
MDL Method detection limit mg/kg Milligram per kilogram MS Matrix spike MSD Matrix spike duplicate
PARCC Precision, accuracy, representativeness, completeness, and comparability PQL Practical quantitation limit
QA/QC Quality assurance and quality control QAPP Quality assurance project plan
QC Quality control
RSD Relative standard deviation RPD Relative percent difference
SDG Sample delivery group Shealy Shealy Environmental Services, Inc. SITE Superfund Innovative Technology Evaluation
Tetra Tech Tetra Tech EM Inc.
XRF X-ray fluorescence

C-1
1.0 INTRODUCTION This data validation summary report (DVSR) summarizes the reference laboratory quality control (QC) data gathered during the x-ray fluorescence (XRF) technologies demonstration conducted under the U.S. Environmental Protection Agency (EPA) Superfund Innovative Technology Evaluation (SITE) program. The reference laboratory was procured following the federal acquisition regulations (FAR) and an extensive selection process. Shealy Environmental Services, Inc. (Shealy), of Cayce, South Carolina, was selected as the reference laboratory for this project. Thirteen target analytes were measured in reference samples and include antimony, arsenic, cadmium, chromium, copper, iron, lead, mercury, nickel, selenium, silver, vanadium, and zinc. The laboratory reported results for 22 metals at the request of EPA; however, for the purposes of meeting project objectives, only the data validation for the 13 target analytes is summarized in this document. The objective of the validation is to determine the validity of the reference data, as well as its usability in meeting the primary objective of comparing reference data to XRF data generated during the demonstration. Shealy provided the data to Tetra Tech EM Inc. (Tetra Tech) in electronic and hardcopy formats; a total of 13 sample delivery groups (SDG) contain all the data for this project. The DVSR consists of seven sections, including this introduction. Section 2.0 presents the data validation methodology. Section 3.0 presents the results of the reference laboratory data validation. Section 4.0 summarizes the precision, accuracy, representativeness, completeness, and comparability (PARCC) evaluation. Section 5.0 presents conclusions about the overall evaluation of the reference data. Section 6.0 lists the references used to prepare this DVSR. Tables are presented following Section 6.0.
2.0 VALIDATION METHODOLOGY Data validation is the systematic process for reviewing and qualifying data against a set of criteria to ensure that the reference data are adequate for the intended use. The data validation process assesses acceptability of the data by evaluating the critical indicator parameters of PARCC. The laboratory analytical data were validated according to the procedures outlined in the following documents:
• “USEPA Contract Laboratory Program National Functional Guidelines for Inorganic Data Review” (EPA 2004), hereinafter referred to as the “EPA guidance.”
• “Demonstration and Quality Assurance Project Plan, XRF Technologies for Measuring Trace Elements in Soil and Sediment” (Tetra Tech 2005), hereinafter referred to as “the QAPP.”
Data validation occurred in the following two stages: (1) a cursory review of analytical reports and quality assurance and quality control (QA/QC) information for 100 percent of the reference data and (2) full validation of analytical reports, QA/QC information, and associated raw data for 10 percent of the reference data as required by the QAPP (Tetra Tech 2005). QA/QC criteria were reviewed in accordance with EPA guidance (EPA 2004) and the QAPP (Tetra Tech 2005). The cursory review for total metals consisted of evaluating the following requirements, as applicable:
• Holding times
C-2
• Initial and continuing calibrations
• Laboratory blank results
• Laboratory control sample (LCS) and laboratory control sample duplicates (LCSD) results
• Matrix spike (MS) and matrix spike duplicate (MSD) results
• Serial dilutions results
In addition to QA/QC criteria described above, the following criteria were reviewed during full
validation:
• ICP interference check samples (ICS)
• Target analyte identification and quantitation
• Quantitation limit verification
Section 3.0 presents the results of the both the cursory review and full validation.
During data validation, worksheets were produced for each SDG that identify any QA/QC issues resulting in data qualification. Data validation findings were written in 13 individual data validation reports (one for each SDG). Data qualifiers were assigned to the results in the electronic database in accordance with EPA guidelines (EPA 2004). In addition to data validation qualifiers, comment codes were added to the database to indicate the primary reason for the validation qualifier. Table 1 defines data validation qualifiers and comment codes that are applied to the data set. Details about specific QC issues can be found in the individual SDG data validation reports and accompanying validation worksheets provided in the Appendix. The overall objective of data validation is to ensure that the quality of the reference data set is adequate for the intended use, as defined by the QAPP (Tetra Tech 2005) for the PARCC parameters. Table 2 provides the QC criteria as defined by the QAPP. PARCC parameters were assessed by completing the following tasks:
• Reviewing precision and accuracy of laboratory QC data
• Reviewing the overall analytical process, including holding time, calibration, analytical or matrix performance, and analyte identification and quantitation
• Assigning qualifiers to affected data when QA/QC criteria were not achieved
• Reviewing and summarizing implications of the frequency and severity of qualifiers in the validated data
Prior to the XRF demonstration, soil and sediment samples were collected from nine locations across the U.S. and then blended, dried, sieved, and homogenized in the characterization laboratory to produce a set of 326 reference samples. Each of these samples were subsequently analyzed by both the reference
C-3
laboratory and all participating technology vendors. As such, 326 prepared soil/sediment samples were delivered to Shealy for the measurement of total metals. The analytical program included the following analyses and methods:
• Total metal for 22 analytes by inductively coupled plasma atomic emission spectroscopy (ICP-AES) according to EPA Methods 3050B/6010B (EPA 1996)
• Total mercury by cold vapor atomic absorption spectroscopy (CVAA) according to EPA Method 7471A (EPA 1996)
3.0 DATA VALIDATION RESULTS The parameters listed in Section 2.0 were evaluated during cursory review and full validation of analytical reports for all methods, as applicable. Each of the validation components discussed in this section is summarized as follows:
• Acceptable – All criteria were met and no data were qualified on that basis
• Acceptable with qualification – Most criteria were met, but at least one data point was qualified as estimated because of issues related to the review component
Since no data were rejected, all data were determined to be either acceptable or acceptable with qualification. Sections 3.1 through 3.9 discuss each review component and the results of each. Tables that summarize the data validation findings follow Section 6.0 of this DVSR. Only qualified data are included in the tables. No reference laboratory data were rejected during the validation process. As such, all results are acceptable with the qualification noted in the sections that follow. 3.1 Holding Time Acceptable. The technical holding times were defined as the maximum time allowable between sample collection and, as applicable, sample extraction, preparation, or analysis. The holding times used for validation purposes were recommended in the specific analytical methods (EPA 1996) and were specified in the QAPP (Tetra Tech 2005). Because the soil and sediment samples were prepared prior to submission to the reference laboratory, and because the preparation included drying to remove moisture, no chemical or physical (for example ice) preservation was required. The holding time for sample digestion was 180 days for the ICP-AES analyses and 28 days for mercury. All sample digestions and analyses were conducted within the specified holding times. No data were qualified based on holding time exceedances. This fact contributes to the high technical quality of the reference data. 3.2 Calibration Acceptable. Laboratory instrument calibration requirements were established to ensure that analytical instruments could produce acceptable qualitative and quantitative data for all target analytes. Initial calibration demonstrates that the instrument is capable of acceptable performance at the beginning of an analytical run, while producing a linear curve. Continuing calibration demonstrates that the instrument is capable of repeating the performance established during the initial calibration (EPA 1996).
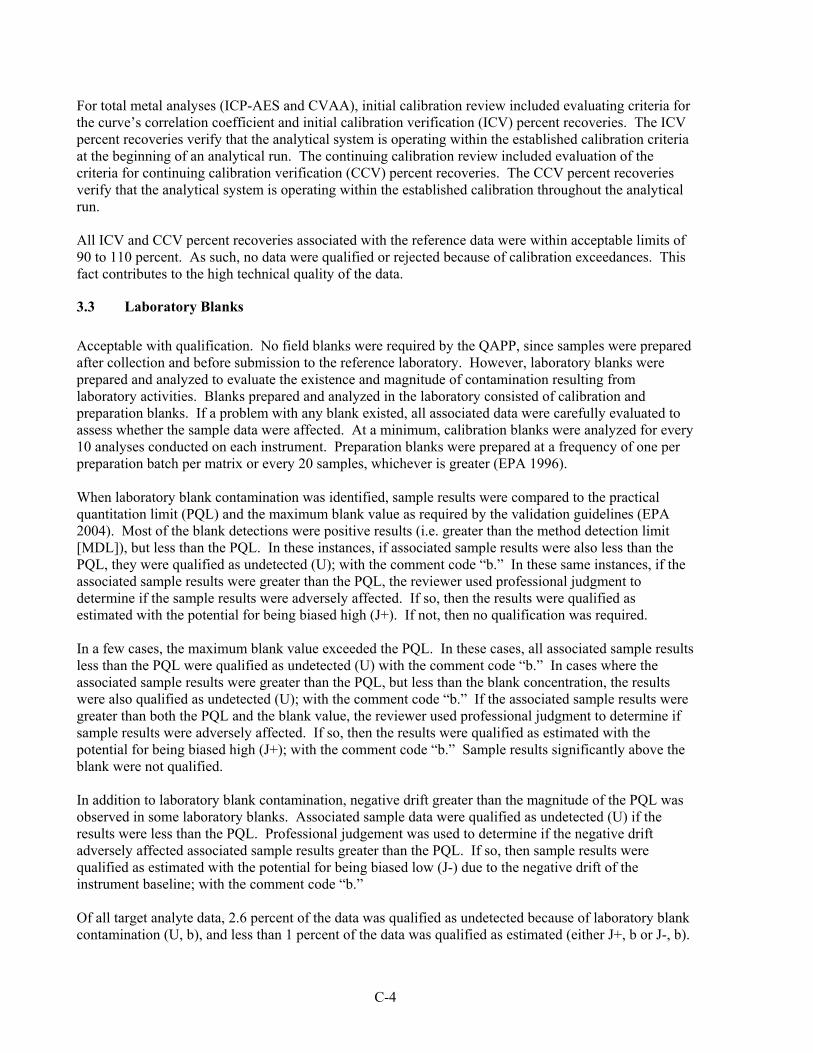
C-4
For total metal analyses (ICP-AES and CVAA), initial calibration review included evaluating criteria for the curve’s correlation coefficient and initial calibration verification (ICV) percent recoveries. The ICV percent recoveries verify that the analytical system is operating within the established calibration criteria at the beginning of an analytical run. The continuing calibration review included evaluation of the criteria for continuing calibration verification (CCV) percent recoveries. The CCV percent recoveries verify that the analytical system is operating within the established calibration throughout the analytical run. All ICV and CCV percent recoveries associated with the reference data were within acceptable limits of 90 to 110 percent. As such, no data were qualified or rejected because of calibration exceedances. This fact contributes to the high technical quality of the data.
3.3 Laboratory Blanks Acceptable with qualification. No field blanks were required by the QAPP, since samples were prepared after collection and before submission to the reference laboratory. However, laboratory blanks were prepared and analyzed to evaluate the existence and magnitude of contamination resulting from laboratory activities. Blanks prepared and analyzed in the laboratory consisted of calibration and preparation blanks. If a problem with any blank existed, all associated data were carefully evaluated to assess whether the sample data were affected. At a minimum, calibration blanks were analyzed for every 10 analyses conducted on each instrument. Preparation blanks were prepared at a frequency of one per preparation batch per matrix or every 20 samples, whichever is greater (EPA 1996). When laboratory blank contamination was identified, sample results were compared to the practical quantitation limit (PQL) and the maximum blank value as required by the validation guidelines (EPA 2004). Most of the blank detections were positive results (i.e. greater than the method detection limit [MDL]), but less than the PQL. In these instances, if associated sample results were also less than the PQL, they were qualified as undetected (U); with the comment code “b.” In these same instances, if the associated sample results were greater than the PQL, the reviewer used professional judgment to determine if the sample results were adversely affected. If so, then the results were qualified as estimated with the potential for being biased high (J+). If not, then no qualification was required. In a few cases, the maximum blank value exceeded the PQL. In these cases, all associated sample results less than the PQL were qualified as undetected (U) with the comment code “b.” In cases where the associated sample results were greater than the PQL, but less than the blank concentration, the results were also qualified as undetected (U); with the comment code “b.” If the associated sample results were greater than both the PQL and the blank value, the reviewer used professional judgment to determine if sample results were adversely affected. If so, then the results were qualified as estimated with the potential for being biased high (J+); with the comment code “b.” Sample results significantly above the blank were not qualified. In addition to laboratory blank contamination, negative drift greater than the magnitude of the PQL was observed in some laboratory blanks. Associated sample data were qualified as undetected (U) if the results were less than the PQL. Professional judgement was used to determine if the negative drift adversely affected associated sample results greater than the PQL. If so, then sample results were qualified as estimated with the potential for being biased low (J-) due to the negative drift of the instrument baseline; with the comment code “b.” Of all target analyte data, 2.6 percent of the data was qualified as undetected because of laboratory blank contamination (U, b), and less than 1 percent of the data was qualified as estimated (either J+, b or J-, b).

C-5
The low occurrence of results affected by blank contamination indicates that the general quality of the analytical data was not significantly compromised by blank contamination. Table 3 provides all results that were qualified based on laboratory blanks. 3.4 Laboratory Control Samples Acceptable. LCSs and LCSDs were prepared and analyzed with each batch of 20 or fewer samples of the same matrix. All percent recoveries were within the QC limits of 80 to 120 percent; all relative percent differences (RPD) between the LCD and LCSD values were less than the criterion of 20 percent. No data were qualified or rejected on the basis of LCS/LCSD results. This fact contributes to the high technical quality of the data.
3.5 Matrix Spike Samples Acceptable with qualification. MS and MSD samples were prepared and analyzed with each batch of 20 or fewer samples of the same matrix. All percent recoveries were within the QC limits of 75 to 125 percent, and all RPDs between the MS and MSD values were less than the criterion of 25 percent, except as discussed in the following paragraphs. Sample results affected by MS and MSD percent recoveries issues were qualified as estimated and either biased high (J+) if the recoveries were greater than 125 percent; or qualified as estimated and biased low (J-) if the recoveries were less than 75 percent. In at least one case, the MS was higher than 125 percent and the MSD was lower than 75 percent; the associated results were qualified as estimated (J) with no distinction for potential bias. All data qualified on the basis of MS and MSD recovery were also assigned the comment code “e.” Of all target analyte data, less than 1 percent was qualified as estimated and biased high (J+, e), while about 8 percent of the data were qualified as estimated and biased low (J-, e). Antimony and silver were the most frequently qualified sample results. Based on experience, antimony and silver soil recoveries are frequently low using the selected methods. Table 4 provides the results that were qualified based on MS/MSD results. The precision between MS and MSD results were generally acceptable. If the RPD between MS and MSD results were greater than 25 percent, the data were already qualified based on exceedance of the acceptance window for recovery. Therefore, no additional qualification was required for MS/MSD precision. No data were rejected on the basis of MS/MSD results. The relatively low occurrence of data qualification due to MS/MSD recoveries and RPDs contribute to the high technical quality of the data.
3.6 Serial Dilution Results Acceptable with qualification. Serial dilutions were conducted and analyzed by Shealy at a frequency of 1 per batch of 20 samples. The serial dilution analysis can evaluate whether matrix interference exists and whether the accuracy of the analytical data is affected. For all target analyte data, less than 1 percent of the data was qualified as estimated and biased high (J+, j), while about 2 percent of the data were qualified as estimated and biased low (J-, j). Serial dilution results are used to determine whether characteristics of the digest matrix, such as viscosity or the presence of analytes at high concentrations, may interfere with the detected analytes. Qualifiers were applied to cases where interference was suspected. However, the low incidence of apparent matrix interference contributes to the high technical quality of the data. Table 5 provides the results that were qualified based on MS/MSD results.

C-6
3.7 ICP Interference Check Samples Acceptable. ICP results for each ICS were evaluated. The ICS verifies the validity of the laboratory’s inter-element and background correction factors. High levels of certain elements (including aluminum, calcium, iron, and magnesium) can affect sample results if the inter-element and background correction factors have not been optimized. Incorrect correction factors may result in false positives, false negatives, or biased results. All ICS recoveries were within QC limits of 80 to 120 percent, and no significant biases were observed due to potential spectral interference. No data were qualified or rejected because of ICS criteria violations. This fact contributes to the high technical quality of the data.
3.8 Target Analyte Identification and Quantitation Acceptable Identification is determined by measuring the characteristic wavelength of energy emitted by the analyte (ICP) or absorbed by the analyte (CVAA). External calibration standards are used to quantify the analyte concentration in the sample digest. Sample digest concentrations are converted to soil units (milligrams per kilogram) and corrected for percent moisture. For 10 percent of the samples, results were recalculated to verify the accuracy of reporting. All results were correctly calculated by the laboratory, except for one mercury result, whose miscalculation was the result of an error in entering the dilution factor. Shealy immediately resolved this error and corrected reports were provided. Since the result was corrected, no qualification was required. No other reporting errors were observed. For inorganic analyses, analytical instruments can make reliable qualitative identification of analytes at concentrations below the PQL. Detected results below the PQL are considered quantitatively uncertain. Sample results below the PQL were reported by the laboratory with a “J” qualifier. No additional qualification was required. 3.9 Quantitation Limit Verification Acceptable. Reference laboratory quantitation limits were specified in the QAPP (Tetra Tech 2005). Circumstances that affected quantitation were limited and included dilution and percent moisture factors. Since the samples were prepared prior to submission to the reference laboratory, moisture content was very low and had little impact on quantitation limits. The laboratory did correct all quantitation limits for moisture content. Due to the presence of percent-level analytes in some samples, dilutions were required. However, the required PQLs for the reference laboratory were high enough that even with dilution and moisture content factors applied, the reporting limits did not exceed those of the XRF instruments. This allows for effective comparison of results between the reference laboratory and XRF instruments.
4.0 PRECISION, ACCURACY, REPRESENTATIVENESS, COMPLETENESS, AND COMPARABILITY EVALUATION SUMMARY
All analytical data were reviewed for PARCC parameters to validate reference data. The following sections discuss the overall data quality, including the PARCC parameters, as determined by the data validation.
C-7
4.1 Precision Precision is a measure of the reproducibility of an experimental value without considering a true or referenced value. The primary indicators of precision were the MS/MSD RPD and LCS/LCSD RPD between the duplicate results. Precision criteria of less than 20 percent RPD for LCS/LCSD and 25 percent for MS/MSD were generally met for all duplicate pairs. No data were qualified based on duplicate precision of MS/MSD or LCS/LCSD pairs that were not already qualified for other reasons. Such low occurrence of laboratory precision problems supports the validity, usability, and defensibility of the data.
4.2 Accuracy Accuracy assesses the proximity of an experimental value to a true or referenced value. The primary accuracy indicators were the recoveries of MS and LCS spikes. Accuracy is expressed as percent recovery. Overall, about 8 percent of the data was qualified as estimated and no data were rejected because of accuracy problems. The low frequency of accuracy problems supports the validity, usability, and defensibility of the data.
4.3 Representativeness Representativeness refers to how well sample data accurately reflect true environmental conditions. The QAPP was carefully designed to ensure that actual environmental samples be collected by choosing representative sites across the US from which sample material was collected. The blending and homogenization was executed according to the approved QAPP (Tetra Tech 2005).
4.4 Completeness Completeness is defined as the percentage of measurements that are considered to be valid. The validity of sample results is evaluated through the data validation process. Sample results that are rejected and any missing analyses are considered incomplete. Data that are qualified as estimated (J) or undetected estimated (UJ) are considered valid and usable. Data qualified as rejected (R) are considered unusable for all purposes. Since no data were rejected in this data set, a completeness of 100 percent was achieved. A total of 4,238 target analyte results were evaluated. The completeness goal stated in the QAPP (Tetra Tech 2005) was 90 percent.
4.5 Comparability Comparability is a qualitative parameter that expresses the confidence with which one data set may be compared to another. Widely-accepted SW-846 methods were used for this project. It is recognized that direct comparison of the reference laboratory data (using ICP-AES and CVAA techniques) to the XRF measurements may result in discrepancies due to differences in the preparation and measurement techniques; however, the reference laboratory data is expected to provide an acceptable basis for comparison to XRF measurement results in accordance with the project objectives. Comparability of the data was also achieved by producing full data packages, by using a homogenous matrix, standard quantitation limits, standardized data validation procedures, and by evaluating the PARCC parameters uniformly. In addition, the use of specified and well-documented analyses, approved laboratories, and the standardized process of data review and validation have resulted in a high degree of comparability for the data.
C-8
5.0 CONCLUSIONS FOR DATA QUALITY AND DATA USABILITY Although some qualifiers were added to the data, a final review of the data set with respect to the data quality parameters discussed in Section 4.0 indicates that the data are of overall good quality. No analytical data were rejected. The data quality is generally consistent with project objectives for producing data of suitable quality for comparison to XRF data. All supporting documentation and data are available upon request, including cursory review and full validation reports as well as the electronic database that contains sample results.
6.0 REFERENCES Tetra Tech EM, Inc. (Tetra Tech). 2005. “Demonstration and Quality Assurance Project Plan, XRF
Technologies for Measuring Trace Elements in Soil and Sediment.” March.
U.S. Environmental Protection Agency (EPA). 1996. “Test Methods for Evaluating Solid Waste”, Third Edition (SW-846). With promulgated revisions. December.
EPA. 2004. “USEPA Contract Laboratory Program National Functional Guidelines For Inorganic Data Review”. October.

TABLES

C-9
TABLE 1: DATA VALIDATION QUALIFIERS AND COMMENT CODES
Qualifier Definition
No Qualifier Indicates that the data are acceptable both qualitatively and quantitatively.
U Indicates compound was analyzed for but not detected above the concentration listed. The value listed is the sample quantitation limit.
J Indicates an estimated concentration value. The result is considered qualitatively acceptable, but quantitatively unreliable.
J+ The result is an estimated quantity, but the result may be biased high.
J- The result is an estimated quantity, but the result may be biased low.
UJ Indicates an estimated quantitation limit. The compound was analyzed for, but was considered non-detected.
R The data are unusable (compound may or may not be present). Resampling and reanalysis is necessary for verification.
Comment Code Definition
a Surrogate recovery exceeded (not applicable to this data set)
b Laboratory method blank and common blank contamination
c Calibration criteria exceeded
d Duplicate precision criteria exceeded
e Matrix spike or laboratory control sample recovery exceeded
f Field blank contamination (not applicable to this data set)
g Quantification below reporting limit
h Holding time exceeded
i Internal standard criteria exceeded (not applicable to this data set)
j Other qualification (will be specified in report)
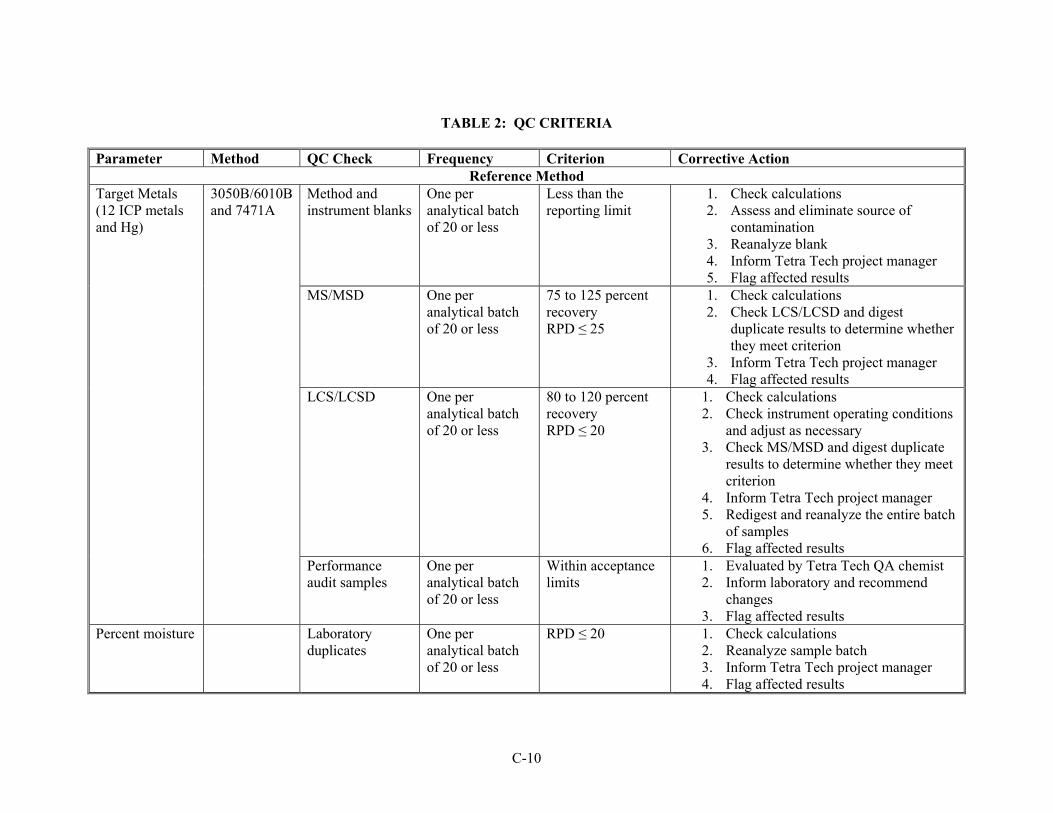
C-10
TABLE 2: QC CRITERIA
Parameter Method QC Check Frequency Criterion Corrective Action Reference Method
Method and instrument blanks
One per analytical batch of 20 or less
Less than the reporting limit
1. Check calculations 2. Assess and eliminate source of
contamination 3. Reanalyze blank 4. Inform Tetra Tech project manager 5. Flag affected results
MS/MSD One per analytical batch of 20 or less
75 to 125 percent recovery RPD ≤ 25
1. Check calculations 2. Check LCS/LCSD and digest
duplicate results to determine whether they meet criterion
3. Inform Tetra Tech project manager 4. Flag affected results
LCS/LCSD One per analytical batch of 20 or less
80 to 120 percent recovery RPD ≤ 20
1. Check calculations 2. Check instrument operating conditions
and adjust as necessary 3. Check MS/MSD and digest duplicate
results to determine whether they meet criterion
4. Inform Tetra Tech project manager 5. Redigest and reanalyze the entire batch
of samples 6. Flag affected results
Target Metals (12 ICP metals and Hg)
3050B/6010B and 7471A
Performance audit samples
One per analytical batch of 20 or less
Within acceptance limits
1. Evaluated by Tetra Tech QA chemist 2. Inform laboratory and recommend
changes 3. Flag affected results
Percent moisture Laboratory duplicates
One per analytical batch of 20 or less
RPD ≤ 20 1. Check calculations 2. Reanalyze sample batch 3. Inform Tetra Tech project manager 4. Flag affected results
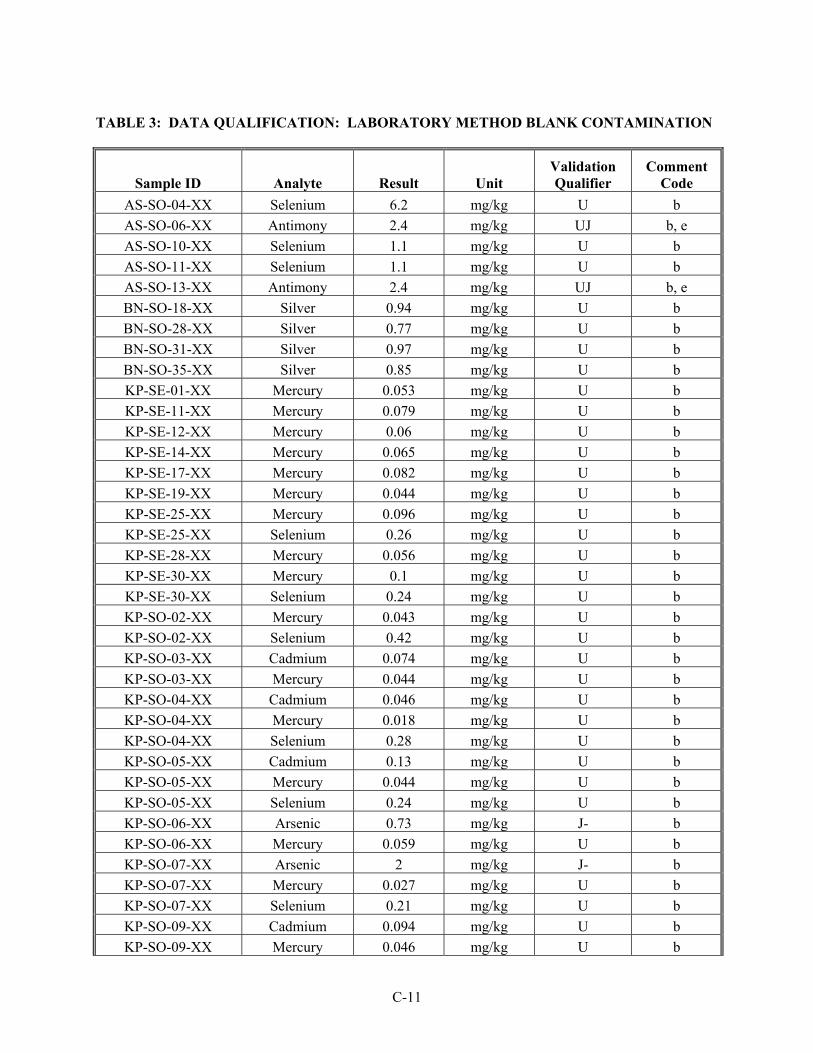
C-11
TABLE 3: DATA QUALIFICATION: LABORATORY METHOD BLANK CONTAMINATION
Sample ID Analyte Result Unit Validation Qualifier
Comment Code
AS-SO-04-XX Selenium 6.2 mg/kg U b AS-SO-06-XX Antimony 2.4 mg/kg UJ b, e AS-SO-10-XX Selenium 1.1 mg/kg U b AS-SO-11-XX Selenium 1.1 mg/kg U b AS-SO-13-XX Antimony 2.4 mg/kg UJ b, e BN-SO-18-XX Silver 0.94 mg/kg U b BN-SO-28-XX Silver 0.77 mg/kg U b BN-SO-31-XX Silver 0.97 mg/kg U b BN-SO-35-XX Silver 0.85 mg/kg U b KP-SE-01-XX Mercury 0.053 mg/kg U b KP-SE-11-XX Mercury 0.079 mg/kg U b KP-SE-12-XX Mercury 0.06 mg/kg U b KP-SE-14-XX Mercury 0.065 mg/kg U b KP-SE-17-XX Mercury 0.082 mg/kg U b KP-SE-19-XX Mercury 0.044 mg/kg U b KP-SE-25-XX Mercury 0.096 mg/kg U b KP-SE-25-XX Selenium 0.26 mg/kg U b KP-SE-28-XX Mercury 0.056 mg/kg U b KP-SE-30-XX Mercury 0.1 mg/kg U b KP-SE-30-XX Selenium 0.24 mg/kg U b KP-SO-02-XX Mercury 0.043 mg/kg U b KP-SO-02-XX Selenium 0.42 mg/kg U b KP-SO-03-XX Cadmium 0.074 mg/kg U b KP-SO-03-XX Mercury 0.044 mg/kg U b KP-SO-04-XX Cadmium 0.046 mg/kg U b KP-SO-04-XX Mercury 0.018 mg/kg U b KP-SO-04-XX Selenium 0.28 mg/kg U b KP-SO-05-XX Cadmium 0.13 mg/kg U b KP-SO-05-XX Mercury 0.044 mg/kg U b KP-SO-05-XX Selenium 0.24 mg/kg U b KP-SO-06-XX Arsenic 0.73 mg/kg J- b KP-SO-06-XX Mercury 0.059 mg/kg U b KP-SO-07-XX Arsenic 2 mg/kg J- b KP-SO-07-XX Mercury 0.027 mg/kg U b KP-SO-07-XX Selenium 0.21 mg/kg U b KP-SO-09-XX Cadmium 0.094 mg/kg U b KP-SO-09-XX Mercury 0.046 mg/kg U b
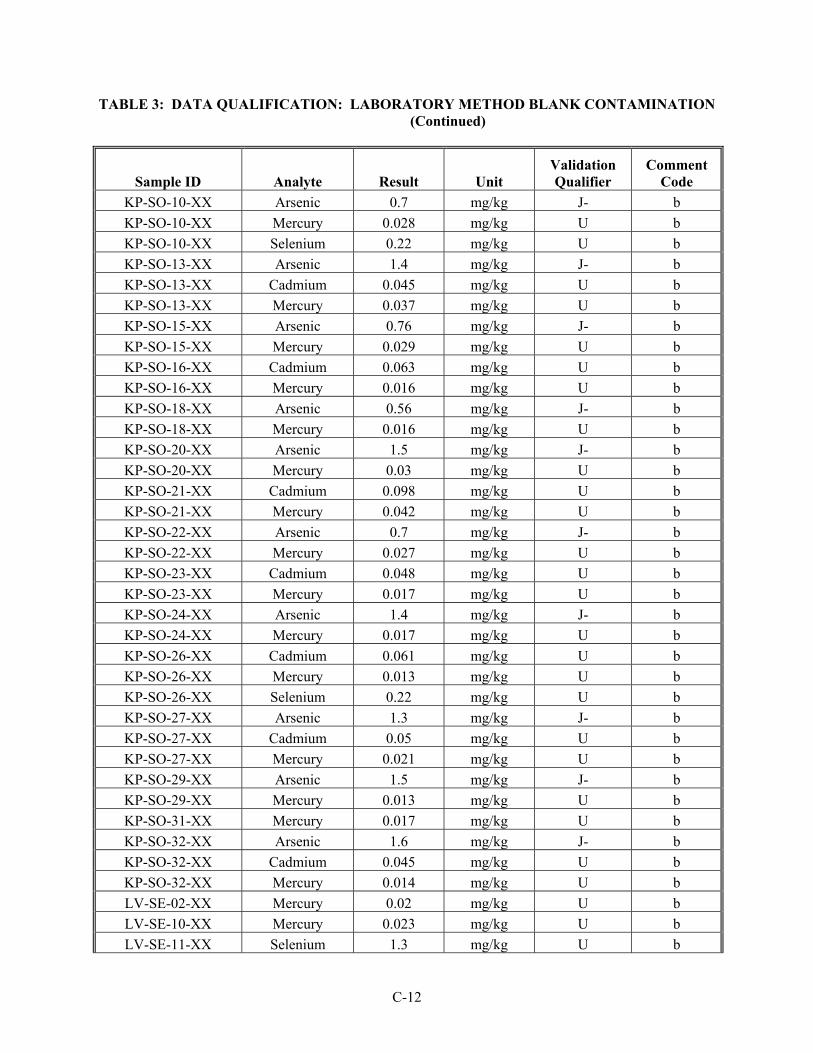
TABLE 3: DATA QUALIFICATION: LABORATORY METHOD BLANK CONTAMINATION (Continued)
C-12
Sample ID Analyte Result Unit Validation Qualifier
Comment Code
KP-SO-10-XX Arsenic 0.7 mg/kg J- b KP-SO-10-XX Mercury 0.028 mg/kg U b KP-SO-10-XX Selenium 0.22 mg/kg U b KP-SO-13-XX Arsenic 1.4 mg/kg J- b KP-SO-13-XX Cadmium 0.045 mg/kg U b KP-SO-13-XX Mercury 0.037 mg/kg U b KP-SO-15-XX Arsenic 0.76 mg/kg J- b KP-SO-15-XX Mercury 0.029 mg/kg U b KP-SO-16-XX Cadmium 0.063 mg/kg U b KP-SO-16-XX Mercury 0.016 mg/kg U b KP-SO-18-XX Arsenic 0.56 mg/kg J- b KP-SO-18-XX Mercury 0.016 mg/kg U b KP-SO-20-XX Arsenic 1.5 mg/kg J- b KP-SO-20-XX Mercury 0.03 mg/kg U b KP-SO-21-XX Cadmium 0.098 mg/kg U b KP-SO-21-XX Mercury 0.042 mg/kg U b KP-SO-22-XX Arsenic 0.7 mg/kg J- b KP-SO-22-XX Mercury 0.027 mg/kg U b KP-SO-23-XX Cadmium 0.048 mg/kg U b KP-SO-23-XX Mercury 0.017 mg/kg U b KP-SO-24-XX Arsenic 1.4 mg/kg J- b KP-SO-24-XX Mercury 0.017 mg/kg U b KP-SO-26-XX Cadmium 0.061 mg/kg U b KP-SO-26-XX Mercury 0.013 mg/kg U b KP-SO-26-XX Selenium 0.22 mg/kg U b KP-SO-27-XX Arsenic 1.3 mg/kg J- b KP-SO-27-XX Cadmium 0.05 mg/kg U b KP-SO-27-XX Mercury 0.021 mg/kg U b KP-SO-29-XX Arsenic 1.5 mg/kg J- b KP-SO-29-XX Mercury 0.013 mg/kg U b KP-SO-31-XX Mercury 0.017 mg/kg U b KP-SO-32-XX Arsenic 1.6 mg/kg J- b KP-SO-32-XX Cadmium 0.045 mg/kg U b KP-SO-32-XX Mercury 0.014 mg/kg U b LV-SE-02-XX Mercury 0.02 mg/kg U b LV-SE-10-XX Mercury 0.023 mg/kg U b LV-SE-11-XX Selenium 1.3 mg/kg U b
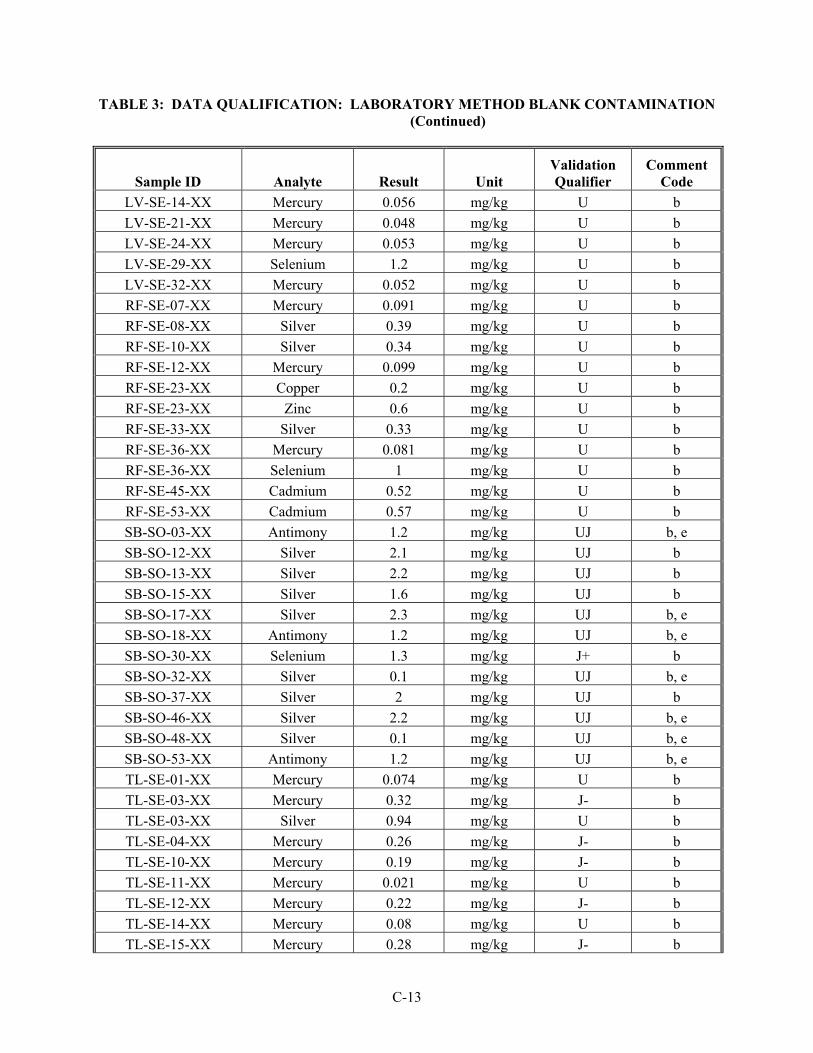
TABLE 3: DATA QUALIFICATION: LABORATORY METHOD BLANK CONTAMINATION (Continued)
C-13
Sample ID Analyte Result Unit Validation Qualifier
Comment Code
LV-SE-14-XX Mercury 0.056 mg/kg U b LV-SE-21-XX Mercury 0.048 mg/kg U b LV-SE-24-XX Mercury 0.053 mg/kg U b LV-SE-29-XX Selenium 1.2 mg/kg U b LV-SE-32-XX Mercury 0.052 mg/kg U b RF-SE-07-XX Mercury 0.091 mg/kg U b RF-SE-08-XX Silver 0.39 mg/kg U b RF-SE-10-XX Silver 0.34 mg/kg U b RF-SE-12-XX Mercury 0.099 mg/kg U b RF-SE-23-XX Copper 0.2 mg/kg U b RF-SE-23-XX Zinc 0.6 mg/kg U b RF-SE-33-XX Silver 0.33 mg/kg U b RF-SE-36-XX Mercury 0.081 mg/kg U b RF-SE-36-XX Selenium 1 mg/kg U b RF-SE-45-XX Cadmium 0.52 mg/kg U b RF-SE-53-XX Cadmium 0.57 mg/kg U b SB-SO-03-XX Antimony 1.2 mg/kg UJ b, e SB-SO-12-XX Silver 2.1 mg/kg UJ b SB-SO-13-XX Silver 2.2 mg/kg UJ b SB-SO-15-XX Silver 1.6 mg/kg UJ b SB-SO-17-XX Silver 2.3 mg/kg UJ b, e SB-SO-18-XX Antimony 1.2 mg/kg UJ b, e SB-SO-30-XX Selenium 1.3 mg/kg J+ b SB-SO-32-XX Silver 0.1 mg/kg UJ b, e SB-SO-37-XX Silver 2 mg/kg UJ b SB-SO-46-XX Silver 2.2 mg/kg UJ b, e SB-SO-48-XX Silver 0.1 mg/kg UJ b, e SB-SO-53-XX Antimony 1.2 mg/kg UJ b, e TL-SE-01-XX Mercury 0.074 mg/kg U b TL-SE-03-XX Mercury 0.32 mg/kg J- b TL-SE-03-XX Silver 0.94 mg/kg U b TL-SE-04-XX Mercury 0.26 mg/kg J- b TL-SE-10-XX Mercury 0.19 mg/kg J- b TL-SE-11-XX Mercury 0.021 mg/kg U b TL-SE-12-XX Mercury 0.22 mg/kg J- b TL-SE-14-XX Mercury 0.08 mg/kg U b TL-SE-15-XX Mercury 0.28 mg/kg J- b
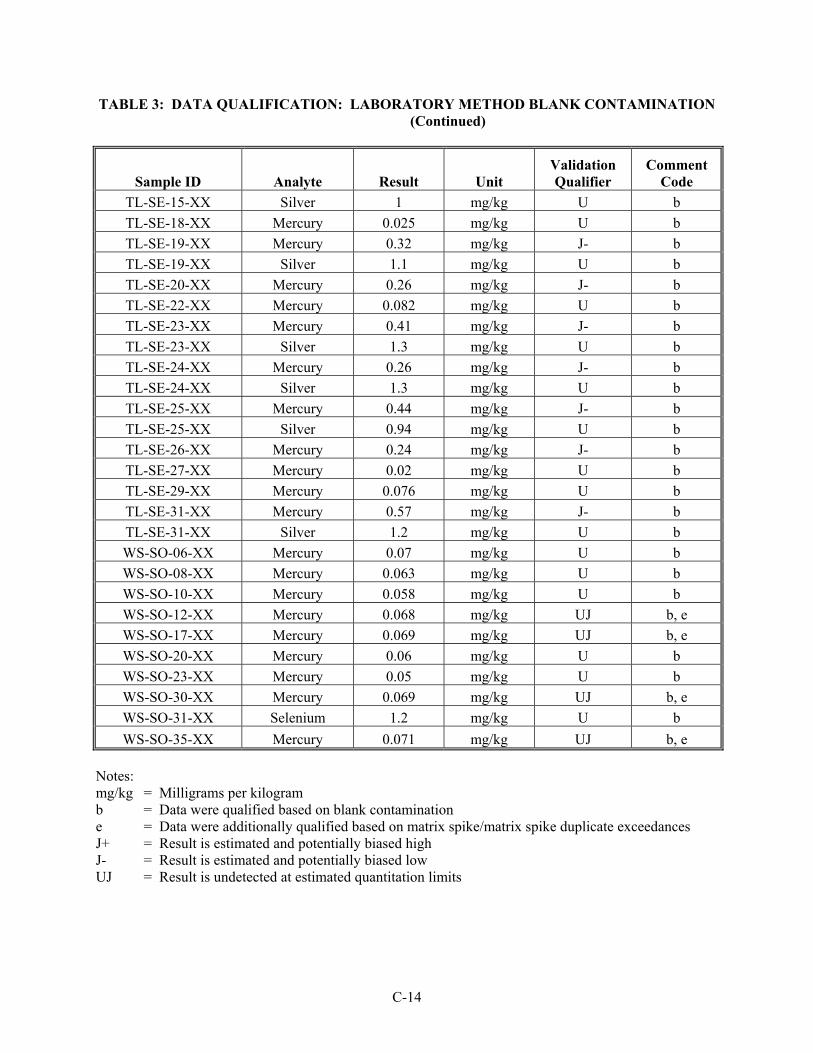
TABLE 3: DATA QUALIFICATION: LABORATORY METHOD BLANK CONTAMINATION (Continued)
C-14
Sample ID Analyte Result Unit Validation Qualifier
Comment Code
TL-SE-15-XX Silver 1 mg/kg U b TL-SE-18-XX Mercury 0.025 mg/kg U b TL-SE-19-XX Mercury 0.32 mg/kg J- b TL-SE-19-XX Silver 1.1 mg/kg U b TL-SE-20-XX Mercury 0.26 mg/kg J- b TL-SE-22-XX Mercury 0.082 mg/kg U b TL-SE-23-XX Mercury 0.41 mg/kg J- b TL-SE-23-XX Silver 1.3 mg/kg U b TL-SE-24-XX Mercury 0.26 mg/kg J- b TL-SE-24-XX Silver 1.3 mg/kg U b TL-SE-25-XX Mercury 0.44 mg/kg J- b TL-SE-25-XX Silver 0.94 mg/kg U b TL-SE-26-XX Mercury 0.24 mg/kg J- b TL-SE-27-XX Mercury 0.02 mg/kg U b TL-SE-29-XX Mercury 0.076 mg/kg U b TL-SE-31-XX Mercury 0.57 mg/kg J- b TL-SE-31-XX Silver 1.2 mg/kg U b WS-SO-06-XX Mercury 0.07 mg/kg U b WS-SO-08-XX Mercury 0.063 mg/kg U b WS-SO-10-XX Mercury 0.058 mg/kg U b WS-SO-12-XX Mercury 0.068 mg/kg UJ b, e WS-SO-17-XX Mercury 0.069 mg/kg UJ b, e WS-SO-20-XX Mercury 0.06 mg/kg U b WS-SO-23-XX Mercury 0.05 mg/kg U b WS-SO-30-XX Mercury 0.069 mg/kg UJ b, e WS-SO-31-XX Selenium 1.2 mg/kg U b WS-SO-35-XX Mercury 0.071 mg/kg UJ b, e
Notes: mg/kg = Milligrams per kilogram b = Data were qualified based on blank contamination e = Data were additionally qualified based on matrix spike/matrix spike duplicate exceedances J+ = Result is estimated and potentially biased high J- = Result is estimated and potentially biased low UJ = Result is undetected at estimated quantitation limits

C-15
TABLE 4: DATA QUALIFICATION: MATRIX SPIKE RECOVERY EXCEEDANCES
Sample ID Analyte Result Unit Validation Qualifier
Validation Code
AS-SO-01-XX Antimony 3.8 mg/kg J- e AS-SO-02-XX Antimony <2.6 mg/kg UJ e AS-SO-03-XX Mercury 3.7 mg/kg J- e AS-SO-03-XX Silver 480 mg/kg J- e AS-SO-04-XX Antimony <6.4 mg/kg UJ e AS-SO-05-XX Mercury 2.5 mg/kg J- e AS-SO-05-XX Silver 330 mg/kg J- e AS-SO-06-XX Antimony 2.4 mg/kg UJ b, e AS-SO-07-XX Antimony 3.6 mg/kg J- e AS-SO-08-XX Mercury 2.5 mg/kg J- e AS-SO-08-XX Silver 280 mg/kg J- e AS-SO-09-XX Antimony <2.6 mg/kg UJ e AS-SO-10-XX Antimony 1.9 mg/kg J- e AS-SO-11-XX Antimony 3.7 mg/kg J- e AS-SO-12-XX Antimony <2.6 mg/kg UJ e AS-SO-13-XX Antimony 2.4 mg/kg UJ b, e BN-SO-01-XX Antimony <1.3 mg/kg UJ e BN-SO-01-XX Silver <1.3 mg/kg UJ e BN-SO-05-XX Antimony 160 mg/kg J- e BN-SO-07-XX Antimony 110 mg/kg J- e BN-SO-07-XX Silver 990 mg/kg J+ e BN-SO-09-XX Antimony 750 mg/kg J- e BN-SO-09-XX Silver 100 mg/kg J- e BN-SO-10-XX Antimony <1.3 mg/kg UJ e BN-SO-10-XX Silver <1.3 mg/kg UJ e BN-SO-11-XX Antimony 4 mg/kg J- e BN-SO-11-XX Silver 140 mg/kg J- e BN-SO-12-XX Antimony 750 mg/kg J- e BN-SO-12-XX Silver 210 mg/kg J- e BN-SO-14-XX Antimony 3.5 mg/kg J- e BN-SO-14-XX Silver 140 mg/kg J- e BN-SO-15-XX Antimony <1.3 mg/kg UJ e BN-SO-15-XX Silver <1.3 mg/kg UJ e BN-SO-16-XX Antimony 120 mg/kg J- e BN-SO-16-XX Arsenic 1100 mg/kg J+ e BN-SO-19-XX Antimony 150 mg/kg J- e BN-SO-21-XX Antimony 150 mg/kg J- e
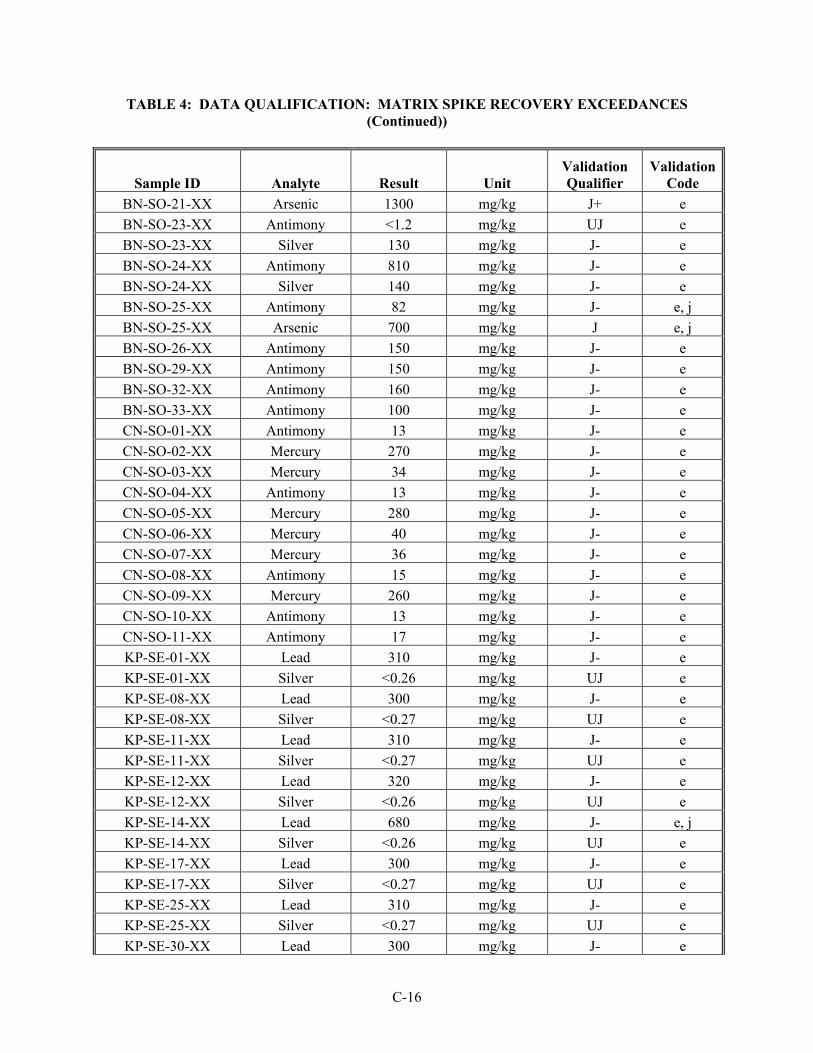
TABLE 4: DATA QUALIFICATION: MATRIX SPIKE RECOVERY EXCEEDANCES (Continued))
C-16
Sample ID Analyte Result Unit Validation Qualifier
Validation Code
BN-SO-21-XX Arsenic 1300 mg/kg J+ e BN-SO-23-XX Antimony <1.2 mg/kg UJ e BN-SO-23-XX Silver 130 mg/kg J- e BN-SO-24-XX Antimony 810 mg/kg J- e BN-SO-24-XX Silver 140 mg/kg J- e BN-SO-25-XX Antimony 82 mg/kg J- e, j BN-SO-25-XX Arsenic 700 mg/kg J e, j BN-SO-26-XX Antimony 150 mg/kg J- e BN-SO-29-XX Antimony 150 mg/kg J- e BN-SO-32-XX Antimony 160 mg/kg J- e BN-SO-33-XX Antimony 100 mg/kg J- e CN-SO-01-XX Antimony 13 mg/kg J- e CN-SO-02-XX Mercury 270 mg/kg J- e CN-SO-03-XX Mercury 34 mg/kg J- e CN-SO-04-XX Antimony 13 mg/kg J- e CN-SO-05-XX Mercury 280 mg/kg J- e CN-SO-06-XX Mercury 40 mg/kg J- e CN-SO-07-XX Mercury 36 mg/kg J- e CN-SO-08-XX Antimony 15 mg/kg J- e CN-SO-09-XX Mercury 260 mg/kg J- e CN-SO-10-XX Antimony 13 mg/kg J- e CN-SO-11-XX Antimony 17 mg/kg J- e KP-SE-01-XX Lead 310 mg/kg J- e KP-SE-01-XX Silver <0.26 mg/kg UJ e KP-SE-08-XX Lead 300 mg/kg J- e KP-SE-08-XX Silver <0.27 mg/kg UJ e KP-SE-11-XX Lead 310 mg/kg J- e KP-SE-11-XX Silver <0.27 mg/kg UJ e KP-SE-12-XX Lead 320 mg/kg J- e KP-SE-12-XX Silver <0.26 mg/kg UJ e KP-SE-14-XX Lead 680 mg/kg J- e, j KP-SE-14-XX Silver <0.26 mg/kg UJ e KP-SE-17-XX Lead 300 mg/kg J- e KP-SE-17-XX Silver <0.27 mg/kg UJ e KP-SE-25-XX Lead 310 mg/kg J- e KP-SE-25-XX Silver <0.27 mg/kg UJ e KP-SE-30-XX Lead 300 mg/kg J- e
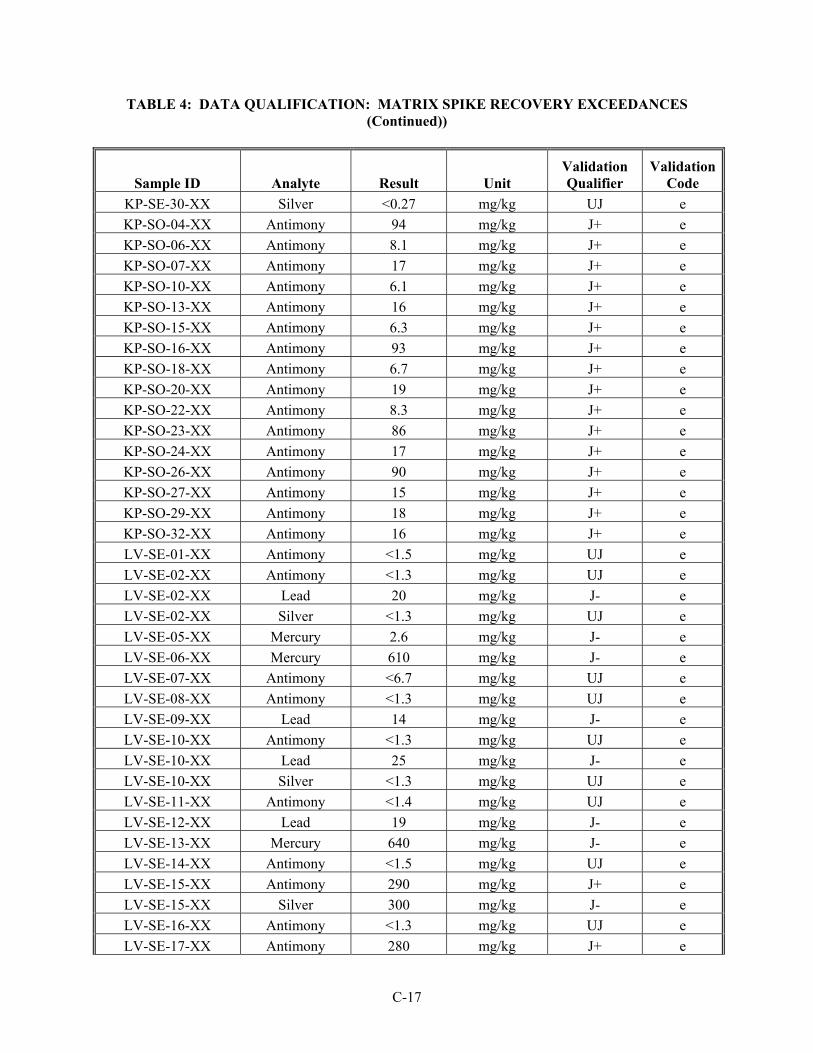
TABLE 4: DATA QUALIFICATION: MATRIX SPIKE RECOVERY EXCEEDANCES (Continued))
C-17
Sample ID Analyte Result Unit Validation Qualifier
Validation Code
KP-SE-30-XX Silver <0.27 mg/kg UJ e KP-SO-04-XX Antimony 94 mg/kg J+ e KP-SO-06-XX Antimony 8.1 mg/kg J+ e KP-SO-07-XX Antimony 17 mg/kg J+ e KP-SO-10-XX Antimony 6.1 mg/kg J+ e KP-SO-13-XX Antimony 16 mg/kg J+ e KP-SO-15-XX Antimony 6.3 mg/kg J+ e KP-SO-16-XX Antimony 93 mg/kg J+ e KP-SO-18-XX Antimony 6.7 mg/kg J+ e KP-SO-20-XX Antimony 19 mg/kg J+ e KP-SO-22-XX Antimony 8.3 mg/kg J+ e KP-SO-23-XX Antimony 86 mg/kg J+ e KP-SO-24-XX Antimony 17 mg/kg J+ e KP-SO-26-XX Antimony 90 mg/kg J+ e KP-SO-27-XX Antimony 15 mg/kg J+ e KP-SO-29-XX Antimony 18 mg/kg J+ e KP-SO-32-XX Antimony 16 mg/kg J+ e LV-SE-01-XX Antimony <1.5 mg/kg UJ e LV-SE-02-XX Antimony <1.3 mg/kg UJ e LV-SE-02-XX Lead 20 mg/kg J- e LV-SE-02-XX Silver <1.3 mg/kg UJ e LV-SE-05-XX Mercury 2.6 mg/kg J- e LV-SE-06-XX Mercury 610 mg/kg J- e LV-SE-07-XX Antimony <6.7 mg/kg UJ e LV-SE-08-XX Antimony <1.3 mg/kg UJ e LV-SE-09-XX Lead 14 mg/kg J- e LV-SE-10-XX Antimony <1.3 mg/kg UJ e LV-SE-10-XX Lead 25 mg/kg J- e LV-SE-10-XX Silver <1.3 mg/kg UJ e LV-SE-11-XX Antimony <1.4 mg/kg UJ e LV-SE-12-XX Lead 19 mg/kg J- e LV-SE-13-XX Mercury 640 mg/kg J- e LV-SE-14-XX Antimony <1.5 mg/kg UJ e LV-SE-15-XX Antimony 290 mg/kg J+ e LV-SE-15-XX Silver 300 mg/kg J- e LV-SE-16-XX Antimony <1.3 mg/kg UJ e LV-SE-17-XX Antimony 280 mg/kg J+ e
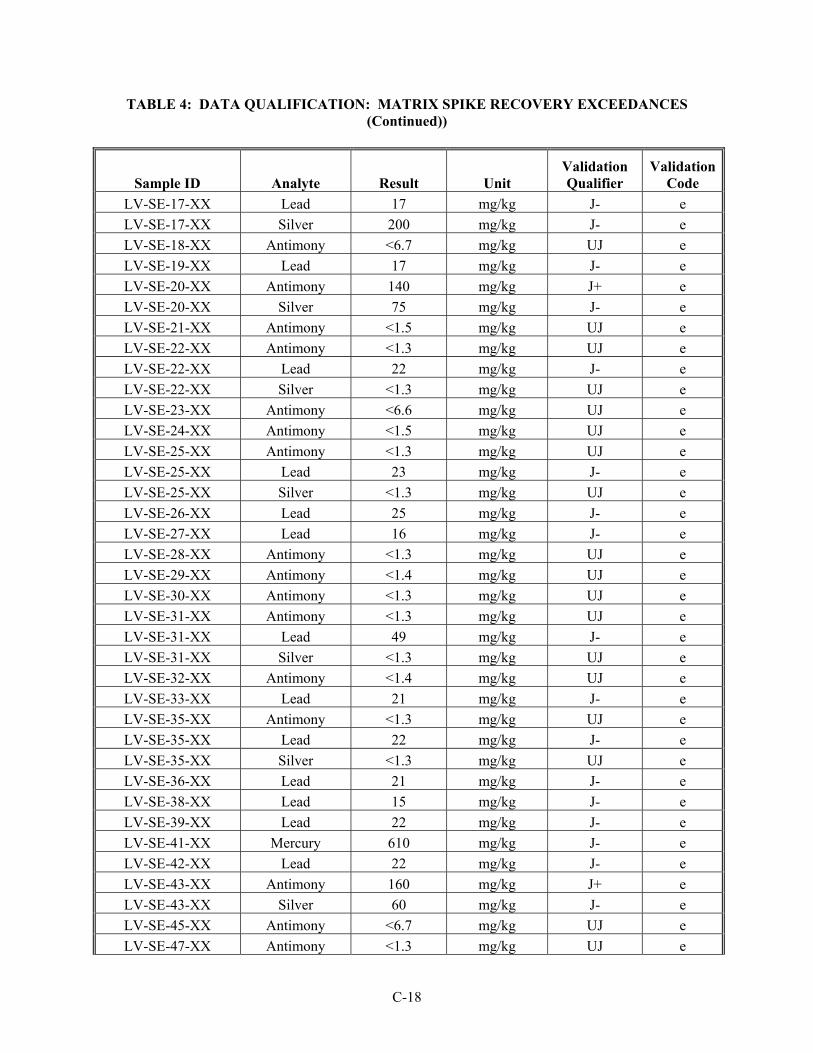
TABLE 4: DATA QUALIFICATION: MATRIX SPIKE RECOVERY EXCEEDANCES (Continued))
C-18
Sample ID Analyte Result Unit Validation Qualifier
Validation Code
LV-SE-17-XX Lead 17 mg/kg J- e LV-SE-17-XX Silver 200 mg/kg J- e LV-SE-18-XX Antimony <6.7 mg/kg UJ e LV-SE-19-XX Lead 17 mg/kg J- e LV-SE-20-XX Antimony 140 mg/kg J+ e LV-SE-20-XX Silver 75 mg/kg J- e LV-SE-21-XX Antimony <1.5 mg/kg UJ e LV-SE-22-XX Antimony <1.3 mg/kg UJ e LV-SE-22-XX Lead 22 mg/kg J- e LV-SE-22-XX Silver <1.3 mg/kg UJ e LV-SE-23-XX Antimony <6.6 mg/kg UJ e LV-SE-24-XX Antimony <1.5 mg/kg UJ e LV-SE-25-XX Antimony <1.3 mg/kg UJ e LV-SE-25-XX Lead 23 mg/kg J- e LV-SE-25-XX Silver <1.3 mg/kg UJ e LV-SE-26-XX Lead 25 mg/kg J- e LV-SE-27-XX Lead 16 mg/kg J- e LV-SE-28-XX Antimony <1.3 mg/kg UJ e LV-SE-29-XX Antimony <1.4 mg/kg UJ e LV-SE-30-XX Antimony <1.3 mg/kg UJ e LV-SE-31-XX Antimony <1.3 mg/kg UJ e LV-SE-31-XX Lead 49 mg/kg J- e LV-SE-31-XX Silver <1.3 mg/kg UJ e LV-SE-32-XX Antimony <1.4 mg/kg UJ e LV-SE-33-XX Lead 21 mg/kg J- e LV-SE-35-XX Antimony <1.3 mg/kg UJ e LV-SE-35-XX Lead 22 mg/kg J- e LV-SE-35-XX Silver <1.3 mg/kg UJ e LV-SE-36-XX Lead 21 mg/kg J- e LV-SE-38-XX Lead 15 mg/kg J- e LV-SE-39-XX Lead 22 mg/kg J- e LV-SE-41-XX Mercury 610 mg/kg J- e LV-SE-42-XX Lead 22 mg/kg J- e LV-SE-43-XX Antimony 160 mg/kg J+ e LV-SE-43-XX Silver 60 mg/kg J- e LV-SE-45-XX Antimony <6.7 mg/kg UJ e LV-SE-47-XX Antimony <1.3 mg/kg UJ e
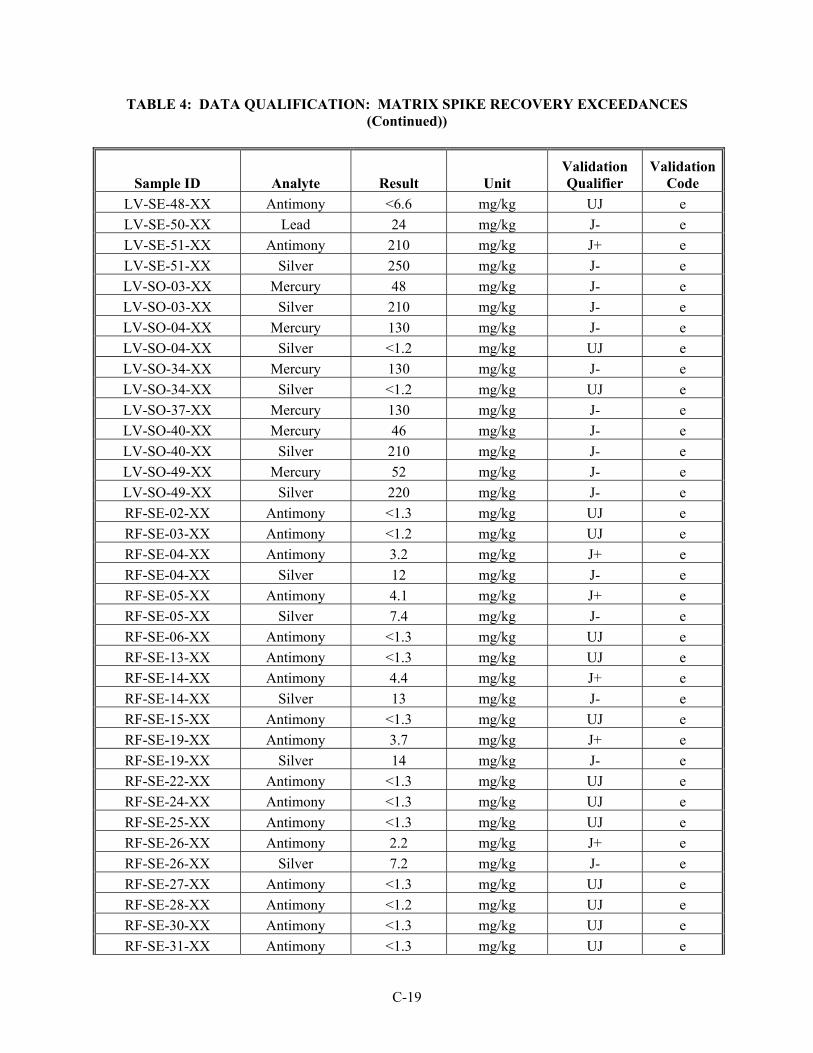
TABLE 4: DATA QUALIFICATION: MATRIX SPIKE RECOVERY EXCEEDANCES (Continued))
C-19
Sample ID Analyte Result Unit Validation Qualifier
Validation Code
LV-SE-48-XX Antimony <6.6 mg/kg UJ e LV-SE-50-XX Lead 24 mg/kg J- e LV-SE-51-XX Antimony 210 mg/kg J+ e LV-SE-51-XX Silver 250 mg/kg J- e LV-SO-03-XX Mercury 48 mg/kg J- e LV-SO-03-XX Silver 210 mg/kg J- e LV-SO-04-XX Mercury 130 mg/kg J- e LV-SO-04-XX Silver <1.2 mg/kg UJ e LV-SO-34-XX Mercury 130 mg/kg J- e LV-SO-34-XX Silver <1.2 mg/kg UJ e LV-SO-37-XX Mercury 130 mg/kg J- e LV-SO-40-XX Mercury 46 mg/kg J- e LV-SO-40-XX Silver 210 mg/kg J- e LV-SO-49-XX Mercury 52 mg/kg J- e LV-SO-49-XX Silver 220 mg/kg J- e RF-SE-02-XX Antimony <1.3 mg/kg UJ e RF-SE-03-XX Antimony <1.2 mg/kg UJ e RF-SE-04-XX Antimony 3.2 mg/kg J+ e RF-SE-04-XX Silver 12 mg/kg J- e RF-SE-05-XX Antimony 4.1 mg/kg J+ e RF-SE-05-XX Silver 7.4 mg/kg J- e RF-SE-06-XX Antimony <1.3 mg/kg UJ e RF-SE-13-XX Antimony <1.3 mg/kg UJ e RF-SE-14-XX Antimony 4.4 mg/kg J+ e RF-SE-14-XX Silver 13 mg/kg J- e RF-SE-15-XX Antimony <1.3 mg/kg UJ e RF-SE-19-XX Antimony 3.7 mg/kg J+ e RF-SE-19-XX Silver 14 mg/kg J- e RF-SE-22-XX Antimony <1.3 mg/kg UJ e RF-SE-24-XX Antimony <1.3 mg/kg UJ e RF-SE-25-XX Antimony <1.3 mg/kg UJ e RF-SE-26-XX Antimony 2.2 mg/kg J+ e RF-SE-26-XX Silver 7.2 mg/kg J- e RF-SE-27-XX Antimony <1.3 mg/kg UJ e RF-SE-28-XX Antimony <1.2 mg/kg UJ e RF-SE-30-XX Antimony <1.3 mg/kg UJ e RF-SE-31-XX Antimony <1.3 mg/kg UJ e
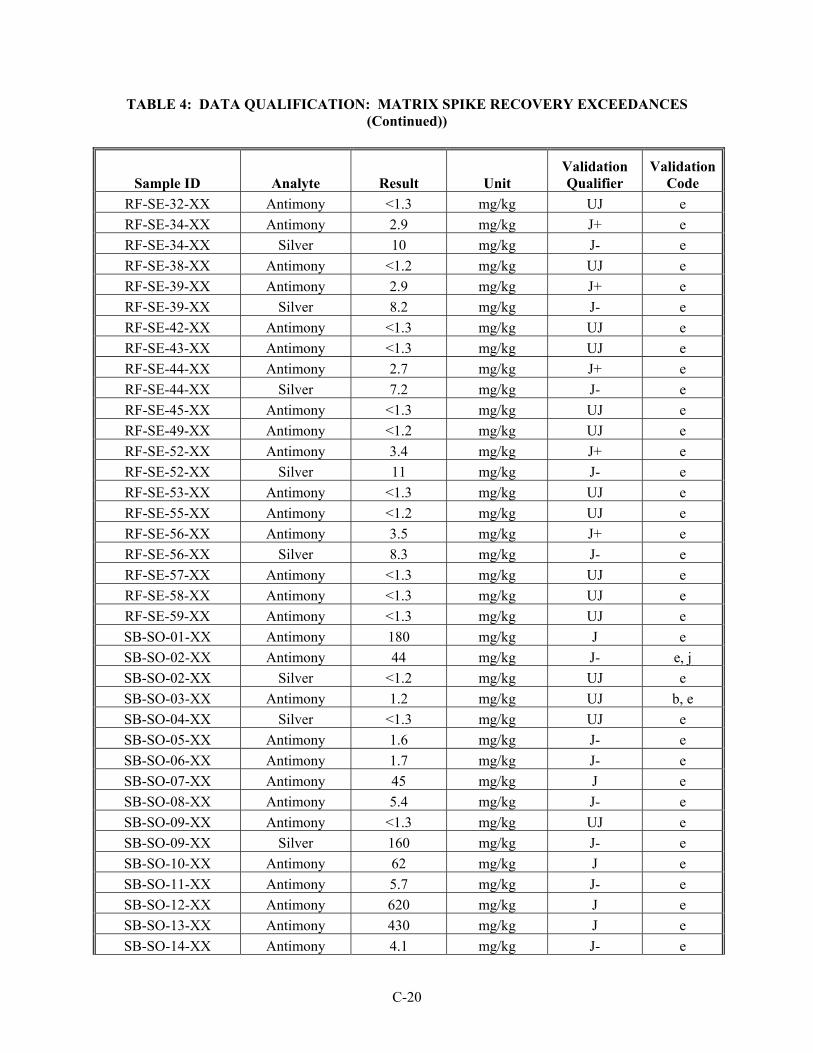
TABLE 4: DATA QUALIFICATION: MATRIX SPIKE RECOVERY EXCEEDANCES (Continued))
C-20
Sample ID Analyte Result Unit Validation Qualifier
Validation Code
RF-SE-32-XX Antimony <1.3 mg/kg UJ e RF-SE-34-XX Antimony 2.9 mg/kg J+ e RF-SE-34-XX Silver 10 mg/kg J- e RF-SE-38-XX Antimony <1.2 mg/kg UJ e RF-SE-39-XX Antimony 2.9 mg/kg J+ e RF-SE-39-XX Silver 8.2 mg/kg J- e RF-SE-42-XX Antimony <1.3 mg/kg UJ e RF-SE-43-XX Antimony <1.3 mg/kg UJ e RF-SE-44-XX Antimony 2.7 mg/kg J+ e RF-SE-44-XX Silver 7.2 mg/kg J- e RF-SE-45-XX Antimony <1.3 mg/kg UJ e RF-SE-49-XX Antimony <1.2 mg/kg UJ e RF-SE-52-XX Antimony 3.4 mg/kg J+ e RF-SE-52-XX Silver 11 mg/kg J- e RF-SE-53-XX Antimony <1.3 mg/kg UJ e RF-SE-55-XX Antimony <1.2 mg/kg UJ e RF-SE-56-XX Antimony 3.5 mg/kg J+ e RF-SE-56-XX Silver 8.3 mg/kg J- e RF-SE-57-XX Antimony <1.3 mg/kg UJ e RF-SE-58-XX Antimony <1.3 mg/kg UJ e RF-SE-59-XX Antimony <1.3 mg/kg UJ e SB-SO-01-XX Antimony 180 mg/kg J e SB-SO-02-XX Antimony 44 mg/kg J- e, j SB-SO-02-XX Silver <1.2 mg/kg UJ e SB-SO-03-XX Antimony 1.2 mg/kg UJ b, e SB-SO-04-XX Silver <1.3 mg/kg UJ e SB-SO-05-XX Antimony 1.6 mg/kg J- e SB-SO-06-XX Antimony 1.7 mg/kg J- e SB-SO-07-XX Antimony 45 mg/kg J e SB-SO-08-XX Antimony 5.4 mg/kg J- e SB-SO-09-XX Antimony <1.3 mg/kg UJ e SB-SO-09-XX Silver 160 mg/kg J- e SB-SO-10-XX Antimony 62 mg/kg J e SB-SO-11-XX Antimony 5.7 mg/kg J- e SB-SO-12-XX Antimony 620 mg/kg J e SB-SO-13-XX Antimony 430 mg/kg J e SB-SO-14-XX Antimony 4.1 mg/kg J- e

TABLE 4: DATA QUALIFICATION: MATRIX SPIKE RECOVERY EXCEEDANCES (Continued))
C-21
Sample ID Analyte Result Unit Validation Qualifier
Validation Code
SB-SO-15-XX Antimony 600 mg/kg J- j, e SB-SO-16-XX Antimony 170 mg/kg J e SB-SO-17-XX Antimony 800 mg/kg J+ e SB-SO-17-XX Silver 2.3 mg/kg UJ b, e SB-SO-18-XX Antimony 1.2 mg/kg UJ b, e SB-SO-19-XX Antimony 310 mg/kg J e SB-SO-20-XX Antimony <1.3 mg/kg UJ e SB-SO-20-XX Silver 140 mg/kg J- e SB-SO-21-XX Antimony 4.9 mg/kg J e SB-SO-22-XX Antimony 10 mg/kg J e, j SB-SO-23-XX Antimony 48 mg/kg J- e SB-SO-23-XX Silver <0.26 mg/kg UJ e SB-SO-24-XX Antimony 180 mg/kg J e SB-SO-25-XX Antimony 6.8 mg/kg J+ e SB-SO-26-XX Antimony 61 mg/kg J e SB-SO-27-XX Antimony 6.7 mg/kg J+ e SB-SO-28-XX Antimony 42 mg/kg J- e SB-SO-28-XX Silver <0.26 mg/kg UJ e SB-SO-29-XX Silver <1.2 mg/kg UJ e SB-SO-30-XX Antimony 3.2 mg/kg J- e SB-SO-31-XX Antimony <1.3 mg/kg UJ e SB-SO-31-XX Silver 160 mg/kg J- e, j SB-SO-32-XX Antimony 46 mg/kg J- e SB-SO-32-XX Silver 0.1 mg/kg UJ b, e SB-SO-33-XX Antimony 350 mg/kg J e SB-SO-33-XX Silver 2 mg/kg J e SB-SO-34-XX Silver <1.3 mg/kg UJ e SB-SO-35-XX Antimony 6 mg/kg J+ e SB-SO-36-XX Silver <1.2 mg/kg UJ e SB-SO-37-XX Antimony 340 mg/kg J e SB-SO-38-XX Antimony <1.3 mg/kg UJ e SB-SO-39-XX Antimony 4.7 mg/kg J- e SB-SO-40-XX Antimony 2.2 mg/kg J- e SB-SO-41-XX Antimony <1.3 mg/kg UJ e SB-SO-42-XX Antimony 4.6 mg/kg J- e SB-SO-43-XX Antimony 40 mg/kg J- e SB-SO-43-XX Silver <0.26 mg/kg UJ e
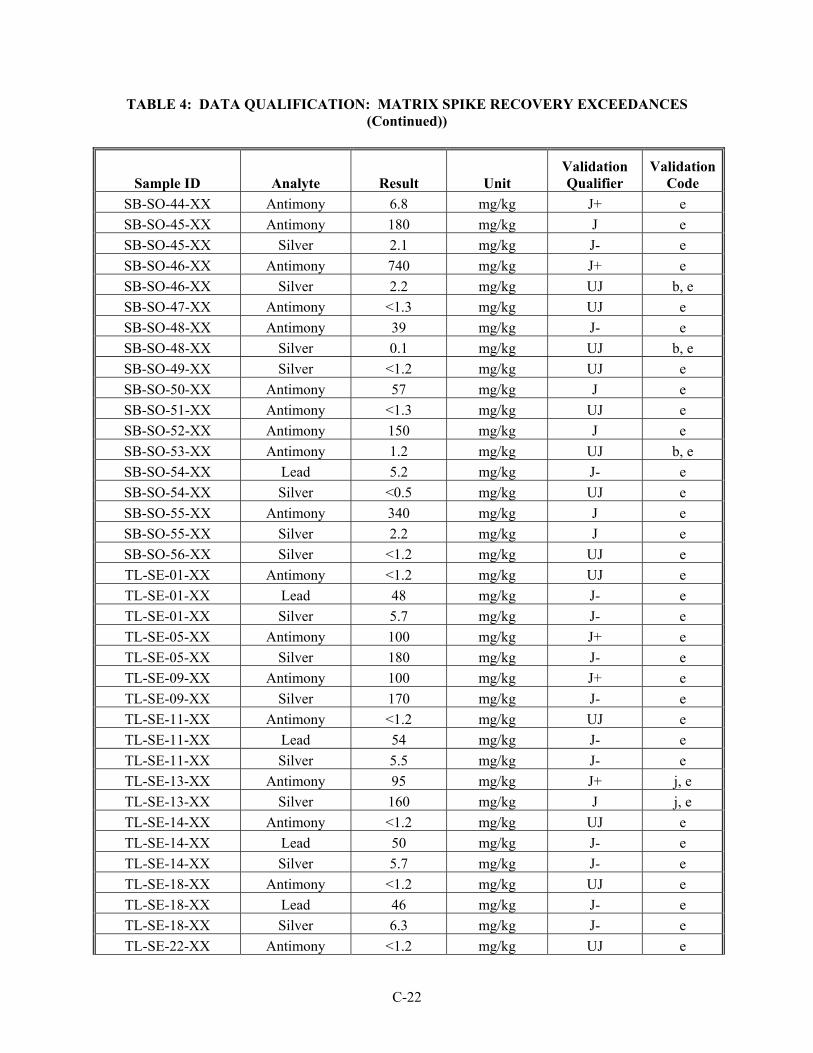
TABLE 4: DATA QUALIFICATION: MATRIX SPIKE RECOVERY EXCEEDANCES (Continued))
C-22
Sample ID Analyte Result Unit Validation Qualifier
Validation Code
SB-SO-44-XX Antimony 6.8 mg/kg J+ e SB-SO-45-XX Antimony 180 mg/kg J e SB-SO-45-XX Silver 2.1 mg/kg J- e SB-SO-46-XX Antimony 740 mg/kg J+ e SB-SO-46-XX Silver 2.2 mg/kg UJ b, e SB-SO-47-XX Antimony <1.3 mg/kg UJ e SB-SO-48-XX Antimony 39 mg/kg J- e SB-SO-48-XX Silver 0.1 mg/kg UJ b, e SB-SO-49-XX Silver <1.2 mg/kg UJ e SB-SO-50-XX Antimony 57 mg/kg J e SB-SO-51-XX Antimony <1.3 mg/kg UJ e SB-SO-52-XX Antimony 150 mg/kg J e SB-SO-53-XX Antimony 1.2 mg/kg UJ b, e SB-SO-54-XX Lead 5.2 mg/kg J- e SB-SO-54-XX Silver <0.5 mg/kg UJ e SB-SO-55-XX Antimony 340 mg/kg J e SB-SO-55-XX Silver 2.2 mg/kg J e SB-SO-56-XX Silver <1.2 mg/kg UJ e TL-SE-01-XX Antimony <1.2 mg/kg UJ e TL-SE-01-XX Lead 48 mg/kg J- e TL-SE-01-XX Silver 5.7 mg/kg J- e TL-SE-05-XX Antimony 100 mg/kg J+ e TL-SE-05-XX Silver 180 mg/kg J- e TL-SE-09-XX Antimony 100 mg/kg J+ e TL-SE-09-XX Silver 170 mg/kg J- e TL-SE-11-XX Antimony <1.2 mg/kg UJ e TL-SE-11-XX Lead 54 mg/kg J- e TL-SE-11-XX Silver 5.5 mg/kg J- e TL-SE-13-XX Antimony 95 mg/kg J+ j, e TL-SE-13-XX Silver 160 mg/kg J j, e TL-SE-14-XX Antimony <1.2 mg/kg UJ e TL-SE-14-XX Lead 50 mg/kg J- e TL-SE-14-XX Silver 5.7 mg/kg J- e TL-SE-18-XX Antimony <1.2 mg/kg UJ e TL-SE-18-XX Lead 46 mg/kg J- e TL-SE-18-XX Silver 6.3 mg/kg J- e TL-SE-22-XX Antimony <1.2 mg/kg UJ e

TABLE 4: DATA QUALIFICATION: MATRIX SPIKE RECOVERY EXCEEDANCES (Continued))
C-23
Sample ID Analyte Result Unit Validation Qualifier
Validation Code
TL-SE-22-XX Lead 54 mg/kg J- e TL-SE-22-XX Silver 6.5 mg/kg J- e TL-SE-27-XX Antimony <1.2 mg/kg UJ e TL-SE-27-XX Lead 51 mg/kg J- e TL-SE-27-XX Silver 7.8 mg/kg J- e TL-SE-29-XX Antimony <1.2 mg/kg UJ e TL-SE-29-XX Lead 51 mg/kg J- e TL-SE-29-XX Silver 5.9 mg/kg J- e WS-SO-01-XX Antimony 41 mg/kg J- e WS-SO-01-XX Mercury 5.8 mg/kg J e, j WS-SO-01-XX Silver 69 mg/kg J- e WS-SO-02-XX Antimony 130 mg/kg J- e WS-SO-02-XX Silver 150 mg/kg J- e WS-SO-03-XX Antimony 8.9 mg/kg J- e WS-SO-03-XX Mercury 0.86 mg/kg J- e WS-SO-04-XX Antimony 45 mg/kg J- e WS-SO-04-XX Silver 76 mg/kg J- e WS-SO-05-XX Antimony 8.6 mg/kg J- e WS-SO-05-XX Silver 0.76 mg/kg J- e WS-SO-07-XX Silver 400 mg/kg J- e WS-SO-09-XX Antimony 7.1 mg/kg J- e WS-SO-09-XX Mercury 0.89 mg/kg J- e WS-SO-10-XX Silver <1.3 mg/kg UJ e WS-SO-11-XX Silver 340 mg/kg J- e WS-SO-12-XX Antimony <1.3 mg/kg UJ e WS-SO-12-XX Mercury 0.068 mg/kg UJ b, e WS-SO-13-XX Antimony 200 mg/kg J- e WS-SO-13-XX Silver 170 mg/kg J- e WS-SO-14-XX Antimony 8.4 mg/kg J- e WS-SO-14-XX Mercury 0.74 mg/kg J- e WS-SO-15-XX Antimony 48 mg/kg J- e WS-SO-15-XX Silver 90 mg/kg J- e WS-SO-16-XX Antimony 110 mg/kg J- e WS-SO-16-XX Silver 150 mg/kg J- e WS-SO-17-XX Antimony <1.3 mg/kg UJ e WS-SO-17-XX Mercury 0.069 mg/kg UJ b, e WS-SO-18-XX Antimony 130 mg/kg J- e

TABLE 4: DATA QUALIFICATION: MATRIX SPIKE RECOVERY EXCEEDANCES (Continued))
C-24
Sample ID Analyte Result Unit Validation Qualifier
Validation Code
WS-SO-18-XX Silver 140 mg/kg J- e WS-SO-19-XX Antimony 150 mg/kg J- e WS-SO-19-XX Silver 160 mg/kg J- e WS-SO-20-XX Silver <1.3 mg/kg UJ e WS-SO-21-XX Antimony 120 mg/kg J- e WS-SO-21-XX Silver 150 mg/kg J- e WS-SO-22-XX Antimony 41 mg/kg J- e WS-SO-22-XX Silver 72 mg/kg J- e WS-SO-23-XX Silver <1.3 mg/kg UJ e WS-SO-24-XX Antimony 97 mg/kg J- e WS-SO-24-XX Silver 140 mg/kg J- e WS-SO-25-XX Silver 450 mg/kg J- e WS-SO-26-XX Antimony 7.6 mg/kg J- e WS-SO-26-XX Mercury 0.83 mg/kg J- e WS-SO-27-XX Antimony <1.3 mg/kg UJ e WS-SO-27-XX Mercury 0.11 mg/kg J- e WS-SO-28-XX Antimony 120 mg/kg J- e WS-SO-28-XX Silver 130 mg/kg J- e WS-SO-29-XX Antimony 120 mg/kg J- e WS-SO-29-XX Silver 140 mg/kg J- e WS-SO-30-XX Antimony 1.2 mg/kg J- e WS-SO-30-XX Mercury 0.069 mg/kg UJ b, e WS-SO-31-XX Antimony 7.2 mg/kg J- e WS-SO-31-XX Mercury 0.85 mg/kg J- e WS-SO-32-XX Antimony 190 mg/kg J- e WS-SO-32-XX Silver 190 mg/kg J- e WS-SO-33-XX Antimony 6.9 mg/kg J- e WS-SO-33-XX Mercury 0.87 mg/kg J- e WS-SO-34-XX Antimony 45 mg/kg J- e WS-SO-34-XX Silver 78 mg/kg J- e WS-SO-35-XX Antimony <1.3 mg/kg UJ e WS-SO-35-XX Mercury 0.071 mg/kg UJ b, e WS-SO-36-XX Antimony 120 mg/kg J- e WS-SO-36-XX Silver 120 mg/kg J- e WS-SO-37-XX Antimony 120 mg/kg J- e WS-SO-37-XX Silver 140 mg/kg J- e
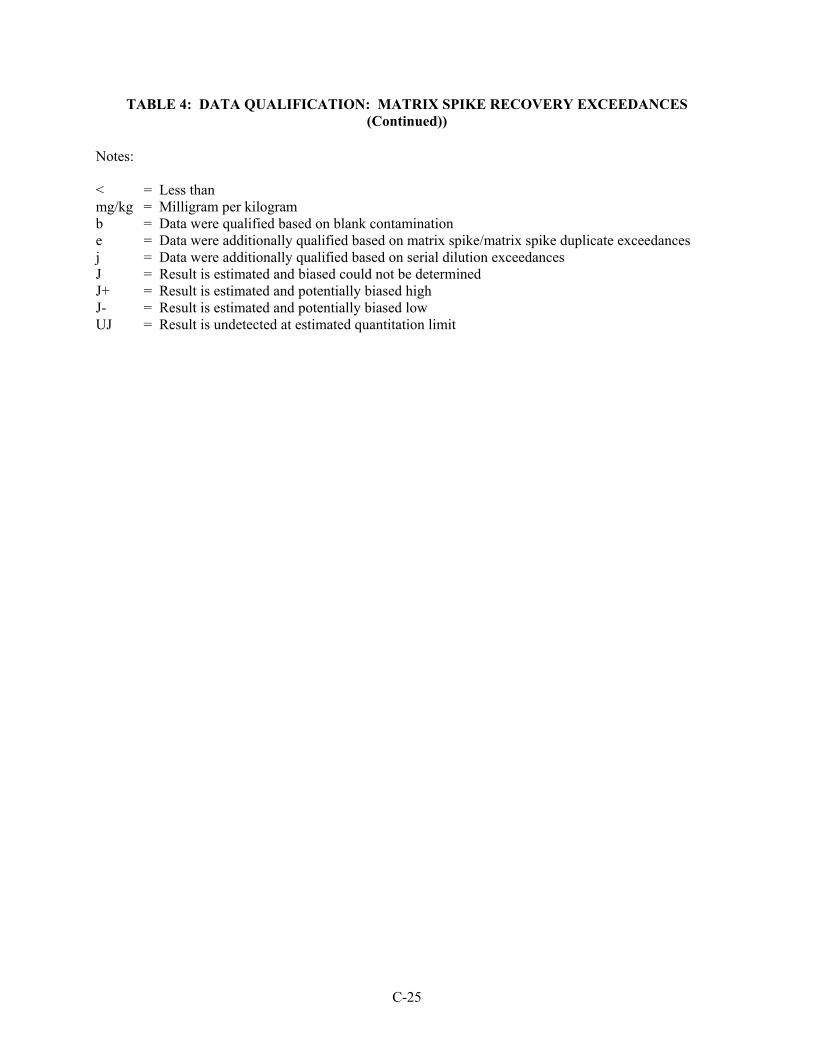
TABLE 4: DATA QUALIFICATION: MATRIX SPIKE RECOVERY EXCEEDANCES (Continued))
C-25
Notes: < = Less than mg/kg = Milligram per kilogram b = Data were qualified based on blank contamination e = Data were additionally qualified based on matrix spike/matrix spike duplicate exceedances j = Data were additionally qualified based on serial dilution exceedances J = Result is estimated and biased could not be determined J+ = Result is estimated and potentially biased high J- = Result is estimated and potentially biased low UJ = Result is undetected at estimated quantitation limit
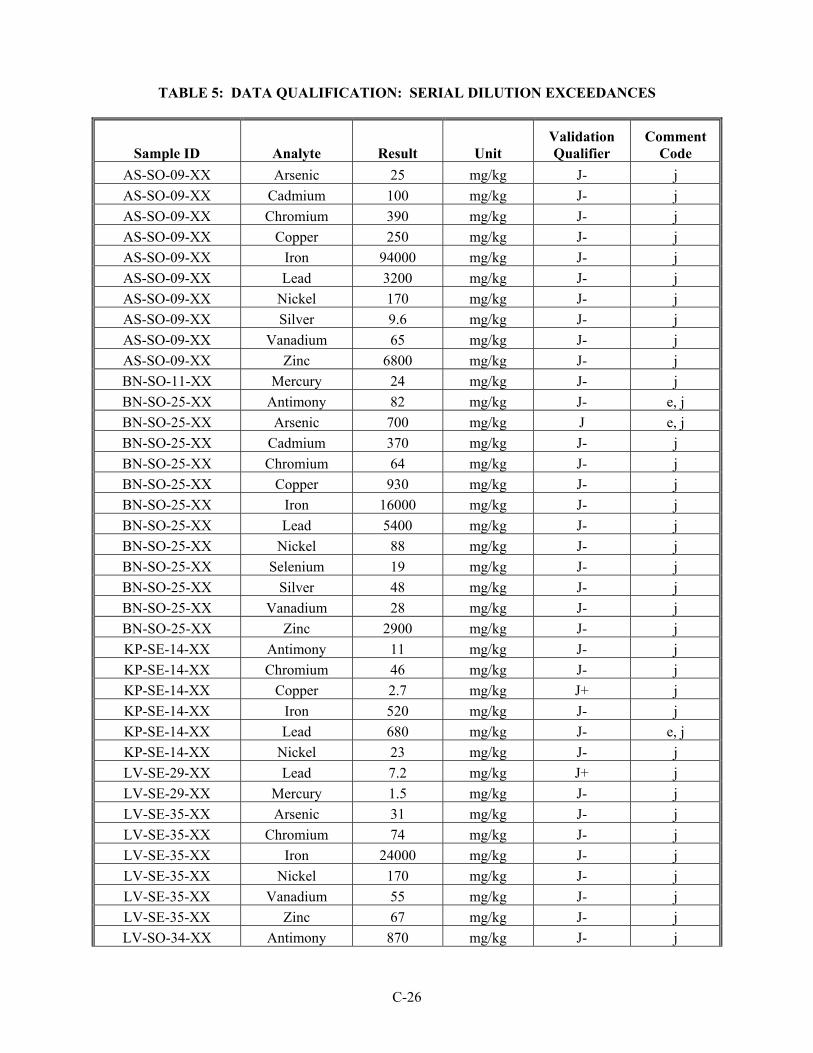
C-26
TABLE 5: DATA QUALIFICATION: SERIAL DILUTION EXCEEDANCES
Sample ID Analyte Result Unit Validation Qualifier
Comment Code
AS-SO-09-XX Arsenic 25 mg/kg J- j AS-SO-09-XX Cadmium 100 mg/kg J- j AS-SO-09-XX Chromium 390 mg/kg J- j AS-SO-09-XX Copper 250 mg/kg J- j AS-SO-09-XX Iron 94000 mg/kg J- j AS-SO-09-XX Lead 3200 mg/kg J- j AS-SO-09-XX Nickel 170 mg/kg J- j AS-SO-09-XX Silver 9.6 mg/kg J- j AS-SO-09-XX Vanadium 65 mg/kg J- j AS-SO-09-XX Zinc 6800 mg/kg J- j BN-SO-11-XX Mercury 24 mg/kg J- j BN-SO-25-XX Antimony 82 mg/kg J- e, j BN-SO-25-XX Arsenic 700 mg/kg J e, j BN-SO-25-XX Cadmium 370 mg/kg J- j BN-SO-25-XX Chromium 64 mg/kg J- j BN-SO-25-XX Copper 930 mg/kg J- j BN-SO-25-XX Iron 16000 mg/kg J- j BN-SO-25-XX Lead 5400 mg/kg J- j BN-SO-25-XX Nickel 88 mg/kg J- j BN-SO-25-XX Selenium 19 mg/kg J- j BN-SO-25-XX Silver 48 mg/kg J- j BN-SO-25-XX Vanadium 28 mg/kg J- j BN-SO-25-XX Zinc 2900 mg/kg J- j KP-SE-14-XX Antimony 11 mg/kg J- j KP-SE-14-XX Chromium 46 mg/kg J- j KP-SE-14-XX Copper 2.7 mg/kg J+ j KP-SE-14-XX Iron 520 mg/kg J- j KP-SE-14-XX Lead 680 mg/kg J- e, j KP-SE-14-XX Nickel 23 mg/kg J- j LV-SE-29-XX Lead 7.2 mg/kg J+ j LV-SE-29-XX Mercury 1.5 mg/kg J- j LV-SE-35-XX Arsenic 31 mg/kg J- j LV-SE-35-XX Chromium 74 mg/kg J- j LV-SE-35-XX Iron 24000 mg/kg J- j LV-SE-35-XX Nickel 170 mg/kg J- j LV-SE-35-XX Vanadium 55 mg/kg J- j LV-SE-35-XX Zinc 67 mg/kg J- j LV-SO-34-XX Antimony 870 mg/kg J- j
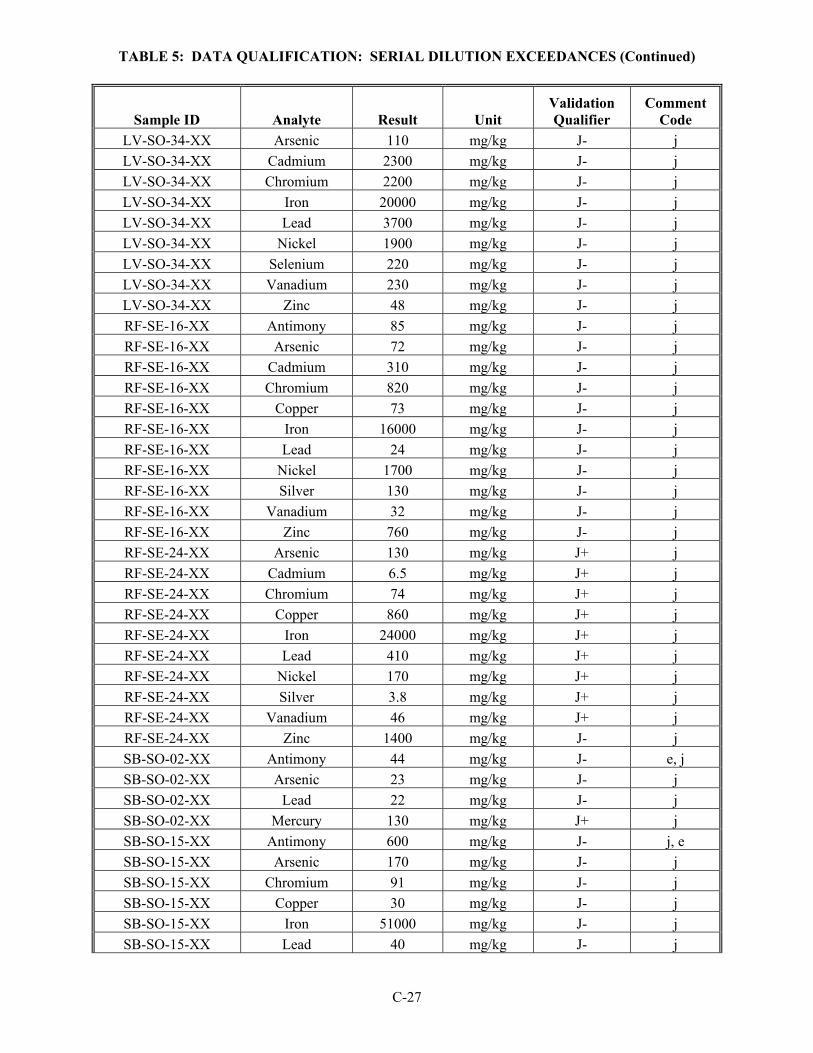
TABLE 5: DATA QUALIFICATION: SERIAL DILUTION EXCEEDANCES (Continued)
C-27
Sample ID Analyte Result Unit Validation Qualifier
Comment Code
LV-SO-34-XX Arsenic 110 mg/kg J- j LV-SO-34-XX Cadmium 2300 mg/kg J- j LV-SO-34-XX Chromium 2200 mg/kg J- j LV-SO-34-XX Iron 20000 mg/kg J- j LV-SO-34-XX Lead 3700 mg/kg J- j LV-SO-34-XX Nickel 1900 mg/kg J- j LV-SO-34-XX Selenium 220 mg/kg J- j LV-SO-34-XX Vanadium 230 mg/kg J- j LV-SO-34-XX Zinc 48 mg/kg J- j RF-SE-16-XX Antimony 85 mg/kg J- j RF-SE-16-XX Arsenic 72 mg/kg J- j RF-SE-16-XX Cadmium 310 mg/kg J- j RF-SE-16-XX Chromium 820 mg/kg J- j RF-SE-16-XX Copper 73 mg/kg J- j RF-SE-16-XX Iron 16000 mg/kg J- j RF-SE-16-XX Lead 24 mg/kg J- j RF-SE-16-XX Nickel 1700 mg/kg J- j RF-SE-16-XX Silver 130 mg/kg J- j RF-SE-16-XX Vanadium 32 mg/kg J- j RF-SE-16-XX Zinc 760 mg/kg J- j RF-SE-24-XX Arsenic 130 mg/kg J+ j RF-SE-24-XX Cadmium 6.5 mg/kg J+ j RF-SE-24-XX Chromium 74 mg/kg J+ j RF-SE-24-XX Copper 860 mg/kg J+ j RF-SE-24-XX Iron 24000 mg/kg J+ j RF-SE-24-XX Lead 410 mg/kg J+ j RF-SE-24-XX Nickel 170 mg/kg J+ j RF-SE-24-XX Silver 3.8 mg/kg J+ j RF-SE-24-XX Vanadium 46 mg/kg J+ j RF-SE-24-XX Zinc 1400 mg/kg J- j SB-SO-02-XX Antimony 44 mg/kg J- e, j SB-SO-02-XX Arsenic 23 mg/kg J- j SB-SO-02-XX Lead 22 mg/kg J- j SB-SO-02-XX Mercury 130 mg/kg J+ j SB-SO-15-XX Antimony 600 mg/kg J- j, e SB-SO-15-XX Arsenic 170 mg/kg J- j SB-SO-15-XX Chromium 91 mg/kg J- j SB-SO-15-XX Copper 30 mg/kg J- j SB-SO-15-XX Iron 51000 mg/kg J- j SB-SO-15-XX Lead 40 mg/kg J- j
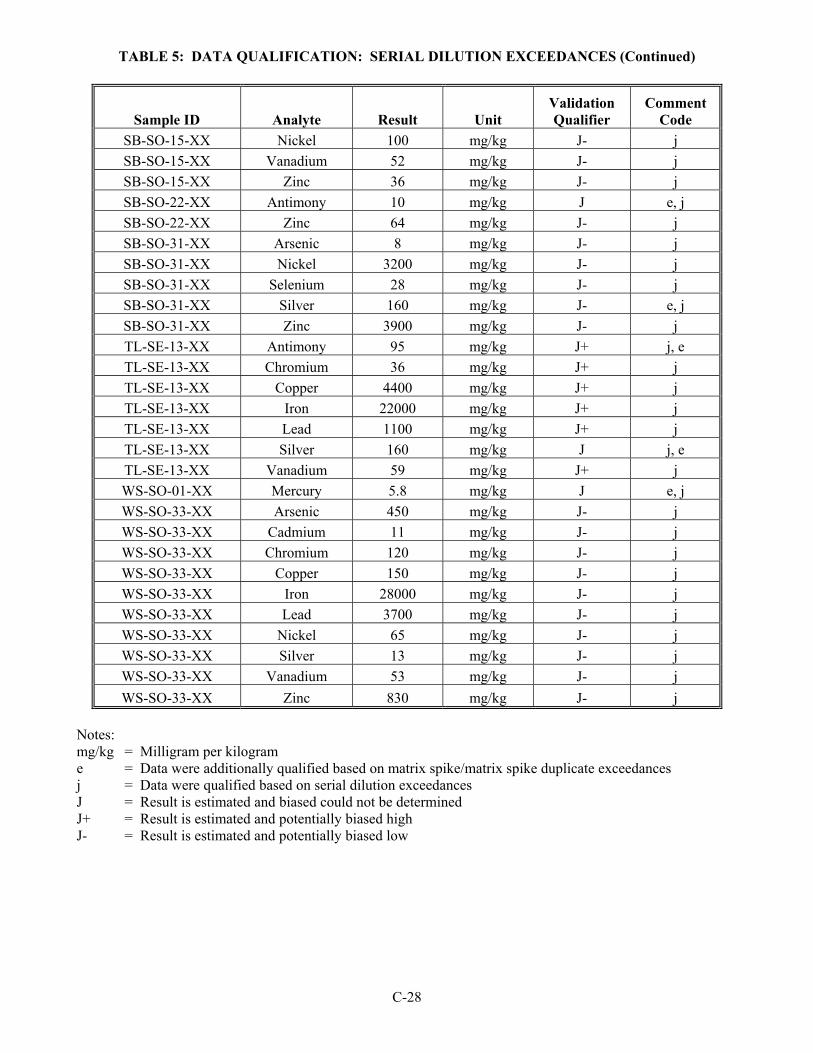
TABLE 5: DATA QUALIFICATION: SERIAL DILUTION EXCEEDANCES (Continued)
C-28
Sample ID Analyte Result Unit Validation Qualifier
Comment Code
SB-SO-15-XX Nickel 100 mg/kg J- j SB-SO-15-XX Vanadium 52 mg/kg J- j SB-SO-15-XX Zinc 36 mg/kg J- j SB-SO-22-XX Antimony 10 mg/kg J e, j SB-SO-22-XX Zinc 64 mg/kg J- j SB-SO-31-XX Arsenic 8 mg/kg J- j SB-SO-31-XX Nickel 3200 mg/kg J- j SB-SO-31-XX Selenium 28 mg/kg J- j SB-SO-31-XX Silver 160 mg/kg J- e, j SB-SO-31-XX Zinc 3900 mg/kg J- j TL-SE-13-XX Antimony 95 mg/kg J+ j, e TL-SE-13-XX Chromium 36 mg/kg J+ j TL-SE-13-XX Copper 4400 mg/kg J+ j TL-SE-13-XX Iron 22000 mg/kg J+ j TL-SE-13-XX Lead 1100 mg/kg J+ j TL-SE-13-XX Silver 160 mg/kg J j, e TL-SE-13-XX Vanadium 59 mg/kg J+ j WS-SO-01-XX Mercury 5.8 mg/kg J e, j WS-SO-33-XX Arsenic 450 mg/kg J- j WS-SO-33-XX Cadmium 11 mg/kg J- j WS-SO-33-XX Chromium 120 mg/kg J- j WS-SO-33-XX Copper 150 mg/kg J- j WS-SO-33-XX Iron 28000 mg/kg J- j WS-SO-33-XX Lead 3700 mg/kg J- j WS-SO-33-XX Nickel 65 mg/kg J- j WS-SO-33-XX Silver 13 mg/kg J- j WS-SO-33-XX Vanadium 53 mg/kg J- j WS-SO-33-XX Zinc 830 mg/kg J- j
Notes: mg/kg = Milligram per kilogram e = Data were additionally qualified based on matrix spike/matrix spike duplicate exceedances j = Data were qualified based on serial dilution exceedances J = Result is estimated and biased could not be determined J+ = Result is estimated and potentially biased high J- = Result is estimated and potentially biased low

APPENDIX D
DEVELOPER AND REFERENCE LABORATORY DATA
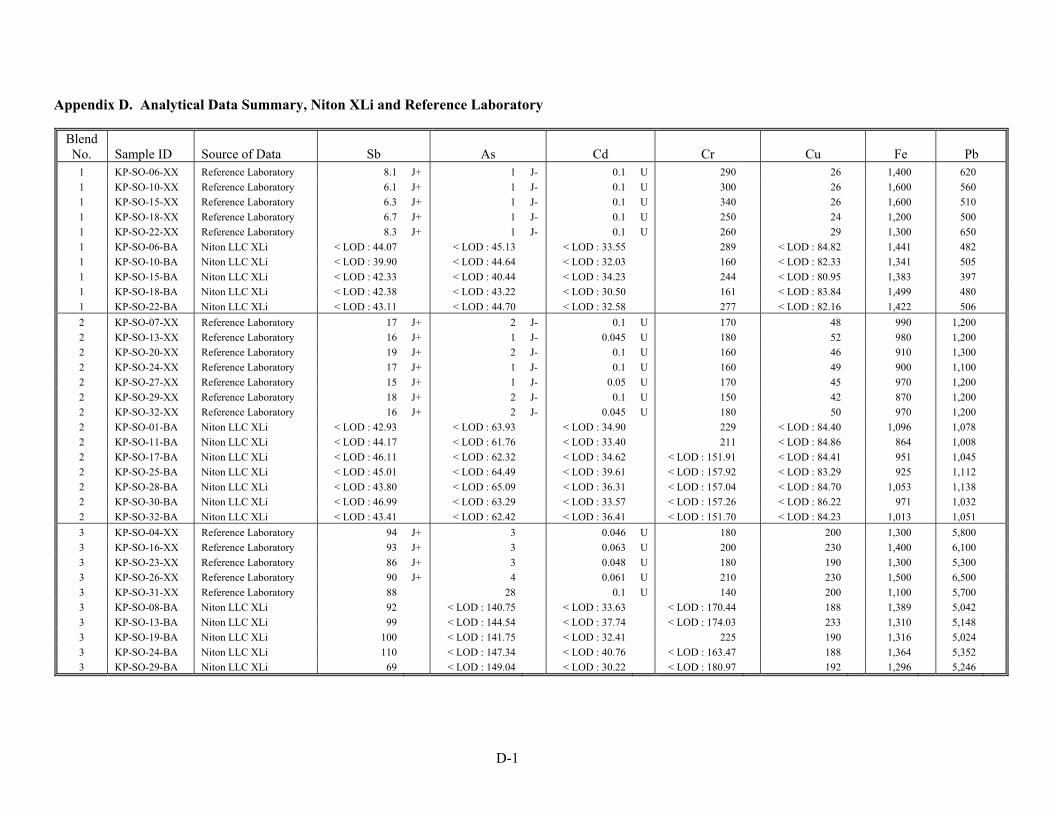
D-1
Appendix D. Analytical Data Summary, Niton XLi and Reference Laboratory
Blend No. Sample ID Source of Data Sb As Cd Cr Cu Fe Pb
1 KP-SO-06-XX Reference Laboratory 8.1 J+ 1 J- 0.1 U 290 26 1,400 620 1 KP-SO-10-XX Reference Laboratory 6.1 J+ 1 J- 0.1 U 300 26 1,600 560 1 KP-SO-15-XX Reference Laboratory 6.3 J+ 1 J- 0.1 U 340 26 1,600 510 1 KP-SO-18-XX Reference Laboratory 6.7 J+ 1 J- 0.1 U 250 24 1,200 500 1 KP-SO-22-XX Reference Laboratory 8.3 J+ 1 J- 0.1 U 260 29 1,300 650 1 KP-SO-06-BA Niton LLC XLi < LOD : 44.07 < LOD : 45.13 < LOD : 33.55 289 < LOD : 84.82 1,441 482 1 KP-SO-10-BA Niton LLC XLi < LOD : 39.90 < LOD : 44.64 < LOD : 32.03 160 < LOD : 82.33 1,341 505 1 KP-SO-15-BA Niton LLC XLi < LOD : 42.33 < LOD : 40.44 < LOD : 34.23 244 < LOD : 80.95 1,383 397 1 KP-SO-18-BA Niton LLC XLi < LOD : 42.38 < LOD : 43.22 < LOD : 30.50 161 < LOD : 83.84 1,499 480 1 KP-SO-22-BA Niton LLC XLi < LOD : 43.11 < LOD : 44.70 < LOD : 32.58 277 < LOD : 82.16 1,422 506 2 KP-SO-07-XX Reference Laboratory 17 J+ 2 J- 0.1 U 170 48 990 1,200 2 KP-SO-13-XX Reference Laboratory 16 J+ 1 J- 0.045 U 180 52 980 1,200 2 KP-SO-20-XX Reference Laboratory 19 J+ 2 J- 0.1 U 160 46 910 1,300 2 KP-SO-24-XX Reference Laboratory 17 J+ 1 J- 0.1 U 160 49 900 1,100 2 KP-SO-27-XX Reference Laboratory 15 J+ 1 J- 0.05 U 170 45 970 1,200 2 KP-SO-29-XX Reference Laboratory 18 J+ 2 J- 0.1 U 150 42 870 1,200 2 KP-SO-32-XX Reference Laboratory 16 J+ 2 J- 0.045 U 180 50 970 1,200 2 KP-SO-01-BA Niton LLC XLi < LOD : 42.93 < LOD : 63.93 < LOD : 34.90 229 < LOD : 84.40 1,096 1,078 2 KP-SO-11-BA Niton LLC XLi < LOD : 44.17 < LOD : 61.76 < LOD : 33.40 211 < LOD : 84.86 864 1,008 2 KP-SO-17-BA Niton LLC XLi < LOD : 46.11 < LOD : 62.32 < LOD : 34.62 < LOD : 151.91 < LOD : 84.41 951 1,045 2 KP-SO-25-BA Niton LLC XLi < LOD : 45.01 < LOD : 64.49 < LOD : 39.61 < LOD : 157.92 < LOD : 83.29 925 1,112 2 KP-SO-28-BA Niton LLC XLi < LOD : 43.80 < LOD : 65.09 < LOD : 36.31 < LOD : 157.04 < LOD : 84.70 1,053 1,138 2 KP-SO-30-BA Niton LLC XLi < LOD : 46.99 < LOD : 63.29 < LOD : 33.57 < LOD : 157.26 < LOD : 86.22 971 1,032 2 KP-SO-32-BA Niton LLC XLi < LOD : 43.41 < LOD : 62.42 < LOD : 36.41 < LOD : 151.70 < LOD : 84.23 1,013 1,051 3 KP-SO-04-XX Reference Laboratory 94 J+ 3 0.046 U 180 200 1,300 5,800 3 KP-SO-16-XX Reference Laboratory 93 J+ 3 0.063 U 200 230 1,400 6,100 3 KP-SO-23-XX Reference Laboratory 86 J+ 3 0.048 U 180 190 1,300 5,300 3 KP-SO-26-XX Reference Laboratory 90 J+ 4 0.061 U 210 230 1,500 6,500 3 KP-SO-31-XX Reference Laboratory 88 28 0.1 U 140 200 1,100 5,700 3 KP-SO-08-BA Niton LLC XLi 92 < LOD : 140.75 < LOD : 33.63 < LOD : 170.44 188 1,389 5,042 3 KP-SO-13-BA Niton LLC XLi 99 < LOD : 144.54 < LOD : 37.74 < LOD : 174.03 233 1,310 5,148 3 KP-SO-19-BA Niton LLC XLi 100 < LOD : 141.75 < LOD : 32.41 225 190 1,316 5,024 3 KP-SO-24-BA Niton LLC XLi 110 < LOD : 147.34 < LOD : 40.76 < LOD : 163.47 188 1,364 5,352 3 KP-SO-29-BA Niton LLC XLi 69 < LOD : 149.04 < LOD : 30.22 < LOD : 180.97 192 1,296 5,246
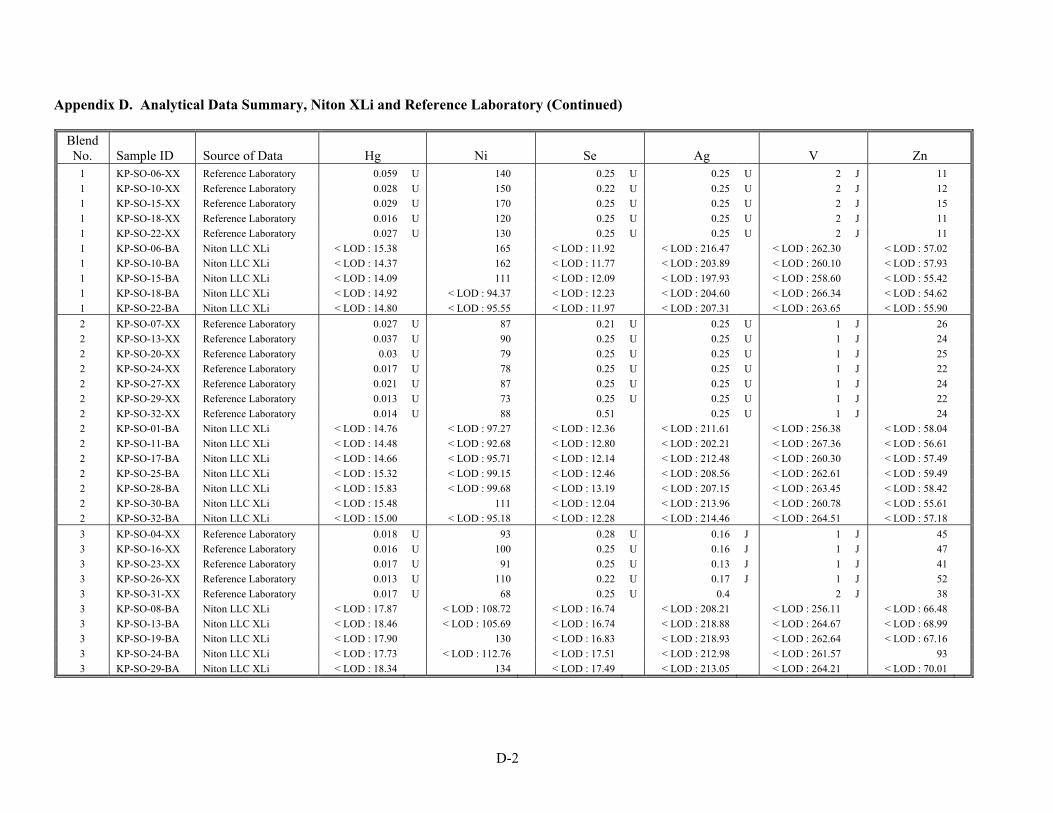
D-2
Appendix D. Analytical Data Summary, Niton XLi and Reference Laboratory (Continued)
Blend No. Sample ID Source of Data Hg Ni Se Ag V Zn
1 KP-SO-06-XX Reference Laboratory 0.059 U 140 0.25 U 0.25 U 2 J 11 1 KP-SO-10-XX Reference Laboratory 0.028 U 150 0.22 U 0.25 U 2 J 12 1 KP-SO-15-XX Reference Laboratory 0.029 U 170 0.25 U 0.25 U 2 J 15 1 KP-SO-18-XX Reference Laboratory 0.016 U 120 0.25 U 0.25 U 2 J 11 1 KP-SO-22-XX Reference Laboratory 0.027 U 130 0.25 U 0.25 U 2 J 11 1 KP-SO-06-BA Niton LLC XLi < LOD : 15.38 165 < LOD : 11.92 < LOD : 216.47 < LOD : 262.30 < LOD : 57.02 1 KP-SO-10-BA Niton LLC XLi < LOD : 14.37 162 < LOD : 11.77 < LOD : 203.89 < LOD : 260.10 < LOD : 57.93 1 KP-SO-15-BA Niton LLC XLi < LOD : 14.09 111 < LOD : 12.09 < LOD : 197.93 < LOD : 258.60 < LOD : 55.42 1 KP-SO-18-BA Niton LLC XLi < LOD : 14.92 < LOD : 94.37 < LOD : 12.23 < LOD : 204.60 < LOD : 266.34 < LOD : 54.62 1 KP-SO-22-BA Niton LLC XLi < LOD : 14.80 < LOD : 95.55 < LOD : 11.97 < LOD : 207.31 < LOD : 263.65 < LOD : 55.90 2 KP-SO-07-XX Reference Laboratory 0.027 U 87 0.21 U 0.25 U 1 J 26 2 KP-SO-13-XX Reference Laboratory 0.037 U 90 0.25 U 0.25 U 1 J 24 2 KP-SO-20-XX Reference Laboratory 0.03 U 79 0.25 U 0.25 U 1 J 25 2 KP-SO-24-XX Reference Laboratory 0.017 U 78 0.25 U 0.25 U 1 J 22 2 KP-SO-27-XX Reference Laboratory 0.021 U 87 0.25 U 0.25 U 1 J 24 2 KP-SO-29-XX Reference Laboratory 0.013 U 73 0.25 U 0.25 U 1 J 22 2 KP-SO-32-XX Reference Laboratory 0.014 U 88 0.51 0.25 U 1 J 24 2 KP-SO-01-BA Niton LLC XLi < LOD : 14.76 < LOD : 97.27 < LOD : 12.36 < LOD : 211.61 < LOD : 256.38 < LOD : 58.04 2 KP-SO-11-BA Niton LLC XLi < LOD : 14.48 < LOD : 92.68 < LOD : 12.80 < LOD : 202.21 < LOD : 267.36 < LOD : 56.61 2 KP-SO-17-BA Niton LLC XLi < LOD : 14.66 < LOD : 95.71 < LOD : 12.14 < LOD : 212.48 < LOD : 260.30 < LOD : 57.49 2 KP-SO-25-BA Niton LLC XLi < LOD : 15.32 < LOD : 99.15 < LOD : 12.46 < LOD : 208.56 < LOD : 262.61 < LOD : 59.49 2 KP-SO-28-BA Niton LLC XLi < LOD : 15.83 < LOD : 99.68 < LOD : 13.19 < LOD : 207.15 < LOD : 263.45 < LOD : 58.42 2 KP-SO-30-BA Niton LLC XLi < LOD : 15.48 111 < LOD : 12.04 < LOD : 213.96 < LOD : 260.78 < LOD : 55.61 2 KP-SO-32-BA Niton LLC XLi < LOD : 15.00 < LOD : 95.18 < LOD : 12.28 < LOD : 214.46 < LOD : 264.51 < LOD : 57.18 3 KP-SO-04-XX Reference Laboratory 0.018 U 93 0.28 U 0.16 J 1 J 45 3 KP-SO-16-XX Reference Laboratory 0.016 U 100 0.25 U 0.16 J 1 J 47 3 KP-SO-23-XX Reference Laboratory 0.017 U 91 0.25 U 0.13 J 1 J 41 3 KP-SO-26-XX Reference Laboratory 0.013 U 110 0.22 U 0.17 J 1 J 52 3 KP-SO-31-XX Reference Laboratory 0.017 U 68 0.25 U 0.4 2 J 38 3 KP-SO-08-BA Niton LLC XLi < LOD : 17.87 < LOD : 108.72 < LOD : 16.74 < LOD : 208.21 < LOD : 256.11 < LOD : 66.48 3 KP-SO-13-BA Niton LLC XLi < LOD : 18.46 < LOD : 105.69 < LOD : 16.74 < LOD : 218.88 < LOD : 264.67 < LOD : 68.99 3 KP-SO-19-BA Niton LLC XLi < LOD : 17.90 130 < LOD : 16.83 < LOD : 218.93 < LOD : 262.64 < LOD : 67.16 3 KP-SO-24-BA Niton LLC XLi < LOD : 17.73 < LOD : 112.76 < LOD : 17.51 < LOD : 212.98 < LOD : 261.57 93 3 KP-SO-29-BA Niton LLC XLi < LOD : 18.34 134 < LOD : 17.49 < LOD : 213.05 < LOD : 264.21 < LOD : 70.01
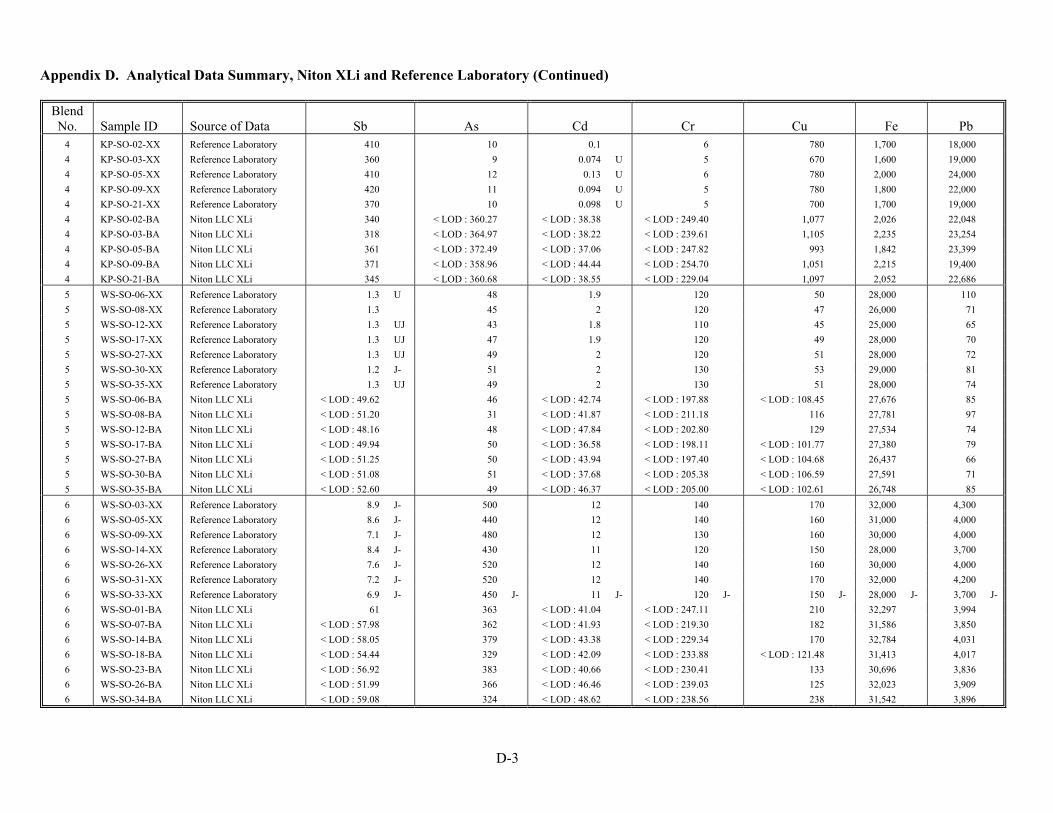
D-3
Appendix D. Analytical Data Summary, Niton XLi and Reference Laboratory (Continued)
Blend No. Sample ID Source of Data Sb As Cd Cr Cu Fe Pb
4 KP-SO-02-XX Reference Laboratory 410 10 0.1 6 780 1,700 18,000 4 KP-SO-03-XX Reference Laboratory 360 9 0.074 U 5 670 1,600 19,000 4 KP-SO-05-XX Reference Laboratory 410 12 0.13 U 6 780 2,000 24,000 4 KP-SO-09-XX Reference Laboratory 420 11 0.094 U 5 780 1,800 22,000 4 KP-SO-21-XX Reference Laboratory 370 10 0.098 U 5 700 1,700 19,000 4 KP-SO-02-BA Niton LLC XLi 340 < LOD : 360.27 < LOD : 38.38 < LOD : 249.40 1,077 2,026 22,048 4 KP-SO-03-BA Niton LLC XLi 318 < LOD : 364.97 < LOD : 38.22 < LOD : 239.61 1,105 2,235 23,254 4 KP-SO-05-BA Niton LLC XLi 361 < LOD : 372.49 < LOD : 37.06 < LOD : 247.82 993 1,842 23,399 4 KP-SO-09-BA Niton LLC XLi 371 < LOD : 358.96 < LOD : 44.44 < LOD : 254.70 1,051 2,215 19,400 4 KP-SO-21-BA Niton LLC XLi 345 < LOD : 360.68 < LOD : 38.55 < LOD : 229.04 1,097 2,052 22,686 5 WS-SO-06-XX Reference Laboratory 1.3 U 48 1.9 120 50 28,000 110 5 WS-SO-08-XX Reference Laboratory 1.3 45 2 120 47 26,000 71 5 WS-SO-12-XX Reference Laboratory 1.3 UJ 43 1.8 110 45 25,000 65 5 WS-SO-17-XX Reference Laboratory 1.3 UJ 47 1.9 120 49 28,000 70 5 WS-SO-27-XX Reference Laboratory 1.3 UJ 49 2 120 51 28,000 72 5 WS-SO-30-XX Reference Laboratory 1.2 J- 51 2 130 53 29,000 81 5 WS-SO-35-XX Reference Laboratory 1.3 UJ 49 2 130 51 28,000 74 5 WS-SO-06-BA Niton LLC XLi < LOD : 49.62 46 < LOD : 42.74 < LOD : 197.88 < LOD : 108.45 27,676 85 5 WS-SO-08-BA Niton LLC XLi < LOD : 51.20 31 < LOD : 41.87 < LOD : 211.18 116 27,781 97 5 WS-SO-12-BA Niton LLC XLi < LOD : 48.16 48 < LOD : 47.84 < LOD : 202.80 129 27,534 74 5 WS-SO-17-BA Niton LLC XLi < LOD : 49.94 50 < LOD : 36.58 < LOD : 198.11 < LOD : 101.77 27,380 79 5 WS-SO-27-BA Niton LLC XLi < LOD : 51.25 50 < LOD : 43.94 < LOD : 197.40 < LOD : 104.68 26,437 66 5 WS-SO-30-BA Niton LLC XLi < LOD : 51.08 51 < LOD : 37.68 < LOD : 205.38 < LOD : 106.59 27,591 71 5 WS-SO-35-BA Niton LLC XLi < LOD : 52.60 49 < LOD : 46.37 < LOD : 205.00 < LOD : 102.61 26,748 85 6 WS-SO-03-XX Reference Laboratory 8.9 J- 500 12 140 170 32,000 4,300 6 WS-SO-05-XX Reference Laboratory 8.6 J- 440 12 140 160 31,000 4,000 6 WS-SO-09-XX Reference Laboratory 7.1 J- 480 12 130 160 30,000 4,000 6 WS-SO-14-XX Reference Laboratory 8.4 J- 430 11 120 150 28,000 3,700 6 WS-SO-26-XX Reference Laboratory 7.6 J- 520 12 140 160 30,000 4,000 6 WS-SO-31-XX Reference Laboratory 7.2 J- 520 12 140 170 32,000 4,200 6 WS-SO-33-XX Reference Laboratory 6.9 J- 450 J- 11 J- 120 J- 150 J- 28,000 J- 3,700 J- 6 WS-SO-01-BA Niton LLC XLi 61 363 < LOD : 41.04 < LOD : 247.11 210 32,297 3,994 6 WS-SO-07-BA Niton LLC XLi < LOD : 57.98 362 < LOD : 41.93 < LOD : 219.30 182 31,586 3,850 6 WS-SO-14-BA Niton LLC XLi < LOD : 58.05 379 < LOD : 43.38 < LOD : 229.34 170 32,784 4,031 6 WS-SO-18-BA Niton LLC XLi < LOD : 54.44 329 < LOD : 42.09 < LOD : 233.88 < LOD : 121.48 31,413 4,017 6 WS-SO-23-BA Niton LLC XLi < LOD : 56.92 383 < LOD : 40.66 < LOD : 230.41 133 30,696 3,836 6 WS-SO-26-BA Niton LLC XLi < LOD : 51.99 366 < LOD : 46.46 < LOD : 239.03 125 32,023 3,909 6 WS-SO-34-BA Niton LLC XLi < LOD : 59.08 324 < LOD : 48.62 < LOD : 238.56 238 31,542 3,896

D-4
Appendix D. Analytical Data Summary, Niton XLi and Reference Laboratory (Continued) Blend No. Sample ID Source of Data Hg Ni Se Ag V Zn
4 KP-SO-02-XX Reference Laboratory 0.043 U 4 0.42 U 0.82 0 J 100 4 KP-SO-03-XX Reference Laboratory 0.044 U 3 0.25 U 0.73 0 J 92 4 KP-SO-05-XX Reference Laboratory 0.044 U 4 0.24 U 0.82 0 J 110 4 KP-SO-09-XX Reference Laboratory 0.046 U 3 0.25 U 0.84 0 J 110 4 KP-SO-21-XX Reference Laboratory 0.042 U 4 0.25 U 0.76 0 J 100 4 KP-SO-02-BA Niton LLC XLi < LOD : 30.91 < LOD : 158.95 < LOD : 33.02 < LOD : 242.56 < LOD : 268.95 122 4 KP-SO-03-BA Niton LLC XLi < LOD : 29.42 < LOD : 165.44 < LOD : 33.47 < LOD : 233.57 < LOD : 261.34 161 4 KP-SO-05-BA Niton LLC XLi < LOD : 31.84 < LOD : 165.47 < LOD : 34.47 < LOD : 235.54 < LOD : 260.01 < LOD : 108.26 4 KP-SO-09-BA Niton LLC XLi < LOD : 30.76 < LOD : 154.88 < LOD : 33.01 < LOD : 244.53 < LOD : 257.08 245 4 KP-SO-21-BA Niton LLC XLi 42 < LOD : 164.90 < LOD : 33.19 < LOD : 236.66 < LOD : 252.29 178 5 WS-SO-06-XX Reference Laboratory 0.07 U 61 1.3 U 0.93 J 56 230 5 WS-SO-08-XX Reference Laboratory 0.063 U 58 1.3 U 0.86 J 52 220 5 WS-SO-12-XX Reference Laboratory 0.068 UJ 55 1.3 U 0.94 J 49 210 5 WS-SO-17-XX Reference Laboratory 0.069 UJ 59 1.3 U 0.89 J 56 230 5 WS-SO-27-XX Reference Laboratory 0.11 J- 61 1.3 U 0.9 J 57 230 5 WS-SO-30-XX Reference Laboratory 0.069 UJ 65 1.3 U 1 J 58 240 5 WS-SO-35-XX Reference Laboratory 0.071 UJ 62 1.3 U 1 J 57 240 5 WS-SO-06-BA Niton LLC XLi < LOD : 17.07 < LOD : 120.37 < LOD : 13.94 < LOD : 245.56 < LOD : 304.49 229 5 WS-SO-08-BA Niton LLC XLi < LOD : 17.63 < LOD : 112.46 < LOD : 14.56 < LOD : 246.85 < LOD : 301.20 201 5 WS-SO-12-BA Niton LLC XLi < LOD : 16.59 < LOD : 115.43 < LOD : 14.40 < LOD : 245.78 < LOD : 303.02 193 5 WS-SO-17-BA Niton LLC XLi < LOD : 17.29 < LOD : 113.59 < LOD : 14.22 < LOD : 242.50 < LOD : 287.51 238 5 WS-SO-27-BA Niton LLC XLi < LOD : 17.45 < LOD : 114.32 < LOD : 14.85 < LOD : 243.58 < LOD : 300.70 172 5 WS-SO-30-BA Niton LLC XLi < LOD : 17.49 < LOD : 121.88 < LOD : 13.69 < LOD : 253.16 < LOD : 295.94 200 5 WS-SO-35-BA Niton LLC XLi < LOD : 17.28 < LOD : 109.06 < LOD : 13.91 < LOD : 249.26 < LOD : 303.33 239 6 WS-SO-03-XX Reference Laboratory 0.86 J- 75 1.6 15 58 930 6 WS-SO-05-XX Reference Laboratory 0.76 J- 71 1.3 U 15 57 900 6 WS-SO-09-XX Reference Laboratory 0.89 J- 70 1.3 U 14 56 870 6 WS-SO-14-XX Reference Laboratory 0.74 J- 64 1.3 U 13 50 820 6 WS-SO-26-XX Reference Laboratory 0.83 J- 70 1.3 U 14 56 900 6 WS-SO-31-XX Reference Laboratory 0.85 J- 72 1.2 U 15 60 950 6 WS-SO-33-XX Reference Laboratory 0.87 J- 65 J- 1.3 U 13 J- 53 J- 830 J- 6 WS-SO-01-BA Niton LLC XLi < LOD : 22.19 < LOD : 134.32 < LOD : 18.98 < LOD : 258.71 < LOD : 296.99 822 6 WS-SO-07-BA Niton LLC XLi < LOD : 20.28 153 < LOD : 18.34 < LOD : 253.84 < LOD : 296.42 760 6 WS-SO-14-BA Niton LLC XLi < LOD : 21.71 < LOD : 129.58 < LOD : 18.80 < LOD : 247.51 < LOD : 297.38 844 6 WS-SO-18-BA Niton LLC XLi 26 < LOD : 134.46 < LOD : 18.93 < LOD : 242.30 < LOD : 295.18 677 6 WS-SO-23-BA Niton LLC XLi < LOD : 20.70 < LOD : 128.92 < LOD : 19.52 < LOD : 253.38 < LOD : 293.20 776 6 WS-SO-26-BA Niton LLC XLi < LOD : 20.42 < LOD : 133.11 20 < LOD : 251.61 < LOD : 300.16 747 6 WS-SO-34-BA Niton LLC XLi < LOD : 21.41 < LOD : 133.31 < LOD : 18.59 < LOD : 255.97 < LOD : 292.46 836
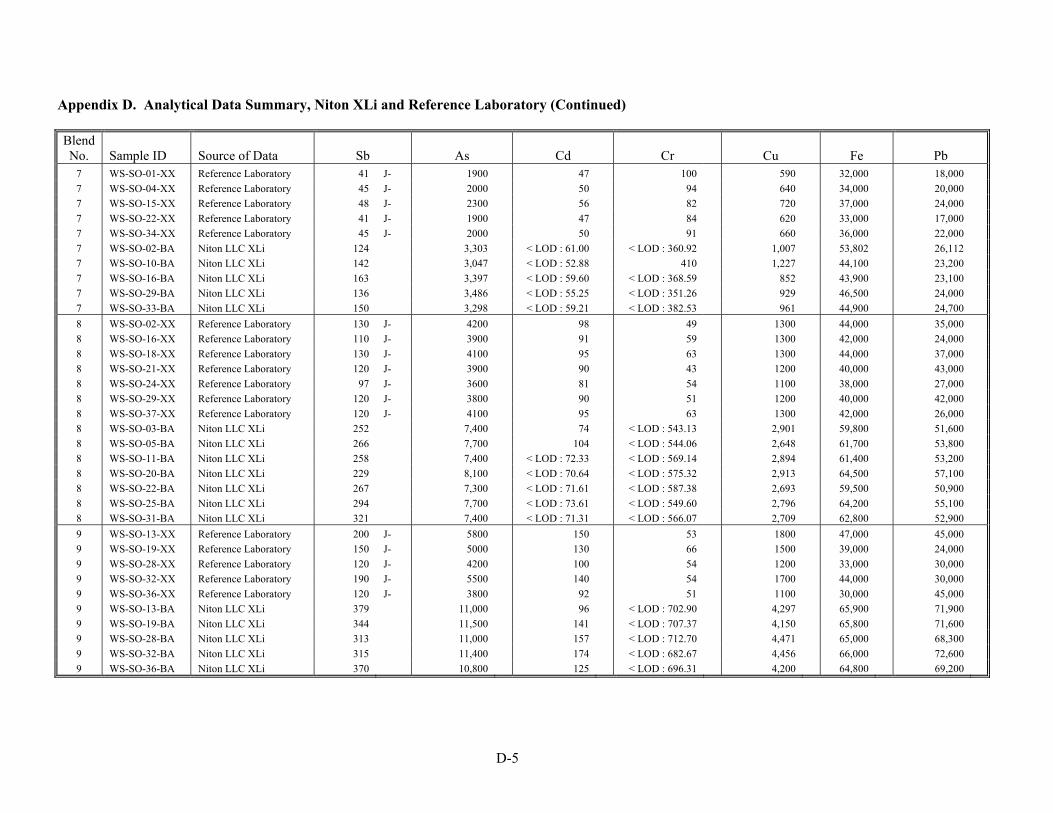
D-5
Appendix D. Analytical Data Summary, Niton XLi and Reference Laboratory (Continued) Blend No. Sample ID Source of Data Sb As Cd Cr Cu Fe Pb
7 WS-SO-01-XX Reference Laboratory 41 J- 1900 47 100 590 32,000 18,000 7 WS-SO-04-XX Reference Laboratory 45 J- 2000 50 94 640 34,000 20,000 7 WS-SO-15-XX Reference Laboratory 48 J- 2300 56 82 720 37,000 24,000 7 WS-SO-22-XX Reference Laboratory 41 J- 1900 47 84 620 33,000 17,000 7 WS-SO-34-XX Reference Laboratory 45 J- 2000 50 91 660 36,000 22,000 7 WS-SO-02-BA Niton LLC XLi 124 3,303 < LOD : 61.00 < LOD : 360.92 1,007 53,802 26,112 7 WS-SO-10-BA Niton LLC XLi 142 3,047 < LOD : 52.88 410 1,227 44,100 23,200 7 WS-SO-16-BA Niton LLC XLi 163 3,397 < LOD : 59.60 < LOD : 368.59 852 43,900 23,100 7 WS-SO-29-BA Niton LLC XLi 136 3,486 < LOD : 55.25 < LOD : 351.26 929 46,500 24,000 7 WS-SO-33-BA Niton LLC XLi 150 3,298 < LOD : 59.21 < LOD : 382.53 961 44,900 24,700 8 WS-SO-02-XX Reference Laboratory 130 J- 4200 98 49 1300 44,000 35,000 8 WS-SO-16-XX Reference Laboratory 110 J- 3900 91 59 1300 42,000 24,000 8 WS-SO-18-XX Reference Laboratory 130 J- 4100 95 63 1300 44,000 37,000 8 WS-SO-21-XX Reference Laboratory 120 J- 3900 90 43 1200 40,000 43,000 8 WS-SO-24-XX Reference Laboratory 97 J- 3600 81 54 1100 38,000 27,000 8 WS-SO-29-XX Reference Laboratory 120 J- 3800 90 51 1200 40,000 42,000 8 WS-SO-37-XX Reference Laboratory 120 J- 4100 95 63 1300 42,000 26,000 8 WS-SO-03-BA Niton LLC XLi 252 7,400 74 < LOD : 543.13 2,901 59,800 51,600 8 WS-SO-05-BA Niton LLC XLi 266 7,700 104 < LOD : 544.06 2,648 61,700 53,800 8 WS-SO-11-BA Niton LLC XLi 258 7,400 < LOD : 72.33 < LOD : 569.14 2,894 61,400 53,200 8 WS-SO-20-BA Niton LLC XLi 229 8,100 < LOD : 70.64 < LOD : 575.32 2,913 64,500 57,100 8 WS-SO-22-BA Niton LLC XLi 267 7,300 < LOD : 71.61 < LOD : 587.38 2,693 59,500 50,900 8 WS-SO-25-BA Niton LLC XLi 294 7,700 < LOD : 73.61 < LOD : 549.60 2,796 64,200 55,100 8 WS-SO-31-BA Niton LLC XLi 321 7,400 < LOD : 71.31 < LOD : 566.07 2,709 62,800 52,900 9 WS-SO-13-XX Reference Laboratory 200 J- 5800 150 53 1800 47,000 45,000 9 WS-SO-19-XX Reference Laboratory 150 J- 5000 130 66 1500 39,000 24,000 9 WS-SO-28-XX Reference Laboratory 120 J- 4200 100 54 1200 33,000 30,000 9 WS-SO-32-XX Reference Laboratory 190 J- 5500 140 54 1700 44,000 30,000 9 WS-SO-36-XX Reference Laboratory 120 J- 3800 92 51 1100 30,000 45,000 9 WS-SO-13-BA Niton LLC XLi 379 11,000 96 < LOD : 702.90 4,297 65,900 71,900 9 WS-SO-19-BA Niton LLC XLi 344 11,500 141 < LOD : 707.37 4,150 65,800 71,600 9 WS-SO-28-BA Niton LLC XLi 313 11,000 157 < LOD : 712.70 4,471 65,000 68,300 9 WS-SO-32-BA Niton LLC XLi 315 11,400 174 < LOD : 682.67 4,456 66,000 72,600 9 WS-SO-36-BA Niton LLC XLi 370 10,800 125 < LOD : 696.31 4,200 64,800 69,200
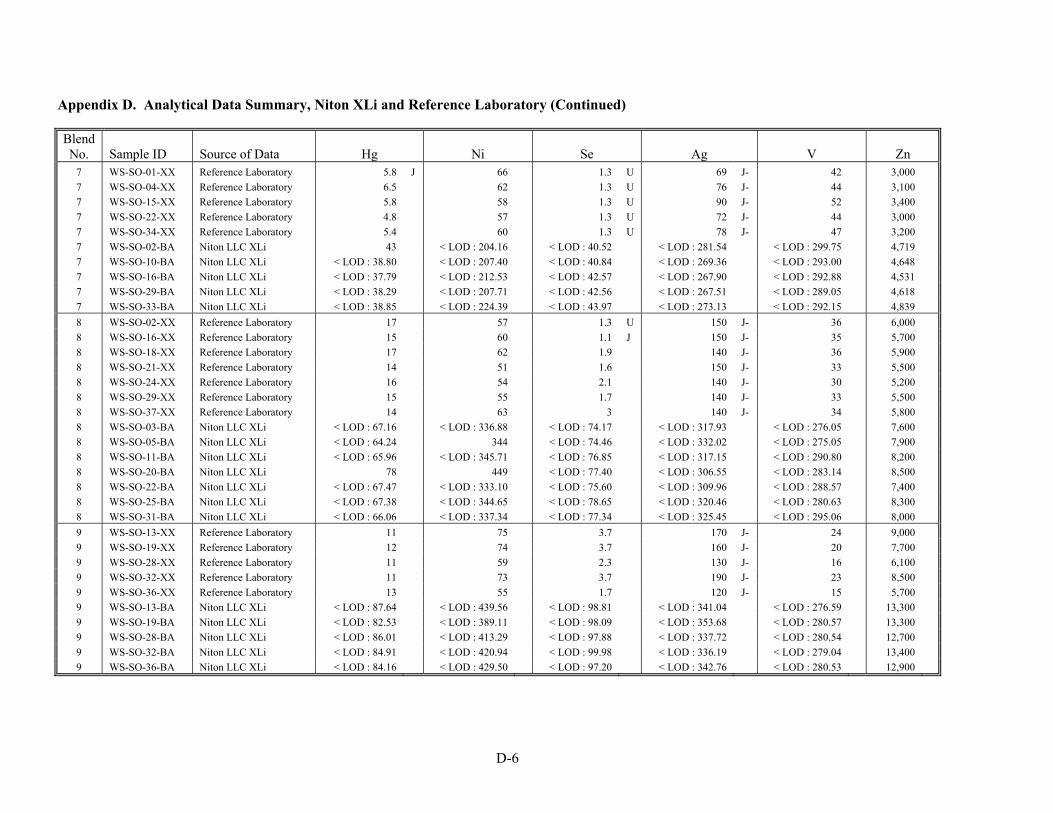
D-6
Appendix D. Analytical Data Summary, Niton XLi and Reference Laboratory (Continued) Blend No. Sample ID Source of Data Hg Ni Se Ag V Zn
7 WS-SO-01-XX Reference Laboratory 5.8 J 66 1.3 U 69 J- 42 3,000 7 WS-SO-04-XX Reference Laboratory 6.5 62 1.3 U 76 J- 44 3,100 7 WS-SO-15-XX Reference Laboratory 5.8 58 1.3 U 90 J- 52 3,400 7 WS-SO-22-XX Reference Laboratory 4.8 57 1.3 U 72 J- 44 3,000 7 WS-SO-34-XX Reference Laboratory 5.4 60 1.3 U 78 J- 47 3,200 7 WS-SO-02-BA Niton LLC XLi 43 < LOD : 204.16 < LOD : 40.52 < LOD : 281.54 < LOD : 299.75 4,719 7 WS-SO-10-BA Niton LLC XLi < LOD : 38.80 < LOD : 207.40 < LOD : 40.84 < LOD : 269.36 < LOD : 293.00 4,648 7 WS-SO-16-BA Niton LLC XLi < LOD : 37.79 < LOD : 212.53 < LOD : 42.57 < LOD : 267.90 < LOD : 292.88 4,531 7 WS-SO-29-BA Niton LLC XLi < LOD : 38.29 < LOD : 207.71 < LOD : 42.56 < LOD : 267.51 < LOD : 289.05 4,618 7 WS-SO-33-BA Niton LLC XLi < LOD : 38.85 < LOD : 224.39 < LOD : 43.97 < LOD : 273.13 < LOD : 292.15 4,839 8 WS-SO-02-XX Reference Laboratory 17 57 1.3 U 150 J- 36 6,000 8 WS-SO-16-XX Reference Laboratory 15 60 1.1 J 150 J- 35 5,700 8 WS-SO-18-XX Reference Laboratory 17 62 1.9 140 J- 36 5,900 8 WS-SO-21-XX Reference Laboratory 14 51 1.6 150 J- 33 5,500 8 WS-SO-24-XX Reference Laboratory 16 54 2.1 140 J- 30 5,200 8 WS-SO-29-XX Reference Laboratory 15 55 1.7 140 J- 33 5,500 8 WS-SO-37-XX Reference Laboratory 14 63 3 140 J- 34 5,800 8 WS-SO-03-BA Niton LLC XLi < LOD : 67.16 < LOD : 336.88 < LOD : 74.17 < LOD : 317.93 < LOD : 276.05 7,600 8 WS-SO-05-BA Niton LLC XLi < LOD : 64.24 344 < LOD : 74.46 < LOD : 332.02 < LOD : 275.05 7,900 8 WS-SO-11-BA Niton LLC XLi < LOD : 65.96 < LOD : 345.71 < LOD : 76.85 < LOD : 317.15 < LOD : 290.80 8,200 8 WS-SO-20-BA Niton LLC XLi 78 449 < LOD : 77.40 < LOD : 306.55 < LOD : 283.14 8,500 8 WS-SO-22-BA Niton LLC XLi < LOD : 67.47 < LOD : 333.10 < LOD : 75.60 < LOD : 309.96 < LOD : 288.57 7,400 8 WS-SO-25-BA Niton LLC XLi < LOD : 67.38 < LOD : 344.65 < LOD : 78.65 < LOD : 320.46 < LOD : 280.63 8,300 8 WS-SO-31-BA Niton LLC XLi < LOD : 66.06 < LOD : 337.34 < LOD : 77.34 < LOD : 325.45 < LOD : 295.06 8,000 9 WS-SO-13-XX Reference Laboratory 11 75 3.7 170 J- 24 9,000 9 WS-SO-19-XX Reference Laboratory 12 74 3.7 160 J- 20 7,700 9 WS-SO-28-XX Reference Laboratory 11 59 2.3 130 J- 16 6,100 9 WS-SO-32-XX Reference Laboratory 11 73 3.7 190 J- 23 8,500 9 WS-SO-36-XX Reference Laboratory 13 55 1.7 120 J- 15 5,700 9 WS-SO-13-BA Niton LLC XLi < LOD : 87.64 < LOD : 439.56 < LOD : 98.81 < LOD : 341.04 < LOD : 276.59 13,300 9 WS-SO-19-BA Niton LLC XLi < LOD : 82.53 < LOD : 389.11 < LOD : 98.09 < LOD : 353.68 < LOD : 280.57 13,300 9 WS-SO-28-BA Niton LLC XLi < LOD : 86.01 < LOD : 413.29 < LOD : 97.88 < LOD : 337.72 < LOD : 280.54 12,700 9 WS-SO-32-BA Niton LLC XLi < LOD : 84.91 < LOD : 420.94 < LOD : 99.98 < LOD : 336.19 < LOD : 279.04 13,400 9 WS-SO-36-BA Niton LLC XLi < LOD : 84.16 < LOD : 429.50 < LOD : 97.20 < LOD : 342.76 < LOD : 280.53 12,900
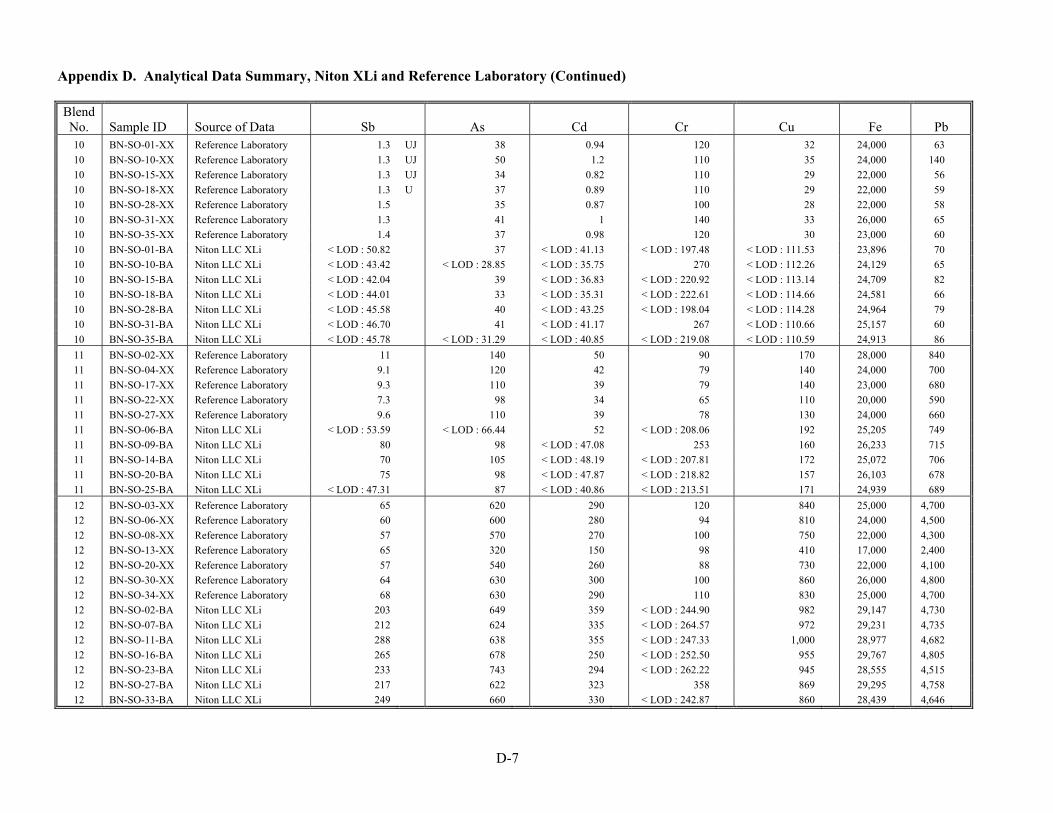
D-7
Appendix D. Analytical Data Summary, Niton XLi and Reference Laboratory (Continued) Blend No. Sample ID Source of Data Sb As Cd Cr Cu Fe Pb 10 BN-SO-01-XX Reference Laboratory 1.3 UJ 38 0.94 120 32 24,000 63 10 BN-SO-10-XX Reference Laboratory 1.3 UJ 50 1.2 110 35 24,000 140 10 BN-SO-15-XX Reference Laboratory 1.3 UJ 34 0.82 110 29 22,000 56 10 BN-SO-18-XX Reference Laboratory 1.3 U 37 0.89 110 29 22,000 59 10 BN-SO-28-XX Reference Laboratory 1.5 35 0.87 100 28 22,000 58 10 BN-SO-31-XX Reference Laboratory 1.3 41 1 140 33 26,000 65 10 BN-SO-35-XX Reference Laboratory 1.4 37 0.98 120 30 23,000 60 10 BN-SO-01-BA Niton LLC XLi < LOD : 50.82 37 < LOD : 41.13 < LOD : 197.48 < LOD : 111.53 23,896 70 10 BN-SO-10-BA Niton LLC XLi < LOD : 43.42 < LOD : 28.85 < LOD : 35.75 270 < LOD : 112.26 24,129 65 10 BN-SO-15-BA Niton LLC XLi < LOD : 42.04 39 < LOD : 36.83 < LOD : 220.92 < LOD : 113.14 24,709 82 10 BN-SO-18-BA Niton LLC XLi < LOD : 44.01 33 < LOD : 35.31 < LOD : 222.61 < LOD : 114.66 24,581 66 10 BN-SO-28-BA Niton LLC XLi < LOD : 45.58 40 < LOD : 43.25 < LOD : 198.04 < LOD : 114.28 24,964 79 10 BN-SO-31-BA Niton LLC XLi < LOD : 46.70 41 < LOD : 41.17 267 < LOD : 110.66 25,157 60 10 BN-SO-35-BA Niton LLC XLi < LOD : 45.78 < LOD : 31.29 < LOD : 40.85 < LOD : 219.08 < LOD : 110.59 24,913 86 11 BN-SO-02-XX Reference Laboratory 11 140 50 90 170 28,000 840 11 BN-SO-04-XX Reference Laboratory 9.1 120 42 79 140 24,000 700 11 BN-SO-17-XX Reference Laboratory 9.3 110 39 79 140 23,000 680 11 BN-SO-22-XX Reference Laboratory 7.3 98 34 65 110 20,000 590 11 BN-SO-27-XX Reference Laboratory 9.6 110 39 78 130 24,000 660 11 BN-SO-06-BA Niton LLC XLi < LOD : 53.59 < LOD : 66.44 52 < LOD : 208.06 192 25,205 749 11 BN-SO-09-BA Niton LLC XLi 80 98 < LOD : 47.08 253 160 26,233 715 11 BN-SO-14-BA Niton LLC XLi 70 105 < LOD : 48.19 < LOD : 207.81 172 25,072 706 11 BN-SO-20-BA Niton LLC XLi 75 98 < LOD : 47.87 < LOD : 218.82 157 26,103 678 11 BN-SO-25-BA Niton LLC XLi < LOD : 47.31 87 < LOD : 40.86 < LOD : 213.51 171 24,939 689 12 BN-SO-03-XX Reference Laboratory 65 620 290 120 840 25,000 4,700 12 BN-SO-06-XX Reference Laboratory 60 600 280 94 810 24,000 4,500 12 BN-SO-08-XX Reference Laboratory 57 570 270 100 750 22,000 4,300 12 BN-SO-13-XX Reference Laboratory 65 320 150 98 410 17,000 2,400 12 BN-SO-20-XX Reference Laboratory 57 540 260 88 730 22,000 4,100 12 BN-SO-30-XX Reference Laboratory 64 630 300 100 860 26,000 4,800 12 BN-SO-34-XX Reference Laboratory 68 630 290 110 830 25,000 4,700 12 BN-SO-02-BA Niton LLC XLi 203 649 359 < LOD : 244.90 982 29,147 4,730 12 BN-SO-07-BA Niton LLC XLi 212 624 335 < LOD : 264.57 972 29,231 4,735 12 BN-SO-11-BA Niton LLC XLi 288 638 355 < LOD : 247.33 1,000 28,977 4,682 12 BN-SO-16-BA Niton LLC XLi 265 678 250 < LOD : 252.50 955 29,767 4,805 12 BN-SO-23-BA Niton LLC XLi 233 743 294 < LOD : 262.22 945 28,555 4,515 12 BN-SO-27-BA Niton LLC XLi 217 622 323 358 869 29,295 4,758 12 BN-SO-33-BA Niton LLC XLi 249 660 330 < LOD : 242.87 860 28,439 4,646

D-8
Appendix D. Analytical Data Summary, Niton XLi and Reference Laboratory (Continued) Blend No. Sample ID Source of Data Hg Ni Se Ag V Zn 10 BN-SO-01-XX Reference Laboratory 0.13 63 1.3 U 1.3 UJ 55 92 10 BN-SO-10-XX Reference Laboratory 0.14 54 1.2 J 1.3 UJ 55 110 10 BN-SO-15-XX Reference Laboratory 0.15 58 1.3 U 1.3 UJ 49 89 10 BN-SO-18-XX Reference Laboratory 0.13 59 1.3 0.94 U 46 88 10 BN-SO-28-XX Reference Laboratory 0.16 54 1.3 U 0.77 U 48 81 10 BN-SO-31-XX Reference Laboratory 0.14 71 1.3 U 0.97 U 54 94 10 BN-SO-35-XX Reference Laboratory 0.15 63 1.2 J 0.85 U 50 87 10 BN-SO-01-BA Niton LLC XLi < LOD : 19.03 < LOD : 126.10 < LOD : 14.84 < LOD : 238.95 < LOD : 298.73 90 10 BN-SO-10-BA Niton LLC XLi < LOD : 18.68 < LOD : 123.93 < LOD : 14.68 < LOD : 228.34 < LOD : 292.72 < LOD : 78.75 10 BN-SO-15-BA Niton LLC XLi < LOD : 19.36 < LOD : 126.71 < LOD : 14.80 < LOD : 225.32 < LOD : 306.01 177 10 BN-SO-18-BA Niton LLC XLi < LOD : 18.78 < LOD : 123.25 < LOD : 15.07 < LOD : 229.44 < LOD : 299.89 122 10 BN-SO-28-BA Niton LLC XLi < LOD : 18.73 < LOD : 123.90 < LOD : 16.02 < LOD : 231.58 < LOD : 292.47 < LOD : 75.59 10 BN-SO-31-BA Niton LLC XLi < LOD : 18.33 < LOD : 119.68 < LOD : 14.79 < LOD : 223.26 < LOD : 301.99 97 10 BN-SO-35-BA Niton LLC XLi < LOD : 18.21 < LOD : 122.89 < LOD : 15.94 < LOD : 225.86 < LOD : 296.02 100 11 BN-SO-02-XX Reference Laboratory 0.37 54 4.3 7.6 60 470 11 BN-SO-04-XX Reference Laboratory 0.36 48 2.9 6.5 50 400 11 BN-SO-17-XX Reference Laboratory 0.39 47 2.7 6.3 49 390 11 BN-SO-22-XX Reference Laboratory 0.37 40 2.8 5.4 43 330 11 BN-SO-27-XX Reference Laboratory 0.38 46 3.7 6.1 52 380 11 BN-SO-06-BA Niton LLC XLi < LOD : 19.16 < LOD : 128.99 < LOD : 16.67 < LOD : 234.37 < LOD : 291.29 416 11 BN-SO-09-BA Niton LLC XLi < LOD : 20.28 < LOD : 127.26 < LOD : 16.37 < LOD : 231.63 < LOD : 289.47 386 11 BN-SO-14-BA Niton LLC XLi < LOD : 18.05 < LOD : 127.98 < LOD : 15.83 < LOD : 230.68 < LOD : 295.97 350 11 BN-SO-20-BA Niton LLC XLi < LOD : 18.45 < LOD : 121.14 < LOD : 15.81 < LOD : 229.97 < LOD : 290.45 376 11 BN-SO-25-BA Niton LLC XLi < LOD : 20.14 < LOD : 125.74 < LOD : 15.74 < LOD : 226.80 < LOD : 291.40 389 12 BN-SO-03-XX Reference Laboratory 1.6 100 17 42 48 2,300 12 BN-SO-06-XX Reference Laboratory 2 92 15 41 48 2,300 12 BN-SO-08-XX Reference Laboratory 2 94 14 38 39 2,200 12 BN-SO-13-XX Reference Laboratory 1.6 71 9.2 21 37 1,200 12 BN-SO-20-XX Reference Laboratory 1.6 84 14 37 44 2,100 12 BN-SO-30-XX Reference Laboratory 1.6 99 17 44 50 2,400 12 BN-SO-34-XX Reference Laboratory 2 100 17 42 49 2,300 12 BN-SO-02-BA Niton LLC XLi < LOD : 23.68 < LOD : 150.58 31 < LOD : 234.18 < LOD : 295.92 2,622 12 BN-SO-07-BA Niton LLC XLi < LOD : 24.25 < LOD : 151.91 < LOD : 22.48 < LOD : 228.57 < LOD : 301.21 2,673 12 BN-SO-11-BA Niton LLC XLi < LOD : 23.95 < LOD : 145.62 25 < LOD : 241.66 < LOD : 309.02 2,545 12 BN-SO-16-BA Niton LLC XLi < LOD : 23.79 < LOD : 148.05 < LOD : 22.84 < LOD : 233.83 < LOD : 301.81 2,738 12 BN-SO-23-BA Niton LLC XLi 28 < LOD : 149.02 < LOD : 22.65 < LOD : 239.40 < LOD : 292.97 2,565 12 BN-SO-27-BA Niton LLC XLi < LOD : 24.34 < LOD : 151.88 29 < LOD : 244.99 < LOD : 303.33 2,722 12 BN-SO-33-BA Niton LLC XLi < LOD : 24.03 192 < LOD : 22.67 < LOD : 231.99 < LOD : 297.51 2,619
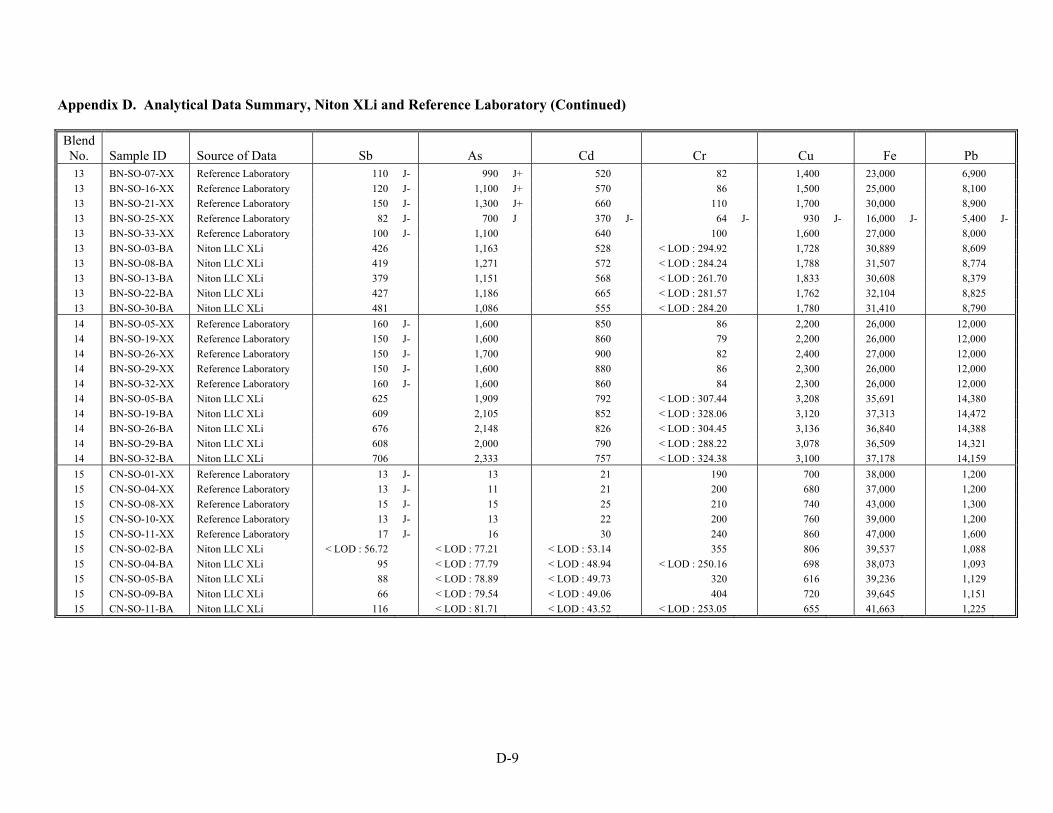
D-9
Appendix D. Analytical Data Summary, Niton XLi and Reference Laboratory (Continued) Blend No. Sample ID Source of Data Sb As Cd Cr Cu Fe Pb 13 BN-SO-07-XX Reference Laboratory 110 J- 990 J+ 520 82 1,400 23,000 6,900 13 BN-SO-16-XX Reference Laboratory 120 J- 1,100 J+ 570 86 1,500 25,000 8,100 13 BN-SO-21-XX Reference Laboratory 150 J- 1,300 J+ 660 110 1,700 30,000 8,900 13 BN-SO-25-XX Reference Laboratory 82 J- 700 J 370 J- 64 J- 930 J- 16,000 J- 5,400 J- 13 BN-SO-33-XX Reference Laboratory 100 J- 1,100 640 100 1,600 27,000 8,000 13 BN-SO-03-BA Niton LLC XLi 426 1,163 528 < LOD : 294.92 1,728 30,889 8,609 13 BN-SO-08-BA Niton LLC XLi 419 1,271 572 < LOD : 284.24 1,788 31,507 8,774 13 BN-SO-13-BA Niton LLC XLi 379 1,151 568 < LOD : 261.70 1,833 30,608 8,379 13 BN-SO-22-BA Niton LLC XLi 427 1,186 665 < LOD : 281.57 1,762 32,104 8,825 13 BN-SO-30-BA Niton LLC XLi 481 1,086 555 < LOD : 284.20 1,780 31,410 8,790 14 BN-SO-05-XX Reference Laboratory 160 J- 1,600 850 86 2,200 26,000 12,000 14 BN-SO-19-XX Reference Laboratory 150 J- 1,600 860 79 2,200 26,000 12,000 14 BN-SO-26-XX Reference Laboratory 150 J- 1,700 900 82 2,400 27,000 12,000 14 BN-SO-29-XX Reference Laboratory 150 J- 1,600 880 86 2,300 26,000 12,000 14 BN-SO-32-XX Reference Laboratory 160 J- 1,600 860 84 2,300 26,000 12,000 14 BN-SO-05-BA Niton LLC XLi 625 1,909 792 < LOD : 307.44 3,208 35,691 14,380 14 BN-SO-19-BA Niton LLC XLi 609 2,105 852 < LOD : 328.06 3,120 37,313 14,472 14 BN-SO-26-BA Niton LLC XLi 676 2,148 826 < LOD : 304.45 3,136 36,840 14,388 14 BN-SO-29-BA Niton LLC XLi 608 2,000 790 < LOD : 288.22 3,078 36,509 14,321 14 BN-SO-32-BA Niton LLC XLi 706 2,333 757 < LOD : 324.38 3,100 37,178 14,159 15 CN-SO-01-XX Reference Laboratory 13 J- 13 21 190 700 38,000 1,200 15 CN-SO-04-XX Reference Laboratory 13 J- 11 21 200 680 37,000 1,200 15 CN-SO-08-XX Reference Laboratory 15 J- 15 25 210 740 43,000 1,300 15 CN-SO-10-XX Reference Laboratory 13 J- 13 22 200 760 39,000 1,200 15 CN-SO-11-XX Reference Laboratory 17 J- 16 30 240 860 47,000 1,600 15 CN-SO-02-BA Niton LLC XLi < LOD : 56.72 < LOD : 77.21 < LOD : 53.14 355 806 39,537 1,088 15 CN-SO-04-BA Niton LLC XLi 95 < LOD : 77.79 < LOD : 48.94 < LOD : 250.16 698 38,073 1,093 15 CN-SO-05-BA Niton LLC XLi 88 < LOD : 78.89 < LOD : 49.73 320 616 39,236 1,129 15 CN-SO-09-BA Niton LLC XLi 66 < LOD : 79.54 < LOD : 49.06 404 720 39,645 1,151 15 CN-SO-11-BA Niton LLC XLi 116 < LOD : 81.71 < LOD : 43.52 < LOD : 253.05 655 41,663 1,225

D-10
Appendix D. Analytical Data Summary, Niton XLi and Reference Laboratory (Continued) Blend No. Sample ID Source of Data Hg Ni Se Ag V Zn 13 BN-SO-07-XX Reference Laboratory 3.4 120 26 70 41 4,000 13 BN-SO-16-XX Reference Laboratory 3.4 130 29 77 44 4,400 13 BN-SO-21-XX Reference Laboratory 3.6 160 35 88 52 5,100 13 BN-SO-25-XX Reference Laboratory 3.8 88 J- 19 J- 48 J- 28 J- 2,900 J- 13 BN-SO-33-XX Reference Laboratory 4 150 34 81 48 5,100 13 BN-SO-03-BA Niton LLC XLi < LOD : 28.18 < LOD : 162.97 39 < LOD : 244.91 < LOD : 284.51 5,185 13 BN-SO-08-BA Niton LLC XLi < LOD : 28.63 < LOD : 169.50 32 < LOD : 248.56 < LOD : 292.87 5,351 13 BN-SO-13-BA Niton LLC XLi < LOD : 26.34 < LOD : 171.25 42 < LOD : 249.14 < LOD : 290.40 5,318 13 BN-SO-22-BA Niton LLC XLi < LOD : 27.80 217 31 < LOD : 247.15 < LOD : 290.87 5,550 13 BN-SO-30-BA Niton LLC XLi < LOD : 28.91 < LOD : 173.33 33 < LOD : 261.34 < LOD : 284.63 5,341 14 BN-SO-05-XX Reference Laboratory 5 160 48 110 39 6,700 14 BN-SO-19-XX Reference Laboratory 5 160 48 120 39 6,700 14 BN-SO-26-XX Reference Laboratory 5.4 160 49 120 40 7,000 14 BN-SO-29-XX Reference Laboratory 5.4 160 48 120 41 6,800 14 BN-SO-32-XX Reference Laboratory 5.4 160 48 120 39 6,700 14 BN-SO-05-BA Niton LLC XLi < LOD : 32.09 279 39 < LOD : 265.55 < LOD : 292.31 8,284 14 BN-SO-19-BA Niton LLC XLi < LOD : 33.75 217 47 < LOD : 263.99 < LOD : 291.28 8,904 14 BN-SO-26-BA Niton LLC XLi < LOD : 33.50 < LOD : 202.86 60 < LOD : 266.70 < LOD : 288.13 8,693 14 BN-SO-29-BA Niton LLC XLi < LOD : 31.58 < LOD : 192.34 < LOD : 34.05 < LOD : 261.01 < LOD : 283.81 8,508 14 BN-SO-32-BA Niton LLC XLi 36 < LOD : 198.86 70 < LOD : 257.86 < LOD : 288.91 8,576 15 CN-SO-01-XX Reference Laboratory 0.13 240 2.2 12 21 3,100 15 CN-SO-04-XX Reference Laboratory 0.14 240 1.5 12 22 2,900 15 CN-SO-08-XX Reference Laboratory 0.16 280 1.3 U 15 26 3,200 15 CN-SO-10-XX Reference Laboratory 0.12 240 1.9 14 22 3,000 15 CN-SO-11-XX Reference Laboratory 0.15 320 1.3 U 16 27 3,500 15 CN-SO-02-BA Niton LLC XLi < LOD : 20.64 263 < LOD : 15.81 < LOD : 245.64 < LOD : 321.83 3,405 15 CN-SO-04-BA Niton LLC XLi < LOD : 20.28 < LOD : 141.26 < LOD : 17.42 < LOD : 243.77 < LOD : 313.36 3,342 15 CN-SO-05-BA Niton LLC XLi < LOD : 20.98 285 < LOD : 17.62 < LOD : 244.58 < LOD : 311.89 3,379 15 CN-SO-09-BA Niton LLC XLi 31 227 < LOD : 17.64 < LOD : 246.01 < LOD : 320.51 3,298 15 CN-SO-11-BA Niton LLC XLi < LOD : 21.65 303 < LOD : 18.21 < LOD : 240.09 < LOD : 319.33 3,419
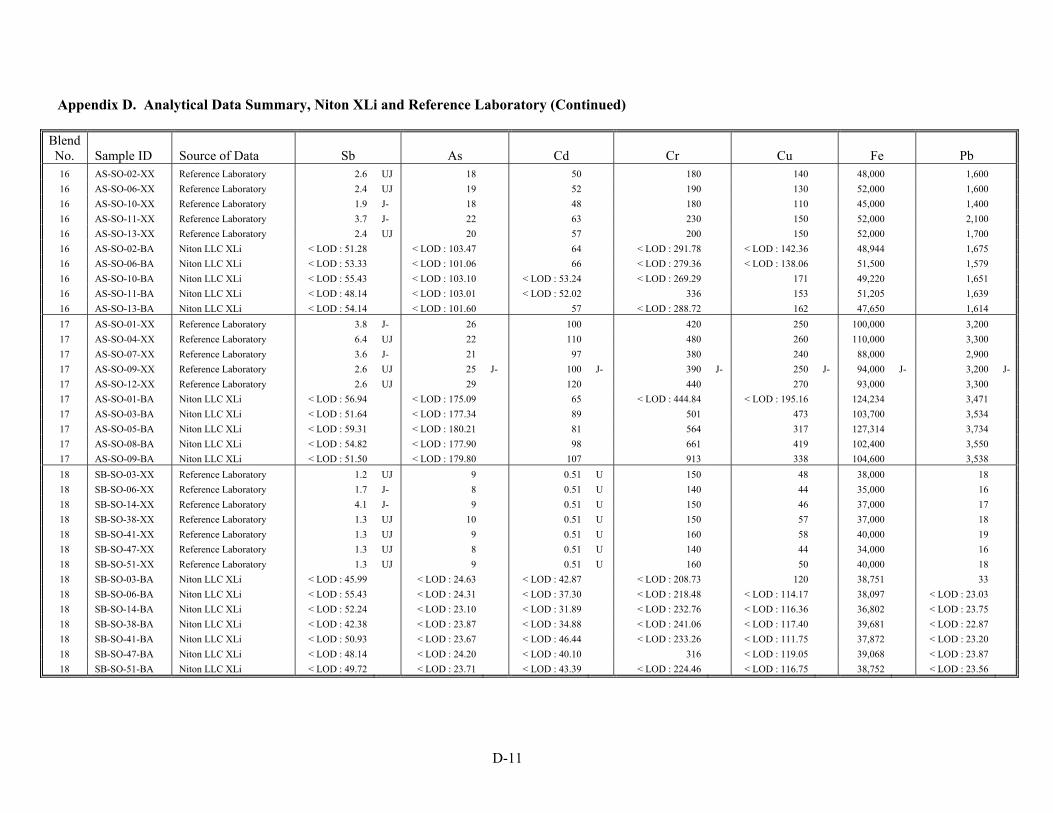
D-11
Appendix D. Analytical Data Summary, Niton XLi and Reference Laboratory (Continued)
Blend No. Sample ID Source of Data Sb As Cd Cr Cu Fe Pb 16 AS-SO-02-XX Reference Laboratory 2.6 UJ 18 50 180 140 48,000 1,600 16 AS-SO-06-XX Reference Laboratory 2.4 UJ 19 52 190 130 52,000 1,600 16 AS-SO-10-XX Reference Laboratory 1.9 J- 18 48 180 110 45,000 1,400 16 AS-SO-11-XX Reference Laboratory 3.7 J- 22 63 230 150 52,000 2,100 16 AS-SO-13-XX Reference Laboratory 2.4 UJ 20 57 200 150 52,000 1,700 16 AS-SO-02-BA Niton LLC XLi < LOD : 51.28 < LOD : 103.47 64 < LOD : 291.78 < LOD : 142.36 48,944 1,675 16 AS-SO-06-BA Niton LLC XLi < LOD : 53.33 < LOD : 101.06 66 < LOD : 279.36 < LOD : 138.06 51,500 1,579 16 AS-SO-10-BA Niton LLC XLi < LOD : 55.43 < LOD : 103.10 < LOD : 53.24 < LOD : 269.29 171 49,220 1,651 16 AS-SO-11-BA Niton LLC XLi < LOD : 48.14 < LOD : 103.01 < LOD : 52.02 336 153 51,205 1,639 16 AS-SO-13-BA Niton LLC XLi < LOD : 54.14 < LOD : 101.60 57 < LOD : 288.72 162 47,650 1,614 17 AS-SO-01-XX Reference Laboratory 3.8 J- 26 100 420 250 100,000 3,200 17 AS-SO-04-XX Reference Laboratory 6.4 UJ 22 110 480 260 110,000 3,300 17 AS-SO-07-XX Reference Laboratory 3.6 J- 21 97 380 240 88,000 2,900 17 AS-SO-09-XX Reference Laboratory 2.6 UJ 25 J- 100 J- 390 J- 250 J- 94,000 J- 3,200 J- 17 AS-SO-12-XX Reference Laboratory 2.6 UJ 29 120 440 270 93,000 3,300 17 AS-SO-01-BA Niton LLC XLi < LOD : 56.94 < LOD : 175.09 65 < LOD : 444.84 < LOD : 195.16 124,234 3,471 17 AS-SO-03-BA Niton LLC XLi < LOD : 51.64 < LOD : 177.34 89 501 473 103,700 3,534 17 AS-SO-05-BA Niton LLC XLi < LOD : 59.31 < LOD : 180.21 81 564 317 127,314 3,734 17 AS-SO-08-BA Niton LLC XLi < LOD : 54.82 < LOD : 177.90 98 661 419 102,400 3,550 17 AS-SO-09-BA Niton LLC XLi < LOD : 51.50 < LOD : 179.80 107 913 338 104,600 3,538 18 SB-SO-03-XX Reference Laboratory 1.2 UJ 9 0.51 U 150 48 38,000 18 18 SB-SO-06-XX Reference Laboratory 1.7 J- 8 0.51 U 140 44 35,000 16 18 SB-SO-14-XX Reference Laboratory 4.1 J- 9 0.51 U 150 46 37,000 17 18 SB-SO-38-XX Reference Laboratory 1.3 UJ 10 0.51 U 150 57 37,000 18 18 SB-SO-41-XX Reference Laboratory 1.3 UJ 9 0.51 U 160 58 40,000 19 18 SB-SO-47-XX Reference Laboratory 1.3 UJ 8 0.51 U 140 44 34,000 16 18 SB-SO-51-XX Reference Laboratory 1.3 UJ 9 0.51 U 160 50 40,000 18 18 SB-SO-03-BA Niton LLC XLi < LOD : 45.99 < LOD : 24.63 < LOD : 42.87 < LOD : 208.73 120 38,751 33 18 SB-SO-06-BA Niton LLC XLi < LOD : 55.43 < LOD : 24.31 < LOD : 37.30 < LOD : 218.48 < LOD : 114.17 38,097 < LOD : 23.03 18 SB-SO-14-BA Niton LLC XLi < LOD : 52.24 < LOD : 23.10 < LOD : 31.89 < LOD : 232.76 < LOD : 116.36 36,802 < LOD : 23.75 18 SB-SO-38-BA Niton LLC XLi < LOD : 42.38 < LOD : 23.87 < LOD : 34.88 < LOD : 241.06 < LOD : 117.40 39,681 < LOD : 22.87 18 SB-SO-41-BA Niton LLC XLi < LOD : 50.93 < LOD : 23.67 < LOD : 46.44 < LOD : 233.26 < LOD : 111.75 37,872 < LOD : 23.20 18 SB-SO-47-BA Niton LLC XLi < LOD : 48.14 < LOD : 24.20 < LOD : 40.10 316 < LOD : 119.05 39,068 < LOD : 23.87 18 SB-SO-51-BA Niton LLC XLi < LOD : 49.72 < LOD : 23.71 < LOD : 43.39 < LOD : 224.46 < LOD : 116.75 38,752 < LOD : 23.56
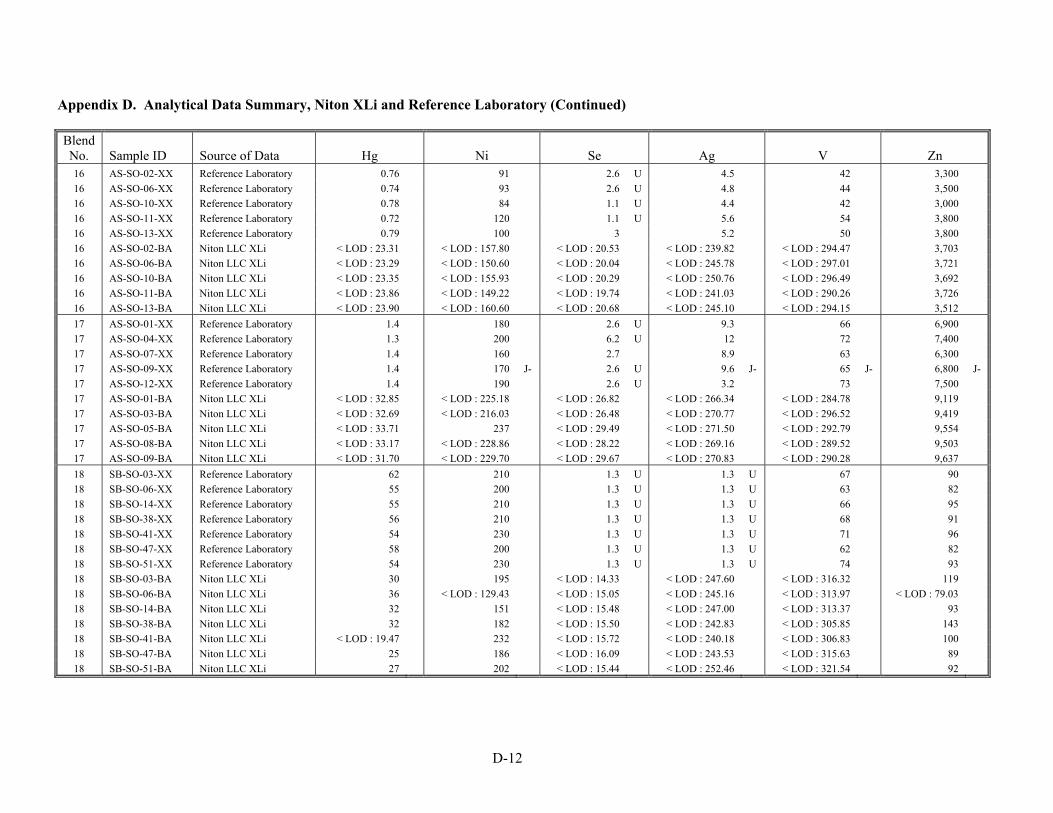
D-12
Appendix D. Analytical Data Summary, Niton XLi and Reference Laboratory (Continued) Blend No. Sample ID Source of Data Hg Ni Se Ag V Zn 16 AS-SO-02-XX Reference Laboratory 0.76 91 2.6 U 4.5 42 3,300 16 AS-SO-06-XX Reference Laboratory 0.74 93 2.6 U 4.8 44 3,500 16 AS-SO-10-XX Reference Laboratory 0.78 84 1.1 U 4.4 42 3,000 16 AS-SO-11-XX Reference Laboratory 0.72 120 1.1 U 5.6 54 3,800 16 AS-SO-13-XX Reference Laboratory 0.79 100 3 5.2 50 3,800 16 AS-SO-02-BA Niton LLC XLi < LOD : 23.31 < LOD : 157.80 < LOD : 20.53 < LOD : 239.82 < LOD : 294.47 3,703 16 AS-SO-06-BA Niton LLC XLi < LOD : 23.29 < LOD : 150.60 < LOD : 20.04 < LOD : 245.78 < LOD : 297.01 3,721 16 AS-SO-10-BA Niton LLC XLi < LOD : 23.35 < LOD : 155.93 < LOD : 20.29 < LOD : 250.76 < LOD : 296.49 3,692 16 AS-SO-11-BA Niton LLC XLi < LOD : 23.86 < LOD : 149.22 < LOD : 19.74 < LOD : 241.03 < LOD : 290.26 3,726 16 AS-SO-13-BA Niton LLC XLi < LOD : 23.90 < LOD : 160.60 < LOD : 20.68 < LOD : 245.10 < LOD : 294.15 3,512 17 AS-SO-01-XX Reference Laboratory 1.4 180 2.6 U 9.3 66 6,900 17 AS-SO-04-XX Reference Laboratory 1.3 200 6.2 U 12 72 7,400 17 AS-SO-07-XX Reference Laboratory 1.4 160 2.7 8.9 63 6,300 17 AS-SO-09-XX Reference Laboratory 1.4 170 J- 2.6 U 9.6 J- 65 J- 6,800 J- 17 AS-SO-12-XX Reference Laboratory 1.4 190 2.6 U 3.2 73 7,500 17 AS-SO-01-BA Niton LLC XLi < LOD : 32.85 < LOD : 225.18 < LOD : 26.82 < LOD : 266.34 < LOD : 284.78 9,119 17 AS-SO-03-BA Niton LLC XLi < LOD : 32.69 < LOD : 216.03 < LOD : 26.48 < LOD : 270.77 < LOD : 296.52 9,419 17 AS-SO-05-BA Niton LLC XLi < LOD : 33.71 237 < LOD : 29.49 < LOD : 271.50 < LOD : 292.79 9,554 17 AS-SO-08-BA Niton LLC XLi < LOD : 33.17 < LOD : 228.86 < LOD : 28.22 < LOD : 269.16 < LOD : 289.52 9,503 17 AS-SO-09-BA Niton LLC XLi < LOD : 31.70 < LOD : 229.70 < LOD : 29.67 < LOD : 270.83 < LOD : 290.28 9,637 18 SB-SO-03-XX Reference Laboratory 62 210 1.3 U 1.3 U 67 90 18 SB-SO-06-XX Reference Laboratory 55 200 1.3 U 1.3 U 63 82 18 SB-SO-14-XX Reference Laboratory 55 210 1.3 U 1.3 U 66 95 18 SB-SO-38-XX Reference Laboratory 56 210 1.3 U 1.3 U 68 91 18 SB-SO-41-XX Reference Laboratory 54 230 1.3 U 1.3 U 71 96 18 SB-SO-47-XX Reference Laboratory 58 200 1.3 U 1.3 U 62 82 18 SB-SO-51-XX Reference Laboratory 54 230 1.3 U 1.3 U 74 93 18 SB-SO-03-BA Niton LLC XLi 30 195 < LOD : 14.33 < LOD : 247.60 < LOD : 316.32 119 18 SB-SO-06-BA Niton LLC XLi 36 < LOD : 129.43 < LOD : 15.05 < LOD : 245.16 < LOD : 313.97 < LOD : 79.03 18 SB-SO-14-BA Niton LLC XLi 32 151 < LOD : 15.48 < LOD : 247.00 < LOD : 313.37 93 18 SB-SO-38-BA Niton LLC XLi 32 182 < LOD : 15.50 < LOD : 242.83 < LOD : 305.85 143 18 SB-SO-41-BA Niton LLC XLi < LOD : 19.47 232 < LOD : 15.72 < LOD : 240.18 < LOD : 306.83 100 18 SB-SO-47-BA Niton LLC XLi 25 186 < LOD : 16.09 < LOD : 243.53 < LOD : 315.63 89 18 SB-SO-51-BA Niton LLC XLi 27 202 < LOD : 15.44 < LOD : 252.46 < LOD : 321.54 92

D-13
Appendix D. Analytical Data Summary, Niton XLi and Reference Laboratory (Continued) Blend No. Sample ID Source of Data Sb As Cd Cr Cu Fe Pb 19 SB-SO-05-XX Reference Laboratory 1.6 J- 9 0.51 U 140 46 35,000 16 19 SB-SO-18-XX Reference Laboratory 1.2 UJ 10 0.51 U 150 46 38,000 17 19 SB-SO-30-XX Reference Laboratory 3.2 J- 7 0.51 U 94 27 22,000 10 19 SB-SO-40-XX Reference Laboratory 2.2 J- 9 0.51 U 120 40 33,000 15 19 SB-SO-53-XX Reference Laboratory 1.2 UJ 10 0.51 U 140 44 37,000 17 19 SB-SO-01-BA Niton LLC XLi < LOD : 52.07 < LOD : 23.51 < LOD : 39.51 320 135 36,801 < LOD : 23.30 19 SB-SO-10-BA Niton LLC XLi < LOD : 48.04 < LOD : 23.77 < LOD : 40.13 < LOD : 233.90 < LOD : 111.47 37,140 < LOD : 23.30 19 SB-SO-21-BA Niton LLC XLi < LOD : 49.98 < LOD : 24.55 < LOD : 42.40 < LOD : 228.01 148 36,765 < LOD : 24.14 19 SB-SO-31-BA Niton LLC XLi < LOD : 46.26 < LOD : 24.56 < LOD : 46.10 < LOD : 232.43 < LOD : 117.32 37,686 < LOD : 24.07 19 SB-SO-45-BA Niton LLC XLi < LOD : 49.59 < LOD : 23.59 < LOD : 38.77 295 < LOD : 114.71 37,706 < LOD : 22.35 20 SB-SO-08-XX Reference Laboratory 5.4 J- 13 0.51 U 120 39 32,000 17 20 SB-SO-11-XX Reference Laboratory 5.7 J- 13 0.51 U 140 46 36,000 20 20 SB-SO-21-XX Reference Laboratory 4.9 J 13 0.51 U 130 43 34,000 18 20 SB-SO-39-XX Reference Laboratory 4.7 J- 13 0.51 U 140 46 34,000 19 20 SB-SO-42-XX Reference Laboratory 4.6 J- 13 0.51 U 140 45 35,000 18 20 SB-SO-05-BA Niton LLC XLi < LOD : 56.08 < LOD : 24.55 < LOD : 39.80 < LOD : 215.20 < LOD : 113.04 34,919 < LOD : 22.86 20 SB-SO-16-BA Niton LLC XLi 101 < LOD : 25.52 < LOD : 41.25 < LOD : 224.93 < LOD : 106.38 33,387 < LOD : 24.96 20 SB-SO-26-BA Niton LLC XLi < LOD : 52.86 < LOD : 25.70 < LOD : 41.31 < LOD : 217.40 < LOD : 110.44 32,348 < LOD : 24.22 20 SB-SO-35-BA Niton LLC XLi < LOD : 55.75 < LOD : 26.55 < LOD : 36.18 < LOD : 233.56 < LOD : 116.90 34,706 28 20 SB-SO-53-BA Niton LLC XLi < LOD : 53.79 < LOD : 24.50 < LOD : 42.20 < LOD : 230.36 < LOD : 113.94 35,012 < LOD : 24.25 21 SB-SO-22-XX Reference Laboratory 10 J 18 0.51 U 120 37 29,000 22 21 SB-SO-25-XX Reference Laboratory 6.8 J+ 18 0.51 U 120 37 29,000 22 21 SB-SO-27-XX Reference Laboratory 6.7 J+ 18 0.51 U 120 37 29,000 22 21 SB-SO-35-XX Reference Laboratory 6 J+ 17 0.51 U 110 35 28,000 21 21 SB-SO-44-XX Reference Laboratory 6.8 J+ 18 0.51 U 120 37 29,000 22 21 SB-SO-08-BA Niton LLC XLi 86 < LOD : 27.51 < LOD : 43.82 < LOD : 216.33 < LOD : 114.66 28,660 27 21 SB-SO-19-BA Niton LLC XLi 88 41 < LOD : 50.60 < LOD : 233.57 < LOD : 114.02 28,259 < LOD : 25.36 21 SB-SO-29-BA Niton LLC XLi 101 < LOD : 28.45 < LOD : 46.67 < LOD : 217.17 < LOD : 113.74 27,596 38 21 SB-SO-40-BA Niton LLC XLi 95 < LOD : 27.52 < LOD : 39.55 < LOD : 215.95 136 26,965 28 21 SB-SO-55-BA Niton LLC XLi 62 < LOD : 27.62 < LOD : 41.33 < LOD : 212.87 < LOD : 112.79 28,715 < LOD : 25.48
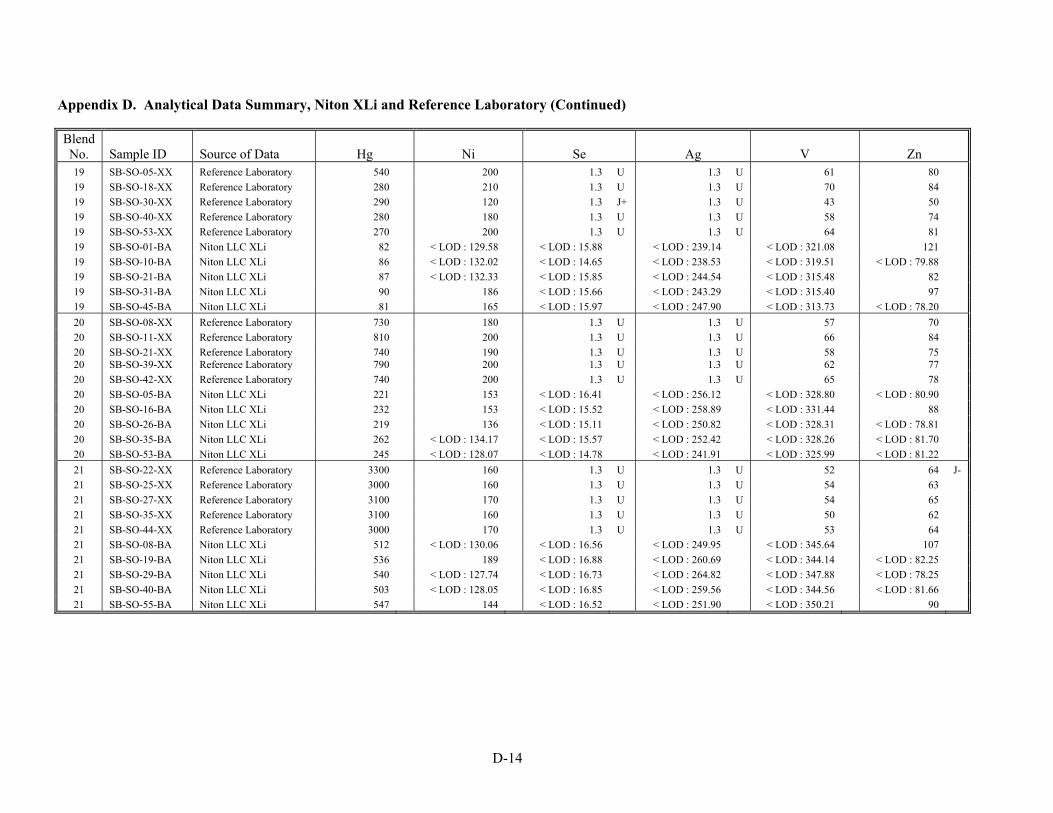
D-14
Appendix D. Analytical Data Summary, Niton XLi and Reference Laboratory (Continued) Blend No. Sample ID Source of Data Hg Ni Se Ag V Zn 19 SB-SO-05-XX Reference Laboratory 540 200 1.3 U 1.3 U 61 80 19 SB-SO-18-XX Reference Laboratory 280 210 1.3 U 1.3 U 70 84 19 SB-SO-30-XX Reference Laboratory 290 120 1.3 J+ 1.3 U 43 50 19 SB-SO-40-XX Reference Laboratory 280 180 1.3 U 1.3 U 58 74 19 SB-SO-53-XX Reference Laboratory 270 200 1.3 U 1.3 U 64 81 19 SB-SO-01-BA Niton LLC XLi 82 < LOD : 129.58 < LOD : 15.88 < LOD : 239.14 < LOD : 321.08 121 19 SB-SO-10-BA Niton LLC XLi 86 < LOD : 132.02 < LOD : 14.65 < LOD : 238.53 < LOD : 319.51 < LOD : 79.88 19 SB-SO-21-BA Niton LLC XLi 87 < LOD : 132.33 < LOD : 15.85 < LOD : 244.54 < LOD : 315.48 82 19 SB-SO-31-BA Niton LLC XLi 90 186 < LOD : 15.66 < LOD : 243.29 < LOD : 315.40 97 19 SB-SO-45-BA Niton LLC XLi 81 165 < LOD : 15.97 < LOD : 247.90 < LOD : 313.73 < LOD : 78.20 20 SB-SO-08-XX Reference Laboratory 730 180 1.3 U 1.3 U 57 70 20 SB-SO-11-XX Reference Laboratory 810 200 1.3 U 1.3 U 66 84 20 SB-SO-21-XX Reference Laboratory 740 190 1.3 U 1.3 U 58 75 20 SB-SO-39-XX Reference Laboratory 790 200 1.3 U 1.3 U 62 77 20 SB-SO-42-XX Reference Laboratory 740 200 1.3 U 1.3 U 65 78 20 SB-SO-05-BA Niton LLC XLi 221 153 < LOD : 16.41 < LOD : 256.12 < LOD : 328.80 < LOD : 80.90 20 SB-SO-16-BA Niton LLC XLi 232 153 < LOD : 15.52 < LOD : 258.89 < LOD : 331.44 88 20 SB-SO-26-BA Niton LLC XLi 219 136 < LOD : 15.11 < LOD : 250.82 < LOD : 328.31 < LOD : 78.81 20 SB-SO-35-BA Niton LLC XLi 262 < LOD : 134.17 < LOD : 15.57 < LOD : 252.42 < LOD : 328.26 < LOD : 81.70 20 SB-SO-53-BA Niton LLC XLi 245 < LOD : 128.07 < LOD : 14.78 < LOD : 241.91 < LOD : 325.99 < LOD : 81.22 21 SB-SO-22-XX Reference Laboratory 3300 160 1.3 U 1.3 U 52 64 J- 21 SB-SO-25-XX Reference Laboratory 3000 160 1.3 U 1.3 U 54 63 21 SB-SO-27-XX Reference Laboratory 3100 170 1.3 U 1.3 U 54 65 21 SB-SO-35-XX Reference Laboratory 3100 160 1.3 U 1.3 U 50 62 21 SB-SO-44-XX Reference Laboratory 3000 170 1.3 U 1.3 U 53 64 21 SB-SO-08-BA Niton LLC XLi 512 < LOD : 130.06 < LOD : 16.56 < LOD : 249.95 < LOD : 345.64 107 21 SB-SO-19-BA Niton LLC XLi 536 189 < LOD : 16.88 < LOD : 260.69 < LOD : 344.14 < LOD : 82.25 21 SB-SO-29-BA Niton LLC XLi 540 < LOD : 127.74 < LOD : 16.73 < LOD : 264.82 < LOD : 347.88 < LOD : 78.25 21 SB-SO-40-BA Niton LLC XLi 503 < LOD : 128.05 < LOD : 16.85 < LOD : 259.56 < LOD : 344.56 < LOD : 81.66 21 SB-SO-55-BA Niton LLC XLi 547 144 < LOD : 16.52 < LOD : 251.90 < LOD : 350.21 90

D-15
Appendix D. Analytical Data Summary, Niton XLi and Reference Laboratory (Continued) Blend No. Sample ID Source of Data Sb As Cd Cr Cu Fe Pb 22 SB-SO-23-XX Reference Laboratory 48 J- 37 0.1 U 21 7 4,500 36 22 SB-SO-28-XX Reference Laboratory 42 J- 36 0.1 U 21 7 4,400 36 22 SB-SO-32-XX Reference Laboratory 46 J- 40 0.1 U 23 7.6 4,900 40 22 SB-SO-43-XX Reference Laboratory 40 J- 35 0.1 U 20 6.7 4,200 34 22 SB-SO-48-XX Reference Laboratory 39 J- 36 0.1 U 21 6.9 4,500 36 22 SB-SO-23-BA Niton LLC XLi 247 48 < LOD : 51.54 < LOD : 180.85 < LOD : 109.84 4,032 41 22 SB-SO-28-BA Niton LLC XLi 231 38 < LOD : 40.53 < LOD : 196.08 < LOD : 109.06 4,252 < LOD : 32.17 22 SB-SO-32-BA Niton LLC XLi 231 49 < LOD : 48.62 < LOD : 194.25 < LOD : 101.63 4,144 < LOD : 31.49 22 SB-SO-43-BA Niton LLC XLi 235 67 < LOD : 54.32 < LOD : 195.71 < LOD : 104.11 3,877 41 22 SB-SO-48-BA Niton LLC XLi 225 45 < LOD : 51.48 < LOD : 200.99 < LOD : 109.05 4,021 46 23 SB-SO-02-XX Reference Laboratory 44 J- 23 J- 0.5 U 130 43 35,000 22 J- 23 SB-SO-07-XX Reference Laboratory 45 J 22 0.5 U 120 38 35,000 23 23 SB-SO-10-XX Reference Laboratory 62 J 26 0.5 U 140 44 41,000 27 23 SB-SO-26-XX Reference Laboratory 61 J 30 0.5 U 160 50 46,000 31 23 SB-SO-50-XX Reference Laboratory 57 J 27 0.5 U 140 46 42,000 28 23 SB-SO-09-BA Niton LLC XLi 288 32 < LOD : 38.94 < LOD : 245.75 < LOD : 111.34 42,028 < LOD : 22.66 23 SB-SO-18-BA Niton LLC XLi 240 < LOD : 26.83 < LOD : 36.78 < LOD : 239.56 < LOD : 113.80 40,851 39 23 SB-SO-30-BA Niton LLC XLi 227 < LOD : 25.83 < LOD : 39.28 < LOD : 241.47 < LOD : 116.06 41,265 32 23 SB-SO-39-BA Niton LLC XLi 279 32 < LOD : 38.79 < LOD : 236.70 < LOD : 113.61 41,873 < LOD : 24.73 23 SB-SO-44-BA Niton LLC XLi 271 29 < LOD : 45.24 < LOD : 236.46 < LOD : 116.08 42,468 < LOD : 24.26 24 SB-SO-01-XX Reference Laboratory 180 J 65 0.5 U 140 46 47,000 30 24 SB-SO-16-XX Reference Laboratory 170 J 64 0.5 U 140 45 47,000 30 24 SB-SO-24-XX Reference Laboratory 180 J 66 0.5 U 150 49 49,000 32 24 SB-SO-45-XX Reference Laboratory 180 J 63 0.5 U 140 45 47,000 30 24 SB-SO-52-XX Reference Laboratory 150 J 62 0.5 U 140 47 46,000 29 24 SB-SO-07-BA Niton LLC XLi 602 77 < LOD : 35.91 < LOD : 237.90 < LOD : 113.49 45,505 35 24 SB-SO-20-BA Niton LLC XLi 693 61 < LOD : 41.83 323 < LOD : 117.10 44,636 27 24 SB-SO-27-BA Niton LLC XLi 680 76 < LOD : 39.21 < LOD : 239.58 < LOD : 117.61 44,350 29 24 SB-SO-37-BA Niton LLC XLi 682 65 < LOD : 41.84 < LOD : 247.16 < LOD : 118.97 45,504 40 24 SB-SO-49-BA Niton LLC XLi 645 81 < LOD : 44.45 < LOD : 241.76 < LOD : 119.71 46,122 < LOD : 24.71
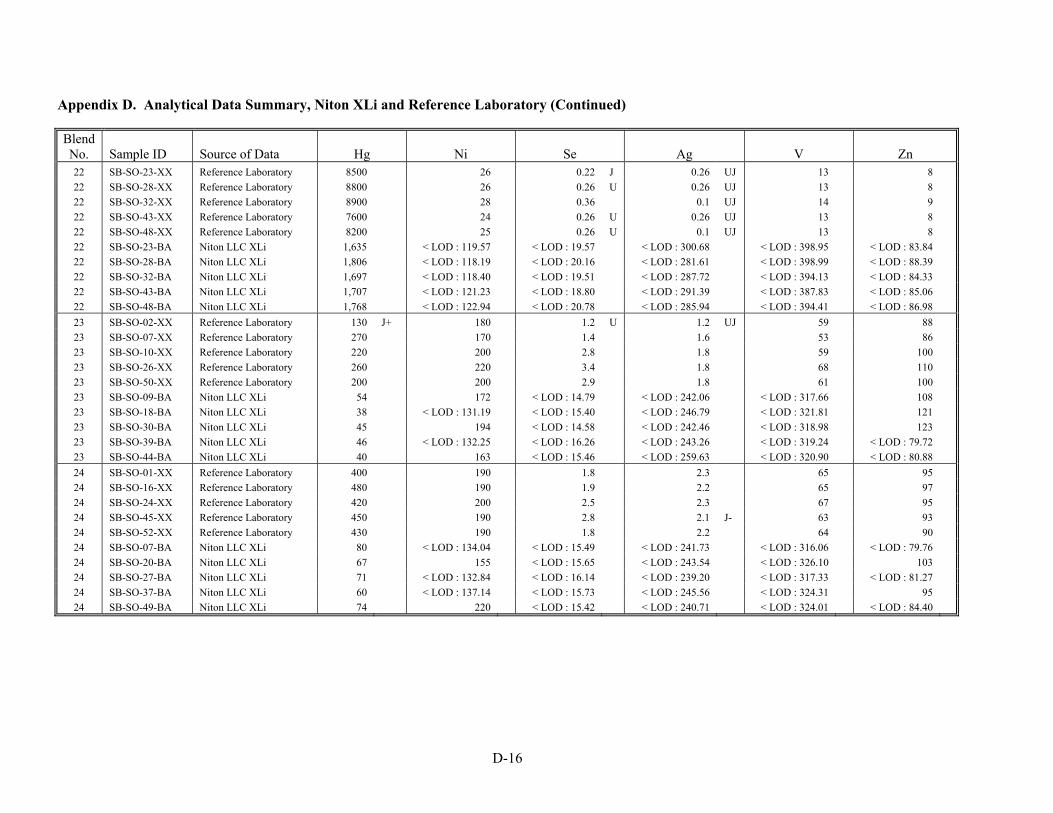
D-16
Appendix D. Analytical Data Summary, Niton XLi and Reference Laboratory (Continued) Blend No. Sample ID Source of Data Hg Ni Se Ag V Zn 22 SB-SO-23-XX Reference Laboratory 8500 26 0.22 J 0.26 UJ 13 8 22 SB-SO-28-XX Reference Laboratory 8800 26 0.26 U 0.26 UJ 13 8 22 SB-SO-32-XX Reference Laboratory 8900 28 0.36 0.1 UJ 14 9 22 SB-SO-43-XX Reference Laboratory 7600 24 0.26 U 0.26 UJ 13 8 22 SB-SO-48-XX Reference Laboratory 8200 25 0.26 U 0.1 UJ 13 8 22 SB-SO-23-BA Niton LLC XLi 1,635 < LOD : 119.57 < LOD : 19.57 < LOD : 300.68 < LOD : 398.95 < LOD : 83.84 22 SB-SO-28-BA Niton LLC XLi 1,806 < LOD : 118.19 < LOD : 20.16 < LOD : 281.61 < LOD : 398.99 < LOD : 88.39 22 SB-SO-32-BA Niton LLC XLi 1,697 < LOD : 118.40 < LOD : 19.51 < LOD : 287.72 < LOD : 394.13 < LOD : 84.33 22 SB-SO-43-BA Niton LLC XLi 1,707 < LOD : 121.23 < LOD : 18.80 < LOD : 291.39 < LOD : 387.83 < LOD : 85.06 22 SB-SO-48-BA Niton LLC XLi 1,768 < LOD : 122.94 < LOD : 20.78 < LOD : 285.94 < LOD : 394.41 < LOD : 86.98 23 SB-SO-02-XX Reference Laboratory 130 J+ 180 1.2 U 1.2 UJ 59 88 23 SB-SO-07-XX Reference Laboratory 270 170 1.4 1.6 53 86 23 SB-SO-10-XX Reference Laboratory 220 200 2.8 1.8 59 100 23 SB-SO-26-XX Reference Laboratory 260 220 3.4 1.8 68 110 23 SB-SO-50-XX Reference Laboratory 200 200 2.9 1.8 61 100 23 SB-SO-09-BA Niton LLC XLi 54 172 < LOD : 14.79 < LOD : 242.06 < LOD : 317.66 108 23 SB-SO-18-BA Niton LLC XLi 38 < LOD : 131.19 < LOD : 15.40 < LOD : 246.79 < LOD : 321.81 121 23 SB-SO-30-BA Niton LLC XLi 45 194 < LOD : 14.58 < LOD : 242.46 < LOD : 318.98 123 23 SB-SO-39-BA Niton LLC XLi 46 < LOD : 132.25 < LOD : 16.26 < LOD : 243.26 < LOD : 319.24 < LOD : 79.72 23 SB-SO-44-BA Niton LLC XLi 40 163 < LOD : 15.46 < LOD : 259.63 < LOD : 320.90 < LOD : 80.88 24 SB-SO-01-XX Reference Laboratory 400 190 1.8 2.3 65 95 24 SB-SO-16-XX Reference Laboratory 480 190 1.9 2.2 65 97 24 SB-SO-24-XX Reference Laboratory 420 200 2.5 2.3 67 95 24 SB-SO-45-XX Reference Laboratory 450 190 2.8 2.1 J- 63 93 24 SB-SO-52-XX Reference Laboratory 430 190 1.8 2.2 64 90 24 SB-SO-07-BA Niton LLC XLi 80 < LOD : 134.04 < LOD : 15.49 < LOD : 241.73 < LOD : 316.06 < LOD : 79.76 24 SB-SO-20-BA Niton LLC XLi 67 155 < LOD : 15.65 < LOD : 243.54 < LOD : 326.10 103 24 SB-SO-27-BA Niton LLC XLi 71 < LOD : 132.84 < LOD : 16.14 < LOD : 239.20 < LOD : 317.33 < LOD : 81.27 24 SB-SO-37-BA Niton LLC XLi 60 < LOD : 137.14 < LOD : 15.73 < LOD : 245.56 < LOD : 324.31 95 24 SB-SO-49-BA Niton LLC XLi 74 220 < LOD : 15.42 < LOD : 240.71 < LOD : 324.01 < LOD : 84.40

D-17
Appendix D. Analytical Data Summary, Niton XLi and Reference Laboratory (Continued) Blend No. Sample ID Source of Data Sb As Cd Cr Cu Fe Pb 25 SB-SO-13-XX Reference Laboratory 430 J 160 1 U 140 46 61,000 36 25 SB-SO-19-XX Reference Laboratory 310 J 100 0.5 U 100 32 42,000 25 25 SB-SO-33-XX Reference Laboratory 350 J 110 0.5 U 100 33 45,000 28 25 SB-SO-37-XX Reference Laboratory 340 J 130 1 U 120 39 51,000 31 25 SB-SO-55-XX Reference Laboratory 340 J 120 0.5 U 120 37 49,000 29 25 SB-SO-02-BA Niton LLC XLi 1,367 124 < LOD : 45.96 < LOD : 264.37 < LOD : 126.06 54,781 40 25 SB-SO-11-BA Niton LLC XLi 1,344 125 < LOD : 50.35 < LOD : 249.44 < LOD : 122.56 52,556 38 25 SB-SO-24-BA Niton LLC XLi 1,290 121 < LOD : 42.33 < LOD : 249.61 < LOD : 130.03 54,191 36 25 SB-SO-33-BA Niton LLC XLi 1,487 138 < LOD : 38.44 < LOD : 258.15 < LOD : 128.94 55,850 < LOD : 27.04 25 SB-SO-50-BA Niton LLC XLi 1,363 135 < LOD : 47.45 < LOD : 271.29 < LOD : 131.20 56,159 < LOD : 26.75 26 SB-SO-12-XX Reference Laboratory 620 J 190 1 U 100 33 55,000 43 26 SB-SO-15-XX Reference Laboratory 600 J- 170 J- 1 U 91 J- 30 J- 51,000 J- 40 J- 26 SB-SO-17-XX Reference Laboratory 800 J+ 210 1 U 110 37 61,000 48 26 SB-SO-46-XX Reference Laboratory 740 J+ 190 1 U 120 35 57,000 47 26 SB-SO-54-XX Reference Laboratory 280 31 0.2 U 25 5.8 8,600 5 J- 26 SB-SO-12-BA Niton LLC XLi 2,168 204 < LOD : 47.30 < LOD : 279.74 < LOD : 128.09 65,594 56 26 SB-SO-15-BA Niton LLC XLi 1,966 195 < LOD : 53.99 < LOD : 270.78 < LOD : 128.71 63,709 34 26 SB-SO-17-BA Niton LLC XLi 2,103 193 < LOD : 55.76 < LOD : 287.74 < LOD : 131.23 64,575 46 26 SB-SO-46-BA Niton LLC XLi 2,056 217 < LOD : 51.01 < LOD : 255.24 < LOD : 134.26 67,100 67 26 SB-SO-54-BA Niton LLC XLi 2,028 187 < LOD : 43.43 < LOD : 281.84 < LOD : 134.97 67,300 59 27 KP-SE-08-XX Reference Laboratory 6.2 3 0.11 U 88 3.8 840 300 J- 27 KP-SE-11-XX Reference Laboratory 5.6 3 0.11 U 96 4.1 940 310 J- 27 KP-SE-17-XX Reference Laboratory 4.9 3 0.11 U 98 4.1 940 300 J- 27 KP-SE-25-XX Reference Laboratory 6 3 0.11 U 99 4.3 960 310 J- 27 KP-SE-30-XX Reference Laboratory 5.7 3 0.11 U 83 3.6 830 300 J- 27 KP-SE-04-BA Niton LLC XLi < LOD : 50.10 < LOD : 36.36 < LOD : 44.64 < LOD : 118.94 < LOD : 73.28 1,023 324 27 KP-SE-12-BA Niton LLC XLi < LOD : 44.56 < LOD : 35.08 < LOD : 44.95 < LOD : 120.26 < LOD : 72.09 1,112 324 27 KP-SE-20-BA Niton LLC XLi < LOD : 46.13 < LOD : 35.12 < LOD : 39.42 < LOD : 123.89 < LOD : 72.73 1,108 337 27 KP-SE-27-BA Niton LLC XLi < LOD : 44.76 < LOD : 35.39 < LOD : 38.53 < LOD : 126.40 < LOD : 70.74 1,022 311 27 KP-SE-31-BA Niton LLC XLi < LOD : 47.05 < LOD : 36.48 < LOD : 37.89 < LOD : 129.95 < LOD : 74.39 928 336
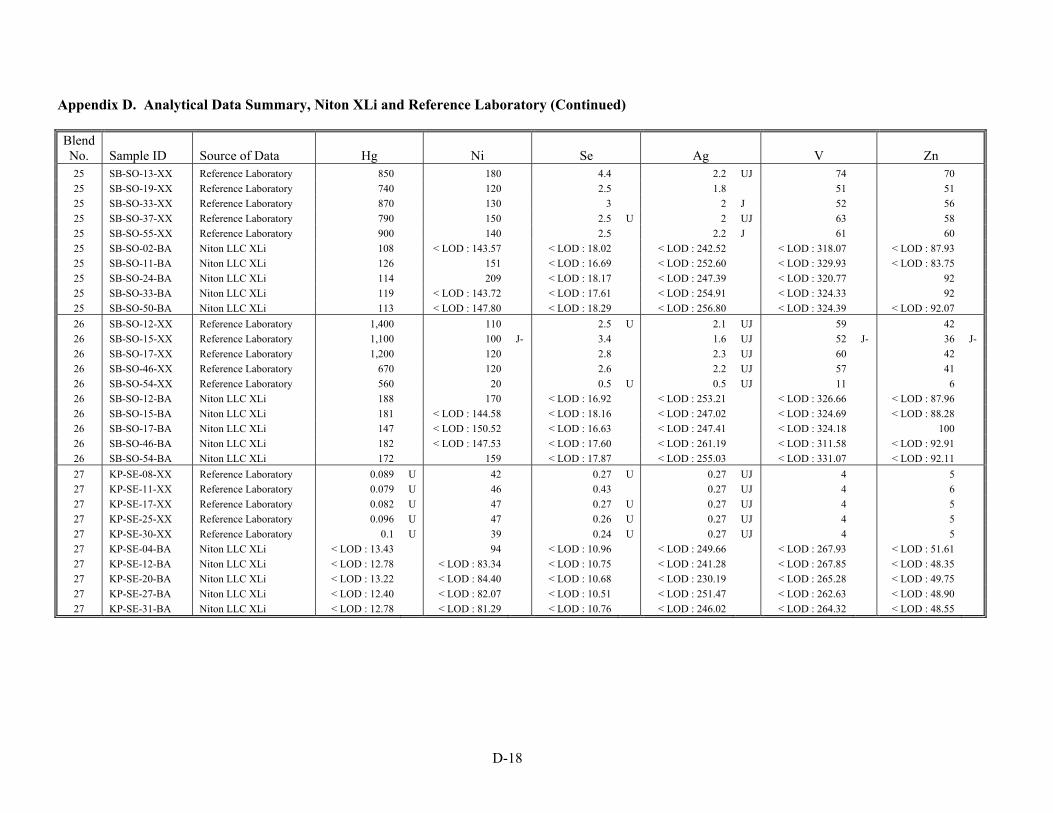
D-18
Appendix D. Analytical Data Summary, Niton XLi and Reference Laboratory (Continued) Blend No. Sample ID Source of Data Hg Ni Se Ag V Zn 25 SB-SO-13-XX Reference Laboratory 850 180 4.4 2.2 UJ 74 70 25 SB-SO-19-XX Reference Laboratory 740 120 2.5 1.8 51 51 25 SB-SO-33-XX Reference Laboratory 870 130 3 2 J 52 56 25 SB-SO-37-XX Reference Laboratory 790 150 2.5 U 2 UJ 63 58 25 SB-SO-55-XX Reference Laboratory 900 140 2.5 2.2 J 61 60 25 SB-SO-02-BA Niton LLC XLi 108 < LOD : 143.57 < LOD : 18.02 < LOD : 242.52 < LOD : 318.07 < LOD : 87.93 25 SB-SO-11-BA Niton LLC XLi 126 151 < LOD : 16.69 < LOD : 252.60 < LOD : 329.93 < LOD : 83.75 25 SB-SO-24-BA Niton LLC XLi 114 209 < LOD : 18.17 < LOD : 247.39 < LOD : 320.77 92 25 SB-SO-33-BA Niton LLC XLi 119 < LOD : 143.72 < LOD : 17.61 < LOD : 254.91 < LOD : 324.33 92 25 SB-SO-50-BA Niton LLC XLi 113 < LOD : 147.80 < LOD : 18.29 < LOD : 256.80 < LOD : 324.39 < LOD : 92.07 26 SB-SO-12-XX Reference Laboratory 1,400 110 2.5 U 2.1 UJ 59 42 26 SB-SO-15-XX Reference Laboratory 1,100 100 J- 3.4 1.6 UJ 52 J- 36 J- 26 SB-SO-17-XX Reference Laboratory 1,200 120 2.8 2.3 UJ 60 42 26 SB-SO-46-XX Reference Laboratory 670 120 2.6 2.2 UJ 57 41 26 SB-SO-54-XX Reference Laboratory 560 20 0.5 U 0.5 UJ 11 6 26 SB-SO-12-BA Niton LLC XLi 188 170 < LOD : 16.92 < LOD : 253.21 < LOD : 326.66 < LOD : 87.96 26 SB-SO-15-BA Niton LLC XLi 181 < LOD : 144.58 < LOD : 18.16 < LOD : 247.02 < LOD : 324.69 < LOD : 88.28 26 SB-SO-17-BA Niton LLC XLi 147 < LOD : 150.52 < LOD : 16.63 < LOD : 247.41 < LOD : 324.18 100 26 SB-SO-46-BA Niton LLC XLi 182 < LOD : 147.53 < LOD : 17.60 < LOD : 261.19 < LOD : 311.58 < LOD : 92.91 26 SB-SO-54-BA Niton LLC XLi 172 159 < LOD : 17.87 < LOD : 255.03 < LOD : 331.07 < LOD : 92.11 27 KP-SE-08-XX Reference Laboratory 0.089 U 42 0.27 U 0.27 UJ 4 5 27 KP-SE-11-XX Reference Laboratory 0.079 U 46 0.43 0.27 UJ 4 6 27 KP-SE-17-XX Reference Laboratory 0.082 U 47 0.27 U 0.27 UJ 4 5 27 KP-SE-25-XX Reference Laboratory 0.096 U 47 0.26 U 0.27 UJ 4 5 27 KP-SE-30-XX Reference Laboratory 0.1 U 39 0.24 U 0.27 UJ 4 5 27 KP-SE-04-BA Niton LLC XLi < LOD : 13.43 94 < LOD : 10.96 < LOD : 249.66 < LOD : 267.93 < LOD : 51.61 27 KP-SE-12-BA Niton LLC XLi < LOD : 12.78 < LOD : 83.34 < LOD : 10.75 < LOD : 241.28 < LOD : 267.85 < LOD : 48.35 27 KP-SE-20-BA Niton LLC XLi < LOD : 13.22 < LOD : 84.40 < LOD : 10.68 < LOD : 230.19 < LOD : 265.28 < LOD : 49.75 27 KP-SE-27-BA Niton LLC XLi < LOD : 12.40 < LOD : 82.07 < LOD : 10.51 < LOD : 251.47 < LOD : 262.63 < LOD : 48.90 27 KP-SE-31-BA Niton LLC XLi < LOD : 12.78 < LOD : 81.29 < LOD : 10.76 < LOD : 246.02 < LOD : 264.32 < LOD : 48.55
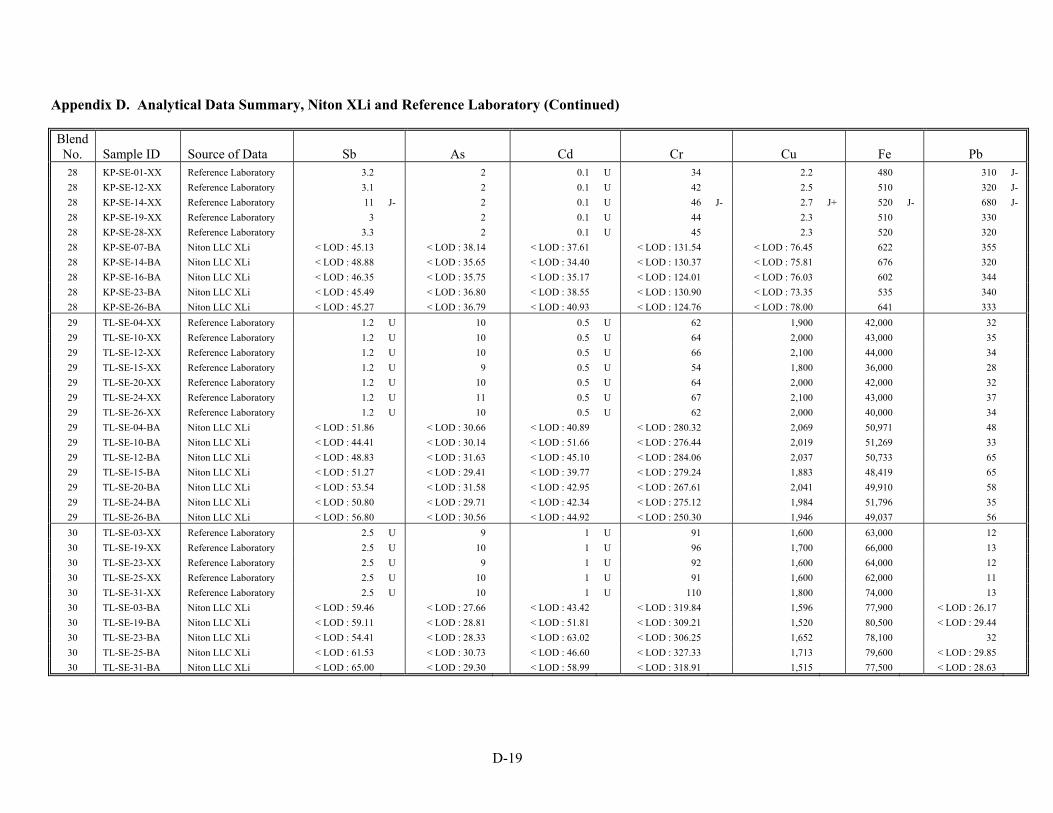
D-19
Appendix D. Analytical Data Summary, Niton XLi and Reference Laboratory (Continued) Blend No. Sample ID Source of Data Sb As Cd Cr Cu Fe Pb 28 KP-SE-01-XX Reference Laboratory 3.2 2 0.1 U 34 2.2 480 310 J- 28 KP-SE-12-XX Reference Laboratory 3.1 2 0.1 U 42 2.5 510 320 J- 28 KP-SE-14-XX Reference Laboratory 11 J- 2 0.1 U 46 J- 2.7 J+ 520 J- 680 J- 28 KP-SE-19-XX Reference Laboratory 3 2 0.1 U 44 2.3 510 330 28 KP-SE-28-XX Reference Laboratory 3.3 2 0.1 U 45 2.3 520 320 28 KP-SE-07-BA Niton LLC XLi < LOD : 45.13 < LOD : 38.14 < LOD : 37.61 < LOD : 131.54 < LOD : 76.45 622 355 28 KP-SE-14-BA Niton LLC XLi < LOD : 48.88 < LOD : 35.65 < LOD : 34.40 < LOD : 130.37 < LOD : 75.81 676 320 28 KP-SE-16-BA Niton LLC XLi < LOD : 46.35 < LOD : 35.75 < LOD : 35.17 < LOD : 124.01 < LOD : 76.03 602 344 28 KP-SE-23-BA Niton LLC XLi < LOD : 45.49 < LOD : 36.80 < LOD : 38.55 < LOD : 130.90 < LOD : 73.35 535 340 28 KP-SE-26-BA Niton LLC XLi < LOD : 45.27 < LOD : 36.79 < LOD : 40.93 < LOD : 124.76 < LOD : 78.00 641 333 29 TL-SE-04-XX Reference Laboratory 1.2 U 10 0.5 U 62 1,900 42,000 32 29 TL-SE-10-XX Reference Laboratory 1.2 U 10 0.5 U 64 2,000 43,000 35 29 TL-SE-12-XX Reference Laboratory 1.2 U 10 0.5 U 66 2,100 44,000 34 29 TL-SE-15-XX Reference Laboratory 1.2 U 9 0.5 U 54 1,800 36,000 28 29 TL-SE-20-XX Reference Laboratory 1.2 U 10 0.5 U 64 2,000 42,000 32 29 TL-SE-24-XX Reference Laboratory 1.2 U 11 0.5 U 67 2,100 43,000 37 29 TL-SE-26-XX Reference Laboratory 1.2 U 10 0.5 U 62 2,000 40,000 34 29 TL-SE-04-BA Niton LLC XLi < LOD : 51.86 < LOD : 30.66 < LOD : 40.89 < LOD : 280.32 2,069 50,971 48 29 TL-SE-10-BA Niton LLC XLi < LOD : 44.41 < LOD : 30.14 < LOD : 51.66 < LOD : 276.44 2,019 51,269 33 29 TL-SE-12-BA Niton LLC XLi < LOD : 48.83 < LOD : 31.63 < LOD : 45.10 < LOD : 284.06 2,037 50,733 65 29 TL-SE-15-BA Niton LLC XLi < LOD : 51.27 < LOD : 29.41 < LOD : 39.77 < LOD : 279.24 1,883 48,419 65 29 TL-SE-20-BA Niton LLC XLi < LOD : 53.54 < LOD : 31.58 < LOD : 42.95 < LOD : 267.61 2,041 49,910 58 29 TL-SE-24-BA Niton LLC XLi < LOD : 50.80 < LOD : 29.71 < LOD : 42.34 < LOD : 275.12 1,984 51,796 35 29 TL-SE-26-BA Niton LLC XLi < LOD : 56.80 < LOD : 30.56 < LOD : 44.92 < LOD : 250.30 1,946 49,037 56 30 TL-SE-03-XX Reference Laboratory 2.5 U 9 1 U 91 1,600 63,000 12 30 TL-SE-19-XX Reference Laboratory 2.5 U 10 1 U 96 1,700 66,000 13 30 TL-SE-23-XX Reference Laboratory 2.5 U 9 1 U 92 1,600 64,000 12 30 TL-SE-25-XX Reference Laboratory 2.5 U 10 1 U 91 1,600 62,000 11 30 TL-SE-31-XX Reference Laboratory 2.5 U 10 1 U 110 1,800 74,000 13 30 TL-SE-03-BA Niton LLC XLi < LOD : 59.46 < LOD : 27.66 < LOD : 43.42 < LOD : 319.84 1,596 77,900 < LOD : 26.17 30 TL-SE-19-BA Niton LLC XLi < LOD : 59.11 < LOD : 28.81 < LOD : 51.81 < LOD : 309.21 1,520 80,500 < LOD : 29.44 30 TL-SE-23-BA Niton LLC XLi < LOD : 54.41 < LOD : 28.33 < LOD : 63.02 < LOD : 306.25 1,652 78,100 32 30 TL-SE-25-BA Niton LLC XLi < LOD : 61.53 < LOD : 30.73 < LOD : 46.60 < LOD : 327.33 1,713 79,600 < LOD : 29.85 30 TL-SE-31-BA Niton LLC XLi < LOD : 65.00 < LOD : 29.30 < LOD : 58.99 < LOD : 318.91 1,515 77,500 < LOD : 28.63
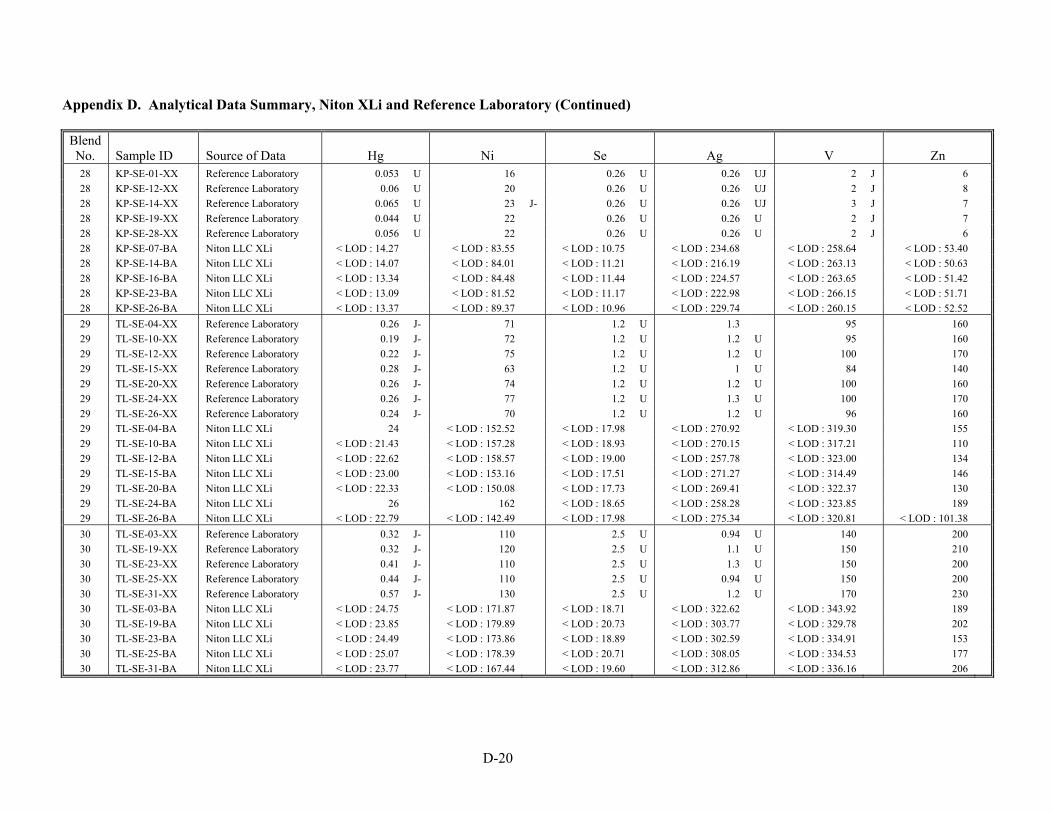
D-20
Appendix D. Analytical Data Summary, Niton XLi and Reference Laboratory (Continued)
Blend No. Sample ID Source of Data Hg Ni Se Ag V Zn 28 KP-SE-01-XX Reference Laboratory 0.053 U 16 0.26 U 0.26 UJ 2 J 6 28 KP-SE-12-XX Reference Laboratory 0.06 U 20 0.26 U 0.26 UJ 2 J 8 28 KP-SE-14-XX Reference Laboratory 0.065 U 23 J- 0.26 U 0.26 UJ 3 J 7 28 KP-SE-19-XX Reference Laboratory 0.044 U 22 0.26 U 0.26 U 2 J 7 28 KP-SE-28-XX Reference Laboratory 0.056 U 22 0.26 U 0.26 U 2 J 6 28 KP-SE-07-BA Niton LLC XLi < LOD : 14.27 < LOD : 83.55 < LOD : 10.75 < LOD : 234.68 < LOD : 258.64 < LOD : 53.40 28 KP-SE-14-BA Niton LLC XLi < LOD : 14.07 < LOD : 84.01 < LOD : 11.21 < LOD : 216.19 < LOD : 263.13 < LOD : 50.63 28 KP-SE-16-BA Niton LLC XLi < LOD : 13.34 < LOD : 84.48 < LOD : 11.44 < LOD : 224.57 < LOD : 263.65 < LOD : 51.42 28 KP-SE-23-BA Niton LLC XLi < LOD : 13.09 < LOD : 81.52 < LOD : 11.17 < LOD : 222.98 < LOD : 266.15 < LOD : 51.71 28 KP-SE-26-BA Niton LLC XLi < LOD : 13.37 < LOD : 89.37 < LOD : 10.96 < LOD : 229.74 < LOD : 260.15 < LOD : 52.52 29 TL-SE-04-XX Reference Laboratory 0.26 J- 71 1.2 U 1.3 95 160 29 TL-SE-10-XX Reference Laboratory 0.19 J- 72 1.2 U 1.2 U 95 160 29 TL-SE-12-XX Reference Laboratory 0.22 J- 75 1.2 U 1.2 U 100 170 29 TL-SE-15-XX Reference Laboratory 0.28 J- 63 1.2 U 1 U 84 140 29 TL-SE-20-XX Reference Laboratory 0.26 J- 74 1.2 U 1.2 U 100 160 29 TL-SE-24-XX Reference Laboratory 0.26 J- 77 1.2 U 1.3 U 100 170 29 TL-SE-26-XX Reference Laboratory 0.24 J- 70 1.2 U 1.2 U 96 160 29 TL-SE-04-BA Niton LLC XLi 24 < LOD : 152.52 < LOD : 17.98 < LOD : 270.92 < LOD : 319.30 155 29 TL-SE-10-BA Niton LLC XLi < LOD : 21.43 < LOD : 157.28 < LOD : 18.93 < LOD : 270.15 < LOD : 317.21 110 29 TL-SE-12-BA Niton LLC XLi < LOD : 22.62 < LOD : 158.57 < LOD : 19.00 < LOD : 257.78 < LOD : 323.00 134 29 TL-SE-15-BA Niton LLC XLi < LOD : 23.00 < LOD : 153.16 < LOD : 17.51 < LOD : 271.27 < LOD : 314.49 146 29 TL-SE-20-BA Niton LLC XLi < LOD : 22.33 < LOD : 150.08 < LOD : 17.73 < LOD : 269.41 < LOD : 322.37 130 29 TL-SE-24-BA Niton LLC XLi 26 162 < LOD : 18.65 < LOD : 258.28 < LOD : 323.85 189 29 TL-SE-26-BA Niton LLC XLi < LOD : 22.79 < LOD : 142.49 < LOD : 17.98 < LOD : 275.34 < LOD : 320.81 < LOD : 101.38 30 TL-SE-03-XX Reference Laboratory 0.32 J- 110 2.5 U 0.94 U 140 200 30 TL-SE-19-XX Reference Laboratory 0.32 J- 120 2.5 U 1.1 U 150 210 30 TL-SE-23-XX Reference Laboratory 0.41 J- 110 2.5 U 1.3 U 150 200 30 TL-SE-25-XX Reference Laboratory 0.44 J- 110 2.5 U 0.94 U 150 200 30 TL-SE-31-XX Reference Laboratory 0.57 J- 130 2.5 U 1.2 U 170 230 30 TL-SE-03-BA Niton LLC XLi < LOD : 24.75 < LOD : 171.87 < LOD : 18.71 < LOD : 322.62 < LOD : 343.92 189 30 TL-SE-19-BA Niton LLC XLi < LOD : 23.85 < LOD : 179.89 < LOD : 20.73 < LOD : 303.77 < LOD : 329.78 202 30 TL-SE-23-BA Niton LLC XLi < LOD : 24.49 < LOD : 173.86 < LOD : 18.89 < LOD : 302.59 < LOD : 334.91 153 30 TL-SE-25-BA Niton LLC XLi < LOD : 25.07 < LOD : 178.39 < LOD : 20.71 < LOD : 308.05 < LOD : 334.53 177 30 TL-SE-31-BA Niton LLC XLi < LOD : 23.77 < LOD : 167.44 < LOD : 19.60 < LOD : 312.86 < LOD : 336.16 206

D-21
Appendix D. Analytical Data Summary, Niton XLi and Reference Laboratory (Continued) Blend No. Sample ID Source of Data Sb As Cd Cr Cu Fe Pb 31 TL-SE-01-XX Reference Laboratory 1.2 UJ 9 0.5 U 110 1,400 19,000 48 J- 31 TL-SE-11-XX Reference Laboratory 1.2 UJ 15 0.5 U 140 1,600 28,000 54 J- 31 TL-SE-14-XX Reference Laboratory 1.2 UJ 10 0.27 J 110 1,500 18,000 50 J- 31 TL-SE-18-XX Reference Laboratory 1.2 UJ 10 0.5 U 150 1,300 24,000 46 J- 31 TL-SE-22-XX Reference Laboratory 1.2 UJ 11 0.5 U 150 1,700 26,000 54 J- 31 TL-SE-27-XX Reference Laboratory 1.2 UJ 10 0.28 J 130 1,500 19,000 51 J- 31 TL-SE-29-XX Reference Laboratory 1.2 UJ 11 0.22 J 140 1,600 23,000 51 J- 31 TL-SE-05-BA Niton LLC XLi < LOD : 42.67 < LOD : 33.14 < LOD : 38.35 < LOD : 275.49 1,763 51,077 69 31 TL-SE-07-BA Niton LLC XLi < LOD : 47.39 < LOD : 32.90 < LOD : 39.23 383 1,740 54,123 71 31 TL-SE-13-BA Niton LLC XLi < LOD : 46.58 < LOD : 33.38 < LOD : 44.07 < LOD : 290.07 1,717 50,090 66 31 TL-SE-16-BA Niton LLC XLi < LOD : 45.95 < LOD : 34.18 < LOD : 41.55 < LOD : 292.00 1,626 50,220 74 31 TL-SE-21-BA Niton LLC XLi < LOD : 42.06 < LOD : 32.87 < LOD : 35.13 < LOD : 287.20 1,721 50,972 68 31 TL-SE-28-BA Niton LLC XLi < LOD : 39.99 < LOD : 31.76 < LOD : 32.43 < LOD : 293.42 1,705 47,127 55 31 TL-SE-30-BA Niton LLC XLi < LOD : 46.41 < LOD : 32.02 < LOD : 33.07 < LOD : 287.28 1,826 52,180 58 32 LV-SE-02-XX Reference Laboratory 1.3 UJ 28 0.51 U 72 33 23,000 20 J- 32 LV-SE-10-XX Reference Laboratory 1.3 UJ 34 0.51 U 84 42 28,000 25 J- 32 LV-SE-22-XX Reference Laboratory 1.3 UJ 30 0.51 U 69 33 23,000 22 J- 32 LV-SE-25-XX Reference Laboratory 1.3 UJ 31 0.51 U 74 36 25,000 23 J- 32 LV-SE-31-XX Reference Laboratory 1.3 UJ 32 0.51 U 78 36 25,000 49 J- 32 LV-SE-35-XX Reference Laboratory 1.3 UJ 31 J- 0.51 U 74 J- 35 24,000 J- 22 J- 32 LV-SE-50-XX Reference Laboratory 2.5 U 29 1 U 74 34 24,000 24 J- 32 LV-SE-02-BA Niton LLC XLi < LOD : 43.98 < LOD : 27.38 < LOD : 36.29 < LOD : 214.92 < LOD : 118.36 28,543 45 32 LV-SE-10-BA Niton LLC XLi < LOD : 47.55 30 < LOD : 40.80 < LOD : 229.72 142 27,382 < LOD : 24.40 32 LV-SE-22-BA Niton LLC XLi < LOD : 49.53 < LOD : 27.21 < LOD : 40.09 < LOD : 221.52 < LOD : 116.78 29,130 30 32 LV-SE-25-BA Niton LLC XLi < LOD : 41.31 30 < LOD : 36.72 < LOD : 206.20 < LOD : 116.58 29,223 36 32 LV-SE-31-BA Niton LLC XLi < LOD : 46.24 33 < LOD : 42.02 < LOD : 229.88 < LOD : 119.19 29,221 35 32 LV-SE-35-BA Niton LLC XLi < LOD : 52.98 < LOD : 28.23 < LOD : 43.27 < LOD : 227.49 < LOD : 115.00 29,040 41 32 LV-SE-50-BA Niton LLC XLi < LOD : 47.83 < LOD : 29.39 < LOD : 39.51 < LOD : 229.92 < LOD : 114.55 29,622 53 33 LV-SE-12-XX Reference Laboratory 2.6 U 190 1 U 55 34 72,000 19 J- 33 LV-SE-26-XX Reference Laboratory 2.6 U 220 1 U 64 39 83,000 25 J- 33 LV-SE-33-XX Reference Laboratory 2.6 U 170 1 U 52 31 66,000 21 J- 33 LV-SE-39-XX Reference Laboratory 2.6 U 190 1 U 58 35 74,000 22 J- 33 LV-SE-42-XX Reference Laboratory 2.7 U 170 1.1 U 50 30 65,000 22 J- 33 LV-SE-01-BA Niton LLC XLi < LOD : 48.35 173 < LOD : 34.67 < LOD : 296.26 < LOD : 135.91 89,700 36 33 LV-SE-06-BA Niton LLC XLi < LOD : 53.19 178 < LOD : 45.32 < LOD : 311.41 < LOD : 137.78 91,587 < LOD : 27.77 33 LV-SE-17-BA Niton LLC XLi < LOD : 54.50 191 < LOD : 44.35 < LOD : 296.77 < LOD : 137.79 91,200 45 33 LV-SE-37-BA Niton LLC XLi < LOD : 56.61 173 < LOD : 39.10 < LOD : 304.09 < LOD : 138.48 93,515 46 33 LV-SE-49-BA Niton LLC XLi < LOD : 47.24 186 < LOD : 46.69 < LOD : 305.50 < LOD : 139.95 89,100 50

D-22
Appendix D. Analytical Data Summary, Niton XLi and Reference Laboratory (Continued) Blend No. Sample ID Source of Data Hg Ni Se Ag V Zn 31 TL-SE-01-XX Reference Laboratory 0.074 U 180 1.2 U 5.7 J- 75 130 31 TL-SE-11-XX Reference Laboratory 0.021 U 210 1.2 U 5.5 J- 85 140 31 TL-SE-14-XX Reference Laboratory 0.08 U 180 1.2 U 5.7 J- 73 140 31 TL-SE-18-XX Reference Laboratory 0.025 U 190 1.2 U 6.3 J- 70 120 31 TL-SE-22-XX Reference Laboratory 0.082 U 210 1.2 U 6.5 J- 80 150 31 TL-SE-27-XX Reference Laboratory 0.02 U 200 1.2 U 7.8 J- 67 140 31 TL-SE-29-XX Reference Laboratory 0.076 U 200 1.2 U 5.9 J- 80 140 31 TL-SE-05-BA Niton LLC XLi < LOD : 24.30 270 < LOD : 19.17 < LOD : 242.15 < LOD : 308.75 172 31 TL-SE-07-BA Niton LLC XLi < LOD : 24.34 300 < LOD : 19.14 < LOD : 233.94 < LOD : 301.73 206 31 TL-SE-13-BA Niton LLC XLi 29 < LOD : 163.25 < LOD : 19.14 < LOD : 230.98 < LOD : 300.05 134 31 TL-SE-16-BA Niton LLC XLi < LOD : 23.79 188 < LOD : 18.78 < LOD : 231.97 < LOD : 313.46 162 31 TL-SE-21-BA Niton LLC XLi < LOD : 23.51 360 < LOD : 19.02 < LOD : 232.46 < LOD : 312.72 182 31 TL-SE-28-BA Niton LLC XLi 24 < LOD : 159.06 < LOD : 18.24 < LOD : 234.40 < LOD : 298.90 194 31 TL-SE-30-BA Niton LLC XLi 46 207 < LOD : 18.31 < LOD : 228.38 < LOD : 308.24 < LOD : 106.47 32 LV-SE-02-XX Reference Laboratory 0.02 U 160 3.8 1.3 UJ 53 65 32 LV-SE-10-XX Reference Laboratory 0.023 U 200 4.7 1.3 UJ 66 77 32 LV-SE-22-XX Reference Laboratory 1.1 170 5.2 1.3 UJ 51 66 32 LV-SE-25-XX Reference Laboratory 1 170 5.1 1.3 UJ 56 70 32 LV-SE-31-XX Reference Laboratory 1 180 5.1 1.3 UJ 58 70 32 LV-SE-35-XX Reference Laboratory 1.4 170 J- 5 1.3 UJ 55 J- 67 J- 32 LV-SE-50-XX Reference Laboratory 1.2 170 3.3 2.5 U 57 65 32 LV-SE-02-BA Niton LLC XLi < LOD : 19.07 < LOD : 133.93 < LOD : 15.78 < LOD : 234.64 < LOD : 314.39 106 32 LV-SE-10-BA Niton LLC XLi < LOD : 18.90 165 < LOD : 15.96 < LOD : 249.40 < LOD : 312.21 < LOD : 80.37 32 LV-SE-22-BA Niton LLC XLi 33 < LOD : 131.56 < LOD : 16.70 < LOD : 241.28 < LOD : 315.92 106 32 LV-SE-25-BA Niton LLC XLi 26 214 < LOD : 16.55 < LOD : 234.58 < LOD : 315.90 99 32 LV-SE-31-BA Niton LLC XLi 23 155 < LOD : 16.19 < LOD : 237.04 < LOD : 312.95 < LOD : 81.67 32 LV-SE-35-BA Niton LLC XLi < LOD : 19.36 < LOD : 130.60 26 < LOD : 247.70 < LOD : 314.82 < LOD : 81.69 32 LV-SE-50-BA Niton LLC XLi < LOD : 20.66 158 < LOD : 16.63 < LOD : 236.02 < LOD : 310.12 < LOD : 82.41 33 LV-SE-12-XX Reference Laboratory 5.6 71 3 2.6 U 72 66 33 LV-SE-26-XX Reference Laboratory 6 83 6.1 2.6 U 86 75 33 LV-SE-33-XX Reference Laboratory 6.8 66 2.8 2.6 U 67 59 33 LV-SE-39-XX Reference Laboratory 8 74 5.1 2.6 U 74 66 33 LV-SE-42-XX Reference Laboratory 4.3 67 3.4 2.7 U 64 57 33 LV-SE-01-BA Niton LLC XLi < LOD : 23.17 < LOD : 166.93 < LOD : 18.99 < LOD : 256.36 < LOD : 320.02 < LOD : 97.28 33 LV-SE-06-BA Niton LLC XLi < LOD : 23.09 < LOD : 155.67 < LOD : 18.81 < LOD : 259.37 < LOD : 319.90 < LOD : 96.31 33 LV-SE-17-BA Niton LLC XLi < LOD : 21.93 210 < LOD : 18.40 < LOD : 256.46 < LOD : 313.98 < LOD : 96.20 33 LV-SE-37-BA Niton LLC XLi < LOD : 22.92 < LOD : 156.50 < LOD : 18.76 < LOD : 259.89 < LOD : 323.68 < LOD : 98.72 33 LV-SE-49-BA Niton LLC XLi < LOD : 22.80 < LOD : 159.50 < LOD : 18.36 < LOD : 258.87 < LOD : 313.30 < LOD : 98.82

D-23
Appendix D. Analytical Data Summary, Niton XLi and Reference Laboratory (Continued)
Blend No. Sample ID Source of Data Sb As Cd Cr Cu Fe Pb 34 LV-SE-09-XX Reference Laboratory 6.7 U 450 2.7 U 48 34 150,000 14 J- 34 LV-SE-19-XX Reference Laboratory 6.7 U 500 2.7 U 55 37 160,000 17 J- 34 LV-SE-27-XX Reference Laboratory 6.7 U 530 2.7 U 56 39 180,000 16 J- 34 LV-SE-36-XX Reference Laboratory 6.7 U 550 2.7 U 60 40 180,000 21 J- 34 LV-SE-38-XX Reference Laboratory 6.7 U 480 2.7 U 52 36 160,000 15 J- 34 LV-SE-03-BA Niton LLC XLi < LOD : 60.54 424 < LOD : 36.80 < LOD : 502.99 < LOD : 189.15 182,700 57 34 LV-SE-11-BA Niton LLC XLi < LOD : 52.64 482 < LOD : 40.72 < LOD : 524.94 < LOD : 188.41 179,500 42 34 LV-SE-24-BA Niton LLC XLi < LOD : 51.32 468 < LOD : 42.93 < LOD : 502.32 < LOD : 189.54 182,400 50 34 LV-SE-32-BA Niton LLC XLi < LOD : 53.13 464 < LOD : 43.30 < LOD : 510.52 < LOD : 187.89 177,400 < LOD : 31.17 34 LV-SE-42-BA Niton LLC XLi < LOD : 49.75 468 < LOD : 51.88 < LOD : 503.34 < LOD : 190.01 176,700 < LOD : 34.20 35 LV-SE-07-XX Reference Laboratory 6.7 UJ 780 2.7 U 57 48 200,000 11 35 LV-SE-18-XX Reference Laboratory 6.7 UJ 800 2.7 U 61 49 210,000 11 35 LV-SE-23-XX Reference Laboratory 6.6 UJ 660 2.6 U 53 40 170,000 8 35 LV-SE-45-XX Reference Laboratory 6.7 UJ 650 2.7 U 50 40 170,000 8 35 LV-SE-48-XX Reference Laboratory 6.6 UJ 680 2.6 U 52 42 180,000 9 35 LV-SE-07-BA Niton LLC XLi < LOD : 57.03 710 < LOD : 39.51 < LOD : 598.82 < LOD : 217.47 222,000 41 35 LV-SE-18-BA Niton LLC XLi < LOD : 60.63 640 < LOD : 45.66 < LOD : 583.12 < LOD : 211.67 230,900 35 35 LV-SE-23-BA Niton LLC XLi < LOD : 56.85 751 < LOD : 48.26 < LOD : 630.01 < LOD : 211.70 222,300 < LOD : 34.83 35 LV-SE-45-BA Niton LLC XLi < LOD : 46.02 797 < LOD : 39.19 < LOD : 642.19 < LOD : 225.04 225,800 < LOD : 35.38 35 LV-SE-48-BA Niton LLC XLi < LOD : 60.28 713 < LOD : 49.92 < LOD : 632.94 < LOD : 221.57 233,400 < LOD : 35.30 36 LV-SE-01-XX Reference Laboratory 1.5 UJ 6 0.76 4 18 1,100 17 36 LV-SE-14-XX Reference Laboratory 1.5 UJ 5 0.74 4 16 980 14 36 LV-SE-21-XX Reference Laboratory 1.5 UJ 7 0.84 4 19 970 18 36 LV-SE-24-XX Reference Laboratory 1.5 UJ 5 0.68 4 15 840 14 36 LV-SE-32-XX Reference Laboratory 1.4 UJ 6 0.87 4 16 860 14 36 LV-SE-05-BA Niton LLC XLi < LOD : 52.15 < LOD : 26.89 < LOD : 39.46 < LOD : 212.13 < LOD : 140.26 770 < LOD : 26.77 36 LV-SE-19-BA Niton LLC XLi < LOD : 57.20 < LOD : 27.64 < LOD : 43.96 < LOD : 227.43 < LOD : 143.32 938 < LOD : 29.21 36 LV-SE-27-BA Niton LLC XLi < LOD : 44.96 < LOD : 25.20 < LOD : 49.57 < LOD : 220.27 < LOD : 143.03 672 < LOD : 27.01 36 LV-SE-39-BA Niton LLC XLi < LOD : 50.01 < LOD : 25.87 < LOD : 40.91 < LOD : 218.51 < LOD : 137.98 655 < LOD : 25.51 36 LV-SE-51-BA Niton LLC XLi < LOD : 55.33 < LOD : 27.15 < LOD : 47.65 < LOD : 229.43 < LOD : 140.42 563 < LOD : 26.51
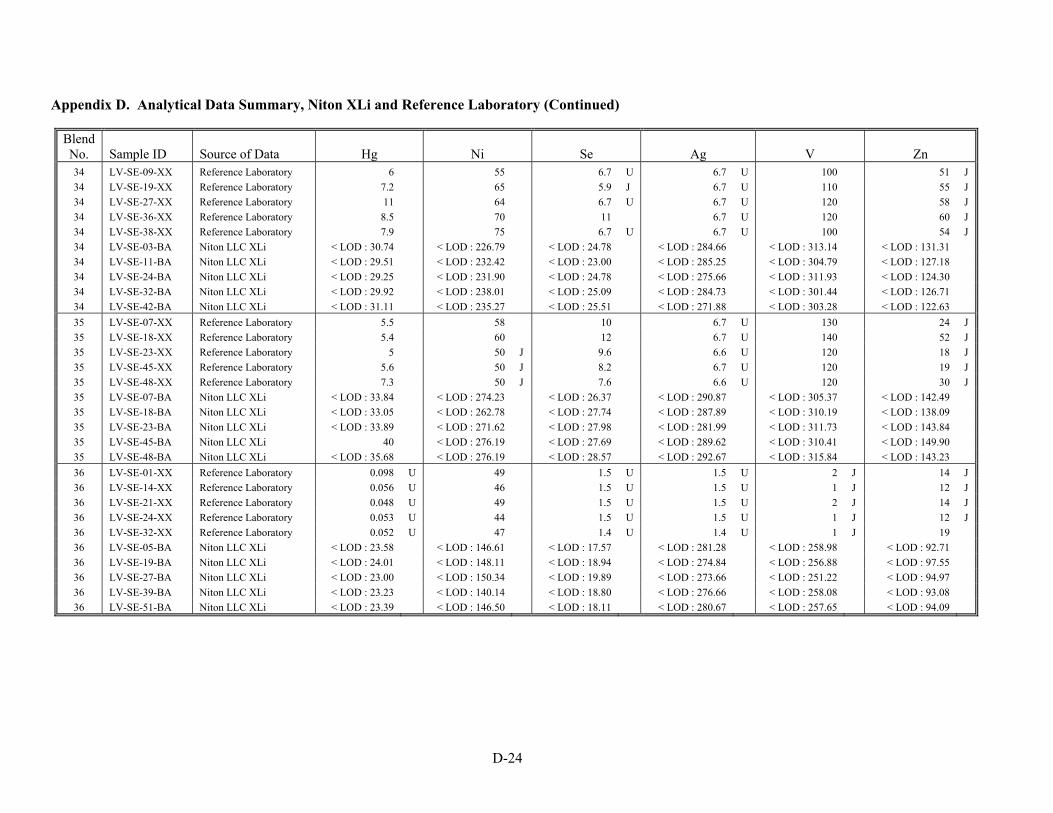
D-24
Appendix D. Analytical Data Summary, Niton XLi and Reference Laboratory (Continued) Blend No. Sample ID Source of Data Hg Ni Se Ag V Zn 34 LV-SE-09-XX Reference Laboratory 6 55 6.7 U 6.7 U 100 51 J 34 LV-SE-19-XX Reference Laboratory 7.2 65 5.9 J 6.7 U 110 55 J 34 LV-SE-27-XX Reference Laboratory 11 64 6.7 U 6.7 U 120 58 J 34 LV-SE-36-XX Reference Laboratory 8.5 70 11 6.7 U 120 60 J 34 LV-SE-38-XX Reference Laboratory 7.9 75 6.7 U 6.7 U 100 54 J 34 LV-SE-03-BA Niton LLC XLi < LOD : 30.74 < LOD : 226.79 < LOD : 24.78 < LOD : 284.66 < LOD : 313.14 < LOD : 131.31 34 LV-SE-11-BA Niton LLC XLi < LOD : 29.51 < LOD : 232.42 < LOD : 23.00 < LOD : 285.25 < LOD : 304.79 < LOD : 127.18 34 LV-SE-24-BA Niton LLC XLi < LOD : 29.25 < LOD : 231.90 < LOD : 24.78 < LOD : 275.66 < LOD : 311.93 < LOD : 124.30 34 LV-SE-32-BA Niton LLC XLi < LOD : 29.92 < LOD : 238.01 < LOD : 25.09 < LOD : 284.73 < LOD : 301.44 < LOD : 126.71 34 LV-SE-42-BA Niton LLC XLi < LOD : 31.11 < LOD : 235.27 < LOD : 25.51 < LOD : 271.88 < LOD : 303.28 < LOD : 122.63 35 LV-SE-07-XX Reference Laboratory 5.5 58 10 6.7 U 130 24 J 35 LV-SE-18-XX Reference Laboratory 5.4 60 12 6.7 U 140 52 J 35 LV-SE-23-XX Reference Laboratory 5 50 J 9.6 6.6 U 120 18 J 35 LV-SE-45-XX Reference Laboratory 5.6 50 J 8.2 6.7 U 120 19 J 35 LV-SE-48-XX Reference Laboratory 7.3 50 J 7.6 6.6 U 120 30 J 35 LV-SE-07-BA Niton LLC XLi < LOD : 33.84 < LOD : 274.23 < LOD : 26.37 < LOD : 290.87 < LOD : 305.37 < LOD : 142.49 35 LV-SE-18-BA Niton LLC XLi < LOD : 33.05 < LOD : 262.78 < LOD : 27.74 < LOD : 287.89 < LOD : 310.19 < LOD : 138.09 35 LV-SE-23-BA Niton LLC XLi < LOD : 33.89 < LOD : 271.62 < LOD : 27.98 < LOD : 281.99 < LOD : 311.73 < LOD : 143.84 35 LV-SE-45-BA Niton LLC XLi 40 < LOD : 276.19 < LOD : 27.69 < LOD : 289.62 < LOD : 310.41 < LOD : 149.90 35 LV-SE-48-BA Niton LLC XLi < LOD : 35.68 < LOD : 276.19 < LOD : 28.57 < LOD : 292.67 < LOD : 315.84 < LOD : 143.23 36 LV-SE-01-XX Reference Laboratory 0.098 U 49 1.5 U 1.5 U 2 J 14 J 36 LV-SE-14-XX Reference Laboratory 0.056 U 46 1.5 U 1.5 U 1 J 12 J 36 LV-SE-21-XX Reference Laboratory 0.048 U 49 1.5 U 1.5 U 2 J 14 J 36 LV-SE-24-XX Reference Laboratory 0.053 U 44 1.5 U 1.5 U 1 J 12 J 36 LV-SE-32-XX Reference Laboratory 0.052 U 47 1.4 U 1.4 U 1 J 19 36 LV-SE-05-BA Niton LLC XLi < LOD : 23.58 < LOD : 146.61 < LOD : 17.57 < LOD : 281.28 < LOD : 258.98 < LOD : 92.71 36 LV-SE-19-BA Niton LLC XLi < LOD : 24.01 < LOD : 148.11 < LOD : 18.94 < LOD : 274.84 < LOD : 256.88 < LOD : 97.55 36 LV-SE-27-BA Niton LLC XLi < LOD : 23.00 < LOD : 150.34 < LOD : 19.89 < LOD : 273.66 < LOD : 251.22 < LOD : 94.97 36 LV-SE-39-BA Niton LLC XLi < LOD : 23.23 < LOD : 140.14 < LOD : 18.80 < LOD : 276.66 < LOD : 258.08 < LOD : 93.08 36 LV-SE-51-BA Niton LLC XLi < LOD : 23.39 < LOD : 146.50 < LOD : 18.11 < LOD : 280.67 < LOD : 257.65 < LOD : 94.09
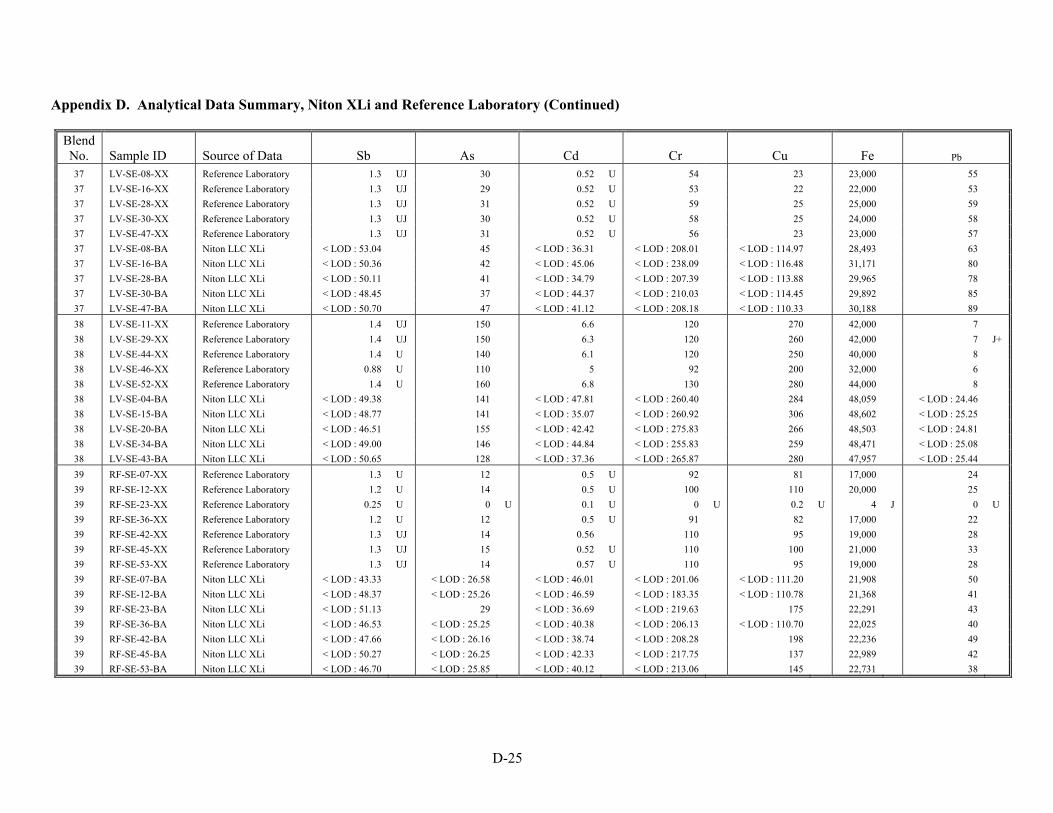
D-25
Appendix D. Analytical Data Summary, Niton XLi and Reference Laboratory (Continued) Blend No. Sample ID Source of Data Sb As Cd Cr Cu Fe Pb
37 LV-SE-08-XX Reference Laboratory 1.3 UJ 30 0.52 U 54 23 23,000 55 37 LV-SE-16-XX Reference Laboratory 1.3 UJ 29 0.52 U 53 22 22,000 53 37 LV-SE-28-XX Reference Laboratory 1.3 UJ 31 0.52 U 59 25 25,000 59 37 LV-SE-30-XX Reference Laboratory 1.3 UJ 30 0.52 U 58 25 24,000 58 37 LV-SE-47-XX Reference Laboratory 1.3 UJ 31 0.52 U 56 23 23,000 57 37 LV-SE-08-BA Niton LLC XLi < LOD : 53.04 45 < LOD : 36.31 < LOD : 208.01 < LOD : 114.97 28,493 63 37 LV-SE-16-BA Niton LLC XLi < LOD : 50.36 42 < LOD : 45.06 < LOD : 238.09 < LOD : 116.48 31,171 80 37 LV-SE-28-BA Niton LLC XLi < LOD : 50.11 41 < LOD : 34.79 < LOD : 207.39 < LOD : 113.88 29,965 78 37 LV-SE-30-BA Niton LLC XLi < LOD : 48.45 37 < LOD : 44.37 < LOD : 210.03 < LOD : 114.45 29,892 85 37 LV-SE-47-BA Niton LLC XLi < LOD : 50.70 47 < LOD : 41.12 < LOD : 208.18 < LOD : 110.33 30,188 89 38 LV-SE-11-XX Reference Laboratory 1.4 UJ 150 6.6 120 270 42,000 7 38 LV-SE-29-XX Reference Laboratory 1.4 UJ 150 6.3 120 260 42,000 7 J+ 38 LV-SE-44-XX Reference Laboratory 1.4 U 140 6.1 120 250 40,000 8 38 LV-SE-46-XX Reference Laboratory 0.88 U 110 5 92 200 32,000 6 38 LV-SE-52-XX Reference Laboratory 1.4 U 160 6.8 130 280 44,000 8 38 LV-SE-04-BA Niton LLC XLi < LOD : 49.38 141 < LOD : 47.81 < LOD : 260.40 284 48,059 < LOD : 24.46 38 LV-SE-15-BA Niton LLC XLi < LOD : 48.77 141 < LOD : 35.07 < LOD : 260.92 306 48,602 < LOD : 25.25 38 LV-SE-20-BA Niton LLC XLi < LOD : 46.51 155 < LOD : 42.42 < LOD : 275.83 266 48,503 < LOD : 24.81 38 LV-SE-34-BA Niton LLC XLi < LOD : 49.00 146 < LOD : 44.84 < LOD : 255.83 259 48,471 < LOD : 25.08 38 LV-SE-43-BA Niton LLC XLi < LOD : 50.65 128 < LOD : 37.36 < LOD : 265.87 280 47,957 < LOD : 25.44 39 RF-SE-07-XX Reference Laboratory 1.3 U 12 0.5 U 92 81 17,000 24 39 RF-SE-12-XX Reference Laboratory 1.2 U 14 0.5 U 100 110 20,000 25 39 RF-SE-23-XX Reference Laboratory 0.25 U 0 U 0.1 U 0 U 0.2 U 4 J 0 U 39 RF-SE-36-XX Reference Laboratory 1.2 U 12 0.5 U 91 82 17,000 22 39 RF-SE-42-XX Reference Laboratory 1.3 UJ 14 0.56 110 95 19,000 28 39 RF-SE-45-XX Reference Laboratory 1.3 UJ 15 0.52 U 110 100 21,000 33 39 RF-SE-53-XX Reference Laboratory 1.3 UJ 14 0.57 U 110 95 19,000 28 39 RF-SE-07-BA Niton LLC XLi < LOD : 43.33 < LOD : 26.58 < LOD : 46.01 < LOD : 201.06 < LOD : 111.20 21,908 50 39 RF-SE-12-BA Niton LLC XLi < LOD : 48.37 < LOD : 25.26 < LOD : 46.59 < LOD : 183.35 < LOD : 110.78 21,368 41 39 RF-SE-23-BA Niton LLC XLi < LOD : 51.13 29 < LOD : 36.69 < LOD : 219.63 175 22,291 43 39 RF-SE-36-BA Niton LLC XLi < LOD : 46.53 < LOD : 25.25 < LOD : 40.38 < LOD : 206.13 < LOD : 110.70 22,025 40 39 RF-SE-42-BA Niton LLC XLi < LOD : 47.66 < LOD : 26.16 < LOD : 38.74 < LOD : 208.28 198 22,236 49 39 RF-SE-45-BA Niton LLC XLi < LOD : 50.27 < LOD : 26.25 < LOD : 42.33 < LOD : 217.75 137 22,989 42 39 RF-SE-53-BA Niton LLC XLi < LOD : 46.70 < LOD : 25.85 < LOD : 40.12 < LOD : 213.06 145 22,731 38
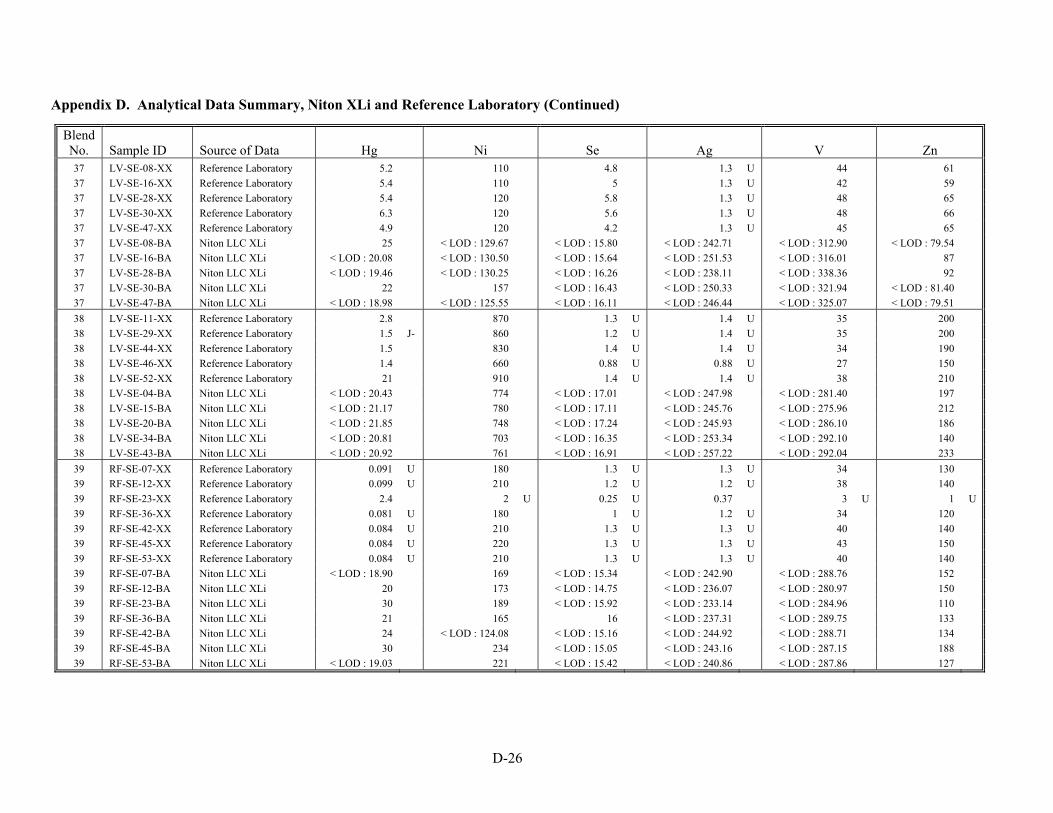
D-26
Appendix D. Analytical Data Summary, Niton XLi and Reference Laboratory (Continued)
Blend No. Sample ID Source of Data Hg Ni Se Ag V Zn 37 LV-SE-08-XX Reference Laboratory 5.2 110 4.8 1.3 U 44 61 37 LV-SE-16-XX Reference Laboratory 5.4 110 5 1.3 U 42 59 37 LV-SE-28-XX Reference Laboratory 5.4 120 5.8 1.3 U 48 65 37 LV-SE-30-XX Reference Laboratory 6.3 120 5.6 1.3 U 48 66 37 LV-SE-47-XX Reference Laboratory 4.9 120 4.2 1.3 U 45 65 37 LV-SE-08-BA Niton LLC XLi 25 < LOD : 129.67 < LOD : 15.80 < LOD : 242.71 < LOD : 312.90 < LOD : 79.54 37 LV-SE-16-BA Niton LLC XLi < LOD : 20.08 < LOD : 130.50 < LOD : 15.64 < LOD : 251.53 < LOD : 316.01 87 37 LV-SE-28-BA Niton LLC XLi < LOD : 19.46 < LOD : 130.25 < LOD : 16.26 < LOD : 238.11 < LOD : 338.36 92 37 LV-SE-30-BA Niton LLC XLi 22 157 < LOD : 16.43 < LOD : 250.33 < LOD : 321.94 < LOD : 81.40 37 LV-SE-47-BA Niton LLC XLi < LOD : 18.98 < LOD : 125.55 < LOD : 16.11 < LOD : 246.44 < LOD : 325.07 < LOD : 79.51 38 LV-SE-11-XX Reference Laboratory 2.8 870 1.3 U 1.4 U 35 200 38 LV-SE-29-XX Reference Laboratory 1.5 J- 860 1.2 U 1.4 U 35 200 38 LV-SE-44-XX Reference Laboratory 1.5 830 1.4 U 1.4 U 34 190 38 LV-SE-46-XX Reference Laboratory 1.4 660 0.88 U 0.88 U 27 150 38 LV-SE-52-XX Reference Laboratory 21 910 1.4 U 1.4 U 38 210 38 LV-SE-04-BA Niton LLC XLi < LOD : 20.43 774 < LOD : 17.01 < LOD : 247.98 < LOD : 281.40 197 38 LV-SE-15-BA Niton LLC XLi < LOD : 21.17 780 < LOD : 17.11 < LOD : 245.76 < LOD : 275.96 212 38 LV-SE-20-BA Niton LLC XLi < LOD : 21.85 748 < LOD : 17.24 < LOD : 245.93 < LOD : 286.10 186 38 LV-SE-34-BA Niton LLC XLi < LOD : 20.81 703 < LOD : 16.35 < LOD : 253.34 < LOD : 292.10 140 38 LV-SE-43-BA Niton LLC XLi < LOD : 20.92 761 < LOD : 16.91 < LOD : 257.22 < LOD : 292.04 233 39 RF-SE-07-XX Reference Laboratory 0.091 U 180 1.3 U 1.3 U 34 130 39 RF-SE-12-XX Reference Laboratory 0.099 U 210 1.2 U 1.2 U 38 140 39 RF-SE-23-XX Reference Laboratory 2.4 2 U 0.25 U 0.37 3 U 1 U 39 RF-SE-36-XX Reference Laboratory 0.081 U 180 1 U 1.2 U 34 120 39 RF-SE-42-XX Reference Laboratory 0.084 U 210 1.3 U 1.3 U 40 140 39 RF-SE-45-XX Reference Laboratory 0.084 U 220 1.3 U 1.3 U 43 150 39 RF-SE-53-XX Reference Laboratory 0.084 U 210 1.3 U 1.3 U 40 140 39 RF-SE-07-BA Niton LLC XLi < LOD : 18.90 169 < LOD : 15.34 < LOD : 242.90 < LOD : 288.76 152 39 RF-SE-12-BA Niton LLC XLi 20 173 < LOD : 14.75 < LOD : 236.07 < LOD : 280.97 150 39 RF-SE-23-BA Niton LLC XLi 30 189 < LOD : 15.92 < LOD : 233.14 < LOD : 284.96 110 39 RF-SE-36-BA Niton LLC XLi 21 165 16 < LOD : 237.31 < LOD : 289.75 133 39 RF-SE-42-BA Niton LLC XLi 24 < LOD : 124.08 < LOD : 15.16 < LOD : 244.92 < LOD : 288.71 134 39 RF-SE-45-BA Niton LLC XLi 30 234 < LOD : 15.05 < LOD : 243.16 < LOD : 287.15 188 39 RF-SE-53-BA Niton LLC XLi < LOD : 19.03 221 < LOD : 15.42 < LOD : 240.86 < LOD : 287.86 127

D-27
Appendix D. Analytical Data Summary, Niton XLi and Reference Laboratory (Continued)
Blend No. Sample ID Source of Data Sb As Cd Cr Cu Fe Pb 40 RF-SE-03-XX Reference Laboratory 1.2 UJ 27 1.3 93 200 17,000 88 40 RF-SE-28-XX Reference Laboratory 1.2 UJ 31 1.5 100 220 18,000 99 40 RF-SE-38-XX Reference Laboratory 1.2 UJ 27 1.2 90 190 16,000 83 40 RF-SE-49-XX Reference Laboratory 1.2 UJ 31 1.5 100 220 18,000 97 40 RF-SE-55-XX Reference Laboratory 1.2 UJ 24 1.1 91 180 15,000 75 40 RF-SE-08-BA Niton LLC XLi < LOD : 47.78 < LOD : 31.74 < LOD : 40.15 < LOD : 197.55 257 20,872 108 40 RF-SE-15-BA Niton LLC XLi < LOD : 45.51 42 < LOD : 37.59 < LOD : 196.04 235 20,918 94 40 RF-SE-32-BA Niton LLC XLi < LOD : 45.17 < LOD : 31.38 < LOD : 35.51 < LOD : 205.36 216 20,368 100 40 RF-SE-44-BA Niton LLC XLi < LOD : 43.86 < LOD : 32.19 < LOD : 41.65 < LOD : 200.41 357 20,767 112 40 RF-SE-51-BA Niton LLC XLi < LOD : 48.23 33 < LOD : 37.86 < LOD : 207.46 244 21,845 98 41 RF-SE-06-XX Reference Laboratory 1.3 UJ 70 3.6 90 490 20,000 230 41 RF-SE-13-XX Reference Laboratory 1.3 UJ 76 3.7 92 530 21,000 230 41 RF-SE-27-XX Reference Laboratory 1.3 UJ 64 3.1 78 440 18,000 200 41 RF-SE-31-XX Reference Laboratory 1.3 UJ 39 1.8 63 250 12,000 120 41 RF-SE-58-XX Reference Laboratory 1.3 UJ 71 3.6 89 500 21,000 230 41 RF-SE-02-BA Niton LLC XLi < LOD : 43.57 100 < LOD : 39.41 < LOD : 208.92 553 22,580 245 41 RF-SE-18-BA Niton LLC XLi < LOD : 42.71 109 < LOD : 36.14 < LOD : 192.78 585 23,021 226 41 RF-SE-22-BA Niton LLC XLi < LOD : 46.54 58 < LOD : 42.16 < LOD : 196.76 544 22,427 257 41 RF-SE-38-BA Niton LLC XLi < LOD : 47.98 79 < LOD : 40.36 < LOD : 201.59 498 23,480 220 41 RF-SE-48-BA Niton LLC XLi < LOD : 53.49 78 < LOD : 37.77 < LOD : 208.50 534 23,456 266 42 RF-SE-02-XX Reference Laboratory 1.3 UJ 110 5.4 93 740 24,000 330 42 RF-SE-22-XX Reference Laboratory 1.3 UJ 99 4.7 84 670 22,000 300 42 RF-SE-25-XX Reference Laboratory 1.3 UJ 88 4 78 580 19,000 270 42 RF-SE-30-XX Reference Laboratory 1.3 UJ 89 4.3 78 610 21,000 290 42 RF-SE-57-XX Reference Laboratory 1.3 UJ 89 4.5 79 610 21,000 300 42 RF-SE-09-BA Niton LLC XLi < LOD : 48.08 83 < LOD : 34.67 < LOD : 199.61 650 23,584 283 42 RF-SE-17-BA Niton LLC XLi < LOD : 44.49 93 < LOD : 41.59 240 690 23,085 345 42 RF-SE-28-BA Niton LLC XLi < LOD : 41.67 101 < LOD : 34.44 < LOD : 212.70 676 23,374 280 42 RF-SE-40-BA Niton LLC XLi < LOD : 46.54 90 < LOD : 39.51 < LOD : 222.40 659 24,309 333 42 RF-SE-50-BA Niton LLC XLi < LOD : 47.06 89 < LOD : 33.44 < LOD : 209.80 719 24,055 302

D-28
Appendix D. Analytical Data Summary, Niton XLi and Reference Laboratory (Continued)
Blend No. Sample ID Source of Data Hg Ni Se Ag V Zn 40 RF-SE-03-XX Reference Laboratory 0.48 150 1.2 U 1.2 U 40 300 40 RF-SE-28-XX Reference Laboratory 0.57 160 1.2 U 1.2 U 44 320 40 RF-SE-38-XX Reference Laboratory 0.41 140 1.2 U 1.2 U 39 300 40 RF-SE-49-XX Reference Laboratory 0.43 170 1.2 U 1.2 U 43 330 40 RF-SE-55-XX Reference Laboratory 0.42 140 1.2 U 1.2 U 35 280 40 RF-SE-08-BA Niton LLC XLi 23 123 < LOD : 15.07 < LOD : 231.29 < LOD : 286.04 296 40 RF-SE-15-BA Niton LLC XLi 29 128 < LOD : 15.51 < LOD : 235.71 < LOD : 290.96 373 40 RF-SE-32-BA Niton LLC XLi 26 166 < LOD : 15.69 < LOD : 230.38 < LOD : 305.81 341 40 RF-SE-44-BA Niton LLC XLi < LOD : 18.73 < LOD : 121.56 < LOD : 15.37 < LOD : 233.18 < LOD : 283.23 349 40 RF-SE-51-BA Niton LLC XLi < LOD : 18.95 172 < LOD : 14.87 < LOD : 226.21 < LOD : 290.57 329 41 RF-SE-06-XX Reference Laboratory 1.1 150 1.3 U 1.3 U 44 740 41 RF-SE-13-XX Reference Laboratory 1.2 160 1.3 U 1.3 45 790 41 RF-SE-27-XX Reference Laboratory 1.2 130 1.3 U 1.3 U 39 670 41 RF-SE-31-XX Reference Laboratory 1.1 86 1.3 U 1.3 U 28 420 41 RF-SE-58-XX Reference Laboratory 1.2 150 1.3 U 1.3 U 46 770 41 RF-SE-02-BA Niton LLC XLi 23 199 19 < LOD : 222.07 < LOD : 284.38 775 41 RF-SE-18-BA Niton LLC XLi 23 136 < LOD : 16.21 < LOD : 229.24 < LOD : 289.69 754 41 RF-SE-22-BA Niton LLC XLi 23 135 < LOD : 14.69 < LOD : 238.29 < LOD : 288.67 799 41 RF-SE-38-BA Niton LLC XLi 22 236 < LOD : 15.65 < LOD : 228.74 < LOD : 294.24 702 41 RF-SE-48-BA Niton LLC XLi < LOD : 19.42 < LOD : 125.28 < LOD : 15.95 < LOD : 232.06 < LOD : 285.99 664 42 RF-SE-02-XX Reference Laboratory 1.6 180 1.3 U 2.7 50 1,100 42 RF-SE-22-XX Reference Laboratory 1.7 160 1.3 U 2.3 44 990 42 RF-SE-25-XX Reference Laboratory 1.5 140 1.5 1.7 40 890 42 RF-SE-30-XX Reference Laboratory 1.5 150 1.3 U 1.9 44 960 42 RF-SE-57-XX Reference Laboratory 1.5 150 2 2.2 44 1,000 42 RF-SE-09-BA Niton LLC XLi 32 162 < LOD : 14.74 < LOD : 232.33 < LOD : 290.94 894 42 RF-SE-17-BA Niton LLC XLi < LOD : 19.73 134 < LOD : 15.51 < LOD : 238.07 < LOD : 285.28 992 42 RF-SE-28-BA Niton LLC XLi 30 146 < LOD : 16.13 < LOD : 237.47 < LOD : 281.87 952 42 RF-SE-40-BA Niton LLC XLi 23 144 < LOD : 15.45 < LOD : 242.94 < LOD : 295.35 913 42 RF-SE-50-BA Niton LLC XLi 22 < LOD : 128.99 < LOD : 15.87 < LOD : 242.52 < LOD : 290.04 910

D-29
Appendix D. Analytical Data Summary, Niton XLi and Reference Laboratory (Continued) Blend No. Sample ID Source of Data Sb As Cd Cr Cu Fe Pb 43 RF-SE-15-XX Reference Laboratory 1.3 UJ 120 6.2 72 820 23,000 390 43 RF-SE-24-XX Reference Laboratory 1.3 UJ 130 J+ 6.5 J+ 74 J+ 860 J+ 24,000 J+ 410 J+ 43 RF-SE-32-XX Reference Laboratory 1.3 UJ 120 5.1 64 770 20,000 330 43 RF-SE-43-XX Reference Laboratory 1.3 UJ 130 5.7 68 840 22,000 350 43 RF-SE-59-XX Reference Laboratory 1.3 UJ 140 5.9 73 890 23,000 380 43 RF-SE-03-BA Niton LLC XLi < LOD : 48.53 152 < LOD : 42.51 < LOD : 214.61 1,002 25,677 430 43 RF-SE-16-BA Niton LLC XLi < LOD : 50.87 139 < LOD : 40.85 < LOD : 205.97 903 26,443 395 43 RF-SE-27-BA Niton LLC XLi < LOD : 45.13 157 < LOD : 44.42 < LOD : 213.30 827 24,200 384 43 RF-SE-35-BA Niton LLC XLi < LOD : 47.27 163 < LOD : 39.59 < LOD : 210.68 936 24,558 395 43 RF-SE-54-BA Niton LLC XLi < LOD : 45.81 115 < LOD : 37.20 < LOD : 204.35 977 25,394 450 44 RF-SE-05-XX Reference Laboratory 4.1 J+ 160 9.1 69 1,000 26,000 450 44 RF-SE-26-XX Reference Laboratory 2.2 J+ 140 8.4 64 990 23,000 440 44 RF-SE-39-XX Reference Laboratory 2.9 J+ 160 9.3 73 1,100 26,000 490 44 RF-SE-44-XX Reference Laboratory 2.7 J+ 140 8.2 64 970 24,000 420 44 RF-SE-56-XX Reference Laboratory 3.5 J+ 180 9.6 75 1200 27,000 490 44 RF-SE-01-BA Niton LLC XLi < LOD : 52.76 155 < LOD : 43.33 < LOD : 216.85 1,133 26,901 462 44 RF-SE-11-BA Niton LLC XLi < LOD : 45.62 170 < LOD : 44.01 < LOD : 231.49 1,053 26,425 412 44 RF-SE-20-BA Niton LLC XLi < LOD : 44.97 118 < LOD : 37.86 < LOD : 212.98 1,251 27,894 473 44 RF-SE-33-BA Niton LLC XLi < LOD : 42.43 146 < LOD : 43.05 < LOD : 225.96 1,181 27,221 492 44 RF-SE-59-BA Niton LLC XLi < LOD : 49.13 128 < LOD : 42.28 < LOD : 225.64 1,214 27,697 486 45 RF-SE-04-XX Reference Laboratory 3.2 J+ 230 12 42 1,500 27,000 730 45 RF-SE-14-XX Reference Laboratory 4.4 J+ 260 12 47 1,700 30,000 800 45 RF-SE-19-XX Reference Laboratory 3.7 J+ 250 13 48 1,700 30,000 800 45 RF-SE-34-XX Reference Laboratory 2.9 J+ 210 10 39 1,400 24,000 660 45 RF-SE-52-XX Reference Laboratory 3.4 J+ 220 11 42 1,500 26,000 720 45 RF-SE-04-BA Niton LLC XLi < LOD : 50.53 232 < LOD : 44.02 < LOD : 229.77 1,724 29,392 706 45 RF-SE-14-BA Niton LLC XLi < LOD : 49.40 221 < LOD : 48.07 < LOD : 231.52 1,470 28,183 727 45 RF-SE-19-BA Niton LLC XLi < LOD : 46.37 206 < LOD : 46.30 < LOD : 206.02 1,553 29,234 769 45 RF-SE-34-BA Niton LLC XLi < LOD : 49.89 223 < LOD : 41.01 < LOD : 218.27 1,538 27,367 679 45 RF-SE-52-BA Niton LLC XLi < LOD : 48.15 233 < LOD : 38.86 < LOD : 222.64 1,494 28,127 700 46 BN-SO-11-XX Reference Laboratory 4 J- 2,900 720 820 120 23,000 56 46 BN-SO-14-XX Reference Laboratory 3.5 J- 2,800 690 800 120 22,000 51 46 BN-SO-23-XX Reference Laboratory 1.2 UJ 2,800 700 800 120 23,000 52 46 BN-SO-04-BA Niton LLC XLi < LOD : 70.02 3,307 860 683 267 27,241 71 46 BN-SO-12-BA Niton LLC XLi < LOD : 70.79 3,291 839 541 < LOD : 146.04 27,683 80 46 BN-SO-24-BA Niton LLC XLi < LOD : 70.95 3,266 875 835 < LOD : 141.72 28,450 58
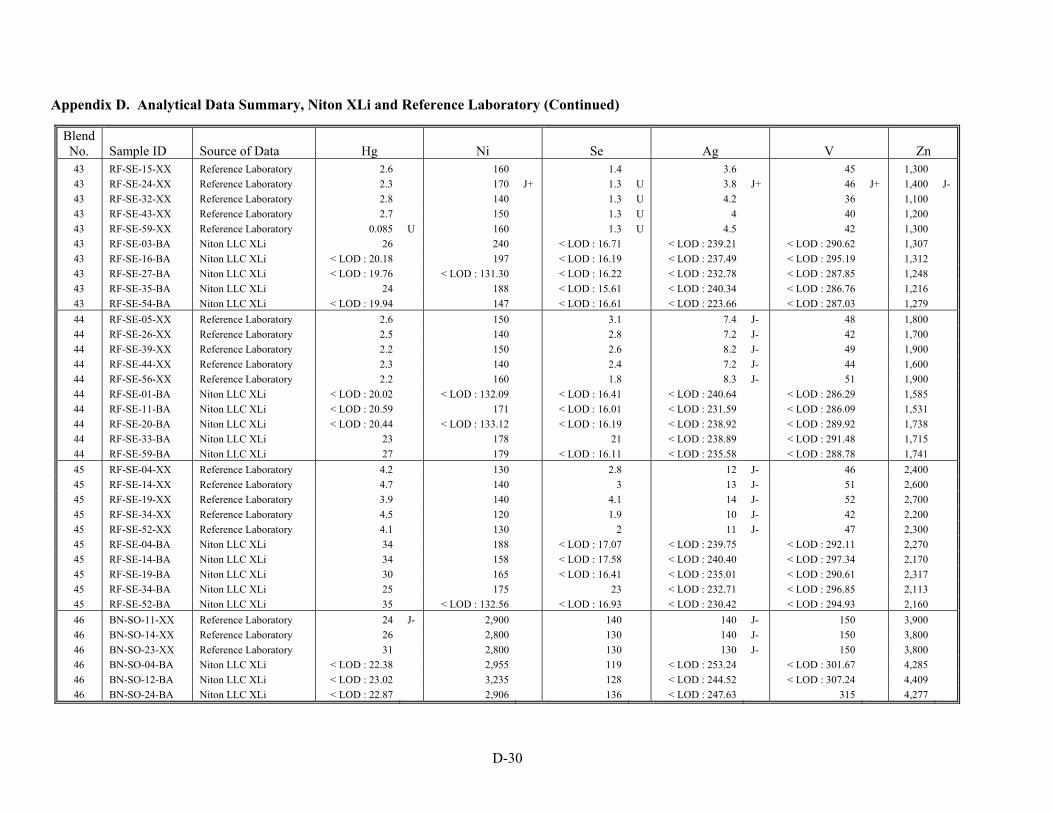
D-30
Appendix D. Analytical Data Summary, Niton XLi and Reference Laboratory (Continued)
Blend No. Sample ID Source of Data Hg Ni Se Ag V Zn 43 RF-SE-15-XX Reference Laboratory 2.6 160 1.4 3.6 45 1,300 43 RF-SE-24-XX Reference Laboratory 2.3 170 J+ 1.3 U 3.8 J+ 46 J+ 1,400 J- 43 RF-SE-32-XX Reference Laboratory 2.8 140 1.3 U 4.2 36 1,100 43 RF-SE-43-XX Reference Laboratory 2.7 150 1.3 U 4 40 1,200 43 RF-SE-59-XX Reference Laboratory 0.085 U 160 1.3 U 4.5 42 1,300 43 RF-SE-03-BA Niton LLC XLi 26 240 < LOD : 16.71 < LOD : 239.21 < LOD : 290.62 1,307 43 RF-SE-16-BA Niton LLC XLi < LOD : 20.18 197 < LOD : 16.19 < LOD : 237.49 < LOD : 295.19 1,312 43 RF-SE-27-BA Niton LLC XLi < LOD : 19.76 < LOD : 131.30 < LOD : 16.22 < LOD : 232.78 < LOD : 287.85 1,248 43 RF-SE-35-BA Niton LLC XLi 24 188 < LOD : 15.61 < LOD : 240.34 < LOD : 286.76 1,216 43 RF-SE-54-BA Niton LLC XLi < LOD : 19.94 147 < LOD : 16.61 < LOD : 223.66 < LOD : 287.03 1,279 44 RF-SE-05-XX Reference Laboratory 2.6 150 3.1 7.4 J- 48 1,800 44 RF-SE-26-XX Reference Laboratory 2.5 140 2.8 7.2 J- 42 1,700 44 RF-SE-39-XX Reference Laboratory 2.2 150 2.6 8.2 J- 49 1,900 44 RF-SE-44-XX Reference Laboratory 2.3 140 2.4 7.2 J- 44 1,600 44 RF-SE-56-XX Reference Laboratory 2.2 160 1.8 8.3 J- 51 1,900 44 RF-SE-01-BA Niton LLC XLi < LOD : 20.02 < LOD : 132.09 < LOD : 16.41 < LOD : 240.64 < LOD : 286.29 1,585 44 RF-SE-11-BA Niton LLC XLi < LOD : 20.59 171 < LOD : 16.01 < LOD : 231.59 < LOD : 286.09 1,531 44 RF-SE-20-BA Niton LLC XLi < LOD : 20.44 < LOD : 133.12 < LOD : 16.19 < LOD : 238.92 < LOD : 289.92 1,738 44 RF-SE-33-BA Niton LLC XLi 23 178 21 < LOD : 238.89 < LOD : 291.48 1,715 44 RF-SE-59-BA Niton LLC XLi 27 179 < LOD : 16.11 < LOD : 235.58 < LOD : 288.78 1,741 45 RF-SE-04-XX Reference Laboratory 4.2 130 2.8 12 J- 46 2,400 45 RF-SE-14-XX Reference Laboratory 4.7 140 3 13 J- 51 2,600 45 RF-SE-19-XX Reference Laboratory 3.9 140 4.1 14 J- 52 2,700 45 RF-SE-34-XX Reference Laboratory 4.5 120 1.9 10 J- 42 2,200 45 RF-SE-52-XX Reference Laboratory 4.1 130 2 11 J- 47 2,300 45 RF-SE-04-BA Niton LLC XLi 34 188 < LOD : 17.07 < LOD : 239.75 < LOD : 292.11 2,270 45 RF-SE-14-BA Niton LLC XLi 34 158 < LOD : 17.58 < LOD : 240.40 < LOD : 297.34 2,170 45 RF-SE-19-BA Niton LLC XLi 30 165 < LOD : 16.41 < LOD : 235.01 < LOD : 290.61 2,317 45 RF-SE-34-BA Niton LLC XLi 25 175 23 < LOD : 232.71 < LOD : 296.85 2,113 45 RF-SE-52-BA Niton LLC XLi 35 < LOD : 132.56 < LOD : 16.93 < LOD : 230.42 < LOD : 294.93 2,160 46 BN-SO-11-XX Reference Laboratory 24 J- 2,900 140 140 J- 150 3,900 46 BN-SO-14-XX Reference Laboratory 26 2,800 130 140 J- 150 3,800 46 BN-SO-23-XX Reference Laboratory 31 2,800 130 130 J- 150 3,800 46 BN-SO-04-BA Niton LLC XLi < LOD : 22.38 2,955 119 < LOD : 253.24 < LOD : 301.67 4,285 46 BN-SO-12-BA Niton LLC XLi < LOD : 23.02 3,235 128 < LOD : 244.52 < LOD : 307.24 4,409 46 BN-SO-24-BA Niton LLC XLi < LOD : 22.87 2,906 136 < LOD : 247.63 315 4,277
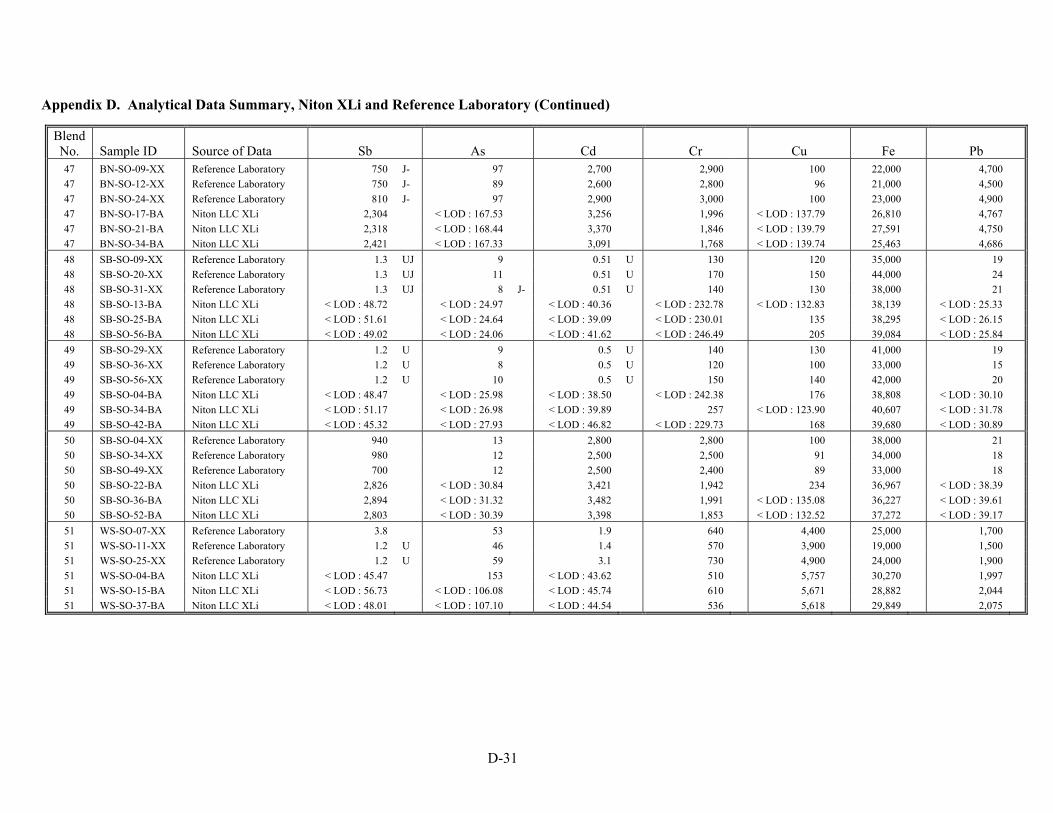
D-31
Appendix D. Analytical Data Summary, Niton XLi and Reference Laboratory (Continued)
Blend No. Sample ID Source of Data Sb As Cd Cr Cu Fe Pb 47 BN-SO-09-XX Reference Laboratory 750 J- 97 2,700 2,900 100 22,000 4,700 47 BN-SO-12-XX Reference Laboratory 750 J- 89 2,600 2,800 96 21,000 4,500 47 BN-SO-24-XX Reference Laboratory 810 J- 97 2,900 3,000 100 23,000 4,900 47 BN-SO-17-BA Niton LLC XLi 2,304 < LOD : 167.53 3,256 1,996 < LOD : 137.79 26,810 4,767 47 BN-SO-21-BA Niton LLC XLi 2,318 < LOD : 168.44 3,370 1,846 < LOD : 139.79 27,591 4,750 47 BN-SO-34-BA Niton LLC XLi 2,421 < LOD : 167.33 3,091 1,768 < LOD : 139.74 25,463 4,686 48 SB-SO-09-XX Reference Laboratory 1.3 UJ 9 0.51 U 130 120 35,000 19 48 SB-SO-20-XX Reference Laboratory 1.3 UJ 11 0.51 U 170 150 44,000 24 48 SB-SO-31-XX Reference Laboratory 1.3 UJ 8 J- 0.51 U 140 130 38,000 21 48 SB-SO-13-BA Niton LLC XLi < LOD : 48.72 < LOD : 24.97 < LOD : 40.36 < LOD : 232.78 < LOD : 132.83 38,139 < LOD : 25.33 48 SB-SO-25-BA Niton LLC XLi < LOD : 51.61 < LOD : 24.64 < LOD : 39.09 < LOD : 230.01 135 38,295 < LOD : 26.15 48 SB-SO-56-BA Niton LLC XLi < LOD : 49.02 < LOD : 24.06 < LOD : 41.62 < LOD : 246.49 205 39,084 < LOD : 25.84 49 SB-SO-29-XX Reference Laboratory 1.2 U 9 0.5 U 140 130 41,000 19 49 SB-SO-36-XX Reference Laboratory 1.2 U 8 0.5 U 120 100 33,000 15 49 SB-SO-56-XX Reference Laboratory 1.2 U 10 0.5 U 150 140 42,000 20 49 SB-SO-04-BA Niton LLC XLi < LOD : 48.47 < LOD : 25.98 < LOD : 38.50 < LOD : 242.38 176 38,808 < LOD : 30.10 49 SB-SO-34-BA Niton LLC XLi < LOD : 51.17 < LOD : 26.98 < LOD : 39.89 257 < LOD : 123.90 40,607 < LOD : 31.78 49 SB-SO-42-BA Niton LLC XLi < LOD : 45.32 < LOD : 27.93 < LOD : 46.82 < LOD : 229.73 168 39,680 < LOD : 30.89 50 SB-SO-04-XX Reference Laboratory 940 13 2,800 2,800 100 38,000 21 50 SB-SO-34-XX Reference Laboratory 980 12 2,500 2,500 91 34,000 18 50 SB-SO-49-XX Reference Laboratory 700 12 2,500 2,400 89 33,000 18 50 SB-SO-22-BA Niton LLC XLi 2,826 < LOD : 30.84 3,421 1,942 234 36,967 < LOD : 38.39 50 SB-SO-36-BA Niton LLC XLi 2,894 < LOD : 31.32 3,482 1,991 < LOD : 135.08 36,227 < LOD : 39.61 50 SB-SO-52-BA Niton LLC XLi 2,803 < LOD : 30.39 3,398 1,853 < LOD : 132.52 37,272 < LOD : 39.17 51 WS-SO-07-XX Reference Laboratory 3.8 53 1.9 640 4,400 25,000 1,700 51 WS-SO-11-XX Reference Laboratory 1.2 U 46 1.4 570 3,900 19,000 1,500 51 WS-SO-25-XX Reference Laboratory 1.2 U 59 3.1 730 4,900 24,000 1,900 51 WS-SO-04-BA Niton LLC XLi < LOD : 45.47 153 < LOD : 43.62 510 5,757 30,270 1,997 51 WS-SO-15-BA Niton LLC XLi < LOD : 56.73 < LOD : 106.08 < LOD : 45.74 610 5,671 28,882 2,044 51 WS-SO-37-BA Niton LLC XLi < LOD : 48.01 < LOD : 107.10 < LOD : 44.54 536 5,618 29,849 2,075
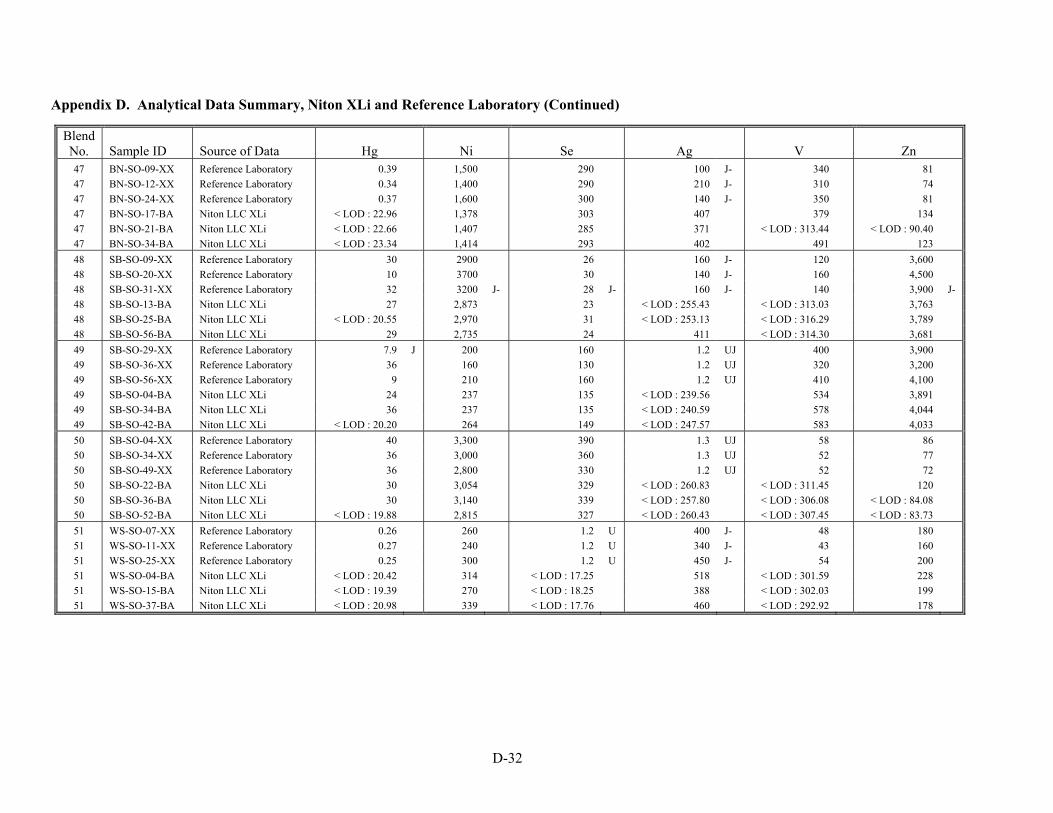
D-32
Appendix D. Analytical Data Summary, Niton XLi and Reference Laboratory (Continued)
Blend No. Sample ID Source of Data Hg Ni Se Ag V Zn 47 BN-SO-09-XX Reference Laboratory 0.39 1,500 290 100 J- 340 81 47 BN-SO-12-XX Reference Laboratory 0.34 1,400 290 210 J- 310 74 47 BN-SO-24-XX Reference Laboratory 0.37 1,600 300 140 J- 350 81 47 BN-SO-17-BA Niton LLC XLi < LOD : 22.96 1,378 303 407 379 134 47 BN-SO-21-BA Niton LLC XLi < LOD : 22.66 1,407 285 371 < LOD : 313.44 < LOD : 90.40 47 BN-SO-34-BA Niton LLC XLi < LOD : 23.34 1,414 293 402 491 123 48 SB-SO-09-XX Reference Laboratory 30 2900 26 160 J- 120 3,600 48 SB-SO-20-XX Reference Laboratory 10 3700 30 140 J- 160 4,500 48 SB-SO-31-XX Reference Laboratory 32 3200 J- 28 J- 160 J- 140 3,900 J- 48 SB-SO-13-BA Niton LLC XLi 27 2,873 23 < LOD : 255.43 < LOD : 313.03 3,763 48 SB-SO-25-BA Niton LLC XLi < LOD : 20.55 2,970 31 < LOD : 253.13 < LOD : 316.29 3,789 48 SB-SO-56-BA Niton LLC XLi 29 2,735 24 411 < LOD : 314.30 3,681 49 SB-SO-29-XX Reference Laboratory 7.9 J 200 160 1.2 UJ 400 3,900 49 SB-SO-36-XX Reference Laboratory 36 160 130 1.2 UJ 320 3,200 49 SB-SO-56-XX Reference Laboratory 9 210 160 1.2 UJ 410 4,100 49 SB-SO-04-BA Niton LLC XLi 24 237 135 < LOD : 239.56 534 3,891 49 SB-SO-34-BA Niton LLC XLi 36 237 135 < LOD : 240.59 578 4,044 49 SB-SO-42-BA Niton LLC XLi < LOD : 20.20 264 149 < LOD : 247.57 583 4,033 50 SB-SO-04-XX Reference Laboratory 40 3,300 390 1.3 UJ 58 86 50 SB-SO-34-XX Reference Laboratory 36 3,000 360 1.3 UJ 52 77 50 SB-SO-49-XX Reference Laboratory 36 2,800 330 1.2 UJ 52 72 50 SB-SO-22-BA Niton LLC XLi 30 3,054 329 < LOD : 260.83 < LOD : 311.45 120 50 SB-SO-36-BA Niton LLC XLi 30 3,140 339 < LOD : 257.80 < LOD : 306.08 < LOD : 84.08 50 SB-SO-52-BA Niton LLC XLi < LOD : 19.88 2,815 327 < LOD : 260.43 < LOD : 307.45 < LOD : 83.73 51 WS-SO-07-XX Reference Laboratory 0.26 260 1.2 U 400 J- 48 180 51 WS-SO-11-XX Reference Laboratory 0.27 240 1.2 U 340 J- 43 160 51 WS-SO-25-XX Reference Laboratory 0.25 300 1.2 U 450 J- 54 200 51 WS-SO-04-BA Niton LLC XLi < LOD : 20.42 314 < LOD : 17.25 518 < LOD : 301.59 228 51 WS-SO-15-BA Niton LLC XLi < LOD : 19.39 270 < LOD : 18.25 388 < LOD : 302.03 199 51 WS-SO-37-BA Niton LLC XLi < LOD : 20.98 339 < LOD : 17.76 460 < LOD : 292.92 178

D-33
Appendix D. Analytical Data Summary, Niton XLi and Reference Laboratory (Continued) Blend No. Sample ID Source of Data Sb As Cd Cr Cu Fe Pb 52 WS-SO-10-XX Reference Laboratory 1.3 U 83 1.8 67 76 19,000 1,900 52 WS-SO-20-XX Reference Laboratory 1.3 U 100 1.9 81 90 23,000 2,300 52 WS-SO-23-XX Reference Laboratory 1.3 U 110 2.1 82 96 23,000 2,500 52 WS-SO-09-BA Niton LLC XLi < LOD : 51.95 < LOD : 121.27 < LOD : 41.19 < LOD : 230.01 154 28,776 2,731 52 WS-SO-21-BA Niton LLC XLi < LOD : 52.89 155 < LOD : 41.52 < LOD : 218.07 126 28,947 2,683 52 WS-SO-24-BA Niton LLC XLi < LOD : 52.67 177 < LOD : 46.21 < LOD : 216.17 < LOD : 119.85 27,997 2,604 53 AS-SO-03-XX Reference Laboratory 1.2 U 14 1,300 33 6,200 15,000 160 53 AS-SO-05-XX Reference Laboratory 1.2 U 9 900 23 4,500 11,000 110 53 AS-SO-08-XX Reference Laboratory 1.2 U 10 930 24 4,600 11,000 120 53 AS-SO-04-BA Niton LLC XLi < LOD : 80.66 < LOD : 38.39 1,507 < LOD : 192.73 5,826 17,098 160 53 AS-SO-07-BA Niton LLC XLi < LOD : 77.15 < LOD : 38.21 1,345 < LOD : 191.07 5,464 20,800 176 53 AS-SO-12-BA Niton LLC XLi < LOD : 80.22 < LOD : 38.12 1,441 < LOD : 210.24 6,013 17,388 167 54 LV-SO-03-XX Reference Laboratory 1.6 42 590 600 130 24,000 94 54 LV-SO-40-XX Reference Laboratory 2.7 42 580 590 130 24,000 92 54 LV-SO-49-XX Reference Laboratory 7.4 43 600 610 130 25,000 98 54 LV-SO-13-BA Niton LLC XLi < LOD : 70.76 45 776 634 230 38,209 138 54 LV-SO-26-BA Niton LLC XLi < LOD : 66.77 75 661 506 < LOD : 139.25 37,093 123 54 LV-SO-40-BA Niton LLC XLi < LOD : 67.21 49 734 698 187 36,503 104 55 LV-SO-04-XX Reference Laboratory 860 120 2,400 2,300 98 22,000 4,000 55 LV-SO-34-XX Reference Laboratory 870 J- 110 J- 2,300 J- 2,200 J- 87 20,000 J- 3,700 J- 55 LV-SO-37-XX Reference Laboratory 590 84 1,700 1,600 66 16,000 2,800 55 LV-SO-09-BA Niton LLC XLi 2,128 < LOD : 182.39 3,290 2,210 162 39,070 5,264 55 LV-SO-21-BA Niton LLC XLi 2,103 251 2,880 1,951 194 36,633 4,958 55 LV-SO-46-BA Niton LLC XLi 2,414 < LOD : 181.20 3,187 2,034 189 38,077 5,190 56 CN-SO-03-XX Reference Laboratory 22 87 63 17 72 15,000 130 56 CN-SO-06-XX Reference Laboratory 20 91 64 18 74 16,000 130 56 CN-SO-07-XX Reference Laboratory 20 90 63 19 72 17,000 130 56 CN-SO-03-BA Niton LLC XLi 72 123 58 < LOD : 223.76 < LOD : 121.81 26,027 187 56 CN-SO-06-BA Niton LLC XLi < LOD : 56.50 118 94 < LOD : 208.84 < LOD : 117.71 24,056 193 56 CN-SO-07-BA Niton LLC XLi 70 107 118 < LOD : 223.66 164 24,161 221
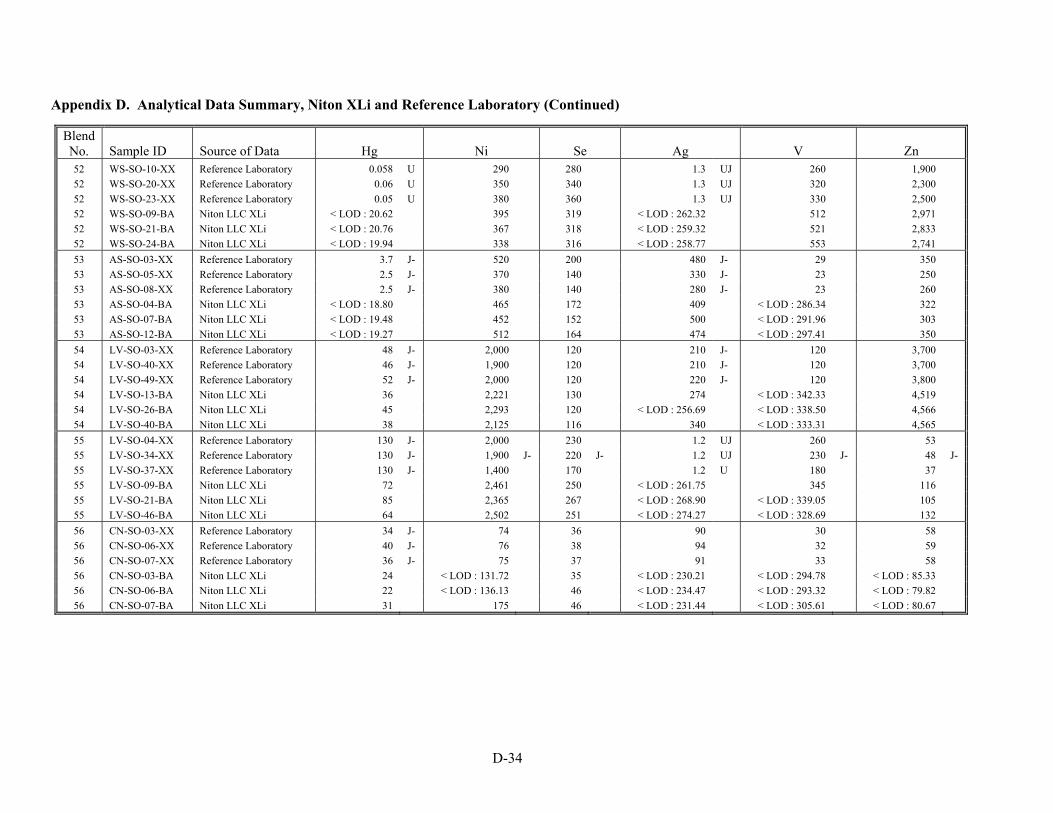
D-34
Appendix D. Analytical Data Summary, Niton XLi and Reference Laboratory (Continued)
Blend No. Sample ID Source of Data Hg Ni Se Ag V Zn 52 WS-SO-10-XX Reference Laboratory 0.058 U 290 280 1.3 UJ 260 1,900 52 WS-SO-20-XX Reference Laboratory 0.06 U 350 340 1.3 UJ 320 2,300 52 WS-SO-23-XX Reference Laboratory 0.05 U 380 360 1.3 UJ 330 2,500 52 WS-SO-09-BA Niton LLC XLi < LOD : 20.62 395 319 < LOD : 262.32 512 2,971 52 WS-SO-21-BA Niton LLC XLi < LOD : 20.76 367 318 < LOD : 259.32 521 2,833 52 WS-SO-24-BA Niton LLC XLi < LOD : 19.94 338 316 < LOD : 258.77 553 2,741 53 AS-SO-03-XX Reference Laboratory 3.7 J- 520 200 480 J- 29 350 53 AS-SO-05-XX Reference Laboratory 2.5 J- 370 140 330 J- 23 250 53 AS-SO-08-XX Reference Laboratory 2.5 J- 380 140 280 J- 23 260 53 AS-SO-04-BA Niton LLC XLi < LOD : 18.80 465 172 409 < LOD : 286.34 322 53 AS-SO-07-BA Niton LLC XLi < LOD : 19.48 452 152 500 < LOD : 291.96 303 53 AS-SO-12-BA Niton LLC XLi < LOD : 19.27 512 164 474 < LOD : 297.41 350 54 LV-SO-03-XX Reference Laboratory 48 J- 2,000 120 210 J- 120 3,700 54 LV-SO-40-XX Reference Laboratory 46 J- 1,900 120 210 J- 120 3,700 54 LV-SO-49-XX Reference Laboratory 52 J- 2,000 120 220 J- 120 3,800 54 LV-SO-13-BA Niton LLC XLi 36 2,221 130 274 < LOD : 342.33 4,519 54 LV-SO-26-BA Niton LLC XLi 45 2,293 120 < LOD : 256.69 < LOD : 338.50 4,566 54 LV-SO-40-BA Niton LLC XLi 38 2,125 116 340 < LOD : 333.31 4,565 55 LV-SO-04-XX Reference Laboratory 130 J- 2,000 230 1.2 UJ 260 53 55 LV-SO-34-XX Reference Laboratory 130 J- 1,900 J- 220 J- 1.2 UJ 230 J- 48 J- 55 LV-SO-37-XX Reference Laboratory 130 J- 1,400 170 1.2 U 180 37 55 LV-SO-09-BA Niton LLC XLi 72 2,461 250 < LOD : 261.75 345 116 55 LV-SO-21-BA Niton LLC XLi 85 2,365 267 < LOD : 268.90 < LOD : 339.05 105 55 LV-SO-46-BA Niton LLC XLi 64 2,502 251 < LOD : 274.27 < LOD : 328.69 132 56 CN-SO-03-XX Reference Laboratory 34 J- 74 36 90 30 58 56 CN-SO-06-XX Reference Laboratory 40 J- 76 38 94 32 59 56 CN-SO-07-XX Reference Laboratory 36 J- 75 37 91 33 58 56 CN-SO-03-BA Niton LLC XLi 24 < LOD : 131.72 35 < LOD : 230.21 < LOD : 294.78 < LOD : 85.33 56 CN-SO-06-BA Niton LLC XLi 22 < LOD : 136.13 46 < LOD : 234.47 < LOD : 293.32 < LOD : 79.82 56 CN-SO-07-BA Niton LLC XLi 31 175 46 < LOD : 231.44 < LOD : 305.61 < LOD : 80.67
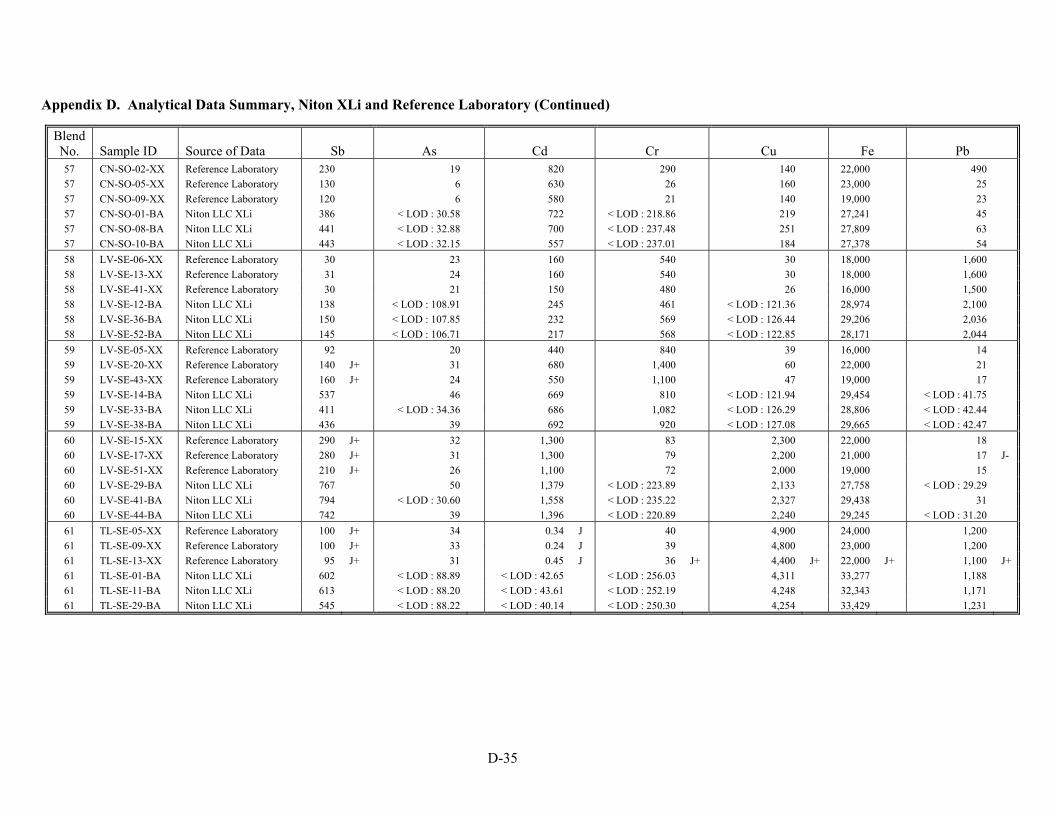
D-35
Appendix D. Analytical Data Summary, Niton XLi and Reference Laboratory (Continued)
Blend No. Sample ID Source of Data Sb As Cd Cr Cu Fe Pb 57 CN-SO-02-XX Reference Laboratory 230 19 820 290 140 22,000 490 57 CN-SO-05-XX Reference Laboratory 130 6 630 26 160 23,000 25 57 CN-SO-09-XX Reference Laboratory 120 6 580 21 140 19,000 23 57 CN-SO-01-BA Niton LLC XLi 386 < LOD : 30.58 722 < LOD : 218.86 219 27,241 45 57 CN-SO-08-BA Niton LLC XLi 441 < LOD : 32.88 700 < LOD : 237.48 251 27,809 63 57 CN-SO-10-BA Niton LLC XLi 443 < LOD : 32.15 557 < LOD : 237.01 184 27,378 54 58 LV-SE-06-XX Reference Laboratory 30 23 160 540 30 18,000 1,600 58 LV-SE-13-XX Reference Laboratory 31 24 160 540 30 18,000 1,600 58 LV-SE-41-XX Reference Laboratory 30 21 150 480 26 16,000 1,500 58 LV-SE-12-BA Niton LLC XLi 138 < LOD : 108.91 245 461 < LOD : 121.36 28,974 2,100 58 LV-SE-36-BA Niton LLC XLi 150 < LOD : 107.85 232 569 < LOD : 126.44 29,206 2,036 58 LV-SE-52-BA Niton LLC XLi 145 < LOD : 106.71 217 568 < LOD : 122.85 28,171 2,044 59 LV-SE-05-XX Reference Laboratory 92 20 440 840 39 16,000 14 59 LV-SE-20-XX Reference Laboratory 140 J+ 31 680 1,400 60 22,000 21 59 LV-SE-43-XX Reference Laboratory 160 J+ 24 550 1,100 47 19,000 17 59 LV-SE-14-BA Niton LLC XLi 537 46 669 810 < LOD : 121.94 29,454 < LOD : 41.75 59 LV-SE-33-BA Niton LLC XLi 411 < LOD : 34.36 686 1,082 < LOD : 126.29 28,806 < LOD : 42.44 59 LV-SE-38-BA Niton LLC XLi 436 39 692 920 < LOD : 127.08 29,665 < LOD : 42.47 60 LV-SE-15-XX Reference Laboratory 290 J+ 32 1,300 83 2,300 22,000 18 60 LV-SE-17-XX Reference Laboratory 280 J+ 31 1,300 79 2,200 21,000 17 J- 60 LV-SE-51-XX Reference Laboratory 210 J+ 26 1,100 72 2,000 19,000 15 60 LV-SE-29-BA Niton LLC XLi 767 50 1,379 < LOD : 223.89 2,133 27,758 < LOD : 29.29 60 LV-SE-41-BA Niton LLC XLi 794 < LOD : 30.60 1,558 < LOD : 235.22 2,327 29,438 31 60 LV-SE-44-BA Niton LLC XLi 742 39 1,396 < LOD : 220.89 2,240 29,245 < LOD : 31.20 61 TL-SE-05-XX Reference Laboratory 100 J+ 34 0.34 J 40 4,900 24,000 1,200 61 TL-SE-09-XX Reference Laboratory 100 J+ 33 0.24 J 39 4,800 23,000 1,200 61 TL-SE-13-XX Reference Laboratory 95 J+ 31 0.45 J 36 J+ 4,400 J+ 22,000 J+ 1,100 J+ 61 TL-SE-01-BA Niton LLC XLi 602 < LOD : 88.89 < LOD : 42.65 < LOD : 256.03 4,311 33,277 1,188 61 TL-SE-11-BA Niton LLC XLi 613 < LOD : 88.20 < LOD : 43.61 < LOD : 252.19 4,248 32,343 1,171 61 TL-SE-29-BA Niton LLC XLi 545 < LOD : 88.22 < LOD : 40.14 < LOD : 250.30 4,254 33,429 1,231
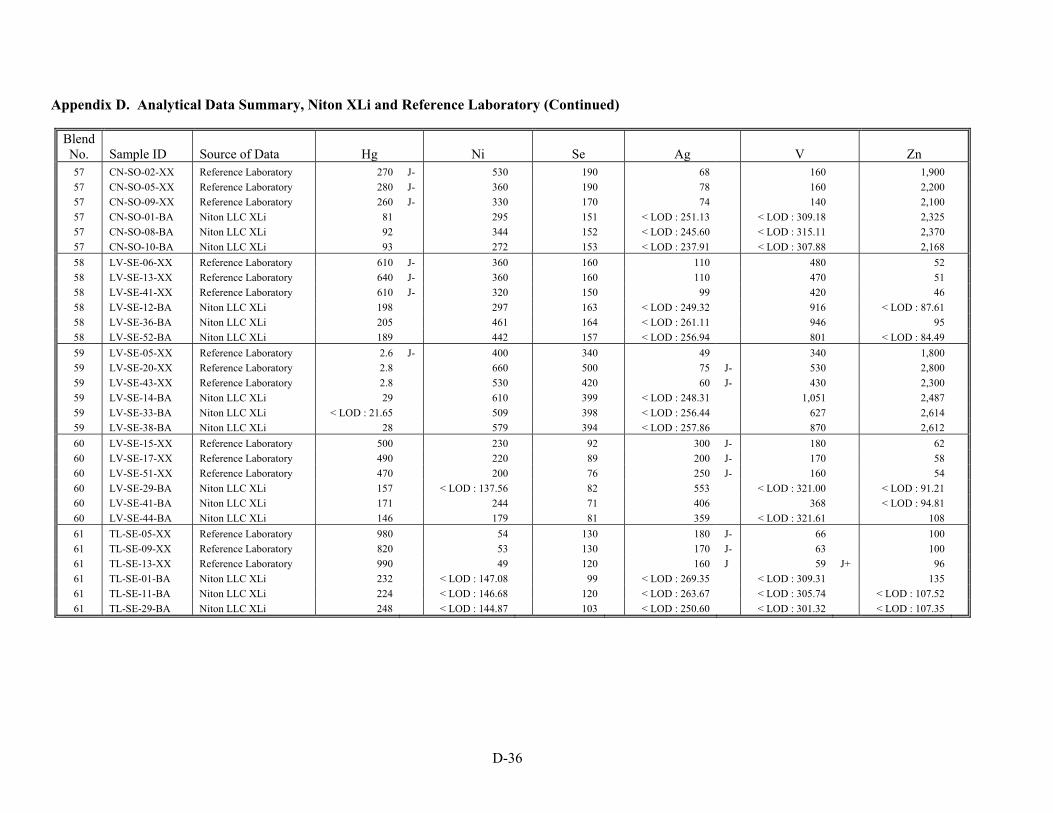
D-36
Appendix D. Analytical Data Summary, Niton XLi and Reference Laboratory (Continued) Blend No. Sample ID Source of Data Hg Ni Se Ag V Zn 57 CN-SO-02-XX Reference Laboratory 270 J- 530 190 68 160 1,900 57 CN-SO-05-XX Reference Laboratory 280 J- 360 190 78 160 2,200 57 CN-SO-09-XX Reference Laboratory 260 J- 330 170 74 140 2,100 57 CN-SO-01-BA Niton LLC XLi 81 295 151 < LOD : 251.13 < LOD : 309.18 2,325 57 CN-SO-08-BA Niton LLC XLi 92 344 152 < LOD : 245.60 < LOD : 315.11 2,370 57 CN-SO-10-BA Niton LLC XLi 93 272 153 < LOD : 237.91 < LOD : 307.88 2,168 58 LV-SE-06-XX Reference Laboratory 610 J- 360 160 110 480 52 58 LV-SE-13-XX Reference Laboratory 640 J- 360 160 110 470 51 58 LV-SE-41-XX Reference Laboratory 610 J- 320 150 99 420 46 58 LV-SE-12-BA Niton LLC XLi 198 297 163 < LOD : 249.32 916 < LOD : 87.61 58 LV-SE-36-BA Niton LLC XLi 205 461 164 < LOD : 261.11 946 95 58 LV-SE-52-BA Niton LLC XLi 189 442 157 < LOD : 256.94 801 < LOD : 84.49 59 LV-SE-05-XX Reference Laboratory 2.6 J- 400 340 49 340 1,800 59 LV-SE-20-XX Reference Laboratory 2.8 660 500 75 J- 530 2,800 59 LV-SE-43-XX Reference Laboratory 2.8 530 420 60 J- 430 2,300 59 LV-SE-14-BA Niton LLC XLi 29 610 399 < LOD : 248.31 1,051 2,487 59 LV-SE-33-BA Niton LLC XLi < LOD : 21.65 509 398 < LOD : 256.44 627 2,614 59 LV-SE-38-BA Niton LLC XLi 28 579 394 < LOD : 257.86 870 2,612 60 LV-SE-15-XX Reference Laboratory 500 230 92 300 J- 180 62 60 LV-SE-17-XX Reference Laboratory 490 220 89 200 J- 170 58 60 LV-SE-51-XX Reference Laboratory 470 200 76 250 J- 160 54 60 LV-SE-29-BA Niton LLC XLi 157 < LOD : 137.56 82 553 < LOD : 321.00 < LOD : 91.21 60 LV-SE-41-BA Niton LLC XLi 171 244 71 406 368 < LOD : 94.81 60 LV-SE-44-BA Niton LLC XLi 146 179 81 359 < LOD : 321.61 108 61 TL-SE-05-XX Reference Laboratory 980 54 130 180 J- 66 100 61 TL-SE-09-XX Reference Laboratory 820 53 130 170 J- 63 100 61 TL-SE-13-XX Reference Laboratory 990 49 120 160 J 59 J+ 96 61 TL-SE-01-BA Niton LLC XLi 232 < LOD : 147.08 99 < LOD : 269.35 < LOD : 309.31 135 61 TL-SE-11-BA Niton LLC XLi 224 < LOD : 146.68 120 < LOD : 263.67 < LOD : 305.74 < LOD : 107.52 61 TL-SE-29-BA Niton LLC XLi 248 < LOD : 144.87 103 < LOD : 250.60 < LOD : 301.32 < LOD : 107.35
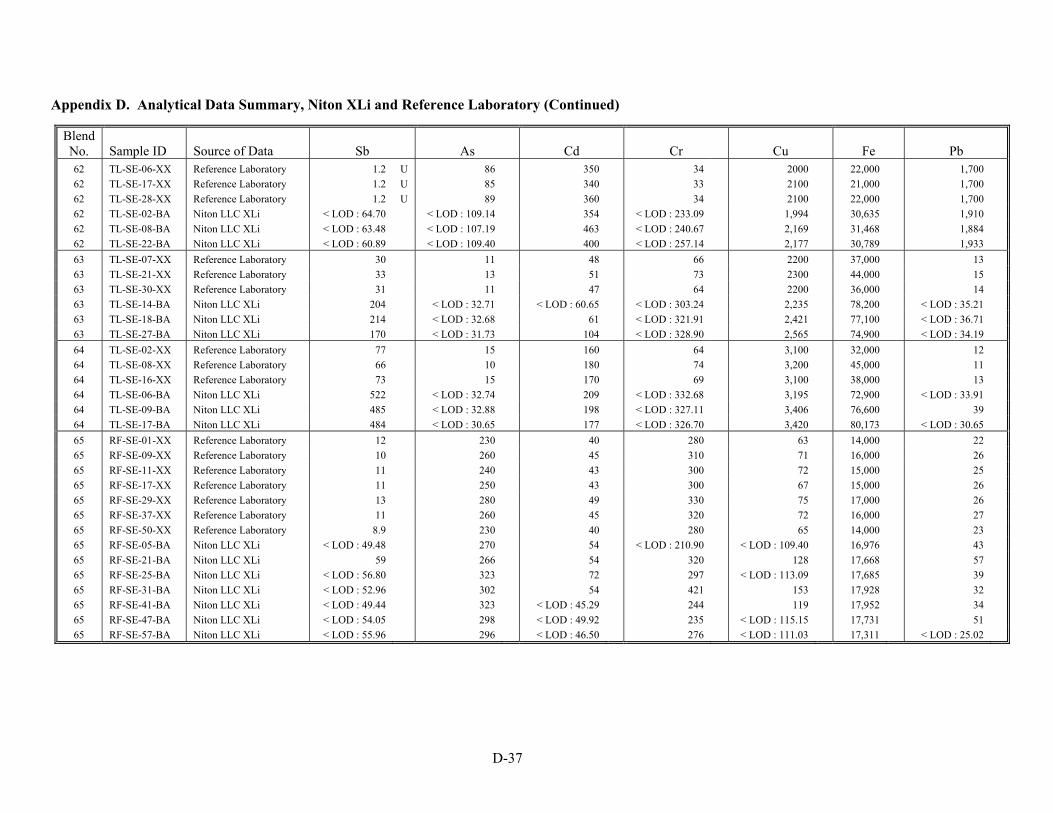
D-37
Appendix D. Analytical Data Summary, Niton XLi and Reference Laboratory (Continued)
Blend No. Sample ID Source of Data Sb As Cd Cr Cu Fe Pb 62 TL-SE-06-XX Reference Laboratory 1.2 U 86 350 34 2000 22,000 1,700 62 TL-SE-17-XX Reference Laboratory 1.2 U 85 340 33 2100 21,000 1,700 62 TL-SE-28-XX Reference Laboratory 1.2 U 89 360 34 2100 22,000 1,700 62 TL-SE-02-BA Niton LLC XLi < LOD : 64.70 < LOD : 109.14 354 < LOD : 233.09 1,994 30,635 1,910 62 TL-SE-08-BA Niton LLC XLi < LOD : 63.48 < LOD : 107.19 463 < LOD : 240.67 2,169 31,468 1,884 62 TL-SE-22-BA Niton LLC XLi < LOD : 60.89 < LOD : 109.40 400 < LOD : 257.14 2,177 30,789 1,933 63 TL-SE-07-XX Reference Laboratory 30 11 48 66 2200 37,000 13 63 TL-SE-21-XX Reference Laboratory 33 13 51 73 2300 44,000 15 63 TL-SE-30-XX Reference Laboratory 31 11 47 64 2200 36,000 14 63 TL-SE-14-BA Niton LLC XLi 204 < LOD : 32.71 < LOD : 60.65 < LOD : 303.24 2,235 78,200 < LOD : 35.21 63 TL-SE-18-BA Niton LLC XLi 214 < LOD : 32.68 61 < LOD : 321.91 2,421 77,100 < LOD : 36.71 63 TL-SE-27-BA Niton LLC XLi 170 < LOD : 31.73 104 < LOD : 328.90 2,565 74,900 < LOD : 34.19 64 TL-SE-02-XX Reference Laboratory 77 15 160 64 3,100 32,000 12 64 TL-SE-08-XX Reference Laboratory 66 10 180 74 3,200 45,000 11 64 TL-SE-16-XX Reference Laboratory 73 15 170 69 3,100 38,000 13 64 TL-SE-06-BA Niton LLC XLi 522 < LOD : 32.74 209 < LOD : 332.68 3,195 72,900 < LOD : 33.91 64 TL-SE-09-BA Niton LLC XLi 485 < LOD : 32.88 198 < LOD : 327.11 3,406 76,600 39 64 TL-SE-17-BA Niton LLC XLi 484 < LOD : 30.65 177 < LOD : 326.70 3,420 80,173 < LOD : 30.65 65 RF-SE-01-XX Reference Laboratory 12 230 40 280 63 14,000 22 65 RF-SE-09-XX Reference Laboratory 10 260 45 310 71 16,000 26 65 RF-SE-11-XX Reference Laboratory 11 240 43 300 72 15,000 25 65 RF-SE-17-XX Reference Laboratory 11 250 43 300 67 15,000 26 65 RF-SE-29-XX Reference Laboratory 13 280 49 330 75 17,000 26 65 RF-SE-37-XX Reference Laboratory 11 260 45 320 72 16,000 27 65 RF-SE-50-XX Reference Laboratory 8.9 230 40 280 65 14,000 23 65 RF-SE-05-BA Niton LLC XLi < LOD : 49.48 270 54 < LOD : 210.90 < LOD : 109.40 16,976 43 65 RF-SE-21-BA Niton LLC XLi 59 266 54 320 128 17,668 57 65 RF-SE-25-BA Niton LLC XLi < LOD : 56.80 323 72 297 < LOD : 113.09 17,685 39 65 RF-SE-31-BA Niton LLC XLi < LOD : 52.96 302 54 421 153 17,928 32 65 RF-SE-41-BA Niton LLC XLi < LOD : 49.44 323 < LOD : 45.29 244 119 17,952 34 65 RF-SE-47-BA Niton LLC XLi < LOD : 54.05 298 < LOD : 49.92 235 < LOD : 115.15 17,731 51 65 RF-SE-57-BA Niton LLC XLi < LOD : 55.96 296 < LOD : 46.50 276 < LOD : 111.03 17,311 < LOD : 25.02
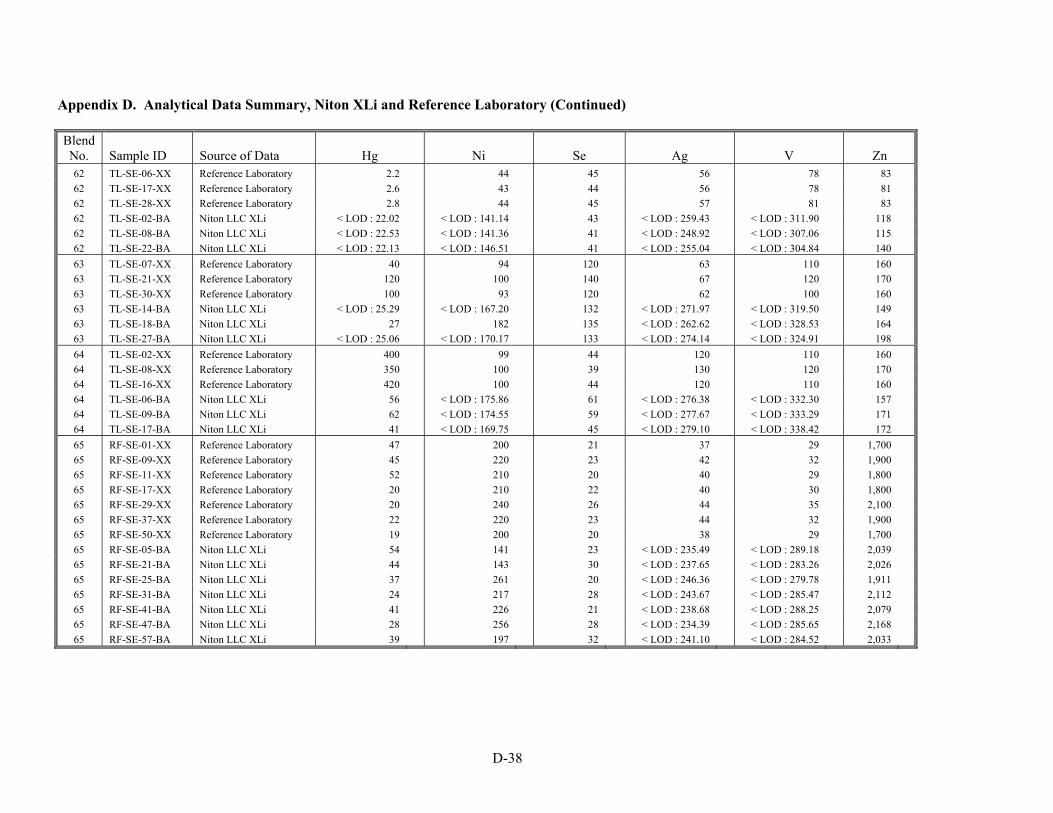
D-38
Appendix D. Analytical Data Summary, Niton XLi and Reference Laboratory (Continued) Blend No. Sample ID Source of Data Hg Ni Se Ag V Zn 62 TL-SE-06-XX Reference Laboratory 2.2 44 45 56 78 83 62 TL-SE-17-XX Reference Laboratory 2.6 43 44 56 78 81 62 TL-SE-28-XX Reference Laboratory 2.8 44 45 57 81 83 62 TL-SE-02-BA Niton LLC XLi < LOD : 22.02 < LOD : 141.14 43 < LOD : 259.43 < LOD : 311.90 118 62 TL-SE-08-BA Niton LLC XLi < LOD : 22.53 < LOD : 141.36 41 < LOD : 248.92 < LOD : 307.06 115 62 TL-SE-22-BA Niton LLC XLi < LOD : 22.13 < LOD : 146.51 41 < LOD : 255.04 < LOD : 304.84 140 63 TL-SE-07-XX Reference Laboratory 40 94 120 63 110 160 63 TL-SE-21-XX Reference Laboratory 120 100 140 67 120 170 63 TL-SE-30-XX Reference Laboratory 100 93 120 62 100 160 63 TL-SE-14-BA Niton LLC XLi < LOD : 25.29 < LOD : 167.20 132 < LOD : 271.97 < LOD : 319.50 149 63 TL-SE-18-BA Niton LLC XLi 27 182 135 < LOD : 262.62 < LOD : 328.53 164 63 TL-SE-27-BA Niton LLC XLi < LOD : 25.06 < LOD : 170.17 133 < LOD : 274.14 < LOD : 324.91 198 64 TL-SE-02-XX Reference Laboratory 400 99 44 120 110 160 64 TL-SE-08-XX Reference Laboratory 350 100 39 130 120 170 64 TL-SE-16-XX Reference Laboratory 420 100 44 120 110 160 64 TL-SE-06-BA Niton LLC XLi 56 < LOD : 175.86 61 < LOD : 276.38 < LOD : 332.30 157 64 TL-SE-09-BA Niton LLC XLi 62 < LOD : 174.55 59 < LOD : 277.67 < LOD : 333.29 171 64 TL-SE-17-BA Niton LLC XLi 41 < LOD : 169.75 45 < LOD : 279.10 < LOD : 338.42 172 65 RF-SE-01-XX Reference Laboratory 47 200 21 37 29 1,700 65 RF-SE-09-XX Reference Laboratory 45 220 23 42 32 1,900 65 RF-SE-11-XX Reference Laboratory 52 210 20 40 29 1,800 65 RF-SE-17-XX Reference Laboratory 20 210 22 40 30 1,800 65 RF-SE-29-XX Reference Laboratory 20 240 26 44 35 2,100 65 RF-SE-37-XX Reference Laboratory 22 220 23 44 32 1,900 65 RF-SE-50-XX Reference Laboratory 19 200 20 38 29 1,700 65 RF-SE-05-BA Niton LLC XLi 54 141 23 < LOD : 235.49 < LOD : 289.18 2,039 65 RF-SE-21-BA Niton LLC XLi 44 143 30 < LOD : 237.65 < LOD : 283.26 2,026 65 RF-SE-25-BA Niton LLC XLi 37 261 20 < LOD : 246.36 < LOD : 279.78 1,911 65 RF-SE-31-BA Niton LLC XLi 24 217 28 < LOD : 243.67 < LOD : 285.47 2,112 65 RF-SE-41-BA Niton LLC XLi 41 226 21 < LOD : 238.68 < LOD : 288.25 2,079 65 RF-SE-47-BA Niton LLC XLi 28 256 28 < LOD : 234.39 < LOD : 285.65 2,168 65 RF-SE-57-BA Niton LLC XLi 39 197 32 < LOD : 241.10 < LOD : 284.52 2,033

D-39
Appendix D. Analytical Data Summary, Niton XLi and Reference Laboratory (Continued)
Blend No. Sample ID Source of Data Sb As Cd Cr Cu Fe Pb 66 RF-SE-08-XX Reference Laboratory 14 460 67 510 1,800 18,000 580 66 RF-SE-10-XX Reference Laboratory 12 400 58 440 1,500 16,000 510 66 RF-SE-33-XX Reference Laboratory 13 440 64 490 1,700 18,000 570 66 RF-SE-13-BA Niton LLC XLi 61 506 < LOD : 53.06 472 1,918 18,951 601 66 RF-SE-29-BA Niton LLC XLi < LOD : 59.02 495 83 305 1,880 19,221 580 66 RF-SE-56-BA Niton LLC XLi 61 529 68 595 2,082 19,877 607 67 RF-SE-16-XX Reference Laboratory 85 J- 72 J- 310 J- 820 J- 73 J- 16,000 J- 24 J- 67 RF-SE-41-XX Reference Laboratory 100 82 360 950 85 18,000 25 67 RF-SE-48-XX Reference Laboratory 100 87 380 1,000 90 19,000 27 67 RF-SE-06-BA Niton LLC XLi 296 93 420 723 196 19,187 < LOD : 24.48 67 RF-SE-26-BA Niton LLC XLi 360 87 436 636 < LOD : 124.79 19,379 42 67 RF-SE-55-BA Niton LLC XLi 268 102 379 834 < LOD : 121.14 18,917 32 68 RF-SE-18-XX Reference Laboratory 320 810 770 950 78 16,000 860 68 RF-SE-35-XX Reference Laboratory 300 740 700 860 70 15,000 780 68 RF-SE-54-XX Reference Laboratory 320 880 840 1,000 86 18,000 920 68 RF-SE-24-BA Niton LLC XLi 874 885 934 642 < LOD : 117.88 18,270 970 68 RF-SE-39-BA Niton LLC XLi 888 826 947 758 < LOD : 117.54 17,609 878 68 RF-SE-46-BA Niton LLC XLi 866 943 1,064 895 140 18,566 960 69 RF-SE-20-XX Reference Laboratory 550 1300 540 94 93 20,000 28 69 RF-SE-46-XX Reference Laboratory 270 590 240 44 40 8,900 13 69 RF-SE-51-XX Reference Laboratory 480 1100 450 77 77 17,000 23 69 RF-SE-10-BA Niton LLC XLi 1,285 1,308 631 < LOD : 209.35 124 20,224 < LOD : 38.29 69 RF-SE-37-BA Niton LLC XLi 1,151 1,247 548 < LOD : 206.44 < LOD : 119.86 20,295 < LOD : 37.88 69 RF-SE-49-BA Niton LLC XLi 1,161 1,266 615 < LOD : 209.35 146 20,669 < LOD : 37.26 70 RF-SE-21-XX Reference Laboratory 1.3 U 62 1,700 76 1,000 16,000 2,100 70 RF-SE-40-XX Reference Laboratory 1.3 U 70 1,900 85 1,100 18,000 2,400 70 RF-SE-47-XX Reference Laboratory 1.3 U 72 1,900 90 1,200 19,000 2,400 70 RF-SE-30-BA Niton LLC XLi < LOD : 101.84 < LOD : 119.79 2,254 < LOD : 231.39 1,186 20,662 2,534 70 RF-SE-43-BA Niton LLC XLi < LOD : 103.44 138 2,252 < LOD : 230.26 1,272 20,923 2,488 70 RF-SE-58-BA Niton LLC XLi < LOD : 102.18 < LOD : 118.56 2,296 < LOD : 220.68 1,347 21,658 2,530

D-40
Appendix D. Analytical Data Summary, Niton XLi and Reference Laboratory (Continued)
Blend No. Sample ID Source of Data Hg Ni Se Ag V Zn 66 RF-SE-08-XX Reference Laboratory 29 250 42 0.39 U 120 120 66 RF-SE-10-XX Reference Laboratory 27 220 39 0.34 U 100 110 66 RF-SE-33-XX Reference Laboratory 28 240 41 0.33 U 120 130 66 RF-SE-13-BA Niton LLC XLi 40 258 46 < LOD : 239.07 < LOD : 295.01 131 66 RF-SE-29-BA Niton LLC XLi 49 295 51 < LOD : 239.32 < LOD : 301.55 135 66 RF-SE-56-BA Niton LLC XLi 40 256 51 < LOD : 232.68 < LOD : 295.23 146 67 RF-SE-16-XX Reference Laboratory 260 1,700 J- 1.2 U 130 J- 32 J- 760 J- 67 RF-SE-41-XX Reference Laboratory 230 1,900 1.2 U 140 39 830 67 RF-SE-48-XX Reference Laboratory 250 2,000 2.2 150 40 880 67 RF-SE-06-BA Niton LLC XLi 102 1,764 < LOD : 15.00 < LOD : 257.37 < LOD : 279.98 857 67 RF-SE-26-BA Niton LLC XLi 104 1,756 21 < LOD : 258.49 < LOD : 285.91 802 67 RF-SE-55-BA Niton LLC XLi 87 1,753 < LOD : 15.45 < LOD : 243.81 < LOD : 285.75 817 68 RF-SE-18-XX Reference Laboratory 600 390 140 140 390 120 68 RF-SE-35-XX Reference Laboratory 650 350 140 150 340 110 68 RF-SE-54-XX Reference Laboratory 670 420 160 180 410 120 68 RF-SE-24-BA Niton LLC XLi 262 431 158 < LOD : 248.29 593 171 68 RF-SE-39-BA Niton LLC XLi 241 341 142 < LOD : 241.97 514 154 68 RF-SE-46-BA Niton LLC XLi 257 414 140 384 445 115 69 RF-SE-20-XX Reference Laboratory 0.48 1,400 380 59 36 1,400 69 RF-SE-46-XX Reference Laboratory 0.45 650 170 26 16 650 69 RF-SE-51-XX Reference Laboratory 0.48 1,200 320 48 30 1,200 69 RF-SE-10-BA Niton LLC XLi < LOD : 20.41 1,295 320 < LOD : 260.60 < LOD : 284.26 1,341 69 RF-SE-37-BA Niton LLC XLi 42 1,187 330 < LOD : 245.11 < LOD : 282.08 1,311 69 RF-SE-49-BA Niton LLC XLi 29 1,316 331 < LOD : 254.19 < LOD : 285.58 1,316 70 RF-SE-21-XX Reference Laboratory 320 220 440 120 130 100 70 RF-SE-40-XX Reference Laboratory 280 250 480 100 150 120 70 RF-SE-47-XX Reference Laboratory 320 250 510 120 150 120 70 RF-SE-30-BA Niton LLC XLi 136 234 469 461 < LOD : 296.73 196 70 RF-SE-43-BA Niton LLC XLi 137 295 480 351 < LOD : 299.11 138 70 RF-SE-58-BA Niton LLC XLi 140 290 454 393 < LOD : 300.45 185
Notes: All concentrations reported in milligrams per kilogram (mg/kg), or parts per million (ppm). J Estimated concentration J+ Concentration is considered estimated and biased high J- Concentration is considered estimated and biased low U Analyte is not detected; the associated concentration value is the sample reporting limit.

APPENDIX E
STATISTICAL DATA SUMMARIES

E-1
Figure E-1: Linear Correlation Plot for Antimony
y = 2.93x + 45.65R2 = 0.92
y = 0.96x - 8.73R2 = 1.00
0
500
1000
1500
2000
2500
3000
3500
0 500 1000 1500 2000 2500 3000 3500
Reference Laboratoy or Certified Value (ppm)
Nito
n X
Li X
RF
(ppm
)
Niton XLi vs Reference Laboratory
Niton XLi vs Certified Value
45 Degrees
Linear (Niton XLi vs Reference Laboratory)
Linear (Niton XLi vs Certified Value)
Figure E-2: Linear Correlation Plot for Arsenic
y = 1.94x - 200.44R2 = 0.94
0
2000
4000
6000
8000
10000
12000
0 1000 2000 3000 4000 5000 6000
Reference Laboratory (ppm)
Nito
n X
Li X
RF
(ppm
)
Niton XLi
45 Degrees
Linear (Niton XLi)
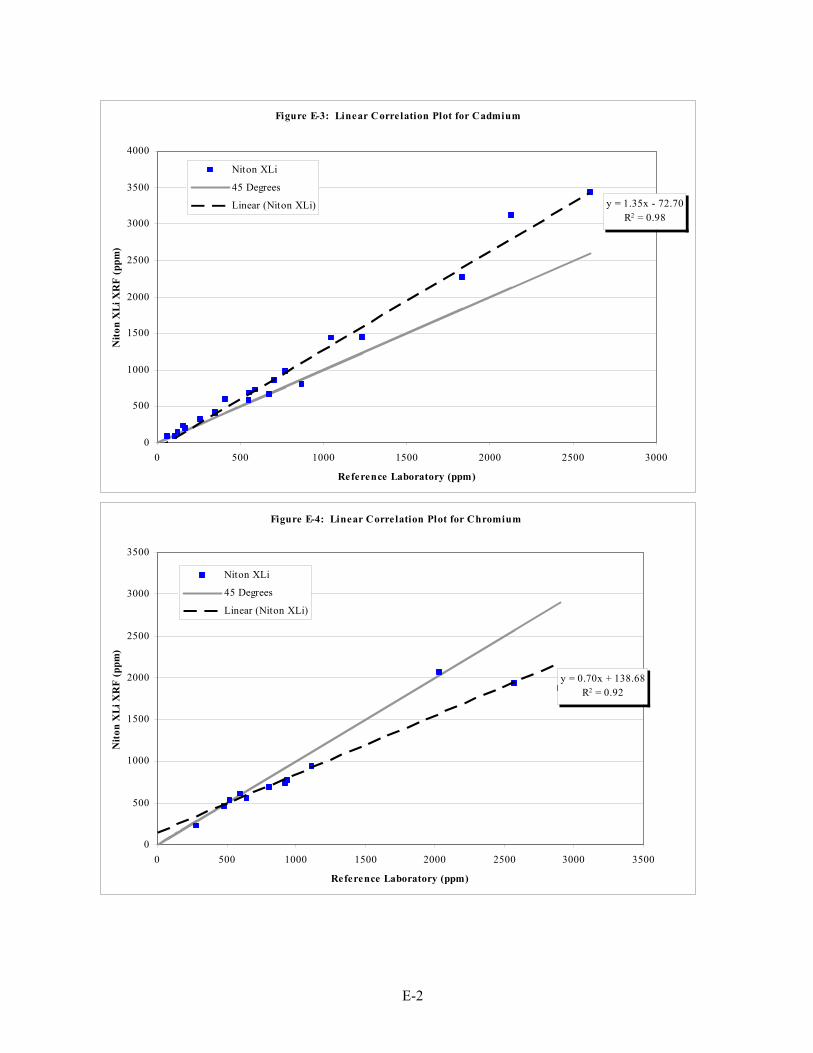
E-2
Figure E-3: Linear Correlation Plot for Cadmium
y = 1.35x - 72.70R2 = 0.98
0
500
1000
1500
2000
2500
3000
3500
4000
0 500 1000 1500 2000 2500 3000
Reference Laboratory (ppm)
Nito
n X
Li X
RF
(ppm
)
Niton XLi
45 Degrees
Linear (Niton XLi)
Figure E-4: Linear Correlation Plot for Chromium
y = 0.70x + 138.68R2 = 0.92
0
500
1000
1500
2000
2500
3000
3500
0 500 1000 1500 2000 2500 3000 3500
Reference Laboratory (ppm)
Nito
n X
Li X
RF
(ppm
)
Niton XLi
45 Degrees
Linear (Niton XLi)

E-3
Figure E-5: Linear Correlation Plot for Copper
y = 1.08x + 194.81R2 = 0.85
0
1000
2000
3000
4000
5000
6000
7000
0 1000 2000 3000 4000 5000 6000
Reference Laboratory (ppm)
Nito
n X
Li X
RF
(ppm
)
Niton XLi
45 Degrees
Linear (Niton XLi)
Figure E-6: Linear Correlation Plot for Iron
y = 1.15x + 2589.23R2 = 0.95
0
50000
100000
150000
200000
250000
0 20000 40000 60000 80000 100000 120000 140000 160000 180000 200000
Reference Laboratory (ppm)
Nito
n X
Li X
RF
(ppm
)
Niton XLi
45 Degrees
Linear (Niton XLi)
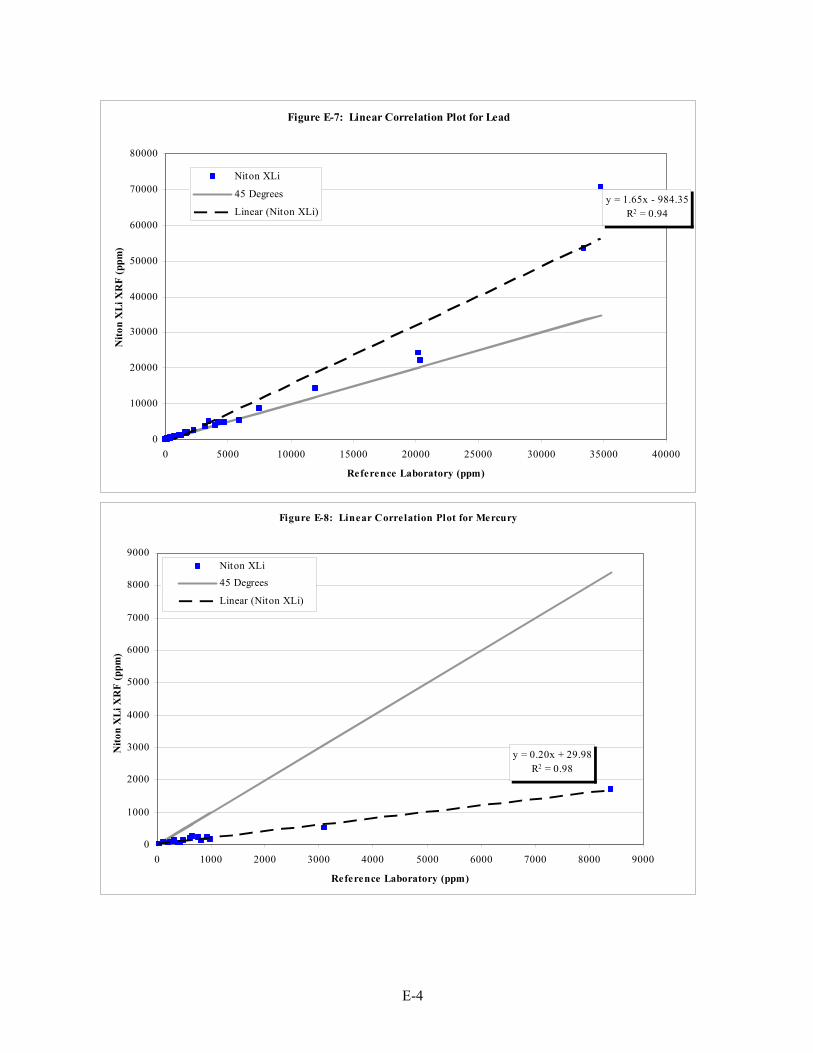
E-4
Figure E-7: Linear Correlation Plot for Lead
y = 1.65x - 984.35R2 = 0.94
0
10000
20000
30000
40000
50000
60000
70000
80000
0 5000 10000 15000 20000 25000 30000 35000 40000
Reference Laboratory (ppm)
Nito
n X
Li X
RF
(ppm
)
Niton XLi
45 Degrees
Linear (Niton XLi)
Figure E-8: Linear Correlation Plot for Mercury
y = 0.20x + 29.98R2 = 0.98
0
1000
2000
3000
4000
5000
6000
7000
8000
9000
0 1000 2000 3000 4000 5000 6000 7000 8000 9000
Reference Laboratory (ppm)
Nito
n X
Li X
RF
(ppm
)
Niton XLi45 Degrees
Linear (Niton XLi)
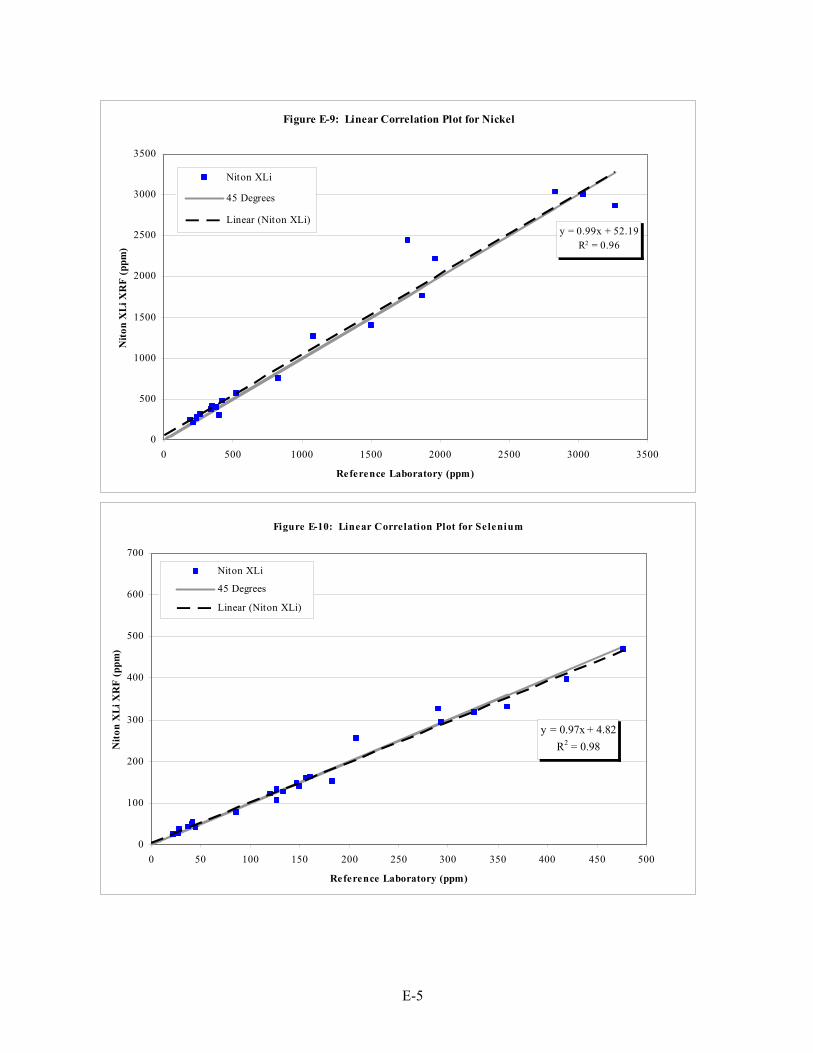
E-5
Figure E-9: Linear Correlation Plot for Nickel
y = 0.99x + 52.19R2 = 0.96
0
500
1000
1500
2000
2500
3000
3500
0 500 1000 1500 2000 2500 3000 3500
Reference Laboratory (ppm)
Nito
n X
Li X
RF
(ppm
)
Niton XLi
45 Degrees
Linear (Niton XLi)
Figure E-10: Linear Correlation Plot for Selenium
y = 0.97x + 4.82R2 = 0.98
0
100
200
300
400
500
600
700
0 50 100 150 200 250 300 350 400 450 500
Reference Laboratory (ppm)
Nito
n X
Li X
RF
(ppm
)
Niton XLi
45 Degrees
Linear (Niton XLi)

E-6
Figure E-11: Linear Correlation Plot for Silver
y = 0.24x + 370.00R2 = 0.90
0
50
100
150
200
250
300
350
400
450
500
0 50 100 150 200 250 300 350 400 450
Reference Laboratory (ppm)
Nito
n X
Li X
RF
(ppm
)
Niton XLi
45 Degrees
Linear (Niton XLi)
Figure E-12: Linear Correlation Plot for Vanadium
y = 2.66x - 366.85R2 = 0.74
0
100
200
300
400
500
600
700
800
900
1000
0 50 100 150 200 250 300 350 400 450 500
Reference Laboratory (ppm)
Nito
n X
Li X
RF
(ppm
)
Niton XLi
45 Degrees
Linear (Niton XLi)
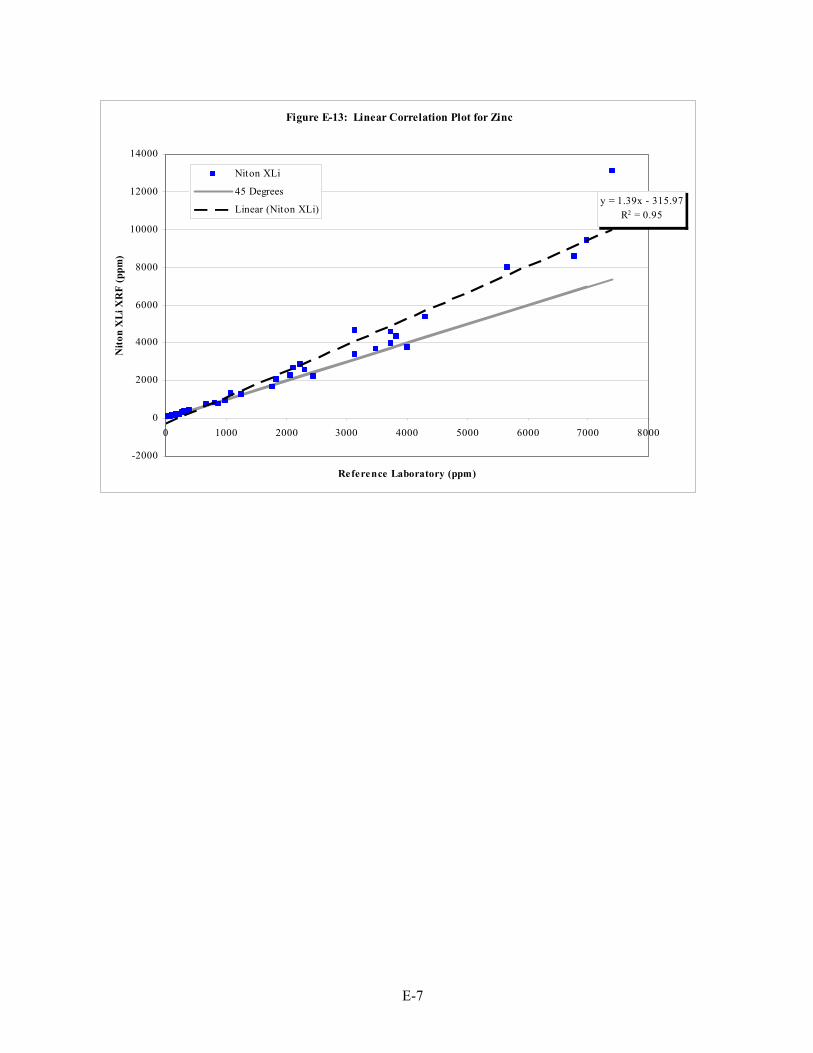
E-7
Figure E-13: Linear Correlation Plot for Zinc
y = 1.39x - 315.97R2 = 0.95
-2000
0
2000
4000
6000
8000
10000
12000
14000
0 1000 2000 3000 4000 5000 6000 7000 8000
Reference Laboratory (ppm)
Nito
n X
Li X
RF
(ppm
)
Niton XLi
45 Degrees
Linear (Niton XLi)

E-8
Box Plot for Relative Percent Difference (RPD)Niton XLi
Median; Box: 25%-75%; Whisker: Non-Outlier Range
Median 25%-75% Non-Outlier Range Outliers Extremes
64-TL
8-WS
9-WS 8-WS
9-WS
64-TL9-WS
57-CN
57-CN
9-WS
Sb-RLSb-CV
AsCd
CrCu
FePb
HgNi
SeAg
VZn
Target Element
-20%
0%
20%
40%
60%
80%
100%
120%
140%
160%
180%
Mea
n R
PD V
alue
s B
etw
een
the
Nito
n XL
ian
d th
e R
efer
ence
Lab
orat
ory
(RL)
and
Cer
tifie
d Va
lues
(CV)
55-LV
55-LV55-LV
55-LV
31-TL
Notes: The “box” in each box plot presents the range of RPD values that lie between the 25th and 75th percentiles (that is, the “quartiles”) of the full RPD population for each element. In essence, the box displays the “interquartile range” of RPD values. The square data point within each box represents the median RPD for the population. The “whiskers” emanating from the top and bottom of each box represent the largest and smallest data points, respectively, that are within 1.5 times the interquartile range. Values outside the whiskers are identified as outliers and extremes. Some of the more significant extremes and outliers are labeled with the associated Blend numbers and sample site abbreviations (see the footnotes of Table E-5 for definitions). Also refer to Appendix D for the sampling site associated with each Blend number. Figure E-14. Box and Whiskers Plot for Mean RPD Values Showing Outliers and Extremes for Target Elements, Niton XLi Data Set.

E-9
Table E-1. Evaluation of Accuracy - Relative Percent Differences Versus Reference Laboratory Data Calculated for the Niton XLi Conc Antimony Arsenic Cadmium Chromium Copper Iron Lead MercuryMatrix Range Statistic Ref Lab ERA Spike Soil Level 1 Number 9 -- 7 4 1 4 5 10 3 Minimum 4.0% -- 1.6% 12.2% 24.1% 5.8% 0.2% 1.3% 20.6% Maximum 169.0% -- 29.0% 34.8% 24.1% 73.9% 16.4% 107.0% 55.2% Mean 92.4% -- 17.7% 21.2% 24.1% 34.9% 6.4% 28.7% 36.9% Median 105.8% -- 22.9% 18.9% 24.1% 30.0% 4.2% 25.2% 35.0% Level 2 Number 5 1 4 7 4 8 13 4 7 Minimum 90.3% 6.2% 12.1% 2.6% 1.5% 6.8% 5.6% 2.9% 101.0% Maximum 122.9% 6.2% 28.5% 37.5% 16.1% 98.9% 64.9% 18.1% 150.9% Mean 113.0% 6.2% 20.7% 17.7% 8.9% 42.1% 28.4% 11.6% 127.4% Median 117.3% 6.2% 21.1% 19.8% 9.0% 33.5% 25.6% 12.6% 131.6% Level 3 Number 4 3 4 2 2 2 13 8 2 Minimum 96.5% 0.7% 14.9% 16.9% 28.4% 12.3% 0.4% 0.7% 131.9% Maximum 109.0% 6.3% 78.5% 27.6% 43.2% 25.4% 51.7% 37.9% 141.8% Mean 103.2% 4.1% 51.2% 22.3% 35.8% 18.9% 11.7% 13.5% 136.9% Median 103.6% 5.4% 55.7% 22.3% 35.8% 18.9% 4.7% 12.2% 136.9% Level 4 Number -- -- -- -- -- -- 7 5 -- Minimum -- -- -- -- -- -- 0.2% 8.3% -- Maximum -- -- -- -- -- -- 39.8% 68.1% -- Mean -- -- -- -- -- -- 15.1% 31.7% -- Median -- -- -- -- -- -- 9.8% 18.1% -- All Soil Number 18 4 15 13 7 14 38 27 12 Minimum 4.0% 0.7% 1.6% 2.6% 1.5% 5.8% 0.2% 0.7% 20.6% Maximum 169.0% 6.3% 78.5% 37.5% 43.2% 98.9% 64.9% 107.0% 150.9% Mean 100.5% 4.6% 27.4% 19.5% 18.7% 36.7% 17.4% 22.2% 106.4% Median 107.5% 5.8% 25.8% 19.8% 16.1% 28.4% 11.1% 17.8% 125.0%
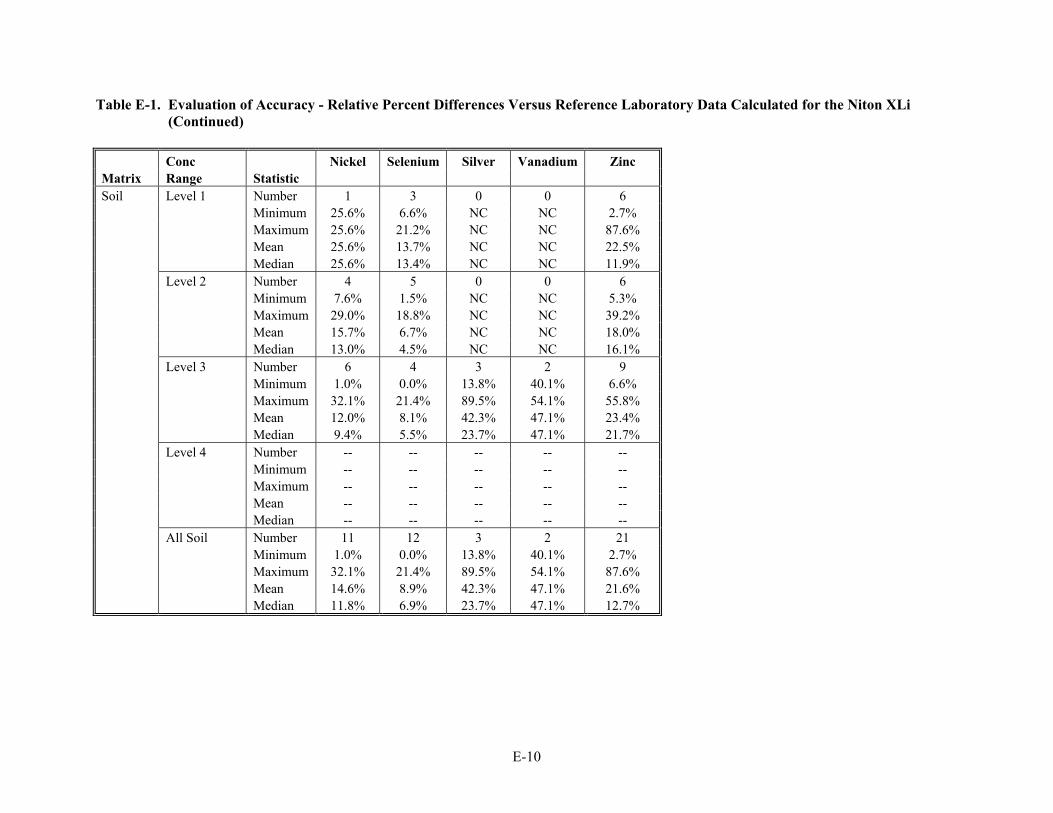
E-10
Table E-1. Evaluation of Accuracy - Relative Percent Differences Versus Reference Laboratory Data Calculated for the Niton XLi (Continued) Conc Nickel Selenium Silver Vanadium Zinc Matrix Range Statistic Soil Level 1 Number 1 3 0 0 6 Minimum 25.6% 6.6% NC NC 2.7% Maximum 25.6% 21.2% NC NC 87.6% Mean 25.6% 13.7% NC NC 22.5% Median 25.6% 13.4% NC NC 11.9% Level 2 Number 4 5 0 0 6 Minimum 7.6% 1.5% NC NC 5.3% Maximum 29.0% 18.8% NC NC 39.2% Mean 15.7% 6.7% NC NC 18.0% Median 13.0% 4.5% NC NC 16.1% Level 3 Number 6 4 3 2 9 Minimum 1.0% 0.0% 13.8% 40.1% 6.6% Maximum 32.1% 21.4% 89.5% 54.1% 55.8% Mean 12.0% 8.1% 42.3% 47.1% 23.4% Median 9.4% 5.5% 23.7% 47.1% 21.7% Level 4 Number -- -- -- -- -- Minimum -- -- -- -- -- Maximum -- -- -- -- -- Mean -- -- -- -- -- Median -- -- -- -- -- All Soil Number 11 12 3 2 21 Minimum 1.0% 0.0% 13.8% 40.1% 2.7% Maximum 32.1% 21.4% 89.5% 54.1% 87.6% Mean 14.6% 8.9% 42.3% 47.1% 21.6% Median 11.8% 6.9% 23.7% 47.1% 12.7%

E-11
Table E-1. Evaluation of Accuracy - Relative Percent Differences Versus Reference Laboratory Data Calculated for the Niton XLi (Continued) Conc Antimony Arsenic Cadmium Chromium Copper Iron Lead MercuryMatrix Range Statistic Ref Lab ERA Spike Sediment Level 1 Number 2 2 9 2 0 3 3 11 2 Minimum 130.5% 4.1% 0.2% 13.6% NC 10.1% 14.1% 1.5% 16.5% Maximum 144.9% 11.5% 33.4% 38.6% NC 25.8% 27.6% 47.7% 42.1% Mean 137.7% 7.8% 12.4% 26.1% NC 18.8% 20.3% 20.0% 29.3% Median 137.7% 7.8% 8.3% 26.1% NC 20.5% 19.1% 14.6% 29.3% Level 2 Number 4 4 4 4 2 4 19 4 4 Minimum 105.7% 2.6% 1.2% 14.8% 2.4% 5.6% 8.1% 2.6% 76.1% Maximum 149.4% 18.8% 17.2% 37.3% 4.8% 14.2% 77.5% 9.2% 152.2% Mean 127.3% 9.9% 10.8% 22.2% 3.6% 10.2% 25.6% 5.7% 104.2% Median 127.1% 9.2% 12.3% 18.2% 3.6% 10.4% 22.0% 5.5% 94.2% Level 3 Number 3 3 2 3 3 10 4 3 3 Minimum 93.8% 0.1% 8.8% 15.8% 17.2% 0.3% 3.8% 9.0% 86.6% Maximum 98.8% 4.2% 24.4% 24.2% 23.3% 16.2% 66.5% 27.2% 119.4% Mean 95.7% 2.3% 16.6% 20.4% 20.2% 6.3% 35.8% 15.9% 103.1% Median 94.6% 2.7% 16.6% 21.2% 20.2% 5.1% 36.5% 11.6% 103.4% Level 4 Number -- -- -- -- -- -- 6 -- -- Minimum -- -- -- -- -- -- 7.9% -- -- Maximum -- -- -- -- -- -- 23.3% -- -- Mean -- -- -- -- -- -- 17.9% -- -- Median -- -- -- -- -- -- 19.1% -- -- All Sediment Number 9 9 15 9 5 17 32 18 9 Minimum 93.8% 0.1% 0.2% 13.6% 2.4% 0.3% 3.8% 1.5% 16.5% Maximum 149.4% 18.8% 33.4% 38.6% 23.3% 25.8% 77.5% 47.7% 152.2% Mean 119.1% 6.9% 12.5% 22.4% 13.6% 9.4% 25.0% 16.2% 87.2% Median 111.7% 4.2% 8.8% 20.3% 17.2% 9.6% 19.2% 10.7% 86.6%
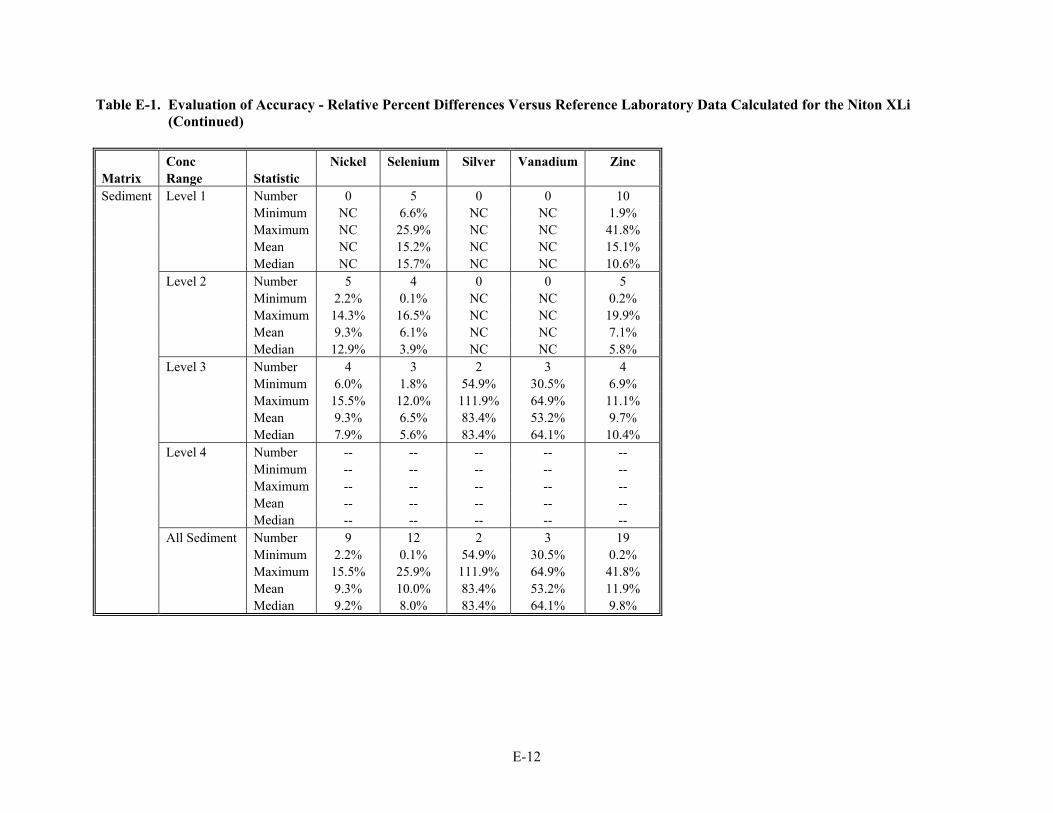
E-12
Table E-1. Evaluation of Accuracy - Relative Percent Differences Versus Reference Laboratory Data Calculated for the Niton XLi (Continued) Conc Nickel Selenium Silver Vanadium Zinc Matrix Range Statistic Sediment Level 1 Number 0 5 0 0 10 Minimum NC 6.6% NC NC 1.9% Maximum NC 25.9% NC NC 41.8% Mean NC 15.2% NC NC 15.1% Median NC 15.7% NC NC 10.6% Level 2 Number 5 4 0 0 5 Minimum 2.2% 0.1% NC NC 0.2% Maximum 14.3% 16.5% NC NC 19.9% Mean 9.3% 6.1% NC NC 7.1% Median 12.9% 3.9% NC NC 5.8% Level 3 Number 4 3 2 3 4 Minimum 6.0% 1.8% 54.9% 30.5% 6.9% Maximum 15.5% 12.0% 111.9% 64.9% 11.1% Mean 9.3% 6.5% 83.4% 53.2% 9.7% Median 7.9% 5.6% 83.4% 64.1% 10.4% Level 4 Number -- -- -- -- -- Minimum -- -- -- -- -- Maximum -- -- -- -- -- Mean -- -- -- -- -- Median -- -- -- -- -- All Sediment Number 9 12 2 3 19 Minimum 2.2% 0.1% 54.9% 30.5% 0.2% Maximum 15.5% 25.9% 111.9% 64.9% 41.8% Mean 9.3% 10.0% 83.4% 53.2% 11.9% Median 9.2% 8.0% 83.4% 64.1% 9.8%

E-13
Table E-1. Evaluation of Accuracy - Relative Percent Differences Versus Reference Laboratory Data Calculated for the Niton XLi (Continued) Conc Antimony Arsenic Cadmium Chromium Copper Iron Lead MercuryMatrix Range Statistic Ref Lab ERA Spike All Niton XLi Number 27 13 30 22 12 31 70 45 21 Samples Minimum 4.0% 0.1% 0.2% 2.6% 1.5% 0.3% 0.2% 0.7% 16.5% Maximum 169.0% 18.8% 78.5% 38.6% 43.2% 98.9% 77.5% 107.0% 152.2% Mean 106.7% 6.2% 20.0% 20.7% 16.6% 21.7% 20.8% 19.8% 98.1% Median 109.0% 5.4% 15.9% 19.9% 16.6% 13.2% 17.8% 14.6% 103.4% All All Instruments Number 206 110 320 209 338 363 558 392 192 Samples Minimum 0.1% 0.1% 0.2% 0.1% 0.1% 0.2% 0.0% 0.1% 0.0% Maximum 181.5% 162.0% 182.8% 168.1% 151.7% 111.1% 190.1% 135.2% 158.1% Mean 80.6% 62.7% 36.6% 29.6% 30.8% 24.6% 35.4% 30.9% 62.5% Median 84.3% 70.6% 26.2% 16.7% 26.0% 16.2% 26.0% 21.5% 58.6%

E-14
Table E-1. Evaluation of Accuracy Relative Percent Differences Versus Reference Laboratory Data Calculated for the Niton XLi (Continued) Conc Nickel Selenium Silver Vanadium Zinc Matrix Range Statistic All Niton XLi Number 20 24 5 5 40 Samples Minimum 1.0% 0.0% 13.8% 30.5% 0.2% Maximum 32.1% 25.9% 111.9% 64.9% 87.6% Mean 12.2% 9.5% 58.8% 50.7% 17.0% Median 11.8% 6.9% 54.9% 54.1% 11.2% All All Instruments Number 403 195 177 218 471 Samples Minimum 0.3% 0.0% 0.0% 0.1% 0.0% Maximum 146.5% 127.1% 129.7% 129.5% 138.0% Mean 31.0% 32.0% 36.0% 42.2% 26.3% Median 25.4% 16.7% 28.7% 38.3% 19.4%
Notes: All RPDs presented in this table are absolute values. -- No samples reported by the reference laboratory in this concentration range. Conc Concentration. ERA Environmental Resource Associates, Inc. NC Not calculated due to lack of XRF data. Number Number of demonstration samples evaluated. Ref Reference laboratory (Shealy Environmental Services, Inc.). RPD Relative percent difference. XRF X-ray fluorescence.

E-15
Table E-2. Evaluation of Precision - Relative Standard Deviations Calculated for the Niton XLi Conc Matrix Range Statistic Antimony Arsenic Cadmium Chromium Copper Iron Lead MercurySoil Low Number 9 7 4 1 4 5 10 3 Minimum 3.5% 5.8% 11.9% 27.6% 8.1% 3.0% 3.8% 11.6% Maximum 17.6% 28.4% 34.0% 27.6% 15.3% 8.0% 23.8% 19.2% Mean 10.7% 13.6% 21.4% 27.6% 10.7% 5.3% 12.4% 15.1% Median 10.4% 11.7% 19.9% 27.6% 9.7% 4.2% 13.4% 14.6% Medium Number 5 4 7 4 8 13 4 7 Minimum 5.3% 5.7% 2.1% 6.4% 1.6% 1.1% 1.9% 4.4% Maximum 8.6% 7.6% 13.6% 21.4% 14.2% 11.2% 4.9% 14.1% Mean 6.8% 6.5% 7.1% 13.3% 5.7% 3.1% 3.4% 8.5% Median 6.8% 6.4% 6.8% 12.7% 4.1% 2.3% 3.3% 7.6% High Number 4 4 2 2 2 13 8 2 Minimum 1.7% 0.6% 1.3% 3.6% 1.2% 0.9% 0.9% 3.6% Maximum 7.8% 5.0% 4.3% 6.2% 4.8% 8.9% 3.1% 3.8% Mean 4.0% 3.0% 2.8% 4.9% 3.0% 2.4% 2.3% 3.7% Median 3.2% 3.2% 2.8% 4.9% 3.0% 1.9% 2.3% 3.7% Very High Number -- -- -- -- -- 7 5 -- Minimum -- -- -- -- -- 1.6% 0.8% -- Maximum -- -- -- -- -- 10.9% 7.4% -- Mean -- -- -- -- -- 3.9% 4.0% -- Median -- -- -- -- -- 3.2% 3.9% -- All Soil Number 18 15 13 7 14 38 27 12 Minimum 1.7% 0.6% 1.3% 3.6% 1.2% 0.9% 0.8% 3.6% Maximum 17.6% 28.4% 34.0% 27.6% 15.3% 11.2% 23.8% 19.2% Mean 8.1% 8.9% 10.9% 12.9% 6.8% 3.3% 6.5% 9.3% Median 7.8% 6.4% 8.0% 9.4% 5.3% 2.4% 3.9% 8.5%
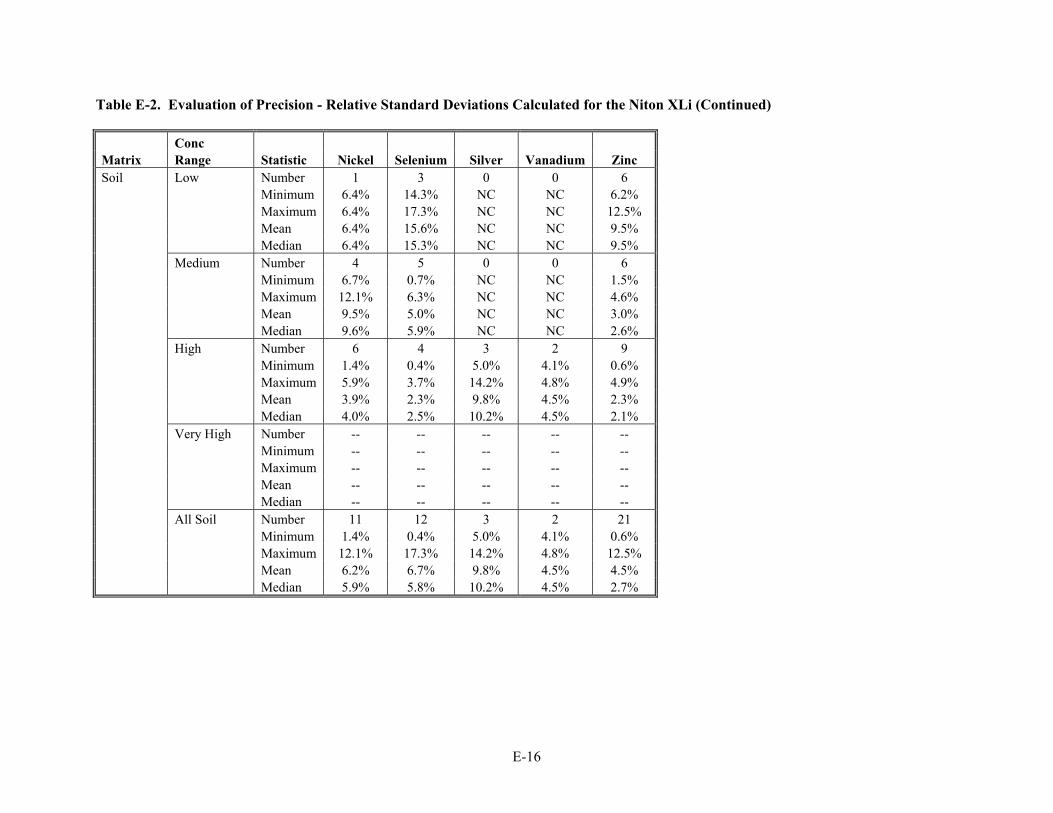
E-16
Table E-2. Evaluation of Precision - Relative Standard Deviations Calculated for the Niton XLi (Continued) Conc Matrix Range Statistic Nickel Selenium Silver Vanadium Zinc Soil Low Number 1 3 0 0 6 Minimum 6.4% 14.3% NC NC 6.2% Maximum 6.4% 17.3% NC NC 12.5% Mean 6.4% 15.6% NC NC 9.5% Median 6.4% 15.3% NC NC 9.5% Medium Number 4 5 0 0 6 Minimum 6.7% 0.7% NC NC 1.5% Maximum 12.1% 6.3% NC NC 4.6% Mean 9.5% 5.0% NC NC 3.0% Median 9.6% 5.9% NC NC 2.6% High Number 6 4 3 2 9 Minimum 1.4% 0.4% 5.0% 4.1% 0.6% Maximum 5.9% 3.7% 14.2% 4.8% 4.9% Mean 3.9% 2.3% 9.8% 4.5% 2.3% Median 4.0% 2.5% 10.2% 4.5% 2.1% Very High Number -- -- -- -- -- Minimum -- -- -- -- -- Maximum -- -- -- -- -- Mean -- -- -- -- -- Median -- -- -- -- -- All Soil Number 11 12 3 2 21 Minimum 1.4% 0.4% 5.0% 4.1% 0.6% Maximum 12.1% 17.3% 14.2% 4.8% 12.5% Mean 6.2% 6.7% 9.8% 4.5% 4.5% Median 5.9% 5.8% 10.2% 4.5% 2.7%

E-17
Table E-2. Evaluation of Precision - Relative Standard Deviations Calculated for the Niton XLi (Continued) Conc Matrix Range Statistic Antimony Arsenic Cadmium Chromium Copper Iron Lead MercurySediment Low Number 2 9 2 0 3 3 11 2 Minimum 4.3% 4.4% 6.1% NC 5.8% 7.3% 3.3% 12.4% Maximum 11.9% 23.9% 8.2% NC 21.1% 19.8% 25.5% 26.3% Mean 8.1% 10.3% 7.2% NC 11.1% 11.9% 9.5% 19.4% Median 8.1% 8.5% 7.2% NC 6.5% 8.5% 8.0% 19.4% Medium Number 4 4 4 2 4 19 4 4 Minimum 4.5% 3.4% 1.7% 11.6% 4.1% 1.2% 2.4% 1.4% Maximum 15.4% 8.0% 13.4% 31.8% 7.4% 4.2% 5.4% 19.7% Mean 10.1% 5.9% 7.4% 21.7% 6.1% 2.3% 3.8% 9.6% Median 10.4% 6.2% 7.3% 21.7% 6.5% 2.4% 3.7% 8.6% High Number 3 2 3 3 10 4 3 3 Minimum 1.3% 2.4% 1.1% 13.6% 0.8% 2.2% 1.0% 4.0% Maximum 6.2% 6.6% 7.3% 16.5% 6.9% 4.7% 1.7% 5.2% Mean 3.6% 4.5% 5.1% 14.9% 4.5% 3.0% 1.3% 4.5% Median 3.4% 4.5% 6.9% 14.6% 4.6% 2.6% 1.3% 4.3% Very High Number -- -- -- -- -- 6 -- -- Minimum -- -- -- -- -- 0.6% -- -- Maximum -- -- -- -- -- 2.4% -- -- Mean -- -- -- -- -- 1.7% -- -- Median -- -- -- -- -- 1.8% -- -- All Sediment Number 9 15 9 5 17 32 18 9 Minimum 1.3% 2.4% 1.1% 11.6% 0.8% 0.6% 1.0% 1.4% Maximum 15.4% 23.9% 13.4% 31.8% 21.1% 19.8% 25.5% 26.3% Mean 7.5% 8.3% 6.6% 17.6% 6.0% 3.2% 6.9% 10.1% Median 6.2% 7.2% 7.1% 14.6% 5.5% 2.3% 6.1% 7.9%

E-18
Table E-2. Evaluation of Precision - Relative Standard Deviations Calculated for the Niton XLi (Continued) Conc Matrix Range Statistic Nickel Selenium Silver Vanadium Zinc Sediment Low Number 0 5 0 0 10 Minimum NC 3.4% NC NC 5.3% Maximum NC 17.1% NC NC 19.6% Mean NC 9.9% NC NC 12.9% Median NC 7.6% NC NC 13.2% Medium Number 5 4 0 0 5 Minimum 8.3% 0.9% NC NC 1.2% Maximum 23.7% 10.5% NC NC 7.5% Mean 15.8% 5.1% NC NC 3.9% Median 12.4% 4.5% NC NC 3.5% High Number 4 3 2 3 4 Minimum 0.3% 0.7% 13.8% 8.6% 2.8% Maximum 9.1% 2.7% 23.0% 25.1% 5.8% Mean 4.7% 1.8% 18.4% 16.0% 4.1% Median 4.8% 1.9% 18.4% 14.3% 3.9% Very High Number -- -- -- -- -- Minimum -- -- -- -- -- Maximum -- -- -- -- -- Mean -- -- -- -- -- Median -- -- -- -- -- All Sediment Number 9 12 2 3 19 Minimum 0.3% 0.7% 13.8% 8.6% 1.2% Maximum 23.7% 17.1% 23.0% 25.1% 19.6% Mean 10.9% 6.3% 18.4% 16.0% 8.7% Median 9.1% 4.6% 18.4% 14.3% 5.8%
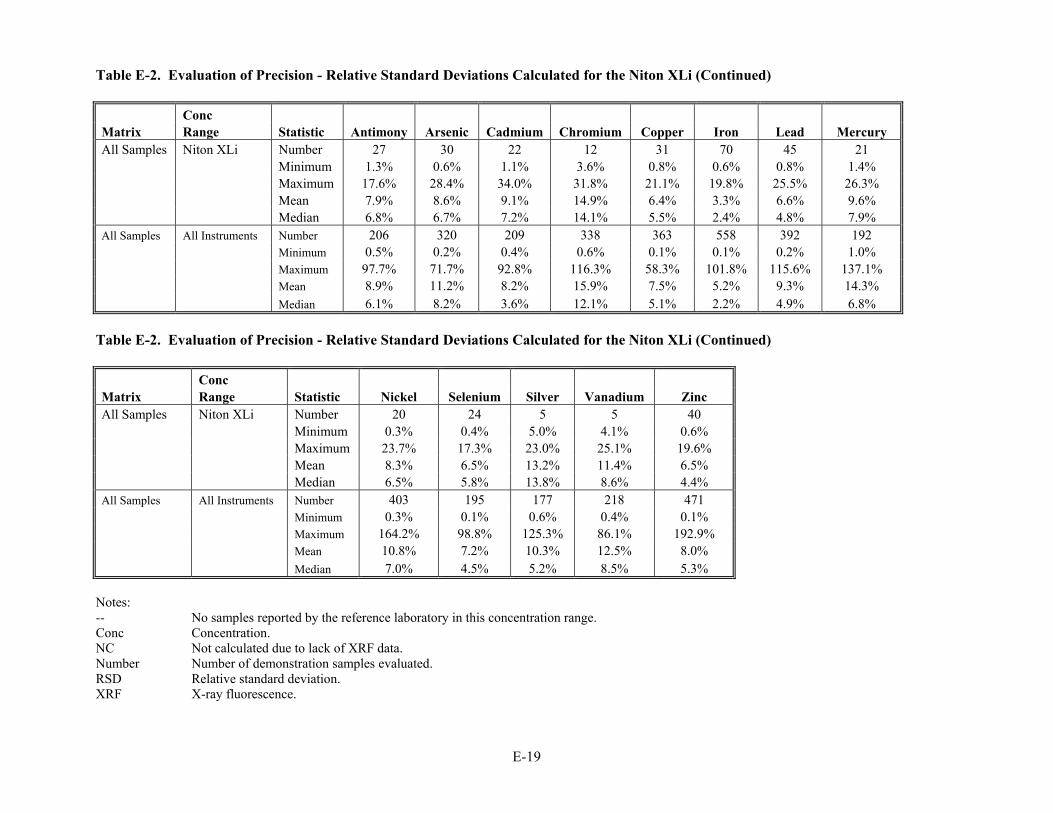
E-19
Table E-2. Evaluation of Precision - Relative Standard Deviations Calculated for the Niton XLi (Continued) Conc Matrix Range Statistic Antimony Arsenic Cadmium Chromium Copper Iron Lead Mercury All Samples Niton XLi Number 27 30 22 12 31 70 45 21 Minimum 1.3% 0.6% 1.1% 3.6% 0.8% 0.6% 0.8% 1.4% Maximum 17.6% 28.4% 34.0% 31.8% 21.1% 19.8% 25.5% 26.3% Mean 7.9% 8.6% 9.1% 14.9% 6.4% 3.3% 6.6% 9.6% Median 6.8% 6.7% 7.2% 14.1% 5.5% 2.4% 4.8% 7.9% All Samples All Instruments Number 206 320 209 338 363 558 392 192 Minimum 0.5% 0.2% 0.4% 0.6% 0.1% 0.1% 0.2% 1.0% Maximum 97.7% 71.7% 92.8% 116.3% 58.3% 101.8% 115.6% 137.1% Mean 8.9% 11.2% 8.2% 15.9% 7.5% 5.2% 9.3% 14.3% Median 6.1% 8.2% 3.6% 12.1% 5.1% 2.2% 4.9% 6.8%
Table E-2. Evaluation of Precision - Relative Standard Deviations Calculated for the Niton XLi (Continued) Conc Matrix Range Statistic Nickel Selenium Silver Vanadium Zinc All Samples Niton XLi Number 20 24 5 5 40 Minimum 0.3% 0.4% 5.0% 4.1% 0.6% Maximum 23.7% 17.3% 23.0% 25.1% 19.6% Mean 8.3% 6.5% 13.2% 11.4% 6.5% Median 6.5% 5.8% 13.8% 8.6% 4.4% All Samples All Instruments Number 403 195 177 218 471 Minimum 0.3% 0.1% 0.6% 0.4% 0.1% Maximum 164.2% 98.8% 125.3% 86.1% 192.9% Mean 10.8% 7.2% 10.3% 12.5% 8.0% Median 7.0% 4.5% 5.2% 8.5% 5.3%
Notes: -- No samples reported by the reference laboratory in this concentration range. Conc Concentration. NC Not calculated due to lack of XRF data. Number Number of demonstration samples evaluated. RSD Relative standard deviation. XRF X-ray fluorescence.

E-20
Table E-3. Evaluation of Precision - Relative Standard Deviations Calculated for the Reference Laboratory Matrix Statistic Antimony Arsenic Cadmium Chromium Copper Iron Lead MercuryAll Soil Number 17 23 15 34 26 38 33 16 Minimum 3.6% 1.4% 0.9% 1.4% 0.0% 1.6% 0.0% 0.0% Maximum 38.0% 45.8% 21.4% 137.0% 21.0% 46.2% 150.0% 50.7% Mean 14.3% 11.7% 11.1% 14.3% 10.1% 10.2% 17.6% 13.8% Median 9.8% 12.4% 9.0% 10.6% 9.1% 8.7% 13.2% 6.6% All Sediment Number 7 24 10 26 21 31 22 10 Minimum 2.9% 2.4% 2.9% 4.6% 1.8% 2.7% 0.0% 2.8% Maximum 33.6% 36.7% 37.5% 35.5% 38.8% 37.5% 41.1% 48.0% Mean 14.4% 10.7% 11.4% 9.8% 9.7% 9.9% 11.6% 14.3% Median 9.1% 9.2% 8.2% 7.5% 8.9% 8.1% 7.4% 6.9% All Samples Number 24 47 25 60 47 69 55 26 Minimum 2.9% 1.4% 0.9% 1.4% 0.0% 1.6% 0.0% 0.0% Maximum 38.0% 45.8% 37.5% 137.0% 38.8% 46.2% 150.0% 50.7% Mean 14.3% 11.2% 11.2% 12.4% 9.9% 10.1% 15.2% 14.0% Median 9.5% 9.5% 9.0% 8.4% 8.9% 8.5% 8.6% 6.6%
Table E-3. Evaluation of Precision - Relative Standard Deviations Calculated for the Reference Laboratory (Continued) Matrix Statistic Nickel Selenium Silver Vanadium Zinc All Soil Number 35 13 13 21 35 Minimum 0.0% 0.0% 2.3% 0.0% 1.0% Maximum 44.9% 22.7% 37.1% 18.1% 46.5% Mean 11.4% 8.9% 12.4% 8.4% 10.4% Median 10.0% 7.1% 7.5% 6.6% 9.1% All Sediment Number 27 12 10 17 27 Minimum 0.6% 1.3% 1.0% 2.2% 1.4% Maximum 35.8% 37.3% 21.3% 21.9% 35.8% Mean 9.4% 10.0% 9.4% 8.4% 8.9% Median 7.3% 7.6% 6.6% 8.1% 6.9% All Samples Number 62 25 23 38 62 Minimum 0.0% 0.0% 1.0% 0.0% 1.0% Maximum 44.9% 37.3% 37.1% 21.9% 46.5% Mean 10.6% 9.4% 11.1% 8.4% 9.8% Median 8.2% 7.4% 7.1% 7.2% 7.4%
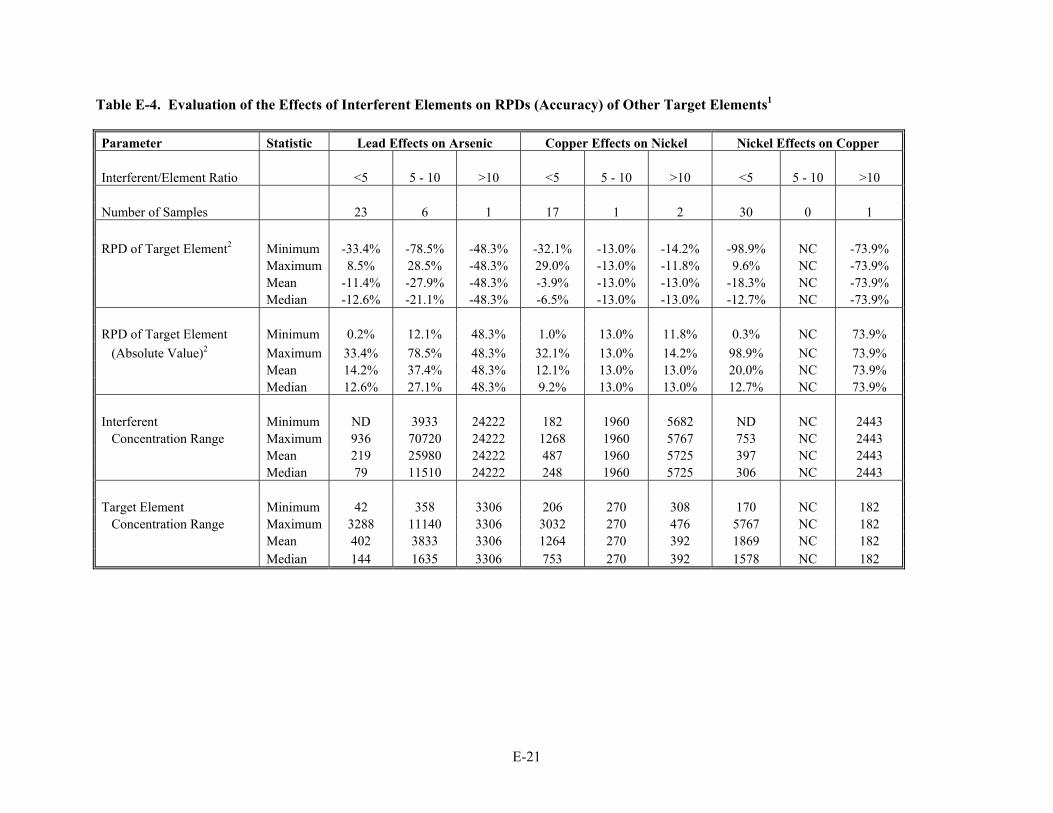
E-21
Table E-4. Evaluation of the Effects of Interferent Elements on RPDs (Accuracy) of Other Target Elements1 Parameter Statistic Lead Effects on Arsenic Copper Effects on Nickel Nickel Effects on Copper Interferent/Element Ratio <5 5 - 10 >10 <5 5 - 10 >10 <5 5 - 10 >10 Number of Samples 23 6 1 17 1 2 30 0 1 RPD of Target Element2 Minimum -33.4% -78.5% -48.3% -32.1% -13.0% -14.2% -98.9% NC -73.9% Maximum 8.5% 28.5% -48.3% 29.0% -13.0% -11.8% 9.6% NC -73.9% Mean -11.4% -27.9% -48.3% -3.9% -13.0% -13.0% -18.3% NC -73.9% Median -12.6% -21.1% -48.3% -6.5% -13.0% -13.0% -12.7% NC -73.9% RPD of Target Element Minimum 0.2% 12.1% 48.3% 1.0% 13.0% 11.8% 0.3% NC 73.9% (Absolute Value)2 Maximum 33.4% 78.5% 48.3% 32.1% 13.0% 14.2% 98.9% NC 73.9% Mean 14.2% 37.4% 48.3% 12.1% 13.0% 13.0% 20.0% NC 73.9% Median 12.6% 27.1% 48.3% 9.2% 13.0% 13.0% 12.7% NC 73.9% Interferent Minimum ND 3933 24222 182 1960 5682 ND NC 2443 Concentration Range Maximum 936 70720 24222 1268 1960 5767 753 NC 2443 Mean 219 25980 24222 487 1960 5725 397 NC 2443 Median 79 11510 24222 248 1960 5725 306 NC 2443 Target Element Minimum 42 358 3306 206 270 308 170 NC 182 Concentration Range Maximum 3288 11140 3306 3032 270 476 5767 NC 182 Mean 402 3833 3306 1264 270 392 1869 NC 182 Median 144 1635 3306 753 270 392 1578 NC 182
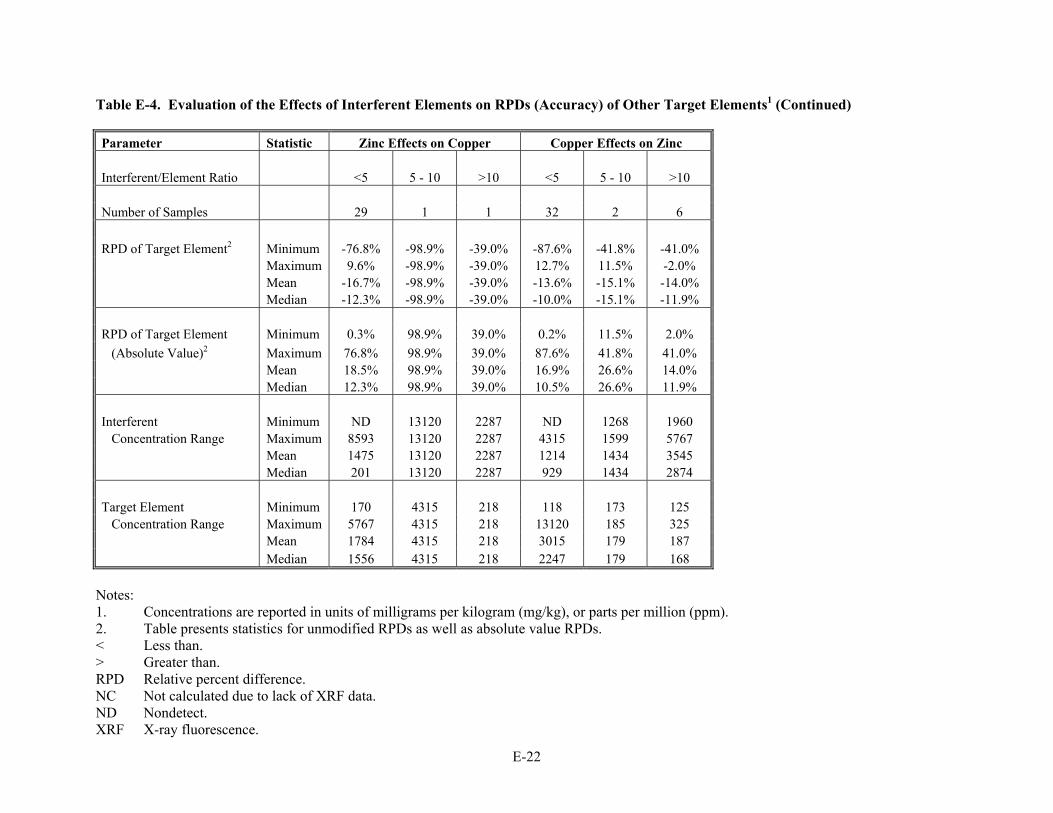
E-22
Table E-4. Evaluation of the Effects of Interferent Elements on RPDs (Accuracy) of Other Target Elements1 (Continued) Parameter Statistic Zinc Effects on Copper Copper Effects on Zinc Interferent/Element Ratio <5 5 - 10 >10 <5 5 - 10 >10 Number of Samples 29 1 1 32 2 6 RPD of Target Element2 Minimum -76.8% -98.9% -39.0% -87.6% -41.8% -41.0% Maximum 9.6% -98.9% -39.0% 12.7% 11.5% -2.0% Mean -16.7% -98.9% -39.0% -13.6% -15.1% -14.0% Median -12.3% -98.9% -39.0% -10.0% -15.1% -11.9% RPD of Target Element Minimum 0.3% 98.9% 39.0% 0.2% 11.5% 2.0% (Absolute Value)2 Maximum 76.8% 98.9% 39.0% 87.6% 41.8% 41.0% Mean 18.5% 98.9% 39.0% 16.9% 26.6% 14.0% Median 12.3% 98.9% 39.0% 10.5% 26.6% 11.9% Interferent Minimum ND 13120 2287 ND 1268 1960 Concentration Range Maximum 8593 13120 2287 4315 1599 5767 Mean 1475 13120 2287 1214 1434 3545 Median 201 13120 2287 929 1434 2874 Target Element Minimum 170 4315 218 118 173 125 Concentration Range Maximum 5767 4315 218 13120 185 325 Mean 1784 4315 218 3015 179 187 Median 1556 4315 218 2247 179 168
Notes: 1. Concentrations are reported in units of milligrams per kilogram (mg/kg), or parts per million (ppm). 2. Table presents statistics for unmodified RPDs as well as absolute value RPDs. < Less than. > Greater than. RPD Relative percent difference. NC Not calculated due to lack of XRF data. ND Nondetect. XRF X-ray fluorescence.
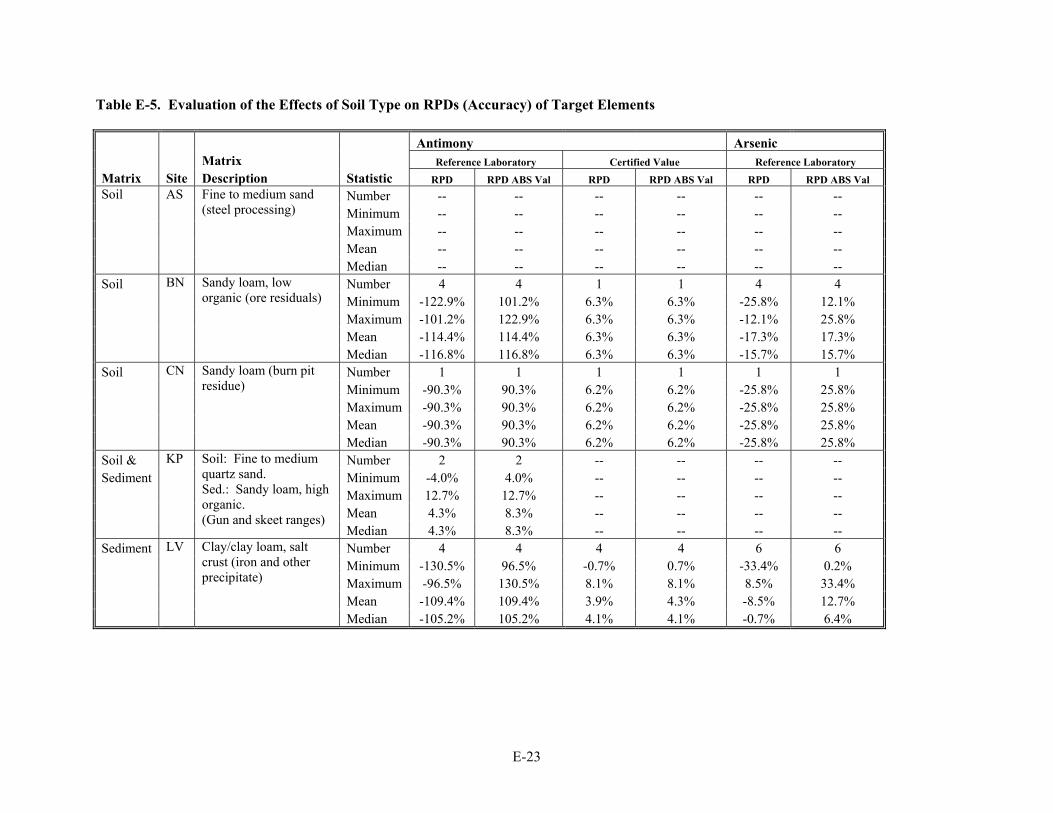
E-23
Table E-5. Evaluation of the Effects of Soil Type on RPDs (Accuracy) of Target Elements Antimony Arsenic Matrix Reference Laboratory Certified Value Reference Laboratory Matrix Site Description Statistic RPD RPD ABS Val RPD RPD ABS Val RPD RPD ABS Val
Number -- -- -- -- -- -- Minimum -- -- -- -- -- -- Maximum -- -- -- -- -- --
Soil
Mean -- -- -- -- -- --
AS Fine to medium sand (steel processing)
Median -- -- -- -- -- -- Soil Number 4 4 1 1 4 4 Minimum -122.9% 101.2% 6.3% 6.3% -25.8% 12.1% Maximum -101.2% 122.9% 6.3% 6.3% -12.1% 25.8% Mean -114.4% 114.4% 6.3% 6.3% -17.3% 17.3%
BN Sandy loam, low organic (ore residuals)
Median -116.8% 116.8% 6.3% 6.3% -15.7% 15.7% Soil Number 1 1 1 1 1 1 Minimum -90.3% 90.3% 6.2% 6.2% -25.8% 25.8% Maximum -90.3% 90.3% 6.2% 6.2% -25.8% 25.8% Mean -90.3% 90.3% 6.2% 6.2% -25.8% 25.8%
CN Sandy loam (burn pit residue)
Median -90.3% 90.3% 6.2% 6.2% -25.8% 25.8% Soil & Number 2 2 -- -- -- -- Sediment Minimum -4.0% 4.0% -- -- -- -- Maximum 12.7% 12.7% -- -- -- -- Mean 4.3% 8.3% -- -- -- --
KP Soil: Fine to medium quartz sand. Sed.: Sandy loam, high organic. (Gun and skeet ranges)
Median 4.3% 8.3% -- -- -- -- Sediment Number 4 4 4 4 6 6 Minimum -130.5% 96.5% -0.7% 0.7% -33.4% 0.2% Maximum -96.5% 130.5% 8.1% 8.1% 8.5% 33.4% Mean -109.4% 109.4% 3.9% 4.3% -8.5% 12.7%
LV Clay/clay loam, salt crust (iron and other precipitate)
Median -105.2% 105.2% 4.1% 4.1% -0.7% 6.4%

E-24
Table E-5. Evaluation of the Effects of Soil Type on RPDs (Accuracy) of Target Elements (Continued) Cadmium Chromium Copper Matrix Reference Laboratory Reference Laboratory Reference Laboratory Matrix Site Description Statistic RPD RPD ABS Val RPD RPD ABS Val RPD RPD ABS Val
Number 2 2 -- -- 1 1 Minimum -31.3% 17.9% -- -- -12.3% 12.3% Maximum 17.9% 31.3% -- -- -12.3% 12.3%
Soil
Mean -6.7% 24.6% -- -- -12.3% 12.3%
AS Fine to medium sand (steel processing)
Median -6.7% 24.6% -- -- -12.3% 12.3% Soil Number 5 5 2 2 4 4 Minimum -19.9% 4.5% 16.1% 16.1% -31.4% 21.0% Maximum 8.0% 19.9% 43.2% 43.2% -21.0% 31.4% Mean -10.6% 13.8% 29.6% 29.6% -24.3% 24.3%
BN Sandy loam, low organic (ore residuals)
Median -16.9% 16.9% -1.5% 2.1% -22.5% 22.5% Soil Number 2 2 -- -- 2 2 Minimum -34.8% 2.6% -- -- -39.0% 6.8% Maximum 2.6% 34.8% -- -- 6.8% 39.0% Mean -16.1% 18.7% -- -- -16.1% 22.9%
CN Sandy loam (burn pit residue)
Median -16.1% 18.7% -- -- -16.1% 22.9% Soil & Number -- -- 1 1 2 2 Sediment Minimum -- -- 24.1% 24.1% -35.7% 5.8% Maximum -- -- 24.1% 24.1% 5.8% 35.7% Mean -- -- 24.1% 24.1% -15.0% 20.7%
KP Soil: Fine to medium quartz sand. Sed.: Sandy loam, high organic. (Gun and skeet ranges)
Median -- -- 24.1% 24.1% -15.0% 20.7% Sediment Number 5 5 4 4 3 3 Minimum -38.6% 15.8% -2.4% 1.5% -73.9% 3.0% Maximum -15.8% 38.6% 17.2% 17.2% -3.0% 73.9% Mean -26.5% 26.5% 2.8% 5.8% -29.0% 29.0%
LV Clay/clay loam, salt crust (iron and other precipitate)
Median -20.4% 20.4% -1.8% 2.2% -10.1% 10.1%
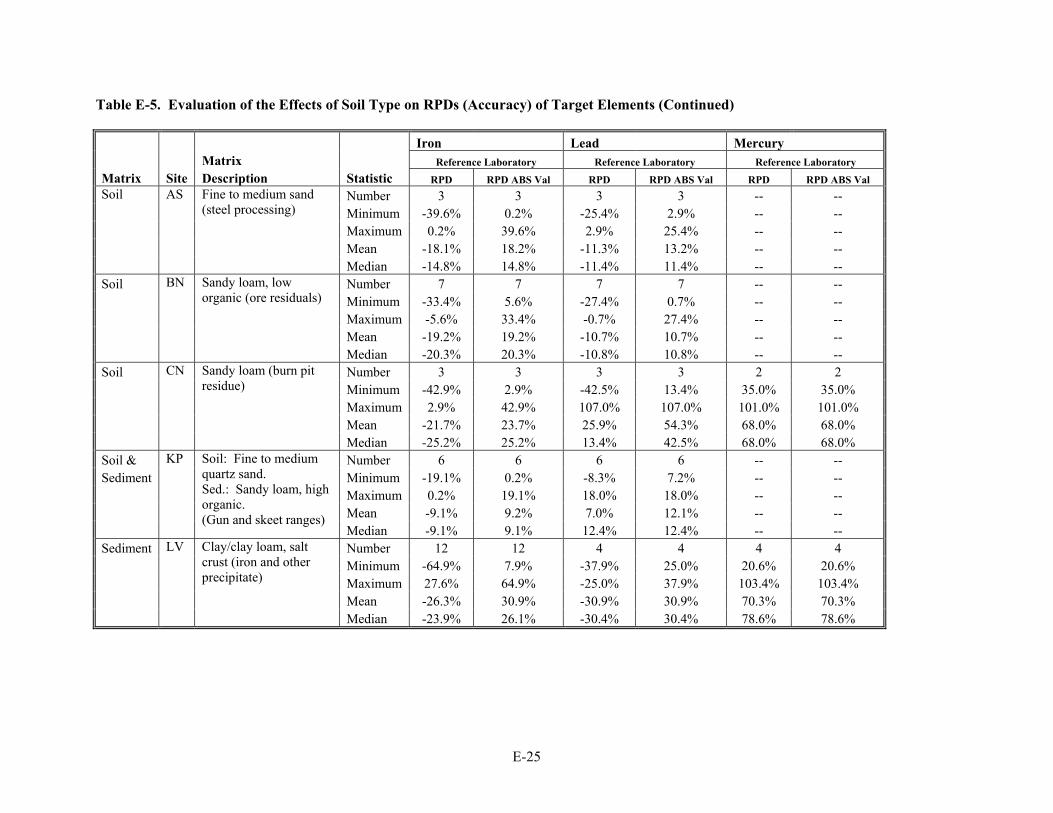
E-25
Table E-5. Evaluation of the Effects of Soil Type on RPDs (Accuracy) of Target Elements (Continued) Iron Lead Mercury Matrix Reference Laboratory Reference Laboratory Reference Laboratory Matrix Site Description Statistic RPD RPD ABS Val RPD RPD ABS Val RPD RPD ABS Val
Number 3 3 3 3 -- -- Minimum -39.6% 0.2% -25.4% 2.9% -- -- Maximum 0.2% 39.6% 2.9% 25.4% -- --
Soil
Mean -18.1% 18.2% -11.3% 13.2% -- --
AS Fine to medium sand (steel processing)
Median -14.8% 14.8% -11.4% 11.4% -- -- Soil Number 7 7 7 7 -- -- Minimum -33.4% 5.6% -27.4% 0.7% -- -- Maximum -5.6% 33.4% -0.7% 27.4% -- -- Mean -19.2% 19.2% -10.7% 10.7% -- --
BN Sandy loam, low organic (ore residuals)
Median -20.3% 20.3% -10.8% 10.8% -- -- Soil Number 3 3 3 3 2 2 Minimum -42.9% 2.9% -42.5% 13.4% 35.0% 35.0% Maximum 2.9% 42.9% 107.0% 107.0% 101.0% 101.0% Mean -21.7% 23.7% 25.9% 54.3% 68.0% 68.0%
CN Sandy loam (burn pit residue)
Median -25.2% 25.2% 13.4% 42.5% 68.0% 68.0% Soil & Number 6 6 6 6 -- -- Sediment Minimum -19.1% 0.2% -8.3% 7.2% -- -- Maximum 0.2% 19.1% 18.0% 18.0% -- -- Mean -9.1% 9.2% 7.0% 12.1% -- --
KP Soil: Fine to medium quartz sand. Sed.: Sandy loam, high organic. (Gun and skeet ranges)
Median -9.1% 9.1% 12.4% 12.4% -- -- Sediment Number 12 12 4 4 4 4 Minimum -64.9% 7.9% -37.9% 25.0% 20.6% 20.6% Maximum 27.6% 64.9% -25.0% 37.9% 103.4% 103.4% Mean -26.3% 30.9% -30.9% 30.9% 70.3% 70.3%
LV Clay/clay loam, salt crust (iron and other precipitate)
Median -23.9% 26.1% -30.4% 30.4% 78.6% 78.6%

E-26
Table E-5. Evaluation of the Effects of Soil Type on RPDs (Accuracy) of Target Elements (Continued) Nickel Selenium Silver Matrix Reference Laboratory Reference Laboratory Reference Laboratory Matrix Site Description Statistic RPD RPD ABS Val RPD RPD ABS Val RPD RPD ABS Val
Number 1 1 1 1 1 1 Minimum -11.8% 11.8% -1.5% 1.5% -23.7% 23.7% Maximum -11.8% 11.8% -1.5% 1.5% -23.7% 23.7%
Soil
Mean -11.8% 11.8% -1.5% 1.5% -23.7% 23.7%
AS Fine to medium sand (steel processing)
Median -11.8% 11.8% -1.5% 1.5% -23.7% 23.7% Soil Number 2 2 3 3 1 1 Minimum -6.8% 6.8% -21.2% 0.0% -89.5% 89.5% Maximum 6.9% 6.9% 4.5% 21.2% -89.5% 89.5% Mean 0.1% 6.9% -5.6% 8.5% -89.5% 89.5%
BN Sandy loam, low organic (ore residuals)
Median 0.1% 6.9% 0.0% 4.5% -89.5% 89.5% Soil Number 1 1 2 2 -- -- Minimum 29.0% 29.0% -13.4% 13.4% -- -- Maximum 29.0% 29.0% 18.8% 18.8% -- -- Mean 29.0% 29.0% 2.7% 16.1% -- --
CN Sandy loam (burn pit residue)
Median 29.0% 29.0% 2.7% 16.1% -- -- Soil & Number -- -- -- -- -- -- Sediment Minimum -- -- -- -- -- -- Maximum -- -- -- -- -- -- Mean -- -- -- -- -- --
KP Soil: Fine to medium quartz sand. Sed.: Sandy loam, high organic. (Gun and skeet ranges)
Median -- -- -- -- -- -- Sediment Number 5 5 5 5 1 1 Minimum -32.1% 6.5% -21.4% 1.5% -54.9% 54.9% Maximum 9.2% 32.1% 9.4% 21.4% -54.9% 54.9% Mean -11.1% 14.8% -2.1% 8.1% -54.9% 54.9%
LV Clay/clay loam, salt crust (iron and other precipitate)
Median -11.8% 11.8% -1.5% 5.6% -54.9% 54.9%
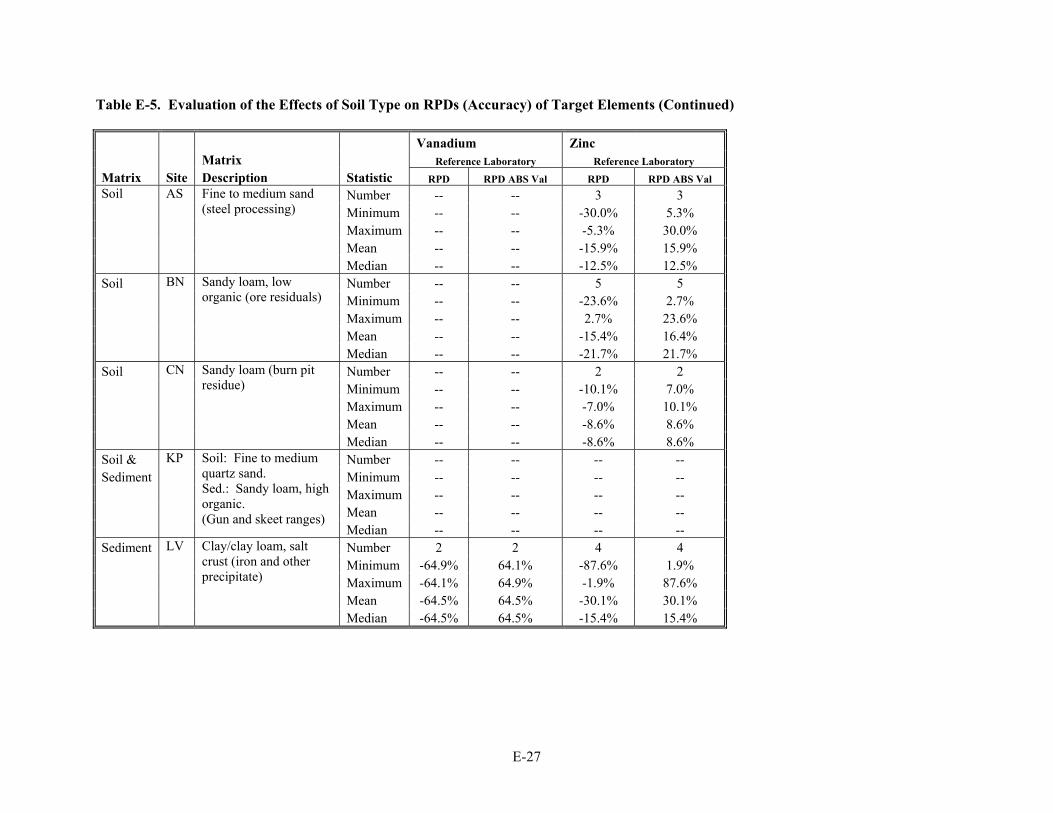
E-27
Table E-5. Evaluation of the Effects of Soil Type on RPDs (Accuracy) of Target Elements (Continued) Vanadium Zinc Matrix Reference Laboratory Reference Laboratory Matrix Site Description Statistic RPD RPD ABS Val RPD RPD ABS Val
Number -- -- 3 3 Minimum -- -- -30.0% 5.3% Maximum -- -- -5.3% 30.0%
Soil
Mean -- -- -15.9% 15.9%
AS Fine to medium sand (steel processing)
Median -- -- -12.5% 12.5% Soil Number -- -- 5 5 Minimum -- -- -23.6% 2.7% Maximum -- -- 2.7% 23.6% Mean -- -- -15.4% 16.4%
BN Sandy loam, low organic (ore residuals)
Median -- -- -21.7% 21.7% Soil Number -- -- 2 2 Minimum -- -- -10.1% 7.0% Maximum -- -- -7.0% 10.1% Mean -- -- -8.6% 8.6%
CN Sandy loam (burn pit residue)
Median -- -- -8.6% 8.6% Soil & Number -- -- -- -- Sediment Minimum -- -- -- -- Maximum -- -- -- -- Mean -- -- -- --
KP Soil: Fine to medium quartz sand. Sed.: Sandy loam, high organic. (Gun and skeet ranges)
Median -- -- -- -- Sediment Number 2 2 4 4 Minimum -64.9% 64.1% -87.6% 1.9% Maximum -64.1% 64.9% -1.9% 87.6% Mean -64.5% 64.5% -30.1% 30.1%
LV Clay/clay loam, salt crust (iron and other precipitate)
Median -64.5% 64.5% -15.4% 15.4%
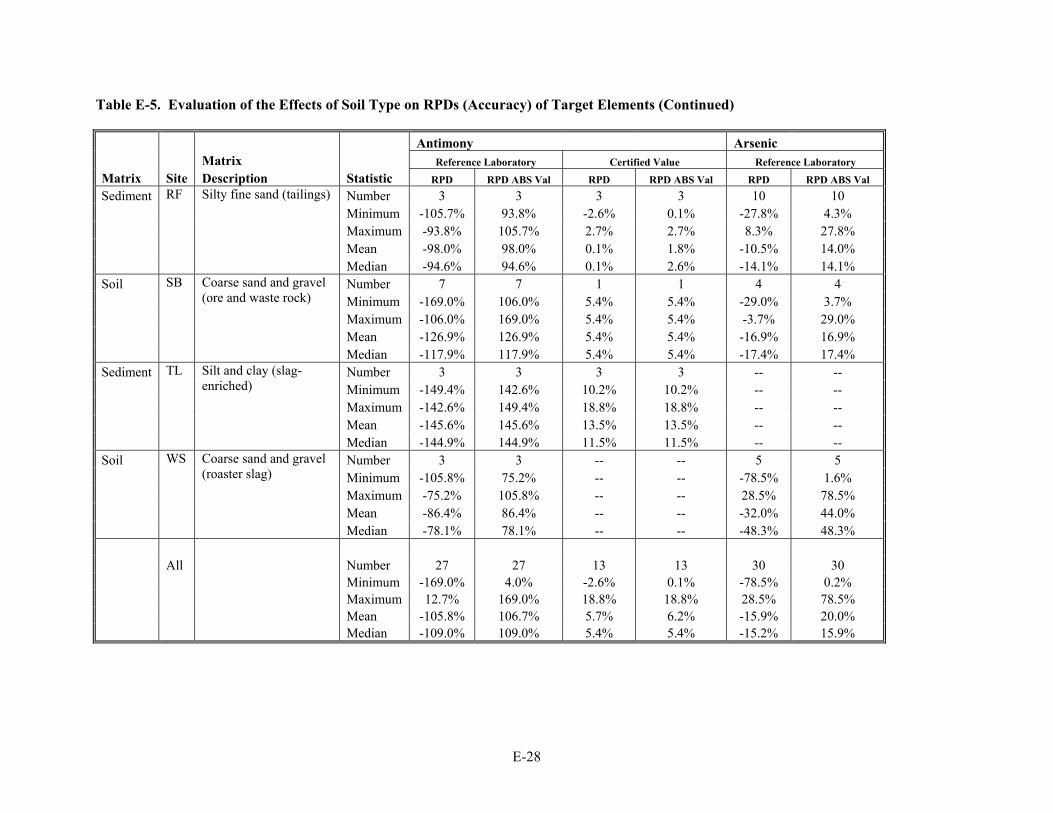
E-28
Table E-5. Evaluation of the Effects of Soil Type on RPDs (Accuracy) of Target Elements (Continued) Antimony Arsenic Matrix Reference Laboratory Certified Value Reference Laboratory Matrix Site Description Statistic RPD RPD ABS Val RPD RPD ABS Val RPD RPD ABS Val Sediment Number 3 3 3 3 10 10 Minimum -105.7% 93.8% -2.6% 0.1% -27.8% 4.3% Maximum -93.8% 105.7% 2.7% 2.7% 8.3% 27.8% Mean -98.0% 98.0% 0.1% 1.8% -10.5% 14.0%
RF Silty fine sand (tailings)
Median -94.6% 94.6% 0.1% 2.6% -14.1% 14.1% Soil Number 7 7 1 1 4 4 Minimum -169.0% 106.0% 5.4% 5.4% -29.0% 3.7% Maximum -106.0% 169.0% 5.4% 5.4% -3.7% 29.0% Mean -126.9% 126.9% 5.4% 5.4% -16.9% 16.9%
SB Coarse sand and gravel (ore and waste rock)
Median -117.9% 117.9% 5.4% 5.4% -17.4% 17.4% Sediment Number 3 3 3 3 -- -- Minimum -149.4% 142.6% 10.2% 10.2% -- -- Maximum -142.6% 149.4% 18.8% 18.8% -- -- Mean -145.6% 145.6% 13.5% 13.5% -- --
TL Silt and clay (slag-enriched)
Median -144.9% 144.9% 11.5% 11.5% -- -- Soil Number 3 3 -- -- 5 5 Minimum -105.8% 75.2% -- -- -78.5% 1.6% Maximum -75.2% 105.8% -- -- 28.5% 78.5% Mean -86.4% 86.4% -- -- -32.0% 44.0%
WS Coarse sand and gravel (roaster slag)
Median -78.1% 78.1% -- -- -48.3% 48.3% All Number 27 27 13 13 30 30 Minimum -169.0% 4.0% -2.6% 0.1% -78.5% 0.2% Maximum 12.7% 169.0% 18.8% 18.8% 28.5% 78.5% Mean -105.8% 106.7% 5.7% 6.2% -15.9% 20.0% Median -109.0% 109.0% 5.4% 5.4% -15.2% 15.9%

E-29
Table E-5. Evaluation of the Effects of Soil Type on RPDs (Accuracy) of Target Elements (Continued) Cadmium Chromium Copper Matrix Reference Laboratory Reference Laboratory Reference Laboratory Matrix Site Description Statistic RPD RPD ABS Val RPD RPD ABS Val RPD RPD ABS Val Sediment Number 4 4 3 3 8 8 Minimum -37.3% 16.2% 4.8% 4.8% -25.8% 0.3% Maximum -16.2% 37.3% 23.3% 23.3% 0.3% 25.8% Mean -24.7% 24.7% 16.1% 16.1% -12.8% 12.9%
RF Silty fine sand (tailings)
Median -22.7% 22.7% 20.2% 20.2% -12.4% 12.4% Soil Number 1 1 1 1 -- -- Minimum -27.6% 27.6% 28.4% 28.4% -- -- Maximum -27.6% 27.6% 28.4% 28.4% -- -- Mean -27.6% 27.6% 28.4% 28.4% -- --
SB Coarse sand and gravel (ore and waste rock)
Median -27.6% 27.6% 28.4% 28.4% -- -- Sediment Number 2 2 -- -- 7 7 Minimum -14.8% 13.6% -- -- -13.2% 0.6% Maximum -13.6% 14.8% -- -- 9.6% 13.2% Mean -14.2% 14.2% -- -- -2.4% 6.2%
TL Silt and clay (slag-enriched)
Median -14.2% 14.2% -- -- -2.2% 6.4% Soil Number 1 1 1 1 4 4 Minimum -12.2% 12.2% 15.8% 15.8% -98.9% 25.4% Maximum -12.2% 12.2% 15.8% 15.8% -25.4% 98.9% Mean -12.2% 12.2% 15.8% 15.8% -60.9% 60.9%
WS Coarse sand and gravel (roaster slag)
Median -12.2% 12.2% 15.8% 15.8% -59.7% 59.7% All Number 22 22 12 12 31 31 Minimum -38.6% 2.6% -2.4% 1.5% -98.9% 0.3% Maximum 17.9% 38.6% 43.2% 43.2% 9.6% 98.9% Mean -18.1% 20.7% 15.6% 16.6% -20.1% 21.7% Median -19.9% 19.9% 16.6% 16.6% -13.2% 13.2%
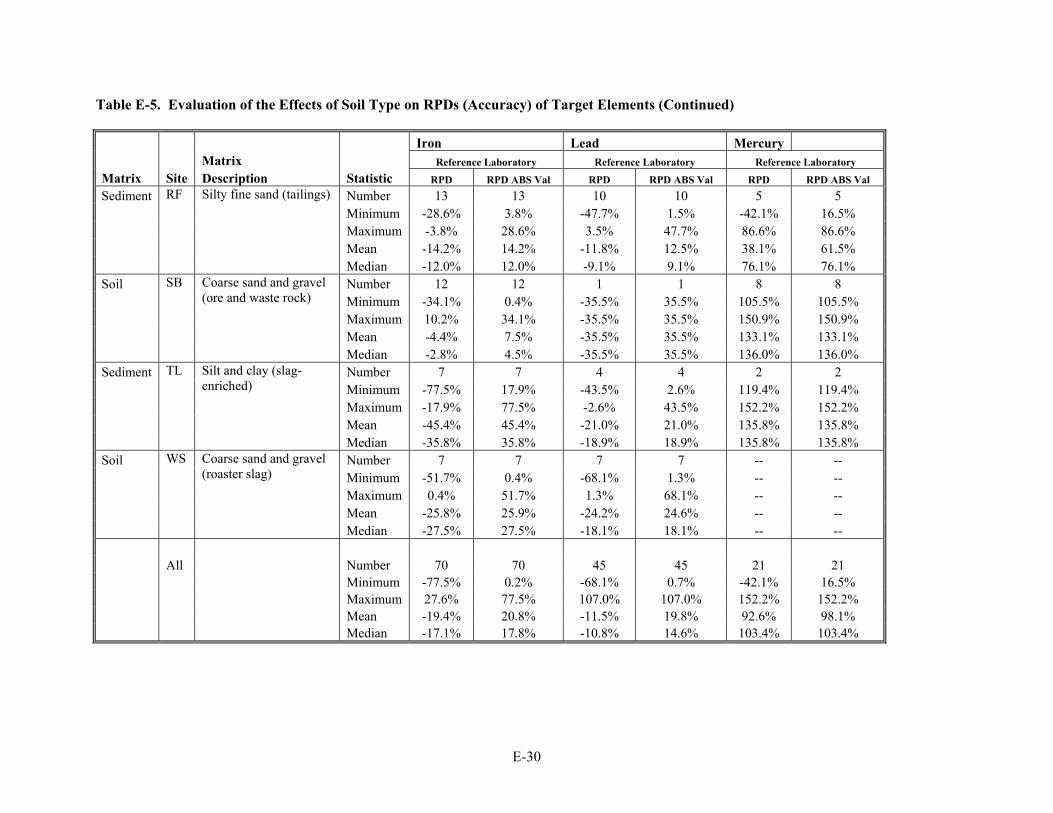
E-30
Table E-5. Evaluation of the Effects of Soil Type on RPDs (Accuracy) of Target Elements (Continued) Iron Lead Mercury Matrix Reference Laboratory Reference Laboratory Reference Laboratory Matrix Site Description Statistic RPD RPD ABS Val RPD RPD ABS Val RPD RPD ABS Val Sediment Number 13 13 10 10 5 5 Minimum -28.6% 3.8% -47.7% 1.5% -42.1% 16.5% Maximum -3.8% 28.6% 3.5% 47.7% 86.6% 86.6% Mean -14.2% 14.2% -11.8% 12.5% 38.1% 61.5%
RF Silty fine sand (tailings)
Median -12.0% 12.0% -9.1% 9.1% 76.1% 76.1% Soil Number 12 12 1 1 8 8 Minimum -34.1% 0.4% -35.5% 35.5% 105.5% 105.5% Maximum 10.2% 34.1% -35.5% 35.5% 150.9% 150.9% Mean -4.4% 7.5% -35.5% 35.5% 133.1% 133.1%
SB Coarse sand and gravel (ore and waste rock)
Median -2.8% 4.5% -35.5% 35.5% 136.0% 136.0% Sediment Number 7 7 4 4 2 2 Minimum -77.5% 17.9% -43.5% 2.6% 119.4% 119.4% Maximum -17.9% 77.5% -2.6% 43.5% 152.2% 152.2% Mean -45.4% 45.4% -21.0% 21.0% 135.8% 135.8%
TL Silt and clay (slag-enriched)
Median -35.8% 35.8% -18.9% 18.9% 135.8% 135.8% Soil Number 7 7 7 7 -- -- Minimum -51.7% 0.4% -68.1% 1.3% -- -- Maximum 0.4% 51.7% 1.3% 68.1% -- -- Mean -25.8% 25.9% -24.2% 24.6% -- --
WS Coarse sand and gravel (roaster slag)
Median -27.5% 27.5% -18.1% 18.1% -- -- All Number 70 70 45 45 21 21 Minimum -77.5% 0.2% -68.1% 0.7% -42.1% 16.5% Maximum 27.6% 77.5% 107.0% 107.0% 152.2% 152.2% Mean -19.4% 20.8% -11.5% 19.8% 92.6% 98.1% Median -17.1% 17.8% -10.8% 14.6% 103.4% 103.4%

E-31
Table E-5. Evaluation of the Effects of Soil Type on RPDs (Accuracy) of Target Elements (Continued) Nickel Selenium Silver Matrix Reference Laboratory Reference Laboratory Reference Laboratory Matrix Site Description Statistic RPD RPD ABS Val RPD RPD ABS Val RPD RPD ABS Val Sediment Number 6 6 5 5 1 1 Minimum -15.5% 2.2% -18.6% 0.1% -111.9% 111.9% Maximum 6.0% 15.5% 1.8% 18.6% -111.9% 111.9% Mean -5.6% 9.0% -8.9% 9.6% -111.9% 111.9%
RF Silty fine sand (tailings)
Median -7.6% 9.5% -12.0% 12.0% -111.9% 111.9% Soil Number 3 3 3 3 -- -- Minimum -25.6% 1.0% 6.6% 6.6% -- -- Maximum 13.3% 25.6% 8.2% 8.2% -- -- Mean -3.8% 13.3% 7.3% 7.3% -- --
SB Coarse sand and gravel (ore and waste rock)
Median 1.0% 13.3% 7.1% 7.1% -- -- Sediment Number -- -- 4 4 -- -- Minimum -- -- -25.9% 5.0% -- -- Maximum -- -- 16.5% 25.9% -- -- Mean -- -- -2.0% 13.5% -- --
TL Silt and clay (slag-enriched)
Median -- -- 0.8% 11.5% -- -- Soil Number 2 2 1 1 1 1 Minimum -14.2% 7.6% 2.9% 2.9% -13.8% 13.8% Maximum -7.6% 14.2% 2.9% 2.9% -13.8% 13.8% Mean -10.9% 10.9% 2.9% 2.9% -13.8% 13.8%
WS Coarse sand and gravel (roaster slag)
Median -10.9% 10.9% 2.9% 2.9% -13.8% 13.8% All Number 20 20 24 24 5 5 Minimum -32.1% 1.0% -25.9% 0.0% -111.9% 13.8% Maximum 29.0% 32.1% 18.8% 25.9% -13.8% 111.9% Mean -5.2% 12.2% -2.1% 9.5% -58.8% 58.8% Median -7.2% 11.8% -0.1% 6.9% -54.9% 54.9%
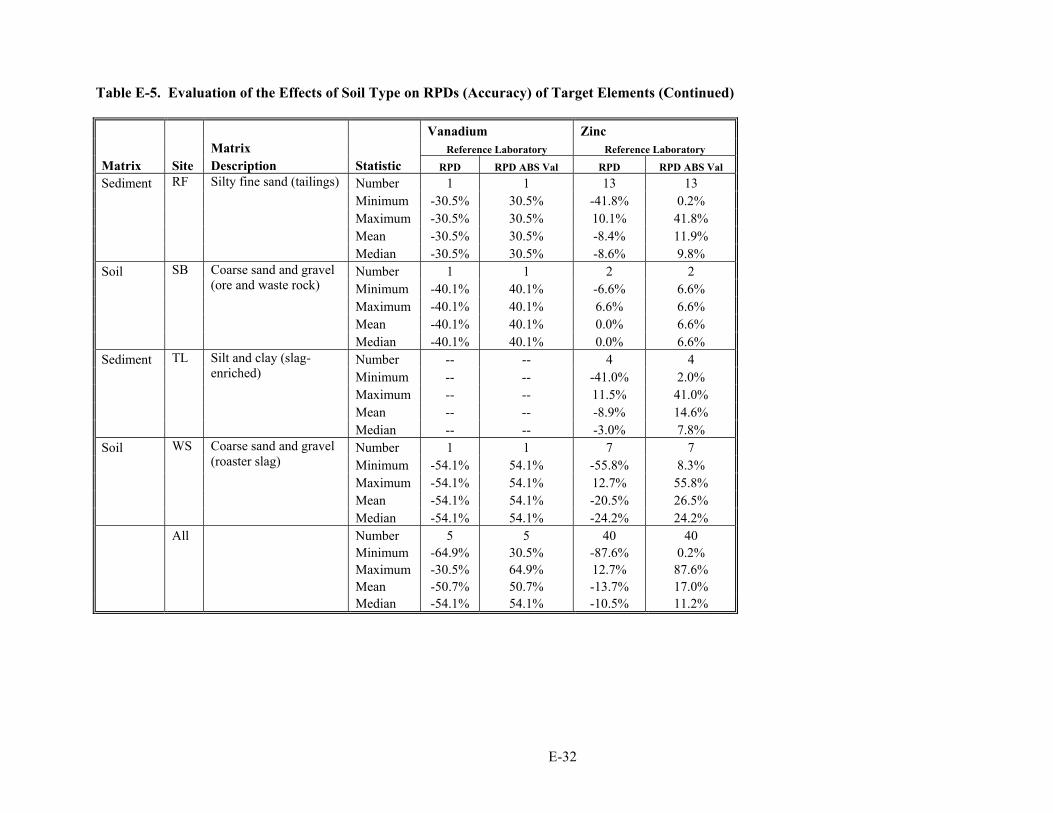
E-32
Table E-5. Evaluation of the Effects of Soil Type on RPDs (Accuracy) of Target Elements (Continued) Vanadium Zinc Matrix Reference Laboratory Reference Laboratory Matrix Site Description Statistic RPD RPD ABS Val RPD RPD ABS Val Sediment Number 1 1 13 13 Minimum -30.5% 30.5% -41.8% 0.2% Maximum -30.5% 30.5% 10.1% 41.8% Mean -30.5% 30.5% -8.4% 11.9%
RF Silty fine sand (tailings)
Median -30.5% 30.5% -8.6% 9.8% Soil Number 1 1 2 2 Minimum -40.1% 40.1% -6.6% 6.6% Maximum -40.1% 40.1% 6.6% 6.6% Mean -40.1% 40.1% 0.0% 6.6%
SB Coarse sand and gravel (ore and waste rock)
Median -40.1% 40.1% 0.0% 6.6% Sediment Number -- -- 4 4 Minimum -- -- -41.0% 2.0% Maximum -- -- 11.5% 41.0% Mean -- -- -8.9% 14.6%
TL Silt and clay (slag-enriched)
Median -- -- -3.0% 7.8% Soil Number 1 1 7 7 Minimum -54.1% 54.1% -55.8% 8.3% Maximum -54.1% 54.1% 12.7% 55.8% Mean -54.1% 54.1% -20.5% 26.5%
WS Coarse sand and gravel (roaster slag)
Median -54.1% 54.1% -24.2% 24.2% All Number 5 5 40 40 Minimum -64.9% 30.5% -87.6% 0.2% Maximum -30.5% 64.9% 12.7% 87.6% Mean -50.7% 50.7% -13.7% 17.0% Median -54.1% 54.1% -10.5% 11.2%

E-33
Site Abbreviations: AS Alton Steel Mill BN Burlington Northern Railroad/ASARCO East CN Naval Surface Warfare Center, Crane Division KP KARS Park – Kennedy Space Center LV Leviathan Mine/Aspen Creek RF Ramsey Flats – Silver Bow Creek SB Sulfur Bank Mercury TL Torch Lake Superfund Site WS Wickes Smelter Site Other Notes: Number Number of demonstration samples evaluated. RPD Relative percent difference (unmodified). RPD Abs Relative percent difference (absolute value).