innovative work practices, information technologies and ...ftp.iza.org/dp2321.pdfinnovative work...
TRANSCRIPT

IZA DP No. 2321
Innovative Work Practices, InformationTechnologies and Working Conditions:Evidence for France
Philippe AskenazyEve Caroli
DI
SC
US
SI
ON
PA
PE
R S
ER
IE
S
Forschungsinstitutzur Zukunft der ArbeitInstitute for the Studyof Labor
September 2006

Innovative Work Practices, Information Technologies and Working Conditions:
Evidence for France
Philippe Askenazy Paris Sciences Economiques
and IZA Bonn
Eve Caroli University Paris X, EconomiX
and Paris Sciences Economiques
Discussion Paper No. 2321 September 2006
IZA
P.O. Box 7240 53072 Bonn
Germany
Phone: +49-228-3894-0 Fax: +49-228-3894-180
E-mail: [email protected]
Any opinions expressed here are those of the author(s) and not those of the institute. Research disseminated by IZA may include views on policy, but the institute itself takes no institutional policy positions. The Institute for the Study of Labor (IZA) in Bonn is a local and virtual international research center and a place of communication between science, politics and business. IZA is an independent nonprofit company supported by Deutsche Post World Net. The center is associated with the University of Bonn and offers a stimulating research environment through its research networks, research support, and visitors and doctoral programs. IZA engages in (i) original and internationally competitive research in all fields of labor economics, (ii) development of policy concepts, and (iii) dissemination of research results and concepts to the interested public. IZA Discussion Papers often represent preliminary work and are circulated to encourage discussion. Citation of such a paper should account for its provisional character. A revised version may be available directly from the author.

IZA Discussion Paper No. 2321 September 2006
ABSTRACT
Innovative Work Practices, Information Technologies and Working Conditions: Evidence for France*
We investigate the impact of new work practices and information and communication technologies (ICT) on working conditions in France. We use a unique French dataset providing information on individual workers for the year 1998. New work practices include the use of quality norms, job rotation, collective discussions on work organization and working time flexibility. Working conditions are captured by occupational injuries as well as indicators of mental strain. We find that workers involved in the new practices face working conditions that are significantly worse than those of workers in non innovative work practices. But, the picture is mixed for ICT that seem to make the workplace safer and less risky. JEL Classification: J28, L23 Keywords: new work practices, technology, working conditions, occupational injuries Corresponding author: Philippe Askenazy Paris Sciences Economiques 48 Bd Jourdan 75014 Paris France E-mail: [email protected]
* This research has been funded by a grant from the French Ministry of Research. We are indebted to David Fairris, Bénédicte Reynaud and Muriel Roger for most valuable discussions. Thomas Coutrot, Sylvie Hamon-Cholet as well as participants to the French-German seminar on “Labour” in Berlin, the International Conference on Organisational Designs, Management Styles and Firm Performance in Bergamo and the seminar on “Labour Intensification” at Centre d’Etude de l’Emploi also provided useful remarks and suggestions. All remaining errors are our own.

1. Introduction
A growing literature has recently been devoted to the impact of ”new” organizational
work practices on firm productivity and labor demand. The so-called new (or ”innovative”
or ”flexible”) practices include total quality management, job rotation, just-in-time and
team work. They have rapidly spread across American firms since the middle of the 1980s
(see Osterman, 1994 and 2000), while continental Europe experienced similar changes in
the 1990s. New work practices appear to be far more than just a management fad: they
are both productivity enhancing and skill biased. On a sample of steel finishing lines,
Ichniowski et al. (1997) show that the introduction of new human resource management
practices positively influences productivity. On a larger panel of US firms, Black and Lynch
(2004) find that re-engineering, profit sharing and employees’ voice also have a positive
impact on productivity. The same result is found for delayering on a panel of French firms
by Caroli and Van Reenen (2001) who also stress that organizational change is biased
against unskilled labor. Bresnahan et al. (2002) find a three-way complementarity between
skills, technology and new organizational practices in a sample of U.S. establishments.
In contrast, there exists little statistical evidence on the potential impact of new or-
ganizational practices upon working conditions. In a number of OECD countries, work
intensity1 has increased during 1990’s. According to the European Survey on Working
Conditions carried out by the European Foundation for the Improvement of Living and
Working Conditions, despite the continuous decline of the manufacturing sector, the share
of European workers who report working at very high speed (resp. to meet tight deadlines)
reached 56% in 2000 (resp. 60%) as compared to 48% in 1990 (resp. 50%). Consistently,
40% of workers declare that they do not have enough time to do their job properly.
Moreover, situations in which the pace of work is imposed by clients or colleagues’ work
have also become more frequent, while standard industrial constraints such as production
norms or automatic machinery have diminished. At the same time, an increasing propor-
1See Green (2004) or the special symposium of the Eastern Economic Journal, vol. 30(4).
2
tion of workers report work-related health problems. Between 1995 and 2000, fatigue has
increased, as have musculoskeletal disorders (e.g. the proportion of backache increased
from 30% to 33%). In France and Belgium, the frequency of occupational injuries has
re-increased in recent years. According to the logs of national Social Securities, the num-
ber of cumulative trauma disorders (CTDs) has more than doubled in most European
countries since 1995. The United-States experienced a similar expansion of CTDs from
the mid-eighties to the mid-nineties with a more than tenfold increase.
Despite this upward trend in work related health problems, until recently little in-
terest had been devoted to the consequences of the new forms of work organization on
working conditions or safety. The difficulty of such an exercise lies in finding reliable data
sources on both workplace organization and working conditions. Most of the literature
(in economics, sociology, ergonomics...) has historically been based on case studies and
qualitative arguments (ILO, 1998). More recently, some statistical analyses have been
conducted using mainly firm or industry level data. For example, using a survey on
workers in car manufacturing plants in Canada, Lewchuk and Robertson (1996) find that
innovative organizational practices tend to harm workers’ well being. Landsbergis et al.
(1999) reach similar conclusions in their study of the same industry in the United-States.
Fairris and Brenner (2001) investigate the relationships between workplace transformation
and the rise in cumulative trauma disorders. They match Osterman’s (1994) survey of
private American establishments with sectoral data on CTDs and find no clear correlation
between new work practices and the frequency of illnesses - except for quality circles where
it is positive. Askenazy (2001) also uses Osterman’s survey and a statistical treatment of
1.5 million articles from 1,000 management journals matched with the longitudinal OSHA
data on occupational injuries. He finds that new work practices (autonomous work teams,
job rotation, total quality management) raise by some 30% the frequency of injuries in the
USA. In a recent paper, Brenner et al. (2004) exploit a survey containing information on
work organization (SEPT) at the establishment level and the CTDs logs from the OSHA
firm database on those very same establishments. They find that the diffusion of new
3

work practices can account for differences in the frequency of CDTs across firms. Green
(2004) uses the British Workplace Employee Relations Survey (WERS, 1998) which has
information from both employers and workers’ representatives. He finds that technical
innovation, new work organization and also high commitment practices have generated
an intensification of work.
Although they provide suggestive results, these works mainly rely on sectoral or firm-
level data. In this paper, we aim at complementing existing evidence by using individual
worker data. This allows us to investigate the impact of innovative work practices upon
a number of indicators of workplace well-being, including occupational injuries, risk as
perceived by workers and mental strain. We also explore the potential impact of the
recent wave of information and communication technologies (ICT) such as the Internet,
Intranet, and E-mailing. We perform this analysis on a large representative sample of
French workers in 1998. The data set we use comes from a supplementary questionnaire
to the French labor force survey and provides unique information on workers’ characteris-
tics, occupation, involvement in new work practices, working conditions and occupational
hazards. This allows us to take into account the potential heterogeneity across work-
ers which is likely to be important when dealing with working conditions and subjective
well-being at work.
Because correlations between new work practices and the deterioration of working
conditions may be affected by massive selection biases, we use a propensity score matching
method. Our results suggest that new work practices such as quality norms, job rotation
and work time flexibility are positively associated with higher levels of mental strain and
occupational risks. In contrast, the development of new ICT seems to reduce workers’
isolation and to improve safety at work.
The paper is organized as follows. Some theoretical considerations on the relation-
ships between innovative work practices and well-being at work are provided in section
2. Section 3 presents the econometric specification. Section 4 describes the data we use.
Section 5 discusses the results and the last section concludes.
4

2. New work practices, ICT and working conditions: some theo-retical considerations
The literature offers numerous descriptions of current organizational changes. The start-
ing point is that new work practices have deeply changed the way firms operate (e.g.
Ichniowski et al, 1996). Traditional ”Taylorist” organizations were based on hierarchical
communication and required from their employees specialized skills consistent with the
standardization of the production process. On the contrary, reorganized enterprises have
more horizontal communication channels and favor multiskilling as opposed to specializa-
tion. Despite the difficulty of identifying what is really “new” in terms of organization,
some workplace practices do reflect real economic changes. They mainly respond to global-
ization and changes in the technological environment which make information processing,
adaptability and product quality keys for firm competitiveness.
Basically, new work practices encompass broad types of changes:
- the new approach is often associated with making production processes ”lean” and
more responsive to market changes. Total Quality Management (TQM) emphasizes con-
tinuous quality improvement and cost reduction. The word quality is used here in a very
broad way and refers to general customer satisfaction, including the prompt delivery of
products. This organizational model encourages information feedback, based on the idea
that employees may provide useful suggestions on how to improve quality and reduce
waste. TQM practices are not necessarily strictly formalized. However, contrary to U.S.
enterprises, European firms tend to massively adopt ISO certification. ISO-9000 stan-
dards specify “requirements for a quality management system for any organization that
needs to demonstrate its ability to consistently provide product that meets customer and
applicable regulatory requirements and aims to enhance customer satisfaction”.
- Just-in-time (JIT) systems are also part of the “lean” model. JIT is used not only
to improve clients’ satisfaction by shortening delivery time and by quickly responding to
changes in tastes, but also to reduce production costs by eliminating unnecessary stocks.
5

In France, this rationalization of production is partly achieved through the development
of flexible work schedules.
- Other practices involve changes in work arrangements, generally with the aim of
decentralizing decision-making and improving the information flow between management
and workers. Individual workers are asked to be actively involved in other team members’
tasks and to participate to the design of the organization of the workplace. According to
management claims, such systems convey greater autonomy to workers.
Both decentralization of decision making and lean production imply that workers
be involved in job rotation. First, job rotation helps to assign workers to transitorily
overloaded parts of the production process, thereby allowing JIT production. Second,
job rotation favors direct contacts between workers thus improving communication in the
whole organization.
According to surveys by Osterman (1994) and Gittleman et al. (1998), new work
practices have spread extensively across U.S businesses since the early nineties. Oster-
man (2000) also suggests that both quality management practices and job rotation have
been more intensely used during the last decade in the USA. Their use has also sub-
stantially increased in other countries like Germany, Italy or France (see Figure 2.1). In
France, according to the REPONSE survey (Coutrot, 2000), the share of ISO-certified
private establishments went up from 12 to 34% between 1992 and 1998 while that of es-
tablishments not providing multitask training dropped from 44% to 26 %. Similarly, while
legal working time was reduced from 39 to 35 hours, the proportion of French workers
with flexible work hours increased from less than 10% in 1995 to about 40% in 20022. At
the same time, new network information and communication technologies have developed
in France following the USA. The proportion of French workers using such technologies
reached 30 % in 1998 as compared to virtually 0 at the beginning of the 1990s.
2Numerous collective agreements signed by workers’ and employers’ unions following the legal reduc-tion in working time have actually introduced the so-called ”annualization of working time”. Thereby,they allow employers to freely modify work schedules provided that the total number of hours workedwithin one year remains below 1600.
6
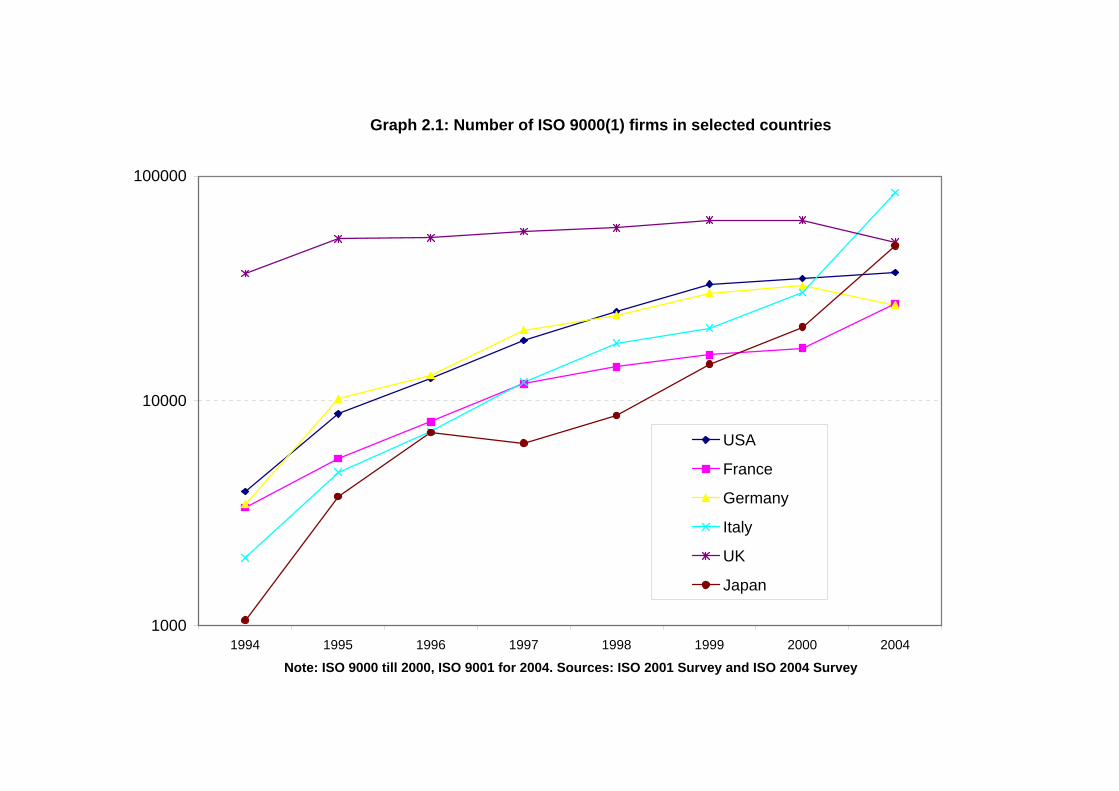
Graph 2.1: Number of ISO 9000(1) firms in selected countries
1000
10000
100000
1994 1995 1996 1997 1998 1999 2000 2004
Note: ISO 9000 till 2000, ISO 9001 for 2004. Sources: ISO 2001 Survey and ISO 2004 Survey
USA
France
Germany
Italy
UK
Japan

An important literature in occupational medicine, ergonomics, psychology or sociology
has been devoted to the consequences of changing workplace organization on the well-being
of workers. Most works take the form of theoretical models or case studies which illustrate
various conjectural arguments. They underline the extreme heterogeneity of the impact
of new forms of workplace organization and use of ICT across firms and occupations. For
the sake of simplicity, they can be divided into two groups defending opposite, although
not necessarily exclusive, views:
a) In the new production model, there is a natural synergy between firm performance
and worker well-being.
• Because new workplace practices aim at optimizing the production process, safety
should be a necessary objective for firms to pursue. This would allow them to reduce
one of the main sources of waste, i.e. absenteeism due to occupational hazards,
workers’ stress and the costs of related incidents.
• New work practices and, in particular, total quality management and quality norms
help reduce failures in the production process. To the extent that such failures
induce risks of injuries in the workplace, quality management should result in an
improvement of occupational safety, especially by reducing serious dangers.
• New network ICT help collecting and sharing information including best safety
procedures. Moreover, electronic communication allows workers to find more easily
a colleague when help is needed.
• In addition, job rotation and delegation of authority make work more diversified and
therefore potentially more interesting. Underlying the new organizational model
is the idea that increased responsibility should enhance workers’ motivation and
thereby increase their productivity. Indeed, boredom reduces alertness thus con-
tributing to the risk of injuries. Moreover, in Karasek’s (1998) control/demand
model, greater autonomy in an efficient organization reduces job strain.
8
b) A second line of analysis stresses that new work practices and ICT increase the
pressure exerted on workers for performance, hence work intensity.
• Job rotation and quality procedures reduce slack time, thus raising the pace of work.
• The setting of safety procedures requires a stable work environment which was
guaranteed in Taylorist organizations. Workers used to build up personal routines
which improved their safety and reduced their efforts through a long learning-by-
doing process. Job rotation, continuous process improvement and changes in the
production process, as well as frequent product changes, are therefore detrimental
to the building up of such safety mechanisms.
• Quality control is another source of mental strain. It also increases the risk of injury
by shifting workers’ attention from their working environment to the product.
• The broader use of network technologies may reduce face-to-face interactions and
informal contacts which avoid tensions between workers or contradictory orders.
• Work time flexibility is likely to disturb the organization of workers’ lives. Moreover,
it implies that short working days may be followed by very long ones; while it
is well-known that mental strain and environmental tensions increase more than
proportionally with the number of hours worked per day (see Hanecke et al. (1998)
for occupational injuries).
As suggested by this discussion, the impact of new work practices on working condi-
tions runs through a complex causality chain. An econometric study may not capture all
details of the mechanisms at work. However, it should help to assess the net impact of
the diffusion of new workplace practices.
3. Econometric method
A first estimate of the consequences of a workplace practice P (e.g. quality norms) on
an indicator Y of mental strain or occupational safety can be obtained by comparing the
9

average value of Y for workers who are involved in the practice (p = 1) and for workers who
are not (p = 0). We will call “naive” this benchmark estimator. Indeed, it is well known
that such an estimation method raises serious selection problems induced by workers’
heterogeneity (due to age, education, tenure, position...). For example, temporary workers
have a greater risk of occupational injury as compared to other employees; ICT could be
used by workers in office positions who thus face fewer occupational risks etc.. .
A standard solution to handle this problem is to perform linear or logistic regressions of
the working condition variable on new work practices/technologies, including a number of
controls. But another problem stems from the fact that the impact of innovative workplace
practices may be non linear. In particular, it may be different for different groups of
workers. For example, old low-skilled workers may be more at risk than others when
innovative practices or devices are introduced. In this case, Heckman et al. (1999)
recommend to use a matching method.
A simple presentation of the method borrows fromRubin (1974). Let Y be an indicator
described by two probabilities (y0, y1) conditional on the realization of the P variable. To
simplify the presentation, and without loss of generality, assume that Y denotes the rate of
occupational injuries. Worker i is thus characterized by the unobservable couple (y0i, y1i)
where y1i is the probability of having an injury if worker i is involved in practice P (pi = 1)
and y0i is the probability of being injured if pi = 0. However, in the data, we only observe
yi :
yi = [pi × y1i] + [(1− pi)× y0i] (3.1)
Using Rubin’s terminology, the “causal effect” ci of practice P on the risk of injury is
defined as:
ci = y1i − y0i (3.2)
Given that our data are not experimental, this parameter cannot be identified. Indeed,
we do not observe simultaneously a realization of y0i and a realization of y1i.We can directly
estimate E(y1i|pi = 1) and E(y0i|pi = 0) but neither E(y1i|pi = 0) nor E(y0i|pi = 1). In
10
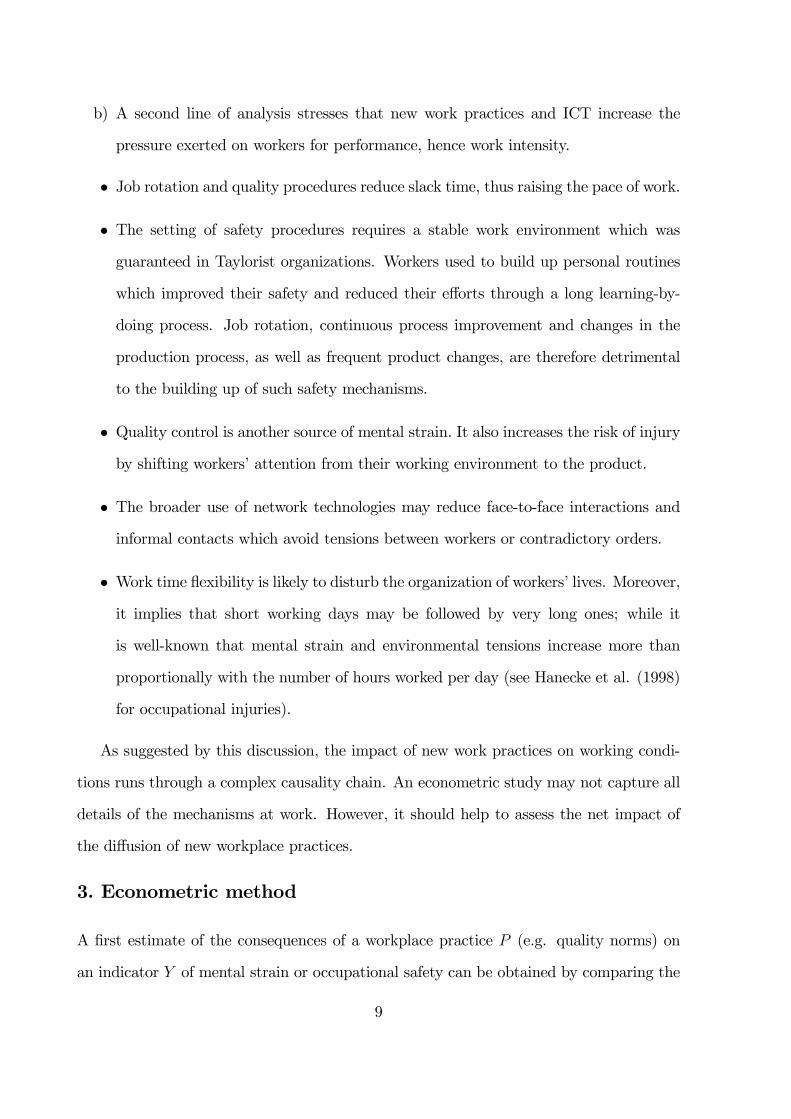
order to obtain an empirical distribution for y0i|pi = 1 (y1i|pi = 0) -, we match each worker
i involved in P (not involved) with a worker j who is not involved in P (pj = 0) (involved
in P ) and has similar characteristics to that of worker i. Rosenbaum and Rubin (1983)
show that the propensity score π(Xi) = P (pi = 1|Xi) of being involved in P given all
the observable characteristics of the worker and of her position (Xi) summarizes enough
information to compute an estimator of E[ci]. Exploiting this result permits us to derive
a continuous ”weighted” estimator defined as follows:
cw = E(ci) = E[yi{pi
π(xi)− 1− pi1− π(xi)
}], (3.3)
Dehejia and Wahba (2002) or Hirano et al. (2000) show that this estimator has useful
properties. It is efficient, convergent, asymptotically normal and unbiased under assump-
tion (H):
(y0i, y1i) ⊥ P | X. (H)
This condition states that, knowing X, the realization of variable P does not supply any
information about workers’ characteristics but only about their work practices.
The estimation method consists of two steps: First, using a logit model, we estimate
the probability that a worker i be assigned to the work practice P , conditional on her
characteristics and that of her job Xi: π(Xi) = Pr(pi = 1|Xi). Second, this probability is
used to compute cw according to (3.3). The asymptotic variance of cw is the variance of
φi defined as:
φi = yi{Pi
π(xi)− 1− Pi
1− π(xi)}− co (3.4)
−E[{Pi(1− π(xi))
π(xi)− π(xi)(1− Pi)
1− π(xi)}yixi]E[π(xi)(1− π(xi))x
0ixi]
−1[(Pi − π(xi))x0i].
This method raises two concerns. First, as Heckman et al. (1999) indicate, a matching
method requires that for each observation there exist a relevant counterfactual. In our
framework, this means that worker i involved in P with a propensity score π(Xi) should
be associated with at least one worker j who is not involved in P with the same propensity
score. So, in practice, the sample has to be restricted to a common support of the empirical
11

distributions of π respectively for observations such that pi = 0 and for observations such
that pi = 1. This restriction leads us to exclude a small number of observations.
Second, assumption H is never strictly satisfied. There is always some residual hetero-
geneity. To mitigate this problem, we include a large number of characteristics of workers
and of their positions in the first step of the estimation process. However, this method
may lead to misspecification of the first-step logit model. So, we also try to properly
specify this model by selecting the most robust and uncorrelated determinants of being
assigned to a work practice P.
4. Data
The data we use come from two complementary French surveys conducted in 1998: the
Labor Force Survey (Enquête Emploi, EE) and a supplementary questionnaire on working
conditions, the Enquête Conditions de Travail (CT). The Enquête Emploi is an annual
survey consisting of a three year rotating panel of a 1/300 sample of the active popula-
tion. The questions on working conditions and workplace organization were asked only
to individuals with a job in the outgoing third of the sample. Our dataset thus contains
information for a representative sample of the working population, with about 22,000
individuals in it.
Merging the two survey yields a unique database which provides detailed information
on 1) workplace organization and workers’ positions, 2) working conditions and 3) numer-
ous personal characteristics of workers. Appendix Table A provides descriptive statistics
of all variables used in the paper for workers with seniority above one year.
4.1. Workplace organization
Workers are asked about selected innovative workplace practices in which they are in-
volved. These include two key practices: job rotation (defined as regular rotation among
jobs or rotation upon employers’ request) and quality norms. Some 20% of workers de-
clare that they must enforce quality norms and 30% that they have to rotate among jobs.
12
These proportions are consistent with those computed using firm-level data in France in
1998. We capture direct worker participation through the variable “regular collective dis-
cussion about the organization of the workplace”. In our dataset one third of the workers
appear to be involved in such discussions. Unfortunately, we have no direct information on
just-in-time processes. However, the survey contains information on work time flexibility
which is usually associated with JIT. We use it to build two complementary indicators.
The first one captures flexible work hours: one worker out of five does not know her
work hours for the next month, week, or day. The second one captures flexibility in the
number of days worked: about 15% of the workers do not work the same number of days
every week.
So, we end up with five variables that depict the main innovative workplace practices.
Because the implementation of these practices is strongly connected to the diffusion of
information and communication technologies, it is also relevant to compare the impact
of ICT to that of new organizational practices on working conditions. The CT survey
provides detailed information on technological devices. Here again, we focus on two main
indicators: whether the worker uses a microcomputer or other computerized equipment;
and more specifically, whether she uses new ICT, i.e. the Internet or other electronic data
interchange technologies. In France in 1998, about half of the workers used computerized
equipment and 32% were connected either to the Internet or to an EDI device.
Because the propensity score method requires detailed information on workers’ char-
acteristics, we also exploit variables describing numerous aspects of workers’ jobs and
working environments. The EE survey provides information on each worker’s occupation
(22 groups) and industry (standard industrial classification with 36 or 85 positions), as well
as the size of the firm (5 groups) she works in and its location (22 regions). Moreover, the
CT survey contains a wealth of complementary information on work organization which
is not totally captured by occupational or sectoral dummies and which cannot be specif-
ically interpreted as innovative or non-innovative practices. We know workers’ median
working time per week and the number of nights worked per year. We have information
13

on whether work is repetitive or not, whether the worker has to fulfill production norms or
whether she is subject to rhythm constraints, and how much control the worker has on her
working time (existence of timekeeper...). The last two points are described by numerous
questions; so, we summarize them in an indicator of rhythm constraints (ranging from 0
to 7) and an indicator of time control (ranging from 0 to 5). Finally, some 6% of workers
use industrial machinery or robots.
4.2. Mental strain, risk and occupational injuries
The CT survey also provides information on mental strain, including factors of psycho-
logical stress such as tensions in the relationships with other people in the working en-
vironment. Most questions rely to a large extent on the personal interpretation of the
worker. For example, one of the questions relating to psychological strain is formulated
as follows: ”Do you need to cope on your own with difficult situations? Yes, quite often.
Yes, it happens. No”. What constitutes a difficult situation is not defined in the ques-
tionnaire, so the respondent must decide on her own what this means. On the one hand,
this is an obvious limitation on the information we have. On the other hand, the data
provide unique information on working conditions, as perceived subjectively by workers,
and therefore allow an accurate description of mental strain.
A first group captures uncertainty about how to do the job. This contains a binary
variable coded as 1 if the worker often has to drop one task for another one that was not
anticipated and if she perceives this as disturbing for her work. It also includes a variable
indicating whether the individual has to cope on her own with difficult situations. One
worker out of four is involved in such situations. A third variable indicates whether the
worker does not receive help when she needs it. We also know whether the worker receives
contradictory orders.
A second group captures the consequences the worker feels her mistakes may have
on the production process: consequences on the quality of the product and financial
consequences for the enterprise. Other questions deal with the human environment at
14

work, in particular tensions in the relationships with colleagues, hierarchical superiors, or
with customers.
Finally, we have information on time pressure as felt by workers. We define a binary
variable coded as 1 if the individual declares that she has to hurry up either all the
time or often, and 0 otherwise; about half of the workers are in this case. We also have
information on whether the individual feels she has enough time to do her job properly;
25% of workers consider that they have not.
In addition to these variables, the questionnaire also asks workers about occupational
safety. First, workers provide details on the type of risks they face at work: infectious risk,
nuclear risk, risk of serious fall, electrical risk, risk of being burnt, risk of transportation
accidents, risk of injury due to falling objects, machines or materials. We do not study
separately each risk because most workers are able to cope with one risk but have difficulty
when they have to face several of them. Therefore, we distinguish between workers who
declare 3 or more risks and others; the former account for one third of the sample.
In addition, the CT survey provides information on occupational injuries. The question
is asked only to wage earners and formulated as follows: ”In the past 12 months, have
you had, while working, any injury, even benign, that forced you to be treated?”. The
treatment being paid for by Social Security, being treated is not an indication of working
in a more ”progressive” firm. The questionnaire then asks to describe the nature of the
injury as well as whether it forced the individual to stop working for at least one day.
Due to the emphasis put on what happened in the past twelve months, we only kept
those workers with more than one year of seniority. Indeed, for those with seniority less
than a year, the injury has not necessarily happened in their present job. Given that we
do not have information on previous jobs, it is indeed impossible for us to correct for the
potential measurement error induced by the observations corresponding to low-seniority
(mainly temporary) workers. More generally, temporary workers’ perception of risks and
tensions in their current workplace could be influenced by their previous positions during
the last year. This restriction to workers with at least one year of seniority brings our
15
sample down to 16,089 individuals.
Despite this precaution and due to the formulation of the question on occupational
injuries - i.e. have you had any injury over the past 12 months -, our injury variable
will underestimate the true probability of injury. Indeed, individuals who have had more
than one injury in the course of the past year will appear, in our data, as having only
one. Similarly, workers who have been very seriously injured and who are still away from
work are not represented in the sample. Given this limitation, the mean proportion of
occupational injuries in our population, 8.5%, will have to be considered as a lower bound.
As expected, the rate of occupational injuries varies widely across occupations, from 16.6%
for skilled manual workers to 2.2% for clerks. It is higher than average for skilled and
unskilled manuals and for agriculture workers, and much below average for clerks and
managers. Note that this proportion broken by industry is similar to that computed
from the logs of the French Social Security (which have information on officially recorded
injuries) which are known to underestimate the real number of occupational injuries.
Eventually, because injuries inducing the loss of working days should correspond to a
much higher level of severity, we define two variables according to whether the injury has
forced the worker to stop working for at least one day or not. They respectively account
for about 55 and 45% of all injuries. ”Serious injury” is defined in the next sections as
involving days away from work. There is a potential bias in this breakdown because it
could be that progressive firms are less reluctant to accept days away from work; but
conversely, they may also adapt workers’ post and workload to their injuries.
4.3. Workers’ characteristics
To control for heterogeneity across workers, we also include individuals’ characteristics in
the standard logit and in the propensity score estimates. The EE provides rich information
on variables such as education, sex, age and nationality. We group this information by
classes which are used as dummy variables in the statistical analysis.
Regarding the characteristics of individuals in our sample, 34% of workers have at
16

least a high school degree as opposed to 25% with no diploma at all. The great majority
of the sample (89%) is between 25 and 55 years old.
5. Results
In what follows, we estimate the correlations between mental strain, occupational in-
juries and new workplace practices using three different methods: "naive" estimates,
"standard" logit specifications and the propensity score method presented in Section 3.
Weighted (propensity score) estimators significantly differ from naive and logit estima-
tors for a number of treatment or and/or variables of interest. The next subsections are
successively devoted to three groups of practices: key practices such as quality norms and
job rotation, work time flexibility - i.e. flexible work hours and flexibility of days worked
-, and collective discussions on work organization. We study the impact of technology on
working conditions in the last subsection.
5.1. Quality norms and job rotation
Quality norms and job rotation are among the most characteristic new workplace prac-
tices. Column (0) of Tables 1 and 2 reports naive estimates, i.e. the difference in the
percentage of workers who claim to suffer from mental strain or occupational injuries,
between workers who are involved in new work practices and workers who are not. For
all working condition indicators (except tensions with customers and feeling isolated at
work) quality norms and job rotation are associated with greater mental strain and more
occupational risks. In order to make the reading of the tables easier, all coefficients are
multiplied by 100. They can thus be read as additional points of probability (to be iso-
lated, to be injured and so on ...) when one is involved in a practice, as compared to
what happens if one is not. For example, the probability of being injured is 5.44 points
higher for workers fulfilling quality norms than for workers who do not, while the average
proportion of injured workers in the whole population is only 8.5%.
Nevertheless, because quality norms and job rotation are associated with the diffusion
17

of information technologies and because their adoption is very heterogeneous across oc-
cupations and industries, the analysis of their correlation pattern with mental strain or
safety at work may suffer from selection biases. As mentioned in Section 3, a first way
to deal with this problem is to estimate standard logit equations for the probability of
suffering from mental strain, occupational risks or injuries. The coefficients of the new
work practices variables are prensented in Column (1) of Tables 1 and 2, with each line
corresponding to a different logit. Regressors include a complete set of characteristics of
workers and of their position, as well as information on the technology they use. More
precisely, independent variables are workers’ age, sex, education, seniority, nationality,
region, weekly hours worked, job security and the size of the firm workers work in. We
also add 36 industrial dummies and 22 occupational dummies as well as information on
the technology that is used and the post: how much work rhythm is constrained and how
much autonomy workers have, whether work is repetitive and whether workers have to
work at night. These variables have been chosen among 1,000 variables in the EE and
CT surveys, because they are likely to be correlated both with new work practices and
with mental strain or occupational risks and injuries.
However, these estimates do not take into account the fact that the impact of new
work practices on working conditions may be different for workers with different bundles
of characteristics. This is the reason why our preferred estimates rely on the implemen-
tation on a propensity score method. As mentioned in Section 3, the first step of this
method consists in estimating a logit model explaining the probability that an individual
be involved in quality norms or job rotation. We first consider a benchmark specification
for this logit including the same regressors as in column (1). The corresponding results
are presented in Appendix Table B. Using this specification, column (2) of Tables 1 and
2 reports our estimates of the correlation between job rotation (resp. quality norms) and
a variety of indicators of mental strain and occupational safety. Overall, both practices
appear to have quite similar effects.
A first result is that heterogeneity biases are quite large. The coefficients estimated
18
using the propensity score method strongly differ from ”naive” computations and also
from standard logit regressions. In many instances, the effects that are estimated when
correcting for heterogeneity are smaller than what we get with standard logit regressions.
Sometimes, the sign of the coefficient itself is modified.
However, both quality norms and job rotation remain associated with greater mental
strain and higher occupational risks. As expected, having to fulfill quality norms is
strongly correlated with a greater sense of responsibility with respect to the quality of the
product and to the financial consequences of errors: workers involved in quality norms
have a 10 point higher probability of being aware of the financial consequences of their
errors than workers who are not. In turn, job rotation is logically associated with the claim
of changing task unexpectedly. Contrary to the standard logit, the weighted estimation
suggests that this correlation also holds for quality norms. More generally, both quality
norms and job rotation seem to increase stress due to uncertainty: workers have to cope
with difficult situations more often and tend to receive more contradictory orders. The
latter correlation suggests that organizations based on quality norms and job rotation
are not necessarily “lean and smart”. This point is supported by positive correlations
between both practices and the existence of tensions inside the organization (either with
colleagues or with the hierarchy). While the naïve or the standard logit estimators tell
that job rotation reduces job isolation, weighted estimates suggest that it also increases
the risk of being on an isolated job. As for time pressure, contrary to what the naive
estimator indicated, job rotation and quality norms do not have any significant effect on
workers having to hurry up or lacking time to do their work properly. Overall, the use of
quality norms and job rotation seems to be associated with greater mental strain.
However, a number of issues are to be raised regarding the robustness of these results.
• First, most coefficients on mental strain variables obtained with the propensity score
method are lower than those computed with a ”naive” estimator and, to a lesser extent
though, than standard logit estimates. This suggests that more extensive corrections for
heterogeneity in the sample might lead to vanishing correlations. Of particular concern
19

is the intensity of the competition faced by firms which can explain both the adoption of
innovative organizational practices and increased pressure on workers. Unfortunately, the
EE and CT surveys do not provide information on firms’ competitive environment. How-
ever, given that this environment is, to a large extent, industry specific we try to capture
it by introducing more detailed sectoral dummies (85 industries) in the regression (see
col.(3)-Spec.2). This does not alter our conclusions: the estimated correlation between
both practices and mental strain indicators is even larger than before.
• Second, Ichniowski et al. (1997) argue that new workplace practices are often
adopted in clusters so that single practices end up being correlated with one another.
For instance, if job rotation were the unique source of strain, quality norms would still be
statistically correlated to mental strain in Table 1, while it would not be per-se a factor
of stress. To correct for this potential bias, we introduce all other new practices in the
first-step logit. These regressions (not reported) confirm clear correlations between our
five new work practices. Nonetheless, the estimated correlations between quality norms
and job rotation on the one hand, and mental strain on the other hand are not sub-
stantially affected (see col(4)-Spec.3): there is no significant difference with results from
specification 1.
• One additional problem could be misspecification of the first step logit. More pre-
cisely, multiplying the number of control variables can generate biases. In order to cope
with this problem, we drop those variables which were not significant in the benchmark
logit (Spec.1). Thus doing, we select the more robust model for each new practice. Col-
umn 5 (Spec.4) reports propensity score estimates using this new specification3. Our
conclusion still holds: whatever the specification, quality norms and job rotation remain
associated with greater mental strain.
Similarly, both practices seem to be positively correlated with greater occupational
risks faced by workers. The probability that a worker claims to face three or more risks
is 6 to 7 point higher when involved in quality norms or job rotation. However, this
3The results are virtually unchanged if removing non significant regressors from specifications 2 or 3.
20
perception of risk does not necessarily translate into real danger. While ”naive” or stan-
dard logit computations suggest that both benign and serious injuries are more frequent
in reorganized workplaces, propensity score estimates yield less sharp results. For all
specifications, the frequency of benign injuries is higher for workers involved in quality
norms or job rotation: in particular, the probability of benign injury is 25 to 40% higher
for workers involved in any of the two practices. However, the impact of quality norms
and job rotation on serious injuries is never statistically significant. Given these results,
workers’ claims of their facing occupational risks can probably be interpreted as capturing
a greater sensitivity to safety issues rather than massive additional dangers.
5.2. Work Time flexibility
Reactivity is a second aspect of the new productive environment. Along with job rotation
or quality norms, firms develop just-in-time production processes. In order to efficiently
implement such organizational devices, a growing requirement in France is work time
flexibility. Contrary to the USA or the UK, this issue is crucial because employment
rigidity has long been the norm.
We distinguish between two types of work time flexibility corresponding to two French
legal categories. First, workers may have flexible work hours, i.e. work hours that can be
freely chosen by the employer so as to match the firm’s requirement. This is typically the
case on a weekly basis in tertiary activities (e.g. supermarkets), or on a monthly basis in
manufacturing. Second, employers can change the number of days worked from one week
to the other. This second form of flexibility mainly affects middle managers.
Tables 3 and 4 report the results for both types of flexibility. As for quality norms and
job rotation, the four specifications yield consistent results and selection bias is massive.
Overall, work time flexibility is correlated with greater time pressure, and especially with
the feeling of not having enough time to do one’s work properly. This finding is quite
natural given that the goal of work time flexibility is precisely to reduce periods of low
activity. As for quality norms and job rotation, work time flexibility is also associated
21

with greater tensions in the work environment, especially with the hierarchy and with
customers. Moreover, flexible work hours are correlated with mental strain due to un-
certainty (having to cope with difficult situations, receiving contradictory orders...) and
the flexibility of days worked is associated with stress regarding potential quality conse-
quences of errors. In contrast, workers with flexible work time do not particularly lack
help; as with job rotation, the flexibility of days worked appears to reduce this form of
stress. Let us underline that given that specification 3 includes all other innovative work-
place practices as controls in the first-step logit, the fact that patterns of results are quite
similar for work time flexibility, job rotation and quality norms is not a statistical artifact
due to positive correlation between the various practices.
Beyond mental strain, this similarity also holds for the impact on occupational risks
and injuries. Whatever its precise form, work time flexibility seems to be associated with
higher occupational risks. Estimated coefficients are positive and statistically significant.
However, here again, this claim does not necessarily translate into an objectively unsafe
workplace; a better visibility of the risks may induce more prevention and so finally less
accidents. Indeed, according to the propensity score estimates, work time flexibility has
virtually no impact on the frequency of serious nor benign injuries; note that this result
differs from the standard logit’s which yields a positive correlation between the flexibility
of hours worked and the probability of benign injuries.
Overall, the main potential consequence of work time flexibility appears to be increased
mental strain, especially time pressure.
5.3. Workplace participation
New work practices often include the participation of workers in the design of the organi-
zation of their workplace. Such participation might be expected to reduce mental strain
and occupational risks. Indeed, workers who are concerned by their own well-being at
work should make suggestions in order to improve safety and health. In turn, employers
should take into account these suggestions in order to reduce absenteeism, which is an
22

important source of inefficiency. We test this assumption looking at the impact of ”regular
collective discussion on work organization” upon working conditions.
Naive estimates yield contrasting results. On the one hand, collective discussions are
associated with greater tensions, uncertainty and time pressure. But, on the other hand,
workers seem to be less isolated, to face less occupational risks and a lower probability of
being seriously injured.
However, the logit estimates and the propensity score method yield more homoge-
nous results. First, the positive effects of regular collective discussions on safety vanish.
The correlation between this indicator and occupational risks even becomes positive and
significant for 3 out of our 4 propensity score specifications. Second, regular collective dis-
cussions remain associated with greater stress due to the awareness of the consequences of
errors and rising tensions with customers, colleagues or the hierarchy, including the claim
of receiving contradictory orders.
This correlation may result from the fact that discussions are more frequent when
problems are more acute in the workplace. Because of the lack of longitudinal data,
we cannot deal with this endogeneity bias. So, our results must be interpreted with
caution. However, if we assume that collective discussions are more frequent in workplace
facing serious problems, our results at least suggest that these discussions have failed
to restore a ”smart and safe” environment. Overall, we do not find clear evidence that
workers’ participation through collective discussion on work organization has massive
positive consequences on workers’ well-being.
5.4. Information and communication technologies
Beyond the implementation of innovative work practices, new workplaces are also charac-
terized by the intensive use of new information and communication technologies. Partic-
ularly, job rotation, quality norms and work time flexibility are strongly correlated to the
use of the Internet, Intranet, electronic data interchange or E-mail. The year 1998 is par-
ticularly relevant for a statistical analysis because the use of ICT was not yet generalized
23
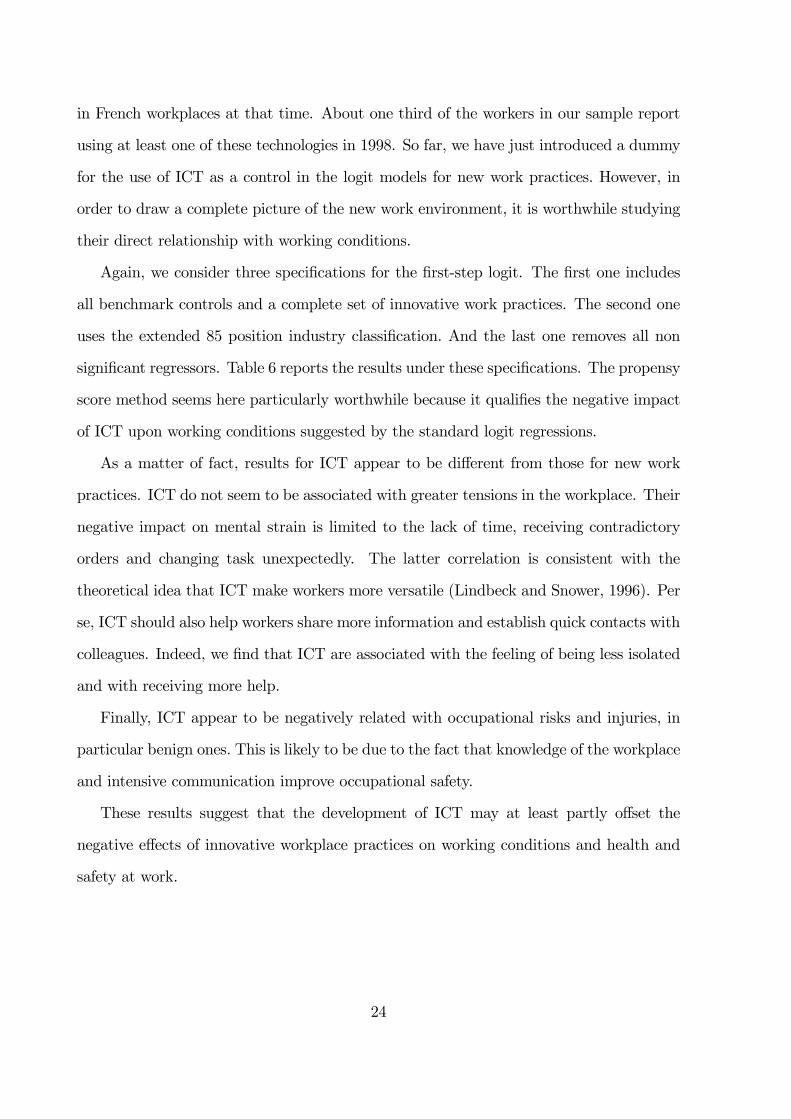
in French workplaces at that time. About one third of the workers in our sample report
using at least one of these technologies in 1998. So far, we have just introduced a dummy
for the use of ICT as a control in the logit models for new work practices. However, in
order to draw a complete picture of the new work environment, it is worthwhile studying
their direct relationship with working conditions.
Again, we consider three specifications for the first-step logit. The first one includes
all benchmark controls and a complete set of innovative work practices. The second one
uses the extended 85 position industry classification. And the last one removes all non
significant regressors. Table 6 reports the results under these specifications. The propensy
score method seems here particularly worthwhile because it qualifies the negative impact
of ICT upon working conditions suggested by the standard logit regressions.
As a matter of fact, results for ICT appear to be different from those for new work
practices. ICT do not seem to be associated with greater tensions in the workplace. Their
negative impact on mental strain is limited to the lack of time, receiving contradictory
orders and changing task unexpectedly. The latter correlation is consistent with the
theoretical idea that ICT make workers more versatile (Lindbeck and Snower, 1996). Per
se, ICT should also help workers share more information and establish quick contacts with
colleagues. Indeed, we find that ICT are associated with the feeling of being less isolated
and with receiving more help.
Finally, ICT appear to be negatively related with occupational risks and injuries, in
particular benign ones. This is likely to be due to the fact that knowledge of the workplace
and intensive communication improve occupational safety.
These results suggest that the development of ICT may at least partly offset the
negative effects of innovative workplace practices on working conditions and health and
safety at work.
24

6. Perspectives
The intensification of work in Europe during the 1990’s has raised concerns about the
potential negative consequences of the development of new workplace practices or in-
formation and communication technologies. Some recent articles seem to support these
concerns. Our work adds to this growing literature in three respects. First, we use a
large representative sample of workers which allows us to go beyond the managerial view
on working conditions. Second, we correct for observed heterogeneity using a matching
method which generates more acurate estimates. Third, we extend the analysis to the
potential consequences of network technologies upon working conditions.
Overall in France, in 1998, new work practices including quality norms, job rotation
or flexibility of work schedules seem indeed associated with increased mental strain and
with a more risky environment. However, the picture is more positive for ICT that are
associated with lower occupational injuries or physical risk and potentially with a more
cooperative workplace.
This result provides a potential explanation of the stabilization of the intensification
of work in Europe or the sharp decline in Cumulative Trauma Disorders observed in the
USA during the last decade. In addition, the implementation of new work practices could
induce some learning which could, in turn, generate a long-term improvement of working
conditions. Testing for this assumption will become possible when the next waves of the
French working conditions survey are available.
References
[1] Askenazy Ph., 2001, ”Innovative Workplace Practices and Occupational Injuries and
Illnesses in the United States”, Economic and Industrial Democracy, vol. 22 (4), pp.
485-516.
25

[2] Berg Pe., E. Appelbaum, Th. Bailey and A. Kalleberg, 1996, ”The Performance
Effects of Modular Production in the Apparel Industry”, Industrial Relations, 35(3),
pp. 356-373.
[3] Black Sandra and Lisa Lynch, 2004, “What’s Driving the New Economy: The Ben-
efits of Workplace Innovation”, Economic Journal, vol. 114, pp. F97-F116.
[4] Black Sandra and Lisa Lynch, 2001, “How to Compete: the Impact of Workplace
Practices and Information Technology on Productivity”, The Review of Economics
and Statistics, vol. 83 (3), pp. 434-45.
[5] Brenner Mark, David Fairris and John Ruser, 2004, “Flexible Work Practices and
Occupational Safety and Health: Exploring the Relationship Between Cumulative
Trauma Disorders and Workplace Transformation”, Industrial Relations, vol. 43(1).
[6] Bresnahan Timothy, Erik Brynjolfsson and Lorin Hitt, 2002, ”Information Technol-
ogy, Workplace Organization and the Demand for Skilled Labor: Firm-level Evi-
dence”, The Quarterly Journal of Economics, vol. 117 (1), pp. 339-76.
[7] Caroli Eve and John Van Reenen, 2001, ”Skill biased organizational change? Evi-
dence from a panel of British and French establishments”, The Quarterly Journal of
Economics, 116(4), pp. 1449-92.
[8] Coutrot Thomas, 2000a, ”Innovations dans le travail : la pression de la concurrence
internationale, l’atout des qualifications”, Première Synthèse DARES 2000.3 -N◦
09.2.
[9] Coutrot Thomas, 2000b, ”Innovations et gestion de l’emploi”, Première Synthèse
DARES 2000.3 -N◦ 12.1.
[10] Dehejia R. and S. Wahba, 2002, “Propensity Score Matching Methods for Non-
Experimental Causal Studies”, Review of Economics and Statistics, vol. 84(1), pp.
151-167.
26

[11] Fairris David and Mark Brenner, 2001, ”Workplace Transformation and the Rise
in Cumulative Trauma Disorders: Is there a Connection?”, Labor Research, vol. 22
(winter), pp. 15-28
[12] Green F., 2004, ”Why has work effort become more intense”, Industrial Relations,
vol.43(4), pp. 709-41.
[13] Hanecke K., S. Tiedemann, F. Nachreiner and H. Grzech-Sukalo, 1998, “Accident
risk as function of hour at work and time of day as determined from accident data
and exposure models for the German working population”, Scandinavian Journal of
Work, Environment & Health, Vol. 24 suppl. 3, pp. 43-48.
[14] Heckman J., R. Lalonde and J. A. Smith, 1999, ”The Economics and Economet-
rics of Active Labor Market Programs", in Handbook of Labor Economics, Oerley
Ashenfelter et David Card eds, NY: Elsevier, chap. 31, pp. 1865-2097.
[15] Hirano, K., G. W. Imbens et G. Ridder, 2000, “Efficient Estimation of Average
Treatment Effects Using the Estimated Propensity Score”, NBER Technical Working
Paper N◦ 251.
[16] Ichniowski C., Th. A. Kochan, D. I. Levine, C. Olson and G. Strauss, 1996, ” What
Works at Work: Overview and Assessment ”, Industrial Relations vol 35 (3), pp.
299-333.
[17] Ichniowski Casey, Kathryn Shaw and Giovanna Prennushi, 1997, ‘The Effects of
Human Resource Management Practices on Productivity: a study of steel finishing
lines’ American Economic Review, vo. 87, 3, 291-313.
[18] ILO, 1998, Psychosocial and Organizational Factors, Encyclopedia of Occupational
Health and Safety, ILO: Geneva, pp. 24.1-34-77.
[19] ISO, 2002, ISO 9000 - Selection and use, ISO: Geneva.
27

[20] Karasek Robert, 1998, ”Demand/Control Model a social, emotional, and physiologi-
cal approach to stress risk and active behaviour development”, in ILO 1998.
[21] Landsbergis P.A., J. Cahill and P. Schnall, 1999, The impact of lean production and
related new systems of work organization on worker health, Journal of Occupational
Health Psychology, vol. 4 (2), pp. 108-130.
[22] Lewchuk W. and D. Robertson, 1996, “Working Conditions Under Lean Production:
A Worker-based Benchmark Study”. Asia Pacific Business Review, summer 1996,
pp. 60-81.
[23] Merlié D. and P. Paoli, 2001, Third European survey on working conditions 2000,
Luxembourg: Office for Official Publications of the European Communities.
[24] OECD, 1999, ”New Enterprise Work Practices and their Labour Market Implications
”, in OCDE Employment Outlook, Chap. 4, pp. 195-241.
[25] Osterman Paul, 1994, ”How Common is Workplace Transformation and Who Adopts
it? ”, Industrial and Labor Relations Review, 47(2), pp.173-188.
[26] Osterman Paul, 2000, ”Work Reorganization in an era of Restructuring: Trends in
Diffusion and Effects on Employee Welfare”, Industrial and Labor Relations Review,
53(2), pp.179-195.
[27] Rosenbaum Paul and Donald Rubin, 1983, “The Central Role of the Propensy Score
in Observational Studies for Causal Effects”, Biometrika, 70 (1), pp. 41-55.
[28] Rubin Donald, 1974, ”Estimating Causal Effects of Treatments in Randomized and
Non Randomized Studies”, Journal of Educational Psychology, 66, pp. 688-701.
28

Table 1Quality norms, mental strain and occupational injuries
(0) (1) (2) (3) (4) (5)Estimator × 100 Naive logit Weighted Weighted Weighted Weighted
Est proba Spec. 1 Spec. 2 Spec. 3 Spec. 4Mental strain
Cope on his own with 4.75 3.41*** 3.28*** 3.28*** 3.47*** 3.13***difficult situations - 1.20 1.20 1.25 1.14Change task 7.19 1.45 3.43*** 3.61*** 3.13** 2.65**unexpectedly - 1.26 1.28 1.28 1.24No help -0.78 -0.02 -0.46 -0.46 -0.15 -0.60
- 0.67 0.67 0.70 0.65Receive 14.07 3.60*** 2.97** 3.15*** 2.80** 2.77**contradictory orders - 1.28 1.31 1.31 1.29Consequences for 19.99 8.63*** 8.19*** 8.31*** 8.54*** 8.92***product quality - 1.59 1.64 1.67 1.59Financial conseq. for 27.79 11.16*** 10.41*** 10.71*** 10.45*** 10.40***the firm - 1.52 1.58 1.59 1.54Tensions with 5.95 3.29*** 4.23*** 4.14*** 4.16*** 3.24***colleagues 1.32 1.31 1.33 1.21Tensions with hierarchy 10.59 3.93*** 4.66*** 4.96*** 4.56*** 3.70***
- 1.37 1.40 1.40 1.32Tensions with -6.02 2.18** 2.40* 2.26* 2.25* 2.21*customers 1.26 1.26 1.29 1.22Isolated job or -9.19 0.13 1.95*** 2.11*** 1.88** 2.32***no colleague 0.73 0.75 0.72 0.72Hurry up 9.81 1.00 0.28 -0.02 0.07 0.15
- 1.44 1.47 1.47 1.42Not enough time 5.29 0.39 0.97 1.12 0.76 0.78
- 1.20 1.22 1.22 1.18
Occupational RisksMore than 3 risks 19.02 6.58*** 7.08*** 7.34*** 7.17*** 7.70***faced on the job - 1.35 1.38 1.37 1.36
Occupational injuriesTotal injuries 5.44 1.88*** 1.95*** 2.11*** 1.88*** 2.32***
- 0.73 0.75 0.72 0.72Serious Injuries 2.19 0.59** 0.68 0.72 0.69 0.82
- 0.54 0.56 0.55 0.53Benign Injuries 3.25 1.09*** 1.28** 1.39*** 1.19** 1.49***
- 0.50 0.51 0.49 0.52
Notes: Col. (1), we report the predicted outcome given by the logit estimation. Std. errors in italics.Field: workers with seniority above 12 months * significant at 10% level ; ** at 5% ; *** at 1%
29

Table 2Job rotation, mental strain and occupational injuries
(0) (1) (2) (3) (4) (5)Estimator × 100 Naive logit Weighted Weighted Weighted Weighted
Est prob. Spec. 1 Spec. 2 Spec. 3 Spec. 4Mental strain
Cope on his own with 0.48 2.70*** 2.19** 2.38*** 1.86** 2.01**difficult situations - 0.87 0.88 0.88 0.86Change task 9.71 8.17*** 7.95*** 7.83*** 7.94*** 7.93***unexpectedly - 0.92 0.92 0.92 0.93No help -2.42 -1.63*** -2.16*** -2.12*** -2.04*** -2.30***
- 0.45 0.46 0.46 0.45Receive 12.13 6.32*** 5.04*** 5.19*** 4.71*** 5.65***contradictory orders - 1.00 1.00 1.01 1.00Consequences for 8.86 3.14*** 2.31* 2.36** 2.09* 3.55***product quality - 1.22 1.22 1.23 1.19Financial conseq. for 10.66 4.41*** 3.55*** 3.71*** 3.35*** 4.29***the firm - 1.12 1.12 1.13 1.10Tensions with 4.91 4.45*** 4.86*** 4.66*** 4.49*** 5.34***colleagues 0.93 0.93 0.93 0.94Tensions with hierarchy 7.72 5.15*** 4.52*** 4.48*** 4.11*** 4.65***
- 1.00 1.01 1.00 0.99Tensions with -1.93 2.94*** 2.26** 2.22** 1.76* 2.35***customers 0.90 0.91 0.91 0.90Isolated job or -8.90 -3.62*** 1.76*** 1.73*** 1.68*** 1.91***no colleague 0.53 0.54 0.53 0.52Hurry up 4.94 1.53 1.20 1.06 1.13 1.36
- 1.14 1.15 1.15 1.13Not enough time 2.04 1.89** 1.51* 1.45* 1.29 1.48*
- 0.87 0.87 0.87 0.87
Occupational RisksMore than 3 risks 17.02 8.13*** 6.25*** 6.30*** 5.97*** 6.93***faced on the job - 0.92 0.94 0.92 0.92
Occupational injuriesTotal injuries 4.78 1.50*** 1.76*** 1.73*** 1.68*** 1.91***
- 0.53 0.54 0.53 0.52Serious Injuries 2.28 0.48** 0.67* 0.69* 0.64 0.64*
- 0.40 0.41 0.40 0.39Benign Injuries 2.50 0.88*** 1.09*** 1.05*** 1.05*** 1.26***
- 0.36 0.36 0.36 0.37
Notes: Col. (1), we report the predicted outcome given by the logit estimation. Std. errors in italics.Field: workers with seniority above 12 months * significant at 10% level ; ** at 5% ; *** at 1%
30
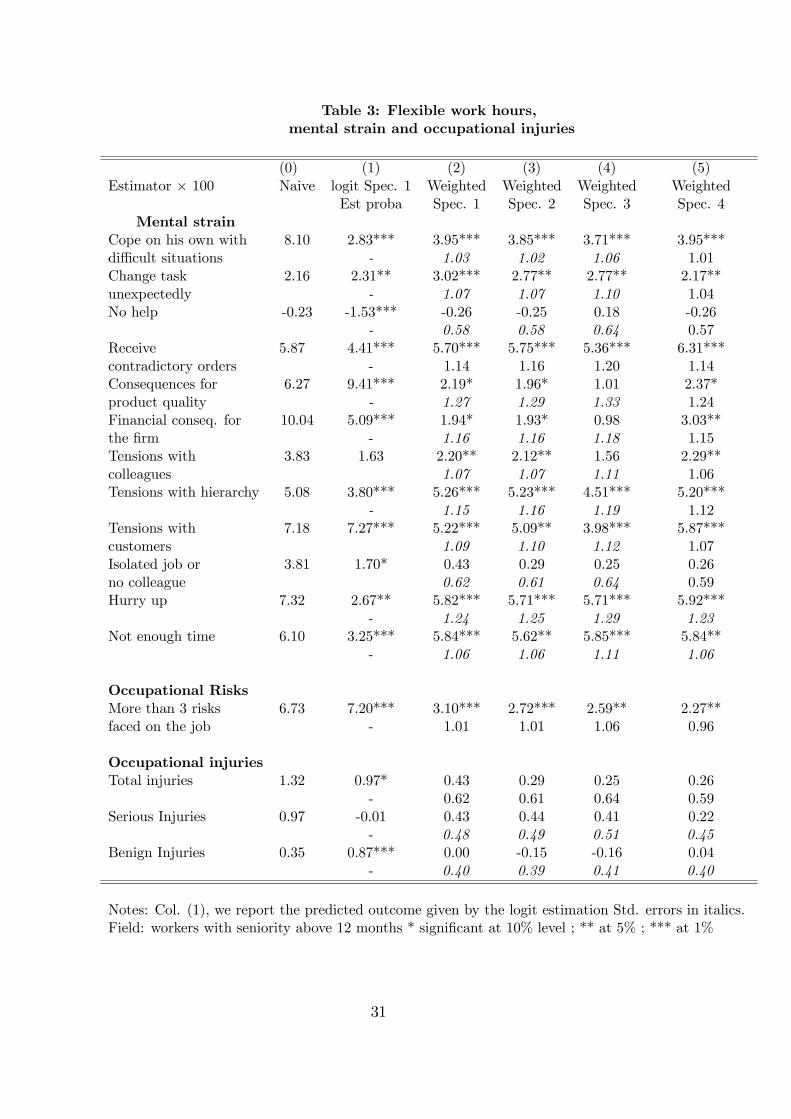
Table 3: Flexible work hours,mental strain and occupational injuries
(0) (1) (2) (3) (4) (5)Estimator × 100 Naive logit Spec. 1 Weighted Weighted Weighted Weighted
Est proba Spec. 1 Spec. 2 Spec. 3 Spec. 4Mental strain
Cope on his own with 8.10 2.83*** 3.95*** 3.85*** 3.71*** 3.95***difficult situations - 1.03 1.02 1.06 1.01Change task 2.16 2.31** 3.02*** 2.77** 2.77** 2.17**unexpectedly - 1.07 1.07 1.10 1.04No help -0.23 -1.53*** -0.26 -0.25 0.18 -0.26
- 0.58 0.58 0.64 0.57Receive 5.87 4.41*** 5.70*** 5.75*** 5.36*** 6.31***contradictory orders - 1.14 1.16 1.20 1.14Consequences for 6.27 9.41*** 2.19* 1.96* 1.01 2.37*product quality - 1.27 1.29 1.33 1.24Financial conseq. for 10.04 5.09*** 1.94* 1.93* 0.98 3.03**the firm - 1.16 1.16 1.18 1.15Tensions with 3.83 1.63 2.20** 2.12** 1.56 2.29**colleagues 1.07 1.07 1.11 1.06Tensions with hierarchy 5.08 3.80*** 5.26*** 5.23*** 4.51*** 5.20***
- 1.15 1.16 1.19 1.12Tensions with 7.18 7.27*** 5.22*** 5.09** 3.98*** 5.87***customers 1.09 1.10 1.12 1.07Isolated job or 3.81 1.70* 0.43 0.29 0.25 0.26no colleague 0.62 0.61 0.64 0.59Hurry up 7.32 2.67** 5.82*** 5.71*** 5.71*** 5.92***
- 1.24 1.25 1.29 1.23Not enough time 6.10 3.25*** 5.84*** 5.62** 5.85*** 5.84**
- 1.06 1.06 1.11 1.06
Occupational RisksMore than 3 risks 6.73 7.20*** 3.10*** 2.72*** 2.59** 2.27**faced on the job - 1.01 1.01 1.06 0.96
Occupational injuriesTotal injuries 1.32 0.97* 0.43 0.29 0.25 0.26
- 0.62 0.61 0.64 0.59Serious Injuries 0.97 -0.01 0.43 0.44 0.41 0.22
- 0.48 0.49 0.51 0.45Benign Injuries 0.35 0.87*** 0.00 -0.15 -0.16 0.04
- 0.40 0.39 0.41 0.40
Notes: Col. (1), we report the predicted outcome given by the logit estimation Std. errors in italics.Field: workers with seniority above 12 months * significant at 10% level ; ** at 5% ; *** at 1%
31

Table 4: Flexibility of days worked,mental strain and occupational injuries
(0) (1) (2) (3) (4) (5)Estimator × 100 Naive logit (spec. 1) Weighted Weighted Weighted Weighted
Est proba Spec. 1 Spec. 2 Spec. 3 Spec. 4Mental strain
Cope on his own with 1.39 3.53*** 5.06*** 5.29*** 3.64*** 4.29***difficult situations - 1.51 1.51 1.44 1.44Change task 2.11 3.49*** 2.30 2.18 0.76 2.56*unexpectedly - 1.48 1.50 1.43 1.48No help -2.23 -0.14 -1.82** -1.81** -1.94** -1.91**
- 0.73 0.72 0.72 0.73Receive 9.28 6.42*** 2.20 2.52* 0.71 2.57*contradictory orders - 1.49 1.48 1.42 1.49Consequences for 15.14 1.57 8.11*** 8.86*** 6.93*** 9.35***product quality - 1.68 1.71 1.67 1.67Financial conseq. for 4.36 2.01* 2.79* 3.00* 2.92* 3.48**the firm - 1.57 1.56 1.58 1.56Tensions with 5.80 2.18** 1.08 1.23 0.96 1.82colleagues 1.43 1.45 1.42 1.41Tensions with hierarchy 7.55 4.82*** 4.45*** 4.98*** 3.77** 4.78***
- 1.62 1.61 1.59 1.59Tensions with 14.67 5.91*** 8.52*** 9.10*** 6.99*** 9.16***customers 1.52 1.52 1.47 1.54Isolated job or -0.09 1.30* 0.61 0.50 0.42 0.88no colleague 0.79 0.78 0.75 0.81Hurry up 4.47 6.07*** 1.58 1.83 0.28 1.24
- 1.68 1.66 1.59 1.62Not enough time 2.99 6.25*** 4.86*** 5.01*** 3.54** 5.10***
- 1.46 1.46 1.40 1.48
Occupational RisksMore than 3 risks 13.16 3.43*** 4.45*** 5.19*** 4.19*** 4.69***faced on the job - 1.31 1.31 1.30 1.30
Occupational injuriesTotal injuries 2.91 0.31 0.61 0.50 0.42 0.88
- 0.79 0.78 0.75 0.81Serious Injuries 0.43 0.30 -0.24 -0.20 -0.74 -0.11
- 0.62 0.60 0.51 0.63Benign Injuries 2.48 -0.03 0.85 0.70 1.16** 0.98*
- 0.53 0.52 0.58 0.54
Notes: Col. (1), we report the predicted outcome given by the logit estimation Std. errors in italics.Field: workers with seniority above 12 months * significant at 10% level ; ** at 5% ; *** at 1%
32
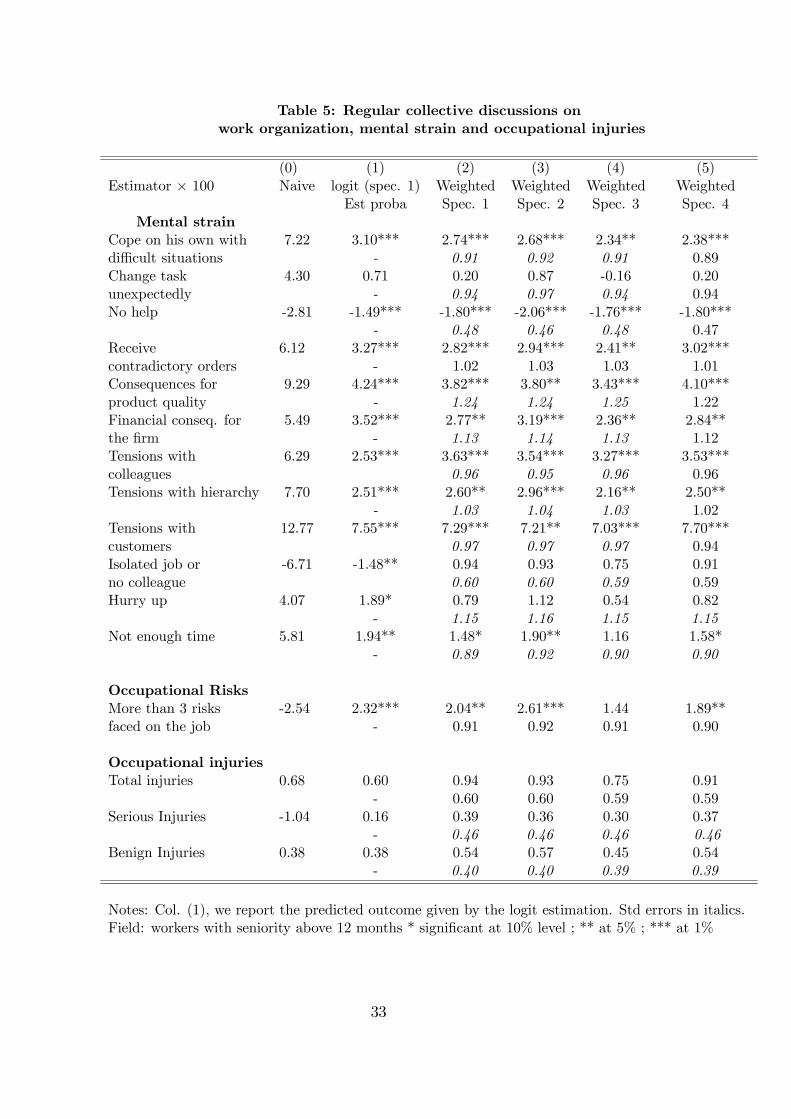
Table 5: Regular collective discussions onwork organization, mental strain and occupational injuries
(0) (1) (2) (3) (4) (5)Estimator × 100 Naive logit (spec. 1) Weighted Weighted Weighted Weighted
Est proba Spec. 1 Spec. 2 Spec. 3 Spec. 4Mental strain
Cope on his own with 7.22 3.10*** 2.74*** 2.68*** 2.34** 2.38***difficult situations - 0.91 0.92 0.91 0.89Change task 4.30 0.71 0.20 0.87 -0.16 0.20unexpectedly - 0.94 0.97 0.94 0.94No help -2.81 -1.49*** -1.80*** -2.06*** -1.76*** -1.80***
- 0.48 0.46 0.48 0.47Receive 6.12 3.27*** 2.82*** 2.94*** 2.41** 3.02***contradictory orders - 1.02 1.03 1.03 1.01Consequences for 9.29 4.24*** 3.82*** 3.80** 3.43*** 4.10***product quality - 1.24 1.24 1.25 1.22Financial conseq. for 5.49 3.52*** 2.77** 3.19*** 2.36** 2.84**the firm - 1.13 1.14 1.13 1.12Tensions with 6.29 2.53*** 3.63*** 3.54*** 3.27*** 3.53***colleagues 0.96 0.95 0.96 0.96Tensions with hierarchy 7.70 2.51*** 2.60** 2.96*** 2.16** 2.50**
- 1.03 1.04 1.03 1.02Tensions with 12.77 7.55*** 7.29*** 7.21** 7.03*** 7.70***customers 0.97 0.97 0.97 0.94Isolated job or -6.71 -1.48** 0.94 0.93 0.75 0.91no colleague 0.60 0.60 0.59 0.59Hurry up 4.07 1.89* 0.79 1.12 0.54 0.82
- 1.15 1.16 1.15 1.15Not enough time 5.81 1.94** 1.48* 1.90** 1.16 1.58*
- 0.89 0.92 0.90 0.90
Occupational RisksMore than 3 risks -2.54 2.32*** 2.04** 2.61*** 1.44 1.89**faced on the job - 0.91 0.92 0.91 0.90
Occupational injuriesTotal injuries 0.68 0.60 0.94 0.93 0.75 0.91
- 0.60 0.60 0.59 0.59Serious Injuries -1.04 0.16 0.39 0.36 0.30 0.37
- 0.46 0.46 0.46 0.46Benign Injuries 0.38 0.38 0.54 0.57 0.45 0.54
- 0.40 0.40 0.39 0.39
Notes: Col. (1), we report the predicted outcome given by the logit estimation. Std errors in italics.Field: workers with seniority above 12 months * significant at 10% level ; ** at 5% ; *** at 1%
33
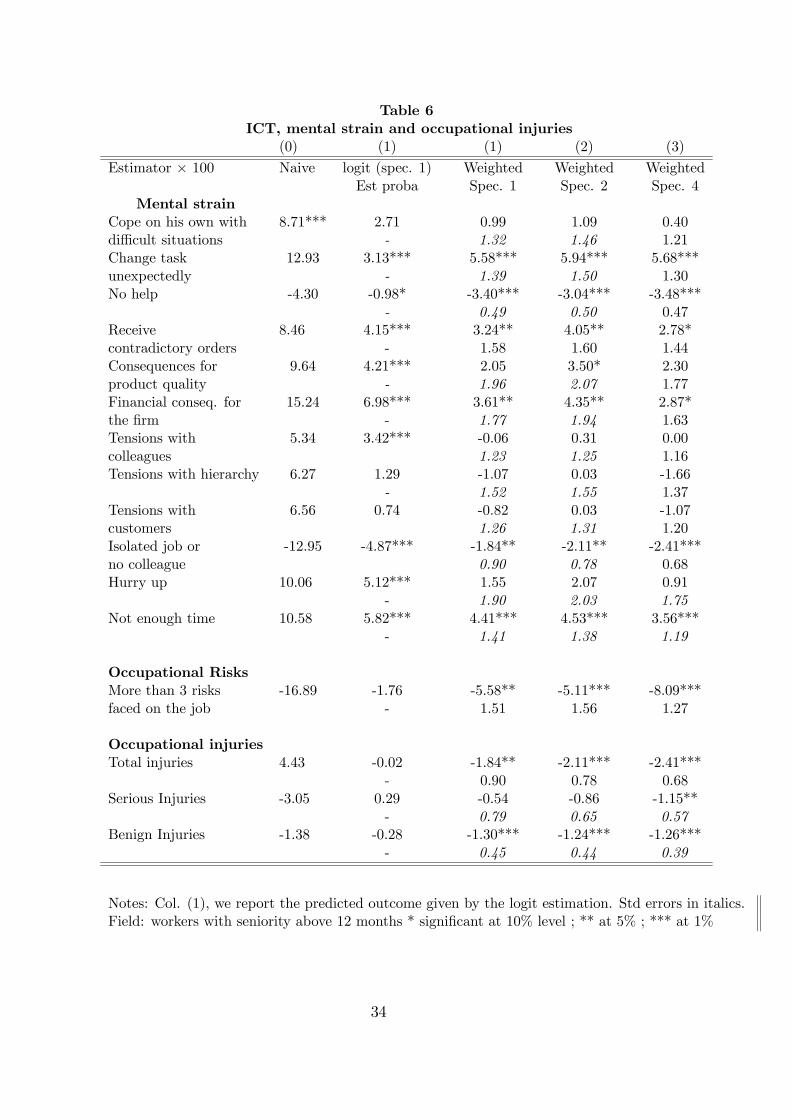
Table 6ICT, mental strain and occupational injuries
(0) (1) (1) (2) (3)
Estimator × 100 Naive logit (spec. 1) Weighted Weighted WeightedEst proba Spec. 1 Spec. 2 Spec. 4
Mental strainCope on his own with 8.71*** 2.71 0.99 1.09 0.40difficult situations - 1.32 1.46 1.21Change task 12.93 3.13*** 5.58*** 5.94*** 5.68***unexpectedly - 1.39 1.50 1.30No help -4.30 -0.98* -3.40*** -3.04*** -3.48***
- 0.49 0.50 0.47Receive 8.46 4.15*** 3.24** 4.05** 2.78*contradictory orders - 1.58 1.60 1.44Consequences for 9.64 4.21*** 2.05 3.50* 2.30product quality - 1.96 2.07 1.77Financial conseq. for 15.24 6.98*** 3.61** 4.35** 2.87*the firm - 1.77 1.94 1.63Tensions with 5.34 3.42*** -0.06 0.31 0.00colleagues 1.23 1.25 1.16Tensions with hierarchy 6.27 1.29 -1.07 0.03 -1.66
- 1.52 1.55 1.37Tensions with 6.56 0.74 -0.82 0.03 -1.07customers 1.26 1.31 1.20Isolated job or -12.95 -4.87*** -1.84** -2.11** -2.41***no colleague 0.90 0.78 0.68Hurry up 10.06 5.12*** 1.55 2.07 0.91
- 1.90 2.03 1.75Not enough time 10.58 5.82*** 4.41*** 4.53*** 3.56***
- 1.41 1.38 1.19
Occupational RisksMore than 3 risks -16.89 -1.76 -5.58** -5.11*** -8.09***faced on the job - 1.51 1.56 1.27
Occupational injuriesTotal injuries 4.43 -0.02 -1.84** -2.11*** -2.41***
- 0.90 0.78 0.68Serious Injuries -3.05 0.29 -0.54 -0.86 -1.15**
- 0.79 0.65 0.57Benign Injuries -1.38 -0.28 -1.30*** -1.24*** -1.26***
- 0.45 0.44 0.39
Notes: Col. (1), we report the predicted outcome given by the logit estimation. Std errors in italics.Field: workers with seniority above 12 months * significant at 10% level ; ** at 5% ; *** at 1%
34

Appendix Table A: Descriptive Statistics for workers with seniority above one year
Variable Mean Std dev Variable Mean Std devOccupational injuries andmental strainMore than 3 occupational risks 0.312 0.464 Contradictory orders 0.459 0.498Total injuries 0.085 0.280Serious Injuries 0.047 0.212 Consequences on qualityBenign Injuries 0.038 0.192 of product 0.659 0.474Hurry up 0.525 0.499 Financial consequences 0.507 0.500Not enough time 0.252 0.434 Isolated job or 0.191 0.393Cope with difficult situations 0.251 0.434 Tensions with colleagues 0.251 0.434Change task unexpectedly 0.284 0.451 Tensions with hierarchy 0.336 0.472No help 0.063 0.242 Tensions with customers 0.305 0.460New workplace practices TechnologyQuality norms 0.214 0.410 Robot or machine 0.057 0.231Job rotation 0.305 0.461 Computer equipment 0.526 0.499Regular discussion 0.301 0.459 NICT 0.319 0.466Flexible work hours 0.216 0.411Flexibility of days worked 0.146 0.353Characteristics of positionNights worked per year 11.29 39.38 SeniorityRepetitive task 0.291 0.454 1-5 years 0.274 0.446Constraints on work rhythm 5-10 years 0.231 0.421(0 to 7) 1.920 1.465 >10 years 0.495 0.500Work autonomy (0 to 5) 2.287 1.137 Size of the firmPrecarious job 0.043 0.203 1-50 workers 0.270 0.444Weekly worked hours 50-100 0.061 0.2380 to 14 hours 0.017 0.130 100-500 0.152 0.35915 to 29 hours 0.107 0.309 500-1000 0.058 0.23330 to 34 hours 0.060 0.238 >1000 0.232 0.42235 to 40 hours 0.531 0.499>40 hours 0.195 0.396Workers’ characteristicsNationalityFrench 0.955 0.207 Sex (ref: women) 0.530 0.499North-Africa 0.013 0.115 Highest education levelAfrica except North-Africa 0.003 0.053 no diploma 0.252 0.434European Union 0.020 0.139 lower 2dary 0.074 0.261Others 0.009 0.093 technical 2dary 0.316 0.465Age high school diploma 0.128 0.33515-25 years old 0.032 0.175 college degree 0.117 0.32225-40 years old 0.434 0.496 graduate degree or more 0.100 0.30040-55 years old 0.453 0.498 still a student 0.013 0.113>55 years old 0.082 0.274
35

Appendix Table BDeterminants of the Use of New Work Practices
Dependent Variable Quality Norms Job RotationWorkers Characteristics
Age (ref: 25-40)
age 15-25 -0.140 0.1450.143 0.111
age 40-55 -0.035 -0.0930.053 0.044
age >55 -0.062 -0.1180.097 0.080
Education (ref: technical 2ndary)
No diplome -0.199 0.0210.063 0.051
Lower general 2ndary 0.020 -0.0410.093 0.075
High School degree 0.002 -0.0800.077 0.064
College degree -0.214 -0.2820.091 0.078
Graduate degree -0.322 -0.3380.116 0.103
Student -0.107 -0.2900.245 0.185
Seniority (ref: >10 years)
seniority 1-5 -0.096 0.1350.066 0.053
seniority 5-10 0.015 0.1470.061 0.050
Sex (women=0) 0.193 0.0260.062 0.052
Nationality (ref: French)
North-Africa -0.919 -0.2600.232 0.166
Africa -0.793 -1.0020.644 0.493
European Union -0.470 -0.1100.176 0.139
Others -0.803 -0.0510.279 0.197
36
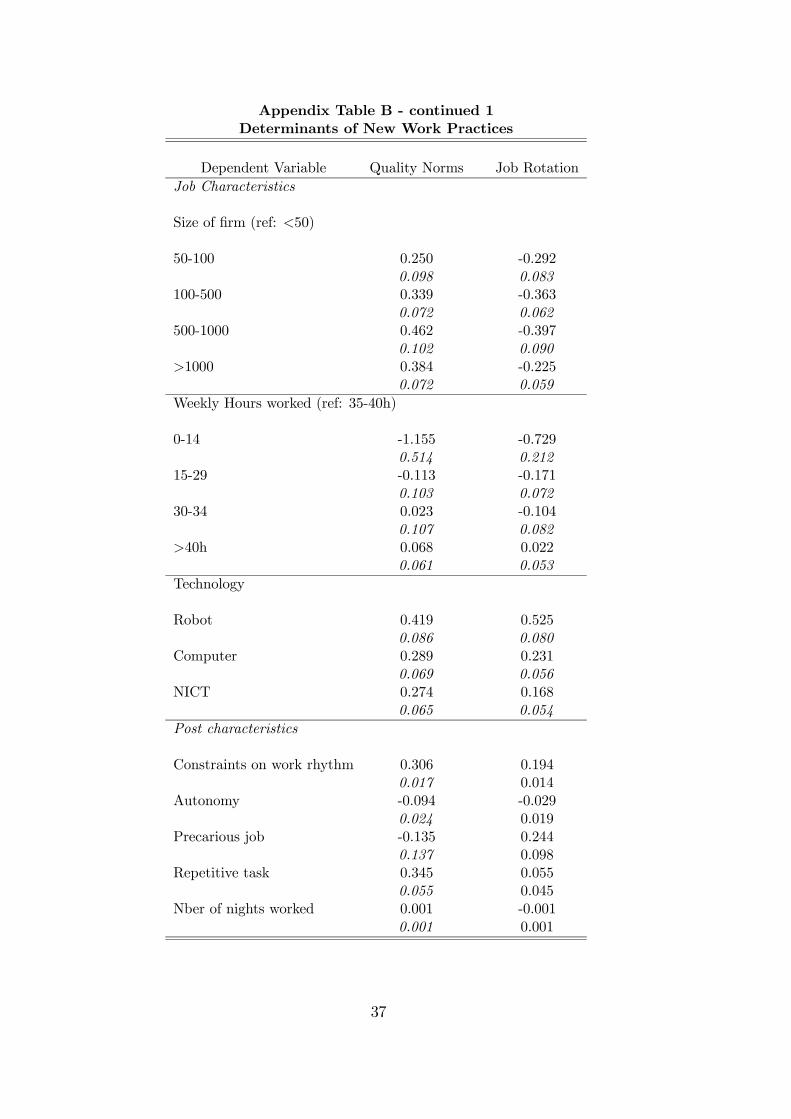
Appendix Table B - continued 1Determinants of New Work Practices
Dependent Variable Quality Norms Job RotationJob Characteristics
Size of firm (ref: <50)
50-100 0.250 -0.2920.098 0.083
100-500 0.339 -0.3630.072 0.062
500-1000 0.462 -0.3970.102 0.090
>1000 0.384 -0.2250.072 0.059
Weekly Hours worked (ref: 35-40h)
0-14 -1.155 -0.7290.514 0.212
15-29 -0.113 -0.1710.103 0.072
30-34 0.023 -0.1040.107 0.082
>40h 0.068 0.0220.061 0.053
Technology
Robot 0.419 0.5250.086 0.080
Computer 0.289 0.2310.069 0.056
NICT 0.274 0.1680.065 0.054
Post characteristics
Constraints on work rhythm 0.306 0.1940.017 0.014
Autonomy -0.094 -0.0290.024 0.019
Precarious job -0.135 0.2440.137 0.098
Repetitive task 0.345 0.0550.055 0.045
Nber of nights worked 0.001 -0.0010.001 0.001
37

Appendix Table B - continued 2Determinants of New Work Practices
Dependent Variable Quality Norms Job RotationOccupations(ref: Skilled manuals in manufacturing)
Public Managers -0.895 -1.6860.235 0.225
University Professors -1.151 -1.3350.234 0.188
Arts -1.747 -1.0170.548 0.309
Higher Civil Servants -0.450 -1.3380.146 0.144
Engineers -0.136 -1.2380.148 0.152
Elementary Teachers -1.276 -1.0040.246 0.172
Health -0.649 -0.6680.174 0.141
Civil Servants -1.388 -1.2240.205 0.156
Higher level Clerks -0.586 -1.112(adm. and trade) 0.122 0.114Technicians -0.251 -0.799
0.115 0.110Supervisors 0.153 -0.709
0.117 0.114Janitors -1.220 -0.559
0.137 0.107Police -1.867 -0.134
0.218 0.135Clerks (private sect) -1.158 -0.809
0.119 0.101Clerks (public sect) -1.240 -0.512
0.175 0.136Community -1.811 -1.134
0.240 0.146Skilled Craftsmen -0.361 -0.459
0.110 0.097Drivers -1.331 -1.115
0.172 0.144Skilled manuals (moving) -1.001 -0.292
0.156 0.136
38

Appendix Table B - continued 3Determinants of New Work Practices
Dependent Variable Quality Norms Job RotationOccupations
Unskilled manuals -0.400 0.338(manufacturing) 0.109 0.101Unskilled Craftsmen -1.232 -0.875
0.190 0.140Agriculture Workers -0.481 -0.493
0.353 0.255
Regional dummies (21) yes yesSectoral dummies (36) yes yes
Observations 15,906 15,907Log likelihood -6417 -8809Pseudo R2 0.224 0.099
Notes: standard errors in italics.
39