inquiry question which acute body system responses … · acute responses of the cardiovascular...
TRANSCRIPT
c06AcutePhysiologicalResponsesToExercise 196 4 May 2017 12:46 PM
INQUIRY QUESTION Which acute body system responses may occur as a result of the movement depicted in this image?
UNCORRECTED PAGE P
ROOFS
UNCORRECTED PAGE P
ROOFS
UNCORRECTED PAGE P
ROOFS
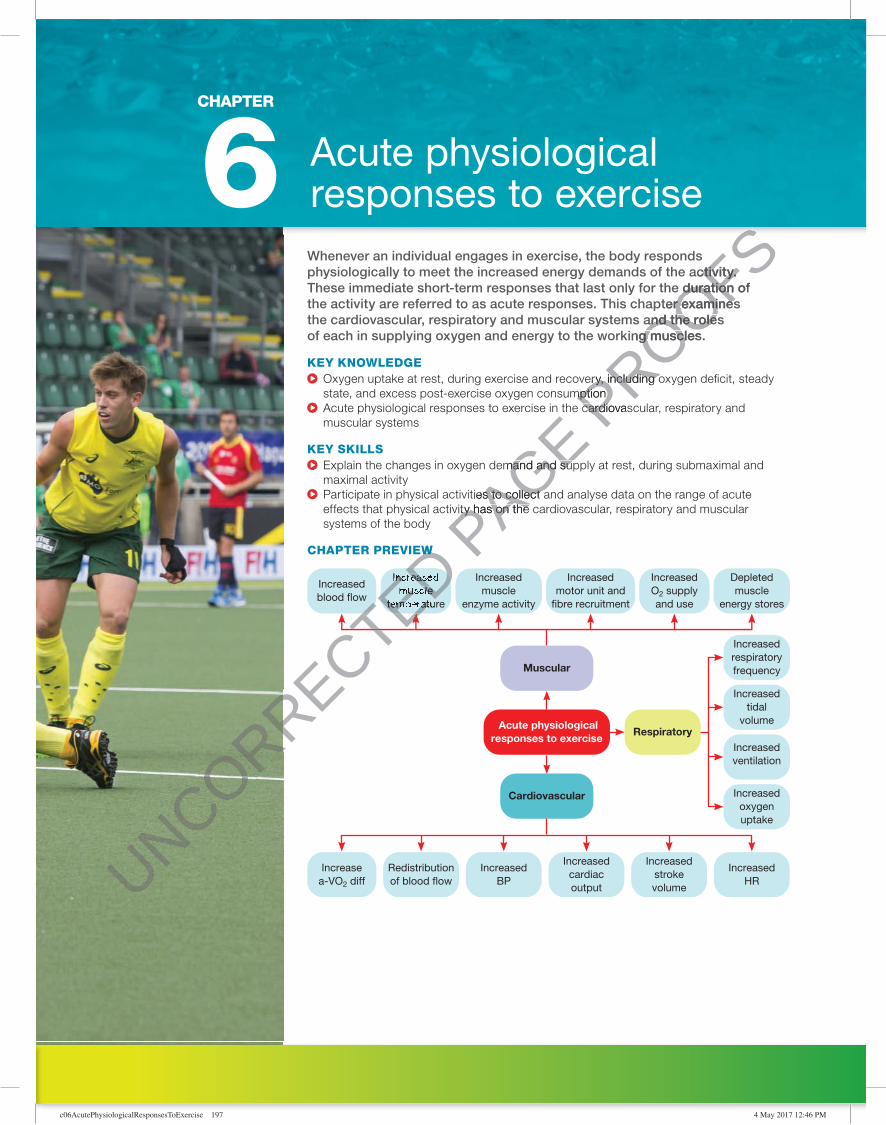
Whenever an individual engages in exercise, the body responds physiologically to meet the increased energy demands of the activity. These immediate short-term responses that last only for the duration of the activity are referred to as acute responses. This chapter examines the cardiovascular, respiratory and muscular systems and the roles of each in supplying oxygen and energy to the working muscles.
KEY KNOWLEDGE � Oxygen uptake at rest, during exercise and recovery, including oxygen de� cit, steady state, and excess post-exercise oxygen consumption
� Acute physiological responses to exercise in the cardiovascular, respiratory and muscular systems
KEY SKILLS � Explain the changes in oxygen demand and supply at rest, during submaximal and maximal activity
� Participate in physical activities to collect and analyse data on the range of acute effects that physical activity has on the cardiovascular, respiratory and muscular systems of the body
CHAPTER PREVIEW
Increasea-VO2 diff
Redistributionof blood �ow
IncreasedBP
Cardiovascular
Respiratory
Muscular
Acute physiologicalresponses to exercise
Increasedcardiacoutput
Increasedstrokevolume
IncreasedHR
Depletedmuscle
energy stores
Increasedmuscle
temperature
Increasedmuscle
enzyme activity
Increasedmotor unit and
�bre recruitment
IncreasedO2 supplyand use
Increasedblood �ow
Increasedoxygenuptake
Increasedventilation
Increasedtidal
volume
Increasedrespiratoryfrequency
Acute physiological responses to exercise
c06AcutePhysiologicalResponsesToExercise 197 4 May 2017 12:46 PM
6 CHAPTER
UNCORRECTED CHAPTER PREVIEW
UNCORRECTED CHAPTER PREVIEW
UNCORRECTED Increased
UNCORRECTED Increased
muscle
UNCORRECTED muscle
UNCORRECTED
UNCORRECTED temperature
UNCORRECTED temperature
UNCORRECTED
UNCORRECTED
UNCORRECTED
UNCORRECTED
UNCORRECTED PAGE Acute physiological responses to exercise in the cardiovascular, respiratory and
PAGE Acute physiological responses to exercise in the cardiovascular, respiratory and
Explain the changes in oxygen demand and supply at rest, during submaximal and
PAGE Explain the changes in oxygen demand and supply at rest, during submaximal and
Participate in physical activities to collect and analyse data on the range of acute
PAGE Participate in physical activities to collect and analyse data on the range of acute effects that physical activity has on the cardiovascular, respiratory and muscular
PAGE effects that physical activity has on the cardiovascular, respiratory and muscular
PROOFSphysiologically to meet the increased energy demands of the activity.
PROOFSphysiologically to meet the increased energy demands of the activity. These immediate short-term responses that last only for the duration of
PROOFSThese immediate short-term responses that last only for the duration of the activity are referred to as acute responses. This chapter examines
PROOFSthe activity are referred to as acute responses. This chapter examines the cardiovascular, respiratory and muscular systems and the roles
PROOFSthe cardiovascular, respiratory and muscular systems and the roles of each in supplying oxygen and energy to the working muscles.
PROOFSof each in supplying oxygen and energy to the working muscles.
Oxygen uptake at rest, during exercise and recovery, including oxygen de� cit, steady
PROOFS
Oxygen uptake at rest, during exercise and recovery, including oxygen de� cit, steady state, and excess post-exercise oxygen consumptionPROOFS
state, and excess post-exercise oxygen consumptionAcute physiological responses to exercise in the cardiovascular, respiratory and PROOFS
Acute physiological responses to exercise in the cardiovascular, respiratory and PROOFS
PROOFS

198 UNIT 3 • Movement skills and energy for physical activity
c06AcutePhysiologicalResponsesToExercise 198 4 May 2017 12:46 PM
6.1 Acute responses of the cardiovascular system: heart rate, stroke volume and cardiac output
Numerous cardiovascular (heart, blood and blood vessels) responses occur when we start exercising. All are designed to facilitate the rapid and effi cient delivery of increased amounts of oxygen to the working muscles in order to meet the body’s increased demand for energy. Acute responses of the cardiovascular system to exercise include:
� increased heart rate � increased stroke volume � increased cardiac output � increased blood pressure � redistribution of blood fl ow to working muscles � increased arteriovenous oxygen difference.This section considers the fi rst three of these cardiovascular responses as they all
relate directly to the heart itself.
Increased heart rate � Heart rate (HR) refers to the number of times the heart contracts or beats per minute (bpm). Resting heart rate (RHR) refers to the number of heartbeats per minute while the body is at rest and for an adult is usually somewhere between 60 and 80 beats per minute, with 70 beats per minute being about average. Once an individual begins to exercise, their heart rate increases as a response to the extra energy required by the body. The increase in heart rate helps to increase oxygen delivery to the working muscles and aids in the removal of waste products from the muscles and body. The heart rate increases directly in proportion (linearly) with increases in exercise intensity until near-maximal intensity is reached. The greater the intensity of exercise, the greater the increase in heart rate. For example, light or low-intensity exercise tends to produce heart rates of 100–140 beats per minute, while moderate intensity exercise typically results in heart rates of 140–160 beats per minute. High-intensity exercise produces even higher heart rates (see fi gure 6.1), although there is a maximum (ceiling) to which the heart rate can increase. This is referred to as the maximum heart rate (MHR) and it can be defi ned as ‘the highest heart rate value achieved in an all-out effort to the point of exhaustion’ (Wilmore et al.).
� An estimation of maximum heart rate can be calculated by subtracting the age of the individual from 220 (maximum heart rate = 220 − age in years). For example, a 17-year-old VCE student would have a maximum heart rate of 220 − 17 = 203 beats per minute. However, it should be stressed that this method provides only a very rough estimation of an individual’s maximum heart rate, and that considerable individual variation exists.
Acute responses are the body’s immediate, short-term responses that last only for the duration of the training or exercise session and for a short time period (recovery) afterwards.
KEY CONCEPT When we engage in exercise, certain changes occur immediately within the cardiovascular system to meet the increased energy demands imposed on the body by the activity being undertaken. These are referred to as acute responses.
Heart rate (HR) is the number of times the heart contracts or beats per minute.
Resting heart rate (RHR) refers to the number of heartbeats per minute while the body is at rest — usually an average of 70 beats per minute for an adult.
Maximum heart rate (MHR) is the highest heart rate value achieved in an all-out effort to the point of exhaustion.
InteractivityMaximum heart rate calculator Searchlight ID: int-6796UNCORRECTED refers to the number of times the heart contracts or beats per
UNCORRECTED refers to the number of times the heart contracts or beats per Resting heart rate (RHR)
UNCORRECTED Resting heart rate (RHR)minute while the body is at rest and for an adult is usually somewhere between
UNCORRECTED minute while the body is at rest and for an adult is usually somewhere between 60 and 80 beats per minute, with 70 beats per minute being about average. Once
UNCORRECTED 60 and 80 beats per minute, with 70 beats per minute being about average. Once an individual begins to exercise, their heart rate increases as a response to the
UNCORRECTED an individual begins to exercise, their heart rate increases as a response to the extra energy required by the body. The increase in heart rate helps to increase
UNCORRECTED extra energy required by the body. The increase in heart rate helps to increase oxygen delivery to the working muscles and aids in the removal of waste products
UNCORRECTED oxygen delivery to the working muscles and aids in the removal of waste products from the muscles and body.
UNCORRECTED from the muscles and body. The heart rate increases directly in proportion (linearly) with increases in
UNCORRECTED The heart rate increases directly in proportion (linearly) with increases in exercise intensity until near-maximal intensity is reached. The greater the
UNCORRECTED
exercise intensity until near-maximal intensity is reached. The greater the intensity of exercise, the greater the increase in heart rate. For example, light or
UNCORRECTED
intensity of exercise, the greater the increase in heart rate. For example, light or low-intensity exercise tends to produce heart rates of 100–140 beats per minute,
UNCORRECTED
low-intensity exercise tends to produce heart rates of 100–140 beats per minute, while moderate intensity exercise typically results in heart rates of 140–160
UNCORRECTED
while moderate intensity exercise typically results in heart rates of 140–160
UNCORRECTED
UNCORRECTED
UNCORRECTED
Maximum heart rate (MHR)
UNCORRECTED
Maximum heart rate (MHR) is
UNCORRECTED
is the highest heart rate value
UNCORRECTED
the highest heart rate value achieved in an all-out effort
UNCORRECTED
achieved in an all-out effort to the point of exhaustion.
UNCORRECTED
to the point of exhaustion.
UNCORRECTED
InteractivityUNCORRECTED
InteractivityMaximum heart rate calculator UNCORRECTED
Maximum heart rate calculator Searchlight ID: int-6796UNCORRECTED
Searchlight ID: int-6796UNCORRECTED
UNCORRECTED
UNCORRECTED
UNCORRECTED
UNCORRECTED
UNCORRECTED
UNCORRECTED
UNCORRECTED PAGE redistribution of blood fl ow to working muscles
PAGE redistribution of blood fl ow to working musclesincreased arteriovenous oxygen difference.
PAGE increased arteriovenous oxygen difference.This section considers the fi rst three of these cardiovascular responses as they all
PAGE This section considers the fi rst three of these cardiovascular responses as they all
Increased heart rate
PAGE Increased heart rate
refers to the number of times the heart contracts or beats per PAGE
refers to the number of times the heart contracts or beats per Resting heart rate (RHR)PAGE
Resting heart rate (RHR)
PROOFSNumerous cardiovascular (heart, blood and blood vessels) responses occur when
PROOFSNumerous cardiovascular (heart, blood and blood vessels) responses occur when we start exercising. All are designed to facilitate the rapid and effi cient delivery of
PROOFSwe start exercising. All are designed to facilitate the rapid and effi cient delivery of increased amounts of oxygen to the working muscles in order to meet the body’s
PROOFSincreased amounts of oxygen to the working muscles in order to meet the body’s
of the cardiovascular system to
PROOFS of the cardiovascular system to
PROOFS

CHAPTER 6 • Acute physiological responses to exercise 199
c06AcutePhysiologicalResponsesToExercise 199 4 May 2017 12:46 PM
0
70
90
110
130
150
170
190
210
% VO2 max
25Rest 50 75 100
Hea
rt r
ate
(bea
ts p
er m
inut
e)
MHR
Trained athletes have lower heart rates at rest and during all exercise intensities compared with untrained individuals. The heart rate actually rises above resting values just before the start of exercise. This is called an anticipatory response. The anticipatory increase in heart rate that occurs prior to beginning exercise is largely due to the release of epinephrine (adrenaline). Figure 6.2 depicts the heart rate response to exercise before, during and after moderate-intensity exercise.
Anticipatoryrise
Hea
rt r
ate
(bea
ts p
er m
inut
e)
RecoveryRest Moderatework
Activity time (minutes)
1 2 3 4 5 6 7 8 9 10 11 12 13 14 15 16 17 18 19 20 21 22 23 24 25 26
65
85
105
125
145
165
FIGURE 6.2 Heart rate response to exercise before, during and after moderate-intensity exercise
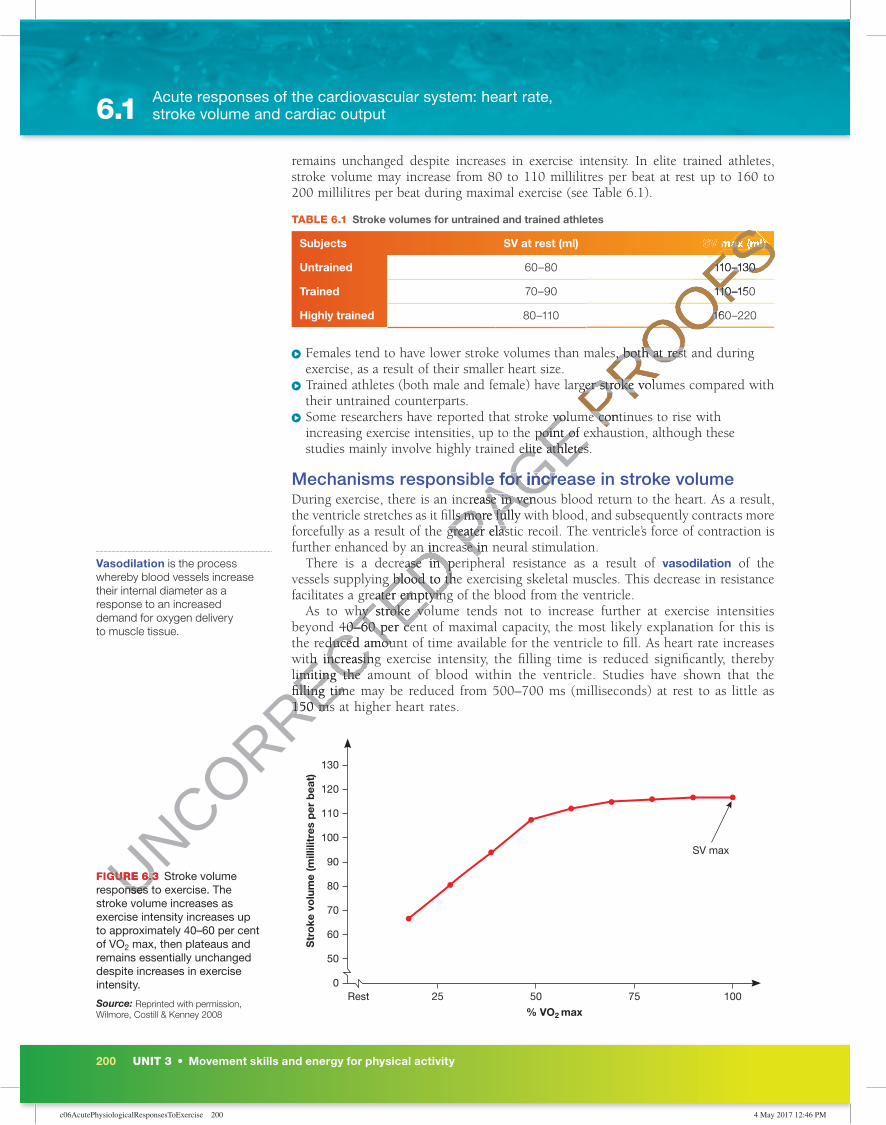
Increased stroke volumeStroke volume (SV) is defi ned as the amount of blood ejected from the left ventricle with each beat (contraction) of the heart. Stroke volume increases during exercise; however, most researchers agree that while stroke volume increases with increasing exercise intensities, it does so only up to exercise intensities, for untrained athletes, somewhere between 40 and 60 per cent of maximal capacity (see fi gure 6.3). In untrained individuals stroke volume at rest is about 60–80 millilitres per beat. During exercise, stroke volume increases to average maximal values ranging from 110 to 130 millilitres per beat. At this point, stroke volume typically plateaus and
FIGURE 6.1 The heart rate increases directly in proportion (linearly) with increases in exercise intensity.
Source: Reprinted with permission, Wilmore, Costill & Kenney 2008.
eLessonHeart rate responseSearchlight ID: eles-2760
Stroke volume (SV) is the amount of blood ejected from the left ventricle with each beat (contraction) of the heart.
Anticipatory response is when the heart rate rises above resting values just before the start of exercise.
UNCORRECTED
UNCORRECTED
UNCORRECTED
UNCORRECTED
UNCORRECTED
UNCORRECTED
Rest
UNCORRECTED
Rest
UNCORRECTED
1
UNCORRECTED
1
UNCORRECTED
2
UNCORRECTED
2
UNCORRECTED
3
UNCORRECTED
3
UNCORRECTED
4
UNCORRECTED
4
UNCORRECTED
UNCORRECTED
UNCORRECTED
UNCORRECTED
UNCORRECTED
UNCORRECTED
UNCORRECTED
Increased stroke volumeUNCORRECTED
Increased stroke volumeStroke volume (SV)UNCORRECTED
Stroke volume (SV)with each beat (contraction) of the heart. Stroke volume increases during exercise; UNCORRECTED
with each beat (contraction) of the heart. Stroke volume increases during exercise;
PAGE Trained athletes have lower heart rates at rest and during all exercise intensities
PAGE Trained athletes have lower heart rates at rest and during all exercise intensities compared with untrained individuals. The heart rate actually rises above resting
PAGE compared with untrained individuals. The heart rate actually rises above resting values just before the start of exercise. This is called an anticipatory response. The
PAGE values just before the start of exercise. This is called an anticipatory response. The anticipatory increase in heart rate that occurs prior to beginning exercise is largely due
PAGE anticipatory increase in heart rate that occurs prior to beginning exercise is largely due to the release of epinephrine (adrenaline). Figure 6.2 depicts the heart rate response
PAGE to the release of epinephrine (adrenaline). Figure 6.2 depicts the heart rate response to exercise before, during and after moderate-intensity exercise.PAGE to exercise before, during and after moderate-intensity exercise.
PROOFSFIGURE 6.1
PROOFSFIGURE 6.1 The heart rate
PROOFSThe heart rate
increases directly in proportion
PROOFSincreases directly in proportion (linearly) with increases in exercise
PROOFS(linearly) with increases in exercise intensity.
PROOFSintensity.
Source: PROOFS
Source: Wilmore, Costill & Kenney 2008.PROOFS
Wilmore, Costill & Kenney 2008.
200 UNIT 3 • Movement skills and energy for physical activity
c06AcutePhysiologicalResponsesToExercise 200 4 May 2017 12:46 PM
remains unchanged despite increases in exercise intensity. In elite trained athletes, stroke volume may increase from 80 to 110 millilitres per beat at rest up to 160 to 200 millilitres per beat during maximal exercise (see Table 6.1).
TABLE 6.1 Stroke volumes for untrained and trained athletes
Subjects SV at rest (ml) SV max (ml)
Untrained 60–80 110–130
Trained 70–90 110–150
Highly trained 80–110 160–220
� Females tend to have lower stroke volumes than males, both at rest and during exercise, as a result of their smaller heart size.
� Trained athletes (both male and female) have larger stroke volumes compared with their untrained counterparts.
� Some researchers have reported that stroke volume continues to rise with increasing exercise intensities, up to the point of exhaustion, although these studies mainly involve highly trained elite athletes.
Mechanisms responsible for increase in stroke volumeDuring exercise, there is an increase in venous blood return to the heart. As a result, the ventricle stretches as it fi lls more fully with blood, and subsequently contracts more forcefully as a result of the greater elastic recoil. The ventricle’s force of contraction is further enhanced by an increase in neural stimulation.
There is a decrease in peripheral resistance as a result of vasodilation of the vessels supplying blood to the exercising skeletal muscles. This decrease in resistance facilitates a greater emptying of the blood from the ventricle.
As to why stroke volume tends not to increase further at exercise intensities beyond 40–60 per cent of maximal capacity, the most likely explanation for this is the reduced amount of time available for the ventricle to fi ll. As heart rate increases with increasing exercise intensity, the fi lling time is reduced signifi cantly, thereby limiting the amount of blood within the ventricle. Studies have shown that the fi lling time may be reduced from 500–700 ms (milliseconds) at rest to as little as 150 ms at higher heart rates.
0
50
60
70
80
90
100
110
120
% VO2 max25Rest 50 75 100
130
Str
oke
vo
lum
e (m
illili
tres
per
bea
t)
SV max
Vasodilation is the process whereby blood vessels increase their internal diameter as a response to an increased demand for oxygen delivery to muscle tissue.
FIGURE 6.3 Stroke volume responses to exercise. The stroke volume increases as exercise intensity increases up to approximately 40–60 per cent of VO2 max, then plateaus and remains essentially unchanged despite increases in exercise intensity.
Source: Reprinted with permission, Wilmore, Costill & Kenney 2008
Acute responses of the cardiovascular system: heart rate, stroke volume and cardiac output6.1
UNCORRECTED further enhanced by an increase in neural stimulation.
UNCORRECTED further enhanced by an increase in neural stimulation.There is a decrease in peripheral resistance as a result of
UNCORRECTED There is a decrease in peripheral resistance as a result of vessels supplying blood to the exercising skeletal muscles. This decrease in resistance
UNCORRECTED vessels supplying blood to the exercising skeletal muscles. This decrease in resistance facilitates a greater emptying of the blood from the ventricle.
UNCORRECTED facilitates a greater emptying of the blood from the ventricle.
As to why stroke volume tends not to increase further at exercise intensities
UNCORRECTED As to why stroke volume tends not to increase further at exercise intensities
UNCORRECTED beyond 40–60 per cent of maximal capacity, the most likely explanation for this is
UNCORRECTED beyond 40–60 per cent of maximal capacity, the most likely explanation for this is the reduced amount of time available for the ventricle to fi ll. As heart rate increases
UNCORRECTED the reduced amount of time available for the ventricle to fi ll. As heart rate increases with increasing exercise intensity, the fi lling time is reduced signifi cantly, thereby
UNCORRECTED with increasing exercise intensity, the fi lling time is reduced signifi cantly, thereby limiting the amount of blood within the ventricle. Studies have shown that the
UNCORRECTED
limiting the amount of blood within the ventricle. Studies have shown that the fi lling time may be reduced from 500–700 ms (milliseconds) at rest to as little as
UNCORRECTED
fi lling time may be reduced from 500–700 ms (milliseconds) at rest to as little as 150 ms at higher heart rates.
UNCORRECTED
150 ms at higher heart rates.
FIGURE 6.3 UNCORRECTED
FIGURE 6.3 responses to exercise. The UNCORRECTED
responses to exercise. The
PAGE Some researchers have reported that stroke volume continues to rise with
PAGE Some researchers have reported that stroke volume continues to rise with increasing exercise intensities, up to the point of exhaustion, although these
PAGE increasing exercise intensities, up to the point of exhaustion, although these studies mainly involve highly trained elite athletes.
PAGE studies mainly involve highly trained elite athletes.
Mechanisms responsible for increase in stroke volume
PAGE Mechanisms responsible for increase in stroke volumeDuring exercise, there is an increase in venous blood return to the heart. As a result,
PAGE During exercise, there is an increase in venous blood return to the heart. As a result, the ventricle stretches as it fi lls more fully with blood, and subsequently contracts more
PAGE the ventricle stretches as it fi lls more fully with blood, and subsequently contracts more forcefully as a result of the greater elastic recoil. The ventricle’s force of contraction is PAGE forcefully as a result of the greater elastic recoil. The ventricle’s force of contraction is further enhanced by an increase in neural stimulation.PAGE
further enhanced by an increase in neural stimulation.There is a decrease in peripheral resistance as a result of PAGE
There is a decrease in peripheral resistance as a result of
PROOFS
PROOFS
PROOFS
PROOFS
PROOFS
PROOFS
PROOFS
PROOFSSV max (ml)
PROOFSSV max (ml)
110–130
PROOFS110–130
110–150
PROOFS110–150
160–220
PROOFS160–220
Females tend to have lower stroke volumes than males, both at rest and during
PROOFSFemales tend to have lower stroke volumes than males, both at rest and during
Trained athletes (both male and female) have larger stroke volumes compared with
PROOFS
Trained athletes (both male and female) have larger stroke volumes compared with
Some researchers have reported that stroke volume continues to rise with PROOFS
Some researchers have reported that stroke volume continues to rise with increasing exercise intensities, up to the point of exhaustion, although these PROOFS
increasing exercise intensities, up to the point of exhaustion, although these
CHAPTER 6 • Acute physiological responses to exercise 201
c06AcutePhysiologicalResponsesToExercise 201 4 May 2017 12:46 PM
Increased cardiac outputCardiac output (Q
.) usually refers to the amount of blood ejected from the left
ventricle of the heart per minute. It is the product of heart rate multiplied by stroke volume:
Q ∙ = heart rate (HR) × stroke volume (SV)
Q ∙ = HR × SV
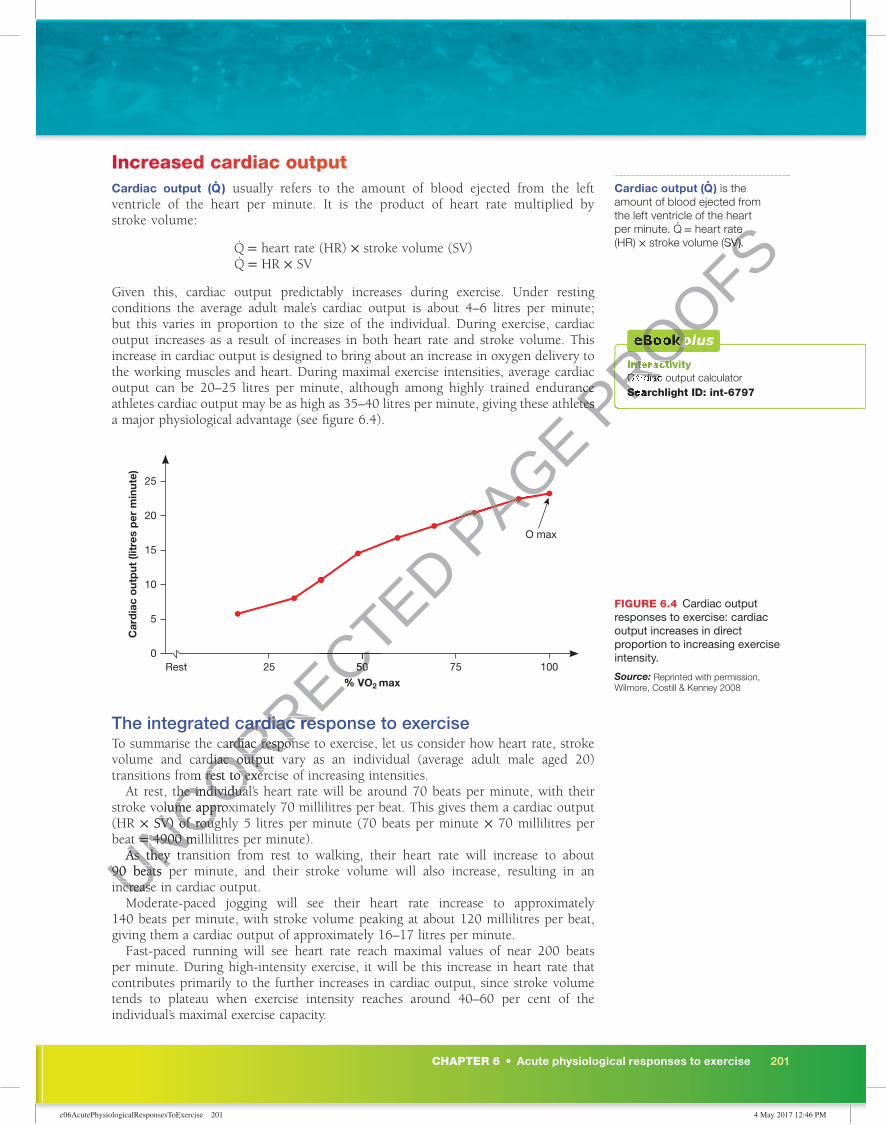
Given this, cardiac output predictably increases during exercise. Under resting conditions the average adult male’s cardiac output is about 4–6 litres per minute; but this varies in proportion to the size of the individual. During exercise, cardiac output increases as a result of increases in both heart rate and stroke volume. This increase in cardiac output is designed to bring about an increase in oxygen delivery to the working muscles and heart. During maximal exercise intensities, average cardiac output can be 20–25 litres per minute, although among highly trained endurance athletes cardiac output may be as high as 35–40 litres per minute, giving these athletes a major physiological advantage (see fi gure 6.4).
0
5
10
15
20
% VO2 max25Rest 50 75 100
O max
25
Car
dia
c o
utp
ut (l
itre
s p
er m
inut
e)
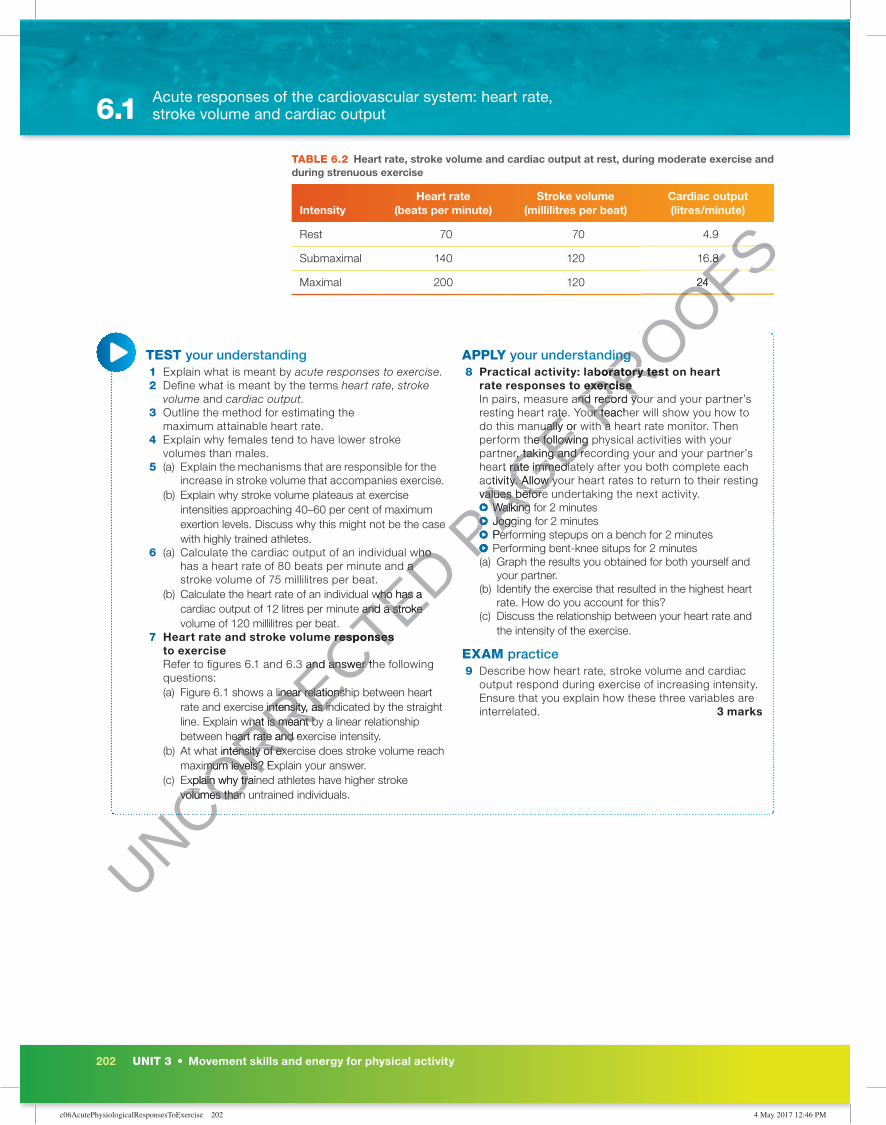
The integrated cardiac response to exerciseTo summarise the cardiac response to exercise, let us consider how heart rate, stroke volume and cardiac output vary as an individual (average adult male aged 20) transitions from rest to exercise of increasing intensities.
At rest, the individual’s heart rate will be around 70 beats per minute, with their stroke volume approximately 70 millilitres per beat. This gives them a cardiac output (HR × SV) of roughly 5 litres per minute (70 beats per minute × 70 millilitres per beat = 4900 millilitres per minute).
As they transition from rest to walking, their heart rate will increase to about 90 beats per minute, and their stroke volume will also increase, resulting in an increase in cardiac output.
Moderate-paced jogging will see their heart rate increase to approximately 140 beats per minute, with stroke volume peaking at about 120 millilitres per beat, giving them a cardiac output of approximately 16–17 litres per minute.
Fast-paced running will see heart rate reach maximal values of near 200 beats per minute. During high-intensity exercise, it will be this increase in heart rate that contributes primarily to the further increases in cardiac output, since stroke volume tends to plateau when exercise intensity reaches around 40–60 per cent of the individual’s maximal exercise capacity.
Cardiac output (Q .) is the
amount of blood ejected from the left ventricle of the heart per minute. Q∙ = heart rate (HR) × stroke volume (SV).
InteractivityCardiac output calculatorSearchlight ID: int-6797
FIGURE 6.4 Cardiac output responses to exercise: cardiac output increases in direct proportion to increasing exercise intensity.
Source: Reprinted with permission, Wilmore, Costill & Kenney 2008
UNCORRECTED
% VO
UNCORRECTED
% VO50
UNCORRECTED 50
UNCORRECTED
UNCORRECTED
UNCORRECTED
The integrated cardiac response to exercise
UNCORRECTED
The integrated cardiac response to exerciseTo summarise the cardiac response to exercise, let us consider how heart rate, stroke
UNCORRECTED
To summarise the cardiac response to exercise, let us consider how heart rate, stroke volume and cardiac output vary as an individual (average adult male aged 20)
UNCORRECTED
volume and cardiac output vary as an individual (average adult male aged 20) transitions from rest to exercise of increasing intensities.
UNCORRECTED
transitions from rest to exercise of increasing intensities.At rest, the individual’s heart rate will be around 70 beats per minute, with their
UNCORRECTED
At rest, the individual’s heart rate will be around 70 beats per minute, with their stroke volume approximately 70 millilitres per beat. This gives them a cardiac output
UNCORRECTED
stroke volume approximately 70 millilitres per beat. This gives them a cardiac output ×
UNCORRECTED
× SV) of roughly 5 litres per minute (70 beats per minute
UNCORRECTED
SV) of roughly 5 litres per minute (70 beats per minute beat
UNCORRECTED
beat =
UNCORRECTED
= 4900 millilitres per minute).
UNCORRECTED
4900 millilitres per minute).As they transition from rest to walking, their heart rate will increase to about
UNCORRECTED
As they transition from rest to walking, their heart rate will increase to about 90 beats per minute, and their stroke volume will also increase, resulting in an UNCORRECTED
90 beats per minute, and their stroke volume will also increase, resulting in an increase in cardiac output.UNCORRECTED
increase in cardiac output.Moderate-paced jogging will see their heart rate increase to approximately UNCORRECTED
Moderate-paced jogging will see their heart rate increase to approximately
PAGE
PAGE
PAGE
PAGE PROOFS
the working muscles and heart. During maximal exercise intensities, average cardiac
PROOFSthe working muscles and heart. During maximal exercise intensities, average cardiac output can be 20–25 litres per minute, although among highly trained endurance PROOFS
output can be 20–25 litres per minute, although among highly trained endurance athletes cardiac output may be as high as 35–40 litres per minute, giving these athletes PROOFS
athletes cardiac output may be as high as 35–40 litres per minute, giving these athletes
heart rate
PROOFS heart rate
stroke volume (SV).
PROOFS stroke volume (SV).
PROOFS
PROOFSInteractivity
PROOFSInteractivityCardiac output calculator
PROOFS
Cardiac output calculatorSearchlight ID: int-6797PROOFS
Searchlight ID: int-6797PROOFS
PROOFS
PROOFS
PROOFS
PROOFS
PROOFS
PROOFS
PROOFS
202 UNIT 3 • Movement skills and energy for physical activity
c06AcutePhysiologicalResponsesToExercise 202 4 May 2017 12:46 PM
TABLE 6.2 Heart rate, stroke volume and cardiac output at rest, during moderate exercise and during strenuous exercise
IntensityHeart rate
(beats per minute)Stroke volume
(millilitres per beat)Cardiac output (litres/minute)
Rest 70 70 4.9
Submaximal 140 120 16.8
Maximal 200 120 24
TEST your understanding 1 Explain what is meant by acute responses to exercise. 2 De� ne what is meant by the terms heart rate, stroke
volume and cardiac output. 3 Outline the method for estimating the
maximum attainable heart rate. 4 Explain why females tend to have lower stroke
volumes than males. 5 (a) Explain the mechanisms that are responsible for the
increase in stroke volume that accompanies exercise.(b) Explain why stroke volume plateaus at exercise
intensities approaching 40–60 per cent of maximum exertion levels. Discuss why this might not be the case with highly trained athletes.
6 (a) Calculate the cardiac output of an individual who has a heart rate of 80 beats per minute and a stroke volume of 75 millilitres per beat.
(b) Calculate the heart rate of an individual who has a cardiac output of 12 litres per minute and a stroke volume of 120 millilitres per beat.
7 Heart rate and stroke volume responses to exercise
Refer to � gures 6.1 and 6.3 and answer the following questions:(a) Figure 6.1 shows a linear relationship between heart
rate and exercise intensity, as indicated by the straight line. Explain what is meant by a linear relationship between heart rate and exercise intensity.
(b) At what intensity of exercise does stroke volume reach maximum levels? Explain your answer.
(c) Explain why trained athletes have higher stroke volumes than untrained individuals.
APPLY your understanding 8 Practical activity: laboratory test on heart
rate responses to exercise In pairs, measure and record your and your partner’s
resting heart rate. Your teacher will show you how to do this manually or with a heart rate monitor. Then perform the following physical activities with your partner, taking and recording your and your partner’s heart rate immediately after you both complete each activity. Allow your heart rates to return to their resting values before undertaking the next activity.
Walking for 2 minutes Jogging for 2 minutes Performing stepups on a bench for 2 minutes � Performing bent-knee situps for 2 minutes
(a) Graph the results you obtained for both yourself and your partner.
(b) Identify the exercise that resulted in the highest heart rate. How do you account for this?
(c) Discuss the relationship between your heart rate and the intensity of the exercise.
EXAM practice 9 Describe how heart rate, stroke volume and cardiac
output respond during exercise of increasing intensity. Ensure that you explain how these three variables are interrelated. 3 marks
Acute responses of the cardiovascular system: heart rate, stroke volume and cardiac output6.1
UNCORRECTED
UNCORRECTED (a) Calculate the cardiac output of an individual who
UNCORRECTED (a) Calculate the cardiac output of an individual who has a heart rate of 80 beats per minute and a
UNCORRECTED has a heart rate of 80 beats per minute and a
(b) Calculate the heart rate of an individual who has a
UNCORRECTED (b) Calculate the heart rate of an individual who has a
cardiac output of 12 litres per minute and a stroke
UNCORRECTED cardiac output of 12 litres per minute and a stroke
Heart rate and stroke volume responses
UNCORRECTED Heart rate and stroke volume responses
Refer to � gures 6.1 and 6.3 and answer the following
UNCORRECTED Refer to � gures 6.1 and 6.3 and answer the following
(a) Figure 6.1 shows a linear relationship between heart
UNCORRECTED
(a) Figure 6.1 shows a linear relationship between heart rate and exercise intensity, as indicated by the straight
UNCORRECTED
rate and exercise intensity, as indicated by the straight line. Explain what is meant by a linear relationship
UNCORRECTED
line. Explain what is meant by a linear relationship between heart rate and exercise intensity.
UNCORRECTED
between heart rate and exercise intensity.(b) At what intensity of exercise does stroke volume reach
UNCORRECTED
(b) At what intensity of exercise does stroke volume reach maximum levels? Explain your answer.
UNCORRECTED
maximum levels? Explain your answer.(c) Explain why trained athletes have higher stroke
UNCORRECTED
(c) Explain why trained athletes have higher stroke volumes than untrained individuals.
UNCORRECTED
volumes than untrained individuals.
PAGE resting heart rate. Your teacher will show you how to
PAGE resting heart rate. Your teacher will show you how to do this manually or with a heart rate monitor. Then
PAGE do this manually or with a heart rate monitor. Then perform the following physical activities with your
PAGE perform the following physical activities with your partner, taking and recording your and your partner’s
PAGE partner, taking and recording your and your partner’s heart rate immediately after you both complete each
PAGE heart rate immediately after you both complete each activity. Allow your heart rates to return to their resting
PAGE activity. Allow your heart rates to return to their resting values before undertaking the next activity.
PAGE values before undertaking the next activity.�
PAGE � Walking for 2 minutes
PAGE Walking for 2 minutes
�PAGE � Jogging for 2 minutesPAGE
Jogging for 2 minutes�PAGE � Performing stepups on a bench for 2 minutesPAGE
Performing stepups on a bench for 2 minutes�PAGE
�
PROOFS
PROOFS
PROOFS
PROOFS16.8
PROOFS16.8
24
PROOFS24
PROOFS
PROOFSyour understanding
PROOFSyour understanding
Practical activity: laboratory test on heart
PROOFSPractical activity: laboratory test on heart rate responses to exercise
PROOFS
rate responses to exerciseIn pairs, measure and record your and your partner’s PROOFS
In pairs, measure and record your and your partner’s resting heart rate. Your teacher will show you how to PROOFS
resting heart rate. Your teacher will show you how to do this manually or with a heart rate monitor. Then PROOFS
do this manually or with a heart rate monitor. Then
CHAPTER 6 • Acute physiological responses to exercise 203
c06AcutePhysiologicalResponsesToExercise 203 4 May 2017 12:46 PM
Increased blood pressureBlood pressure is the pressure exerted by the blood against the arterial walls as it is forced through the circulatory system by the action of the heart. It has two components: systolic blood pressure and diastolic blood pressure. Systolic blood pressure is the pressure recorded as blood is ejected during the contraction phase of the heart beat. Diastolic blood pressure is the value recorded during relaxation of the heart.
Blood pressure is usually expressed as:
Blood pressure = systolic
mmHgdiastolic
Normal blood pressure = 120
mmHg80
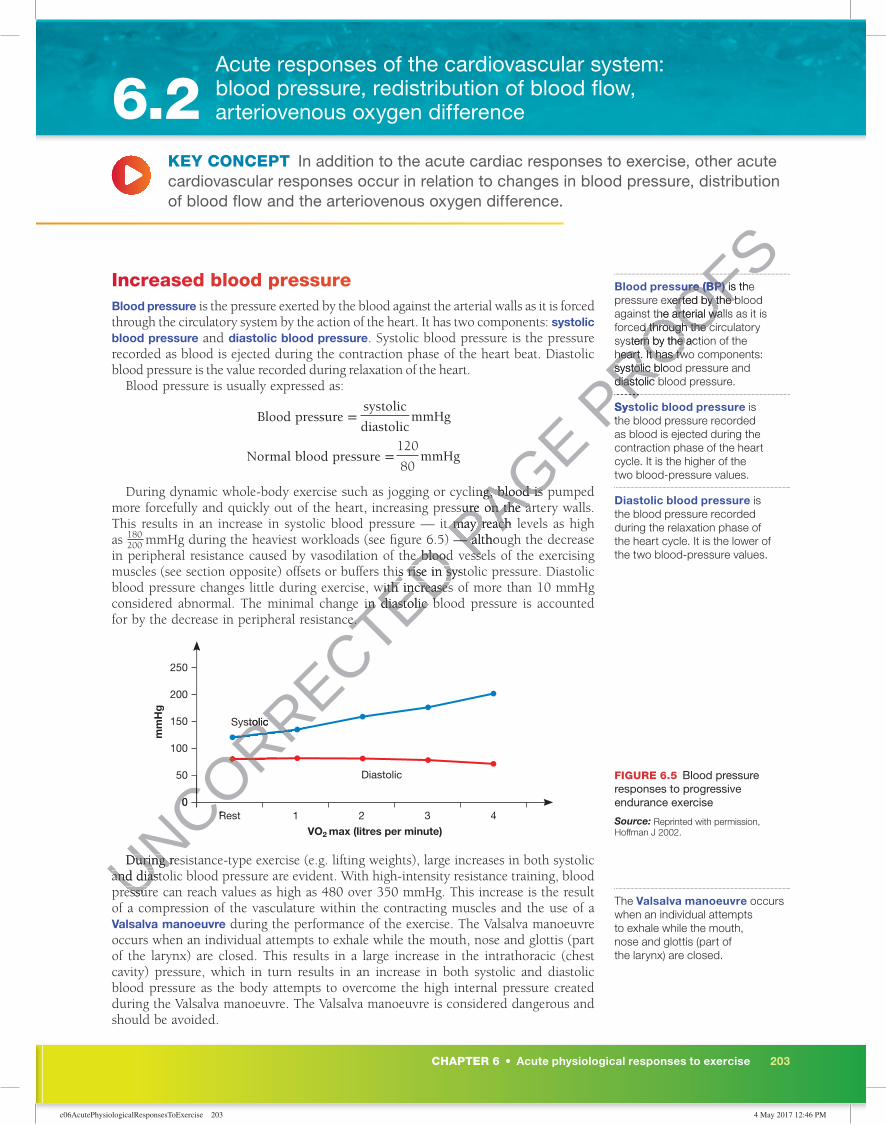
During dynamic whole-body exercise such as jogging or cycling, blood is pumped more forcefully and quickly out of the heart, increasing pressure on the artery walls. This results in an increase in systolic blood pressure — it may reach levels as high as 180
200 mmHg during the heaviest workloads (see fi gure 6.5) — although the decrease in peripheral resistance caused by vasodilation of the blood vessels of the exercising muscles (see section opposite) offsets or buffers this rise in systolic pressure. Diastolic blood pressure changes little during exercise, with increases of more than 10 mmHg considered abnormal. The minimal change in diastolic blood pressure is accounted for by the decrease in peripheral resistance.
0
50
100
150
200
250
VO2 max (litres per minute)Rest
Diastolic
Systolic
1 2 3 4
mm
Hg
During resistance-type exercise (e.g. lifting weights), large increases in both systolic and diastolic blood pressure are evident. With high-intensity resistance training, blood pressure can reach values as high as 480 over 350 mmHg. This increase is the result of a compression of the vasculature within the contracting muscles and the use of a Valsalva manoeuvre during the performance of the exercise. The Valsalva manoeuvre occurs when an individual attempts to exhale while the mouth, nose and glottis (part of the larynx) are closed. This results in a large increase in the intrathoracic (chest cavity) pressure, which in turn results in an increase in both systolic and diastolic blood pressure as the body attempts to overcome the high internal pressure created during the Valsalva manoeuvre. The Valsalva manoeuvre is considered dangerous and should be avoided.
KEY CONCEPT In addition to the acute cardiac responses to exercise, other acute cardiovascular responses occur in relation to changes in blood pressure, distribution of blood flow and the arteriovenous oxygen difference.
Blood pressure (BP) is the pressure exerted by the blood against the arterial walls as it is forced through the circulatory system by the action of the heart. It has two components: systolic blood pressure and diastolic blood pressure.
Systolic blood pressure is the blood pressure recorded as blood is ejected during the contraction phase of the heart cycle. It is the higher of the two blood-pressure values.
Diastolic blood pressure is the blood pressure recorded during the relaxation phase of the heart cycle. It is the lower of the two blood-pressure values.
FIGURE 6.5 Blood pressure responses to progressive endurance exercise
Source: Reprinted with permission, Hoffman J 2002.
The Valsalva manoeuvre occurs when an individual attempts to exhale while the mouth, nose and glottis (part of the larynx) are closed.
Acute responses of the cardiovascular system: blood pressure, redistribution of blood flow, arteriovenous oxygen difference6.2
UNCORRECTED mmHg during the heaviest workloads (see fi gure 6.5) — although the decrease
UNCORRECTED mmHg during the heaviest workloads (see fi gure 6.5) — although the decrease in peripheral resistance caused by vasodilation of the blood vessels of the exercising
UNCORRECTED in peripheral resistance caused by vasodilation of the blood vessels of the exercising muscles (see section opposite) offsets or buffers this rise in systolic pressure. Diastolic
UNCORRECTED muscles (see section opposite) offsets or buffers this rise in systolic pressure. Diastolic blood pressure changes little during exercise, with increases of more than 10 mmHg
UNCORRECTED blood pressure changes little during exercise, with increases of more than 10 mmHg considered abnormal. The minimal change in diastolic blood pressure is accounted
UNCORRECTED considered abnormal. The minimal change in diastolic blood pressure is accounted for by the decrease in peripheral resistance.
UNCORRECTED for by the decrease in peripheral resistance.
UNCORRECTED
UNCORRECTED
UNCORRECTED
0
UNCORRECTED
0Rest
UNCORRECTED
Rest
Systolic
UNCORRECTED
Systolic
UNCORRECTED
UNCORRECTED
UNCORRECTED
UNCORRECTED
UNCORRECTED
UNCORRECTED
UNCORRECTED
UNCORRECTED
UNCORRECTED
UNCORRECTED
During resistance-type exercise (e.g. lifting weights), large increases in both systolic UNCORRECTED
During resistance-type exercise (e.g. lifting weights), large increases in both systolic and diastolic blood pressure are evident. With high-intensity resistance training, blood UNCORRECTED
and diastolic blood pressure are evident. With high-intensity resistance training, blood pressure can reach values as high as 480 over 350 mmHg. This increase is the result UNCORRECTED
pressure can reach values as high as 480 over 350 mmHg. This increase is the result
PAGE During dynamic whole-body exercise such as jogging or cycling, blood is pumped
PAGE During dynamic whole-body exercise such as jogging or cycling, blood is pumped
more forcefully and quickly out of the heart, increasing pressure on the artery walls.
PAGE more forcefully and quickly out of the heart, increasing pressure on the artery walls. This results in an increase in systolic blood pressure — it may reach levels as high PAGE This results in an increase in systolic blood pressure — it may reach levels as high
mmHg during the heaviest workloads (see fi gure 6.5) — although the decrease PAGE
mmHg during the heaviest workloads (see fi gure 6.5) — although the decrease in peripheral resistance caused by vasodilation of the blood vessels of the exercising PAGE
in peripheral resistance caused by vasodilation of the blood vessels of the exercising
PROOFS
PROOFS
PROOFS
PROOFS
PROOFSBlood pressure (BP)
PROOFSBlood pressure (BP) is the
PROOFSis the
pressure exerted by the blood
PROOFSpressure exerted by the blood against the arterial walls as it is
PROOFSagainst the arterial walls as it is forced through the circulatory
PROOFSforced through the circulatory system by the action of the
PROOFSsystem by the action of the heart. It has two components:
PROOFSheart. It has two components: systolic blood pressure and
PROOFSsystolic blood pressure and diastolic blood pressure.
PROOFS
diastolic blood pressure.
Systolic blood pressure PROOFS
Systolic blood pressure the blood pressure recorded PROOFS
the blood pressure recorded

204 UNIT 3 • Movement skills and energy for physical activity
c06AcutePhysiologicalResponsesToExercise 204 4 May 2017 12:46 PM
Redistribution of blood flow to working musclesUnder resting conditions only about 15–20 per cent of total systemic blood � ow is directed to the skeletal muscles. The majority of the remaining 80–85 per cent is distributed to the organs (e.g. heart, liver, kidneys, intestines, brain) of the body. However, under exercise conditions the majority of the blood (80–90 per cent) may be redirected to the working muscles (see fi gure 6.6). This is achieved by the capillaries and arterioles supplying the working muscles expanding in diameter (a process known as vasodilation). At the same time, blood fl ow to the organs of the body is reduced by the vasoconstriction (narrowing) of the capillaries and arterioles that supply blood to these organs.
Resting
Skin6%
Liver29%
Other7%
Brain15%
Heart4%
Kidneys23%
Muscle16%
Skin2%
Other3%
Brain4%
Heart4%
Kidneys1% Liver
2%Muscle84%
Exercising
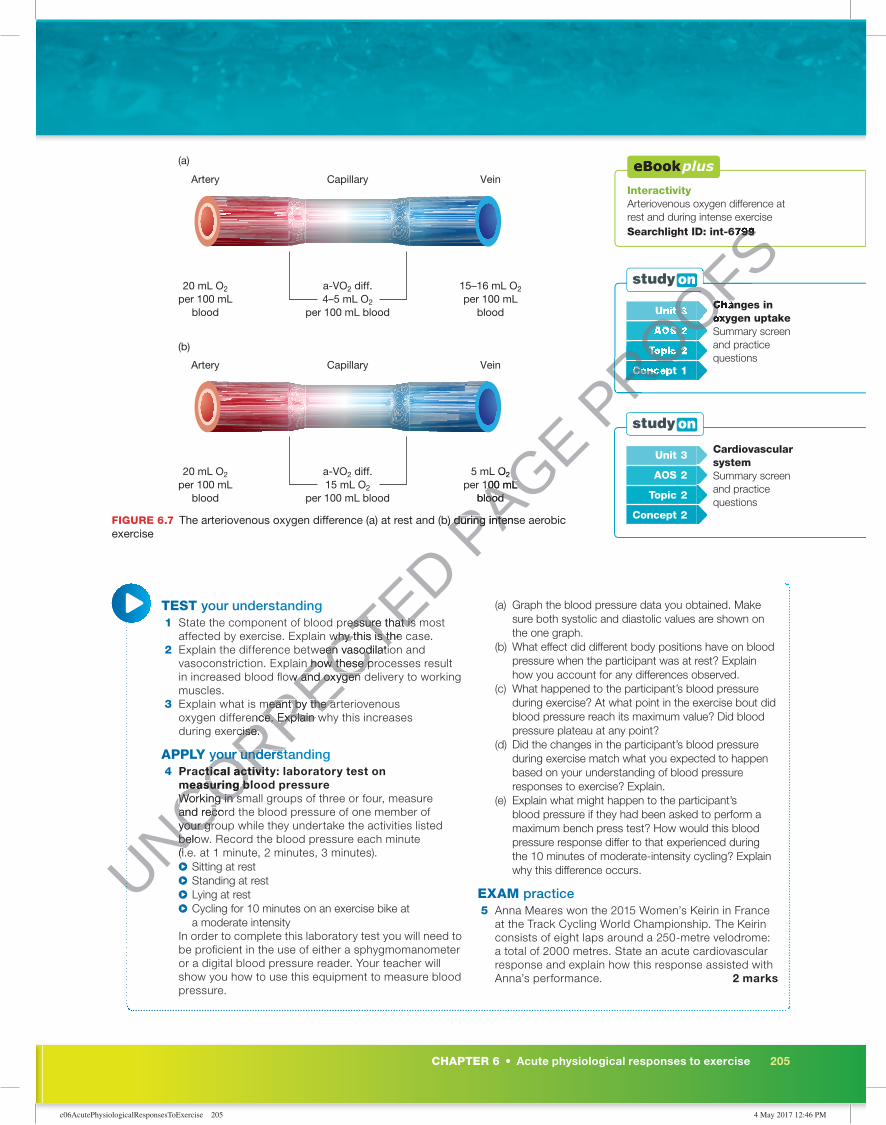
Increased arteriovenous oxygen differenceThe arteriovenous oxygen difference (a-VO2 diff.) is a measure of the difference in the concentration of oxygen in the arterial blood and the concentration of oxygen in the venous blood. This is measured in millilitres per 100 millilitres of blood. At rest, the arteries contain an oxygen concentration of approximately 20 millilitres per 100 millilitres of blood (200 millilitres of oxygen per litre of blood), while at rest the veins typically contain about 15 millilitres per 100 millilitres. Thus the arteriovenous oxygen difference at rest is about 5 millilitres per 100 millilitres of blood.
a-VO2 diff. = 20 mL − 15 mL100 mL 100 mL
a-VO2 diff. = 5 mL100 mL
The amount of oxygen extracted from the arterial blood at rest is therefore about 25 per cent. However, during exercise working muscles extract much more of the available oxygen from the blood that passes through them (as much as 75 per cent of the available oxygen is extracted). As a result, the arteriovenous oxygen difference increases and can be as high as 15–18 millilitres per 100 millilitres of blood — almost a threefold increase over the value at rest (see fi gure 6.7).
InteractivitySystemic blood � owSearchlight ID: int-6640
Systemic blood � ow is the blood � ow around the body. Blood leaves the left ventricle of the heart via the aorta, and then travels via the arteries and capillaries to the body, returning to the right atrium of the heart via the superior and inferior vena cava.
Vasoconstriction is the process where blood vessels narrow or constrict as a response to a decreased demand for oxygen delivery to muscle tissue.
InteractivityRedistribution of blood � ow during exerciseSearchlight ID: int-6798
Arteriovenous oxygen difference (a-VO2 diff.) is a measure of the difference in the concentration of oxygen in the arterial blood and the concentration of oxygen in the venous blood.
Weblinka-VO2 diff.
Acute responses of the cardiovascular system: blood pressure, redistribution of blood flow, arteriovenous oxygen difference6.2
FIGURE 6.6 Distribution of cardiac output while resting and exercising
Source: Reprinted with permission, Hoffman J 2002.
UNCORRECTED
UNCORRECTED
UNCORRECTED Muscle
UNCORRECTED Muscle84%
UNCORRECTED 84%
UNCORRECTED
Increased arteriovenous oxygen difference
UNCORRECTED
Increased arteriovenous oxygen differenceThe
UNCORRECTED
The the concentration of oxygen in the arterial blood and the concentration of oxygen
UNCORRECTED
the concentration of oxygen in the arterial blood and the concentration of oxygen
UNCORRECTED
UNCORRECTED
Redistribution of blood � ow during
UNCORRECTED
Redistribution of blood � ow during
Searchlight ID: int-6798
UNCORRECTED
Searchlight ID: int-6798
UNCORRECTED
UNCORRECTED
Arteriovenous oxygen
UNCORRECTED
Arteriovenous oxygen difference (a-VO
UNCORRECTED
difference (a-VO2
UNCORRECTED
2 diff.)
UNCORRECTED
diff.) measure of the difference in the
UNCORRECTED
measure of the difference in the concentration of oxygen in the
UNCORRECTED
concentration of oxygen in the arterial blood and the concentration UNCORRECTED
arterial blood and the concentration of oxygen in the venous blood.UNCORRECTED
of oxygen in the venous blood.
PAGE Resting
PAGE Resting
PAGE
PAGE
PAGE
PAGE
PAGE OtherPAGE Other3%PAGE
3%
PROOFSis distributed to the organs (e.g. heart, liver, kidneys, intestines, brain) of the body.
PROOFSis distributed to the organs (e.g. heart, liver, kidneys, intestines, brain) of the body. However, under exercise conditions the majority of the blood (80–90 per cent)
PROOFSHowever, under exercise conditions the majority of the blood (80–90 per cent) may be redirected to the working muscles (see fi gure 6.6). This is achieved by the
PROOFSmay be redirected to the working muscles (see fi gure 6.6). This is achieved by the capillaries and arterioles supplying the working muscles expanding in diameter (a
PROOFScapillaries and arterioles supplying the working muscles expanding in diameter (a process known as vasodilation). At the same time, blood fl ow to the organs of the
PROOFSprocess known as vasodilation). At the same time, blood fl ow to the organs of the
(narrowing) of the capillaries and arterioles
PROOFS (narrowing) of the capillaries and arterioles
PROOFS
PROOFS
PROOFS
PROOFS
PROOFSHeart
PROOFSHeart4%
PROOFS
4%
PROOFS
PROOFS
PROOFS
PROOFS
PROOFS
CHAPTER 6 • Acute physiological responses to exercise 205
c06AcutePhysiologicalResponsesToExercise 205 4 May 2017 12:46 PM
FIGURE 6.7 The arteriovenous oxygen difference (a) at rest and (b) during intense aerobic exercise
Unit 3 Changes in oxygen uptakeSummary screen and practice questions
AOS 2
Topic 2
Concept 1
Unit 3 Cardiovascular systemSummary screen and practice questions
AOS 2
Topic 2
Concept 2
Artery
(a)
(b)
Capillary Vein
20 mL O2
per 100 mLblood
a-VO2 diff.4–5 mL O2
per 100 mL blood
15–16 mL O2
per 100 mLblood
Artery Capillary Vein
20 mL O2
per 100 mLblood
a-VO2 diff.15 mL O2
per 100 mL blood
5 mL O2
per 100 mLblood
TEST your understanding 1 State the component of blood pressure that is most
affected by exercise. Explain why this is the case. 2 Explain the difference between vasodilation and
vasoconstriction. Explain how these processes result in increased blood � ow and oxygen delivery to working muscles.
3 Explain what is meant by the arteriovenous oxygen difference. Explain why this increases during exercise.
APPLY your understanding 4 Practical activity: laboratory test on
measuring blood pressure Working in small groups of three or four, measure
and record the blood pressure of one member of your group while they undertake the activities listed below. Record the blood pressure each minute (i.e. at 1 minute, 2 minutes, 3 minutes).
� Sitting at rest � Standing at rest � Lying at rest � Cycling for 10 minutes on an exercise bike at a moderate intensity
In order to complete this laboratory test you will need to be pro� cient in the use of either a sphygmomanometer or a digital blood pressure reader. Your teacher will show you how to use this equipment to measure blood pressure.
(a) Graph the blood pressure data you obtained. Make sure both systolic and diastolic values are shown on the one graph.
(b) What effect did different body positions have on blood pressure when the participant was at rest? Explain how you account for any differences observed.
(c) What happened to the participant’s blood pressure during exercise? At what point in the exercise bout did blood pressure reach its maximum value? Did blood pressure plateau at any point?
(d) Did the changes in the participant’s blood pressure during exercise match what you expected to happen based on your understanding of blood pressure responses to exercise? Explain.
(e) Explain what might happen to the participant’s blood pressure if they had been asked to perform a maximum bench press test? How would this blood pressure response differ to that experienced during the 10 minutes of moderate-intensity cycling? Explain why this difference occurs.
EXAM practice 5 Anna Meares won the 2015 Women’s Keirin in France
at the Track Cycling World Championship. The Keirin consists of eight laps around a 250-metre velodrome: a total of 2000 metres. State an acute cardiovascular response and explain how this response assisted with Anna’s performance. 2 marks
InteractivityArteriovenous oxygen difference at rest and during intense exerciseSearchlight ID: int-6799
UNCORRECTED
UNCORRECTED
UNCORRECTED
UNCORRECTED State the component of blood pressure that is most
UNCORRECTED State the component of blood pressure that is most affected by exercise. Explain why this is the case.
UNCORRECTED affected by exercise. Explain why this is the case.Explain the difference between vasodilation and
UNCORRECTED Explain the difference between vasodilation and vasoconstriction. Explain how these processes result
UNCORRECTED vasoconstriction. Explain how these processes result in increased blood � ow and oxygen delivery to working
UNCORRECTED
in increased blood � ow and oxygen delivery to working
Explain what is meant by the arteriovenous
UNCORRECTED
Explain what is meant by the arteriovenous oxygen difference. Explain why this increases
UNCORRECTED
oxygen difference. Explain why this increases during exercise.
UNCORRECTED
during exercise.
your understanding
UNCORRECTED
your understandingPractical activity: laboratory test on
UNCORRECTED
Practical activity: laboratory test on measuring blood pressure
UNCORRECTED
measuring blood pressure
UNCORRECTED
Working in small groups of three or four, measure
UNCORRECTED
Working in small groups of three or four, measure and record the blood pressure of one member of
UNCORRECTED
and record the blood pressure of one member of your group while they undertake the activities listed
UNCORRECTED
your group while they undertake the activities listed below. Record the blood pressure each minute
UNCORRECTED
below. Record the blood pressure each minute (i.e. at 1 minute, 2 minutes, 3 minutes).
UNCORRECTED
(i.e. at 1 minute, 2 minutes, 3 minutes).
PAGE The arteriovenous oxygen difference (a) at rest and (b) during intense aerobic PAGE The arteriovenous oxygen difference (a) at rest and (b) during intense aerobic
5 mL O
PAGE 5 mL O2
PAGE 2
per 100 mL
PAGE per 100 mL
blood
PAGE blood
PROOFS
PROOFS
PROOFS
PROOFS
PROOFS
PROOFS
PROOFS
PROOFS
PROOFS
PROOFS
PROOFS
PROOFS
PROOFS
PROOFS
PROOFS
PROOFS
PROOFS
PROOFS
PROOFS
PROOFS
PROOFSUnit
PROOFSUnit 3
PROOFS3
PROOFSChanges in
PROOFSChanges in oxygen uptake
PROOFSoxygen uptake
AOS
PROOFSAOS 2
PROOFS2
PROOFSTopic
PROOFSTopic 2
PROOFS2
Concept
PROOFSConcept
PROOFS
PROOFSSearchlight ID: int-6799
PROOFSSearchlight ID: int-6799
206 UNIT 3 • Movement skills and energy for physical activity
c06AcutePhysiologicalResponsesToExercise 206 4 May 2017 12:46 PM
Acute responses of the respiratory system to exercise are designed to facilitate an increase in the availability of oxygen and the removal of carbon dioxide. These responses include:
� increased respiratory frequency (breathing rate) � increased tidal volume � increased ventilation � increased pulmonary diffusion � increased oxygen uptake.
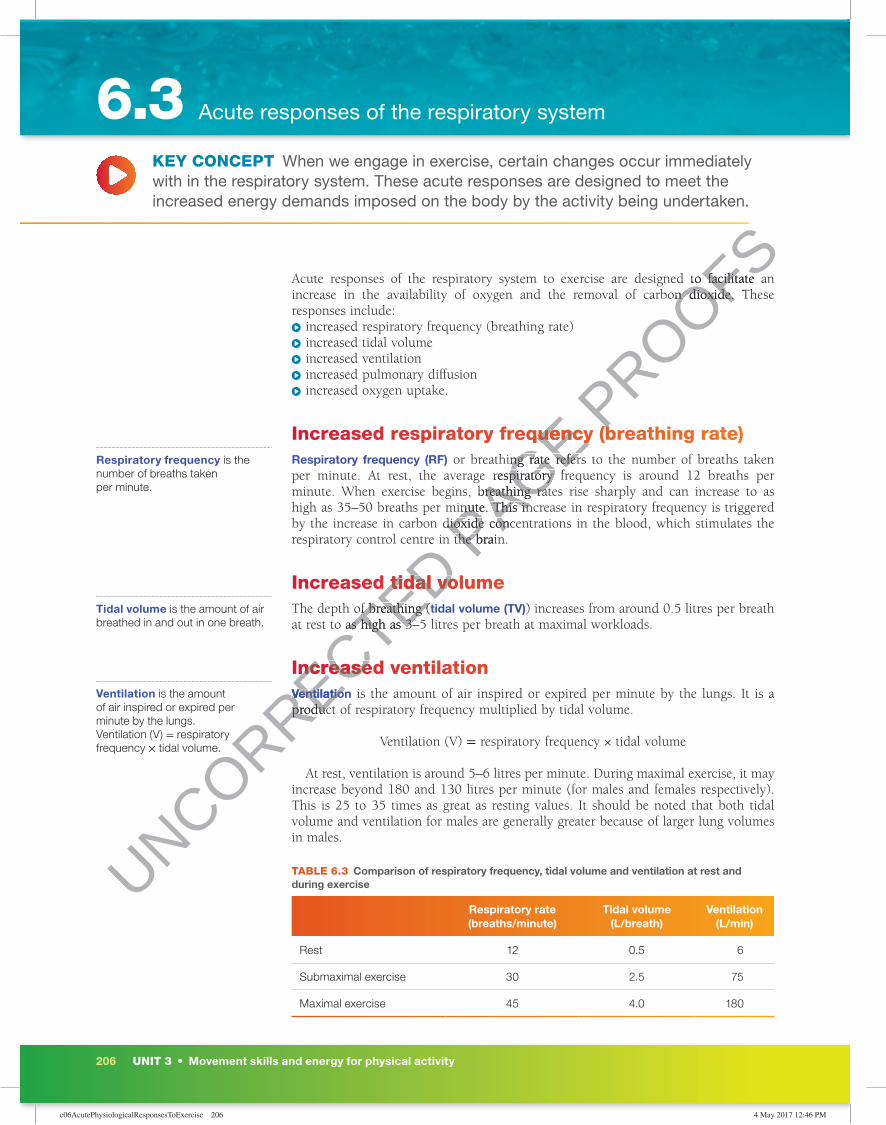
Increased respiratory frequency (breathing rate)Respiratory frequency (RF) or breathing rate refers to the number of breaths taken per minute. At rest, the average respiratory frequency is around 12 breaths per minute. When exercise begins, breathing rates rise sharply and can increase to as high as 35–50 breaths per minute. This increase in respiratory frequency is triggered by the increase in carbon dioxide concentrations in the blood, which stimulates the respiratory control centre in the brain.
Increased tidal volumeThe depth of breathing (tidal volume (TV)) increases from around 0.5 litres per breath at rest to as high as 3–5 litres per breath at maximal workloads.
Increased ventilationVentilation is the amount of air inspired or expired per minute by the lungs. It is a product of respiratory frequency multiplied by tidal volume.
Ventilation (V) = respiratory frequency × tidal volume
At rest, ventilation is around 5–6 litres per minute. During maximal exercise, it may increase beyond 180 and 130 litres per minute (for males and females respectively). This is 25 to 35 times as great as resting values. It should be noted that both tidal volume and ventilation for males are generally greater because of larger lung volumes in males.
TABLE 6.3 Comparison of respiratory frequency, tidal volume and ventilation at rest and during exercise
Respiratory rate (breaths/minute)
Tidal volume (L/breath)
Ventilation (L/min)
Rest 12 0.5 6
Submaximal exercise 30 2.5 75
Maximal exercise 45 4.0 180
KEY CONCEPT When we engage in exercise, certain changes occur immediately with in the respiratory system. These acute responses are designed to meet the increased energy demands imposed on the body by the activity being undertaken.
Respiratory frequency is the number of breaths taken per minute.
Tidal volume is the amount of air breathed in and out in one breath.
Ventilation is the amount of air inspired or expired per minute by the lungs. Ventilation (V) = respiratory frequency × tidal volume.
6.3 Acute responses of the respiratory system
UNCORRECTED respiratory control centre in the brain.
UNCORRECTED respiratory control centre in the brain.
Increased tidal volume
UNCORRECTED Increased tidal volumeThe depth of breathing (
UNCORRECTED The depth of breathing (tidal volume (TV)
UNCORRECTED tidal volume (TV)
at rest to as high as 3–5 litres per breath at maximal workloads.
UNCORRECTED at rest to as high as 3–5 litres per breath at maximal workloads.
Increased ventilation
UNCORRECTED
Increased ventilationVentilation
UNCORRECTED
Ventilationproduct of respiratory frequency multiplied by tidal volume.
UNCORRECTED
product of respiratory frequency multiplied by tidal volume.
PAGE Increased respiratory frequency (breathing rate)
PAGE Increased respiratory frequency (breathing rate) or breathing rate refers to the number of breaths taken
PAGE or breathing rate refers to the number of breaths taken
per minute. At rest, the average respiratory frequency is around 12 breaths per
PAGE per minute. At rest, the average respiratory frequency is around 12 breaths per minute. When exercise begins, breathing rates rise sharply and can increase to as
PAGE minute. When exercise begins, breathing rates rise sharply and can increase to as high as 35–50 breaths per minute. This increase in respiratory frequency is triggered
PAGE high as 35–50 breaths per minute. This increase in respiratory frequency is triggered by the increase in carbon dioxide concentrations in the blood, which stimulates the PAGE by the increase in carbon dioxide concentrations in the blood, which stimulates the respiratory control centre in the brain.PAGE
respiratory control centre in the brain.
PROOFSAcute responses of the respiratory system to exercise are designed to facilitate an
PROOFSAcute responses of the respiratory system to exercise are designed to facilitate an increase in the availability of oxygen and the removal of carbon dioxide. These
PROOFSincrease in the availability of oxygen and the removal of carbon dioxide. These
Increased respiratory frequency (breathing rate)PROOFS
Increased respiratory frequency (breathing rate)PROOFS
CHAPTER 6 • Acute physiological responses to exercise 207
c06AcutePhysiologicalResponsesToExercise 207 4 May 2017 12:46 PM
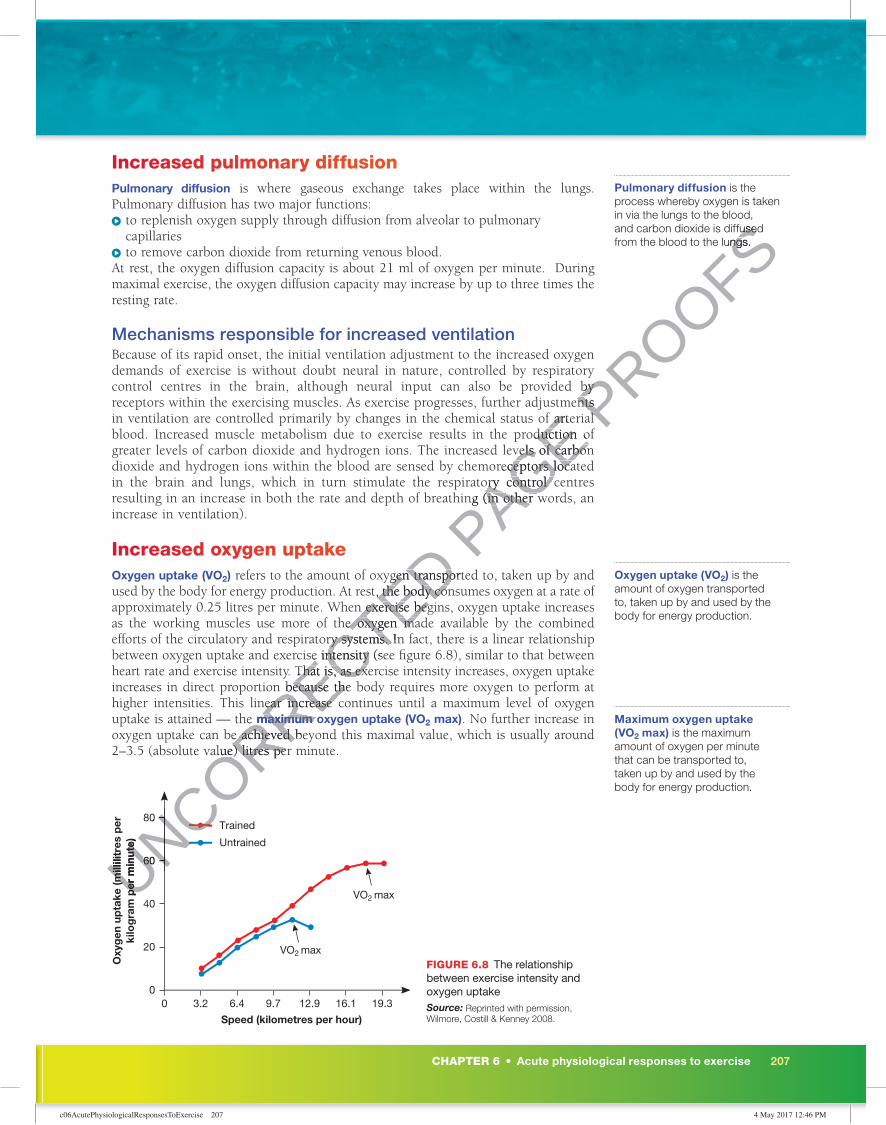
Increased pulmonary diffusionPulmonary diffusion is where gaseous exchange takes place within the lungs. Pulmonary diffusion has two major functions:
� to replenish oxygen supply through diffusion from alveolar to pulmonary capillaries
� to remove carbon dioxide from returning venous blood.At rest, the oxygen diffusion capacity is about 21 ml of oxygen per minute. During maximal exercise, the oxygen diffusion capacity may increase by up to three times the resting rate.
Mechanisms responsible for increased ventilationBecause of its rapid onset, the initial ventilation adjustment to the increased oxygen demands of exercise is without doubt neural in nature, controlled by respiratory control centres in the brain, although neural input can also be provided by receptors within the exercising muscles. As exercise progresses, further adjustments in ventilation are controlled primarily by changes in the chemical status of arterial blood. Increased muscle metabolism due to exercise results in the production of greater levels of carbon dioxide and hydrogen ions. The increased levels of carbon dioxide and hydrogen ions within the blood are sensed by chemoreceptors located in the brain and lungs, which in turn stimulate the respiratory control centres resulting in an increase in both the rate and depth of breathing (in other words, an increase in ventilation).
Increased oxygen uptakeOxygen uptake (VO2 ) refers to the amount of oxygen transported to, taken up by and used by the body for energy production. At rest, the body consumes oxygen at a rate of approximately 0.25 litres per minute. When exercise begins, oxygen uptake increases as the working muscles use more of the oxygen made available by the combined efforts of the circulatory and respiratory systems. In fact, there is a linear relationship between oxygen uptake and exercise intensity (see fi gure 6.8), similar to that between heart rate and exercise intensity. That is, as exercise intensity increases, oxygen uptake increases in direct proportion because the body requires more oxygen to perform at higher intensities. This linear increase continues until a maximum level of oxygen uptake is attained — the maximum oxygen uptake (VO2 max). No further increase in oxygen uptake can be achieved beyond this maximal value, which is usually around 2–3.5 (absolute value) litres per minute.
0
20
40
60
Speed (kilometres per hour)
VO2 max
9.76.43.20 12.9 16.1 19.3
80
Oxy
gen
up
take
(mill
ilitr
es p
erki
log
ram
per
min
ute)
VO2 max
Trained
Untrained
FIGURE 6.8 The relationship between exercise intensity and oxygen uptakeSource: Reprinted with permission, Wilmore, Costill & Kenney 2008.
Pulmonary diffusion is the process whereby oxygen is taken in via the lungs to the blood, and carbon dioxide is diffused from the blood to the lungs.
Oxygen uptake (VO2) is the amount of oxygen transported to, taken up by and used by the body for energy production.
Maximum oxygen uptake (VO2 max) is the maximum amount of oxygen per minute that can be transported to, taken up by and used by the body for energy production.
UNCORRECTED refers to the amount of oxygen transported to, taken up by and
UNCORRECTED refers to the amount of oxygen transported to, taken up by and used by the body for energy production. At rest, the body consumes oxygen at a rate of
UNCORRECTED used by the body for energy production. At rest, the body consumes oxygen at a rate of approximately 0.25 litres per minute. When exercise begins, oxygen uptake increases
UNCORRECTED approximately 0.25 litres per minute. When exercise begins, oxygen uptake increases as the working muscles use more of the oxygen made available by the combined
UNCORRECTED as the working muscles use more of the oxygen made available by the combined efforts of the circulatory and respiratory systems. In fact, there is a linear relationship
UNCORRECTED efforts of the circulatory and respiratory systems. In fact, there is a linear relationship between oxygen uptake and exercise intensity (see fi gure 6.8), similar to that between
UNCORRECTED between oxygen uptake and exercise intensity (see fi gure 6.8), similar to that between heart rate and exercise intensity. That is, as exercise intensity increases, oxygen uptake
UNCORRECTED
heart rate and exercise intensity. That is, as exercise intensity increases, oxygen uptake increases in direct proportion because the body requires more oxygen to perform at
UNCORRECTED
increases in direct proportion because the body requires more oxygen to perform at higher intensities. This linear increase continues until a maximum level of oxygen
UNCORRECTED
higher intensities. This linear increase continues until a maximum level of oxygen uptake is attained — the
UNCORRECTED
uptake is attained — the maximum oxygen uptake (VO
UNCORRECTED
maximum oxygen uptake (VOoxygen uptake can be achieved beyond this maximal value, which is usually around
UNCORRECTED
oxygen uptake can be achieved beyond this maximal value, which is usually around 2–3.5 (absolute value) litres per minute.
UNCORRECTED
2–3.5 (absolute value) litres per minute.
UNCORRECTED
60UNCORRECTED
60
80
UNCORRECTED
80
UNCORRECTED
UNCORRECTED
UNCORRECTED
UNCORRECTED
Oxy
gen
up
take
(mill
ilitr
es p
er
UNCORRECTED
Oxy
gen
up
take
(mill
ilitr
es p
erki
log
ram
per
min
ute)
UNCORRECTED
kilo
gra
m p
er m
inut
e)
UNCORRECTED
UNCORRECTED
UNCORRECTED PAGE in ventilation are controlled primarily by changes in the chemical status of arterial
PAGE in ventilation are controlled primarily by changes in the chemical status of arterial blood. Increased muscle metabolism due to exercise results in the production of
PAGE blood. Increased muscle metabolism due to exercise results in the production of greater levels of carbon dioxide and hydrogen ions. The increased levels of carbon
PAGE greater levels of carbon dioxide and hydrogen ions. The increased levels of carbon dioxide and hydrogen ions within the blood are sensed by chemoreceptors located
PAGE dioxide and hydrogen ions within the blood are sensed by chemoreceptors located in the brain and lungs, which in turn stimulate the respiratory control centres
PAGE in the brain and lungs, which in turn stimulate the respiratory control centres resulting in an increase in both the rate and depth of breathing (in other words, an
PAGE resulting in an increase in both the rate and depth of breathing (in other words, an
PROOFS
control centres in the brain, although neural input can also be provided by
PROOFS
control centres in the brain, although neural input can also be provided by receptors within the exercising muscles. As exercise progresses, further adjustments PROOFS
receptors within the exercising muscles. As exercise progresses, further adjustments in ventilation are controlled primarily by changes in the chemical status of arterial PROOFS
in ventilation are controlled primarily by changes in the chemical status of arterial
and carbon dioxide is diffused
PROOFSand carbon dioxide is diffused from the blood to the lungs.
PROOFSfrom the blood to the lungs.

208 UNIT 3 • Movement skills and energy for physical activity
c06AcutePhysiologicalResponsesToExercise 208 4 May 2017 12:46 PM
TEST your understanding 1 De� ne the terms respiratory frequency, tidal volume,
ventilation, pulmonary diffusion, oxygen uptake, maximum oxygen uptake.
2 An individual sets out on a 3-kilometre run. Indicate the likely respiratory system responses to this exercise bout.
3 Using your prior knowledge of the respiratory system, explain the mechanics of inspiration (inhalation) and expiration (exhalation), and how gases diffuse into and out of the lungs and blood vessels.
4 Calculate the ventilation of an individual who has a respiratory frequency of 15 breaths per minute and a tidal volume of 0.5 litres per breath.
APPLY your understanding 5 Practical activity: laboratory test on acute
respiratory responses to exercise Measure your resting respiratory frequency by counting
the number of breaths you take in 1 minute. Then perform the following activities, measuring your respiratory frequency for 10 seconds immediately after you complete each activity. Allow your breathing rate to return to your resting value before undertaking the next activity.
� Standing still for 2 minutes � Lying down for 2 minutes
� Walking for 2 minutes � Jogging for 2 minutes � Performing stepups on a bench for 2 minutes � Resting for 1 minute after the bout of stepups � Resting for 2 minutes after the bout of stepups � Performing bent-knee situps for 2 minutes
(a) Record and graph your results. To determine your respiratory frequency immediately after each activity, multiply the 10-second breathing-rate measurement by 6 to calculate your respiratory frequency per minute.
(b) Which activity resulted in the highest respiratory frequency? How do you account for this?
(c) Did standing still or lying down result in the highest respiratory frequency? Explain.
(d) Explain why respiratory frequency increases so much during exercise.
(e) Explain why your respiratory frequency remains elevated above normal resting values for a period after the cessation of strenuous exercise.
EXAM practice 6 List two acute respiratory responses to exercise and
explain how they assist with the performance of the athlete. 3 marks
Acute responses of the respiratory system6.3
UNCORRECTED
UNCORRECTED PAGE
PAGE (e) Explain why your respiratory frequency remains
PAGE (e) Explain why your respiratory frequency remains elevated above normal resting values for a period after
PAGE elevated above normal resting values for a period after the cessation of strenuous exercise.
PAGE the cessation of strenuous exercise.
practice
PAGE practice
List two acute respiratory responses to exercise and
PAGE List two acute respiratory responses to exercise and explain how they assist with the performance of the
PAGE explain how they assist with the performance of the athlete.
PAGE athlete.
PROOFS
PROOFS
PROOFS(a) Record and graph your results. To determine your
PROOFS(a) Record and graph your results. To determine your respiratory frequency immediately after each activity,
PROOFSrespiratory frequency immediately after each activity, multiply the 10-second breathing-rate measurement
PROOFSmultiply the 10-second breathing-rate measurement by 6 to calculate your respiratory frequency per
PROOFSby 6 to calculate your respiratory frequency per
(b) Which activity resulted in the highest respiratory
PROOFS(b) Which activity resulted in the highest respiratory
frequency? How do you account for this?
PROOFSfrequency? How do you account for this?
(c) Did standing still or lying down result in the highest
PROOFS(c) Did standing still or lying down result in the highest
respiratory frequency? Explain.
PROOFSrespiratory frequency? Explain.
(d) Explain why respiratory frequency increases so much
PROOFS
(d) Explain why respiratory frequency increases so much
(e) Explain why your respiratory frequency remains PROOFS
(e) Explain why your respiratory frequency remains elevated above normal resting values for a period after PROOFS
elevated above normal resting values for a period after

CHAPTER 6 • Acute physiological responses to exercise 209
c06AcutePhysiologicalResponsesToExercise 209 4 May 2017 12:46 PM
Maximum oxygen uptake or VO2 max represents the maximum amount of oxygen able to be taken up by, transported to and used by the body for energy production. This value is commonly used to determine an athlete’s capacity to perform in aerobic (endurance) activities.
Around 3.5 litres of oxygen per minute is the average maximum oxygen uptake for males. This fi gure is lower for females, who have an average oxygen uptake of around 2.3 litres per minute.
Factors affecting maximum oxygen uptakeMaximum oxygen uptake is affected by a number of factors including body size, gender, genetics, age and training status (aerobic or cardiorespiratory fi tness levels).
Body sizeOxygen uptake is related to body size — a larger, heavier person requires more oxygen than a smaller person. It is for this reason that VO2 max is usually expressed relative to body size in mL/kg/min — so that individuals can be compared, particularly in relation to their aerobic fi tness levels, irrespective of differences in body size.
GenderFemales tend to have lower oxygen uptake values compared with males of similar age and athleticism. Maximum oxygen uptake values for untrained female individuals can be as great as 20–25 per cent lower than for untrained male individuals. However, when comparing trained athletes, the gap tends to close to about 10 per cent.
Several factors contribute to females having a lower maximum oxygen uptake than males, including:
� Females typically have a higher percentage of body fat and lower percentage of muscle mass. Body fat does not consume oxygen, unlike muscle tissue.
� Females have lower blood volumes and lower levels of red blood cells and haemoglobin compared with males. This reduces the oxygen-carrying capacity of females as compared with males, as oxygen binds to haemoglobin when being transported around the body.
� Females typically have a smaller lung size and volume and a smaller heart size and volume (due to their on-average smaller body size) than males, thereby reducing their oxygen intake and transport capacity.
FIGURE 6.9 Oxygen uptake is related to body size.
FIGURE 6.10 Females generally have a lower maximum oxygen uptake than males.
Maximum oxygen uptake6.4KEY CONCEPT Maximum oxygen uptake refers to the maximum capacity for oxygen consumption by the body during maximum exertion.
UNCORRECTED Females tend to have lower oxygen uptake
UNCORRECTED Females tend to have lower oxygen uptake values compared with males of similar age and
UNCORRECTED values compared with males of similar age and athleticism. Maximum oxygen uptake values for
UNCORRECTED
athleticism. Maximum oxygen uptake values for untrained female individuals can be as great as
UNCORRECTED
untrained female individuals can be as great as 20–25 per cent lower than for untrained male
UNCORRECTED
20–25 per cent lower than for untrained male individuals. However, when comparing trained
UNCORRECTED
individuals. However, when comparing trained athletes, the gap tends to close to about 10 per cent.
UNCORRECTED
athletes, the gap tends to close to about 10 per cent.Several factors contribute to females having
UNCORRECTED
Several factors contribute to females having a lower maximum oxygen uptake than males,
UNCORRECTED
a lower maximum oxygen uptake than males,
Females typically have a higher percentage
UNCORRECTED
Females typically have a higher percentage of body fat and lower percentage of muscle
UNCORRECTED
of body fat and lower percentage of muscle mass. Body fat does not consume oxygen,
UNCORRECTED
mass. Body fat does not consume oxygen, unlike muscle tissue.
UNCORRECTED
unlike muscle tissue.� UNCORRECTED
� Females have lower blood volumes and lower UNCORRECTED
Females have lower blood volumes and lower levels of red blood cells and haemoglobin UNCORRECTED
levels of red blood cells and haemoglobin compared with males. This reduces the UNCORRECTED
compared with males. This reduces the UNCORRECTED PAGE Maximum oxygen uptake is affected by a number of factors including body size,
PAGE Maximum oxygen uptake is affected by a number of factors including body size, gender, genetics, age and training status (aerobic or cardiorespiratory fi tness levels).
PAGE gender, genetics, age and training status (aerobic or cardiorespiratory fi tness levels).
PAGE PROOFS

210 UNIT 3 • Movement skills and energy for physical activity
c06AcutePhysiologicalResponsesToExercise 210 4 May 2017 12:46 PM
GeneticsThere is signifi cant evidence to suggest that aerobic capacity is largely genetically determined, with some studies suggesting that heredity may account for up to 25–50 per cent of the variance seen between individuals. Training, however, can result in substantial improvement in maximum oxygen uptake values.
AgeMaximum oxygen uptake tends to decline with increasing age. It peaks during late adolescence and early adulthood and then declines from that point. The average rate of decline is generally accepted to be about 1 per cent per year or 10 per cent per decade after the age of 25. However, training and/or maintaining a physically active lifestyle can both increase maximum values as well as decrease the rate of decline that occurs with increasing age. Usually, the age-related decline in maximum oxygen uptake can be accounted for by a reduction in maximum heart rate, maximal stoke volume and maximal a-VO2 difference.
FIGURE 6.11 Maximum oxygen uptake declines with age.
Training status (aerobic or cardiorespiratory fitness level)Aerobic training can substantially increase maximum oxygen uptake values for both males and females. Average maximum oxygen uptake relative values for untrained male and female adults aged 20–29 are 43–52 mL/kg/min and 33–42 mL/kg/min respectively. Trained endurance athletes on the other hand may have values as high as 60–85 mL/kg/min for male athletes and 50–70 mL/kg/min for female athletes. Table 6.4 presents a range of maximum oxygen uptake values for various population groups.
The extent to which maximum oxygen uptake can improve also appears to be dependent on the initial fi tness level (starting point) of the individual. The greater the level of an individual’s fi tness to begin with, the less potential there is for further increases. There also seems to be a genetic upper limit beyond which further increases in either intensity or volume of training have no effect on increasing maximum oxygen uptake, although other benefi ts may be gained from such training; for example, an improvement in the athlete’s capacity to perform at a higher percentage of their maximum oxygen uptake for longer periods of time.
Unit 3 Respiratory systemSummary screen and practice questions
AOS 2
Topic 2
Concept 3
Maximum oxygen uptake6.4
UNCORRECTED
UNCORRECTED
FIGURE 6.11
UNCORRECTED
FIGURE 6.11
UNCORRECTED
UNCORRECTED
UNCORRECTED
UNCORRECTED
UNCORRECTED
UNCORRECTED
UNCORRECTED
UNCORRECTED
UNCORRECTED
UNCORRECTED
UNCORRECTED
UNCORRECTED
UNCORRECTED
UNCORRECTED
UNCORRECTED
UNCORRECTED
UNCORRECTED
UNCORRECTED
UNCORRECTED
Unit
UNCORRECTED
Unit 3
UNCORRECTED
3
UNCORRECTED
Respiratory
UNCORRECTED
Respiratory system
UNCORRECTED
systemSummary screen
UNCORRECTED
Summary screen AOS
UNCORRECTED
AOS 2
UNCORRECTED
2
UNCORRECTED
Topic UNCORRECTED
Topic 2UNCORRECTED
2UNCORRECTED
Concept UNCORRECTED
Concept
PAGE
PAGE PROOFSMaximum oxygen uptake tends to decline with increasing age. It peaks during late
PROOFSMaximum oxygen uptake tends to decline with increasing age. It peaks during late adolescence and early adulthood and then declines from that point. The average rate
PROOFSadolescence and early adulthood and then declines from that point. The average rate of decline is generally accepted to be about 1 per cent per year or 10 per cent per
PROOFSof decline is generally accepted to be about 1 per cent per year or 10 per cent per decade after the age of 25. However, training and/or maintaining a physically active
PROOFSdecade after the age of 25. However, training and/or maintaining a physically active lifestyle can both increase maximum values as well as decrease the rate of decline
PROOFSlifestyle can both increase maximum values as well as decrease the rate of decline that occurs with increasing age. Usually, the age-related decline in maximum oxygen
PROOFSthat occurs with increasing age. Usually, the age-related decline in maximum oxygen uptake can be accounted for by a reduction in maximum heart rate, maximal stoke
PROOFS
uptake can be accounted for by a reduction in maximum heart rate, maximal stoke
PROOFS

CHAPTER 6 • Acute physiological responses to exercise 211
c06AcutePhysiologicalResponsesToExercise 211 4 May 2017 12:46 PM
The highest ever recorded and documented maximum oxygen uptake values are 94 mL/kg/min for a male and 77 mL/kg/min for a female. Both were elite-level cross-country skiers.
TABLE 6.4 Maximum oxygen uptake values (mL/kg/min) for various population groups
Group Age Males Females
Non-athletes 10–1920–2930–3940–4950–5960–6970–79
47–5643–5239–4836–4434–4131–3828–35
38–4633–4230–3826–3524–3322–3020–27
Baseball/softball 18–32 48–56 52–57
Basketball 18–30 40–60 43–60
Bicycling 18–26 62–74 47–57
Canoeing 22–28 55–67 48–52
Gymnastics 18–22 52–58 36–50
Racquetball 20–35 55–62 50–60
Rowing 20–35 60–72 58–65
Skiing, alpine 18–30 57–68 50–55
Skiing, Nordic 20–28 65–94 60–75
Soccer 22–28 54–64 50–60
Speed skating 18–24 56–73 44–55
Swimming 10–25 50–70 40–60
Track and � eld, discus 22–30 42–55 –
Track and � eld, running 18–3940–75
60–8540–60
50–7535–60
Track and � eld, shot put 22–30 40–46 –
Volleyball 18–22 – 40–56
Weight-lifting 20–30 38–52 –
FIGURE 6.12 Oxygen uptake levels can be increased in an individual through aerobic training.
Source: Reprinted with permission, Wilmore, Costill & Kenney 2008.
UNCORRECTED
UNCORRECTED
UNCORRECTED
UNCORRECTED
UNCORRECTED
UNCORRECTED
UNCORRECTED
UNCORRECTED
UNCORRECTED
UNCORRECTED
UNCORRECTED
UNCORRECTED
UNCORRECTED
UNCORRECTED
UNCORRECTED
UNCORRECTED
UNCORRECTED
UNCORRECTED Males
UNCORRECTED Males
50–59
UNCORRECTED 50–5960–69
UNCORRECTED 60–6970–79
UNCORRECTED 70–79
47–56
UNCORRECTED 47–5643–52
UNCORRECTED 43–5239–48
UNCORRECTED 39–4836–44
UNCORRECTED 36–44
18–32
UNCORRECTED 18–32
18–30
UNCORRECTED
18–30
18–26
UNCORRECTED
18–26
Skiing, alpine
UNCORRECTED
Skiing, alpine
Skiing, Nordic
UNCORRECTED
Skiing, Nordic
Soccer
UNCORRECTED
Soccer
Speed skatingUNCORRECTED
Speed skatingUNCORRECTED
SwimmingUNCORRECTED
Swimming
PAGE
PAGE The highest ever recorded and documented maximum oxygen uptake values are
PAGE The highest ever recorded and documented maximum oxygen uptake values are
94 mL/kg/min for a male and 77 mL/kg/min for a female. Both were elite-level cross-
PAGE 94 mL/kg/min for a male and 77 mL/kg/min for a female. Both were elite-level cross-
PAGE
PAGE Maximum oxygen uptake values (mL/kg/min) for various population groups
PAGE Maximum oxygen uptake values (mL/kg/min) for various population groups
Males PAGE
Males
PROOFS
PROOFS
FIGURE 6.12 PROOFS
FIGURE 6.12 levels can be increased in an PROOFS
levels can be increased in an individual through aerobic training.PROOFS
individual through aerobic training.

212 UNIT 3 • Movement skills and energy for physical activity
c06AcutePhysiologicalResponsesToExercise 212 4 May 2017 12:46 PM
TEST your understanding 1 De� ne the term maximum oxygen uptake. Explain why it
is best expressed relative to body weight. 2 List and brie� y summarise the factors that can affect
maximum oxygen uptake. 3 Discuss the relationship between oxygen uptake
(consumption) and energy production. 4 Explain why Nordic (cross-country) skiers would
have higher maximum oxygen uptake values than weight-lifters of a similar age (see table 6.4).
APPLY your understanding 5 Practical activity: estimating maximum
oxygen uptake As a class, undertake a test designed to provide an
estimation of VO2 max. After completing the test, obtain the results for all
members of the class and calculate the average estimated VO2 max for males and females. Graph these results alongside your own personal results and then answer the following questions.(a) How did your personal result compare with the group
average result? (If you are a male student compare your result with the male class average; if you are a female student compare your result with the female class average.)
(b) How would you account for your performance relative to the class average? Think about your activity levels and the sports and activities you participate in.
(c) Which group obtained the higher group average — males or females? How do you account for this?
(d) Explain the in� uence of genetics and training status on maximum oxygen uptake.
6 Practical activity: laboratory testing of VO2 max As a class, visit an organisation that conducts
laboratory testing of VO2 max. A number of universities and other organisations offer such facilities to school groups (your teacher will have details).
After attending and witnessing a laboratory VO2 max test, complete the following questions.(a) Outline the basic protocols involved in a laboratory test
of VO2 max.(b) Why are laboratory tests more accurate than � eld tests
designed to measure VO2 max?(c) What are the disadvantages of laboratory testing of
VO2 max as compared with � eld tests?
EXAM practice 7 Australia’s Michael Shelley, 31 years of age, powered
to victory in the men’s marathon at the Glasgow 2014 Commonwealth Games in a time of 2 hours, 11 minutes and 15 seconds.(a) Estimate the VO2 max result of an international level
male marathon runner such as Michael Shelley. 1 mark(b) Estimate the VO2 max result of a 31-year-old female
competing in the local marathon. Explain your reasons. 3 marks
eLessonVO2 testSearchlight ID: int-0820
Maximum oxygen uptake6.4
UNCORRECTED
UNCORRECTED (b) How would you account for your performance relative
UNCORRECTED (b) How would you account for your performance relative to the class average? Think about your activity levels
UNCORRECTED to the class average? Think about your activity levels and the sports and activities you participate in.
UNCORRECTED and the sports and activities you participate in.(c) Which group obtained the higher group average —
UNCORRECTED (c) Which group obtained the higher group average —
males or females? How do you account for this?
UNCORRECTED males or females? How do you account for this?
(d) Explain the in� uence of genetics and training status on
UNCORRECTED (d) Explain the in� uence of genetics and training status on
UNCORRECTED PAGE 2014 Commonwealth Games in a time of 2 hours,
PAGE 2014 Commonwealth Games in a time of 2 hours, 11 minutes and 15 seconds.
PAGE 11 minutes and 15 seconds.(a) Estimate the VO
PAGE (a) Estimate the VO2
PAGE 2 max result of an international level
PAGE max result of an international level male marathon runner such as Michael Shelley.
PAGE male marathon runner such as Michael Shelley.
(b) Estimate the VO
PAGE (b) Estimate the VO
competing in the local marathon. Explain your
PAGE competing in the local marathon. Explain your reasons.
PAGE reasons.
PAGE
PAGE
eLessonPAGE
eLessonPAGE
PAGE
PAGE
PAGE PROOFS
PROOFS
PROOFSand other organisations offer such facilities to school
PROOFSand other organisations offer such facilities to school
After attending and witnessing a laboratory VO
PROOFS After attending and witnessing a laboratory VO2
PROOFS2 max
PROOFS max
(a) Outline the basic protocols involved in a laboratory test
PROOFS(a) Outline the basic protocols involved in a laboratory test
(b) Why are laboratory tests more accurate than � eld tests
PROOFS(b) Why are laboratory tests more accurate than � eld tests
(c) What are the disadvantages of laboratory testing of
PROOFS(c) What are the disadvantages of laboratory testing of
max as compared with � eld tests?
PROOFS max as compared with � eld tests?
Australia’s Michael Shelley, 31 years of age, powered
PROOFS
Australia’s Michael Shelley, 31 years of age, powered to victory in the men’s marathon at the Glasgow PROOFS
to victory in the men’s marathon at the Glasgow 2014 Commonwealth Games in a time of 2 hours, PROOFS
2014 Commonwealth Games in a time of 2 hours, 11 minutes and 15 seconds.PROOFS
11 minutes and 15 seconds.
CHAPTER 6 • Acute physiological responses to exercise 213
c06AcutePhysiologicalResponsesToExercise 213 4 May 2017 12:46 PM
Oxygen uptake at restWhen at rest, the body’s need for ATP is relatively small, requiring minimal oxygen consumption. At rest the average person consumes about 0.3L of oxygen per minute and will usually utilise a mixture of carbohydrates and fats for energy. The body stores minimal amounts of oxygen. This means that the amount of oxygen entering your bloodstream is directly proportional to the amount used by your tissues for oxidative metabolism. As exercise intensity increases, the consumption of oxygen increases to allow greater levels of ATP to be produced at the muscle level.
Oxygen deficitAs we have discovered in the previous sections, when exercise begins, oxygen uptake increases as the body attempts to meet the increased oxygen demand of the working muscles that results from their need to produce more energy for ATP resynthesis. The respiratory and cardiovascular systems play the major role when increasing oxygen uptake and transport to the working muscles.
However, during the transition from rest to exercise, particularly high-intensity exercise, and at any time during exercise performance when exercise intensity increases, there is a period of time where there is a discrepancy between the amount of oxygen required for a given exercise intensity and the amount actually supplied and used. This discrepancy is referred to as the oxygen de� cit (see fi gure 6.13). Because of this discrepancy (shortfall) between supply and demand, anaerobic sources must be involved in providing energy during these periods of time.
The oxygen defi cit occurs because the respiratory and circulatory systems take some time to adjust to the new oxygen demand (even at low exercise intensities) and, consequently, the amount supplied lags behind the amount needed until these systems make the necessary adjustments required to increase oxygen supply. These adjustments involve such things as:
� increased respiratory frequency (breaths per minute) � increased tidal volume (depth of breathing) � increased heart rate (number of times the heart beats per minute) � increased stroke volume (amount of blood ejected from the heart per beat).
Steady stateIt may take anywhere between a few seconds and 1 minute or more, depending on the intensity of the exercise, for oxygen supply or uptake to have increased suffi ciently to meet the oxygen demands of the exercise. If and when oxygen supply does equal the oxygen demand of the exercise, an aerobic steady state (see fi gure 6.13) has been attained. Steady state occurs when virtually all of the required ATP to maintain the current exercise intensity is being supplied aerobically, so that there is no need for further increases in oxygen uptake and there is little reliance on the anaerobic pathways to supply energy for ATP resynthesis. This steady state in oxygen uptake also coincides with a plateau in heart rate and ventilation.
However, if the exercise intensity increases again, the demand for ATP resynthesis and oxygen also increases. Once again, during the short delay before oxygen uptake increases suffi ciently for supply to equal demand, the anaerobic pathways must
eLessonOxygen de� citSearchlight ID: eles-2759
KEY CONCEPT Oxygen uptake at rest, oxygen deficit, steady state and excess post-exercise oxygen consumption are important factors in the efficient delivery of oxygen to working muscles during exercise performance.
Oxygen de� cit is the state in which there is a discrepancy (shortfall) between oxygen supply and demand and the oxygen needed to meet the energy requirements of the activity. Under these conditions the anaerobic pathways must supplement the energy demands of the activity.
Size of oxygen de� cit can be reduced by decreasing intensity, completing a warm-up and completing aerobic training.
Steady state is the state in which oxygen supply equals oxygen demand so that virtually all of the required ATP to maintain the current exercise intensity is being supplied aerobically.
Oxygen uptake at rest, oxygen deficit, steady state and excess post-exercise oxygen consumption6.5
UNCORRECTED However, during the transition from rest to exercise, particularly high-intensity
UNCORRECTED However, during the transition from rest to exercise, particularly high-intensity exercise, and at any time during exercise performance when exercise intensity
UNCORRECTED exercise, and at any time during exercise performance when exercise intensity increases, there is a period of time where there is a discrepancy between the amount
UNCORRECTED increases, there is a period of time where there is a discrepancy between the amount of oxygen required for a given exercise intensity and the amount actually supplied and
UNCORRECTED of oxygen required for a given exercise intensity and the amount actually supplied and
oxygen de� cit
UNCORRECTED oxygen de� cit
this discrepancy (shortfall) between supply and demand, anaerobic sources must be
UNCORRECTED this discrepancy (shortfall) between supply and demand, anaerobic sources must be involved in providing energy during these periods of time.
UNCORRECTED involved in providing energy during these periods of time.
The oxygen defi cit occurs because the respiratory and circulatory systems take
UNCORRECTED The oxygen defi cit occurs because the respiratory and circulatory systems take
some time to adjust to the new oxygen demand (even at low exercise intensities)
UNCORRECTED
some time to adjust to the new oxygen demand (even at low exercise intensities) and, consequently, the amount supplied lags behind the amount needed until these
UNCORRECTED
and, consequently, the amount supplied lags behind the amount needed until these
UNCORRECTED
systems make the necessary adjustments required to increase oxygen supply. These
UNCORRECTED
systems make the necessary adjustments required to increase oxygen supply. These adjustments involve such things as:
UNCORRECTED
adjustments involve such things as:increased respiratory frequency (breaths per minute)
UNCORRECTED
increased respiratory frequency (breaths per minute)increased tidal volume (depth of breathing)
UNCORRECTED
increased tidal volume (depth of breathing)increased heart rate (number of times the heart beats per minute)
UNCORRECTED
increased heart rate (number of times the heart beats per minute)increased stroke volume (amount of blood ejected from the heart per beat).
UNCORRECTED
increased stroke volume (amount of blood ejected from the heart per beat).
Steady state
UNCORRECTED
Steady stateIt may take anywhere between a few seconds and 1 minute or more, depending on
UNCORRECTED
It may take anywhere between a few seconds and 1 minute or more, depending on
UNCORRECTED
the intensity of the exercise, for oxygen supply or uptake to have increased suffi ciently UNCORRECTED
the intensity of the exercise, for oxygen supply or uptake to have increased suffi ciently to meet the oxygen demands of the exercise. If and when oxygen supply does equal UNCORRECTED
to meet the oxygen demands of the exercise. If and when oxygen supply does equal the oxygen demand of the exercise, an aerobic UNCORRECTED
the oxygen demand of the exercise, an aerobic
PAGE As we have discovered in the previous sections, when exercise begins, oxygen uptake
PAGE As we have discovered in the previous sections, when exercise begins, oxygen uptake increases as the body attempts to meet the increased oxygen demand of the working
PAGE increases as the body attempts to meet the increased oxygen demand of the working muscles that results from their need to produce more energy for ATP resynthesis. The
PAGE muscles that results from their need to produce more energy for ATP resynthesis. The respiratory and cardiovascular systems play the major role when increasing oxygen
PAGE respiratory and cardiovascular systems play the major role when increasing oxygen
However, during the transition from rest to exercise, particularly high-intensity PAGE
However, during the transition from rest to exercise, particularly high-intensity exercise, and at any time during exercise performance when exercise intensity PAGE
exercise, and at any time during exercise performance when exercise intensity
PROOFS
metabolism. As exercise intensity increases, the consumption of oxygen increases to
PROOFS
metabolism. As exercise intensity increases, the consumption of oxygen increases to

214 UNIT 3 • Movement skills and energy for physical activity
c06AcutePhysiologicalResponsesToExercise 214 4 May 2017 12:46 PM
supplement the energy supply. As the oxygen uptake increases to the required level, a second aerobic steady state is achieved. The process of increasing oxygen uptake and reaching a new steady state can only occur when lactate removal is greater than production. A steady state can only be held up to and including the lactate infl ection point. It should be noted that in trained endurance (aerobic) athletes, the oxygen defi cit is reduced due to these athletes attaining steady state sooner than untrained individuals.
Oxygen de�cit
Oxy
gen
co
nsum
pti
on
Steady-stateoxygen consumption
Resting oxygenconsumption
Start exercise
Rest Exercise Recovery
End exercise End recovery
Oxygen requirement
EPOC
Time
FIGURE 6.13 Oxygen de� cit, steady state and EPOC
Source: Reprinted with permission, Wilmore, Costill & Kenney, 2008.
Excess post-exercise oxygen consumption (EPOC)Oxygen can be viewed as the ‘currency’ the body uses in order to ‘purchase’ (resynthesise) ATP. In other words, oxygen must be used in order for ATP to be produced. During the time period where an oxygen-defi cit condition prevails, the muscles are able to continue contracting by obtaining the required energy for ATP resynthesis via the two anaerobic pathways (i.e. without suffi cient oxygen).
Even though these two anaerobic systems do not rely directly on oxygen, they should not be viewed as producing ‘free’ ATP. After the cessation of exercise, oxygen uptake or consumption does not immediately return to resting levels, despite the fact that the demand for ATP resynthesis decreases dramatically. Rather, oxygen consumption remains temporarily elevated. This elevated oxygen consumption, which exceeds that normally experienced at rest, is referred to as excess post-exercise oxygen consumption (EPOC) (see fi gure 6.13).
Factors responsible for elevated EPOCThere are a number of factors associated with EPOC and they can only be understood by focusing on how the chemical and physical changes occur in muscle cells during exercise. Chemical and physical changes occurring in contracting muscle cells that increase levels of oxygen consumption and ATP will continue for some time after exercise has ceased. These changes continue into the recovery phase as oxygen consumption remains elevated.
Some of the factors of EPOC are: � Temperature is the most important factor. Elevated muscle temperature after exercise is closely associated with elevated levels of EPOC and accounts for the slow component of oxygen consumption.
� Increased mitochondrial respiration during exercise to produce aerobic energy. Mitochondria are the site of aerobic energy production. Calcium ions stimulate mitochondrial respiration, infl uencing EPOC levels.
InteractivityOxygen de� cit, steady state and EPOCSearchlight ID: int-6800
Excess post-exercise oxygen consumption (EPOC) is the amount of oxygen consumed during the recovery period after the cessation of an exercise bout that is over and above the amount usually required during rest.
Oxygen uptake at rest, oxygen deficit, steady state and excess post-exercise oxygen consumption6.5
UNCORRECTED Reprinted with permission, Wilmore, Costill & Kenney, 2008.
UNCORRECTED Reprinted with permission, Wilmore, Costill & Kenney, 2008.
Excess post-exercise oxygen consumption (EPOC)
UNCORRECTED Excess post-exercise oxygen consumption (EPOC)Oxygen can be viewed as the ‘currency’ the body uses in order to ‘purchase’
UNCORRECTED Oxygen can be viewed as the ‘currency’ the body uses in order to ‘purchase’ (resynthesise) ATP. In other words, oxygen must be used in order for ATP to be
UNCORRECTED (resynthesise) ATP. In other words, oxygen must be used in order for ATP to be produced. During the time period where an oxygen-defi cit condition prevails, the
UNCORRECTED produced. During the time period where an oxygen-defi cit condition prevails, the muscles are able to continue contracting by obtaining the required energy for ATP
UNCORRECTED muscles are able to continue contracting by obtaining the required energy for ATP resynthesis via the two anaerobic pathways (i.e. without suffi cient oxygen).
UNCORRECTED resynthesis via the two anaerobic pathways (i.e. without suffi cient oxygen).
Even though these two anaerobic systems do not rely directly on oxygen, they
UNCORRECTED
Even though these two anaerobic systems do not rely directly on oxygen, they should not be viewed as producing ‘free’ ATP. After the cessation of exercise, oxygen
UNCORRECTED
should not be viewed as producing ‘free’ ATP. After the cessation of exercise, oxygen uptake or consumption does not immediately return to resting levels, despite the
UNCORRECTED
uptake or consumption does not immediately return to resting levels, despite the fact that the demand for ATP resynthesis decreases dramatically. Rather, oxygen
UNCORRECTED
fact that the demand for ATP resynthesis decreases dramatically. Rather, oxygen consumption remains temporarily elevated. This elevated oxygen consumption, which
UNCORRECTED
consumption remains temporarily elevated. This elevated oxygen consumption, which
UNCORRECTED
UNCORRECTED
UNCORRECTED
Excess post-exercise oxygen
UNCORRECTED
Excess post-exercise oxygen consumption (EPOC)
UNCORRECTED
consumption (EPOC) is the
UNCORRECTED
is the amount of oxygen consumed
UNCORRECTED
amount of oxygen consumed during the recovery period after
UNCORRECTED
during the recovery period after the cessation of an exercise bout
UNCORRECTED
the cessation of an exercise bout that is over and above the amount
UNCORRECTED
that is over and above the amount usually required during rest.
UNCORRECTED
usually required during rest.
PAGE
PAGE
PAGE
PAGE
PAGE
PAGE
PAGE
PAGE Exercise
PAGE Exercise
End exercise
PAGE End exercise
Time
PAGE Time
PAGE Oxygen de� cit, steady state and EPOCPAGE Oxygen de� cit, steady state and EPOC
Reprinted with permission, Wilmore, Costill & Kenney, 2008.PAGE Reprinted with permission, Wilmore, Costill & Kenney, 2008.
PROOFSpoint. It should be noted that in trained endurance (aerobic) athletes, the oxygen
PROOFSpoint. It should be noted that in trained endurance (aerobic) athletes, the oxygen defi cit is reduced due to these athletes attaining steady state sooner than untrained
PROOFSdefi cit is reduced due to these athletes attaining steady state sooner than untrained
PROOFS
PROOFSEPOC
PROOFSEPOC
PROOFS
PROOFS
PROOFS
PROOFS
PROOFS
PROOFS
CHAPTER 6 • Acute physiological responses to exercise 215
c06AcutePhysiologicalResponsesToExercise 215 4 May 2017 12:46 PM
� Elevated concentration levels of catecholamine, which stimulate energy-requiring processes in cells.
� Changes in sodium (Na+), potassium (K+) and hormone levels interact to change EPOC levels.
� Lipolysis and release of fatty acids increases EPOC after exercise. � If previous exercise was primarily aerobic, EPOC recovery would be completed within several minutes (fast component).
� Increased use of mitochondria, which may be controlled by concentrations of ADP, ATP, inorganic phosphates and creatine phosphate.
� Resynthesising creatine phosphates after exercise exhibiting a fast and slow recovery component.
� The size of EPOC is determined by re-phosphorylation of creatine and ADP. � Increased ATP production. � If previous exercise was strenuous, where lactate and body temperature have increased considerably, EPOC recovery would be slow (slow component). EPOC recovery may take several hours, depending on intensity and duration, before returning to pre-exercise oxygen consumption levels.
TEST your understanding 1 Explain why an oxygen de� cit accrues at the beginning
of any exercise bout. 2 Discuss the factors that could determine the size of the
oxygen de� cit that accrues. 3 When is a steady state achieved during an exercise
bout? What does this signify in terms of energy supply to the working muscles?
4 Explain the factors responsible for the elevated levels of EPOC.
5 Explain what is meant by the expression ‘oxygen is the body’s exercise currency’.
6 Explain the changes in oxygen demand and supply during submaximal exercise.
EXAM practice 7 A female VCE PE student completes a 3-km
cross-country course in 12 minutes on a 20°C day.
She wears a heart rate monitor and holds a steady pace until the � nal minute where she increases her pace until she crosses the � nish line. She notices that her heart rate reaches a plateau after about three minutes from the start. She also notices that her heart rate returns to pre-race levels about four minutes after her race is completed.
Draw and label a graph that illustrates oxygen uptake for the female student for the 12 minutes of the race and 4 minutes of recovery. On your graph, label and include:(a) any periods of rest 1 mark(b) any periods of oxygen de� cit 1 mark(c) any periods of steady state 1 mark(d) any periods of EPOC. 1 mark(e) Explain why the heart rate plateaued at the
three-minute mark. 2 marks
UNCORRECTED
UNCORRECTED When is a steady state achieved during an exercise
UNCORRECTED When is a steady state achieved during an exercise bout? What does this signify in terms of energy supply
UNCORRECTED bout? What does this signify in terms of energy supply
Explain the factors responsible for the elevated levels of
UNCORRECTED Explain the factors responsible for the elevated levels of
Explain what is meant by the expression ‘oxygen is the
UNCORRECTED Explain what is meant by the expression ‘oxygen is the
Explain the changes in oxygen demand and supply
UNCORRECTED Explain the changes in oxygen demand and supply during submaximal exercise.
UNCORRECTED during submaximal exercise.
A female VCE PE student completes a 3-km
UNCORRECTED
A female VCE PE student completes a 3-km cross-country course in 12 minutes on a 20
UNCORRECTED
cross-country course in 12 minutes on a 20
PAGE
PAGE
PAGE Discuss the factors that could determine the size of the
PAGE Discuss the factors that could determine the size of the
She wears a heart rate monitor and holds a steady
PAGE She wears a heart rate monitor and holds a steady pace until the � nal minute where she increases her
PAGE pace until the � nal minute where she increases her pace until she crosses the � nish line.
PAGE pace until she crosses the � nish line.
PAGE She notices that her heart rate reaches a plateau after
PAGE She notices that her heart rate reaches a plateau after about three minutes from the start. She also notices PAGE about three minutes from the start. She also notices that her heart rate returns to pre-race levels about four PAGE that her heart rate returns to pre-race levels about four
PROOFS
increased considerably, EPOC recovery would be slow (slow component). EPOC
PROOFS
increased considerably, EPOC recovery would be slow (slow component). EPOC
216 UNIT 3 • Movement skills and energy for physical activity
c06AcutePhysiologicalResponsesToExercise 216 4 May 2017 12:46 PM
Acute muscular system responses to exercise are those that occur in the working muscles themselves. These responses vary according to the type, intensity and duration of the exercise performed, and may differ according to the type of muscle fi bre recruited (fast-twitch as opposed to slow-twitch fi bres). However, basically these responses include:
� increased motor unit and muscle fi bre recruitment � increased blood fl ow to the muscles � increased arteriovenous oxygen difference � increased muscle temperature � increased muscle enzyme activity � increased oxygen supply and use � decreased muscle substrate levels (ATP, creatine phosphate, glycogen and triglycerides).
Increased motor unit and muscle fibre recruitmentWhen an individual engages in any physical activity there is a need for muscular contractions to take place. When exercise begins, an increase in motor unit recruitment must take place so that more muscle fi bres are activated to contract. The greater the force or effort required, the greater the number of motor units recruited and the greater the number of muscle fi bres activated.
Increased blood flow in the musclesThe extra demand of the muscles for oxygen during exercise leads to vasodilation of the capillaries and redistribution of blood fl ow from the internal organs to the working skeletal muscles.
Increased arteriovenous oxygen differenceDuring exercise, working muscles extract much more of the available oxygen from the blood, via myoglobin and mitochondria. As much as 75 per cent of the available oxygen is extracted and, as a result, the arteriovenous oxygen difference increases.
Increased muscle temperatureIncreased blood fl ow to the muscles, coupled with the heat generated as a by-product of the increased production of ATP during exercise, results in an increase in muscle temperature.
Increased muscle enzyme activityEnzyme activity increases during exercise to produce the increased amounts of ATP required by the muscles. Enzymes are involved in all of the chemical processes that produce energy via the three energy pathways.
KEY CONCEPT When we engage in exercise, acute responses also occur in the muscles themselves as the body responds to the increased energy demands imposed by the activity undertaken.
6.6 Acute responses of the muscular system
UNCORRECTED When an individual engages in any physical activity there is a need for muscular
UNCORRECTED When an individual engages in any physical activity there is a need for muscular contractions to take place. When exercise begins, an increase in motor unit recruitment
UNCORRECTED contractions to take place. When exercise begins, an increase in motor unit recruitment must take place so that more muscle fi bres are activated to contract. The greater the
UNCORRECTED must take place so that more muscle fi bres are activated to contract. The greater the force or effort required, the greater the number of motor units recruited and the
UNCORRECTED force or effort required, the greater the number of motor units recruited and the greater the number of muscle fi bres activated.
UNCORRECTED greater the number of muscle fi bres activated.
Increased blood flow in the muscles
UNCORRECTED Increased blood flow in the musclesThe extra demand of the muscles for oxygen during exercise leads to vasodilation
UNCORRECTED The extra demand of the muscles for oxygen during exercise leads to vasodilation of the capillaries and redistribution of blood fl ow from the internal organs to the
UNCORRECTED
of the capillaries and redistribution of blood fl ow from the internal organs to the working skeletal muscles.
UNCORRECTED
working skeletal muscles.
Increased arteriovenous oxygen difference
UNCORRECTED
Increased arteriovenous oxygen difference
PAGE decreased muscle substrate levels (ATP, creatine phosphate, glycogen and
PAGE decreased muscle substrate levels (ATP, creatine phosphate, glycogen and
Increased motor unit and muscle fibre recruitment
PAGE Increased motor unit and muscle fibre recruitmentWhen an individual engages in any physical activity there is a need for muscular PAGE When an individual engages in any physical activity there is a need for muscular contractions to take place. When exercise begins, an increase in motor unit recruitment PAGE
contractions to take place. When exercise begins, an increase in motor unit recruitment
PROOFSAcute muscular system responses to exercise are those that occur in the working
PROOFSAcute muscular system responses to exercise are those that occur in the working muscles themselves. These responses vary according to the type, intensity and
PROOFSmuscles themselves. These responses vary according to the type, intensity and duration of the exercise performed, and may differ according to the type of muscle
PROOFSduration of the exercise performed, and may differ according to the type of muscle fi bre recruited (fast-twitch as opposed to slow-twitch fi bres). However, basically these
PROOFSfi bre recruited (fast-twitch as opposed to slow-twitch fi bres). However, basically these

CHAPTER 6 • Acute physiological responses to exercise 217
c06AcutePhysiologicalResponsesToExercise 217 4 May 2017 12:46 PM
Increased oxygen supply and useThe muscle cells extract and use more oxygen from the blood during exercise because of the increased demand for ATP. This greater extraction and use of oxygen by the exercising muscle contributes to the increase in the arteriovenous oxygen difference that has been previously referred to.
Decreased muscle substrate levelsMuscular stores of ATP, creatine phosphate, glycogen and triglycerides begin to deplete during exercise because they are sources of fuel for the production of ATP. The depletion of these energy stores, particularly creatine phosphate and glycogen, contributes to the fatigue experienced during exercise and physical activity.
FIGURE 6.14 During high-intensity exercise, muscular stores of ATP and creatine phosphate deplete as they provide energy for the production of ATP.
TEST your understanding 1 Draw a simple diagram (using appropriate icons to represent each muscular
system change) that summarises the major acute muscular system responses to exercise.
2 Using your knowledge of different types of muscle � bre, explain how each of the muscle � bre types might respond to different types of exercise (anaerobic and aerobic).
practiceState one acute muscular response that will occur during a 100-metre sprint and assist with performance. Explain how the stated acute response assists with performance. 2 marks
Unit 3 Muscular systemSummary screen and practice questions
AOS 2
Topic 2
Concept 4
UNCORRECTED
UNCORRECTED During high-intensity exercise, muscular stores of ATP and creatine phosphate
UNCORRECTED During high-intensity exercise, muscular stores of ATP and creatine phosphate
deplete as they provide energy for the production of ATP.
UNCORRECTED deplete as they provide energy for the production of ATP.
UNCORRECTED
UNCORRECTED
UNCORRECTED
UNCORRECTED
UNCORRECTED
UNCORRECTED
your understanding
UNCORRECTED
your understandingDraw a simple diagram (using appropriate icons to represent each muscular
UNCORRECTED
Draw a simple diagram (using appropriate icons to represent each muscular system change) that summarises the major acute muscular system responses
UNCORRECTED
system change) that summarises the major acute muscular system responses to exercise.
UNCORRECTED
to exercise.Using your knowledge of different types of muscle � bre, explain how each of
UNCORRECTED
Using your knowledge of different types of muscle � bre, explain how each of the muscle � bre types might respond to different types of exercise (anaerobic
UNCORRECTED
the muscle � bre types might respond to different types of exercise (anaerobic and aerobic).
UNCORRECTED
and aerobic).
EXAM
UNCORRECTED
EXAM practice
UNCORRECTED
practice 3
UNCORRECTED
3 State one acute muscular response that will occur during a 100-metre sprint
UNCORRECTED
State one acute muscular response that will occur during a 100-metre sprint and assist with performance. Explain how the stated acute response assists
UNCORRECTED
and assist with performance. Explain how the stated acute response assists
PAGE PROOFS
PROOFS
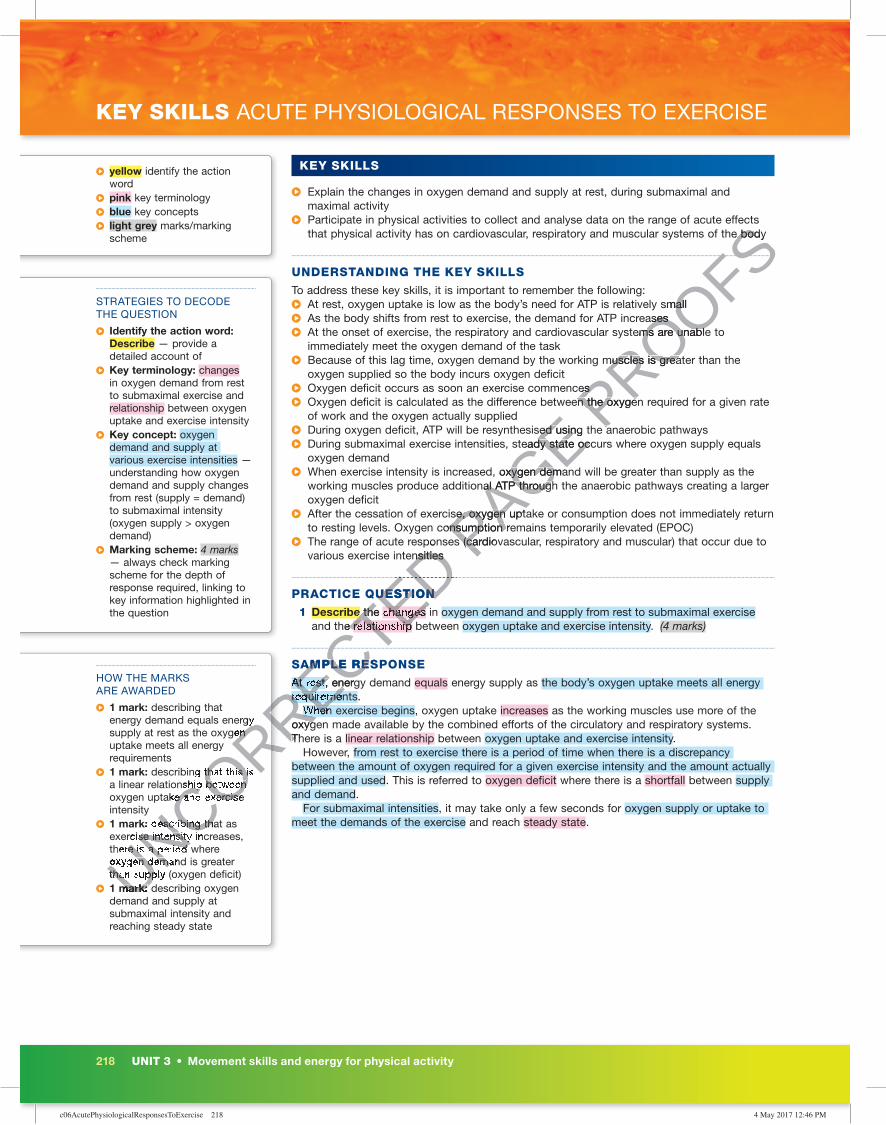
218 UNIT 3 • Movement skills and energy for physical activity
c06AcutePhysiologicalResponsesToExercise 218 4 May 2017 12:46 PM
KEY SKILLS ACUTE PHYSIOLOGICAL RESPONSES TO EXERCISE
KEY SKILLS
� Explain the changes in oxygen demand and supply at rest, during submaximal and maximal activity
� Participate in physical activities to collect and analyse data on the range of acute effects that physical activity has on cardiovascular, respiratory and muscular systems of the body
UNDERSTANDING THE KEY SKILLS
To address these key skills, it is important to remember the following: � At rest, oxygen uptake is low as the body’s need for ATP is relatively small � As the body shifts from rest to exercise, the demand for ATP increases � At the onset of exercise, the respiratory and cardiovascular systems are unable to
immediately meet the oxygen demand of the task � Because of this lag time, oxygen demand by the working muscles is greater than the
oxygen supplied so the body incurs oxygen de� cit � Oxygen de� cit occurs as soon an exercise commences � Oxygen de� cit is calculated as the difference between the oxygen required for a given rate
of work and the oxygen actually supplied � During oxygen de� cit, ATP will be resynthesised using the anaerobic pathways � During submaximal exercise intensities, steady state occurs where oxygen supply equals
oxygen demand � When exercise intensity is increased, oxygen demand will be greater than supply as the
working muscles produce additional ATP through the anaerobic pathways creating a larger oxygen de� cit
� After the cessation of exercise, oxygen uptake or consumption does not immediately return to resting levels. Oxygen consumption remains temporarily elevated (EPOC)
� The range of acute responses (cardiovascular, respiratory and muscular) that occur due to various exercise intensities
PRACTICE QUESTION
1 Describe the changes in oxygen demand and supply from rest to submaximal exercise and the relationship between oxygen uptake and exercise intensity. (4 marks)
SAMPLE RESPONSE
At rest, energy demand equals energy supply as the body’s oxygen uptake meets all energy requirements. When exercise begins, oxygen uptake increases as the working muscles use more of the oxygen made available by the combined efforts of the circulatory and respiratory systems. There is a linear relationship between oxygen uptake and exercise intensity. However, from rest to exercise there is a period of time when there is a discrepancy between the amount of oxygen required for a given exercise intensity and the amount actually supplied and used. This is referred to oxygen de� cit where there is a shortfall between supply and demand. For submaximal intensities, it may take only a few seconds for oxygen supply or uptake to meet the demands of the exercise and reach steady state.
� yellow identify the action word
� pink key terminology � blue key concepts � light grey marks/marking scheme
STRATEGIES TO DECODE THE QUESTION
� Identify the action word: Describe — provide a detailed account of
� Key terminology: changes in oxygen demand from rest to submaximal exercise and relationship between oxygen uptake and exercise intensity
� Key concept: oxygen demand and supply at various exercise intensities — understanding how oxygen demand and supply changes from rest (supply = demand) to submaximal intensity (oxygen supply > oxygen demand)
� Marking scheme: 4 marks — always check marking scheme for the depth of response required, linking to key information highlighted in the question
HOW THE MARKS ARE AWARDED
� 1 mark: describing that energy demand equals energy supply at rest as the oxygen uptake meets all energy requirements
� 1 mark: describing that this is a linear relationship between oxygen uptake and exercise intensity
� 1 mark: describing that as exercise intensity increases, there is a period where oxygen demand is greater than supply (oxygen de� cit)
� 1 mark: describing oxygen demand and supply at submaximal intensity and reaching steady state
UNCORRECTED
UNCORRECTED
UNCORRECTED
UNCORRECTED
UNCORRECTED
UNCORRECTED
UNCORRECTED
UNCORRECTED The range of acute responses (cardiovascular, respiratory and muscular) that occur due to
UNCORRECTED The range of acute responses (cardiovascular, respiratory and muscular) that occur due to various exercise intensities
UNCORRECTED various exercise intensities
PRACTICE QUESTION
UNCORRECTED PRACTICE QUESTION
Describe
UNCORRECTED Describe the
UNCORRECTED the changes
UNCORRECTED changes in oxygen demand and supply from rest to submaximal exercise
UNCORRECTED in oxygen demand and supply from rest to submaximal exercise
and the
UNCORRECTED and the relationship
UNCORRECTED relationship between oxygen uptake and exercise intensity.
UNCORRECTED between oxygen uptake and exercise intensity.
SAMPLE RESPONSE
UNCORRECTED SAMPLE RESPONSE
UNCORRECTED
UNCORRECTED
UNCORRECTED
UNCORRECTED
At rest, energy demand
UNCORRECTED
At rest, energy demand At rest, energy demand
UNCORRECTED
At rest, energy demand requirements.
UNCORRECTED
requirements.When exercise begins, oxygen uptake
UNCORRECTED
When exercise begins, oxygen uptake oxygen made available by the combined efforts of the circulatory and respiratory systems.
UNCORRECTED
oxygen made available by the combined efforts of the circulatory and respiratory systems. There is a linear relationship between oxygen uptake and exercise intensity
UNCORRECTED
There is a linear relationship between oxygen uptake and exercise intensity
UNCORRECTED
UNCORRECTED
UNCORRECTED
energy demand equals energy
UNCORRECTED
energy demand equals energy supply at rest as the oxygen
UNCORRECTED
supply at rest as the oxygen uptake meets all energy
UNCORRECTED
uptake meets all energy
describing that this is
UNCORRECTED
describing that this is a linear relationship between
UNCORRECTED
a linear relationship between oxygen uptake and exercise
UNCORRECTED
oxygen uptake and exercise
1 mark:
UNCORRECTED
1 mark: describing that as
UNCORRECTED
describing that as
UNCORRECTED
exercise intensity increases,
UNCORRECTED
exercise intensity increases, there is a period where
UNCORRECTED
there is a period where oxygen demand is greater UNCORRECTED
oxygen demand is greater than supply (oxygen de� cit)UNCORRECTED
than supply (oxygen de� cit)UNCORRECTED
1 mark:UNCORRECTED
1 mark: describing oxygen UNCORRECTED
describing oxygen demand and supply at UNCORRECTED
demand and supply at
PAGE During oxygen de� cit, ATP will be resynthesised using the anaerobic pathways
PAGE During oxygen de� cit, ATP will be resynthesised using the anaerobic pathwaysDuring submaximal exercise intensities, steady state occurs where oxygen supply equals
PAGE During submaximal exercise intensities, steady state occurs where oxygen supply equals
When exercise intensity is increased, oxygen demand will be greater than supply as the
PAGE When exercise intensity is increased, oxygen demand will be greater than supply as the working muscles produce additional ATP through the anaerobic pathways creating a larger
PAGE working muscles produce additional ATP through the anaerobic pathways creating a larger
After the cessation of exercise, oxygen uptake or consumption does not immediately return
PAGE After the cessation of exercise, oxygen uptake or consumption does not immediately return to resting levels. Oxygen consumption remains temporarily elevated (EPOC)PAGE to resting levels. Oxygen consumption remains temporarily elevated (EPOC)The range of acute responses (cardiovascular, respiratory and muscular) that occur due to PAGE
The range of acute responses (cardiovascular, respiratory and muscular) that occur due to
PROOFS
PROOFS
PROOFS
PROOFSParticipate in physical activities to collect and analyse data on the range of acute effects
PROOFSParticipate in physical activities to collect and analyse data on the range of acute effects that physical activity has on cardiovascular, respiratory and muscular systems of the body
PROOFSthat physical activity has on cardiovascular, respiratory and muscular systems of the body
At rest, oxygen uptake is low as the body’s need for ATP is relatively small
PROOFSAt rest, oxygen uptake is low as the body’s need for ATP is relatively smallAs the body shifts from rest to exercise, the demand for ATP increases
PROOFSAs the body shifts from rest to exercise, the demand for ATP increasesAt the onset of exercise, the respiratory and cardiovascular systems are unable to
PROOFSAt the onset of exercise, the respiratory and cardiovascular systems are unable to
Because of this lag time, oxygen demand by the working muscles is greater than the
PROOFSBecause of this lag time, oxygen demand by the working muscles is greater than the
Oxygen de� cit occurs as soon an exercise commences PROOFS
Oxygen de� cit occurs as soon an exercise commencesOxygen de� cit is calculated as the difference between the oxygen required for a given rate PROOFS
Oxygen de� cit is calculated as the difference between the oxygen required for a given rate
During oxygen de� cit, ATP will be resynthesised using the anaerobic pathwaysPROOFS
During oxygen de� cit, ATP will be resynthesised using the anaerobic pathways

CHAPTER REVIEW ACUTE PHYSIOLOGICAL RESPONSES TO EXERCISE
CHAPTER 6 • Acute physiological responses to exercise 219
c06AcutePhysiologicalResponsesToExercise 219 4 May 2017 12:46 PM
CHAPTER SUMMARY
Table 6.5 summarises the acute cardiovascular, respiratory and muscular system responses to exercise that have been discussed in this chapter.
TABLE 6.5 Summary of acute responses to exercise
Body system Acute response Nature of response
Cardiovascular system
� Increased heart rate
� Increased stroke volume
� Increased cardiac output
� Increased blood pressure
� Redistributed blood � ow to working muscles
� Increased arteriovenous oxygen difference
� Increases linearly with increasing exercise intensity up to approximate maximum that is calculated by subtracting the individual’s age (years) from 220
� Maximal value reached during submaximal exercise
� Increases from 5–6 L/min at rest to 20–25 L/min or more during maximal exercise
� Increased systolic pressure
� At rest 15–20 per cent of total blood � ow directed to working muscles; during exercise 80–90 per cent of total blood � ow directed to working muscles
� Increases can be almost threefold over the value at rest
Respiratory system
� Increased respiratory frequency (breathing rate)
� Increased tidal volume
� Increased ventilation
� Increased oxygen uptake
� Increased pulmonary diffusion
� Increases from 12 breaths per minute to as many as 35–40 per minute
� Increases from around 0.5 litres per breath at rest to as high as 5 litres per breath at maximal workloads
� Increases from around 5–6 L/min at rest to beyond 108 and 130 L/minduring exercise (for males and females respectively)
� Increases from 0.3–0.4 L/min at rest to maximal values of 2.0–3.5 L/min during exercise
� increase by up to three times the resting rate
Muscular system
� Increased motor unit and muscle � bre recruitment
� Increased blood � ow in the muscles
� Increased muscle temperature
� Increased muscle enzyme activity
� Increased oxygen extraction and utilisation
� Decreased muscle substrate levels
� More motor units recruited and muscle � bres activated
� Increases from 15–20 per cent of total blood � ow at rest up to80–90 per cent during exercise
� As a result of increased blood � ow and ATP production
� In order to produce the increased amounts of ATP required by the muscles during exercise
� Muscle cells extract and use more oxygen during exercise
� ATP, creatine phosphate, glycogen and triglycerides deplete
InteractivityUnderstanding acute response termsSearchlight ID: int-6801
InteractivityAcute responses to exerciseSearchlight ID: int-6802
UNCORRECTED
UNCORRECTED
UNCORRECTED
UNCORRECTED
Increased oxygen uptake
UNCORRECTED
Increased oxygen uptake
Increased pulmonary
UNCORRECTED
Increased pulmonary diffusion
UNCORRECTED
diffusion
Increases from 12 breaths per minute
UNCORRECTED Increases from 12 breaths per minute to as many as 35–40 per minute
UNCORRECTED to as many as 35–40 per minute
�
UNCORRECTED � Increases from around 0.5 litres per
UNCORRECTED Increases from around 0.5 litres per breath at rest to as high as 5 litres per
UNCORRECTED breath at rest to as high as 5 litres per breath at maximal workloads
UNCORRECTED breath at maximal workloads
�
UNCORRECTED � Increases from around 5–6 L/min at
UNCORRECTED Increases from around 5–6 L/min at rest to beyond 108 and 130 L/min
UNCORRECTED rest to beyond 108 and 130 L/min
�
UNCORRECTED
� Increased motor unit and
UNCORRECTED
Increased motor unit and muscle � bre recruitment
UNCORRECTED
muscle � bre recruitment
�
UNCORRECTED
� Increased blood � ow in
UNCORRECTED
Increased blood � ow in
PAGE
PAGE At rest 15–20 per cent of total blood
PAGE At rest 15–20 per cent of total blood � ow directed to working muscles;
PAGE � ow directed to working muscles; during exercise 80–90 per cent of total
PAGE during exercise 80–90 per cent of total blood � ow directed to working muscles
PAGE blood � ow directed to working muscles
Increases can be almost threefold PAGE Increases can be almost threefold over the value at restPAGE over the value at rest
Increases from 12 breaths per minute PAGE
Increases from 12 breaths per minute
PROOFS
PROOFS
PROOFSSearchlight ID: int-6801
PROOFSSearchlight ID: int-6801
PROOFS
PROOFSInteractivity
PROOFSInteractivityAcute responses to exercise
PROOFSAcute responses to exerciseSearchlight ID: int-6802
PROOFSSearchlight ID: int-6802
PROOFS
PROOFS
PROOFS
PROOFS
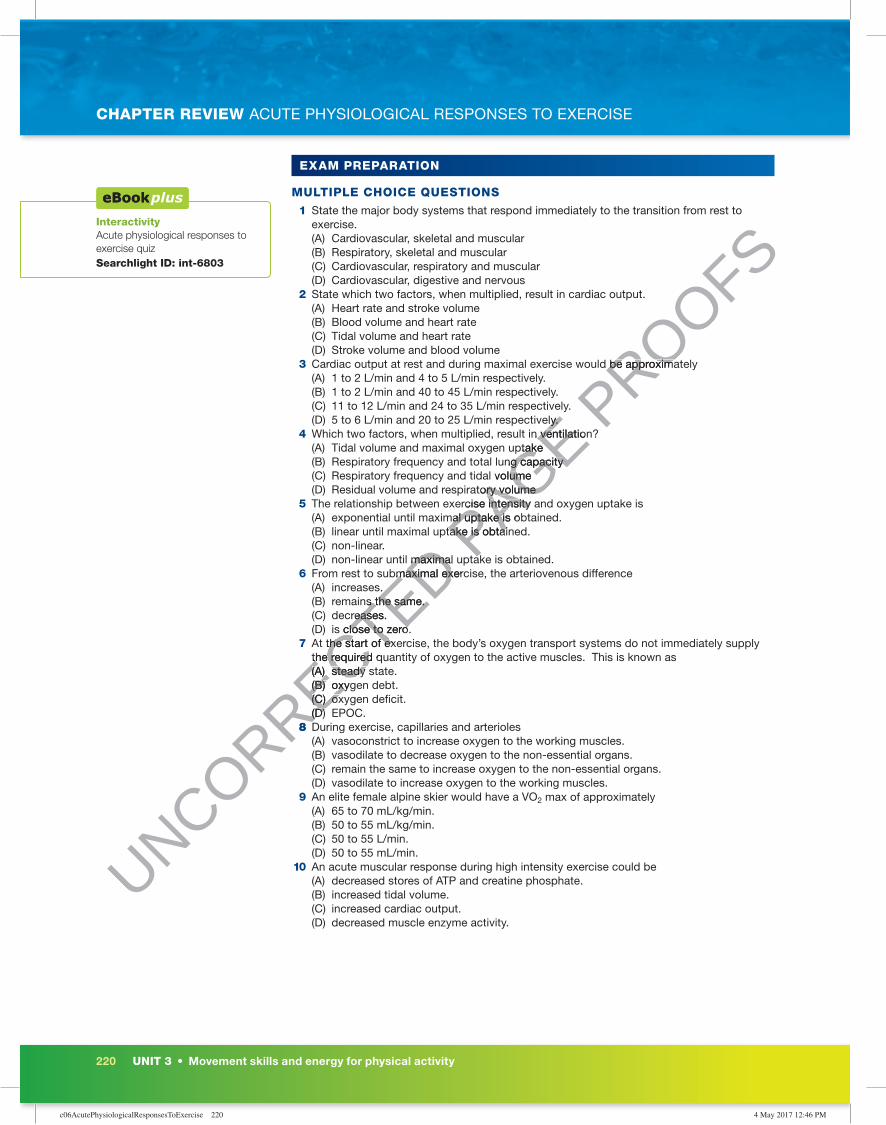
220 UNIT 3 • Movement skills and energy for physical activity
c06AcutePhysiologicalResponsesToExercise 220 4 May 2017 12:46 PM
CHAPTER REVIEW ACUTE PHYSIOLOGICAL RESPONSES TO EXERCISE
EXAM PREPARATION
MULTIPLE CHOICE QUESTIONS
1 State the major body systems that respond immediately to the transition from rest to exercise. (A) Cardiovascular, skeletal and muscular(B) Respiratory, skeletal and muscular(C) Cardiovascular, respiratory and muscular(D) Cardiovascular, digestive and nervous
2 State which two factors, when multiplied, result in cardiac output.(A) Heart rate and stroke volume(B) Blood volume and heart rate(C) Tidal volume and heart rate(D) Stroke volume and blood volume
3 Cardiac output at rest and during maximal exercise would be approximately(A) 1 to 2 L/min and 4 to 5 L/min respectively.(B) 1 to 2 L/min and 40 to 45 L/min respectively.(C) 11 to 12 L/min and 24 to 35 L/min respectively.(D) 5 to 6 L/min and 20 to 25 L/min respectively.
4 Which two factors, when multiplied, result in ventilation?(A) Tidal volume and maximal oxygen uptake(B) Respiratory frequency and total lung capacity(C) Respiratory frequency and tidal volume(D) Residual volume and respiratory volume
5 The relationship between exercise intensity and oxygen uptake is(A) exponential until maximal uptake is obtained.(B) linear until maximal uptake is obtained.(C) non-linear.(D) non-linear until maximal uptake is obtained.
6 From rest to submaximal exercise, the arteriovenous difference(A) increases.(B) remains the same.(C) decreases.(D) is close to zero.
7 At the start of exercise, the body’s oxygen transport systems do not immediately supply the required quantity of oxygen to the active muscles. This is known as(A) steady state.(B) oxygen debt.(C) oxygen de� cit.(D) EPOC.
8 During exercise, capillaries and arterioles(A) vasoconstrict to increase oxygen to the working muscles.(B) vasodilate to decrease oxygen to the non-essential organs.(C) remain the same to increase oxygen to the non-essential organs.(D) vasodilate to increase oxygen to the working muscles.
9 An elite female alpine skier would have a VO2 max of approximately(A) 65 to 70 mL/kg/min.(B) 50 to 55 mL/kg/min.(C) 50 to 55 L/min.(D) 50 to 55 mL/min.
10 An acute muscular response during high intensity exercise could be(A) decreased stores of ATP and creatine phosphate.(B) increased tidal volume.(C) increased cardiac output.(D) decreased muscle enzyme activity.
InteractivityAcute physiological responses to exercise quizSearchlight ID: int-6803
UNCORRECTED (D) non-linear until maximal uptake is obtained.
UNCORRECTED (D) non-linear until maximal uptake is obtained.From rest to submaximal exercise, the arteriovenous difference
UNCORRECTED From rest to submaximal exercise, the arteriovenous difference(A) increases.
UNCORRECTED (A) increases.(B) remains the same.
UNCORRECTED (B) remains the same.(C) decreases.
UNCORRECTED (C) decreases.
UNCORRECTED (D) is close to zero.
UNCORRECTED (D) is close to zero.At the start of exercise, the body’s oxygen transport systems do not immediately supply
UNCORRECTED At the start of exercise, the body’s oxygen transport systems do not immediately supply the required quantity of oxygen to the active muscles. This is known as
UNCORRECTED the required quantity of oxygen to the active muscles. This is known as(A) steady state.
UNCORRECTED
(A) steady state.(B) oxygen debt.
UNCORRECTED
(B) oxygen debt.(C) oxygen de� cit.
UNCORRECTED
(C) oxygen de� cit.(D) EPOC.
UNCORRECTED
(D) EPOC. 8
UNCORRECTED
8
PAGE (C) 11 to 12 L/min and 24 to 35 L/min respectively.
PAGE (C) 11 to 12 L/min and 24 to 35 L/min respectively.(D) 5 to 6 L/min and 20 to 25 L/min respectively.
PAGE (D) 5 to 6 L/min and 20 to 25 L/min respectively.Which two factors, when multiplied, result in ventilation?
PAGE Which two factors, when multiplied, result in ventilation?(A) Tidal volume and maximal oxygen uptake
PAGE (A) Tidal volume and maximal oxygen uptake(B) Respiratory frequency and total lung capacity
PAGE (B) Respiratory frequency and total lung capacity(C) Respiratory frequency and tidal volume
PAGE (C) Respiratory frequency and tidal volume(D) Residual volume and respiratory volume
PAGE (D) Residual volume and respiratory volumeThe relationship between exercise intensity and oxygen uptake is
PAGE The relationship between exercise intensity and oxygen uptake is(A) exponential until maximal uptake is obtained.PAGE (A) exponential until maximal uptake is obtained.(B) linear until maximal uptake is obtained.PAGE (B) linear until maximal uptake is obtained.
(D) non-linear until maximal uptake is obtained.PAGE
(D) non-linear until maximal uptake is obtained.
PROOFSCardiac output at rest and during maximal exercise would be approximately
PROOFSCardiac output at rest and during maximal exercise would be approximately
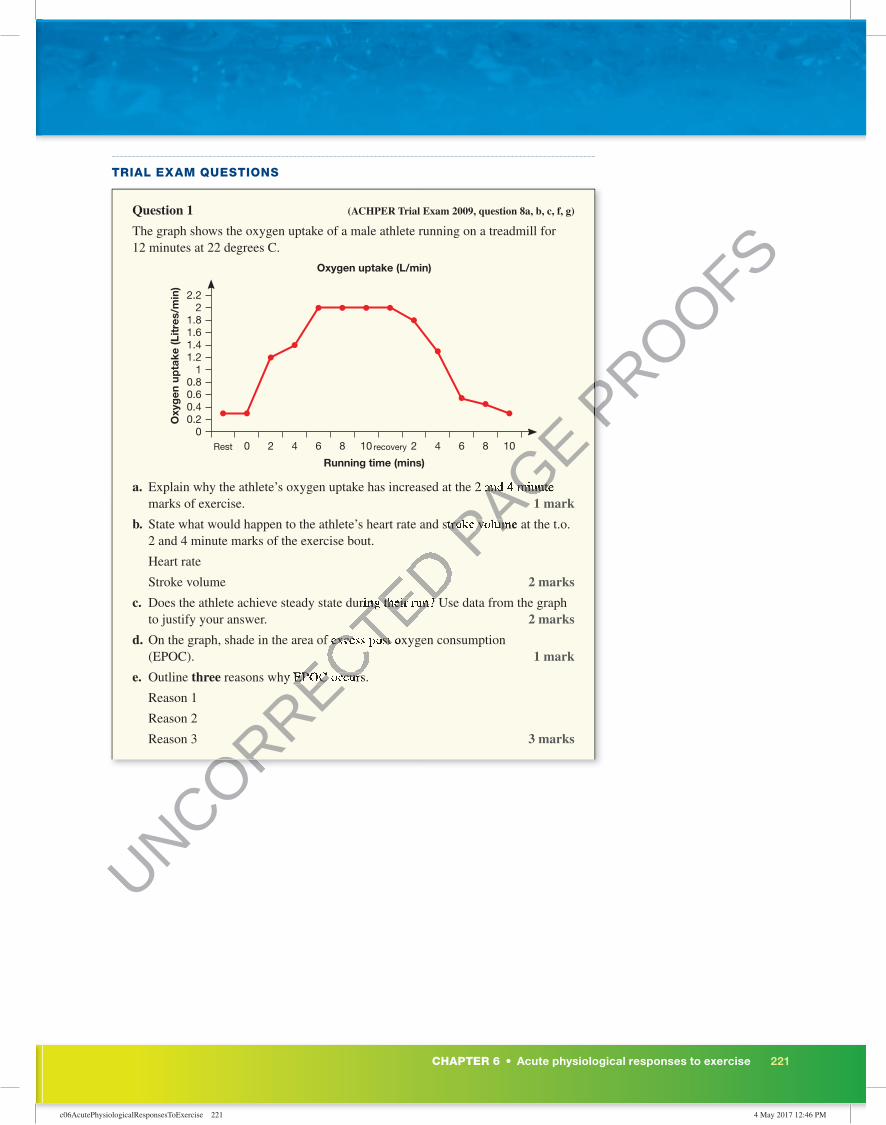
CHAPTER 6 • Acute physiological responses to exercise 221
c06AcutePhysiologicalResponsesToExercise 221 4 May 2017 12:46 PM
TRIAL EXAM QUESTIONS
Question 1 (ACHPER Trial Exam 2009, question 8a, b, c, f, g)
The graph shows the oxygen uptake of a male athlete running on a treadmill for 12 minutes at 22 degrees C.
Rest 0 2 4 6 8 10 recovery 2 4 6 8 10
Running time (mins)
Oxygen uptake (L/min)
Oxy
gen
up
take
(Lit
res/
min
)
00.20.40.60.8
11.21.41.61.8
22.2
a. Explain why the athlete’s oxygen uptake has increased at the 2 and 4 minute marks of exercise. 1 mark
b. State what would happen to the athlete’s heart rate and stroke volume at the t.o. 2 and 4 minute marks of the exercise bout.
Heart rate
Stroke volume 2 marks
c. Does the athlete achieve steady state during their run? Use data from the graph to justify your answer. 2 marks
d. On the graph, shade in the area of excess post oxygen consumption (EPOC). 1 mark
e. Outline three reasons why EPOC occurs.
Reason 1
Reason 2
Reason 3 3 marks
UNCORRECTED
UNCORRECTED
UNCORRECTED
UNCORRECTED Does the athlete achieve steady state during their run? Use data from the graph
UNCORRECTED Does the athlete achieve steady state during their run? Use data from the graph
On the graph, shade in the area of excess post oxygen consumption
UNCORRECTED On the graph, shade in the area of excess post oxygen consumption
reasons why EPOC occurs.
UNCORRECTED
reasons why EPOC occurs.
PAGE Explain why the athlete’s oxygen uptake has increased at the 2 and 4 minute
PAGE Explain why the athlete’s oxygen uptake has increased at the 2 and 4 minute
1 mark
PAGE 1 mark
State what would happen to the athlete’s heart rate and stroke volume at the t.o. PAGE State what would happen to the athlete’s heart rate and stroke volume at the t.o.
PROOFS
PROOFS
PROOFS
PROOFS
PROOFS

222 UNIT 3 • Movement skills and energy for physical activity
c06AcutePhysiologicalResponsesToExercise 222 4 May 2017 12:46 PM
CHAPTER REVIEW ACUTE PHYSIOLOGICAL RESPONSES TO EXERCISE
Question 2 (ACHPER Trial Exam 2009, question 12a, b, c)
The graph below indicates blood � ow to various organs of the body at rest and during exercise.
Brain Cardiacmuscle
Skeletalmuscle
Skin
Blood �ow
Kidney Gut Other
L m
in–1
0
4
8
12
ExerciseRest
a. Approximately how much blood is redistributed to the skeletal muscles during exercise? 1 mark
b. Other than skeletal muscle, indicate two areas in which blood � ow increases during exercise and outline the reason for this redistribution in blood � ow for each area.
Area 1
Reason
Area 2
Reason 2 + 2 marks
c. Explain the physiological response that allows the increase in blood � ow to skeletal muscle during exercise. 2 marks
Question 3 (ACHPER Trial Exam 2010, question 4)
Area A
Area C
Time
Oxy
gen
co
nsum
pti
on
Line B End of exercise
UNCORRECTED during exercise and outline the reason for this redistribution in blood � ow for
UNCORRECTED during exercise and outline the reason for this redistribution in blood � ow for
Area 2
UNCORRECTED Area 2
Reason
UNCORRECTED Reason 2
UNCORRECTED 2
c.
UNCORRECTED c. Explain the physiological response that allows the increase in blood � ow to
UNCORRECTED Explain the physiological response that allows the increase in blood � ow to
skeletal muscle during exercise.
UNCORRECTED
skeletal muscle during exercise.
Question 3
UNCORRECTED
Question 3
UNCORRECTED
UNCORRECTED
UNCORRECTED
UNCORRECTED PAGE
PAGE muscle
PAGE muscle
Skin
PAGE Skin
Blood �ow
PAGE Blood �ow
Kidney Gut Other
PAGE Kidney Gut Other
PAGE
PAGE Approximately how much blood is redistributed to the skeletal muscles during
PAGE Approximately how much blood is redistributed to the skeletal muscles during
Other than skeletal muscle, indicate PAGE Other than skeletal muscle, indicate during exercise and outline the reason for this redistribution in blood � ow for PAGE
during exercise and outline the reason for this redistribution in blood � ow for
PROOFS
PROOFS
PROOFS
PROOFS
PROOFS
PROOFS
PROOFS
PROOFS
PROOFS
PROOFS

CHAPTER 6 • Acute physiological responses to exercise 223
c06AcutePhysiologicalResponsesToExercise 223 4 May 2017 12:46 PM
a. What do the following areas of the graph represent?
Area A:
Line B:
Area C:
3 marks
b. Why does Area A occur at the beginning of exercise? 1 mark
c. Describe the circumstances that allow Line B to occur. 2 marks
d. Name one strategy that an athlete can undertake in order to reduce the size of Area A. 1 mark
e. Explain why the strategy listed in part d above can reduce the size of Area A. 2 marks
UNCORRECTED PAGE
PAGE PROOFS
PROOFS
PROOFS
PROOFS
PROOFS